Embed Size (px)
Citation preview

Swiss Re Dots ImageryTitle: DotstitleCategory: Categorytitle
Copyright © 2010 Swiss Re
Scriptographer Plugin
10
50
Economic Value Management2011 Report
Swiss Re EVM Report 2011 1
Contents
02 Introduction
04 Financial year04 Group EVM results08 Property & Casualty10 Life & Health12 Investment activities
14 Group EVM financial statements (unaudited)
14 EVM Income statement15 EVM Balance sheet16 Statement of Economic net worth
17 Notes to the EVM financial statements (unaudited)17 Note 1 Organisation and basis
of presentation 19 Note 2 Definitions and
parameters23 Note 3 Information on
segments28 Note 4 Reconciliation to
US GAAP29 Note 5 Economic net worth
per share30 Note 6 EVM sensitivities31 PricewaterhouseCoopers review
report
32 General information32 Cautionary note on forward-
looking statements
2 Swiss Re EVM Report 2011
Introduction
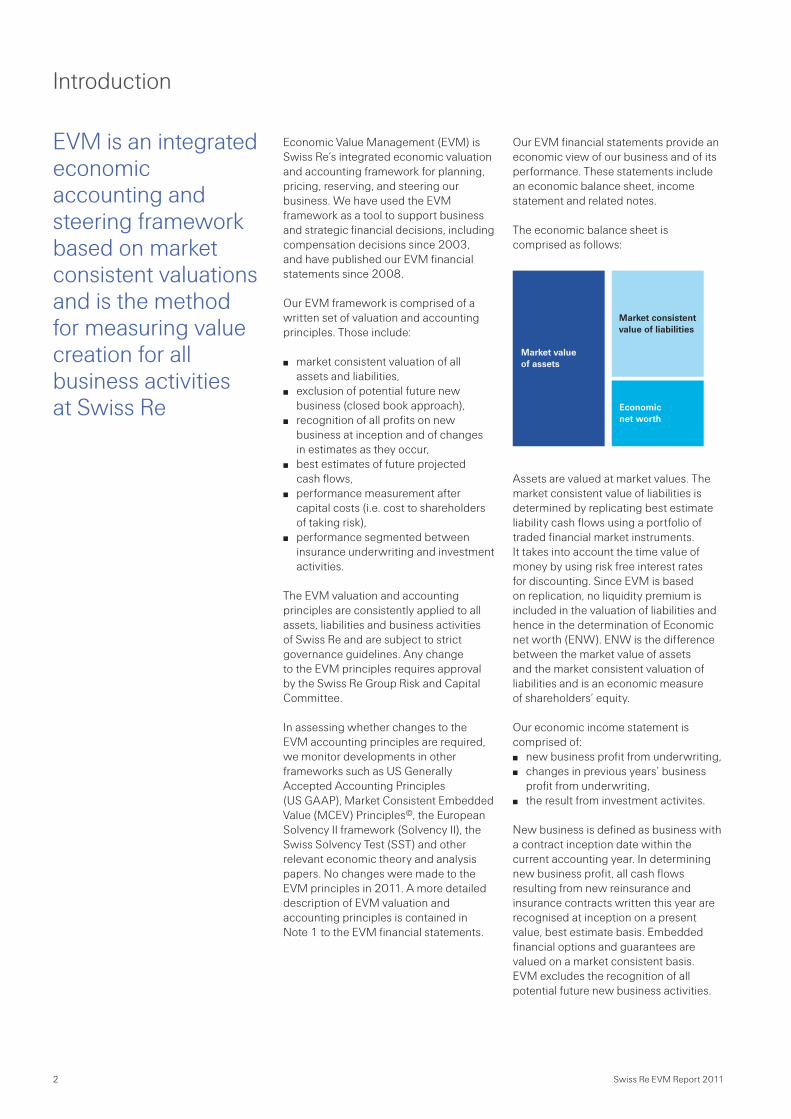
Our EVM financial statements provide an economic view of our business and of its performance. These statements include an economic balance sheet, income statement and related notes.
The economic balance sheet is comprised as follows:
Assets are valued at market values. The market consistent value of liabilities is determined by replicating best estimate liability cash flows using a portfolio of traded financial market instruments. It takes into account the time value of money by using risk free interest rates for discounting. Since EVM is based on replication, no liquidity premium is included in the valuation of liabilities and hence in the determination of Economic net worth (ENW). ENW is the difference between the market value of assets and the market consistent valuation of liabilities and is an economic measure of shareholders’ equity.
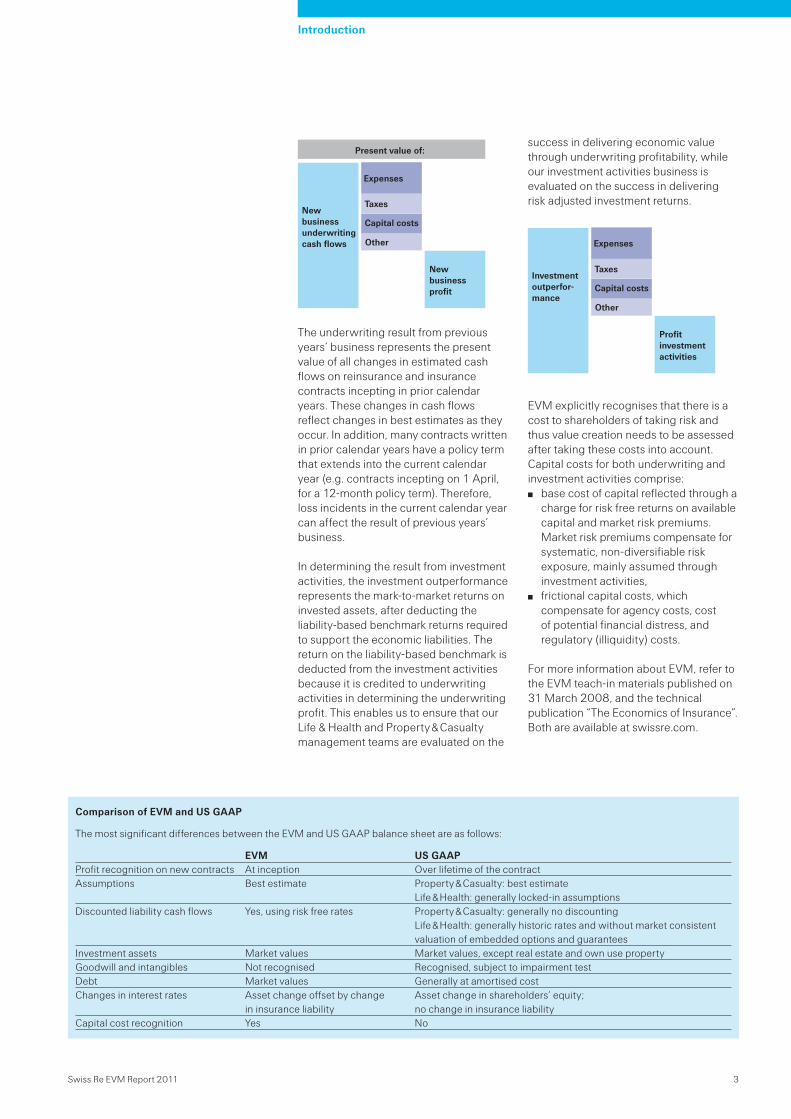
Our economic income statement is comprised of: new business profit from underwriting, changes in previous years’ business
profit from underwriting, the result from investment activites.
New business is defined as business with a contract inception date within the current accounting year. In determining new business profit, all cash flows resulting from new reinsurance and insurance contracts written this year are recognised at inception on a present value, best estimate basis. Embedded financial options and guarantees are valued on a market consistent basis. EVM excludes the recognition of all potential future new business activities.
EVM is an integrated economic accounting and steering framework based on market consistent valuations and is the method for measuring value creation for all business activities at Swiss Re
Market value of assets
Market consistent value of liabilities
Economic net worth
Economic Value Management (EVM) is Swiss Re’s integrated economic valuation and accounting framework for planning, pricing, reserving, and steering our business. We have used the EVM framework as a tool to support business and strategic financial decisions, including compensation decisions since 2003, and have published our EVM financial statements since 2008.
Our EVM framework is comprised of a written set of valuation and accounting principles. Those include:
market consistent valuation of all assets and liabilities,
exclusion of potential future new business (closed book approach),
recognition of all profits on new business at inception and of changes in estimates as they occur,
best estimates of future projected cash flows,
performance measurement after capital costs (i.e. cost to shareholders of taking risk),
performance segmented between insurance underwriting and investment activities.
The EVM valuation and accounting principles are consistently applied to all assets, liabilities and business activities of Swiss Re and are subject to strict governance guidelines. Any change to the EVM principles requires approval by the Swiss Re Group Risk and Capital Committee.
In assessing whether changes to the EVM accounting principles are required, we monitor developments in other frameworks such as US Generally Accepted Accounting Principles (US GAAP), Market Consistent Embedded Value (MCEV) Principles©, the European Solvency II framework (Solvency II), the Swiss Solvency Test (SST) and other relevant economic theory and analysis papers. No changes were made to the EVM principles in 2011. A more detailed description of EVM valuation and accounting principles is contained in Note 1 to the EVM financial statements.
Swiss Re EVM Report 2011 3
The underwriting result from previous years’ business represents the present value of all changes in estimated cash flows on reinsurance and insurance contracts incepting in prior calendar years. These changes in cash flows reflect changes in best estimates as they occur. In addition, many contracts written in prior calendar years have a policy term that extends into the current calendar year (e.g. contracts incepting on 1 April, for a 12-month policy term). Therefore, loss incidents in the current calendar year can affect the result of previous years’ business.
In determining the result from investment activities, the investment outperformance represents the mark-to-market returns on invested assets, after deducting the liability-based benchmark returns required to support the economic liabilities. The return on the liability-based benchmark is deducted from the investment activities because it is credited to underwriting activities in determining the underwriting profit. This enables us to ensure that our Life & Health and Property & Casualty management teams are evaluated on the
Introduction
Present Value of new business underwriting cash flows
Present Valueof Expenses
Present Valueof Taxes
Present Valueof Capital Costs
Other
New business profit
Prior yeardevelopment
Total profit underwritiing
Investment result
Total EVM profit
New business underwriting cash flows
Expenses
Taxes
Capital costs
Other
New business profit
Prior yearresult
Total profit underwriting
Investment result
Total EVM profit
Present value of:success in delivering economic value through underwriting profitability, while our investment activities business is evaluated on the success in delivering risk adjusted investment returns.
EVM explicitly recognises that there is a cost to shareholders of taking risk and thus value creation needs to be assessed after taking these costs into account. Capital costs for both underwriting and investment activities comprise: base cost of capital reflected through a
charge for risk free returns on available capital and market risk premiums. Market risk premiums compensate for systematic, non-diversifiable risk exposure, mainly assumed through investment activities,
frictional capital costs, which compensate for agency costs, cost of potential financial distress, and regulatory (illiquidity) costs.
For more information about EVM, refer to the EVM teach-in materials published on 31 March 2008, and the technical publication “The Economics of Insurance”. Both are available at swissre.com.
Investmentoutperfor-mance
Expenses
Taxes
Capital costs
Other
Profitinvestmentactivities
Comparison of EVM and US GAAP
The most significant differences between the EVM and US GAAP balance sheet are as follows:
EVM US GAAPProfit recognition on new contracts At inception Over lifetime of the contract Assumptions Best estimate Property & Casualty: best estimate
Life & Health: generally locked-in assumptionsDiscounted liability cash flows
Yes, using risk free rates
Property & Casualty: generally no discounting Life & Health: generally historic rates and without market consistent valuation of embedded options and guarantees
Investment assets Market values Market values, except real estate and own use propertyGoodwill and intangibles Not recognised Recognised, subject to impairment testDebt Market values Generally at amortised costChanges in interest rates Asset change offset by change
in insurance liabilityAsset change in shareholders’ equity; no change in insurance liability
Capital cost recognition Yes No
4 Swiss Re EVM Report 2011
Group EVM results
Financial year
Results from strong new business performance tempered by natural catastrophes and financial market volatility
Swiss Re reported annual EVM income of USD 0.8 billion in 2011, compared to USD 3.2 billion in 2010. After taking into account capital costs, the result was an EVM loss of USD 1.7 billion in 2011, compared to an EVM profit of USD 1.3 billion in the previous year. The 2011 result reflects the difficult economic and market environments, and the extent and severity of natural catastrophe events during the year.
Property & Casualty delivered a strong new business underwriting result, but was adversely impacted by the extraordinary accumulation of natural catastrophe events that occurred in Asia, Australia, New Zealand and the US during the year. The Life & Health result improved by 62% compared to 2010 including the successful completion of an Admin Re® transaction in 2011, higher new business volumes and improved margins. Asset Management’s result was adversely affected by widening credit spreads and equity market declines in an environment of heightened financial market volatility and uncertainty.
In 2011, Economic net worth decreased to USD 29.0 billion from USD 30.7 billion at the end of December 2010. EVM income of USD 0.8 billion was more than offset by the Group’s dividend payments, share repurchase and other movements including foreign currency translation.
Economic net worth per share was USD 84.72, compared to USD 89.71 at the end of 2010.
Economic return on capital (EROC) for new business was 2.0% in 2011 compared to 17.8% in 2010. The EVM new business profit margin (risk adjusted) was –7.0% in 2011, declining from 6.7% in 2010. Excluding the excess over the normalised impact of natural catastrophe experience in 2011, EROC and the EVM profit margin on new business were reported at 3.8% and –5.2%, respectively, driven by the losses from investment activities. The EVM profit margin on previous years’ business was –0.8%.
Full-year 2011 Group results
New business profitThe present value of premiums and fees rose by 32% to USD 24.6 billion in 2011 from USD 18.6 billion in 2010. Approximately 60% of the USD 6.0 billion increase was driven by the significant rise in new business volumes in Property & Casualty, notably from Asia. Life & Health premiums and fees rose by USD 2.4 billion, USD 1.1 billion of which was derived from the execution of an Admin Re® transaction with American Life Insurance Company. Excluding foreign exchange movements, the present value of premiums and fees increased by 28%.
The present value of claims and benefits rose by 38% to USD 16.2 billion in 2011 from USD 11.8 billion in 2010. This increase was driven by the proportionate growth in business volumes for both Property & Casualty and Life & Health, together with the impact of current underwriting year natural catastrophe claims from the floods in Thailand, as well as tornados and hurricane Irene in the US. Excluding foreign exchange movements, the present value of claims and benefits increased by 33%.
The present value of commissions increased to USD 3.5 billion in 2011, from USD 2.4 billion in 2010. In both Property & Casualty and Life & Heath, the increase reflected the higher business volume written. Excluding foreign exchange movements, the present value of commissions increased by 41%.
The present value of expenses was USD 2.6 billion in 2011, compared to USD 2.0 billion in 2010. Excluding foreign exchange movements, the present value of expenses rose by 23%. Approximately 28% of the increase in expenses was due to the 2011 Admin Re® transaction, and the balance by the segments due to underlying business volume.
Financial year | EVM Group result
Swiss Re EVM Report 2011 5
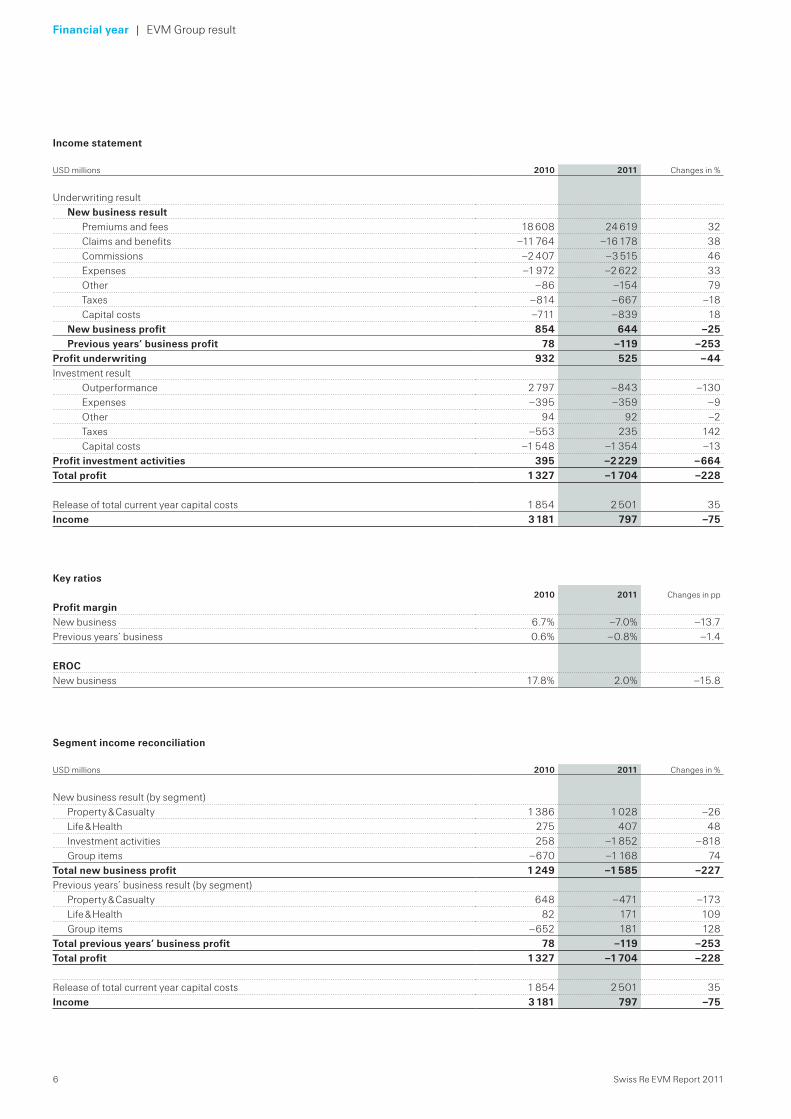
The present value of taxes decreased by USD 147 million to USD 667 million in 2011. Group tax expenses accounted for this decline, primarily due to tax benefits arising from the restructuring of subsidiary loans.
The present value of capital costs increased to USD 839 million in 2011, due to the higher business volumes in Property & Casualty and Life & Health.
Previous years’ business profitThe loss from previous years’ business was primarily driven by Property & Casualty segment due to the floods and cyclone Yasi in Australia and the earthquakes in New Zealand and Japan that occurred during the first quarter of 2011, partially offset by favourable claims development on the prior year book of business. While the noted natural catastrophe events occurred in 2011, they are classified as previous years’ business because the underwriting year that covers these losses incepted in 2010.
Investment activitiesAlthough Swiss Re’s assets and liabilities are closely matched in terms of interest rate exposure, widening credit spreads and weakening global equity markets led to an underperformance against the liability-based benchmark.
Segment income reconciliationThe EVM income reconciliation table reconciles the EVM profit from Swiss Re’s segments and the operations of the company’s Corporate Centre with the Group’s consolidated EVM profit and EVM income.
Group items reported an EVM loss of USD 1.0 billion in 2011, compared to USD 1.3 billion in 2010. The new business EVM loss increased by USD 0.5 billion to USD 1.2 billion in 2011 primarily driven by an underperformance on former Legacy positions due to credit spread widening and negative performance of portfolios excluded from the liability-based benchmark. Previous years’ business profit of USD 0.2 billion in 2011 improved over 2010. The 2011 result includes a tax benefit realised on a 2011 local statutory accounting adjustment for restructuring of subsidiaries. The 2010 result included the reflection of higher full term funding costs for letters of credit.
6 Swiss Re EVM Report 2011
Financial year | EVM Group result
Segment income reconciliation
USD millions 2010 2011 Changes in %
New business result (by segment)Property & Casualty 1 386 1 028 –26Life & Health 275 407 48Investment activities 258 –1 852 –818Group items –670 –1 168 74
Total new business profit 1 249 –1 585 –227Previous years’ business result (by segment)
Property & Casualty 648 –471 –173Life & Health 82 171 109Group items –652 181 128
Total previous years’ business profit 78 –119 –253Total profit 1 327 –1 704 –228
Release of total current year capital costs 1 854 2 501 35Income 3 181 797 –75
Income statement
USD millions 2010 2011 Changes in %
Underwriting resultNew business result
Premiums and fees 18 608 24 619 32Claims and benefits –11 764 –16 178 38Commissions –2 407 –3 515 46Expenses –1 972 –2 622 33Other –86 –154 79Taxes –814 –667 –18Capital costs –711 –839 18
New business profit 854 644 –25Previous years’ business profit 78 –119 –253
Profit underwriting 932 525 –44Investment result
Outperformance 2 797 –843 –130Expenses –395 –359 –9Other 94 92 –2Taxes –553 235 142Capital costs –1 548 –1 354 –13
Profit investment activities 395 –2 229 –664Total profit 1 327 –1 704 –228
Release of total current year capital costs 1 854 2 501 35Income 3 181 797 –75
Key ratios
2010 2011 Changes in pp
Profit marginNew business 6.7% –7.0% –13.7Previous years’ business 0.6% –0.8% –1.4
EROCNew business 17.8% 2.0% –15.8

Swiss Re EVM Report 2011 7
This page is intentionally left blank
8 Swiss Re EVM Report 2011
Financial year
Property & Casualty
Strong new business performance offset by severe losses from natural catastrophe events
Segment informationSwiss Re’s Property & Casualty business segment provides coverage for insurance companies (reinsurance) as well as for large and mid-size corporates (direct insurance). In 2011, 90% of the present value of gross premiums was reinsurance business, compared to 88% in 2010.
The Property & Casualty book is diversified as to lines of business, type of reinsurance as well as geography. The main lines of business are Property, Casualty, Specialty lines including Credit, and non-traditional business (in order of size, based on the present value of premiums).
Swiss Re writes treaty and facultative reinsurance, with treaty business comprising 90% of 2011 present value of gross premiums, compared to 86% in 2010. Treaty reinsurance covers entire portfolios, while facultative reinsurance is case-by-case risk transfer. Both treaty and facultative reinsurance can be on a proportional or non-proportional basis. In proportional reinsurance, the reinsurer assumes an agreed percentage of premiums and liabilities arising from each policy an insurer writes. Non-proportional coverage (or excess of loss as the most common form) reimburses the insured for losses incurred above an attachment point.
The Property & Casualty new business results include risk free investment returns on the corresponding liability-based benchmark portfolios.
The most important factor for Property & Casualty profitability is sound and disciplined underwriting, ensuring that Swiss Re obtains adequate prices for the risks it assumes. The EVM result in a given period is exposed to the actual experience in large catastrophe events, to the adequacy of reserving for previous years and changes to the timing of expected future cashflows. The Property & Casualty underwriting result is immunised against financial market impacts through the mechanics of the replicating portfolio.
Results from investment activities reported in the Property & Casualty segment include Weather & Electricity Price & Outage Solutions products in derivative form and insurance linked securities transactions.
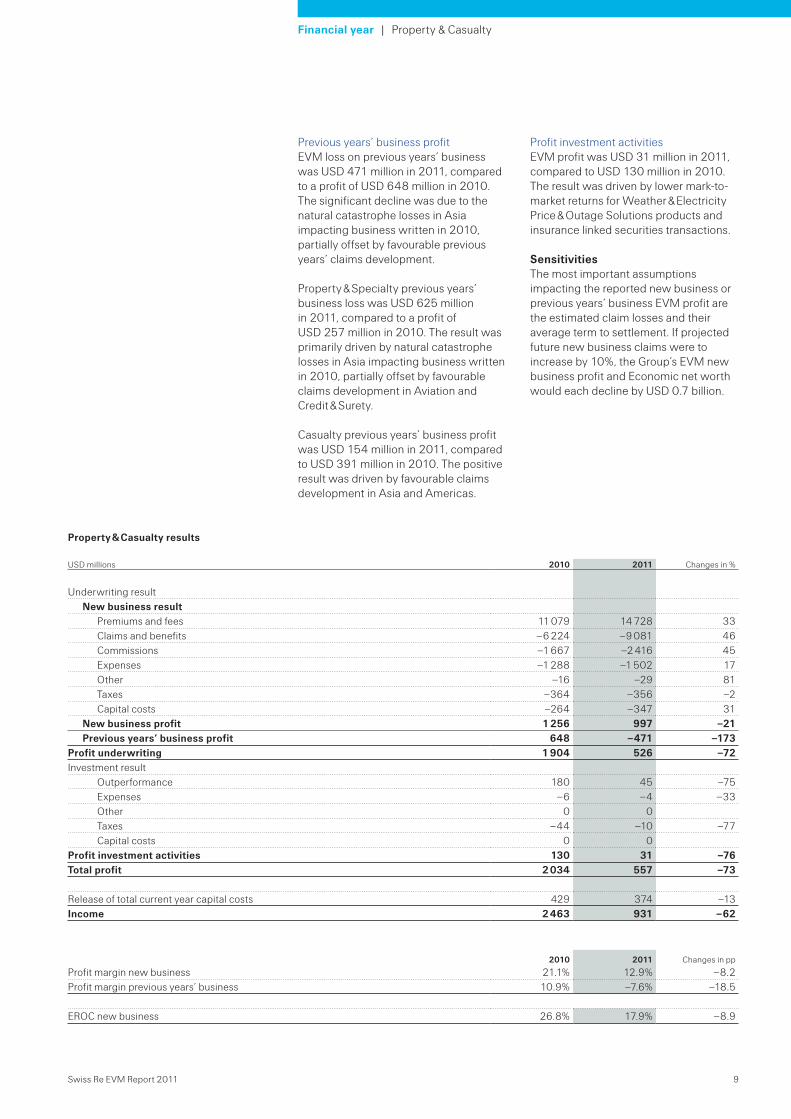
PerformanceProperty & Casualty reported an EVM profit of USD 0.6 billion in 2011, a decrease of USD 1.4 billion over the 2010 result of USD 2.0 billion. The primary drivers were natural catastrophe losses impacting business written in 2010 and 2011. This includes the earthquake and tsunami in Japan, the earthquakes in Christchurch, New Zealand, floods in Thailand and Queensland, Australia, cyclone Yasi in Queensland, Australia, as well as tornados and hurricane Irene in the US. This was partially offset by favourable prior year claims experience and increased new business volume.
The profit margin on new business in 2011 decreased to 12.9%, compared to 21.1% in 2010. Excluding the excess over the normalised impact from natural catastrophe events, the profit margin was 18.0% on new business and –7.6% on previous years’ business.
New business profitEVM profit on new business decreased by 21% to USD 1.0 billion in 2011, compared to USD 1.3 billion in 2010. The decline in new business profit was mainly driven by the 2011 natural catastrophe losses, partially offset by higher business volume.
The present value of premiums, claims and commissions rose significantly in 2011 driven by higher volumes, notably with large Asian clients, and new business premiums written following the large natural catastrophes. Expenses increased by 17% in 2011, mainly driven by investments in developing new business opportunities. Capital costs increased in line with the business volume growth.
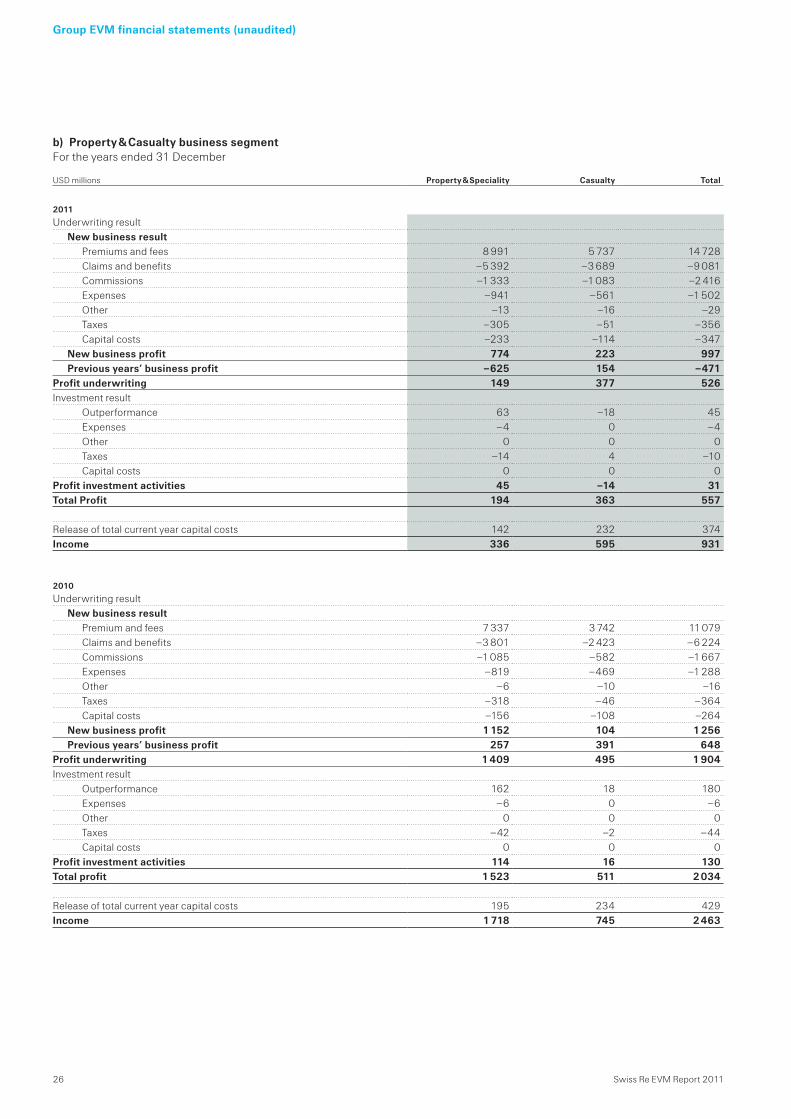
Property & Specialty new business profit decreased by USD 0.4 billion to USD 0.8 billion in 2011. Natural catastrophe losses and lower new business profits from Marine and Aviation were partially offset by increased business volume, mainly in Property, which grew by 33% in 2011, and higher margins in Credit & Surety.
Casualty new business profit more than doubled to USD 223 million in 2011, compared to USD 104 million in 2010. This was mainly driven by increased Liability and Motor business volumes and higher Liability margins. Motor new business profit grew by 94% in 2011.
Swiss Re EVM Report 2011 9
Financial year | Property & Casualty
Previous years’ business profitEVM loss on previous years’ business was USD 471 million in 2011, compared to a profit of USD 648 million in 2010. The significant decline was due to the natural catastrophe losses in Asia impacting business written in 2010, partially offset by favourable previous years’ claims development.
Property & Specialty previous years’ business loss was USD 625 million in 2011, compared to a profit of USD 257 million in 2010. The result was primarily driven by natural catastrophe losses in Asia impacting business written in 2010, partially offset by favourable claims development in Aviation and Credit & Surety.
Casualty previous years’ business profit was USD 154 million in 2011, compared to USD 391 million in 2010. The positive result was driven by favourable claims development in Asia and Americas.
Property & Casualty results
USD millions 2010 2011 Changes in %
Underwriting resultNew business result
Premiums and fees 11 079 14 728 33Claims and benefits –6 224 –9 081 46Commissions –1 667 –2 416 45Expenses –1 288 –1 502 17Other –16 –29 81Taxes –364 –356 –2Capital costs –264 –347 31
New business profit 1 256 997 –21Previous years’ business profit 648 –471 –173
Profit underwriting 1 904 526 –72Investment result
Outperformance 180 45 –75Expenses –6 –4 –33Other 0 0Taxes –44 –10 –77Capital costs 0 0
Profit investment activities 130 31 –76Total profit 2 034 557 –73
Release of total current year capital costs 429 374 –13Income 2 463 931 –62
2010 2011 Changes in pp
Profit margin new business 21.1% 12.9% –8.2Profit margin previous years’ business 10.9% –7.6% –18.5
EROC new business 26.8% 17.9% –8.9
Profit investment activitiesEVM profit was USD 31 million in 2011, compared to USD 130 million in 2010. The result was driven by lower mark-to-market returns for Weather & Electricity Price & Outage Solutions products and insurance linked securities transactions.
SensitivitiesThe most important assumptions impacting the reported new business or previous years’ business EVM profit are the estimated claim losses and their average term to settlement. If projected future new business claims were to increase by 10%, the Group’s EVM new business profit and Economic net worth would each decline by USD 0.7 billion.
10 Swiss Re EVM Report 2011
Financial year
Life & Health
EVM new business profit rose by 48%
Segment information The Life & Health business segment comprises three lines of business, Traditional Life, Traditional Health and Admin Re®. The Traditional Life and Traditional Health lines of business include reinsurance contracts for individual and group life, disability income, critical illness and annuity products. Admin Re® comprises closed blocks of in-force life and health insurance business, acquired through either purchase of legal entities or via reinsurance contracts. Individual life and interest sensitive life products dominate the Admin Re® segment, although the acquired business also includes disability income, long term care and annuity products.
The Life & Health new business results include risk free investment returns on the corresponding liability-based benchmark portfolios.
Life & Health new business profitability is driven by sound and disciplined underwriting, ensuring that Swiss Re obtains adequate prices for the risks it assumes. For previous years’ business, the main drivers of Life & Health economic performance are mortality, morbidity and lapse experience variances and assumption changes. Financial markets can both influence the results directly through earned fee income, but can also impact policyholder behaviour, which may be exhibited through policy lapse and incidence rates. In addition, the timing and granularity of data received from cedents can affect reported economic results. In some regions, reporting may only be received from cedents on an annual basis, thus causing some volatility in reported results in the period of reporting.
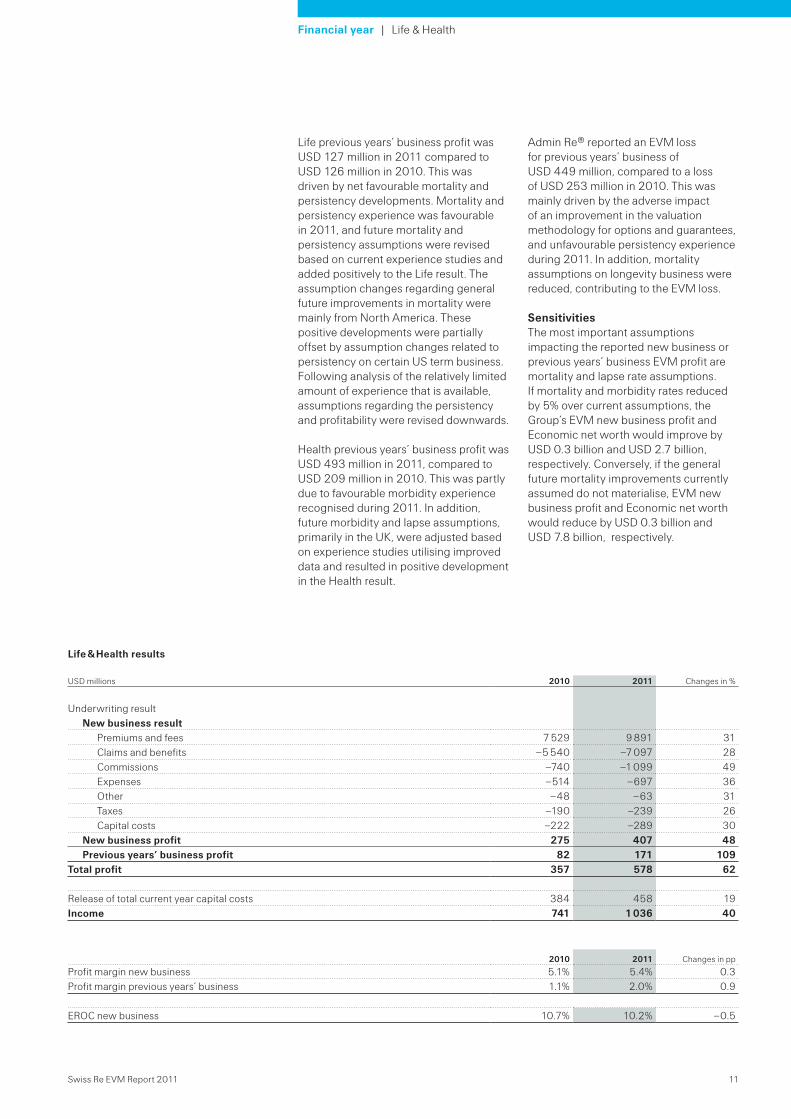
PerformanceLife & Health reported EVM profit of USD 578 million in 2011, an increase of USD 221 million over the 2010 result of USD 357 million. The primary drivers of the improvement in performance were Admin Re® new business, higher volumes and improved margins on traditional health new business, and increased net favourable developments on previous years’ business.
The profit margin on new business was 5.4% in 2011, compared to 5.1% in 2010. The 2010 new business profit margin was negatively impacted by the absence
of new business transactions in Admin Re®. The profit margin on previous years’ business was 2.0% in 2011, compared to 1.1% in 2010.
New business profitEVM profit on new business increased by 48% to USD 407 million in 2011, compared to USD 275 million in 2010.
The present values of premiums, claims, commissions, expenses and capital costs rose significantly in 2011, driven by a material reduction in risk free interest rates, resulting in a lower discount impact on future cash flows. In addition, these results include the impact of a completed Admin Re® transaction in 2011. Expenses increased by 36% in 2011, mainly driven by additional expenses in Admin Re® related to new business. Capital costs increased in line with the growth in the business.
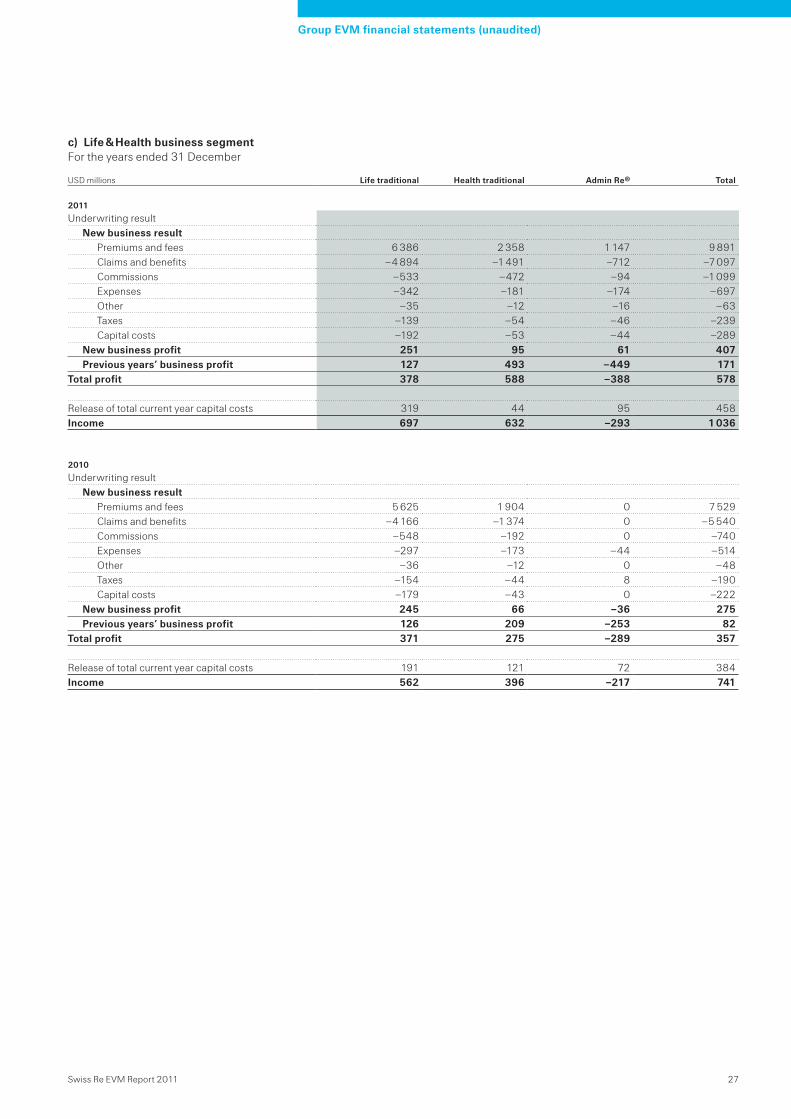
Life reported new business profit of USD 251 million in 2011, compared to USD 245 million in 2010. Increased volumes and margins in the US and higher volumes in Asia were largely offset by lower volumes and margins in Europe.
Health new business profit was USD 95 million, compared to USD 66 million in 2010. The improvement in performance was due to broad based increases in volumes and margins.
Admin Re® reported new business profit of USD 61 million, compared to a loss of USD 36 million in 2010. This improvement was driven by the acquisition of selected life insurance business from American Life Insurance Company in 2011. No Admin Re® transactions were closed in 2010 and the loss reported reflects the allocation of a portion of expenses to new business development activities.
Previous years’ business profitEVM profit on previous years’ business was USD 171 million in 2011, compared to a profit of USD 82 million in 2010. Favourable current year experience, together with the positive impact of changes in assumptions in the traditional life and traditional health segments were partially offset by the unfavourable impact of model enhancements, assumptions changes and experience in Admin Re®.
Swiss Re EVM Report 2011 11
Financial year | Life & Health
Life previous years’ business profit was USD 127 million in 2011 compared to USD 126 million in 2010. This was driven by net favourable mortality and persistency developments. Mortality and persistency experience was favourable in 2011, and future mortality and persistency assumptions were revised based on current experience studies and added positively to the Life result. The assumption changes regarding general future improvements in mortality were mainly from North America. These positive developments were partially offset by assumption changes related to persistency on certain US term business. Following analysis of the relatively limited amount of experience that is available, assumptions regarding the persistency and profitability were revised downwards.
Health previous years’ business profit was USD 493 million in 2011, compared to USD 209 million in 2010. This was partly due to favourable morbidity experience recognised during 2011. In addition, future morbidity and lapse assumptions, primarily in the UK, were adjusted based on experience studies utilising improved data and resulted in positive development in the Health result.
Life & Health results
USD millions 2010 2011 Changes in %
Underwriting resultNew business result
Premiums and fees 7 529 9 891 31Claims and benefits –5 540 –7 097 28Commissions –740 –1 099 49Expenses –514 –697 36Other –48 –63 31Taxes –190 –239 26Capital costs –222 –289 30
New business profit 275 407 48Previous years’ business profit 82 171 109
Total profit 357 578 62
Release of total current year capital costs 384 458 19Income 741 1 036 40
2010 2011 Changes in pp
Profit margin new business 5.1% 5.4% 0.3Profit margin previous years’ business 1.1% 2.0% 0.9
EROC new business 10.7% 10.2% –0.5
Admin Re® reported an EVM loss for previous years’ business of USD 449 million, compared to a loss of USD 253 million in 2010. This was mainly driven by the adverse impact of an improvement in the valuation methodology for options and guarantees, and unfavourable persistency experience during 2011. In addition, mortality assumptions on longevity business were reduced, contributing to the EVM loss.
SensitivitiesThe most important assumptions impacting the reported new business or previous years’ business EVM profit are mortality and lapse rate assumptions. If mortality and morbidity rates reduced by 5% over current assumptions, the Group’s EVM new business profit and Economic net worth would improve by USD 0.3 billion and USD 2.7 billion, respectively. Conversely, if the general future mortality improvements currently assumed do not materialise, EVM new business profit and Economic net worth would reduce by USD 0.3 billion and USD 7.8 billion, respectively.
12 Swiss Re EVM Report 2011
Financial year
Investment activities
EVM loss reflects the challenging market environment
Market environmentThe 2011 year was marked by continued uncertainties and heightened financial market volatility, with different trouble spots taking centre stage throughout the year. Heightened risk aversion meant that safe-haven assets outperformed others, with both US Treasury and “core” European government bonds rallying significantly (US 10-year Treasury yield reached a new all-time low of 1.72% in September 2011), while European peripheral bond yields climbed to record levels. Equities fell in 2011, with the European market clearly underperforming the US market.
Given the uncertain economic and financial market environment, Asset Management maintained a cautious and prudent investment management approach going into and throughout 2011. Overall risk capacity usage was generally kept low, as the focus remained on asset-liability management activities within the risk budgeting process, which was implemented in 2010.
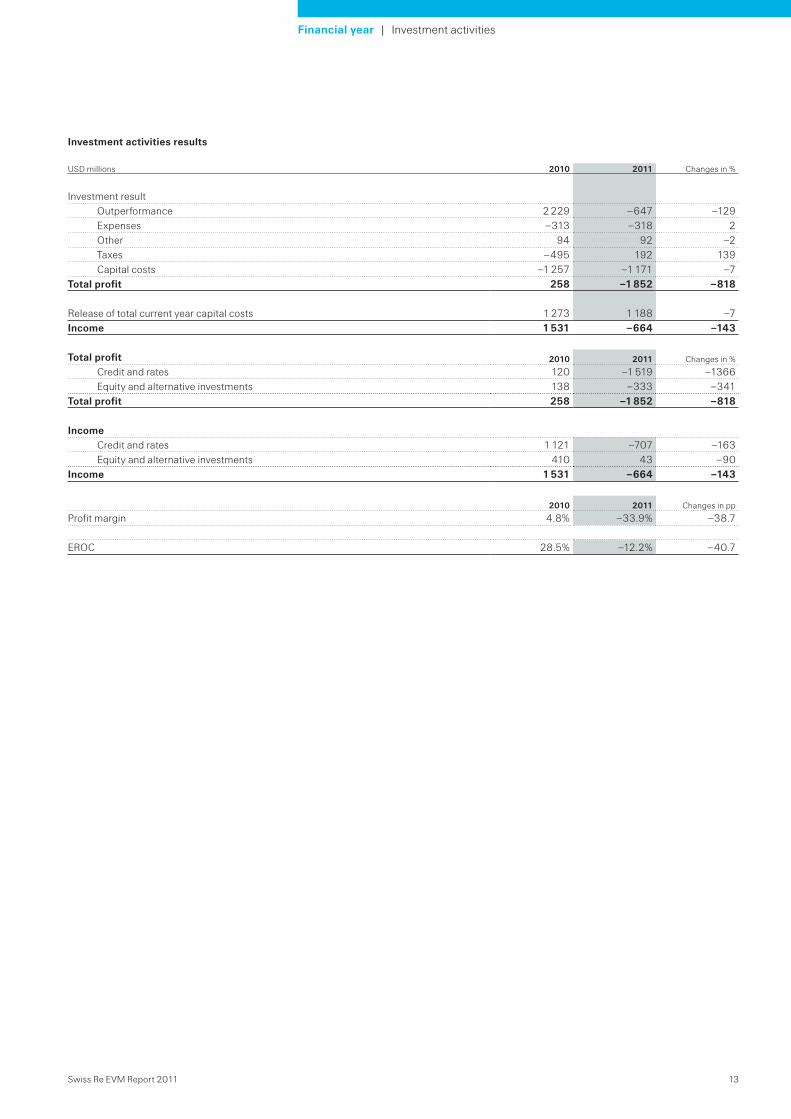
Investment resultAsset Management reported an EVM loss of USD 1.9 billion in 2011, compared to a profit of USD 0.3 billion in 2010. The EVM profit margin also declined substantially. The result was primarily due to an underperformance against the liability-based benchmark driven by credit spread widening. The 2010 results have been restated to include the impact of a short duration asset position previously reported as a Group item but included as a part of Asset Management responsibilities in 2011.
Credit and ratesCredit and rates reported an EVM loss of USD 1519 million for 2011, compared to a profit of USD 120 million in 2010. Included in the loss are capital cost charges of USD 798 million.
Rates reported an underperformance against the liability-based benchmark, primarily driven by agency and supranational bond exposure as spreads widened, partially offset by gains on actively managed short duration asset positions. As of 31 December 2011, total government bonds were USD 65.6 billion, excluding short-term investments.
Credit and securitised products reported an underperformance largely driven by the impact of credit spreads widening. Bank of America Corporate Indices widened in the financial sector by 158bps in the US, and 241bps in the UK. Industrial sector spreads widened by 60bps in the US and 69bps in the UK, while utility sector spreads widened in the US and UK by 47bps and 91bps, respectively. These losses were partially offset by credit hedging activities. As of 31 December 2011, total corporate credit bond positions were USD 23.5 billion and total securitised investments were USD 7.2 billion.
Equity and alternative investmentsEquity and alternative investments reported an EVM loss of USD 333 million for 2011 compared to a profit of USD 138 million in 2010. Included in the loss are capital cost charges of USD 373 million.
Equity underperformed the liability-based benchmark primarily due to a declining global equity market. Alternative investments reported an outperformance against the liability-based benchmark driven by investments in indirect private equity and in real estate.The concept of out- or
underperformance in EVM:
Mark-to-market return:Includes net investment income, realised gains and losses and changes in unrealised gains and losses derived from US GAAP. In addition, it includes changes in market value of investment positions carried at amortised cost in US GAAP.It excludes the following items from US GAAP: investment income from cedants, unit linked and with profit business and mortgages and other loans as well as minority interest and depreciation.
Liability-based benchmark return:Change in the economic value of liabilities as a result of changes in risk free discount rates, changes in credit spreads, changes in equity prices or changes in the economic value of embedded options and guarantees.
Outperformance is defined as the difference between mark-to-market return and the return on the liability-based benchmark.
Swiss Re EVM Report 2011 13
Financial year | Investment activities
Investment activities results
USD millions 2010 2011 Changes in %
Investment resultOutperformance 2 229 –647 –129Expenses –313 –318 2Other 94 92 –2Taxes –495 192 139Capital costs –1 257 –1 171 –7
Total profit 258 –1 852 –818
Release of total current year capital costs 1 273 1 188 –7Income 1 531 –664 –143
Total profit 2010 2011 Changes in %
Credit and rates 120 –1 519 –1366Equity and alternative investments 138 –333 –341
Total profit 258 –1 852 –818
IncomeCredit and rates 1 121 –707 –163Equity and alternative investments 410 43 –90
Income 1 531 –664 –143
2010 2011 Changes in pp
Profit margin 4.8% –33.9% –38.7
EROC 28.5% –12.2% –40.7
14 Swiss Re EVM Report 2011
Group EVM financial statements (unaudited)
For the years ended 31 December
The accompanying notes are an integral part of the Swiss Re Group EVM financial statements.
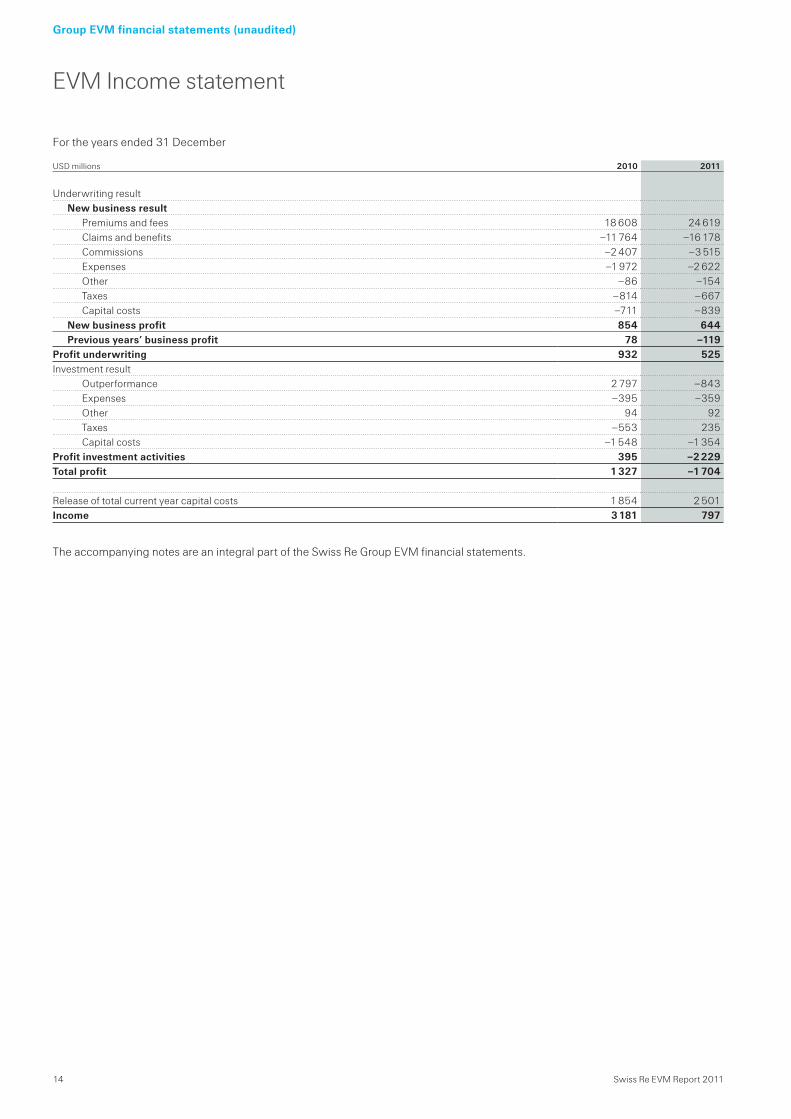
EVM Income statement
USD millions 2010 2011
Underwriting resultNew business result
Premiums and fees 18 608 24 619Claims and benefits –11 764 –16 178Commissions –2 407 –3 515Expenses –1 972 –2 622Other –86 –154Taxes –814 –667Capital costs –711 –839
New business profit 854 644Previous years’ business profit 78 –119
Profit underwriting 932 525Investment result
Outperformance 2 797 –843Expenses –395 –359Other 94 92Taxes –553 235Capital costs –1 548 –1 354
Profit investment activities 395 –2 229Total profit 1 327 –1 704
Release of total current year capital costs 1 854 2 501Income 3 181 797
Swiss Re EVM Report 2011 15
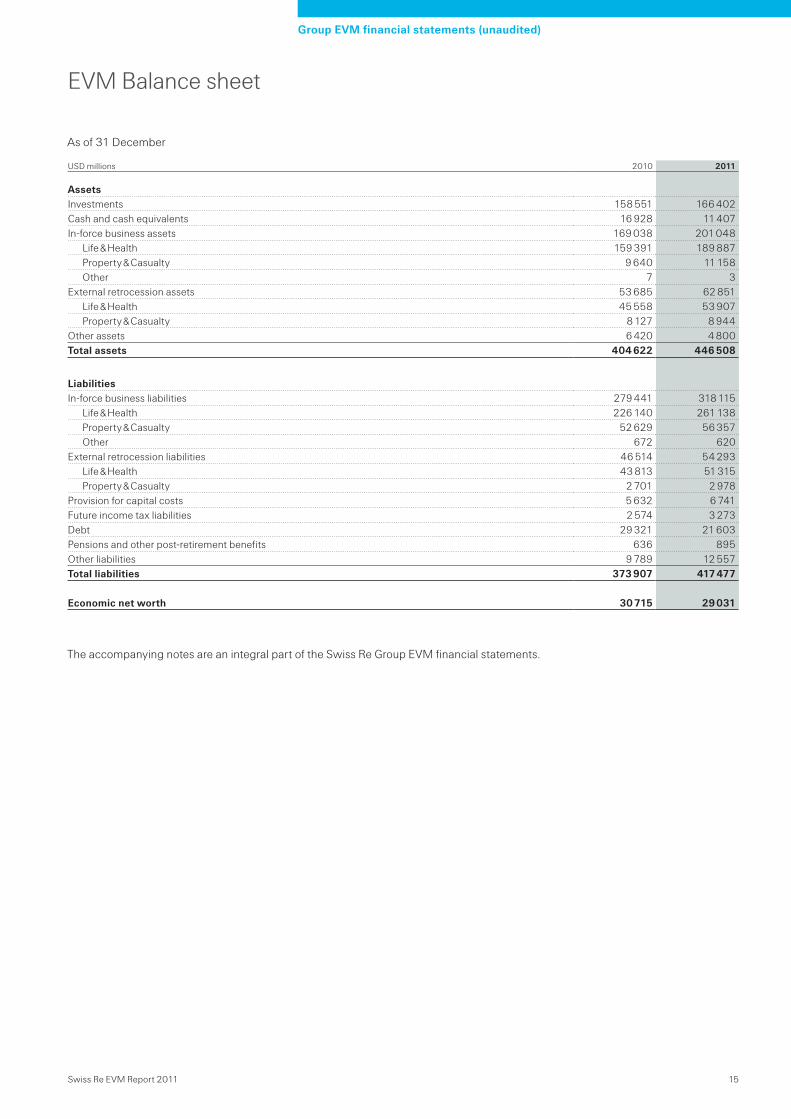
EVM Balance sheet
Group EVM financial statements (unaudited)
As of 31 December
The accompanying notes are an integral part of the Swiss Re Group EVM financial statements.
USD millions 2010 2011
AssetsInvestments 158 551 166 402Cash and cash equivalents 16 928 11 407In-force business assets 169 038 201 048
Life & Health 159 391 189 887Property & Casualty 9 640 11 158Other 7 3
External retrocession assets 53 685 62 851Life & Health 45 558 53 907Property & Casualty 8 127 8 944
Other assets 6 420 4 800Total assets 404 622 446 508
LiabilitiesIn-force business liabilities 279 441 318 115
Life & Health 226 140 261 138Property & Casualty 52 629 56 357Other 672 620
External retrocession liabilities 46 514 54 293Life & Health 43 813 51 315Property & Casualty 2 701 2 978
Provision for capital costs 5 632 6 741Future income tax liabilities 2 574 3 273Debt 29 321 21 603Pensions and other post-retirement benefits 636 895Other liabilities 9 789 12 557Total liabilities 373 907 417 477
Economic net worth 30 715 29 031
16 Swiss Re EVM Report 2011
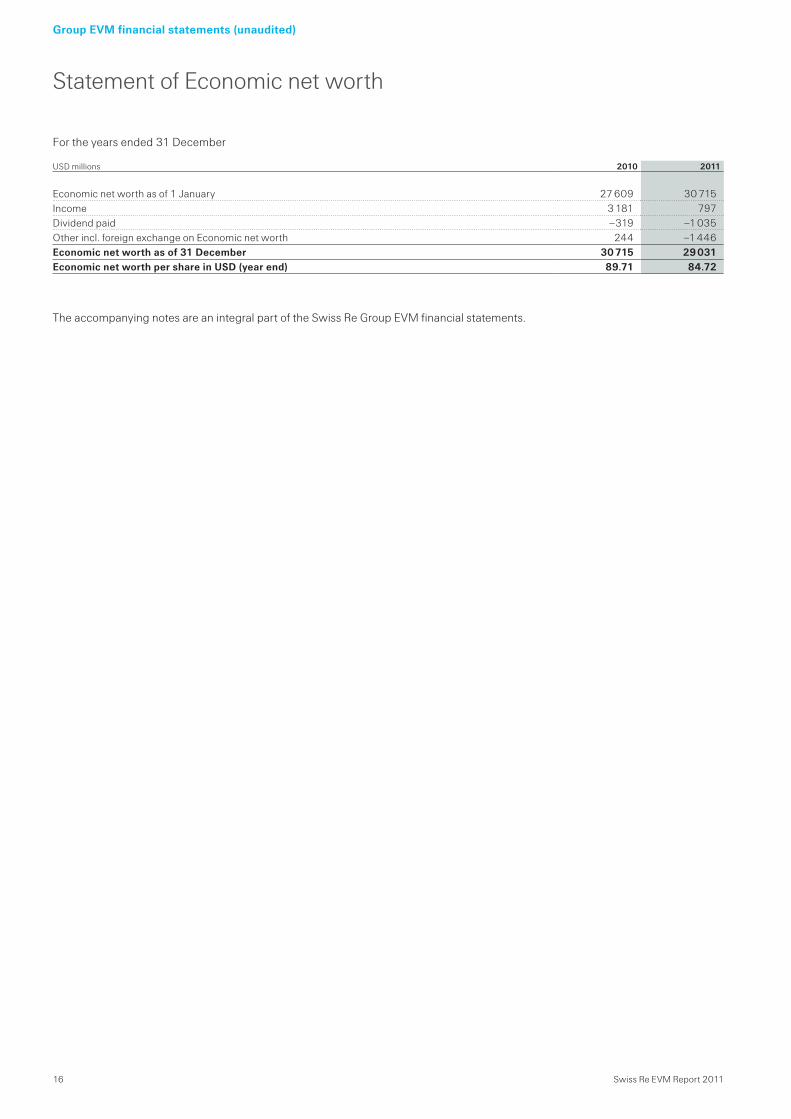
Statement of Economic net worth
Group EVM financial statements (unaudited)
For the years ended 31 December
The accompanying notes are an integral part of the Swiss Re Group EVM financial statements.
USD millions 2010 2011
Economic net worth as of 1 January 27 609 30 715Income 3 181 797Dividend paid –319 –1 035Other incl. foreign exchange on Economic net worth 244 –1 446Economic net worth as of 31 December 30 715 29 031Economic net worth per share in USD (year end) 89.71 84.72
Swiss Re EVM Report 2011 17
Group EVM financial statements (unaudited)
Notes to the Group EVM financial statements (unaudited)
Note 1 Organisation and basis of presentation
Economic Value Management (EVM) is Swiss Re’s integrated economic measurement and steering framework used for planning, pricing, reserving and steering the business. The EVM framework has been in use as an internal steering tool to support business and strategic financial decisions since 2003. In addition, the EVM balance sheet provides the basis for determining available capital under the Swiss Solvency Test (SST). Like EVM, SST is based on an economic view. In the future, EVM best estimate cash flow information will also be the basis for the calculation of Solvency II technical provisions.
Nature of operationsThe Swiss Re Group, which is headquartered in Zurich, Switzerland, comprises Swiss Re Ltd (the parent company) and its subsidiaries (collectively, the “Swiss Re Group” or the “Group”). The Swiss Re Group is a wholesale provider of reinsurance, insurance and other insurance-based forms of risk transfer. Working through brokers and a network of more than 60 offices around the globe, its client base consists of insurance companies, mid-to-large-sized corporations and public sector clients.
Basis of presentationThe accompanying consolidated EVM financial statements have been prepared in accordance with the EVM principles as approved by the Swiss Re Group Risk and Capital Committee. All significant inter-company transactions and balances have been eliminated on consolidation.
On 17 February 2011, the Swiss Re Group announced the implementation of a new organisational structure. As a first step to create that new structure, the Swiss Re Group established a new holding company (Swiss Re Ltd) through an exchange offer. Swiss Reinsurance Company Ltd (“Swiss Reinsurance Company”) shareholders were offered the opportunity to exchange their shares in Swiss Reinsurance Company for new shares in the holding company on a one-for-one basis. Effective 20 May 2011, Swiss Re Ltd became the holding company of the Swiss Re Group, and effective 12 December 2011, Swiss Reinsurance Company became a wholly owned subsidiary of Swiss Re Ltd. Because holders of Swiss Re Ltd shares had the same beneficial ownership interests before and after the exchange offer, the exchange offer has been accounted for in a manner similar to a transaction between entities under common control (and not as a purchase event). The exchange offer did not have an impact on the consolidated EVM financial statements of the Swiss Re Group for the periods presented because the financial statements are presented as if Swiss Re Ltd had been the parent company for such periods.
The new corporate structure will be reflected in the Group EVM financial statements beginning in 2012. As a result, the segmental disclosures will change to reflect the way the Group manages its business activities. The new Group reporting structure will consist of the Reinsurance segment, with separate disclosure of the Property & Casualty and Life & Health units, the Corporate Solutions segment and the Admin Re® segment. The Group items segment will include the Group’s holding company (Swiss Re Ltd), and certain Treasury activities, as well as the remaining non-core activities that have been in run-off since November 2007.
Certain balance sheet comparatives have been restated to conform with the presentation captions adopted in the current year.
Principles of consolidationThe Group’s EVM financial statements follow the same consolidation principles as used in the preparation of the Group’s consolidated US GAAP financial statements, except for holdings with minority interests to which proportionate consolidation is applied to reflect Swiss Re’s economic share.
Use of estimates in the preparation of financial statementsThe preparation of EVM financial statements requires management to make significant estimates and assumptions that affect the reported amounts of assets, liabilities, revenues and expenses. The valuation of assets and liabilities reflects best estimates of underlying cash flows – premiums, claims, commissions, expenses, taxes, capital costs – taking into consideration all the information available at the time a contract is bound or revalued. In line with other valuation methods based on projections of future cash flows, EVM involves significant judgement when establishing assumptions to be used. The Group actively and carefully reviews assumptions, selecting those which are considered appropriate and seeking consistency among business activities, whilst reflecting all information available at year end. In-force business assets and liabilities for Property & Casualty and Life & Health include estimates for premiums, claims and benefit payments not received from ceding companies at the date of the financial statements. In addition, the Group has certain assets and liabilities for which liquid market prices do not exist. These estimates are determined on a market consistent basis using all information available at the time of valuation. However, actual results could differ significantly from these estimates described above.
Foreign currency translationAssets and liabilities denominated in foreign currencies are translated at the rate of exchange on the balance sheet date. Income statement items are translated at average January to December exchange rates.
18 Swiss Re EVM Report 2011
Group EVM financial statements (unaudited)
Closed book approach EVM excludes the recognition of all potential future new business activities, as well as potential renewals. EVM recognises all profits and losses resulting from expected cash flows from contractual rights and obligations at inception or the effective date of a business acquisition or disposition. Acquisitions do not result in the recording of goodwill. Changes to previous assumptions and estimates are recognised as they occur. Events and new information about assumptions and estimates occurring after the balance sheet date are not reflected in this financial statement.
The closed book principle does not imply that EVM is a run-off measure. Capital costs and expenses are projected on a going concern basis, i.e. reflecting constant diversification benefits and economies of scale.
The closed book principle is largely in line with other economic valuation frameworks such as MCEV or SST. The main differences relate to the treatment of potential future renewals (MCEV) and the going concern assumption (SST).
Valuation of assets and liabilitiesAll traded assets and liabilities are marked to market, based on quoted prices in active markets or observable inputs. Untraded assets and liabilities are valued consistently with market prices. The Group’s insurance liabilities are valued on a market consistent basis by replicating future expected cash flows with liquid financial market instruments. As the majority of the Group’s insurance liabilities do not contain embedded financial market risk exposure other than to interest rates, the market consistent value of liabilities can be determined by discounting future cash flows using prevailing risk free interest rates. If insurance liabilities include embedded options or guarantees (e.g. variable annuities or interest sensitive life business), they are valued on a market consistent basis using stochastic models and other appropriate valuation techniques.
In-force business assets and liabilitiesIn-force business assets are assets associated with (re-)insurance contracts underwritten and include estimated future premiums and other expected cash inflows related to existing (re-)insurance contracts. They are carried at market consistent valuations as described above. In-force business liabilities are liabilities associated with (re-)insurance contracts underwritten and include best estimate reserves for expected claims, commissions and expenses. They are carried at market consistent valuations as described above.
External retrocession assets and liabilitiesExternal retrocessions are carried at market consistent valuations consistent with the approaches used for inward business. A market consistent allowance for counterparty credit risk is applied to uncollateralized external net retrocession assets.
InvestmentsAll investments are valued at fair value. For non-traded assets, fair values are determined through a mark-to-model approach or other market consistent techniques validated through an independent price verification process.
Cash and cash equivalentsCash and cash equivalents include cash at hand, short-term deposits, certain short-term investments in money market funds, and highly liquid debt instruments with a remaining maturity at the date of acquisition of three months or less.
Future income tax assets and liabilitiesEVM valuations reflect best estimates of expected tax assets and liabilities related to in-force contracts.
Other assets and liabilitiesOther assets and liabilities are consistent with the US GAAP balance sheet with the exception of certain positions not recognised under EVM, such as deferred income and expenses, pre-payments, goodwill and intangible assets. Furthermore, economic valuation principles are applied to certain other assets and liabilities such as own use property, liabilities for employee incentive plans and projections for corporate centre expenses, resulting in a valuation difference to US GAAP.
DebtSwiss Re’s external debt including hybrid instruments is valued at fair value. Where available, market prices are used to infer the fair value of debt. Debt that is not publically traded is valued using market consistent valuation techniques.
Swiss Re EVM Report 2011 19
Group EVM financial statements (unaudited)
Pensions and other post-retirement benefitsSwiss Re’s obligations to pensions and other post-retirement benefits are based on US GAAP valuations and adjusted for certain parameters to infer an approximate economic valuation. Technical assumptions (e.g. mortality assumptions, technical interest rate assumptions etc.) underlying the reserve calculation for pension fund liabilities are consistent with US GAAP assumptions.
Provision for capital costsFrictional capital costs provide compensation for agency costs, costs of potential financial distress, and regulatory (illiquidity) costs. Frictional capital costs are reflected through a 4% charge on available capital and are allocated to segments based on EVM capital. EVM capital is projected assuming a stable business mix, therefore, current diversification benefits are assumed to continue into the future.
Premiums and feesPremiums and fees in the EVM income statement represent the present value of the best estimate of all premiums and fees on contracts written during the year. Changes in premium estimates on contracts written in prior years are reflected in the previous years’ business profit line, along with changes in other underwriting cash flows relating to previous years (e.g. expected claims).
Claims and benefitsClaims and benefits in the EVM income statement represent the present value of the best estimate of all claims and benefits payable in contracts written during the year. Changes in estimates of claims and benefits payable on contracts written in prior years are reflected in the previous years’ business profit line, along with changes in other underwriting cash flows relating to previous years (e.g. expected premiums). For example, because many of the Property & Casualty contracts written in the prior underwriting year cover risks in the current calendar year, potentially significant current year losses (e.g. on catastrophes) are frequently included in the previous years’ business profit line.
Note 2 Definitions and parameters
EVM profit and EVM incomeEVM profit is a risk adjusted measure of profitability that can be compared across all business activities. EVM income is the total return generated for shareholders and is before the release of capital costs. EVM income is therefore not a risk adjusted measure.
EVM profit is composed of profit from underwriting activities and profit from investment activities. The profit from underwriting in turn segregates results from new business and previous years’ business. New business is defined as business with an inception date within the current calendar (accounting) year. For Property & Casualty, performance resulting from insurance or reinsurance contracts written or renewed within the calendar year is recognised as new business. This also applies to multi-year transactions. For Life & Health, new business includes new individual business cessions in the year, renewals of and increments to existing group schemes, new group schemes, new Admin Re® blocks and new cessions on existing blocks still open to new business, and renewals of business that is subject to active annual renewal. Previous years’ business results reflect the impact of changes in cash flow projections on contracts incepting in previous accounting periods. Exceptions to this approach are explictly disclosed.
All investment and trading activities are marked to market and recognised as new business. The result from investment activities reflects the extent to which our investment management business has outperformed the liability-based benchmark returns. The return on the liability-based benchmark is deducted from the investment activities because it is credited to underwriting activities in determining the underwriting profit.
EVM capitalEVM capital is the measure of capital required to support the in-force book including investment activities, which takes internal risk, regulatory and rating agency capital requirements into consideration.
Economic net worthEconomic net worth (ENW) is defined as the difference between the market value of investments and the market consistent value of insurance assets and liabilities. ENW is the EVM measure of shareholders’ equity and the starting point in determining available capital under the Swiss Solvency Test (SST).
20 Swiss Re EVM Report 2011
Group EVM financial statements (unaudited)
Return on capital employed ratiosEconomic return on capital employed (EROC) is the ratio of EVM income before capital costs divided by EVM capital, calculated for new business:EROC = EVM income/present value of EVM capital
Profit margin is the ratio of EVM profit divided by EVM capital, calculated separately for new business and previous years’ business:Profit margin (new business) = EVM profit (new business)/present value of EVM capital allocated for new businessProfit margin (previous years’ business) = EVM profit (previous years’ business)/EVM capital allocated for previous years’ business
New business ratios reflect returns on EVM capital allocated for the lifetime of the business. Previous years’ ratios reflect returns on EVM capital allocated for previous years’ business in the current year.
Performance segmented between underwriting and investment activitiesEVM values and discloses underwriting and investment activities separately. Underwriting activities create value by raising funds through insurance transactions at a lower cost than through other sources. The performance of investment activities is assessed on a risk adjusted basis. This makes a like-for-like comparison of underwriting and investment activities possible.
Performance measurement after capital costsEVM explicitly recognises opportunity costs for shareholder capital. Capital charges cover the base cost of capital and frictional capital costs. The base cost of capital consists of the risk free return on Economic net worth plus market risk charges over and above the risk free return. Market risk charges provide compensation for systematic, non-diversifiable risk exposure.
Effective 1 January 2012, frictional capital costs will be allocated based on a weighted average of internal risk capital and regulatory required excess capital rather than based on an equally weighted average of internal risk, regulatory and rating agency capital.
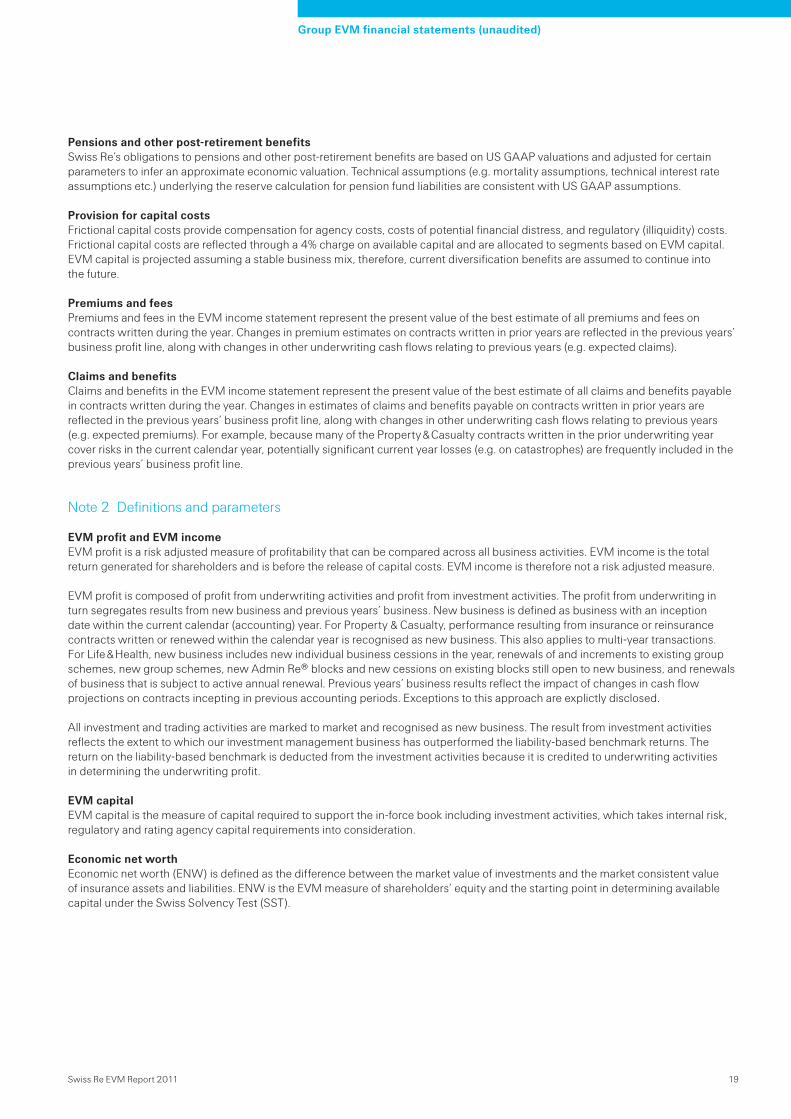
Risk free interest ratesThe market consistent value of insurance cash flows not correlated to financial market risks (standard insurance liabilities) can be determined with a liquidly traded portfolio of risk free government bonds matching the insurance liabilities’ expected cash flow profile (replicating portfolio). As a result, the value of insurance liabilities can be calculated by discounting best estimate cash flows with prevailing risk free interest rates. These interest rates also determine the investment return recognised at inception of a standard insurance contract. The replicating portfolio immunises underwriting activities against subsequent changes in risk free interest rates. Changes in risk free interest rates are reflected in the investment activities’ result by deducting the performance of the liability-based benchmark from the mark-to-market return on the invested assets (investment outperformance). Risk free interest rates are derived from government bond prices differentiated for 30 currencies and for durations up to 50 years. Insurance liabilities which are correlated to financial market risks (non-standard insurance liabilities) require different valuation and replication techniques, which adequately model the embedded financial market risk exposure.
Risk free spot rates for the main currencies as of 31 December 2011 and 31 December 2010 were as follows (source Bloomberg and Swiss Re):
Risk free interest rates December 2011:
0%
1%
2%
3%
4%
5%
CADGBPEURUSD
5045403530252015105
Swiss Re EVM Report 2011 21
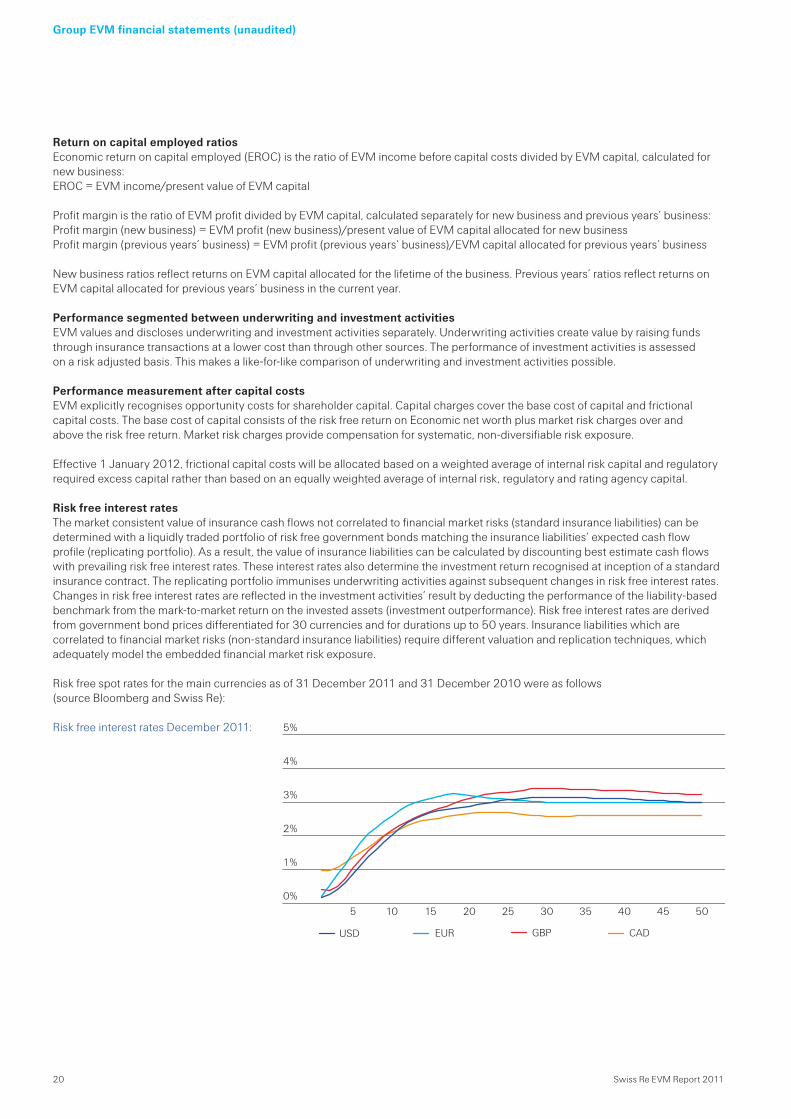
Risk free interest rates December 2010:
Between 1 January 2010 and 31 December 2011, the 5-year risk free spot rates for the main currencies developed as follows (source Bloomberg and Swiss Re):
5-year risk free spot rates 2010–2011
Market risk premiumsEVM market risk premiums (MRP) provide a market-derived estimate of the premium required by investors for taking systematic financial market risk. The MRP is deducted from EVM income as part of the capital costs to assess performance on a risk adjusted basis. The majority of the Group’s MRP stems from the credit risk embedded in the portfolios of Asset Management, former Legacy portfolio and Credit Underwriting. Generally, credit spreads are the main driver of the MRP charges. Between 1 January 2010 and 31 December 2011 the credit spreads of selected assets developed as follows (source Barclays):
Credit spreads 2010–2011:
Group EVM financial statements (unaudited)
0%
1%
2%
3%
4%
5%
CADGBPEURUSD
5045403530252015105
0.0%
0.5%
1.0%
1.5%
2.0%
2.5%
3.0%
3.5%
CADGBPEURUSD
Oct 11Jul 11Apr 11Jan 11Oct 10Jul 10Apr 10Jan 10
0
50
100
150
200
250
300
350
400
CMBS AAAGlobal Corporate AGlobal Corporate AAA
Dec
11
Sep
11
Jun
11
Mar
111
Dec
10
Sep
10
Jun
10
Mar
10
Jan
10
Oct 11Jul 11Apr 11Jan 11Oct 10Jul 10Apr 10Jan 10
22 Swiss Re EVM Report 2011
Group EVM financial statements (unaudited)
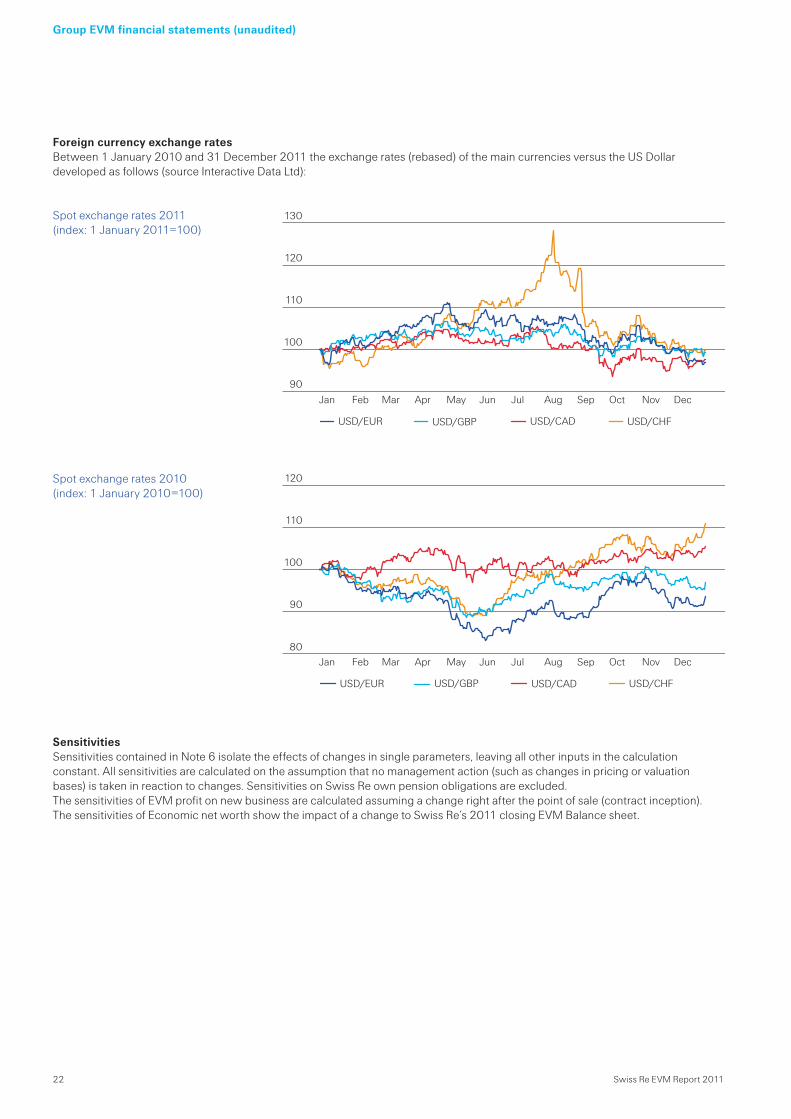
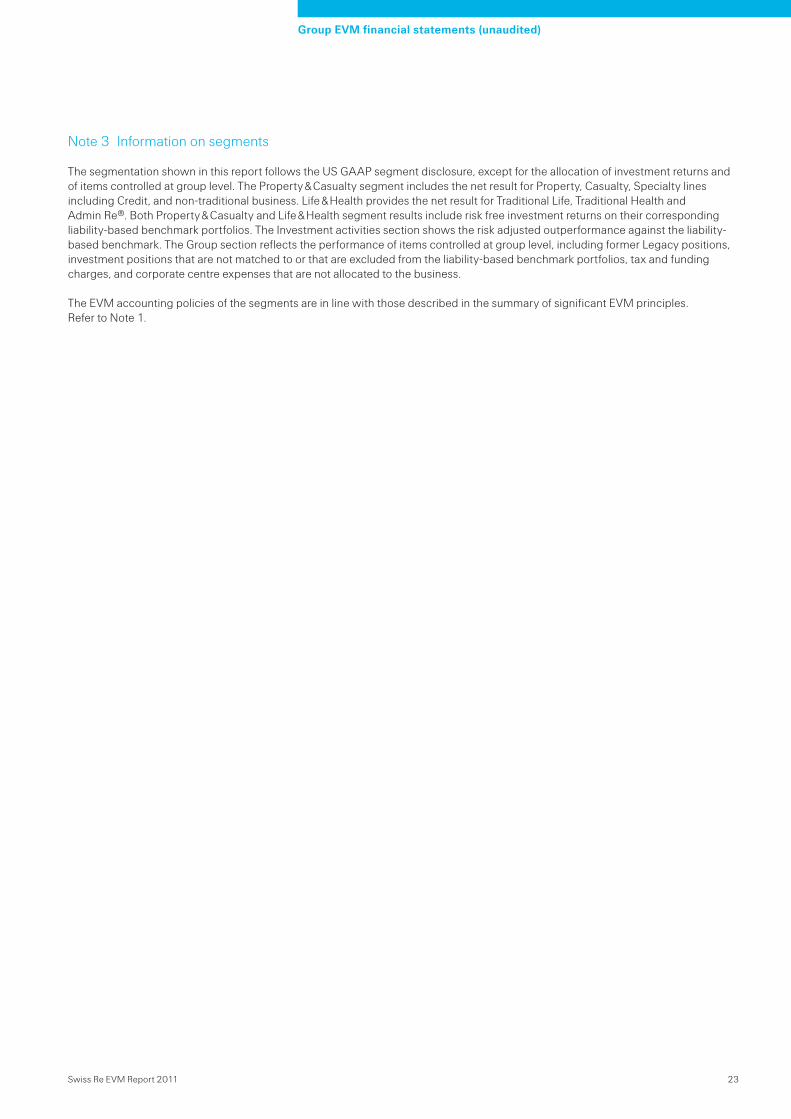
Foreign currency exchange ratesBetween 1 January 2010 and 31 December 2011 the exchange rates (rebased) of the main currencies versus the US Dollar developed as follows (source Interactive Data Ltd):
Spot exchange rates 2011 (index: 1 January 2011=100)
Spot exchange rates 2010(index: 1 January 2010=100)
SensitivitiesSensitivities contained in Note 6 isolate the effects of changes in single parameters, leaving all other inputs in the calculation constant. All sensitivities are calculated on the assumption that no management action (such as changes in pricing or valuation bases) is taken in reaction to changes. Sensitivities on Swiss Re own pension obligations are excluded.The sensitivities of EVM profit on new business are calculated assuming a change right after the point of sale (contract inception). The sensitivities of Economic net worth show the impact of a change to Swiss Re’s 2011 closing EVM Balance sheet.
80
90
100
110
120
USD/CHFUSD/CADUSD/GBPUSD/EUR
DecNovOctSepAugJulJunMayAprMarFebJan
90
100
110
120
130
USD/CHFUSD/CADUSD/GBPUSD/EUR
DecNovOctSepAugJulJunMayAprMarFebJan
Swiss Re EVM Report 2011 23
Group EVM financial statements (unaudited)
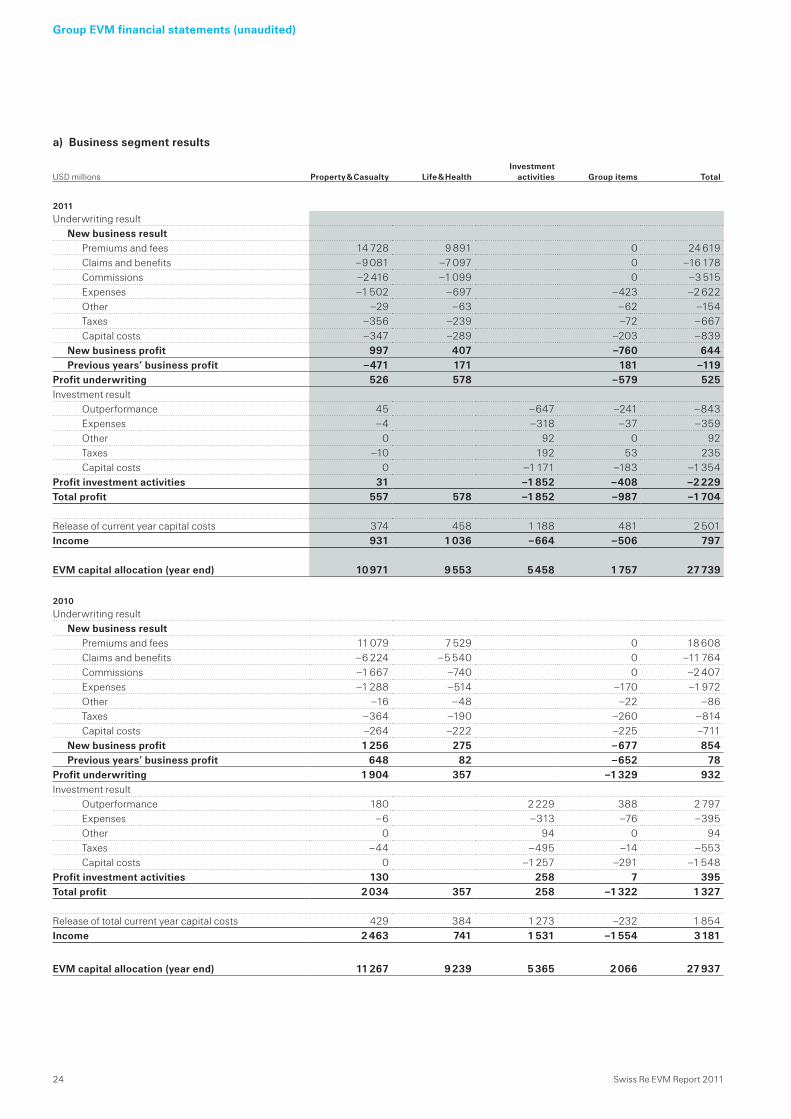
Note 3 Information on segments
The segmentation shown in this report follows the US GAAP segment disclosure, except for the allocation of investment returns and of items controlled at group level. The Property & Casualty segment includes the net result for Property, Casualty, Specialty lines including Credit, and non-traditional business. Life & Health provides the net result for Traditional Life, Traditional Health and Admin Re®. Both Property & Casualty and Life & Health segment results include risk free investment returns on their corresponding liability-based benchmark portfolios. The Investment activities section shows the risk adjusted outperformance against the liability-based benchmark. The Group section reflects the performance of items controlled at group level, including former Legacy positions, investment positions that are not matched to or that are excluded from the liability-based benchmark portfolios, tax and funding charges, and corporate centre expenses that are not allocated to the business.
The EVM accounting policies of the segments are in line with those described in the summary of significant EVM principles. Refer to Note 1.
24 Swiss Re EVM Report 2011
Group EVM financial statements (unaudited)
a) Business segment results
USD millions Property & Casualty Life & HealthInvestment
activities Group items Total
2011
Underwriting resultNew business result
Premiums and fees 14 728 9 891 0 24 619Claims and benefits –9 081 –7 097 0 –16 178Commissions –2 416 –1 099 0 –3 515Expenses –1 502 –697 –423 –2 622Other –29 –63 –62 –154Taxes –356 –239 –72 –667Capital costs –347 –289 –203 –839
New business profit 997 407 –760 644Previous years’ business profit –471 171 181 –119
Profit underwriting 526 578 –579 525Investment result
Outperformance 45 –647 –241 –843Expenses –4 –318 –37 –359Other 0 92 0 92Taxes –10 192 53 235Capital costs 0 –1 171 –183 –1 354
Profit investment activities 31 –1 852 –408 –2 229Total profit 557 578 –1 852 –987 –1 704
Release of current year capital costs 374 458 1 188 481 2 501Income 931 1 036 –664 –506 797
EVM capital allocation (year end) 10 971 9 553 5 458 1 757 27 739
2010
Underwriting resultNew business result
Premiums and fees 11 079 7 529 0 18 608Claims and benefits –6 224 –5 540 0 –11 764Commissions –1 667 –740 0 –2 407Expenses –1 288 –514 –170 –1 972Other –16 –48 –22 –86Taxes –364 –190 –260 –814Capital costs –264 –222 –225 –711
New business profit 1 256 275 –677 854Previous years’ business profit 648 82 –652 78
Profit underwriting 1 904 357 –1 329 932Investment result
Outperformance 180 2 229 388 2 797Expenses –6 –313 –76 –395Other 0 94 0 94Taxes –44 –495 –14 –553Capital costs 0 –1 257 –291 –1 548
Profit investment activities 130 258 7 395Total profit 2 034 357 258 –1 322 1 327
Release of total current year capital costs 429 384 1 273 –232 1 854Income 2 463 741 1 531 –1 554 3 181
EVM capital allocation (year end) 11 267 9 239 5 365 2 066 27 937
Swiss Re EVM Report 2011 25
Group EVM financial statements (unaudited)
Property & Casualty Life & HealthInvestment
activities Group items Total
Key ratios
2011
Profit marginNew business 12.9% 5.4% –33.9% n/a –7.0%Previous years’ business –7.6% 2.0% n/a n/a –0.8%
EROCNew business 17.9% 10.2% –12.2% n/a 2.0%
2010
Profit marginNew business 21.1% 5.1% 4.8% n/a 6.7%Previous years’ business 10.9% 1.1% n/a n/a 0.6%
EROCNew business 26.8% 10.7% 28.5% n/a 17.8%
26 Swiss Re EVM Report 2011
Group EVM financial statements (unaudited)
b) Property & Casualty business segmentFor the years ended 31 December
USD millions Property & Speciality Casualty Total
2011
Underwriting resultNew business result
Premiums and fees 8 991 5 737 14 728Claims and benefits –5 392 –3 689 –9 081Commissions –1 333 –1 083 –2 416Expenses –941 –561 –1 502Other –13 –16 –29Taxes –305 –51 –356Capital costs –233 –114 –347
New business profit 774 223 997Previous years’ business profit –625 154 –471
Profit underwriting 149 377 526Investment result
Outperformance 63 –18 45Expenses –4 0 –4Other 0 0 0Taxes –14 4 –10Capital costs 0 0 0
Profit investment activities 45 –14 31Total Profit 194 363 557
Release of total current year capital costs 142 232 374Income 336 595 931
2010
Underwriting resultNew business result
Premium and fees 7 337 3 742 11 079Claims and benefits –3 801 –2 423 –6 224Commissions –1 085 –582 –1 667Expenses –819 –469 –1 288Other –6 –10 –16Taxes –318 –46 –364Capital costs –156 –108 –264
New business profit 1 152 104 1 256Previous years’ business profit 257 391 648
Profit underwriting 1 409 495 1 904Investment result
Outperformance 162 18 180Expenses –6 0 –6Other 0 0 0Taxes –42 –2 –44Capital costs 0 0 0
Profit investment activities 114 16 130Total profit 1 523 511 2 034
Release of total current year capital costs 195 234 429Income 1 718 745 2 463
Swiss Re EVM Report 2011 27
Group EVM financial statements (unaudited)
c) Life & Health business segmentFor the years ended 31 December
USD millions Life traditional Health traditional Admin Re® Total
2011
Underwriting resultNew business result
Premiums and fees 6 386 2 358 1 147 9 891Claims and benefits –4 894 –1 491 –712 –7 097Commissions –533 –472 –94 –1 099Expenses –342 –181 –174 –697Other –35 –12 –16 –63Taxes –139 –54 –46 –239Capital costs –192 –53 –44 –289
New business profit 251 95 61 407Previous years’ business profit 127 493 –449 171
Total profit 378 588 –388 578
Release of total current year capital costs 319 44 95 458Income 697 632 –293 1 036
2010
Underwriting resultNew business result
Premiums and fees 5 625 1 904 0 7 529Claims and benefits –4 166 –1 374 0 –5 540Commissions –548 –192 0 –740Expenses –297 –173 –44 –514Other –36 –12 0 –48Taxes –154 –44 8 –190Capital costs –179 –43 0 –222
New business profit 245 66 –36 275Previous years’ business profit 126 209 –253 82
Total profit 371 275 –289 357
Release of total current year capital costs 191 121 72 384Income 562 396 –217 741
28 Swiss Re EVM Report 2011
Group EVM financial statements (unaudited)
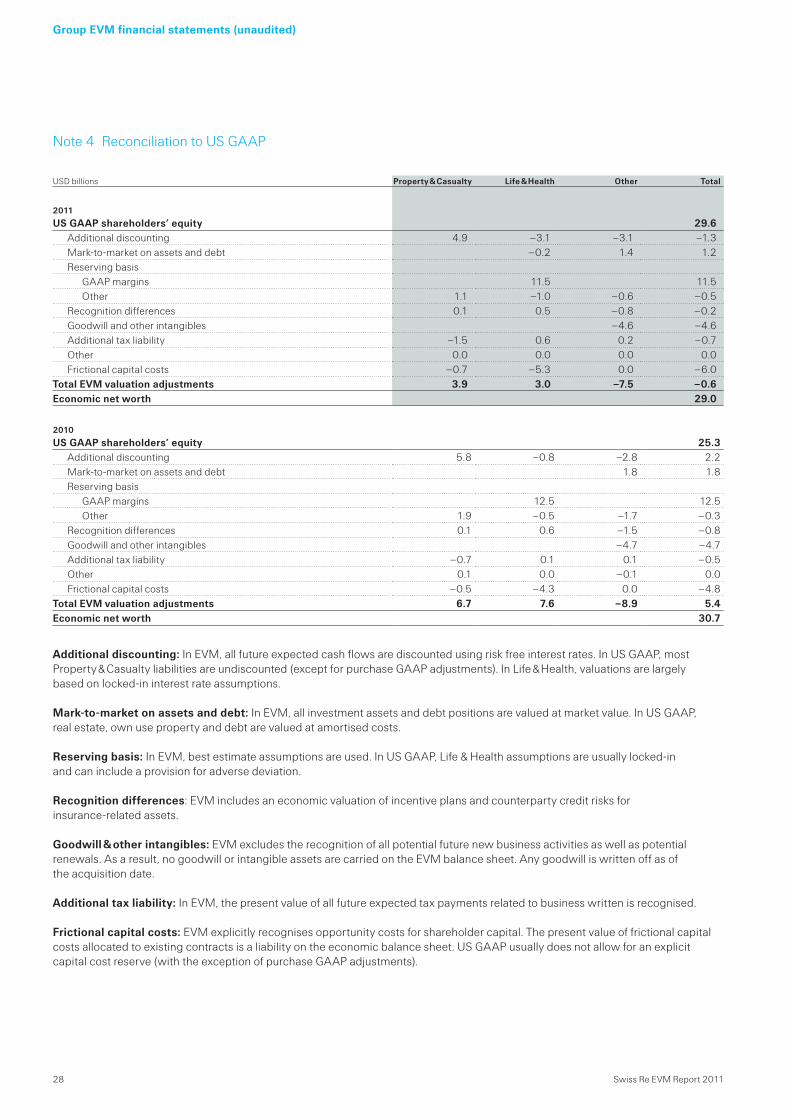
Note 4 Reconciliation to US GAAP
Additional discounting: In EVM, all future expected cash flows are discounted using risk free interest rates. In US GAAP, most Property & Casualty liabilities are undiscounted (except for purchase GAAP adjustments). In Life & Health, valuations are largely based on locked-in interest rate assumptions.
Mark-to-market on assets and debt: In EVM, all investment assets and debt positions are valued at market value. In US GAAP, real estate, own use property and debt are valued at amortised costs.
Reserving basis: In EVM, best estimate assumptions are used. In US GAAP, Life & Health assumptions are usually locked-in and can include a provision for adverse deviation.
Recognition differences: EVM includes an economic valuation of incentive plans and counterparty credit risks for insurance-related assets. Goodwill & other intangibles: EVM excludes the recognition of all potential future new business activities as well as potential renewals. As a result, no goodwill or intangible assets are carried on the EVM balance sheet. Any goodwill is written off as of the acquisition date.
Additional tax liability: In EVM, the present value of all future expected tax payments related to business written is recognised.
Frictional capital costs: EVM explicitly recognises opportunity costs for shareholder capital. The present value of frictional capital costs allocated to existing contracts is a liability on the economic balance sheet. US GAAP usually does not allow for an explicit capital cost reserve (with the exception of purchase GAAP adjustments).
USD billions Property & Casualty Life & Health Other Total
2011
US GAAP shareholders’ equity 29.6Additional discounting 4.9 –3.1 –3.1 –1.3Mark-to-market on assets and debt –0.2 1.4 1.2Reserving basis
GAAP margins 11.5 11.5Other 1.1 –1.0 –0.6 –0.5
Recognition differences 0.1 0.5 –0.8 –0.2Goodwill and other intangibles –4.6 –4.6Additional tax liability –1.5 0.6 0.2 –0.7Other 0.0 0.0 0.0 0.0Frictional capital costs –0.7 –5.3 0.0 –6.0
Total EVM valuation adjustments 3.9 3.0 –7.5 –0.6Economic net worth 29.0
2010
US GAAP shareholders’ equity 25.3Additional discounting 5.8 –0.8 –2.8 2.2Mark-to-market on assets and debt 1.8 1.8Reserving basis
GAAP margins 12.5 12.5Other 1.9 –0.5 –1.7 –0.3
Recognition differences 0.1 0.6 –1.5 –0.8Goodwill and other intangibles –4.7 –4.7Additional tax liability –0.7 0.1 0.1 –0.5Other 0.1 0.0 –0.1 0.0Frictional capital costs –0.5 –4.3 0.0 –4.8
Total EVM valuation adjustments 6.7 7.6 –8.9 5.4Economic net worth 30.7
Swiss Re EVM Report 2011 29
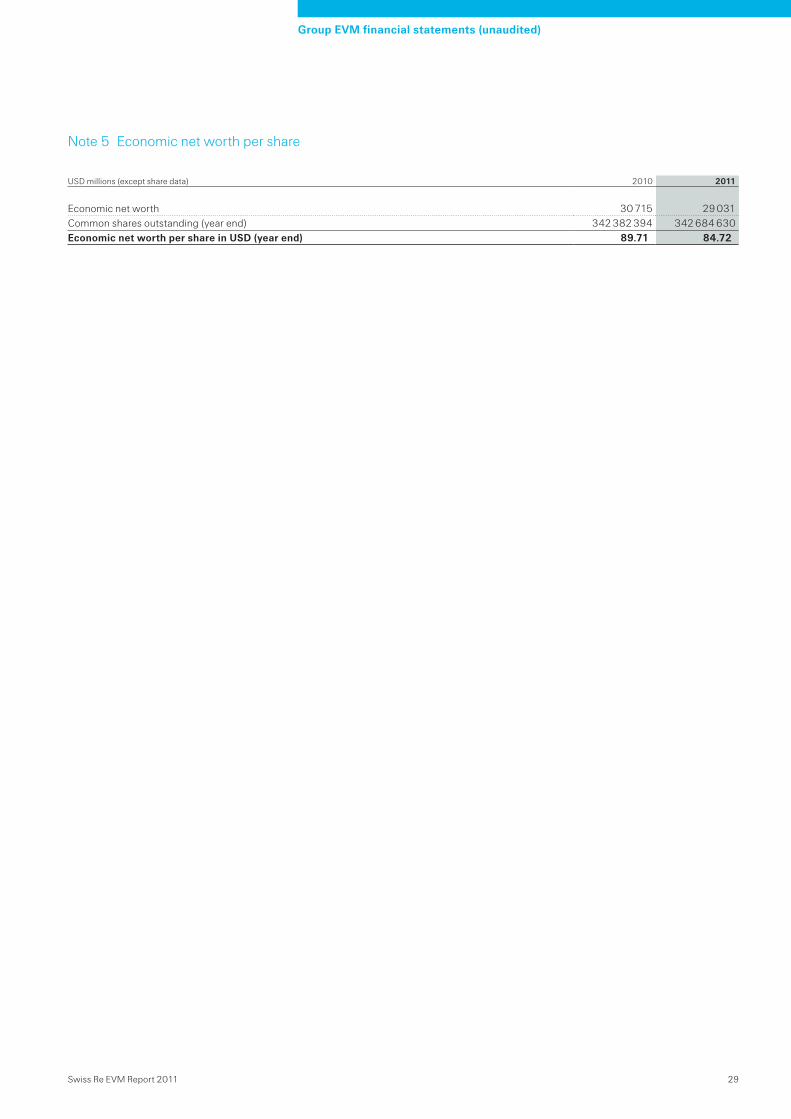
Note 5 Economic net worth per share
Group EVM financial statements (unaudited)
USD millions (except share data) 2010 2011
Economic net worth 30 715 29 031Common shares outstanding (year end) 342 382 394 342 684 630Economic net worth per share in USD (year end) 89.71 84.72
30 Swiss Re EVM Report 2011
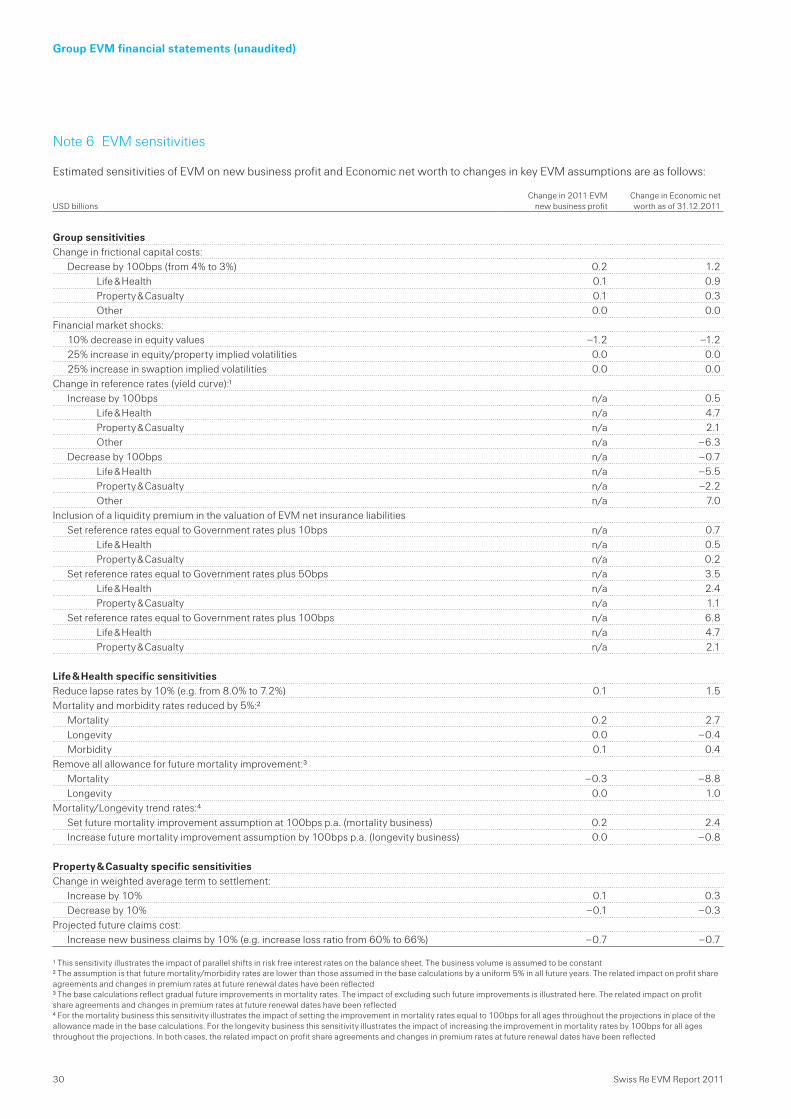
Note 6 EVM sensitivities
Estimated sensitivities of EVM on new business profit and Economic net worth to changes in key EVM assumptions are as follows:
Group EVM financial statements (unaudited)
USD billionsChange in 2011 EVM
new business profitChange in Economic net worth as of 31.12.2011
Group sensitivities Change in frictional capital costs:
Decrease by 100bps (from 4% to 3%) 0.2 1.2Life & Health 0.1 0.9Property & Casualty 0.1 0.3Other 0.0 0.0
Financial market shocks:10% decrease in equity values –1.2 –1.225% increase in equity/property implied volatilities 0.0 0.025% increase in swaption implied volatilities 0.0 0.0
Change in reference rates (yield curve):1Increase by 100bps n/a 0.5
Life & Health n/a 4.7Property & Casualty n/a 2.1Other n/a –6.3
Decrease by 100bps n/a –0.7Life & Health n/a –5.5Property & Casualty n/a –2.2Other n/a 7.0
Inclusion of a liquidity premium in the valuation of EVM net insurance liabilitiesSet reference rates equal to Government rates plus 10bps n/a 0.7
Life & Health n/a 0.5Property & Casualty n/a 0.2
Set reference rates equal to Government rates plus 50bps n/a 3.5Life & Health n/a 2.4Property & Casualty n/a 1.1
Set reference rates equal to Government rates plus 100bps n/a 6.8Life & Health n/a 4.7Property & Casualty n/a 2.1
Life & Health specific sensitivities Reduce lapse rates by 10% (e.g. from 8.0% to 7.2%) 0.1 1.5Mortality and morbidity rates reduced by 5%:2
Mortality 0.2 2.7Longevity 0.0 –0.4Morbidity 0.1 0.4
Remove all allowance for future mortality improvement:3Mortality –0.3 –8.8Longevity 0.0 1.0
Mortality/Longevity trend rates:4Set future mortality improvement assumption at 100bps p.a. (mortality business) 0.2 2.4Increase future mortality improvement assumption by 100bps p.a. (longevity business) 0.0 –0.8
Property & Casualty specific sensitivitiesChange in weighted average term to settlement:
Increase by 10% 0.1 0.3Decrease by 10% –0.1 –0.3
Projected future claims cost:Increase new business claims by 10% (e.g. increase loss ratio from 60% to 66%) –0.7 –0.7
1 This sensitivity illustrates the impact of parallel shifts in risk free interest rates on the balance sheet. The business volume is assumed to be constant2 The assumption is that future mortality/morbidity rates are lower than those assumed in the base calculations by a uniform 5% in all future years. The related impact on profit share agreements and changes in premium rates at future renewal dates have been reflected3 The base calculations reflect gradual future improvements in mortality rates. The impact of excluding such future improvements is illustrated here. The related impact on profit share agreements and changes in premium rates at future renewal dates have been reflected4 For the mortality business this sensitivity illustrates the impact of setting the improvement in mortality rates equal to 100bps for all ages throughout the projections in place of the allowance made in the base calculations. For the longevity business this sensitivity illustrates the impact of increasing the improvement in mortality rates by 100bps for all ages throughout the projections. In both cases, the related impact on profit share agreements and changes in premium rates at future renewal dates have been reflected
Swiss Re EVM Report 2011 31
Group EVM financial statements (unaudited)
PricewaterhouseCoopers review report
To the Board of Directors of Swiss Re Ltd, ZurichWe have reviewed the Economic Value Management (“EVM”) financial information of Swiss Re Ltd as set out on pages 14 to 30 as of and for the year ended 31 December 2011 (“the supplementary financial information”). This supplementary financial information is the responsibility of the Board of Directors. Our responsibility is to issue a report on this supplementary financial information based on our review.
Our review was conducted in accordance with the International Standard on Review Engagements 2400 and Swiss Auditing Standard 910, which require that a review be planned and performed to obtain moderate assurance about whether the supplementary financial information is free from material misstatement. A review is limited primarily to inquiries of company personnel and analytical procedures applied to financial data and thus provides less assurance than an audit. We have not performed an audit and, accordingly, we do not express an audit opinion.
Based on our review, nothing has come to our attention that causes us to believe that the accompanying supplementary financial information has not been properly prepared, in all material respects, in accordance with the EVM principles and policies as stated in the Notes on the EVM methodology to the supplementary financial information.
This review report has been prepared for and only for the Board of Directors in accordance with our letter of engagement and for no other purpose. We do not, in giving this report, accept or assume responsibility for any other purpose or to any other person whom this report is shown or in whose hands it may come save where expressly agreed by our prior consent in writing.
PricewaterhouseCoopers AG
Alex Finn Dawn M Kink
Zurich, 15 March 2012
32 Swiss Re EVM Report 2011
General Information
Cautionary note on forward-looking statements
Certain statements and illustrations contained herein are forward-looking. These statements and illustrations provide current expectations of future events based on certain assumptions and include any statement that does not directly relate to a historical fact or current fact.Forward-looking statements typically are identified by words or phrases such as “anticipate“, “assume“, “believe“, “continue“, “estimate“, “expect“, “foresee“, “intend“, “may increase“ and “may fluctuate“ and similar expressions or by future or conditional verbs such as “will“, “should“, “would“ and “could“. These forward-looking statements involve known and unknown risks, uncertainties and other factors, which may cause Swiss Re’s actual results of operations, financial condition, solvency ratios, liquidity position or prospects to be materially different from any future results of operations, financial condition, solvency ratios, liquidity position or prospects expressed or implied by such statements. Such factors include, among others:
further instability affecting the global financial system and developments related thereto, including as a result of concerns over, or adverse developments relating to, sovereign debt of euro area countries;
further deterioration in global economic conditions; Swiss Re’s ability to maintain sufficient liquidity and access to capital markets, including sufficient liquidity to cover potential
recapture of reinsurance agreements, early calls of debt or debt-like arrangements and collateral calls due to actual or perceived deterioration of Swiss Re’s financial strength or otherwise;
the effect of market conditions, including the global equity and credit markets, and the level and volatility of equity prices, interest rates, credit spreads, currency values and other market indices, on Swiss Re’s investment assets;
changes in Swiss Re’s investment result as a result of changes in its investment policy or the changed composition of its investment assets, and the impact of the timing of any such changes relative to changes in market conditions;
uncertainties in valuing credit default swaps and other credit-related instruments; possible inability to realise amounts on sales of securities on Swiss Re’s balance sheet equivalent to their mark-to-market values
recorded for accounting purposes; the outcome of tax audits, the ability to realise tax loss carryforwards and the ability to realise deferred tax assets (including by
reason of the mix of earnings in a jurisdiction or deemed change of control), which could negatively impact future earnings; the possibility that Swiss Re’s hedging arrangements may not be effective; the lowering or loss of financial strength or other ratings of Swiss Re companies, and developments adversely affecting Swiss Re’s
ability to achieve improved ratings; the cyclicality of the reinsurance industry; uncertainties in estimating reserves; uncertainties in estimating future claims for purposes of financial reporting, particularly with respect to large natural catastrophes,
as significant uncertainties may be involved in estimating losses from such events and preliminary estimates may be subject to change as new information becomes available;
the frequency, severity and development of insured claim events; acts of terrorism and acts of war; mortality and morbidity experience; policy renewal and lapse rates; extraordinary events affecting Swiss Re’s clients and other counterparties, such as bankruptcies, liquidations and other credit-
related events; current, pending and future legislation and regulation affecting Swiss Re or its ceding companies; legal actions or regulatory investigations or actions, including those in respect of industry requirements or business conduct rules
of general applicability; changes in economic theory or principles; significant investments, acquisitions or dispositions, and any delays, unexpected costs or other issues experienced in connection
with any such transactions; changing levels of competition; operational factors, including the efficacy of risk management and other internal procedures in managing the foregoing risks; and challenges in implementation, adverse responses of counterparties, regulators or rating agencies, or other issues arising from, or
otherwise relating to, the changes in Swiss Re’s corporate structure.
These factors are not exhaustive. Swiss Re operates in a continually changing environment and new risks emerge continually. Readers are cautioned not to place undue reliance on forward-looking statements. Swiss Re undertakes no obligation to publicly revise or update any forward-looking statements, whether as a result of new information, future events or otherwise.

Swiss Re Ltd Mythenquai 50/60 P.O. Box 8022 Zurich SwitzerlandTelephone +41 43 285 2121 Fax +41 43 285 2999 www.swissre.com
© 2012 Swiss Re. All rights reserved.


![Korea Fintech Industry & Fintech Center Korea · [7/30, 2015 ] Alibaba Samsung GM Electronics 201.6 billion USD 155.5 billion USD 50.6 billion USD $111.8 billion 2018 $ 9.3 billion](https://img.pdfslide.net/doc/110x75/5f07c81f7e708231d41eb72b/korea-fintech-industry-fintech-center-korea-730-2015-alibaba-samsung.jpg)