Embed Size (px)
Citation preview
25 April 2013
Economically Active Population Survey (EAPS) First quarter of 2013
Main results
Employment in the first quarter of 2013 registers a decrease of 322,300 persons, reaching a total of 16,634,700 employed persons. The quarterly employment variation rate stands at –1.90% and the annual rate stands at –4.58%. Employment decreases by 71,400 persons in public employment, and by 251,000 in private employment.
The number of independent workers or businesspersons without wage earners increases 22,100 this quarter. However, the number of self-employed workers decreases by 9,900. The total number of wage earners with a permanent contract decreases by 118,400, and wage earners with a temporary contract decrease by 194,400.
Employment decreases by 170,500 persons in Services, by 66,800 in Industry, by 60,900 in Agriculture and by 24,200 in Construction.
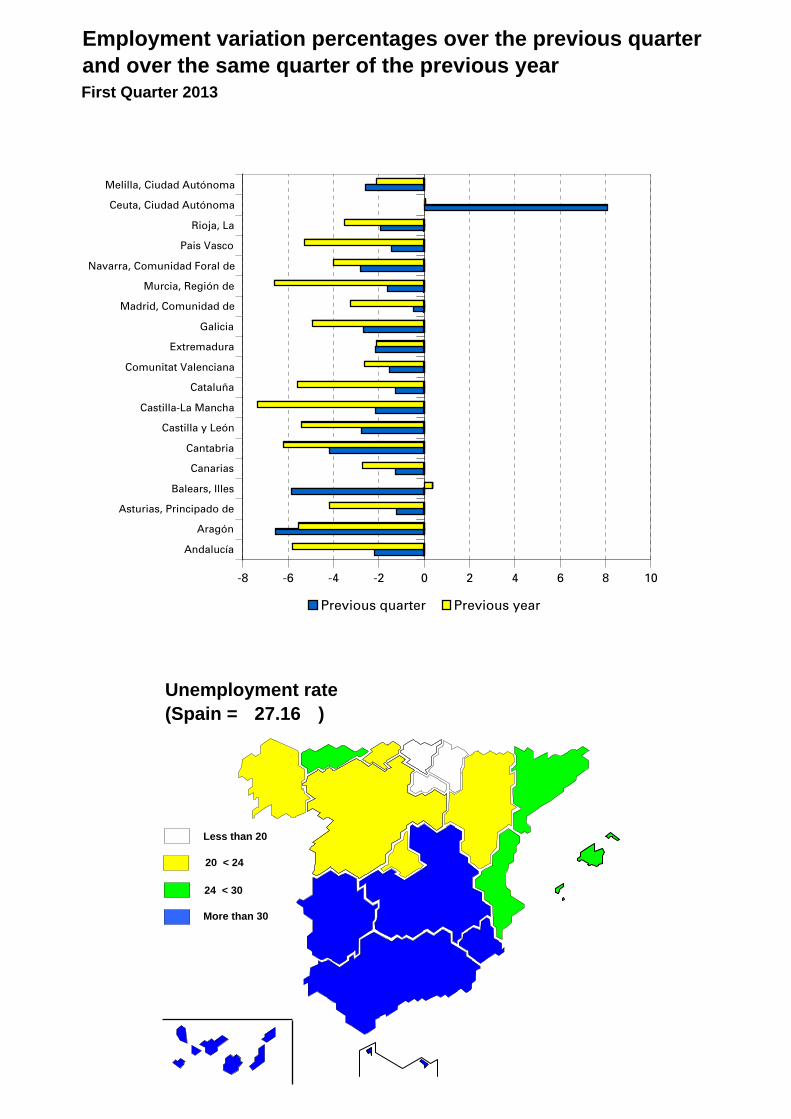
The Autonomous Communities with the greatest decreases in employment, as compared with the previous quarter, are: Andalucía (57,100 fewer employed persons), Cataluña (35,700) and Aragón (35,200).
Illes Balears is the only Autonomous Community with a positive interannual variation rate for employment (0.37%). Extremadura (-2.12%), Comunitat Valenciana (-2.64%) and Canarias (-2.70%) have the lowest negative interannual rates. In turn, the greatest decreases in the interannual rate of employment are registered in Castilla-La Mancha (-7.36%), Región de Murcia (-6.60%) and Cantabria (-6.21%).
The number of unemployed persons increases by 237,400 persons and reaches the figure of 6,202,700. The unemployment rate increases 1.14 points, standing at 27,16%.
Increases in unemployment affects almost all Autonomous Communities. The greatest increases, as compared with the previous quarter, are registered in Andalucía (31,100 more unemployed persons), Comunitat Valenciana (27,400) and Illes Balears (24,900).
1
Employment 1
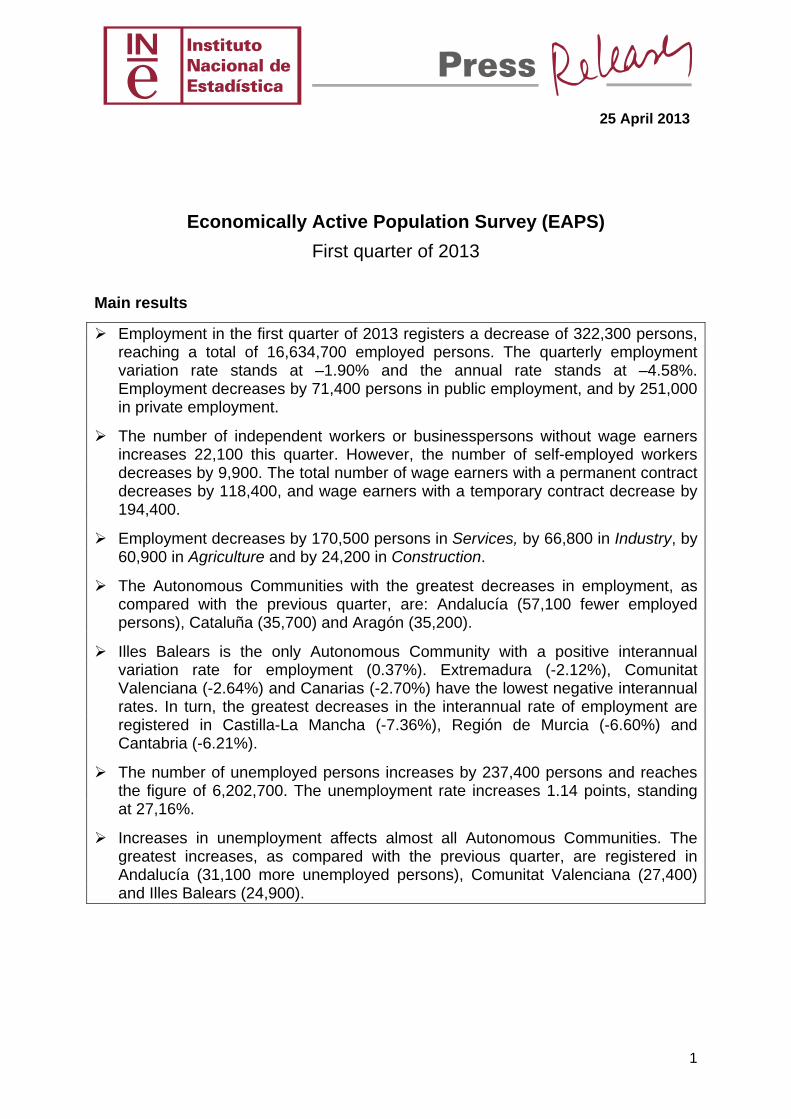
The number of employed persons decreased by 322,300 persons in the first quarter of 2013, standing at 16,634,700. The quarterly variation rate of employment stood at –1.90%.
The employment rate decrease was not as sharp as it was in the same quarter of last year.
Quarter‐on‐quarter employment performance, in thousands (variation of 1Q‐2013 as compared with 4Q‐2012)
‐74.6
‐766.0
‐251.8 ‐256.5
‐374.3‐322.3
‐900
‐800
‐700
‐600
‐500
‐400
‐300
‐200
‐100
0
1Q‐2008 1Q‐2009 1Q‐2010 1Q‐2011 1Q‐2012 1Q‐2013
Thou
sand
s
By sex, the drop in employment was greater among men (-199,500 fewer employed men) than among women (-122,800). By nationality, employment decreased by 218,700 among the Spaniards and by 103,600 among the foreign nationals.
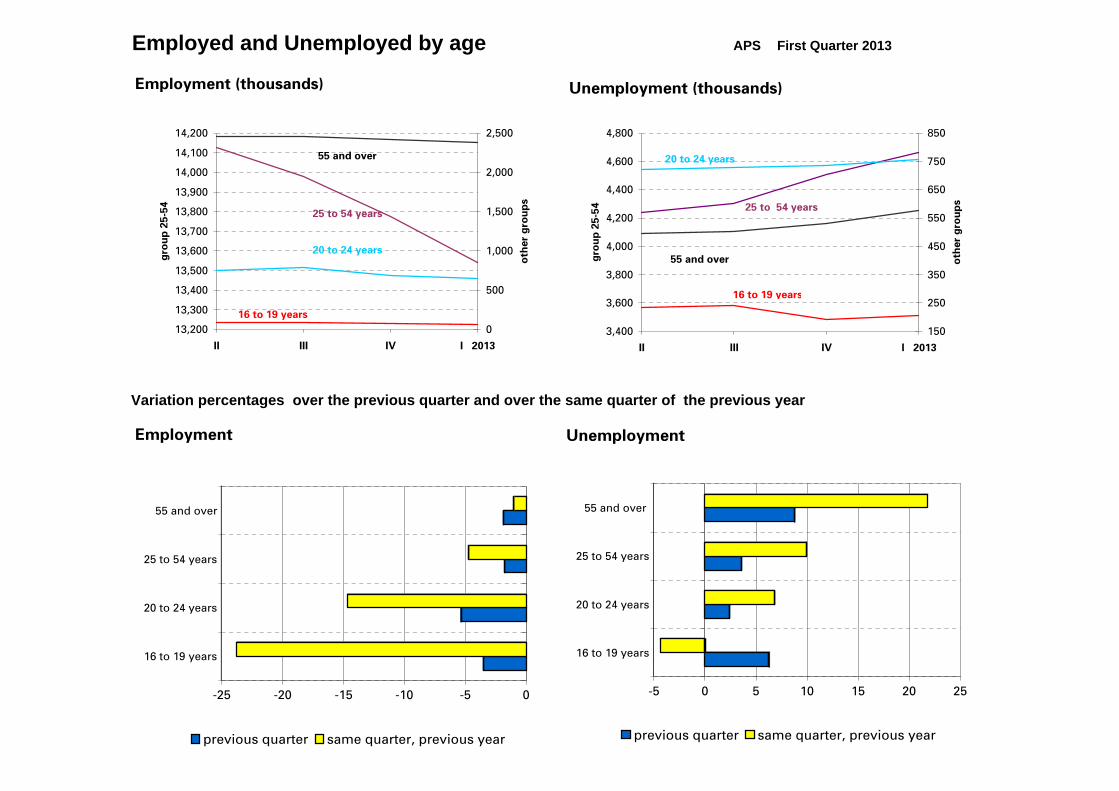
The decrease in employment affected practically every age group, especially that aged 25-29 years old (69,000 fewer employed persons).
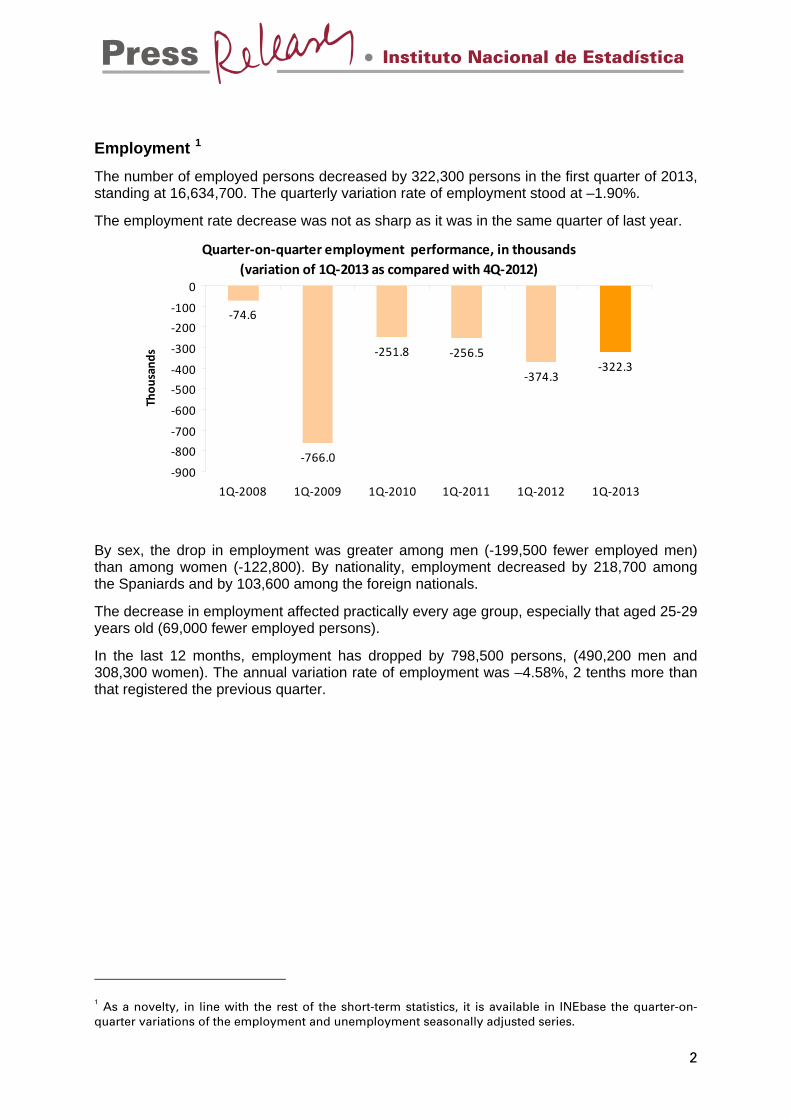
In the last 12 months, employment has dropped by 798,500 persons, (490,200 men and 308,300 women). The annual variation rate of employment was –4.58%, 2 tenths more than that registered the previous quarter.
1 As a novelty, in line with the rest of the short-term statistics, it is available in INEbase the quarter-on-quarter variations of the employment and unemployment seasonally adjusted series.
2
Total performance of employed persons, as an annual rate
‐1.32%‐0.94%
‐2.11%
‐3.26%
‐3.96%
‐4.84%‐4.60% ‐4.78% ‐4.58%
‐6%
‐5%
‐4%
‐3%
‐2%
‐1%
0%
1Q‐2011 2Q‐2011 3Q‐2011 4Q‐2011 1Q‐2012 2Q‐2012 3Q‐2012 4Q‐2012 1Q‐2013
This quarter, the number of employed persons decreased in every sector. In Services did so by 170,500, in Industry by 66,800, in Agriculture by 60,900 and in Construction by 24,200.
Full-time employment decreased by 385,300 persons this quarter, whilst part-time employed persons increased by 63,000. The percentage of persons working part time increased 68 hundredths, reaching 16%.
The number of self-employed workers decreased by 9,900 persons the first quarter of 2013. Businesspersons without wage earners or independent workers increased by 22,100.
The number of wage earners decreased by 312,800. Those with a permanent contract decreased by 118,400, and those wage earners with temporary contracts did so by 194,400. The temporary employment rate decreased nine tenths, standing at 22.12%.
The number of wage earners dropped by 798,500 over the last 12 months, whereas the number of self-employed workers did so by 2,900.
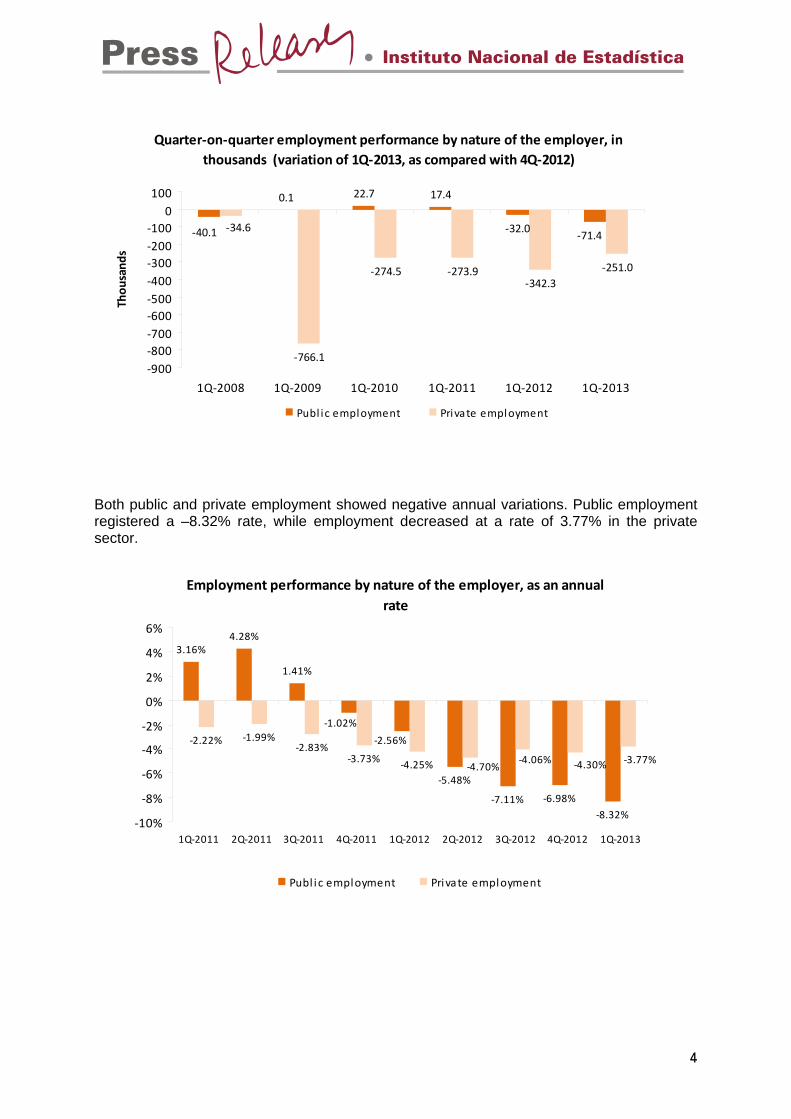
Private employment2 dropped by 251,000 persons this quarter, and stood at 13,788,900. In turn, public employment decreased by 71,400 persons, reaching 2,845,800.
2 Employment in the private sector includes: wage earners from the private sector, employers, independent workers and businesspersons without wage earners, members of a cooperative, family assistance and other professional situations. Employment in the public sector includes all the wage earners of public enterprises and of the National and Regional Administrations, including both workers contributing to the SS and those attached to an Insurance society.
3
4
Quarter‐on‐quarter employment performance by nature of the employer, in thousands (variation of 1Q‐2013, as compared with 4Q‐2012)
0.1 22.7 17.4
‐32.0
‐766.1
‐274.5 ‐273.9‐342.3
‐251.0
‐71.4‐40.1 ‐34.6
‐900‐800‐700‐600‐500‐400‐300‐200‐100
0100
1Q‐2008 1Q‐2009 1Q‐2010 1Q‐2011 1Q‐2012 1Q‐2013
Thou
sand
s
Publ ic employment Private employment
Both public and private employment showed negative annual variations. Public employment registered a –8.32% rate, while employment decreased at a rate of 3.77% in the private sector.
Employment performance by nature of the employer, as an annual
rate
3.16%4.28%
1.41%
‐5.48%
‐7.11% ‐6.98%
‐8.32%
‐2.22% ‐1.99%‐2.83%
‐3.73% ‐4.25%
‐1.02%
‐2.56%
‐4.70%‐4.06% ‐4.30% ‐3.77%
‐10%
‐8%
‐6%
‐4%
‐2%
0%
2%
4%
6%
1Q‐2011 2Q‐2011 3Q‐2011 4Q‐2011 1Q‐2012 2Q‐2012 3Q‐2012 4Q‐2012 1Q‐2013
Publ i c employment Private employment
Unemployment and unemployment rate3
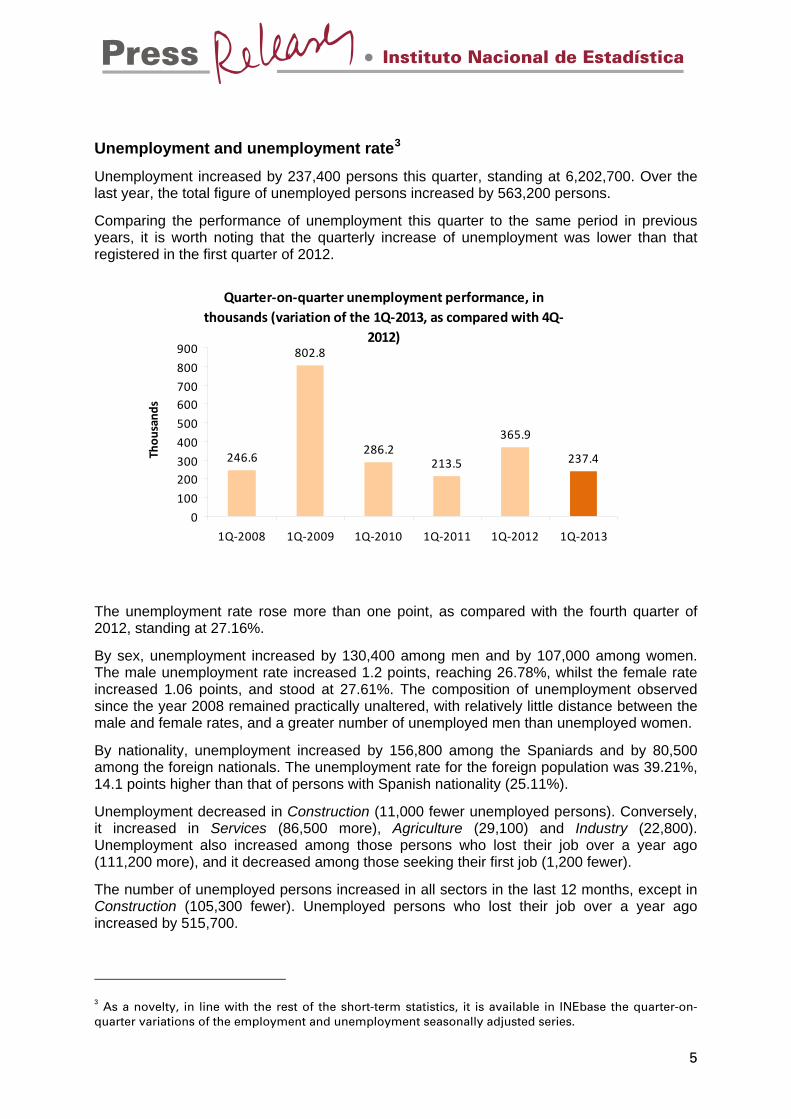
Unemployment increased by 237,400 persons this quarter, standing at 6,202,700. Over the last year, the total figure of unemployed persons increased by 563,200 persons.
Comparing the performance of unemployment this quarter to the same period in previous years, it is worth noting that the quarterly increase of unemployment was lower than that registered in the first quarter of 2012.
Quarter‐on‐quarter unemployment performance, in
thousands (variation of the 1Q‐2013, as compared with 4Q‐2012)
246.6
802.8
286.2213.5
365.9
237.4
0
100
200300
400
500
600700
800
900
1Q‐2008 1Q‐2009 1Q‐2010 1Q‐2011 1Q‐2012 1Q‐2013
Thou
sand
s
The unemployment rate rose more than one point, as compared with the fourth quarter of 2012, standing at 27.16%.
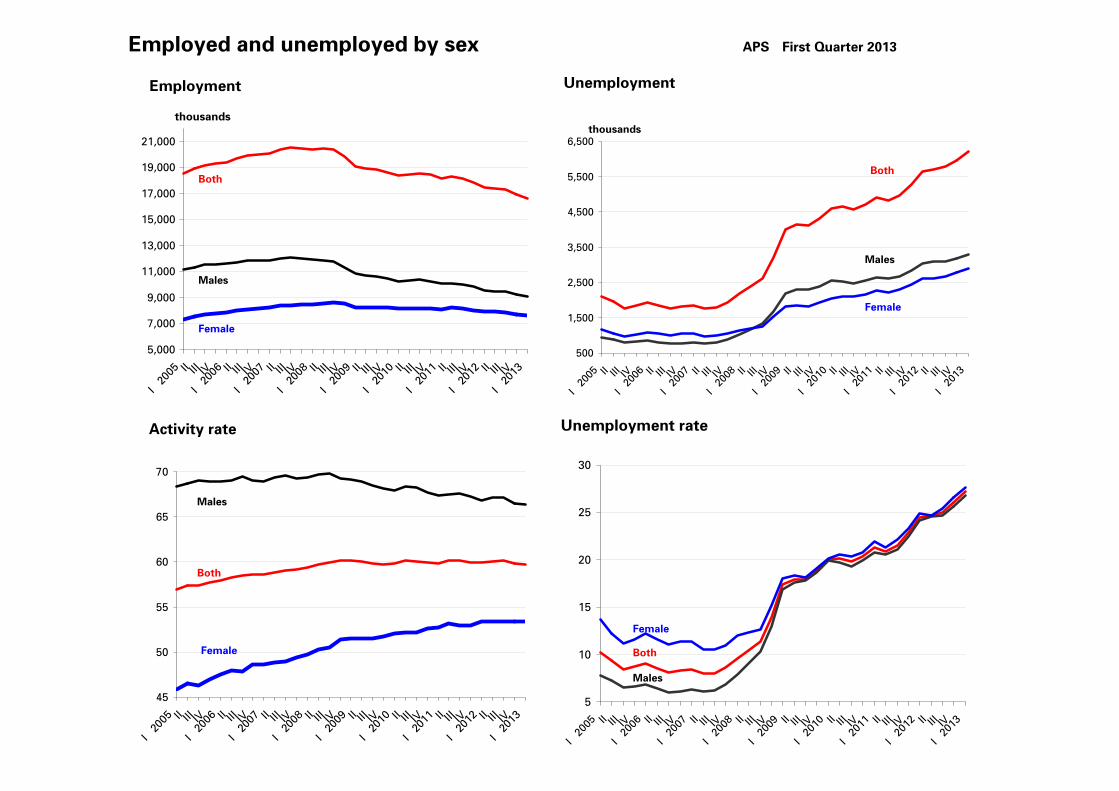
By sex, unemployment increased by 130,400 among men and by 107,000 among women. The male unemployment rate increased 1.2 points, reaching 26.78%, whilst the female rate increased 1.06 points, and stood at 27.61%. The composition of unemployment observed since the year 2008 remained practically unaltered, with relatively little distance between the male and female rates, and a greater number of unemployed men than unemployed women.
By nationality, unemployment increased by 156,800 among the Spaniards and by 80,500 among the foreign nationals. The unemployment rate for the foreign population was 39.21%, 14.1 points higher than that of persons with Spanish nationality (25.11%).
Unemployment decreased in Construction (11,000 fewer unemployed persons). Conversely, it increased in Services (86,500 more), Agriculture (29,100) and Industry (22,800). Unemployment also increased among those persons who lost their job over a year ago (111,200 more), and it decreased among those seeking their first job (1,200 fewer).
The number of unemployed persons increased in all sectors in the last 12 months, except in Construction (105,300 fewer). Unemployed persons who lost their job over a year ago increased by 515,700.
3 As a novelty, in line with the rest of the short-term statistics, it is available in INEbase the quarter-on-quarter variations of the employment and unemployment seasonally adjusted series.
5
6
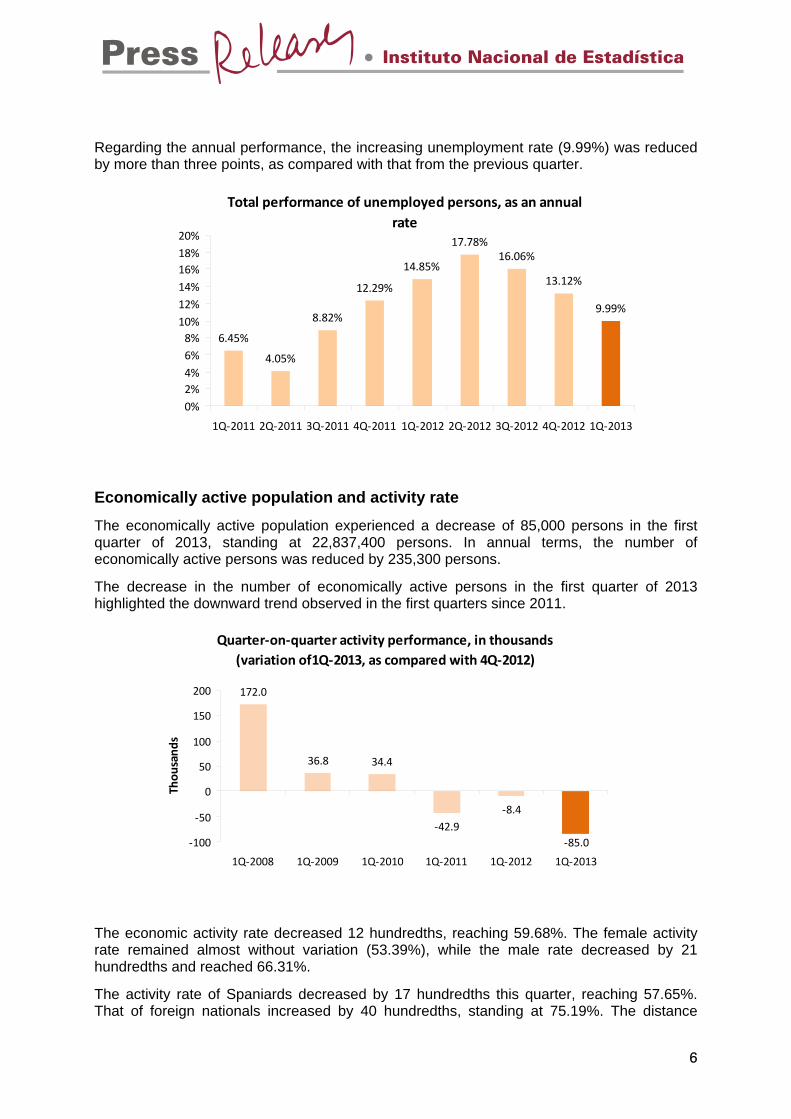
Regarding the annual performance, the increasing unemployment rate (9.99%) was reduced by more than three points, as compared with that from the previous quarter.
Total performance of unemployed persons, as an annual
rate
6.45%
4.05%
8.82%
12.29%
14.85%
17.78%16.06%
13.12%
9.99%
0%2%4%6%8%10%12%14%16%18%20%
1Q‐2011 2Q‐2011 3Q‐2011 4Q‐2011 1Q‐2012 2Q‐2012 3Q‐2012 4Q‐2012 1Q‐2013
Economically active population and activity rate
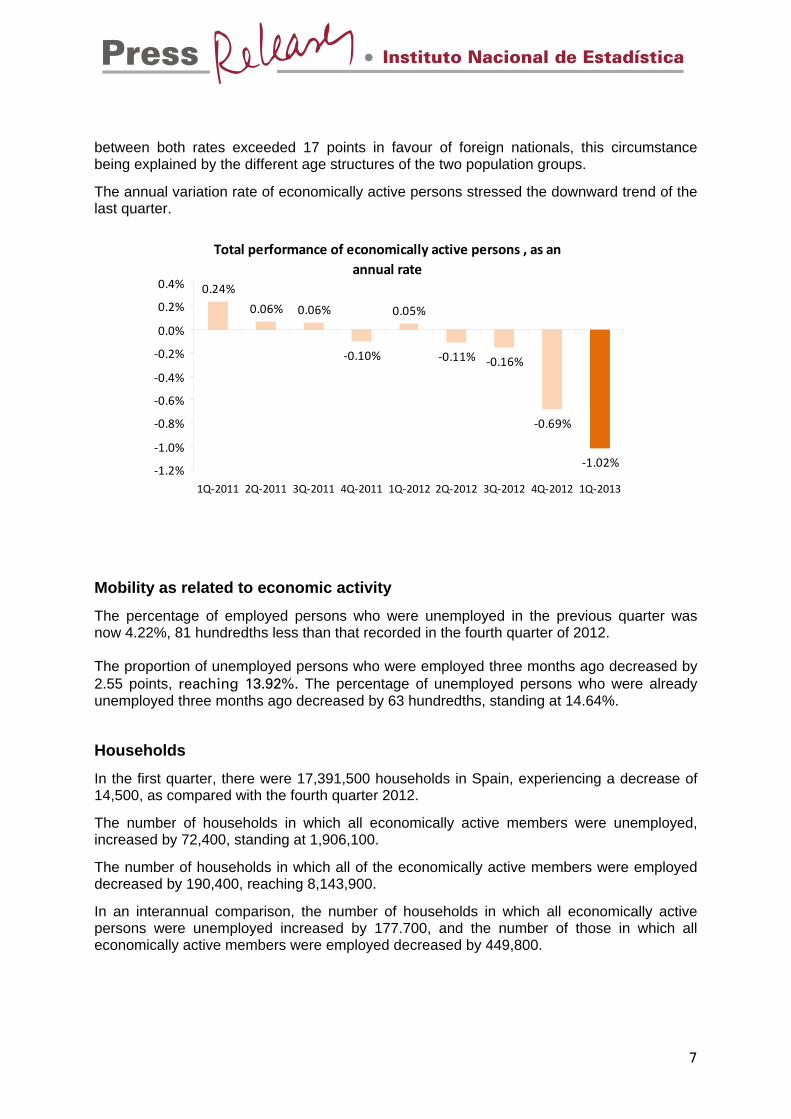
The economically active population experienced a decrease of 85,000 persons in the first quarter of 2013, standing at 22,837,400 persons. In annual terms, the number of economically active persons was reduced by 235,300 persons.
The decrease in the number of economically active persons in the first quarter of 2013 highlighted the downward trend observed in the first quarters since 2011.
Quarter‐on‐quarter activity performance, in thousands
(variation of1Q‐2013, as compared with 4Q‐2012)
172.0
36.8 34.4
‐42.9‐8.4
‐85.0‐100
‐50
0
50
100
150
200
1Q‐2008 1Q‐2009 1Q‐2010 1Q‐2011 1Q‐2012 1Q‐2013
Thou
sand
s
The economic activity rate decreased 12 hundredths, reaching 59.68%. The female activity rate remained almost without variation (53.39%), while the male rate decreased by 21 hundredths and reached 66.31%.
The activity rate of Spaniards decreased by 17 hundredths this quarter, reaching 57.65%. That of foreign nationals increased by 40 hundredths, standing at 75.19%. The distance
7
between both rates exceeded 17 points in favour of foreign nationals, this circumstance being explained by the different age structures of the two population groups.
The annual variation rate of economically active persons stressed the downward trend of the last quarter.
Total performance of economically active persons , as an
annual rate0.24%
0.06% 0.06%
‐0.10%
0.05%
‐0.11% ‐0.16%
‐0.69%
‐1.02%‐1.2%
‐1.0%
‐0.8%
‐0.6%
‐0.4%
‐0.2%
0.0%
0.2%
0.4%
1Q‐2011 2Q‐2011 3Q‐2011 4Q‐2011 1Q‐2012 2Q‐2012 3Q‐2012 4Q‐2012 1Q‐2013
Mobility as related to economic activity
The percentage of employed persons who were unemployed in the previous quarter was now 4.22%, 81 hundredths less than that recorded in the fourth quarter of 2012. The proportion of unemployed persons who were employed three months ago decreased by 2.55 points, reaching 13.92%. The percentage of unemployed persons who were already unemployed three months ago decreased by 63 hundredths, standing at 14.64%.
Households
In the first quarter, there were 17,391,500 households in Spain, experiencing a decrease of 14,500, as compared with the fourth quarter 2012.
The number of households in which all economically active members were unemployed, increased by 72,400, standing at 1,906,100.
The number of households in which all of the economically active members were employed decreased by 190,400, reaching 8,143,900.
In an interannual comparison, the number of households in which all economically active persons were unemployed increased by 177.700, and the number of those in which all economically active members were employed decreased by 449,800.
8
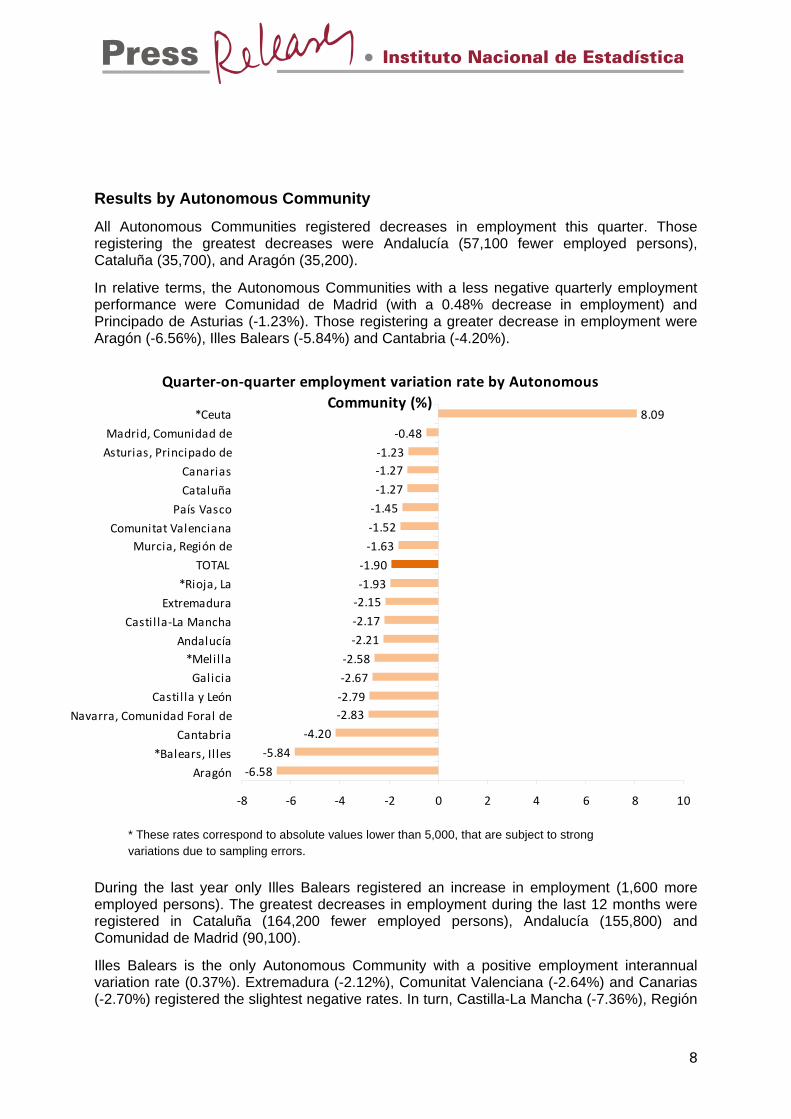
Results by Autonomous Community
All Autonomous Communities registered decreases in employment this quarter. Those registering the greatest decreases were Andalucía (57,100 fewer employed persons), Cataluña (35,700), and Aragón (35,200).
In relative terms, the Autonomous Communities with a less negative quarterly employment performance were Comunidad de Madrid (with a 0.48% decrease in employment) and Principado de Asturias (-1.23%). Those registering a greater decrease in employment were Aragón (-6.56%), Illes Balears (-5.84%) and Cantabria (-4.20%).
Quarter‐on‐quarter employment variation rate by Autonomous Community (%)
8.09
‐0.48
‐1.23‐1.27
‐1.27
‐1.45
‐1.52
‐1.63
‐1.90
‐1.93‐2.15
‐2.17
‐2.21
‐2.58
‐2.67
‐2.79‐2.83
‐4.20
‐5.84
‐6.58
‐8 ‐6 ‐4 ‐2 0 2 4 6 8 10
*Ceuta
Madrid, Comunidad de
Asturias, Principado de
Canarias
Cataluña
País Vasco
Comunitat ValencianaMurcia, Región de
TOTAL
*Rioja, La
Extremadura
Castil la‐La Mancha
Andalucía*Melil la
Galicia
Castil la y León
Nav
ar ra, Comunidad Foral de
Cantabria
*Balears, Il les
Aragón
* These rates correspond to absolute values lower than 5,000, that are subject to strong variations due to sampling errors.
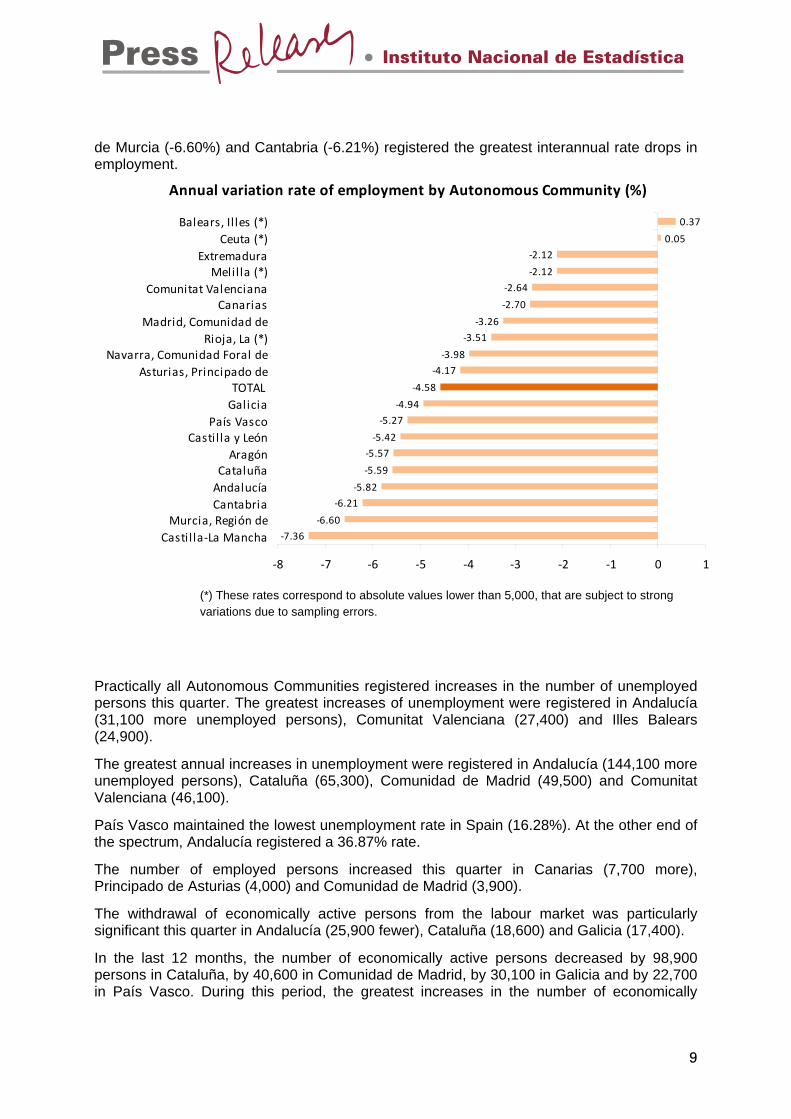
During the last year only Illes Balears registered an increase in employment (1,600 more employed persons). The greatest decreases in employment during the last 12 months were registered in Cataluña (164,200 fewer employed persons), Andalucía (155,800) and Comunidad de Madrid (90,100).
Illes Balears is the only Autonomous Community with a positive employment interannual variation rate (0.37%). Extremadura (-2.12%), Comunitat Valenciana (-2.64%) and Canarias (-2.70%) registered the slightest negative rates. In turn, Castilla-La Mancha (-7.36%), Región
9
de Murcia (-6.60%) and Cantabria (-6.21%) registered the greatest interannual rate drops in employment.
Annual variation rate of employment by Autonomous Community (%)
0.37
0.05
‐2.12
‐2.12
‐2.64
‐2.70
‐3.26
‐3.51
‐3.98
‐4.17
‐4.58
‐4.94
‐5.27
‐5.42
‐5.57
‐5.59
‐5.82
‐6.21
‐6.60
‐7.36
‐8 ‐7 ‐6 ‐5 ‐4 ‐3 ‐2 ‐1 0 1
Balears, Il les (*)Ceuta (*)
ExtremaduraMelil la (*)
Comunitat ValencianaCanarias
Madrid, Comunidad deRioja, La (*)
Navarra, Comunidad Foral deAsturias, Principado de
TOTAL Galicia
País VascoCastil la y León
AragónCataluñaAndalucíaCantabria
Murcia, Región deCastil la‐La Mancha
(*) These rates correspond to absolute values lower than 5,000, that are subject to strong variations due to sampling errors.
Practically all Autonomous Communities registered increases in the number of unemployed persons this quarter. The greatest increases of unemployment were registered in Andalucía (31,100 more unemployed persons), Comunitat Valenciana (27,400) and Illes Balears (24,900).
The greatest annual increases in unemployment were registered in Andalucía (144,100 more unemployed persons), Cataluña (65,300), Comunidad de Madrid (49,500) and Comunitat Valenciana (46,100).
País Vasco maintained the lowest unemployment rate in Spain (16.28%). At the other end of the spectrum, Andalucía registered a 36.87% rate.
The number of employed persons increased this quarter in Canarias (7,700 more), Principado de Asturias (4,000) and Comunidad de Madrid (3,900).
The withdrawal of economically active persons from the labour market was particularly significant this quarter in Andalucía (25,900 fewer), Cataluña (18,600) and Galicia (17,400).
In the last 12 months, the number of economically active persons decreased by 98,900 persons in Cataluña, by 40,600 in Comunidad de Madrid, by 30,100 in Galicia and by 22,700 in País Vasco. During this period, the greatest increases in the number of economically
active persons were registered in Extremadura (15,900 more) and in Principado de Asturias (10,300).
The economic activity rates this quarter ranged between the 64,84% recorded in Illes Balears, and the 52,94% registered in Principado de Asturias.
Results by province
The provincial results summary of the EAPS may be accessed via the following link:
http://www.ine.es/en/daco/daco42/daco4211/epapro0113_en.pdf
All of the provincial information from this survey may be accessed via the following links:
• In the INEbase database
http://www.ine.es/jaxiBD/menu.do?L=1&divi=EPA&his=0&type=db
• In the TEMPUS database
http://www.ine.es/GSTConsul/loginAction.do?U=S0&language=1&divi=EPA
Seasonally adjusted series
In order to contribute to a better interpretation of the EAPS results from a short-term point of view, in line with the rest of short-term statistics, it is available for the labour market analysts the quarterly performance of the main seasonally adjusted variables.
http://www.ine.es/en/daco/daco42/daco4211/epadesestacional0113_en.pdf
For further information see INEbase-www.ine.es/en/ All press releases at: www.ine.es/en/prensa/prensa_en.htm Press Office: Telephone numbers: 91 583 93 63 / 94 08 – Fax: 91 583 90 87 - [email protected] Information Area: Telephone number: 91 583 91 00 – Fax: 91 583 91 58 – www.ine.es/infoine/?L=1
10
Methodological note
General features
The Economically Active Population Survey (EAPS) is a continuous sample-based study aimed at family dwellings, and which has been conducted since 1964.
The additional sample collected by the Galician Statistics Institute (IGE) has been incorporated as of the third quarter of 2009, using the same fieldwork system and identical methodology to that of the INE. Therefore, apart from the 3,588 census sections that have made up the sample for the whole of Spain since 2005, we must take into account the 234 additional sections in the Autonomous Community of Galicia. Since the third quarter of 2009, the EAPS sample is made up of 3,822 census sections from the more than 30,000 census sections into which Spain is divided. An average of 18 households are surveyed in each one, except in the provinces of Barcelona, Madrid, Sevilla, Valencia and Zaragoza, where the number of households surveyed is 22. Thus, the sample size is approximately 65,000 dwellings, providing information on some 180,000 persons. The data is collected via personal and telephone interviews. The information is carefully filtered and computer-processed. Results are obtained within the month following the end of the reference quarter for the data.
Main definitions (Economically) Active persons: persons aged 16 years old and over who, during the reference week (the week prior to that when the interview is held), supplied labour for the production of goods and services, or were available to do so and in conditions to incorporate themselves into said production. They are divided into employed and unemployed persons.
Employed persons: persons aged 16 years old and over who, during the reference week, worked for at least one hour in exchange for payment (salary, wage, business benefit, etc.) in cash or in kind. Persons who, being employed, had been temporarily absent from their job due to illness, holidays, etc., are also considered employed persons.
Employed persons are classified, considering their professional status, as non-wage earners (employers, businesspersons without wage earners and independent workers, cooperative members, family assistance) and wage earners (public or private).
Considering the length of the working day, employed persons are classified as full-time and part-time employed persons. The usual working week may not be shorter than 30 hours in the first case, nor exceed 35 hours in the second.
Wage earners are classified as permanent and temporary. For the latter, the end of their contract or work relationship is set by means of objective conditions, such as the expiry of a certain period of time, the completion of a specific task, etc.
A significant category within employment is that of time-related underemployment, defined in the 16th International Labour Statisticians Conference (Geneva, 1998). The EAPS considers persons suffering time-related underemployment as employed persons who would like to work more hours, who are available to work more hours and whose effective working hours in the reference week are less than the number of hours usually worked by employed persons working full-time in the same branch of activity as that in which the underemployed person develops his/her main job.
11

Unemployed persons: persons aged 16 years old and over who, during the reference week, were jobless, available for work, and actively looking for a job. Persons who might have already found a job and are waiting to start are also considered to be unemployed, provided that they meet the first two conditions.
According to European Commission Regulation 1897/2000, the following are considered to be active search methods, in the four weeks prior to the interview:
−Being in contact with a public employment office for the purpose of finding work, whatever part they play in the initiative (the renewal of registration due to purely administrative reasons does not constitute active planning).
−Being in contact with a private office (temporary employment agency, specialised hiring agency, etc.) with the objective of finding work.
−Having sent an application directly to employers.
−Having searched via personal relations and trade unions, etc.
−Having advertised oneself or responded to newspaper advertisements.
−Having studied job vacancies.
−Having taken part in a test, public exam or interview in the framework of a contracting procedure.
−Having looked for land, premises or material.
−Having taken steps to obtain permits, licences or financial resources.
(Economically) Inactive persons: persons aged 16 years old and over not included in any of the above categories.
12
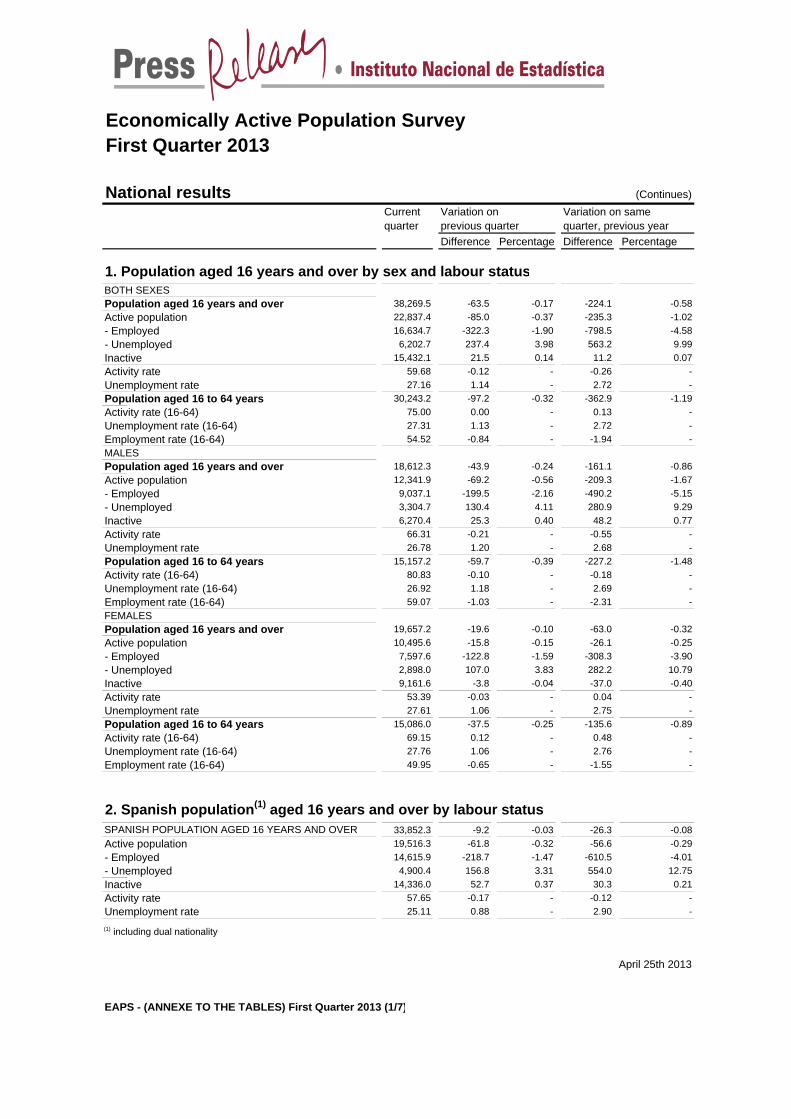
Economically Active Population SurveyFirst Quarter 2013
National results (Continues)Current Variation on Variation on samequarter previous quarter quarter, previous year
Difference Percentage Difference Percentage
1. Population aged 16 years and over by sex and labour statusBOTH SEXESPopulation aged 16 years and over 38,269.5 -63.5 -0.17 -224.1 -0.58Active population 22,837.4 -85.0 -0.37 -235.3 -1.02- Employed 16,634.7 -322.3 -1.90 -798.5 -4.58- Unemployed 6,202.7 237.4 3.98 563.2 9.99Inactive 15,432.1 21.5 0.14 11.2 0.07Activity rate 59.68 -0.12 - -0.26 -Unemployment rate 27.16 1.14 - 2.72 -Population aged 16 to 64 years 30,243.2 -97.2 -0.32 -362.9 -1.19Activity rate (16-64) 75.00 0.00 - 0.13 -Unemployment rate (16-64) 27.31 1.13 - 2.72 -Employment rate (16-64) 54.52 -0.84 - -1.94 -MALESPopulation aged 16 years and over 18,612.3 -43.9 -0.24 -161.1 -0.86Active population 12,341.9 -69.2 -0.56 -209.3 -1.67- Employed 9,037.1 -199.5 -2.16 -490.2 -5.15- Unemployed 3,304.7 130.4 4.11 280.9 9.29Inactive 6,270.4 25.3 0.40 48.2 0.77Activity rate 66.31 -0.21 - -0.55 -Unemployment rate 26.78 1.20 - 2.68 -Population aged 16 to 64 years 15,157.2 -59.7 -0.39 -227.2 -1.48Activity rate (16-64) 80.83 -0.10 - -0.18 -Unemployment rate (16-64) 26.92 1.18 - 2.69 -Employment rate (16-64) 59.07 -1.03 - -2.31 -FEMALESPopulation aged 16 years and over 19,657.2 -19.6 -0.10 -63.0 -0.32Active population 10,495.6 -15.8 -0.15 -26.1 -0.25- Employed 7,597.6 -122.8 -1.59 -308.3 -3.90- Unemployed 2,898.0 107.0 3.83 282.2 10.79Inactive 9,161.6 -3.8 -0.04 -37.0 -0.40Activity rate 53.39 -0.03 - 0.04 -Unemployment rate 27.61 1.06 - 2.75 -Population aged 16 to 64 years 15,086.0 -37.5 -0.25 -135.6 -0.89Activity rate (16-64) 69.15 0.12 - 0.48 -Unemployment rate (16-64) 27.76 1.06 - 2.76 -Employment rate (16-64) 49.95 -0.65 - -1.55 -
2. Spanish population(1) aged 16 years and over by labour statusSPANISH POPULATION AGED 16 YEARS AND OVER 33,852.3 -9.2 -0.03 -26.3 -0.08Active population 19,516.3 -61.8 -0.32 -56.6 -0.29- Employed 14,615.9 -218.7 -1.47 -610.5 -4.01- Unemployed 4,900.4 156.8 3.31 554.0 12.75Inactive 14,336.0 52.7 0.37 30.3 0.21Activity rate 57.65 -0.17 - -0.12 -Unemployment rate 25.11 0.88 - 2.90 -
(1) including dual nationality
April 25th 2013
EAPS - (ANNEXE TO THE TABLES) First Quarter 2013 (1/7)
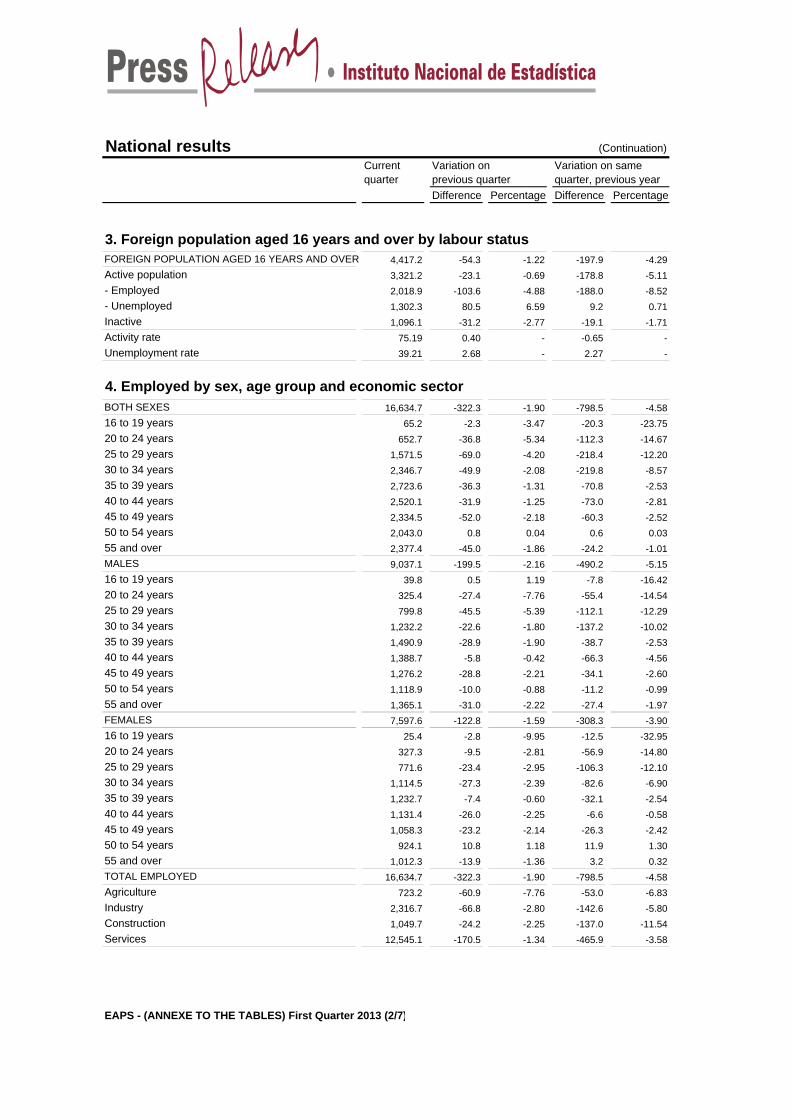
National results (Continuation)Current Variation on Variation on samequarter previous quarter quarter, previous year
Difference Percentage Difference Percentage
3. Foreign population aged 16 years and over by labour statusFOREIGN POPULATION AGED 16 YEARS AND OVER 4,417.2 -54.3 -1.22 -197.9 -4.29Active population 3,321.2 -23.1 -0.69 -178.8 -5.11- Employed 2,018.9 -103.6 -4.88 -188.0 -8.52- Unemployed 1,302.3 80.5 6.59 9.2 0.71Inactive 1,096.1 -31.2 -2.77 -19.1 -1.71Activity rate 75.19 0.40 - -0.65 -Unemployment rate 39.21 2.68 - 2.27 -
4. Employed by sex, age group and economic sectorBOTH SEXES 16,634.7 -322.3 -1.90 -798.5 -4.5816 to 19 years 65.2 -2.3 -3.47 -20.3 -23.7520 to 24 years 652.7 -36.8 -5.34 -112.3 -14.6725 to 29 years 1,571.5 -69.0 -4.20 -218.4 -12.2030 to 34 years 2,346.7 -49.9 -2.08 -219.8 -8.5735 to 39 years 2,723.6 -36.3 -1.31 -70.8 -2.5340 to 44 years 2,520.1 -31.9 -1.25 -73.0 -2.8145 to 49 years 2,334.5 -52.0 -2.18 -60.3 -2.5250 to 54 years 2,043.0 0.8 0.04 0.6 0.0355 and over 2,377.4 -45.0 -1.86 -24.2 -1.01MALES 9,037.1 -199.5 -2.16 -490.2 -5.1516 to 19 years 39.8 0.5 1.19 -7.8 -16.4220 to 24 years 325.4 -27.4 -7.76 -55.4 -14.5425 to 29 years 799.8 -45.5 -5.39 -112.1 -12.2930 to 34 years 1,232.2 -22.6 -1.80 -137.2 -10.0235 to 39 years 1,490.9 -28.9 -1.90 -38.7 -2.5340 to 44 years 1,388.7 -5.8 -0.42 -66.3 -4.5645 to 49 years 1,276.2 -28.8 -2.21 -34.1 -2.6050 to 54 years 1,118.9 -10.0 -0.88 -11.2 -0.9955 and over 1,365.1 -31.0 -2.22 -27.4 -1.97FEMALES 7,597.6 -122.8 -1.59 -308.3 -3.9016 to 19 years 25.4 -2.8 -9.95 -12.5 -32.9520 to 24 years 327.3 -9.5 -2.81 -56.9 -14.8025 to 29 years 771.6 -23.4 -2.95 -106.3 -12.1030 to 34 years 1,114.5 -27.3 -2.39 -82.6 -6.9035 to 39 years 1,232.7 -7.4 -0.60 -32.1 -2.5440 to 44 years 1,131.4 -26.0 -2.25 -6.6 -0.5845 to 49 years 1,058.3 -23.2 -2.14 -26.3 -2.4250 to 54 years 924.1 10.8 1.18 11.9 1.3055 and over 1,012.3 -13.9 -1.36 3.2 0.32TOTAL EMPLOYED 16,634.7 -322.3 -1.90 -798.5 -4.58Agriculture 723.2 -60.9 -7.76 -53.0 -6.83Industry 2,316.7 -66.8 -2.80 -142.6 -5.80Construction 1,049.7 -24.2 -2.25 -137.0 -11.54Services 12,545.1 -170.5 -1.34 -465.9 -3.58
EAPS - (ANNEXE TO THE TABLES) First Quarter 2013 (2/7)
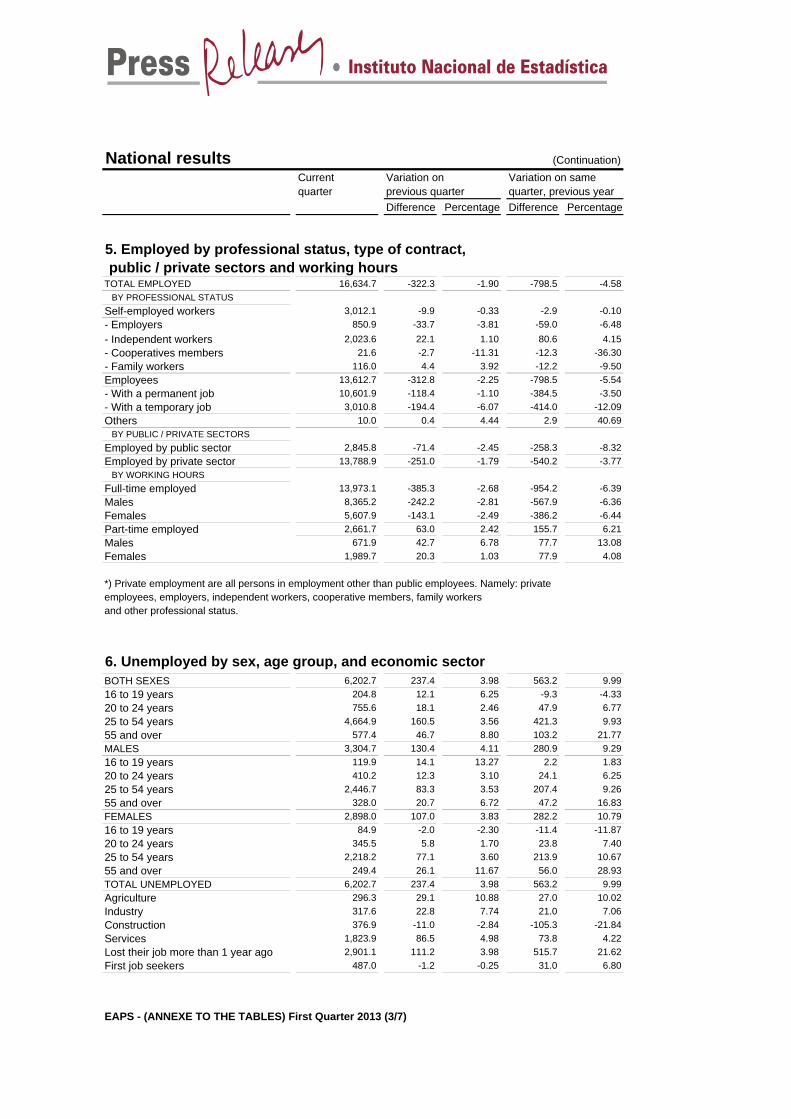
National results (Continuation)Current Variation on Variation on samequarter previous quarter quarter, previous year
Difference Percentage Difference Percentage
5. Employed by professional status, type of contract, public / private sectors and working hoursTOTAL EMPLOYED 16,634.7 -322.3 -1.90 -798.5 -4.58 BY PROFESSIONAL STATUS Self-employed workers 3,012.1 -9.9 -0.33 -2.9 -0.10- Employers 850.9 -33.7 -3.81 -59.0 -6.48- Independent workers 2,023.6 22.1 1.10 80.6 4.15- Cooperatives members 21.6 -2.7 -11.31 -12.3 -36.30- Family workers 116.0 4.4 3.92 -12.2 -9.50Employees 13,612.7 -312.8 -2.25 -798.5 -5.54- With a permanent job 10,601.9 -118.4 -1.10 -384.5 -3.50- With a temporary job 3,010.8 -194.4 -6.07 -414.0 -12.09Others 10.0 0.4 4.44 2.9 40.69 BY PUBLIC / PRIVATE SECTORSEmployed by public sector 2,845.8 -71.4 -2.45 -258.3 -8.32Employed by private sector 13,788.9 -251.0 -1.79 -540.2 -3.77 BY WORKING HOURSFull-time employed 13,973.1 -385.3 -2.68 -954.2 -6.39Males 8,365.2 -242.2 -2.81 -567.9 -6.36Females 5,607.9 -143.1 -2.49 -386.2 -6.44Part-time employed 2,661.7 63.0 2.42 155.7 6.21Males 671.9 42.7 6.78 77.7 13.08Females 1,989.7 20.3 1.03 77.9 4.08
*) Private employment are all persons in employment other than public employees. Namely: private employees, employers, independent workers, cooperative members, family workers and other professional status.
6. Unemployed by sex, age group, and economic sectorBOTH SEXES 6,202.7 237.4 3.98 563.2 9.9916 to 19 years 204.8 12.1 6.25 -9.3 -4.3320 to 24 years 755.6 18.1 2.46 47.9 6.7725 to 54 years 4,664.9 160.5 3.56 421.3 9.9355 and over 577.4 46.7 8.80 103.2 21.77MALES 3,304.7 130.4 4.11 280.9 9.2916 to 19 years 119.9 14.1 13.27 2.2 1.8320 to 24 years 410.2 12.3 3.10 24.1 6.2525 to 54 years 2,446.7 83.3 3.53 207.4 9.2655 and over 328.0 20.7 6.72 47.2 16.83FEMALES 2,898.0 107.0 3.83 282.2 10.7916 to 19 years 84.9 -2.0 -2.30 -11.4 -11.8720 to 24 years 345.5 5.8 1.70 23.8 7.4025 to 54 years 2,218.2 77.1 3.60 213.9 10.6755 and over 249.4 26.1 11.67 56.0 28.93TOTAL UNEMPLOYED 6,202.7 237.4 3.98 563.2 9.99Agriculture 296.3 29.1 10.88 27.0 10.02Industry 317.6 22.8 7.74 21.0 7.06Construction 376.9 -11.0 -2.84 -105.3 -21.84Services 1,823.9 86.5 4.98 73.8 4.22Lost their job more than 1 year ago 2,901.1 111.2 3.98 515.7 21.62First job seekers 487.0 -1.2 -0.25 31.0 6.80
EAPS - (ANNEXE TO THE TABLES) First Quarter 2013 (3/7)
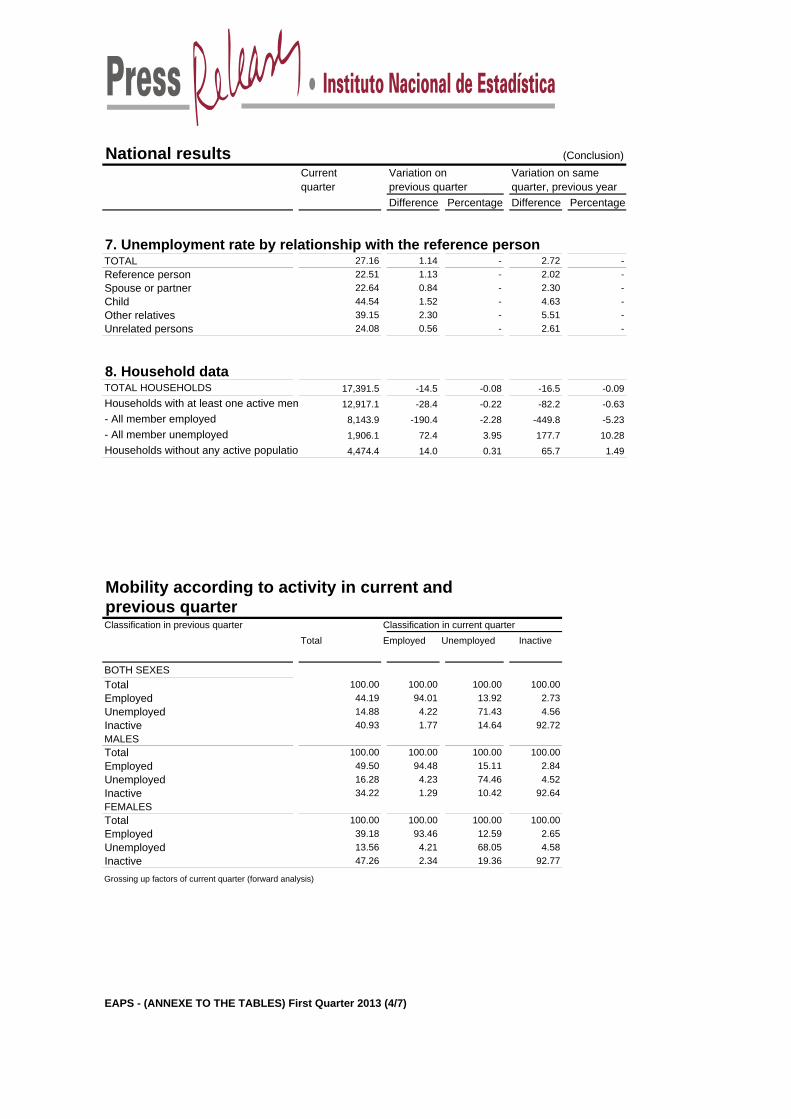
National results (Conclusion)Current Variation on Variation on samequarter previous quarter quarter, previous year
Difference Percentage Difference Percentage
7. Unemployment rate by relationship with the reference personTOTAL 27.16 1.14 - 2.72 -Reference person 22.51 1.13 - 2.02 -Spouse or partner 22.64 0.84 - 2.30 -Child 44.54 1.52 - 4.63 -Other relatives 39.15 2.30 - 5.51 -Unrelated persons 24.08 0.56 - 2.61 -
8. Household dataTOTAL HOUSEHOLDS 17,391.5 -14.5 -0.08 -16.5 -0.09Households with at least one active mem 12,917.1 -28.4 -0.22 -82.2 -0.63- All member employed 8,143.9 -190.4 -2.28 -449.8 -5.23- All member unemployed 1,906.1 72.4 3.95 177.7 10.28Households without any active populatio 4,474.4 14.0 0.31 65.7 1.49
Mobility according to activity in current and previous quarterClassification in previous quarter Classification in current quarter
Total Employed Unemployed Inactive
BOTH SEXESTotal 100.00 100.00 100.00 100.00Employed 44.19 94.01 13.92 2.73Unemployed 14.88 4.22 71.43 4.56Inactive 40.93 1.77 14.64 92.72MALESTotal 100.00 100.00 100.00 100.00Employed 49.50 94.48 15.11 2.84Unemployed 16.28 4.23 74.46 4.52Inactive 34.22 1.29 10.42 92.64FEMALESTotal 100.00 100.00 100.00 100.00Employed 39.18 93.46 12.59 2.65Unemployed 13.56 4.21 68.05 4.58Inactive 47.26 2.34 19.36 92.77
Grossing up factors of current quarter (forward analysis)
EAPS - (ANNEXE TO THE TABLES) First Quarter 2013 (4/7)
Results by Autonomous Communities and Cities (Continues)Current Variation on Variation on samequarter previous quarter quarter, previous year
Difference Percentage Difference Percentage
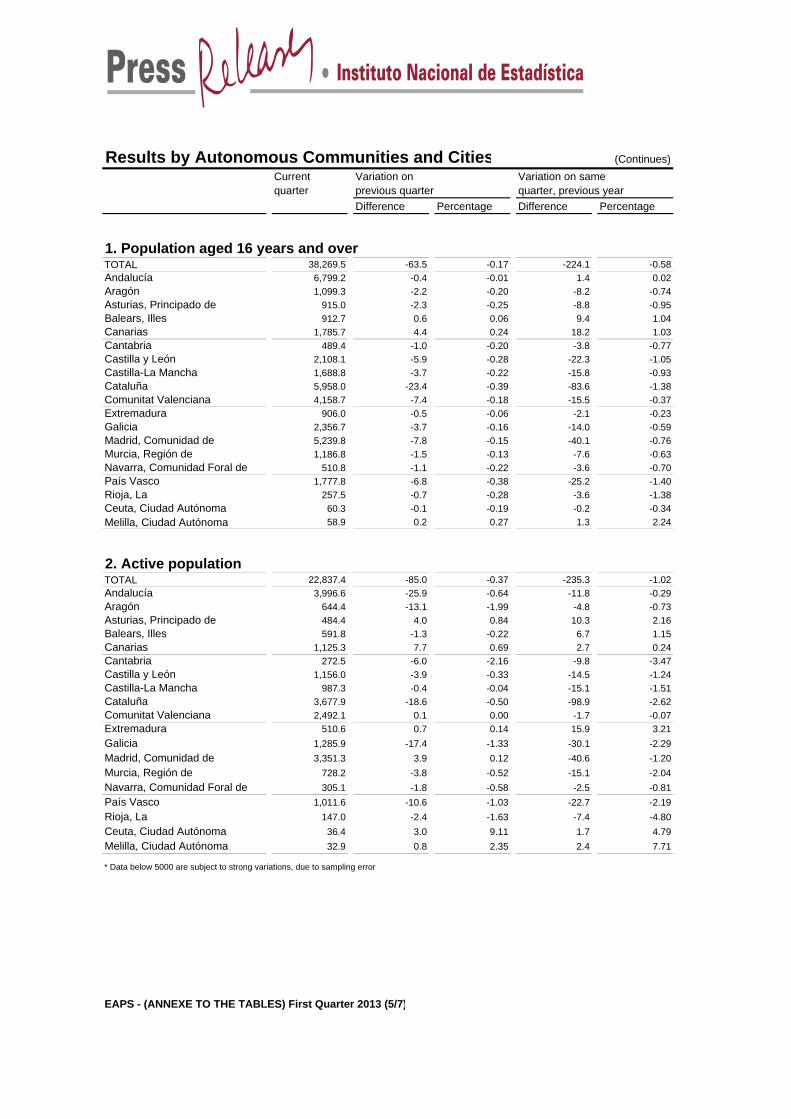
1. Population aged 16 years and over TOTAL 38,269.5 -63.5 -0.17 -224.1 -0.58Andalucía 6,799.2 -0.4 -0.01 1.4 0.02Aragón 1,099.3 -2.2 -0.20 -8.2 -0.74Asturias, Principado de 915.0 -2.3 -0.25 -8.8 -0.95Balears, Illes 912.7 0.6 0.06 9.4 1.04Canarias 1,785.7 4.4 0.24 18.2 1.03Cantabria 489.4 -1.0 -0.20 -3.8 -0.77Castilla y León 2,108.1 -5.9 -0.28 -22.3 -1.05Castilla-La Mancha 1,688.8 -3.7 -0.22 -15.8 -0.93Cataluña 5,958.0 -23.4 -0.39 -83.6 -1.38Comunitat Valenciana 4,158.7 -7.4 -0.18 -15.5 -0.37Extremadura 906.0 -0.5 -0.06 -2.1 -0.23Galicia 2,356.7 -3.7 -0.16 -14.0 -0.59Madrid, Comunidad de 5,239.8 -7.8 -0.15 -40.1 -0.76Murcia, Región de 1,186.8 -1.5 -0.13 -7.6 -0.63Navarra, Comunidad Foral de 510.8 -1.1 -0.22 -3.6 -0.70País Vasco 1,777.8 -6.8 -0.38 -25.2 -1.40Rioja, La 257.5 -0.7 -0.28 -3.6 -1.38Ceuta, Ciudad Autónoma 60.3 -0.1 -0.19 -0.2 -0.34Melilla, Ciudad Autónoma 58.9 0.2 0.27 1.3 2.24
2. Active populationTOTAL 22,837.4 -85.0 -0.37 -235.3 -1.02Andalucía 3,996.6 -25.9 -0.64 -11.8 -0.29Aragón 644.4 -13.1 -1.99 -4.8 -0.73Asturias, Principado de 484.4 4.0 0.84 10.3 2.16Balears, Illes 591.8 -1.3 -0.22 6.7 1.15Canarias 1,125.3 7.7 0.69 2.7 0.24Cantabria 272.5 -6.0 -2.16 -9.8 -3.47Castilla y León 1,156.0 -3.9 -0.33 -14.5 -1.24Castilla-La Mancha 987.3 -0.4 -0.04 -15.1 -1.51Cataluña 3,677.9 -18.6 -0.50 -98.9 -2.62Comunitat Valenciana 2,492.1 0.1 0.00 -1.7 -0.07Extremadura 510.6 0.7 0.14 15.9 3.21Galicia 1,285.9 -17.4 -1.33 -30.1 -2.29Madrid, Comunidad de 3,351.3 3.9 0.12 -40.6 -1.20Murcia, Región de 728.2 -3.8 -0.52 -15.1 -2.04Navarra, Comunidad Foral de 305.1 -1.8 -0.58 -2.5 -0.81País Vasco 1,011.6 -10.6 -1.03 -22.7 -2.19Rioja, La 147.0 -2.4 -1.63 -7.4 -4.80Ceuta, Ciudad Autónoma 36.4 3.0 9.11 1.7 4.79Melilla, Ciudad Autónoma 32.9 0.8 2.35 2.4 7.71
* Data below 5000 are subject to strong variations, due to sampling error
EAPS - (ANNEXE TO THE TABLES) First Quarter 2013 (5/7)
Results by Autonomous Communities and Cities (Conclusion)Current Variation on Variation on samequarter previous quarter quarter, previous year
Difference Percentage Difference Percentage
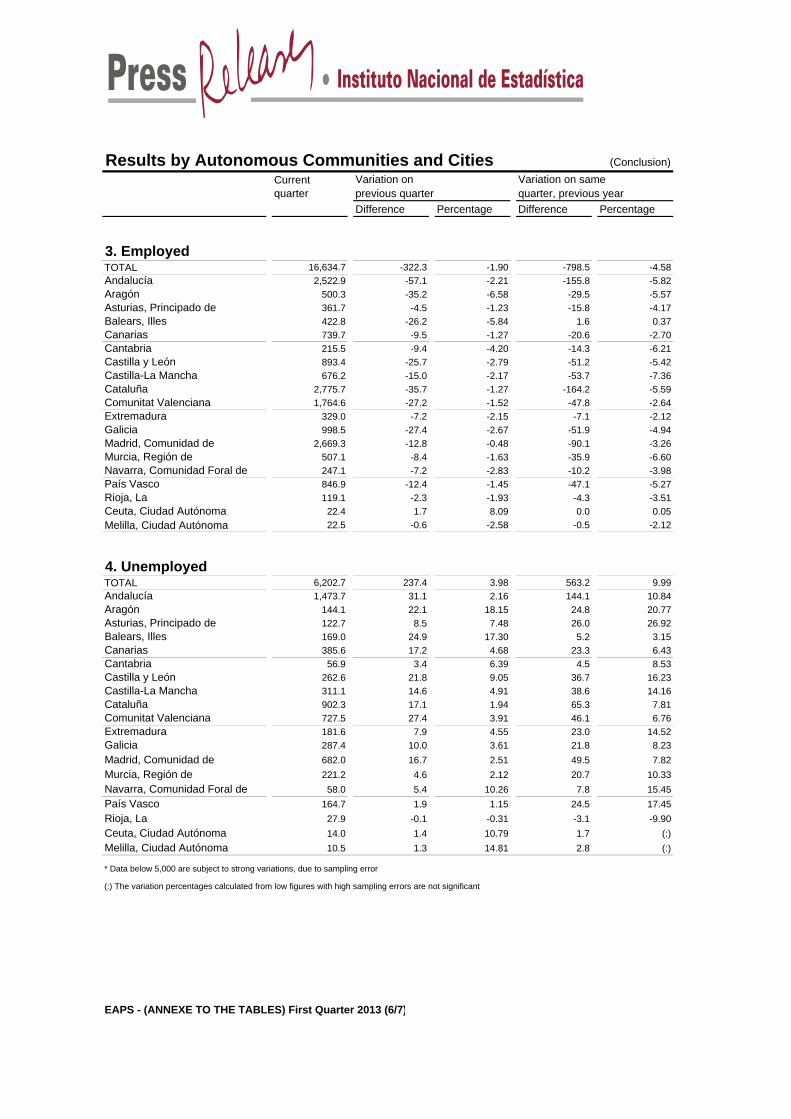
3. EmployedTOTAL 16,634.7 -322.3 -1.90 -798.5 -4.58Andalucía 2,522.9 -57.1 -2.21 -155.8 -5.82Aragón 500.3 -35.2 -6.58 -29.5 -5.57Asturias, Principado de 361.7 -4.5 -1.23 -15.8 -4.17Balears, Illes 422.8 -26.2 -5.84 1.6 0.37Canarias 739.7 -9.5 -1.27 -20.6 -2.70Cantabria 215.5 -9.4 -4.20 -14.3 -6.21Castilla y León 893.4 -25.7 -2.79 -51.2 -5.42Castilla-La Mancha 676.2 -15.0 -2.17 -53.7 -7.36Cataluña 2,775.7 -35.7 -1.27 -164.2 -5.59Comunitat Valenciana 1,764.6 -27.2 -1.52 -47.8 -2.64Extremadura 329.0 -7.2 -2.15 -7.1 -2.12Galicia 998.5 -27.4 -2.67 -51.9 -4.94Madrid, Comunidad de 2,669.3 -12.8 -0.48 -90.1 -3.26Murcia, Región de 507.1 -8.4 -1.63 -35.9 -6.60Navarra, Comunidad Foral de 247.1 -7.2 -2.83 -10.2 -3.98País Vasco 846.9 -12.4 -1.45 -47.1 -5.27Rioja, La 119.1 -2.3 -1.93 -4.3 -3.51Ceuta, Ciudad Autónoma 22.4 1.7 8.09 0.0 0.05Melilla, Ciudad Autónoma 22.5 -0.6 -2.58 -0.5 -2.12
4. UnemployedTOTAL 6,202.7 237.4 3.98 563.2 9.99Andalucía 1,473.7 31.1 2.16 144.1 10.84Aragón 144.1 22.1 18.15 24.8 20.77Asturias, Principado de 122.7 8.5 7.48 26.0 26.92Balears, Illes 169.0 24.9 17.30 5.2 3.15Canarias 385.6 17.2 4.68 23.3 6.43Cantabria 56.9 3.4 6.39 4.5 8.53Castilla y León 262.6 21.8 9.05 36.7 16.23Castilla-La Mancha 311.1 14.6 4.91 38.6 14.16Cataluña 902.3 17.1 1.94 65.3 7.81Comunitat Valenciana 727.5 27.4 3.91 46.1 6.76Extremadura 181.6 7.9 4.55 23.0 14.52Galicia 287.4 10.0 3.61 21.8 8.23Madrid, Comunidad de 682.0 16.7 2.51 49.5 7.82Murcia, Región de 221.2 4.6 2.12 20.7 10.33Navarra, Comunidad Foral de 58.0 5.4 10.26 7.8 15.45País Vasco 164.7 1.9 1.15 24.5 17.45Rioja, La 27.9 -0.1 -0.31 -3.1 -9.90Ceuta, Ciudad Autónoma 14.0 1.4 10.79 1.7 (:)Melilla, Ciudad Autónoma 10.5 1.3 14.81 2.8 (:)
* Data below 5,000 are subject to strong variations, due to sampling error
(:) The variation percentages calculated from low figures with high sampling errors are not significant
EAPS - (ANNEXE TO THE TABLES) First Quarter 2013 (6/7)
Results by Autonomous Communities and Cities(Absolute figures in thousands and rates in percentage)
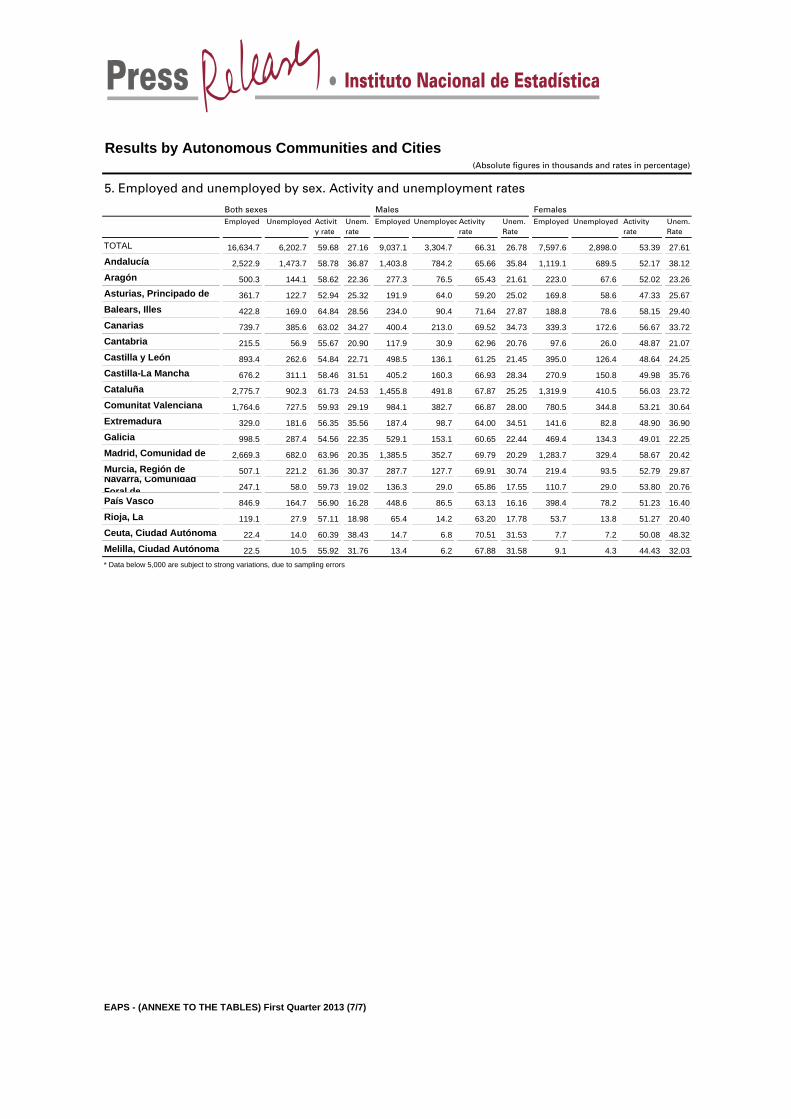
5. Employed and unemployed by sex. Activity and unemployment rates
Both sexes Males FemalesEmployed Unemployed Activit
y rateUnem. rate
Employed UnemployedActivity rate
Unem. Rate
Employed Unemployed Activity rate
Unem. Rate
TOTAL 16,634.7 6,202.7 59.68 27.16 9,037.1 3,304.7 66.31 26.78 7,597.6 2,898.0 53.39 27.61
Andalucía 2,522.9 1,473.7 58.78 36.87 1,403.8 784.2 65.66 35.84 1,119.1 689.5 52.17 38.12
Aragón 500.3 144.1 58.62 22.36 277.3 76.5 65.43 21.61 223.0 67.6 52.02 23.26
Asturias, Principado de 361.7 122.7 52.94 25.32 191.9 64.0 59.20 25.02 169.8 58.6 47.33 25.67
Balears, Illes 422.8 169.0 64.84 28.56 234.0 90.4 71.64 27.87 188.8 78.6 58.15 29.40
Canarias 739.7 385.6 63.02 34.27 400.4 213.0 69.52 34.73 339.3 172.6 56.67 33.72
Cantabria 215.5 56.9 55.67 20.90 117.9 30.9 62.96 20.76 97.6 26.0 48.87 21.07
Castilla y León 893.4 262.6 54.84 22.71 498.5 136.1 61.25 21.45 395.0 126.4 48.64 24.25
Castilla-La Mancha 676.2 311.1 58.46 31.51 405.2 160.3 66.93 28.34 270.9 150.8 49.98 35.76
Cataluña 2,775.7 902.3 61.73 24.53 1,455.8 491.8 67.87 25.25 1,319.9 410.5 56.03 23.72
Comunitat Valenciana 1,764.6 727.5 59.93 29.19 984.1 382.7 66.87 28.00 780.5 344.8 53.21 30.64
Extremadura 329.0 181.6 56.35 35.56 187.4 98.7 64.00 34.51 141.6 82.8 48.90 36.90
Galicia 998.5 287.4 54.56 22.35 529.1 153.1 60.65 22.44 469.4 134.3 49.01 22.25
Madrid, Comunidad de 2,669.3 682.0 63.96 20.35 1,385.5 352.7 69.79 20.29 1,283.7 329.4 58.67 20.42
Murcia, Región de 507.1 221.2 61.36 30.37 287.7 127.7 69.91 30.74 219.4 93.5 52.79 29.87Navarra, Comunidad Foral de 247.1 58.0 59.73 19.02 136.3 29.0 65.86 17.55 110.7 29.0 53.80 20.76
País Vasco 846.9 164.7 56.90 16.28 448.6 86.5 63.13 16.16 398.4 78.2 51.23 16.40
Rioja, La 119.1 27.9 57.11 18.98 65.4 14.2 63.20 17.78 53.7 13.8 51.27 20.40
Ceuta, Ciudad Autónoma 22.4 14.0 60.39 38.43 14.7 6.8 70.51 31.53 7.7 7.2 50.08 48.32
Melilla, Ciudad Autónoma 22.5 10.5 55.92 31.76 13.4 6.2 67.88 31.58 9.1 4.3 44.43 32.03* Data below 5,000 are subject to strong variations, due to sampling errors
EAPS - (ANNEXE TO THE TABLES) First Quarter 2013 (7/7)
Employed and unemployed by sex APS First Quarter 2013
0Employment
5,000
7,000
9,000
11,000
13,000
15,000
17,000
19,000
21,000
I 20
05 II III IVI
2006 II III IV
I 20
07 II III IVI
2008 II III IV
I 20
09 II III IVI
2010 II III IV
I 20
11 II III IVI
2012 II III IV
I 20
13
thousands
Both
Female
Males
Unemployment
500
1,500
2,500
3,500
4,500
5,500
6,500
I 20
05 II III IVI
2006 II III IV
I 20
07 II III IVI
2008 II III IV
I 20
09 II III IVI
2010 II III IV
I 20
11 II III IVI
2012 II III IV
I 20
13
thousands
Both
Males
Female
Activity rate
45
50
55
60
65
70
I 20
05 II III IVI
2006 II III IV
I 20
07 II III IVI
2008 II III IV
I 20
09 II III IVI
2010 II III IV
I 20
11 II III IVI
2012 II III IV
I 20
13
Both
Males
Female
Unemployment rate
5
10
15
20
25
30
I 20
05 II III IVI
2006 II III IV
I 20
07 II III IVI
2008 II III IV
I 20
09 II III IVI
2010 II III IV
I 20
11 II III IVI
2012 II III IV
I 20
13
Both
Males
Female
Employed and Unemployed by age APS First Quarter 2013
Variation percentages over the previous quarter and over the same quarter of the previous year
-20 -10 0 10 20
16 to 19 years
20 to 24 years
25 to 54 years
55 and over
Employed
Previous quarter Previous year
-4 -2 0 2 4 6 8 10 12
16 to 19 years
20 to 24 years
25 to 54 years
55 and over
Unemployed
Previous quarter Previous year
Employment (thousands)
13,200
13,300
13,400
13,500
13,600
13,700
13,800
13,900
14,000
14,100
14,200
II III IV I 2013
gro
up
25-5
4
0
500
1,000
1,500
2,000
2,500
oth
er
gro
up
s
25 to 54 years
55 and over
20 to 24 years
16 to 19 years
Unemployment (thousands)
3,400
3,600
3,800
4,000
4,200
4,400
4,600
4,800
II III IV I 2013
gro
up
25-5
4
150
250
350
450
550
650
750
850
oth
er
gro
up
s
55 and over
16 to 19 years
25 to 54 years
20 to 24 years
-25 -20 -15 -10 -5 0
16 to 19 years
20 to 24 years
25 to 54 years
55 and over
Employment
previous quarter same quarter, previous year
-5 0 5 10 15 20 25
16 to 19 years
20 to 24 years
25 to 54 years
55 and over
Unemployment
previous quarter same quarter, previous year
Employment variation percentages over the previous quarterand over the same quarter of the previous yearFirst Quarter 2013
Unemployment rate(Spain = 27.16 )
-8 -6 -4 -2 0 2 4 6 8 10
Andalucía
Aragón
Asturias, Principado de
Balears, Illes
Canarias
Cantabria
Castilla y León
Castilla-La Mancha
Cataluña
Comunitat Valenciana
Extremadura
Galicia
Madrid, Comunidad de
Murcia, Región de
Navarra, Comunidad Foral de
Pais Vasco
Rioja, La
Ceuta, Ciudad Autónoma
Melilla, Ciudad Autónoma
Previous quarter Previous year
Less than 20
20 < 24
24 < 30
More than 30