Embed Size (px)
Citation preview
Economics and Engineering in a New Partnership: Cost of Service
Larry VogtDirector, Rates
Mississippi Power
Wisconsin Public Utility Institute
June 28, 2017
1
The Cost-of-Service Study
A cost-of-service study is a model of utility accounting and financial data which relies on various engineering and economics inputs and concepts to appropriately assign detailed cost elements to the customer groups using the principle of cost causation.
2

Power System Functional Levels
GENERATION ANDSTEP-UP SUBSTATION
TRANSMISSION SUBTRANSMISSION
PRIMARY DISTRIBUTION
DISTRIBUTIONSUBSTATION
TRANSMISSIONSUBSTATION
LINE TRANSFORMERSECONDARY DISTRIBUTIONSERVICE LINE
3
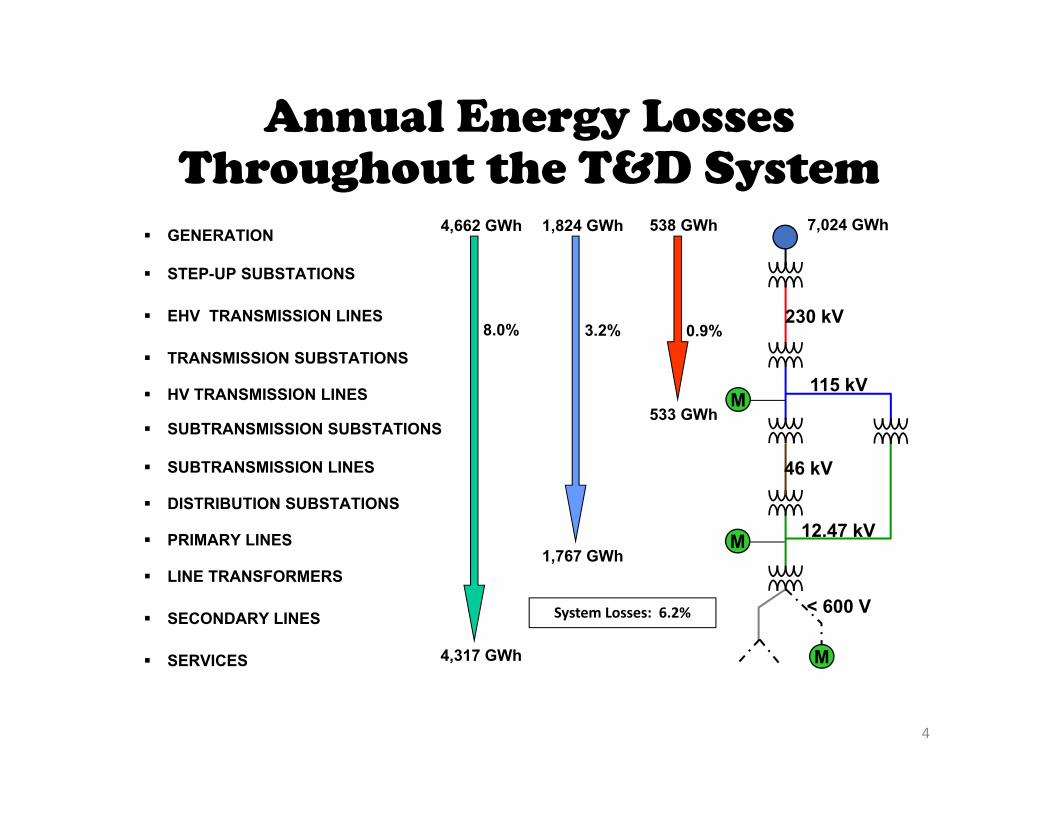
Annual Energy Losses Throughout the T&D System
System Losses: 6.2% < 600 V
12.47 kV
46 kV
115 kV
230 kV
4,662 GWh
1,767 GWh
4,317 GWh
1,824 GWh
533 GWh
538 GWh
0.9%3.2%8.0%
M
M
M
7,024 GWh GENERATION
STEP-UP SUBSTATIONS
EHV TRANSMISSION LINES
TRANSMISSION SUBSTATIONS
HV TRANSMISSION LINES
SUBTRANSMISSION SUBSTATIONS
SUBTRANSMISSION LINES
DISTRIBUTION SUBSTATIONS
PRIMARY LINES
LINE TRANSFORMERS
SECONDARY LINES
SERVICES
4
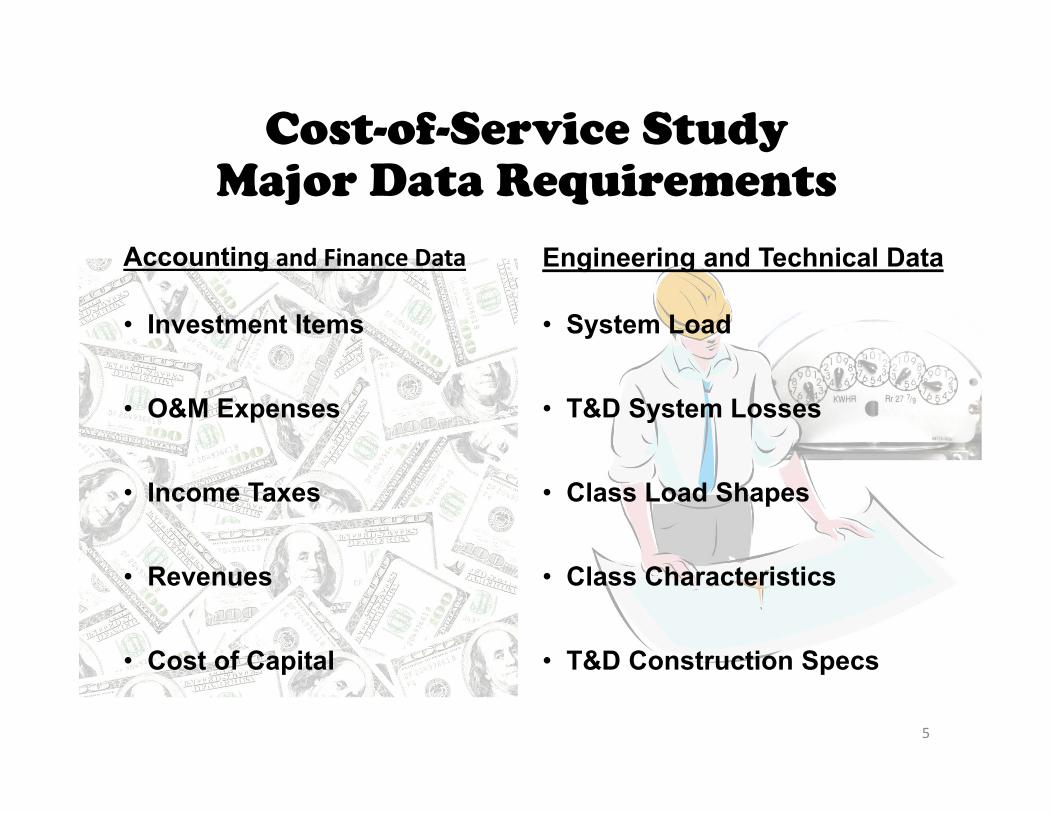
Cost-of-Service StudyMajor Data Requirements
Accounting and Finance Data
• Investment Items
• O&M Expenses
• Income Taxes
• Revenues
• Cost of Capital
Engineering and Technical Data
• System Load
• T&D System Losses
• Class Load Shapes
• Class Characteristics
• T&D Construction Specs
5
SPECIFICASSIGNMENT
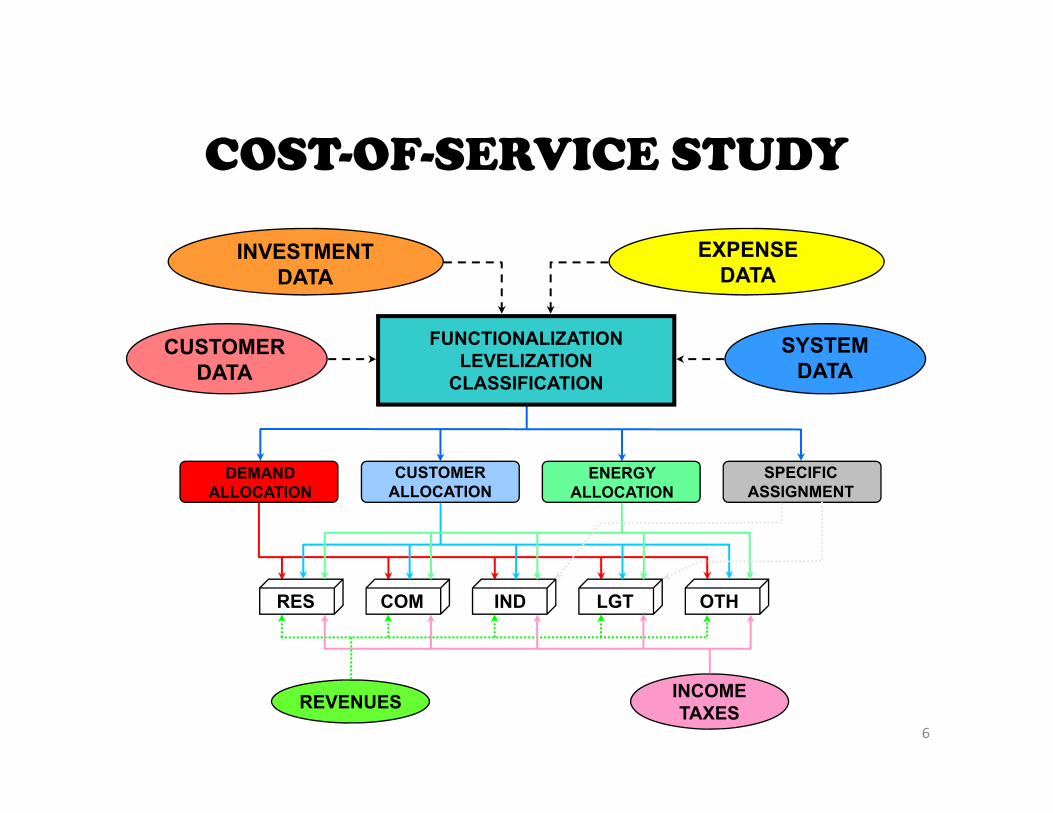
COST-OF-SERVICE STUDY
INVESTMENTDATA
FUNCTIONALIZATIONLEVELIZATION
CLASSIFICATION
CUSTOMERDATA
SYSTEMDATA
DEMANDALLOCATION
CUSTOMERALLOCATION
ENERGYALLOCATION
RES COM IND LGT OTH
EXPENSEDATA
REVENUES INCOMETAXES
6
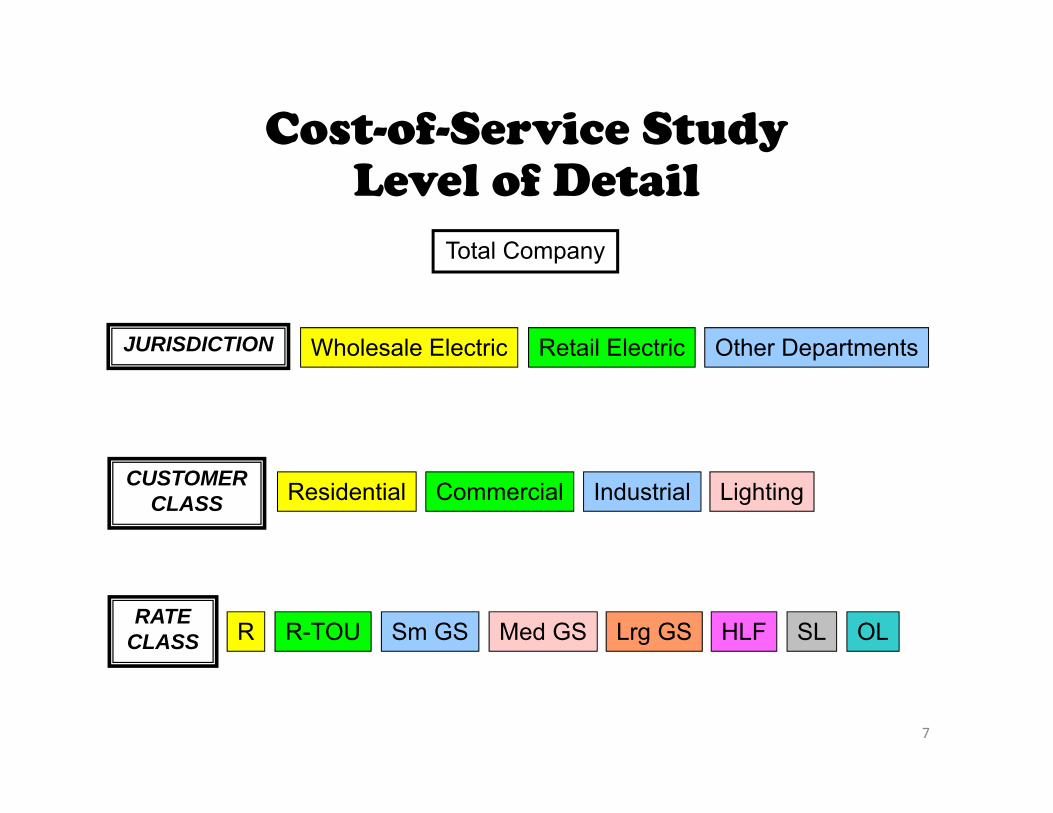
Cost-of-Service StudyLevel of Detail
Total Company
Wholesale Electric Retail Electric Other Departments
Residential Commercial Industrial Lighting
R R-TOU Sm GS Med GS Lrg GS HLF SL OL
JURISDICTION
CUSTOMER CLASS
RATE CLASS
7

Much about cost of service has changed over the last 40 years!• Computation Capability
Tools Data
• Information Technologies Metering T&D System Mapping
• Legislation and Regulations Filing Requirements Reporting
• Classification and Allocation Methodologies Embedded Cost Approach Marginal Cost Approach
8

Cost-of-Service Study Tools
1971 Cost-of-Service Study
9
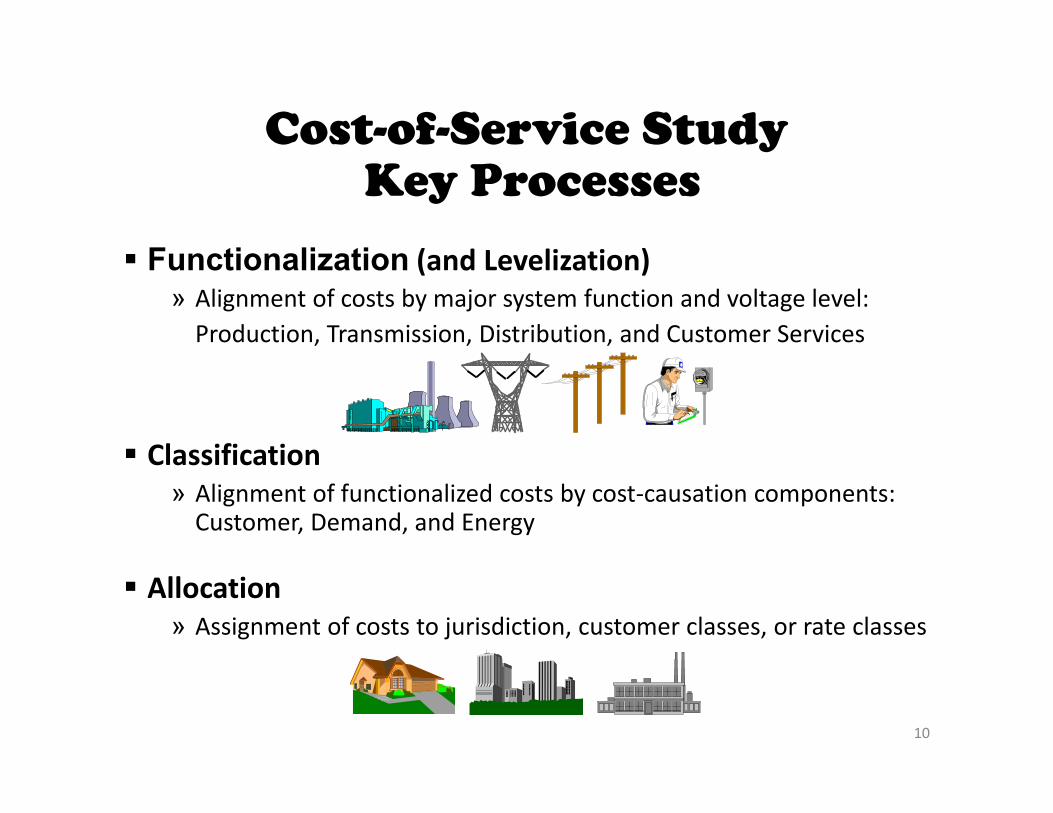
Cost-of-Service StudyKey Processes
Functionalization (and Levelization)» Alignment of costs by major system function and voltage level: Production, Transmission, Distribution, and Customer Services
Classification» Alignment of functionalized costs by cost‐causation components: Customer, Demand, and Energy
Allocation» Assignment of costs to jurisdiction, customer classes, or rate classes
10
COST OF SERVICE:FUNCTIONALIZATION
11
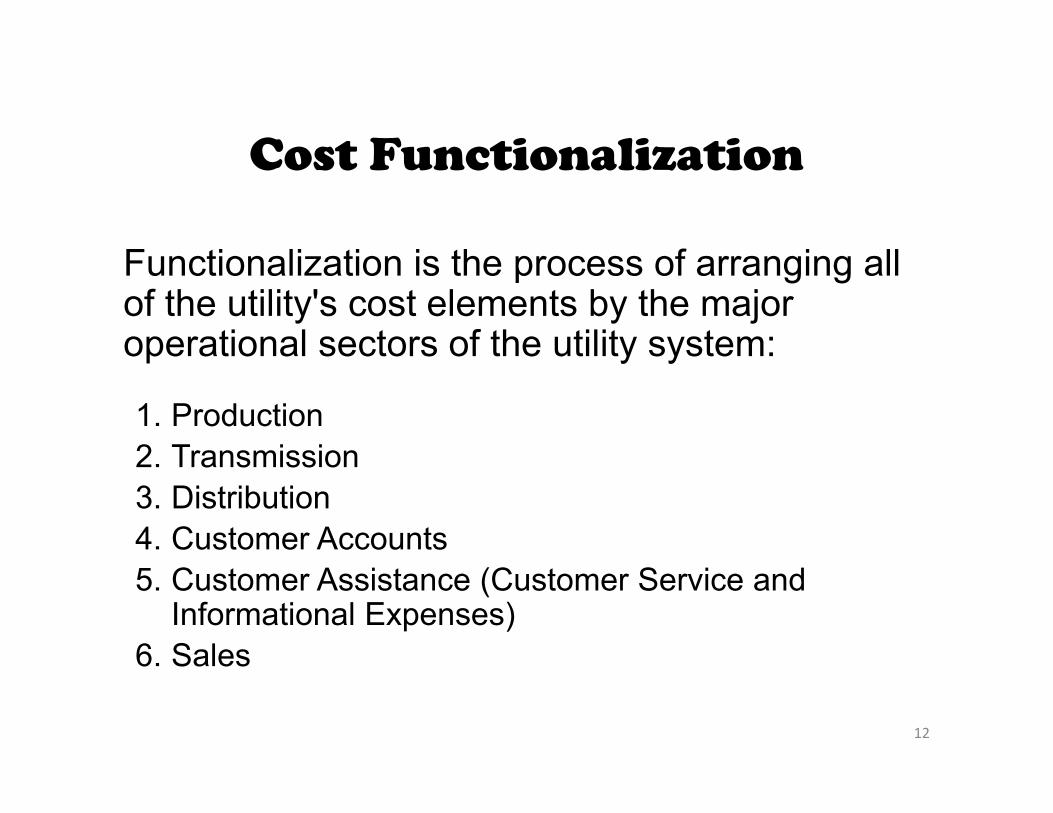
Cost Functionalization
Functionalization is the process of arranging all of the utility's cost elements by the major operational sectors of the utility system:
1. Production2. Transmission3. Distribution4. Customer Accounts5. Customer Assistance (Customer Service and
Informational Expenses)6. Sales
12

FERC Uniform System of AccountsRate Base and Expense Items
100 – 199 Assets and Other Debits – Plant Held for Future Use, CWIP, Accumulated Depreciation, Fuel Stocks, Plant Materials and Supplies, Prepayments, 190 -Accumulated Deferred Income Taxes (ADIT)
200 – 299 Liabilities and Other Credits – Operating Reserves, Customer Deposits and Advances for Construction, Investment Tax Credits (ITC), 281, 282 & 283 -ADIT
300 – 399 Intangible, Production, Transmission, Distribution, and General Plant
400 – 459 Income, Retained Earnings, and Operating Revenues – Depreciation Expense, Taxes Other Than Income Taxes, Sales for Resale
500 – 599 Power Production, Transmission, and Distribution O&M Expenses
900 – 949 Customer Accounts, Customer Service and Informational, and Sales O&M, and A&G Expenses
13
New FERC Accounts
In the 2003 to 2005 timeframe, the FERC Uniform System of Accounts was modified by the addition of 56 accounts mostly associated with:
• Asset Retirement Obligations [FASB statement SFAS 143; FERC Order No. 631 - 2003] and
• Regional Transmission and Market Operations [FERC Order No. 668 - 2005]
14
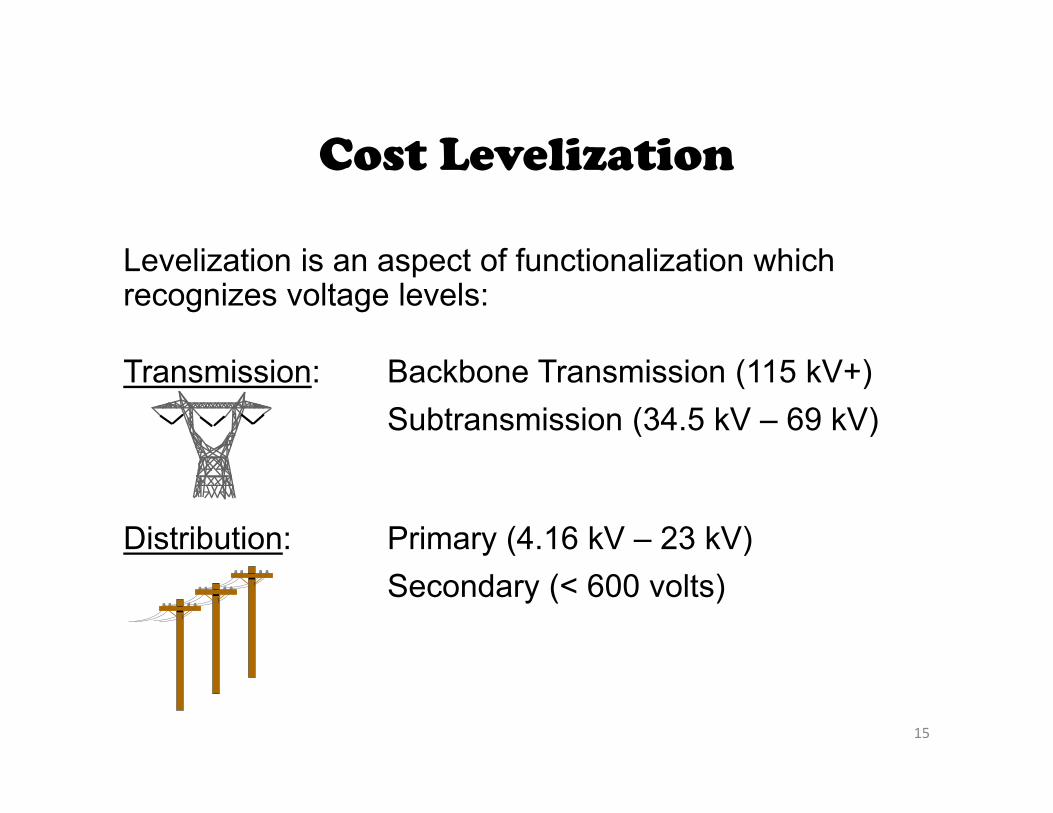
Cost Levelization
Levelization is an aspect of functionalization which recognizes voltage levels:
Transmission: Backbone Transmission (115 kV+)Subtransmission (34.5 kV – 69 kV)
Distribution: Primary (4.16 kV – 23 kV)Secondary (< 600 volts)
15

5
4
3
2
1
Cost-of-Service Levelsof The Power System
5A
5B
< 600 V
12.47 kV
46 kV
115 kV
230 kV
16

Functionalization ofMajor Gross Plant
Production Transmission Distribution
System Level: 1 2 3 4 5FERC Accts (Sub) (Pri) (Sec)310 – 316 Steam Production X320 – 325 Nuclear Production X330 – 336 Hydraulic Production X340 – 346 Other Production X350 – 353 Transmission Subs X X X354 – 359 Transmission Lines X360 – 363 Distribution Subs (Inc. Land) X X364 Poles, Towers & Fixtures X X365 OH Conductors/Devices X X366 UG Conduit X X367 UG Conductors/Devices X X368 Line Transformers X X369 – 370 Services and Meters X371 – 373 Cust. Inst. and St. Lgt. X
GSUs -“Splits”-
17
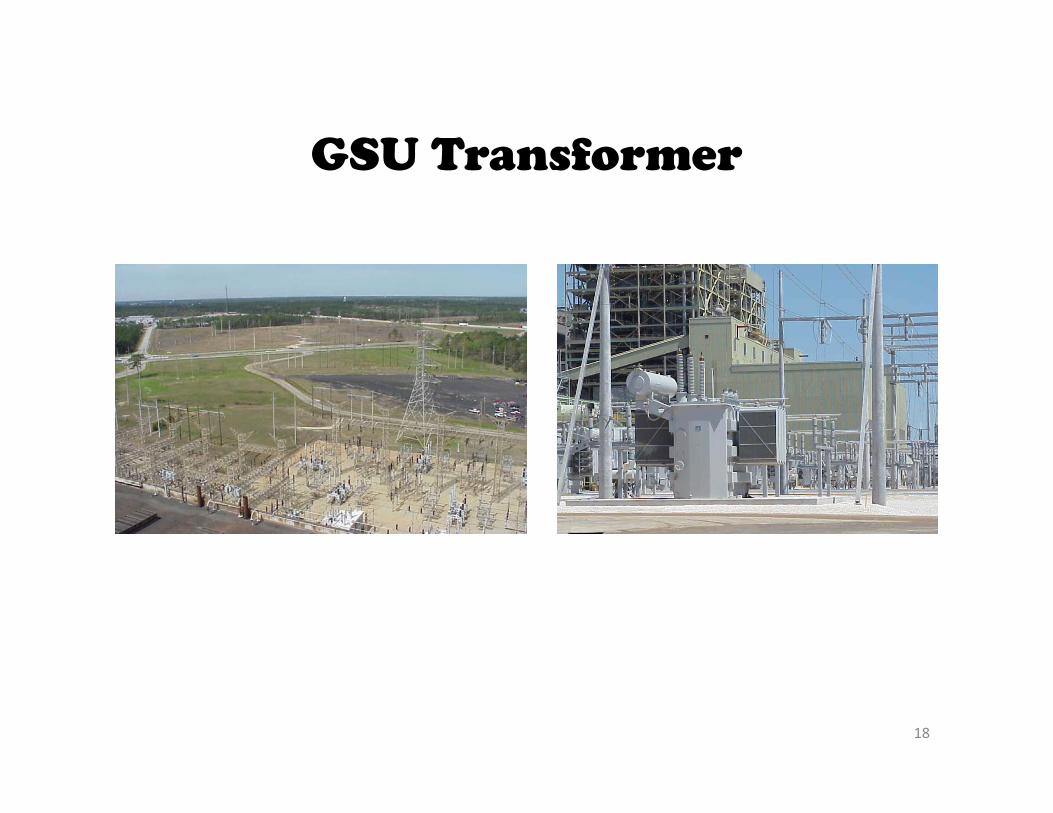
GSU Transformer
18
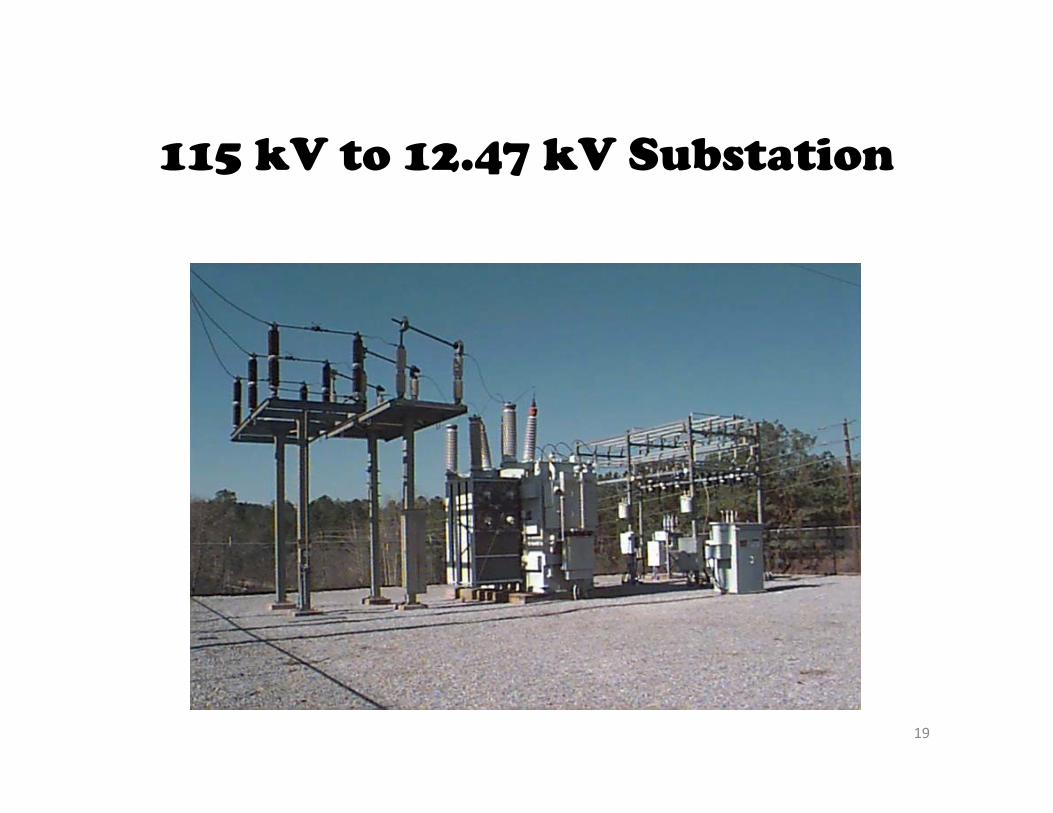
115 kV to 12.47 kV Substation
19
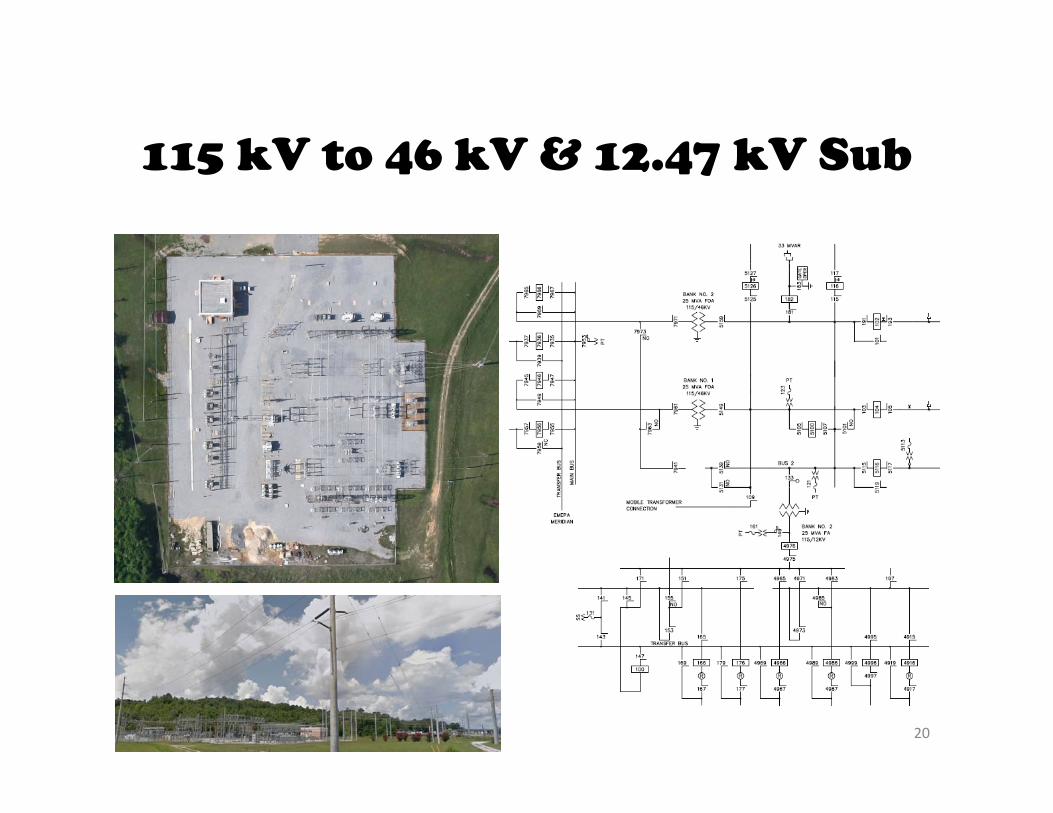
115 kV to 46 kV & 12.47 kV Sub
20

Distribution Substation Capacitor Array
21
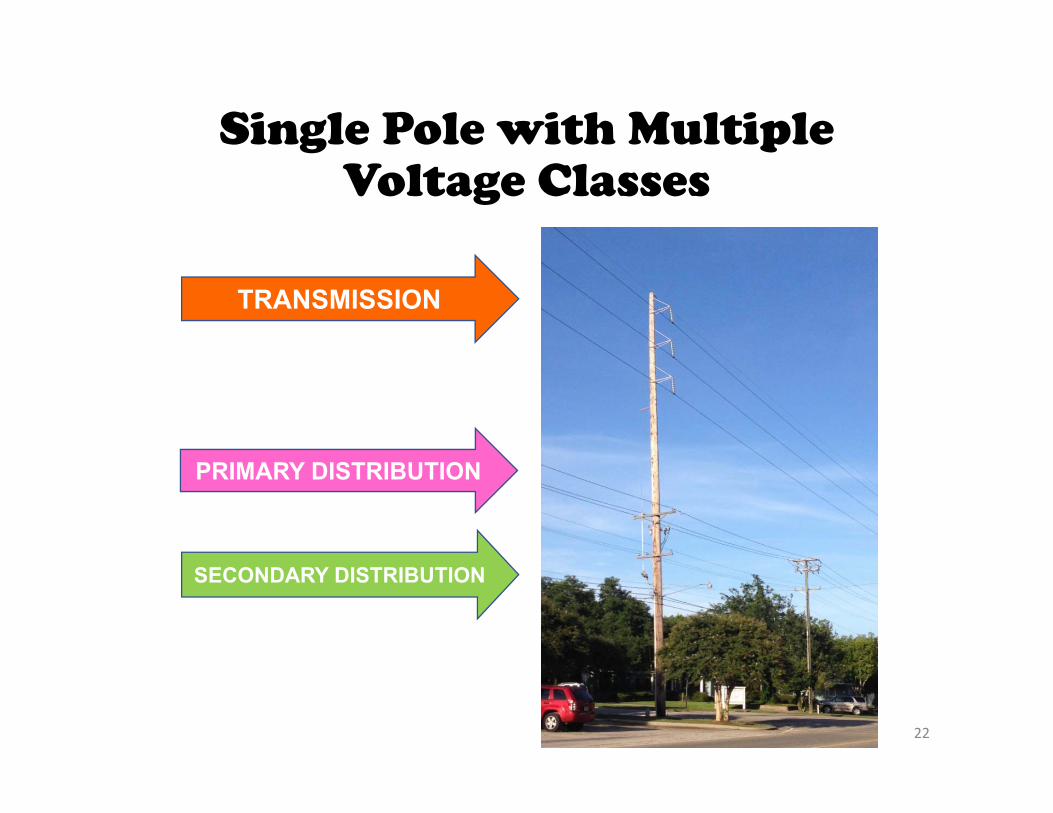
Single Pole with Multiple Voltage Classes
TRANSMISSION
PRIMARY DISTRIBUTION
SECONDARY DISTRIBUTION
22
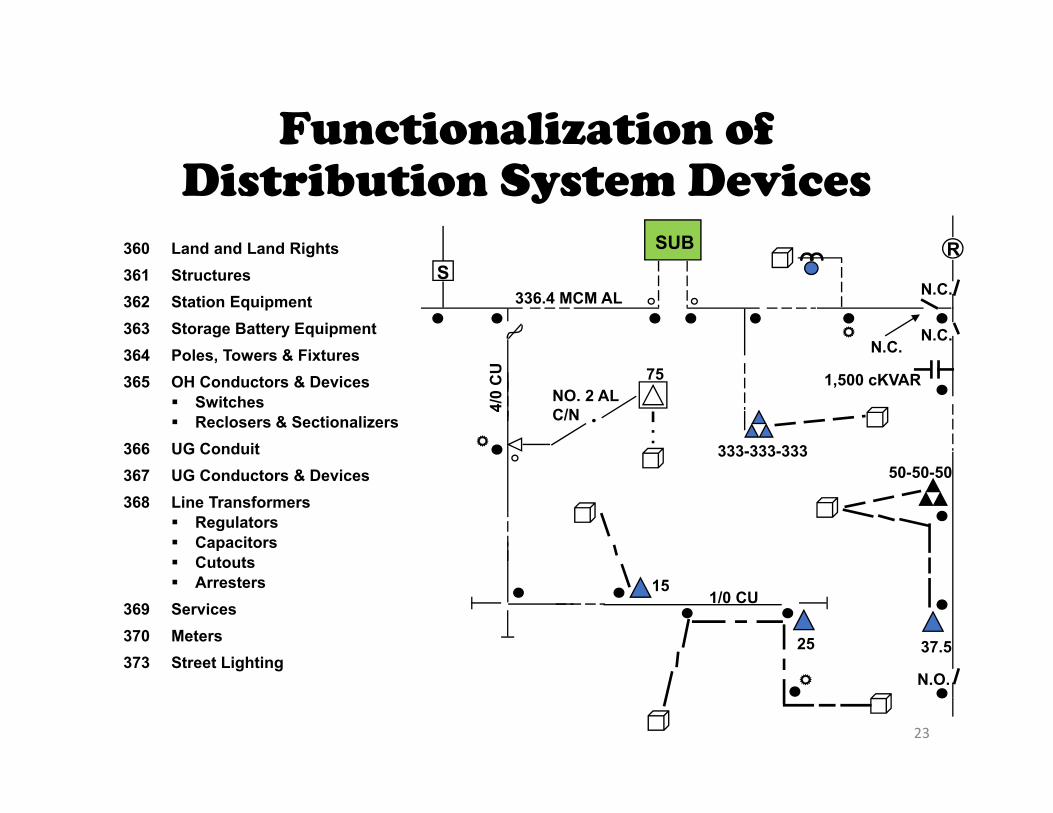
Functionalization of Distribution System Devices
360 Land and Land Rights361 Structures362 Station Equipment363 Storage Battery Equipment364 Poles, Towers & Fixtures365 OH Conductors & Devices
Switches Reclosers & Sectionalizers
366 UG Conduit367 UG Conductors & Devices368 Line Transformers
Regulators Capacitors Cutouts Arresters
369 Services370 Meters373 Street Lighting
SUBS
R
N.O.
N.C.
N.C.N.C.
1,500 cKVAR
333-333-33350-50-50
75
15
25 37.5
336.4 MCM AL
4/0
CU
NO. 2 ALC/N
1/0 CU
23

AM/FM Mapping Systems
24
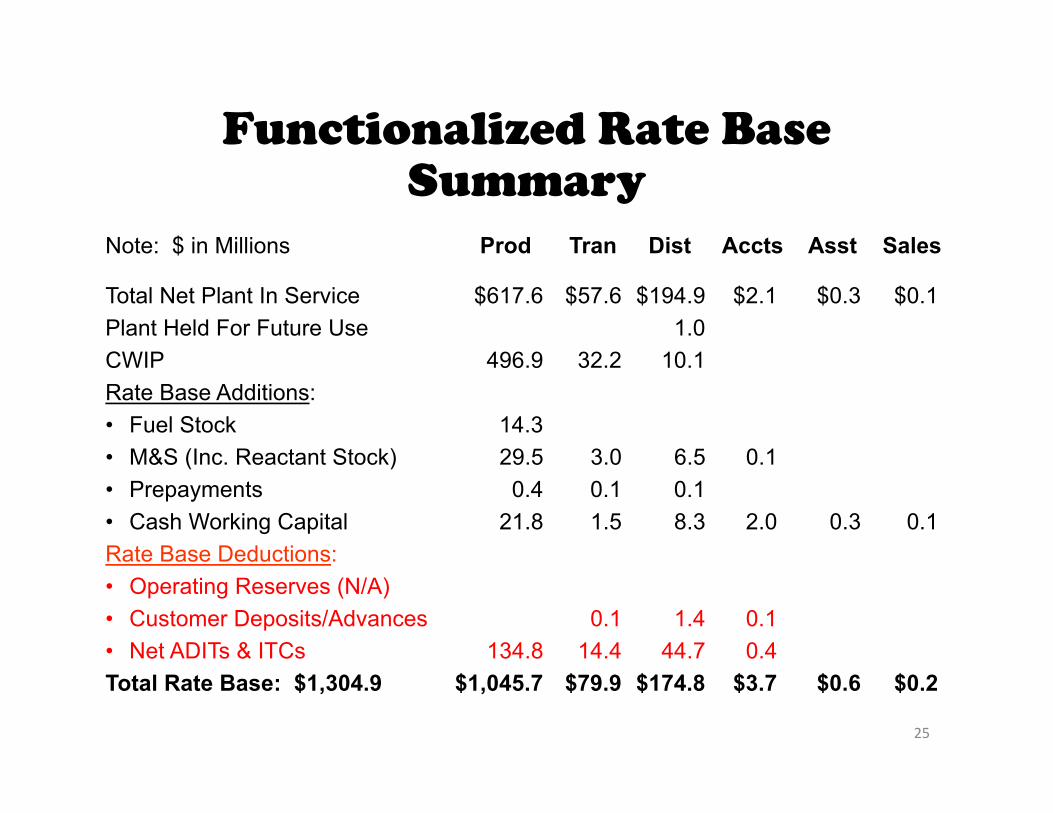
Functionalized Rate Base Summary
Note: $ in Millions Prod Tran Dist Accts Asst Sales
Total Net Plant In Service $617.6 $57.6 $194.9 $2.1 $0.3 $0.1Plant Held For Future Use 1.0CWIP 496.9 32.2 10.1Rate Base Additions:• Fuel Stock 14.3• M&S (Inc. Reactant Stock) 29.5 3.0 6.5 0.1• Prepayments 0.4 0.1 0.1• Cash Working Capital 21.8 1.5 8.3 2.0 0.3 0.1Rate Base Deductions:• Operating Reserves (N/A)• Customer Deposits/Advances 0.1 1.4 0.1• Net ADITs & ITCs 134.8 14.4 44.7 0.4Total Rate Base: $1,304.9 $1,045.7 $79.9 $174.8 $3.7 $0.6 $0.2
25
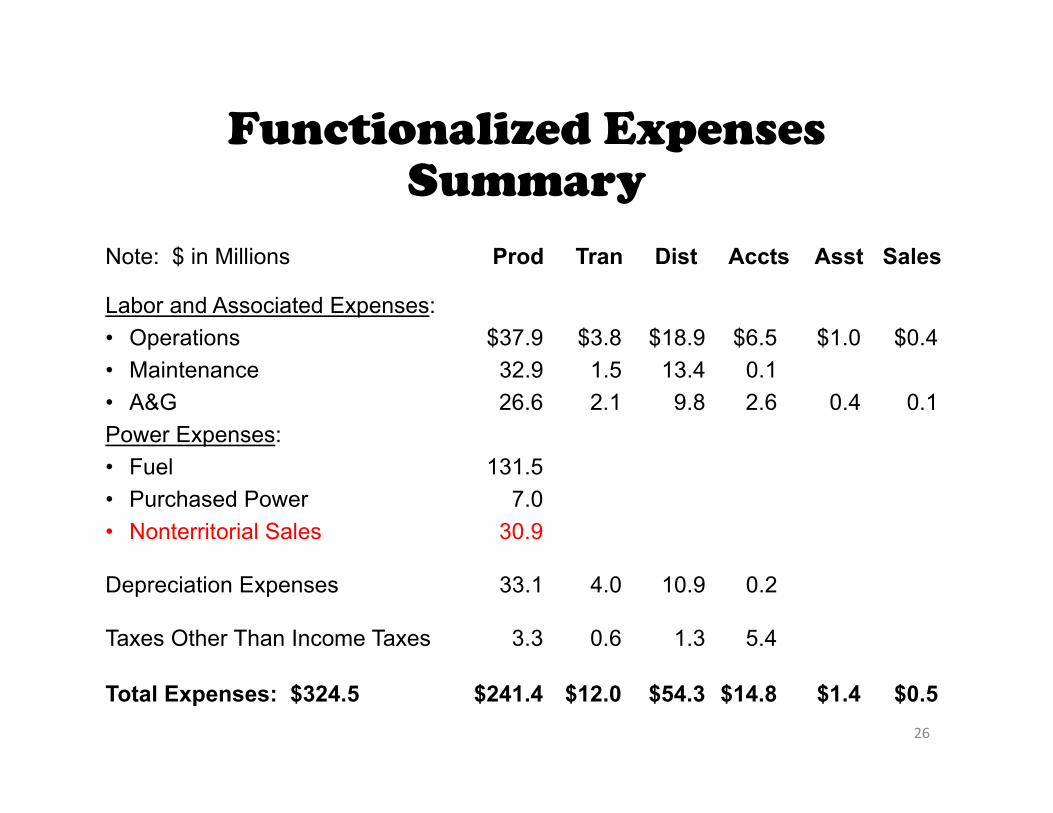
Functionalized Expenses Summary
Note: $ in Millions Prod Tran Dist Accts Asst Sales
Labor and Associated Expenses:• Operations $37.9 $3.8 $18.9 $6.5 $1.0 $0.4• Maintenance 32.9 1.5 13.4 0.1• A&G 26.6 2.1 9.8 2.6 0.4 0.1Power Expenses:• Fuel 131.5• Purchased Power 7.0• Nonterritorial Sales 30.9
Depreciation Expenses 33.1 4.0 10.9 0.2
Taxes Other Than Income Taxes 3.3 0.6 1.3 5.4
Total Expenses: $324.5 $241.4 $12.0 $54.3 $14.8 $1.4 $0.526
COST OF SERVICE:CLASSIFICATION
27
Cost Classification
Classification assigns the functionalized cost elements to the cost causation components of Customer, Demand, and Energy.
» Customer-related costs – fixed costs which are independent of load or energy requirements.
» Demand-related costs – fixed costs which are dependent on kW requirements.
» Energy-related costs – variable costs which are dependent on kWh requirements.
28

5
4
3
2
1
Cost-of-Service Levelsof The Power System
5A
5B
< 600 V
12.47 kV
46 kV
115 kV
230 kV
ENERGYDEMAND
DEMAND
DEMAND
DEMANDCUSTOMER
DEMANDCUSTOMER
29
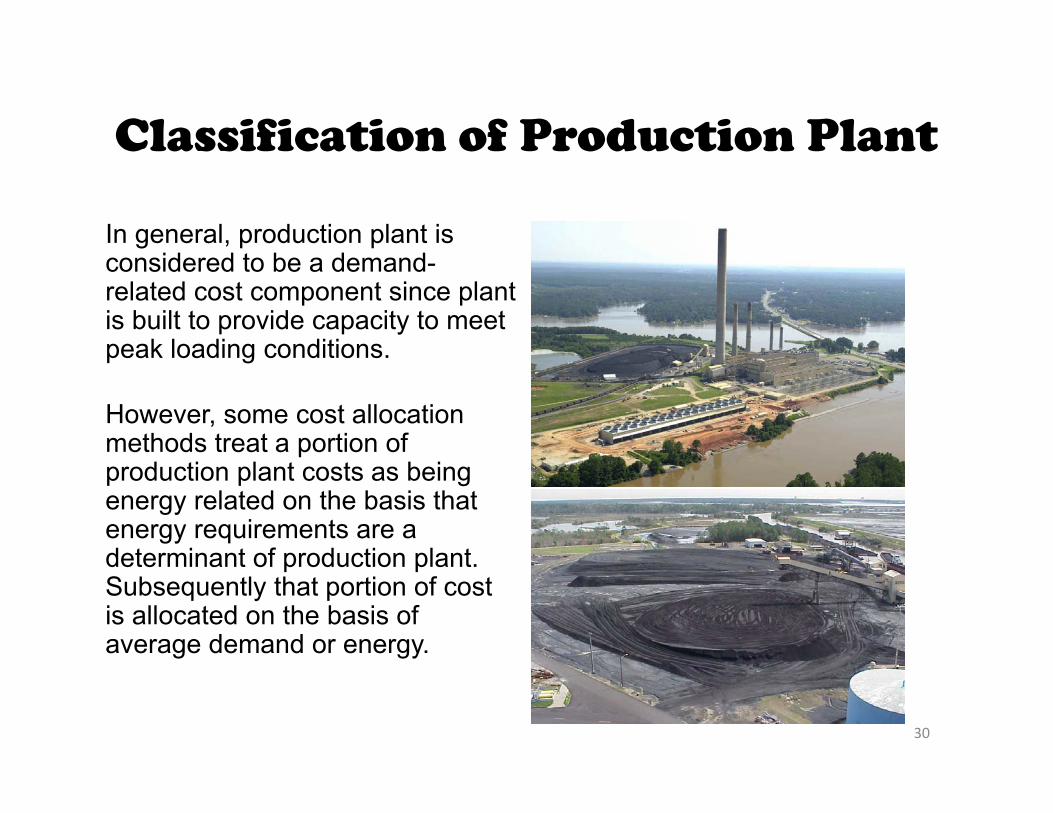
Classification of Production Plant
In general, production plant is considered to be a demand-related cost component since plant is built to provide capacity to meet peak loading conditions.
However, some cost allocation methods treat a portion of production plant costs as being energy related on the basis that energy requirements are a determinant of production plant. Subsequently that portion of cost is allocated on the basis of average demand or energy.
30

Classification of Production Expenses
Steam Production O&M FERC Method NARUC MethodOperation Demand Energy Demand Energy500 Supervision and Engineering All -- Labor* Labor*
501 Fuel and Fuel Handling -- All -- All
502 Steam Expenses All -- Labor Materials
503 Steam From Other Sources -- All -- All
504 Steam Transferred - Credit -- All -- All
505 Electric Expenses All -- Labor Materials
506 Miscellaneous Steam Expenses All -- All --
507 Rents All -- All --
509 Allowances -- All -- All
Maintenance
510 Supervision and Engineering -- All Labor* Labor*
511 Structures All -- All --
512 Boilers -- All -- All
513 Electric Plant -- All -- All
514 Miscellaneous Steam Plant All -- -- All
* Allocation between Energy and Demand based on labor subtotal of underlying accounts. 31
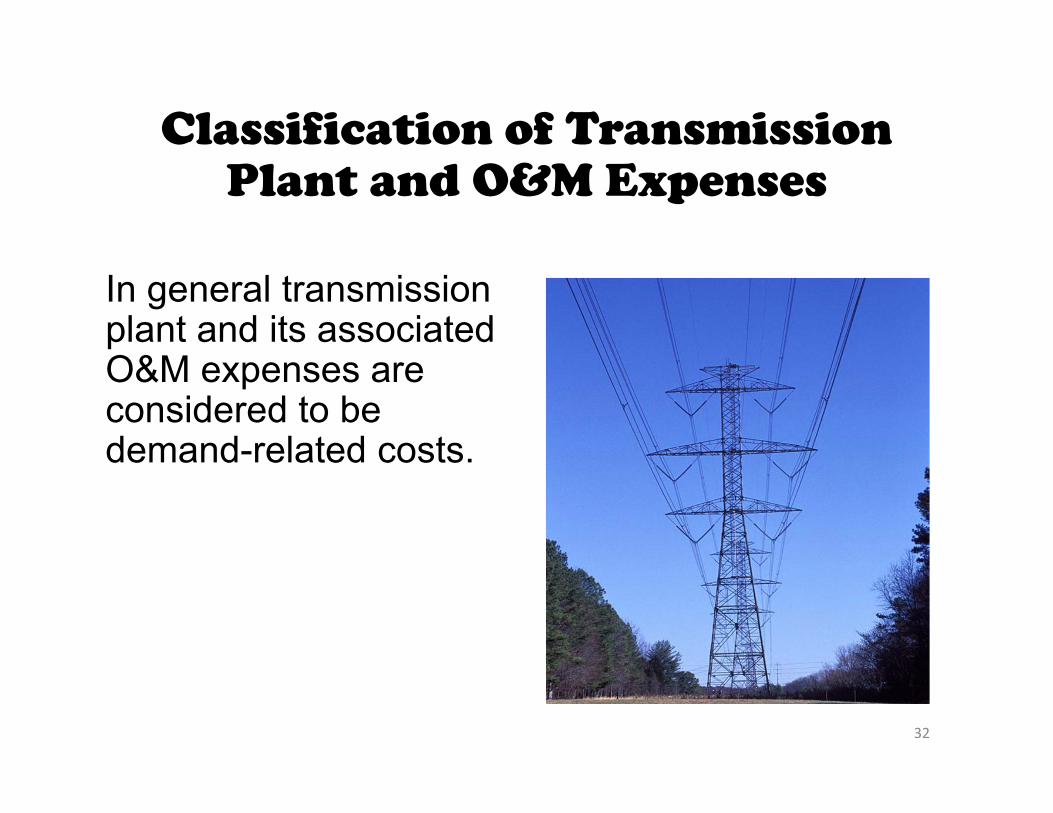
Classification of Transmission Plant and O&M Expenses
In general transmission plant and its associated O&M expenses are considered to be demand-related costs.
32
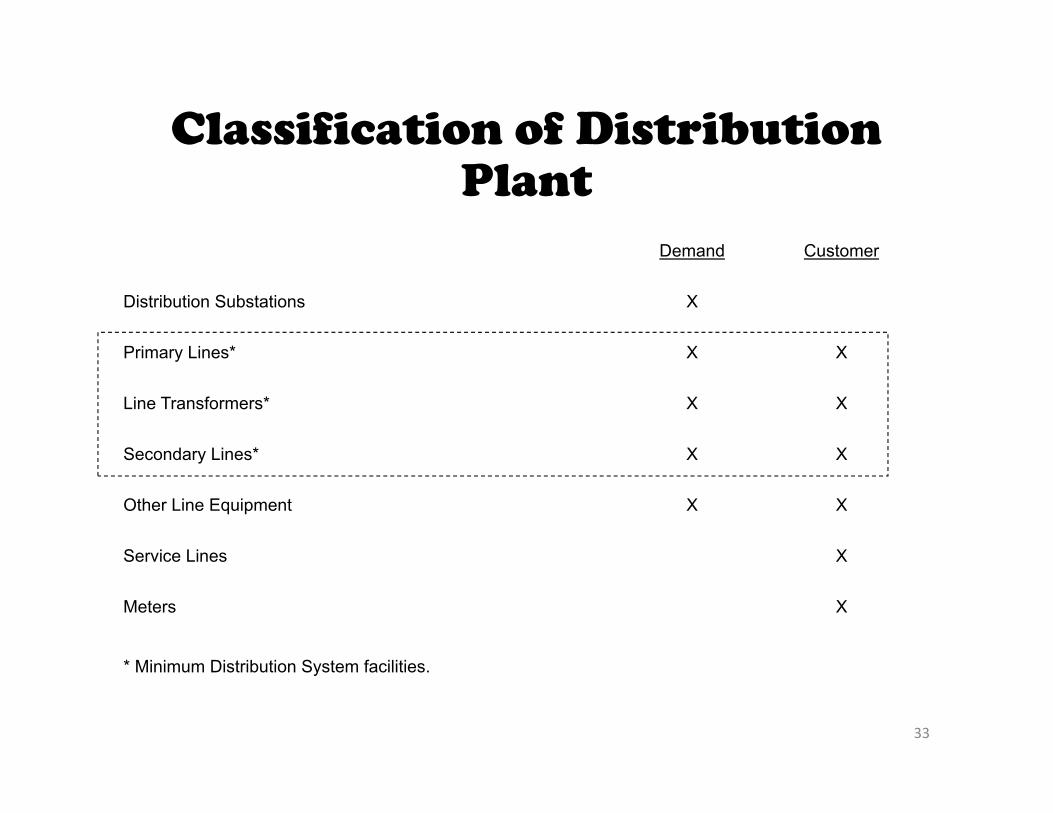
Classification of Distribution Plant
Demand Customer
Distribution Substations X
Primary Lines* X X
Line Transformers* X X
Secondary Lines* X X
Other Line Equipment X X
Service Lines X
Meters X
* Minimum Distribution System facilities.
33
COST OF SERVICE:ALLOCATION
34
Cost Allocation
Allocation is the process whereby the customer, demand, and energy cost components, developed in the classification of costs step, are apportioned to customer groups: rate classes, customer classes, and/or jurisdictions.
Direct assignment of costs are made when possible, e.g., ornamental poles and fixtures assigned directly to the lighting class.
35

Major Cost Allocators
Energy Cost Allocator – Developed on the basis of customers’ kWh energy usage.
Demand Cost Allocator – Developed on the basis of customers’ kW loads.
Customer Cost Allocator – Developed on the basis of numbers of customers.
36
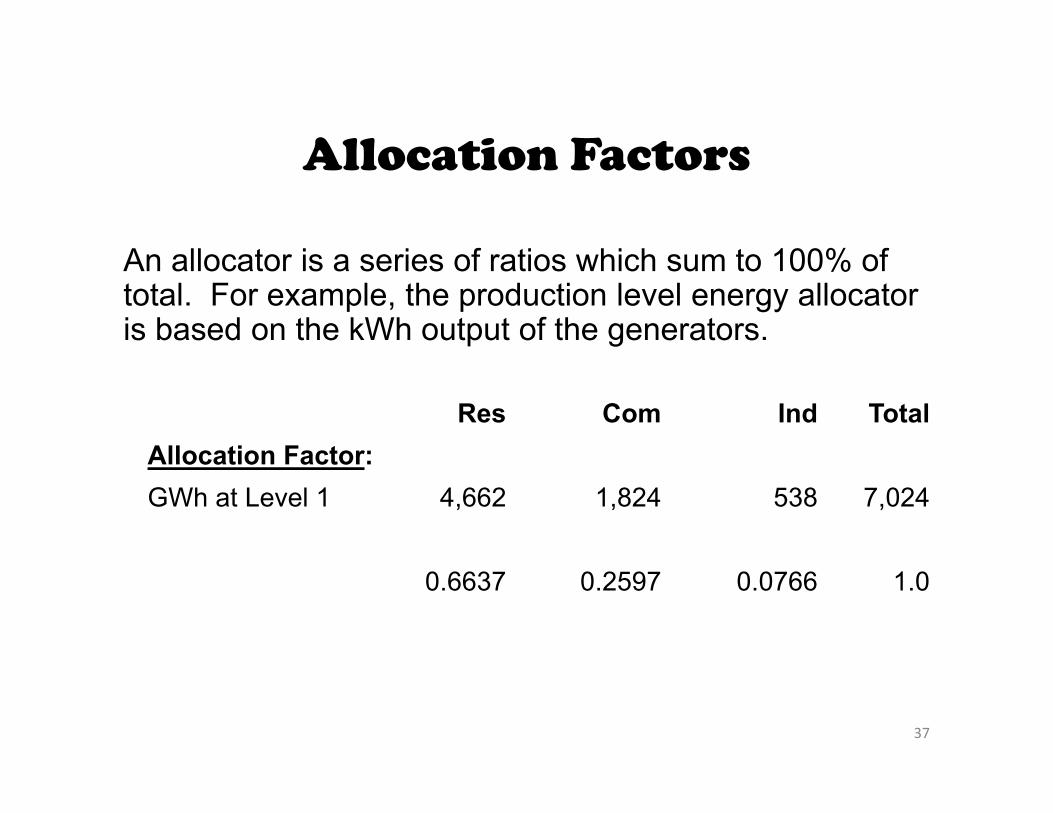
Allocation Factors
An allocator is a series of ratios which sum to 100% of total. For example, the production level energy allocator is based on the kWh output of the generators.
Res Com Ind TotalAllocation Factor:GWh at Level 1 4,662 1,824 538 7,024
0.6637 0.2597 0.0766 1.0
37

Expansion of Energy Sales at Meters to the Production Level
< 600 V
12.47 kV
46 kV
115 kV
230 kV
4,662 GWh
1,767 GWh
4,317 GWh
1,824 GWh
533 GWh
538 GWh
0.9%3.2%8.0%
System Losses: 6.2%
M
M
M
7,024 GWh
38
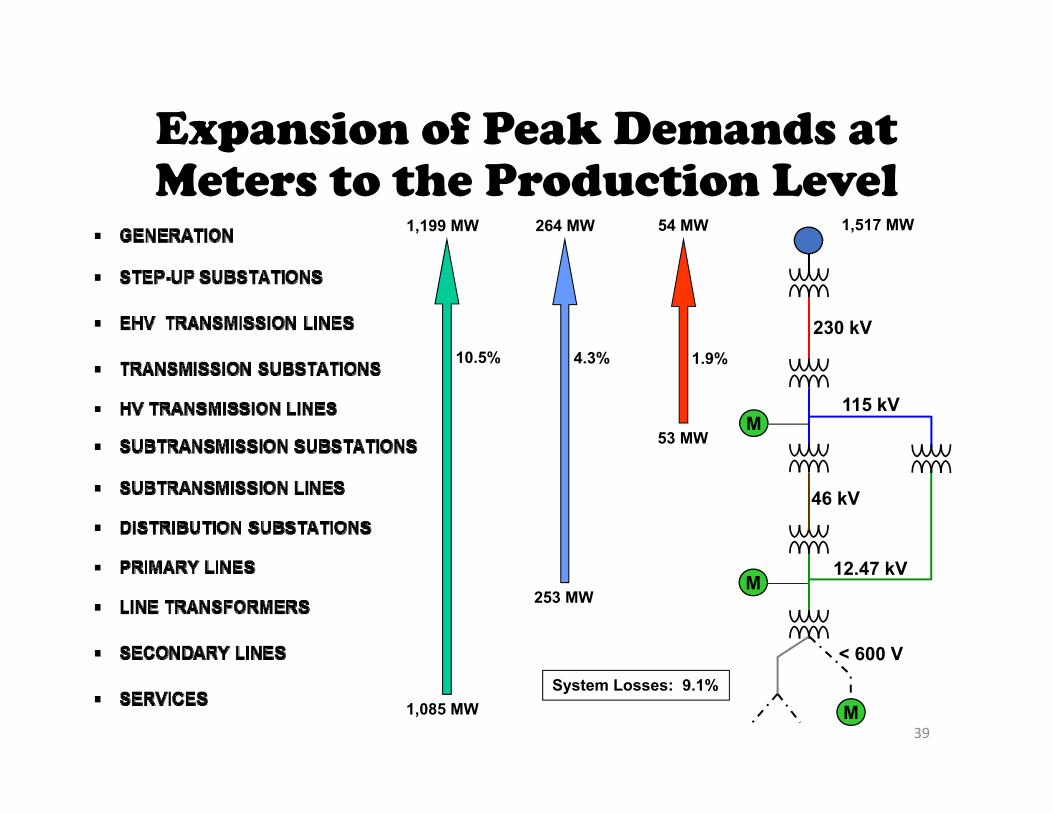
Expansion of Peak Demands at Meters to the Production Level
< 600 V
12.47 kV
46 kV
115 kV
230 kV
1,199 MW
253 MW
1,085 MW
264 MW
53 MW
54 MW
1.9%4.3%10.5%
System Losses: 9.1%
M
M
M
1,517 MW
39
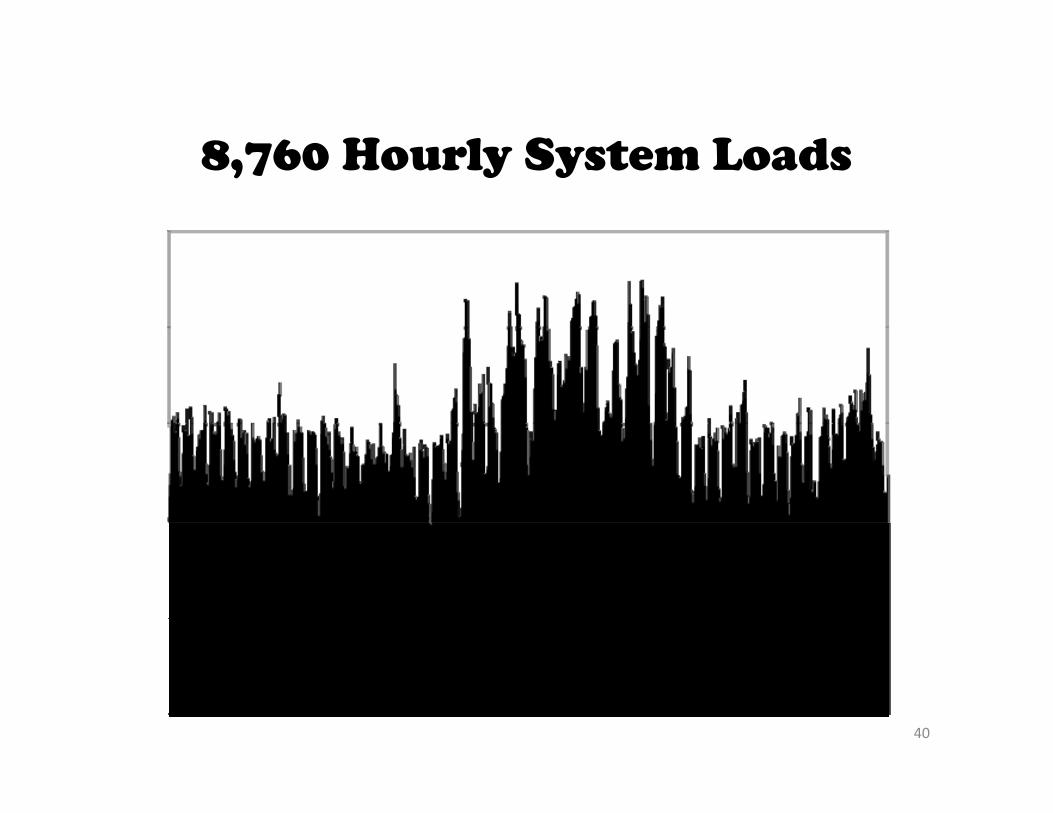
8,760 Hourly System Loads
40
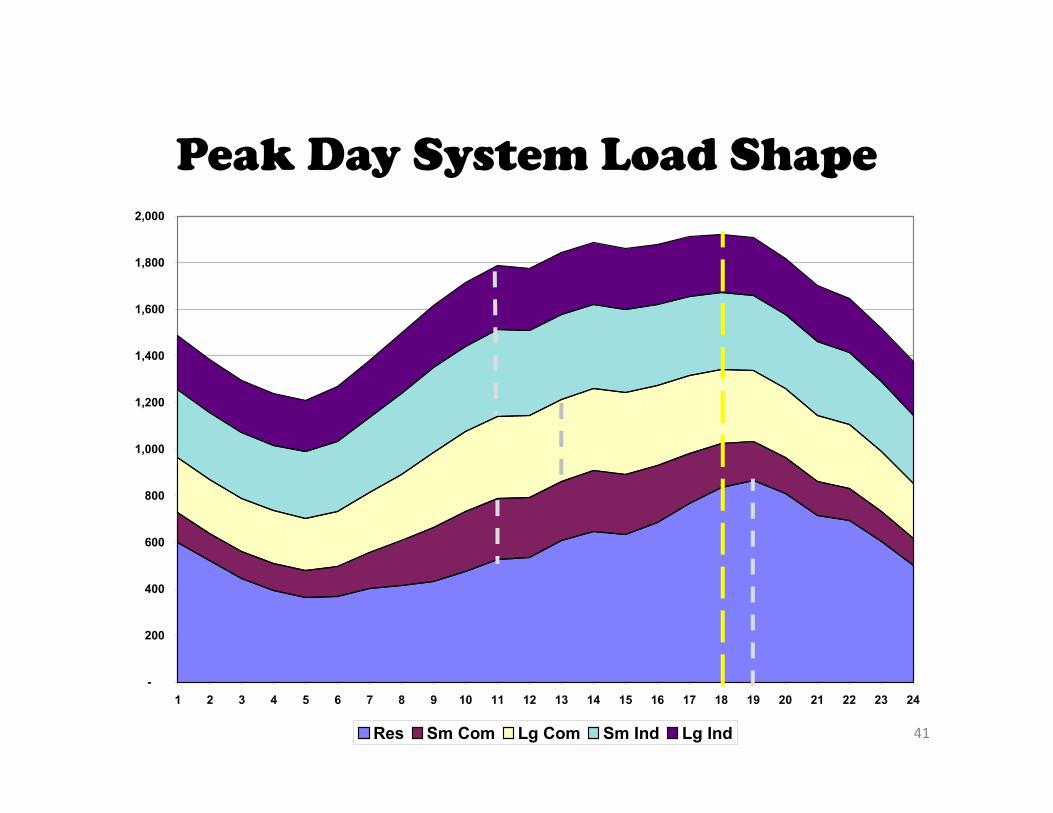
Peak Day System Load Shape
-
200
400
600
800
1,000
1,200
1,400
1,600
1,800
2,000
1 2 3 4 5 6 7 8 9 10 11 12 13 14 15 16 17 18 19 20 21 22 23 24
Res Sm Com Lg Com Sm Ind Lg Ind 41
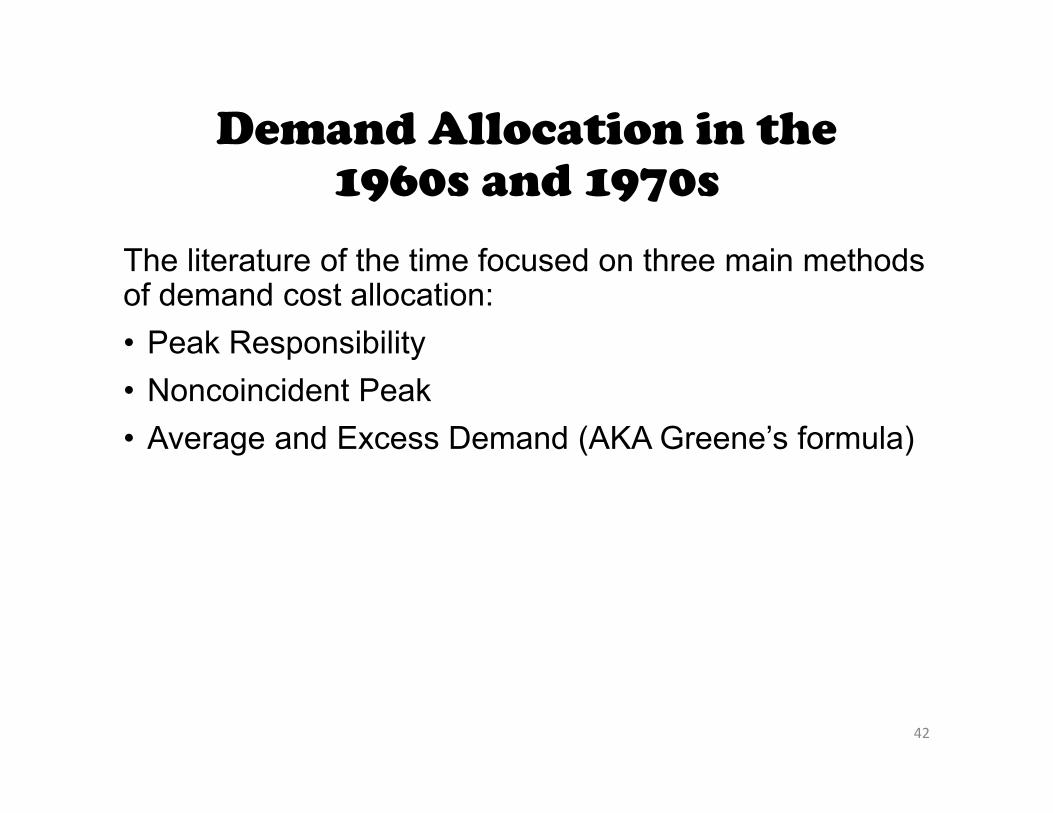
Demand Allocation in the1960s and 1970s
The literature of the time focused on three main methods of demand cost allocation:• Peak Responsibility• Noncoincident Peak• Average and Excess Demand (AKA Greene’s formula)
42
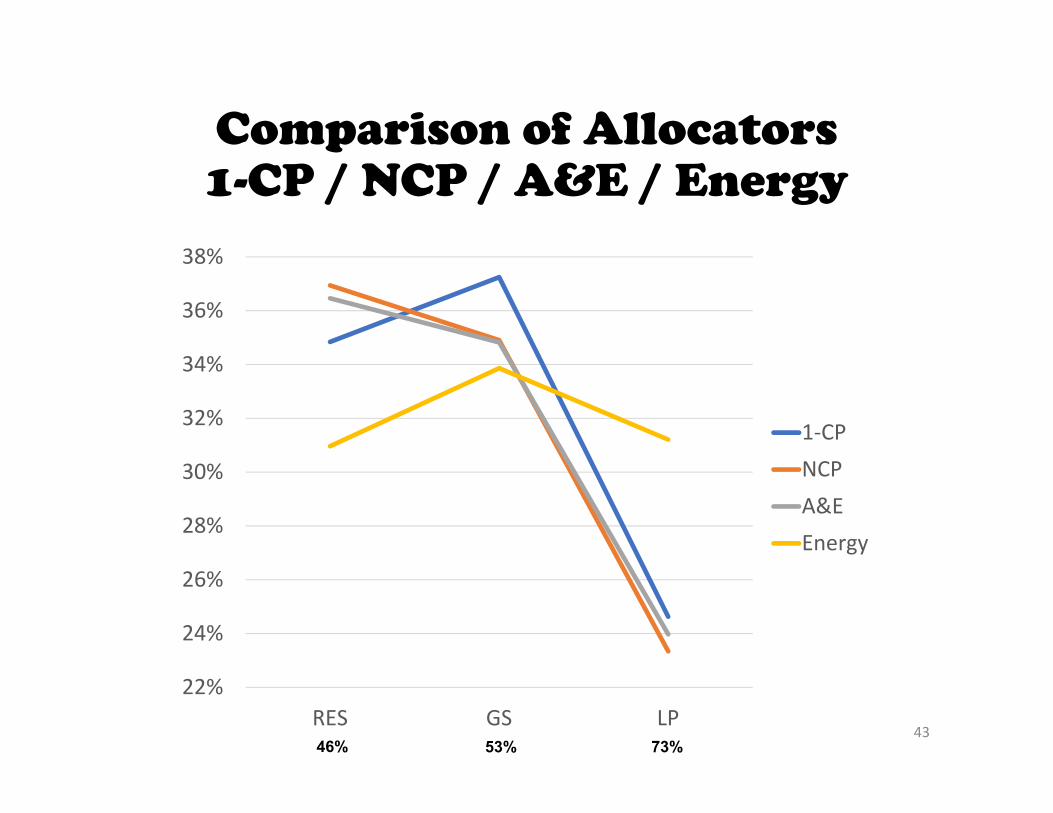
Comparison of Allocators1-CP / NCP / A&E / Energy
22%
24%
26%
28%
30%
32%
34%
36%
38%
RES GS LP
1‐CPNCPA&EEnergy
4346% 53% 73%

24%
26%
28%
30%
32%
34%
36%
38%
40%
RES GS LP
1‐CP3‐CP4‐CP12‐CP
Comparison of Allocators1-CP / 3-CP / 4-CP / 12-CP
4446% 53% 73%
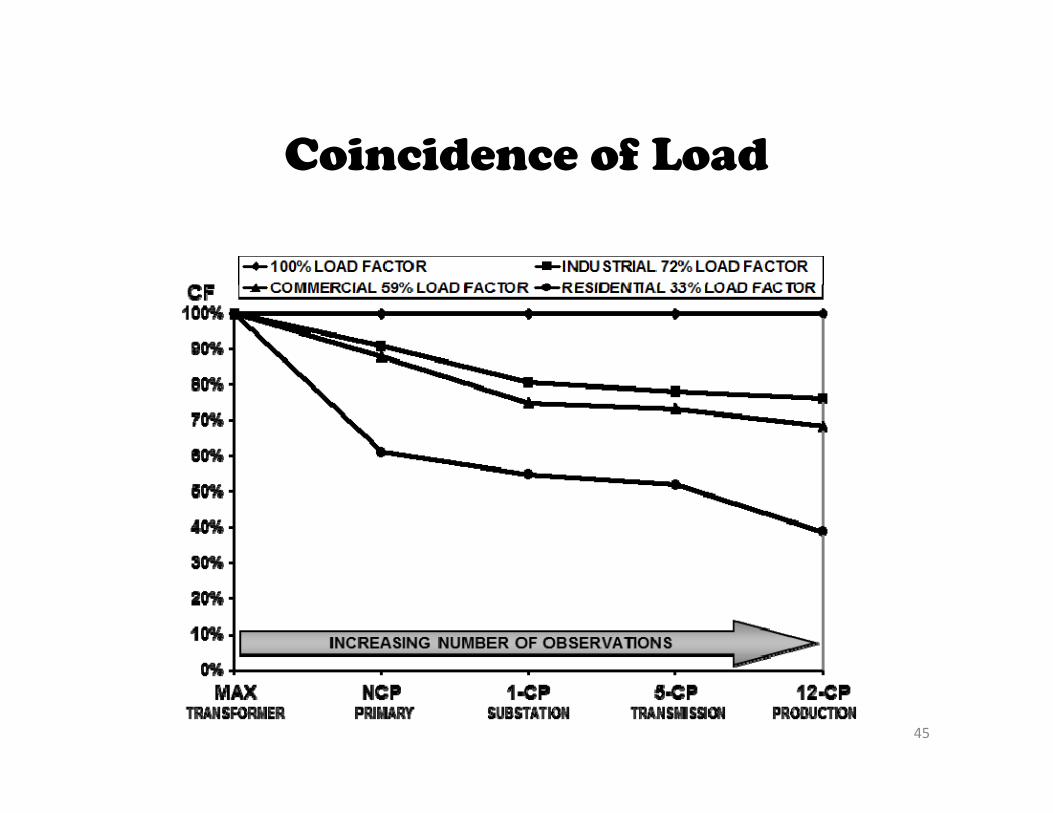
Coincidence of Load
45
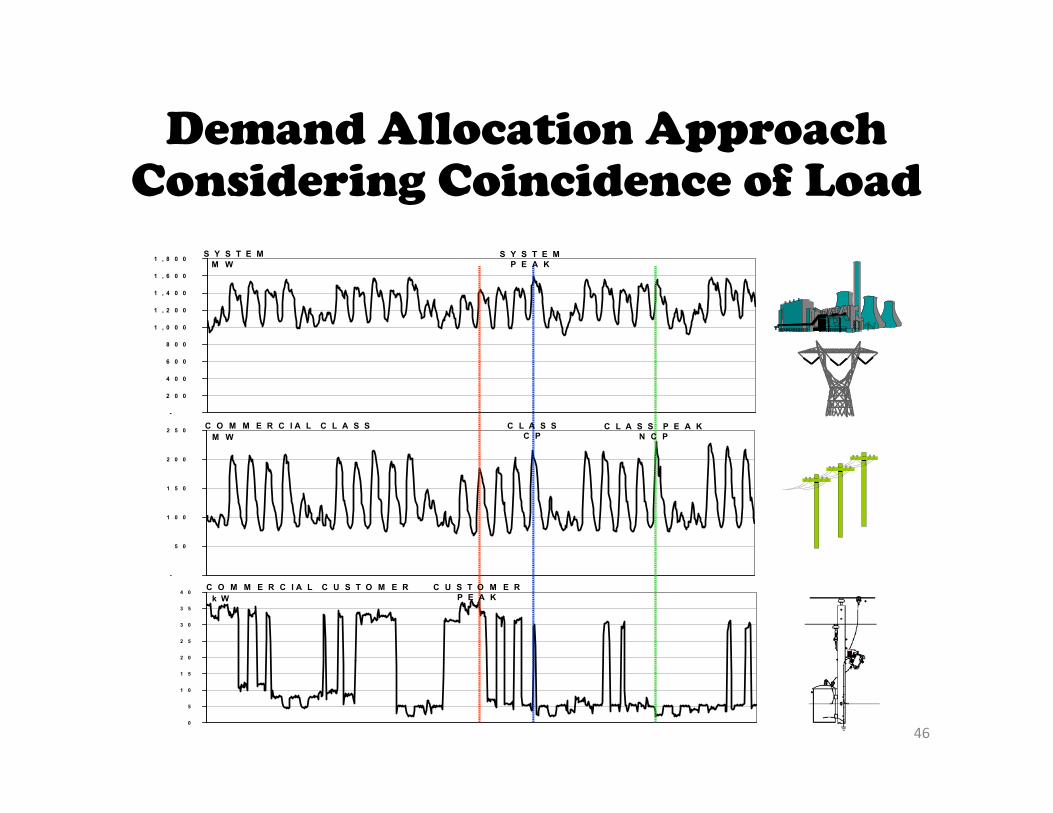
Demand Allocation Approach Considering Coincidence of Load
-
5 0
1 0 0
1 5 0
2 0 0
2 5 0
-
2 0 0
4 0 0
6 0 0
8 0 0
1 , 0 0 0
1 , 2 0 0
1 , 4 0 0
1 , 6 0 0
1 , 8 0 0
0
5
1 0
1 5
2 0
2 5
3 0
3 5
4 0k W
M W
M WS Y S T E M
C O M M E R C I A L C L A S S
C O M M E R C I A L C U S T O M E R
S Y S T E MP E A K
C L A S S P E A KN C P
C U S T O M E RP E A K
C L A S SC P
46
FERC Methods for Production and Transmission Allocation
FERC believes that the majority of utilities plan their systems to meet their 12 monthly peaks.
FERC precedent is to use a 12-CP demand allocation method when the system demand shape is relatively flat.
FERC allows utilities to file other allocation methods if they can demonstrate that these alternatives reflect their system planning.
47

System Peak Demands
48
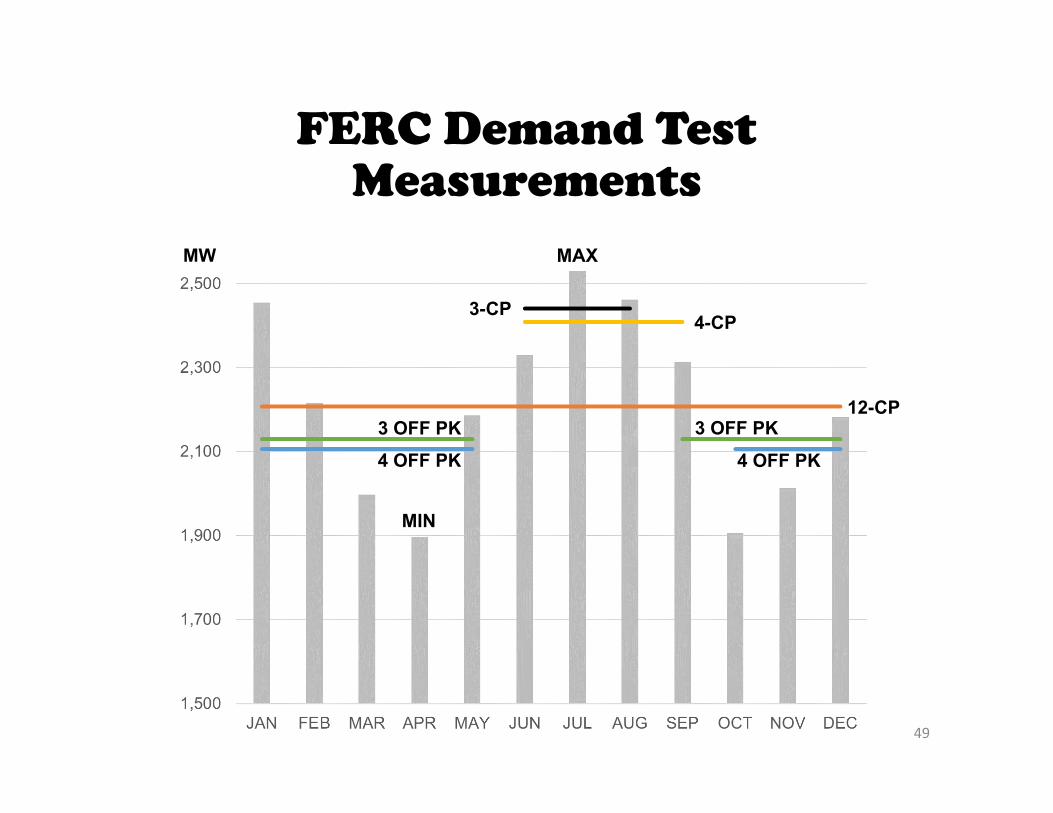
FERC Demand Test Measurements
MAX
12-CP
4-CP3-CP
MIN
3 OFF PK 3 OFF PK4 OFF PK 4 OFF PK
MW
49

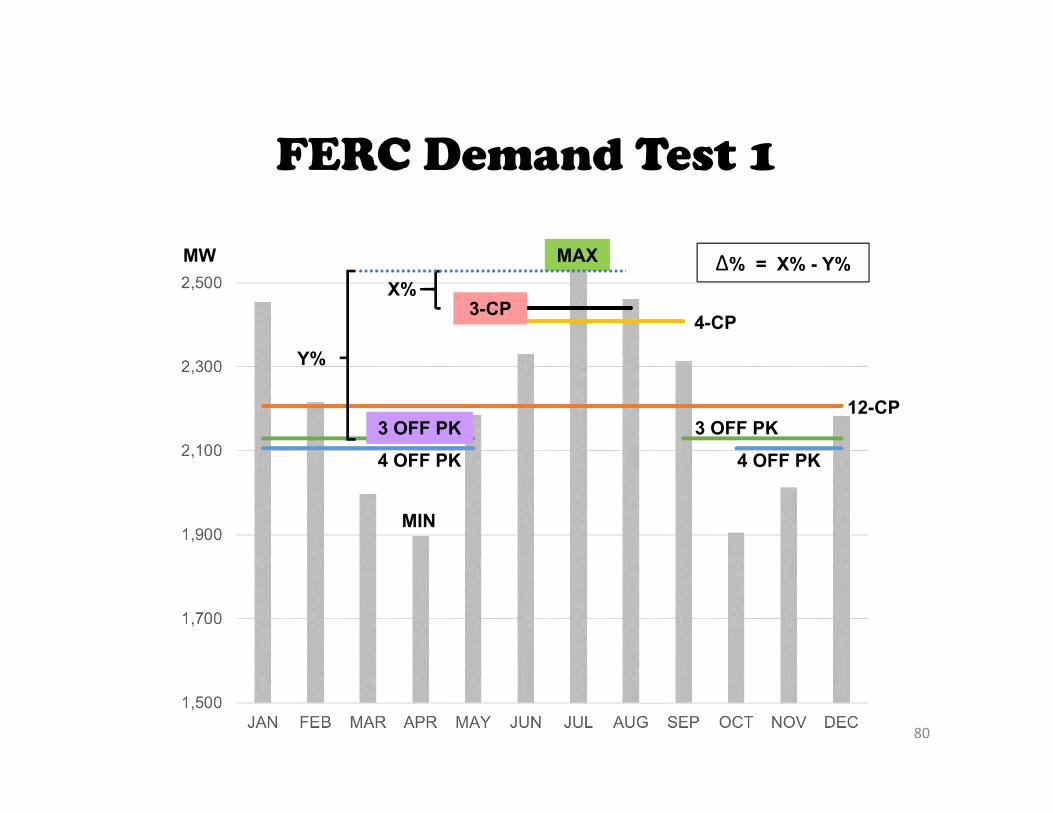
FERC Demand Test 1
On Peak—Off Peak Test: Compare (a) the average of the monthly system peaks during the on-peak period (e.g., 3-CP or 4-CP) as a percentage of the annual system peak (MAX) to (b) the average of the monthly system peaks during the off-peak period (e.g., 3 OFF PK or 4 OFF PK) as a percentage of the annual system peak.
• A smaller difference (≤ 19%) supports a 12-CP method.
• A larger difference supports some method other than 12-CP.
50
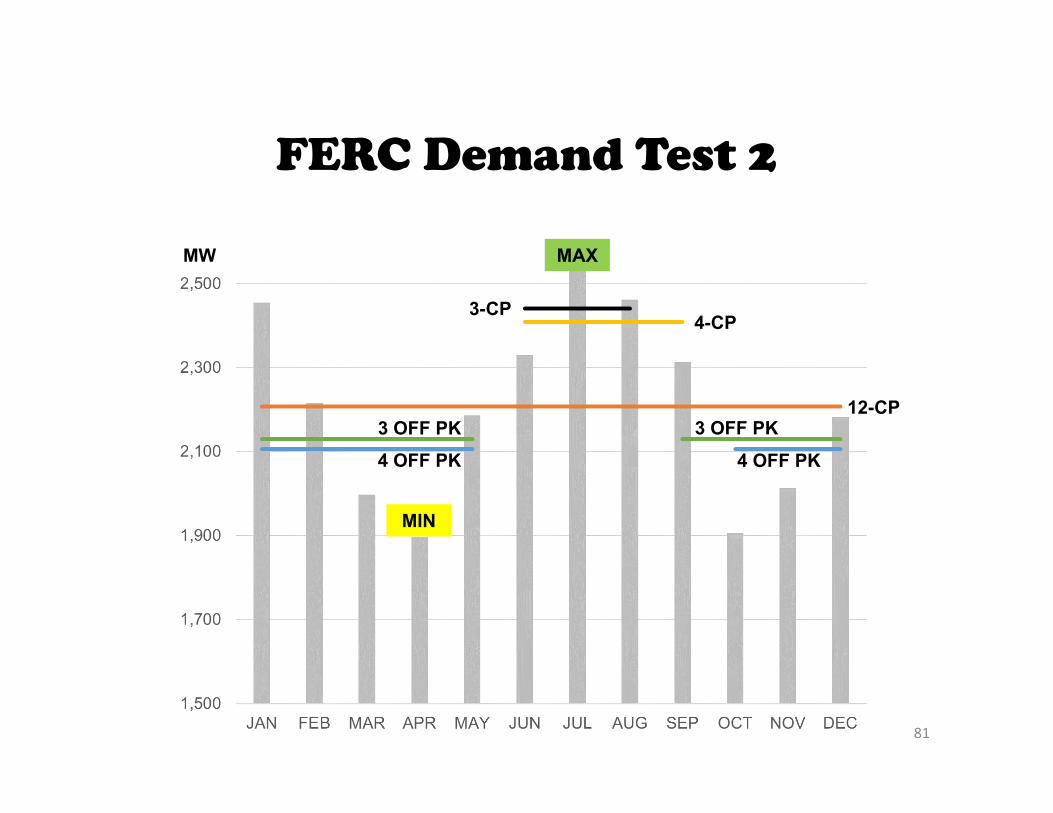
FERC Demand Test 2
Low Peak—High Peak Test: Compute the ratio of the lowest monthly peak (MIN) to the highest monthly peak (MAX) during the annual test period.
• A higher percentage (≥ 66%) supports a 12-CP method.
• A smaller percentage supports some method other than 12-CP.
51
FERC Demand Test 3
Average Peak—High Peak Test: Compute the ratio of the average monthly peaks (12-CP) to the highest monthly peak (MAX) during the annual test period.
• A higher percentage (≥ 81%) supports a 12-CP method.
• A smaller percentage supports some method other than 12-CP.
52
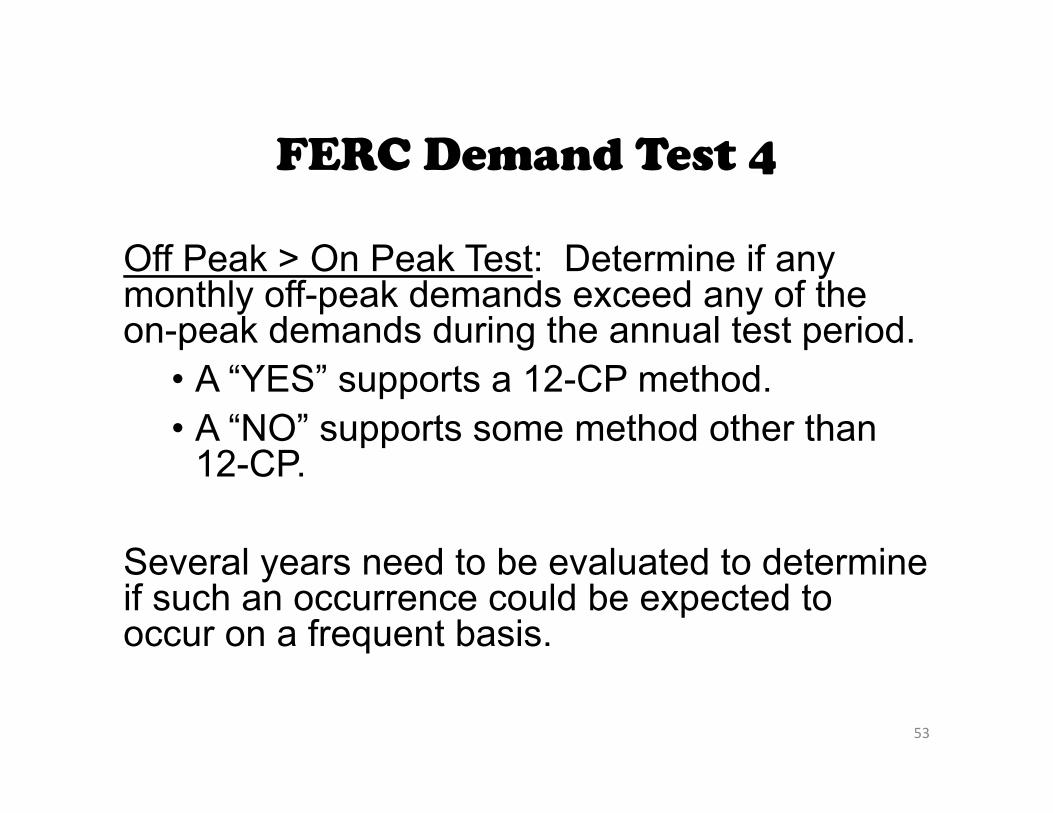
FERC Demand Test 4
Off Peak > On Peak Test: Determine if any monthly off-peak demands exceed any of the on-peak demands during the annual test period.
• A “YES” supports a 12-CP method.• A “NO” supports some method other than
12-CP.
Several years need to be evaluated to determine if such an occurrence could be expected to occur on a frequent basis.
53
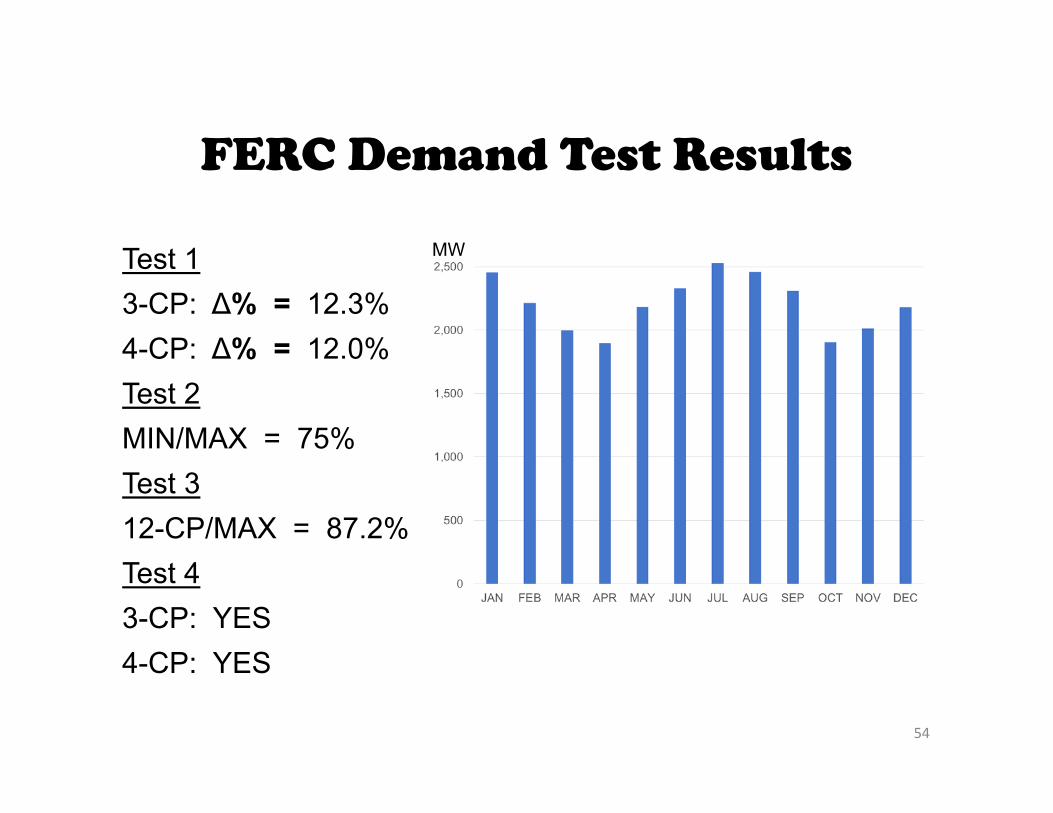
FERC Demand Test Results
Test 13-CP: Δ% = 12.3%4-CP: Δ% = 12.0%Test 2MIN/MAX = 75%Test 312-CP/MAX = 87.2%Test 43-CP: YES4-CP: YES
MW
54
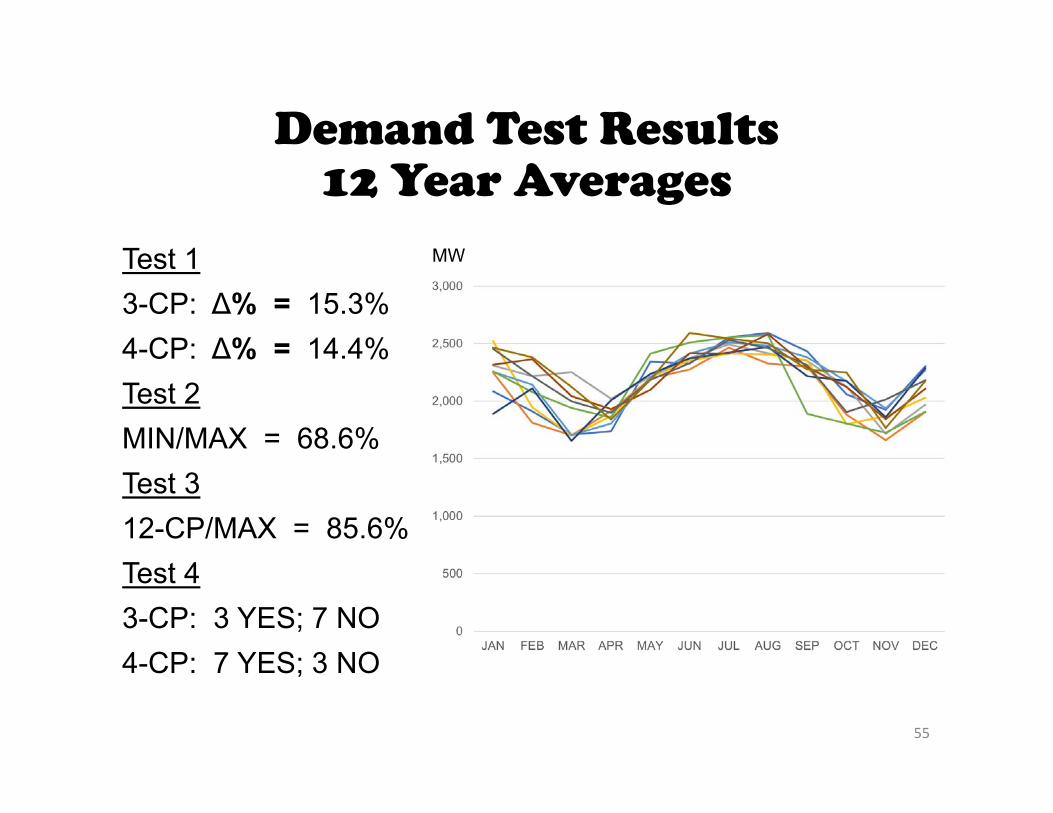
Demand Test Results12 Year Averages
Test 13-CP: Δ% = 15.3%4-CP: Δ% = 14.4%Test 2MIN/MAX = 68.6%Test 312-CP/MAX = 85.6%Test 43-CP: 3 YES; 7 NO4-CP: 7 YES; 3 NO
MW
55
Electric Utility Rate Design Study
• A nationwide effort by EPRI, EEI, APPA, and NRECA for NARUC to study and advance ratemaking in costing, rate design, metering, and other relevant topics.
• Reports were published during the period of 1977 to 1981.
56
Public Utility Regulatory Policy Act PURPA – 1978 COSS Standards
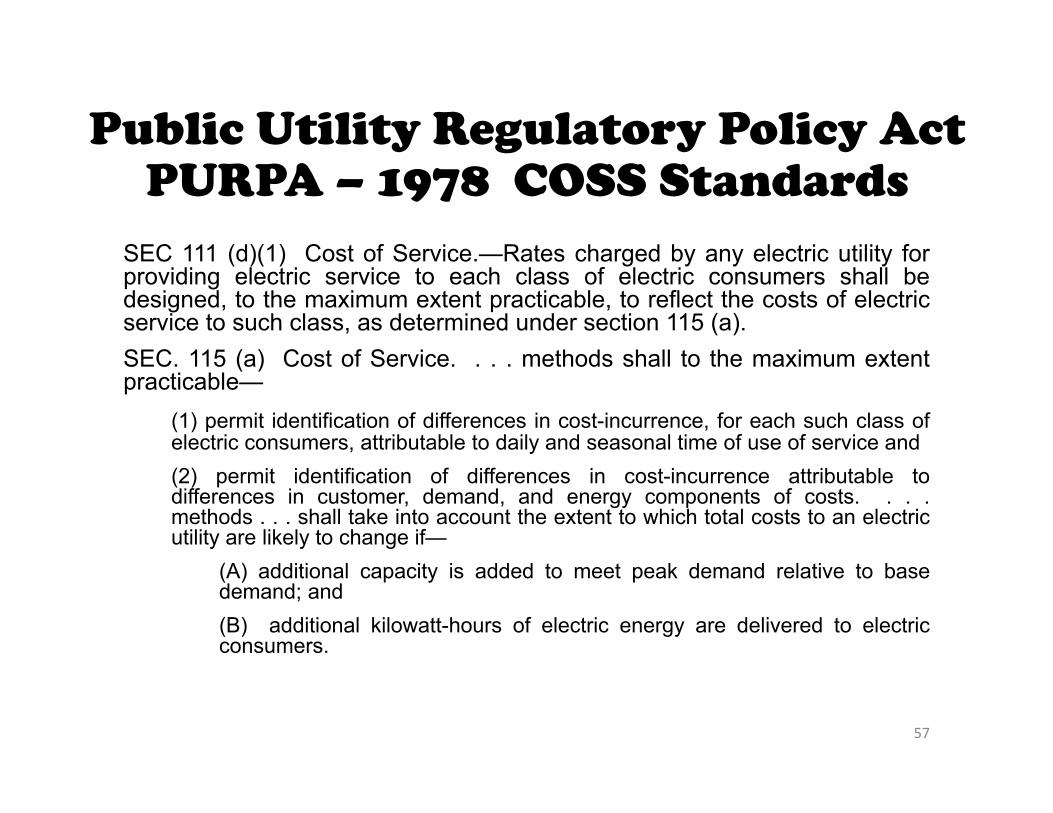
SEC 111 (d)(1) Cost of Service.—Rates charged by any electric utility forproviding electric service to each class of electric consumers shall bedesigned, to the maximum extent practicable, to reflect the costs of electricservice to such class, as determined under section 115 (a).SEC. 115 (a) Cost of Service. . . . methods shall to the maximum extentpracticable—
(1) permit identification of differences in cost-incurrence, for each such class ofelectric consumers, attributable to daily and seasonal time of use of service and(2) permit identification of differences in cost-incurrence attributable todifferences in customer, demand, and energy components of costs. . . .methods . . . shall take into account the extent to which total costs to an electricutility are likely to change if—
(A) additional capacity is added to meet peak demand relative to basedemand; and(B) additional kilowatt-hours of electric energy are delivered to electricconsumers.
57

Marginal Energy Cost
• Marginal Energy Cost Approaches• Production dispatch model• Historic incremental heat rates applied to a
projected period
• Time-differentiated costs – seasonal and daily rating periods
58

Marginal Capacity Cost
• Reliability Indicators• Generation reserve margins• Loss of load probability
• Marginal Capacity Cost Approaches• Long-run cost view: Peaker Deferral – typically
based on a CT peaker• Short-run cost view: Resource Expansion Plan –
base plan vs. incremental/decremental load forecast plan
• Time-differentiated costs – seasonal and daily rating periods
59
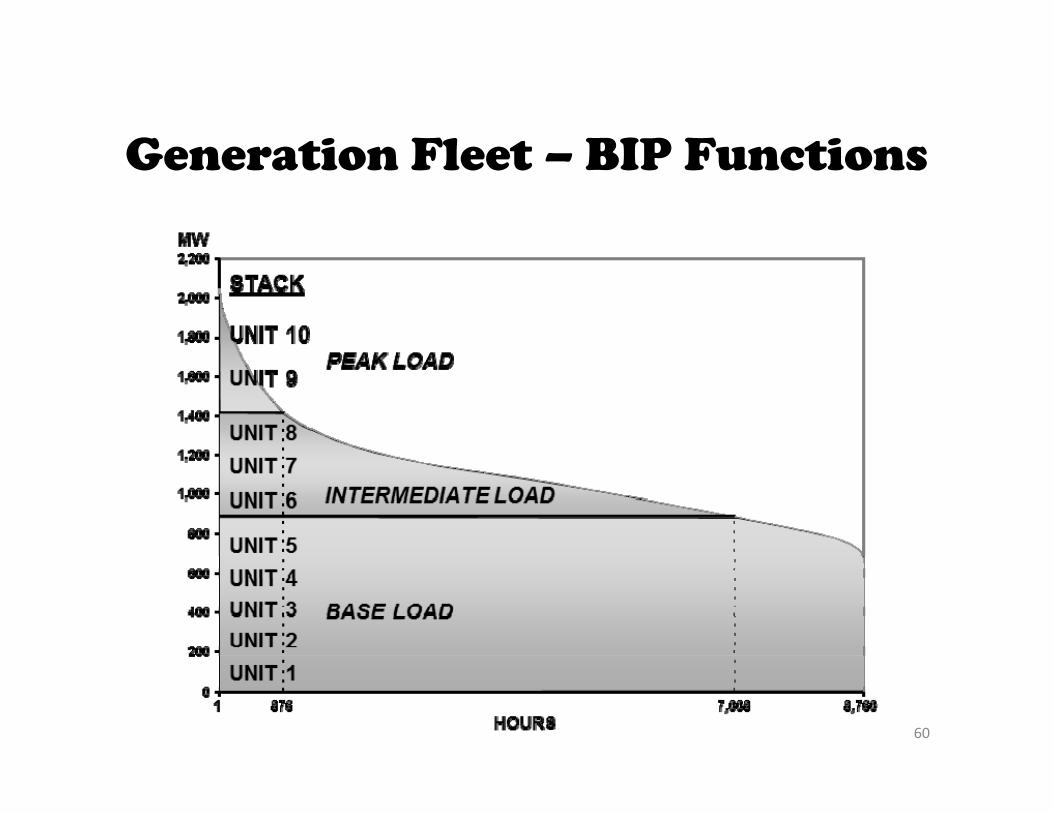
Generation Fleet – BIP Functions
60
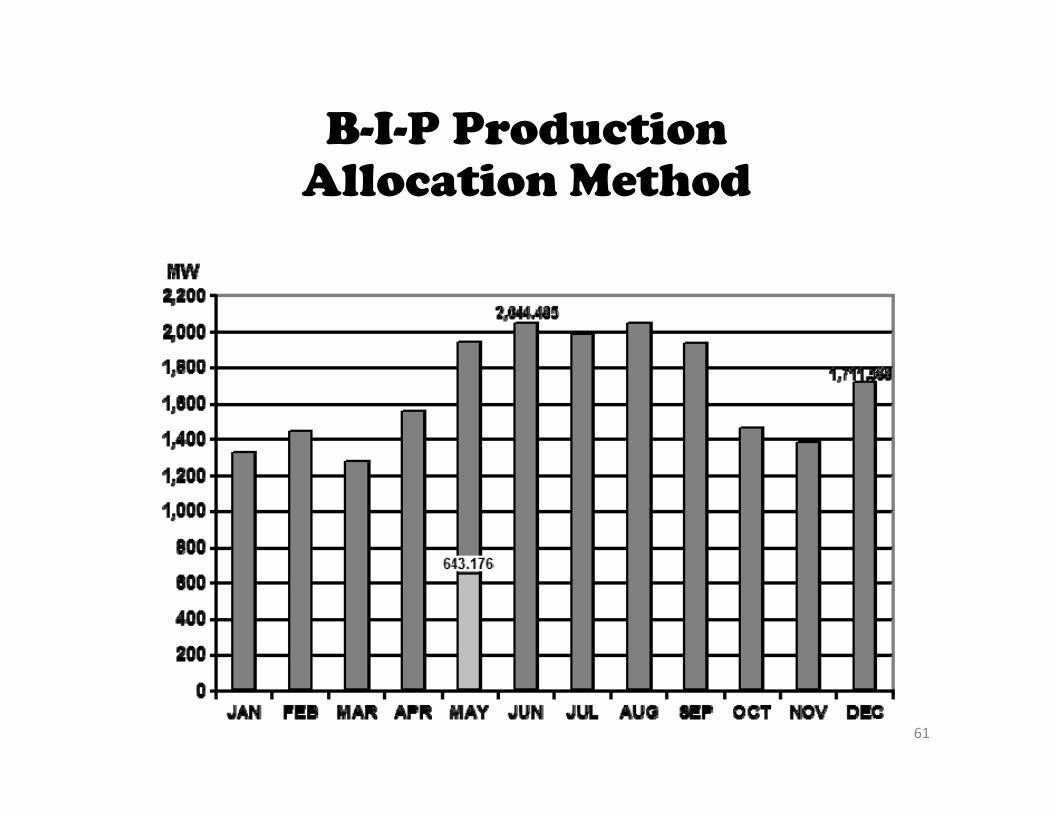
B-I-P ProductionAllocation Method
61

B-I-P ProductionAllocation Method
Base:31.46%
Intermediate:33.06%
Peak:35.48%
62
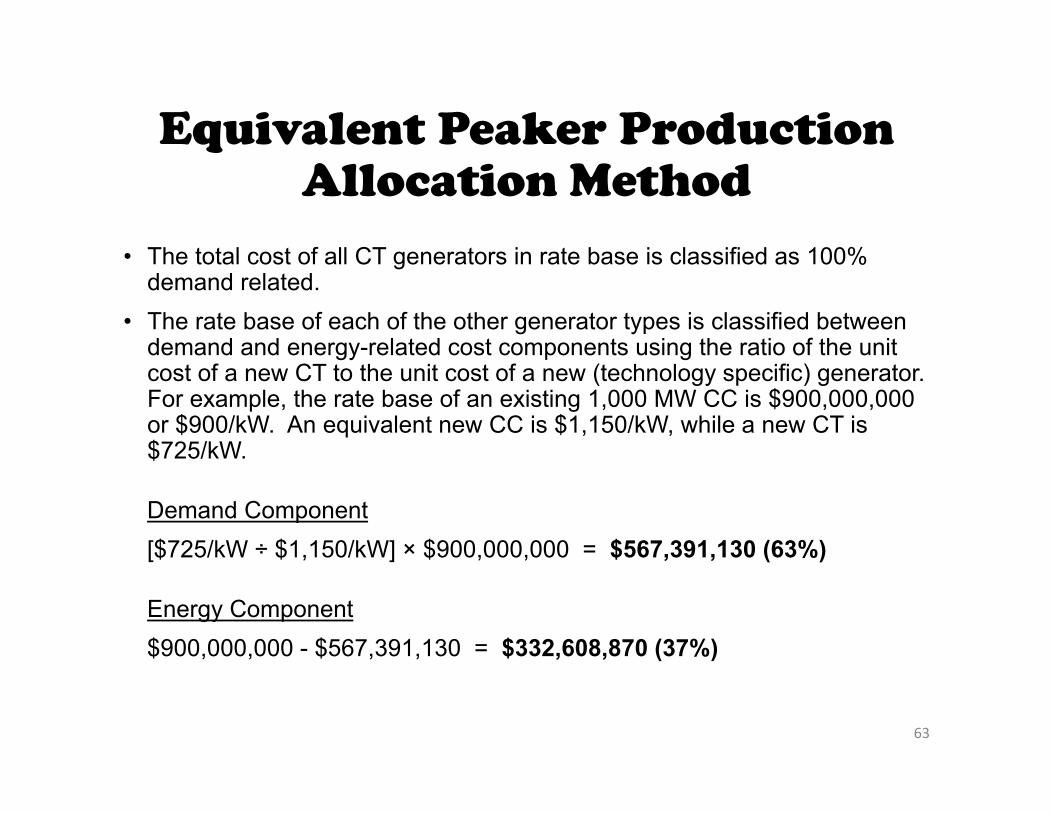
Equivalent Peaker Production Allocation Method
• The total cost of all CT generators in rate base is classified as 100% demand related.
• The rate base of each of the other generator types is classified between demand and energy-related cost components using the ratio of the unit cost of a new CT to the unit cost of a new (technology specific) generator. For example, the rate base of an existing 1,000 MW CC is $900,000,000 or $900/kW. An equivalent new CC is $1,150/kW, while a new CT is $725/kW.
Demand Component[$725/kW ÷ $1,150/kW] × $900,000,000 = $567,391,130 (63%)
Energy Component$900,000,000 - $567,391,130 = $332,608,870 (37%)
63
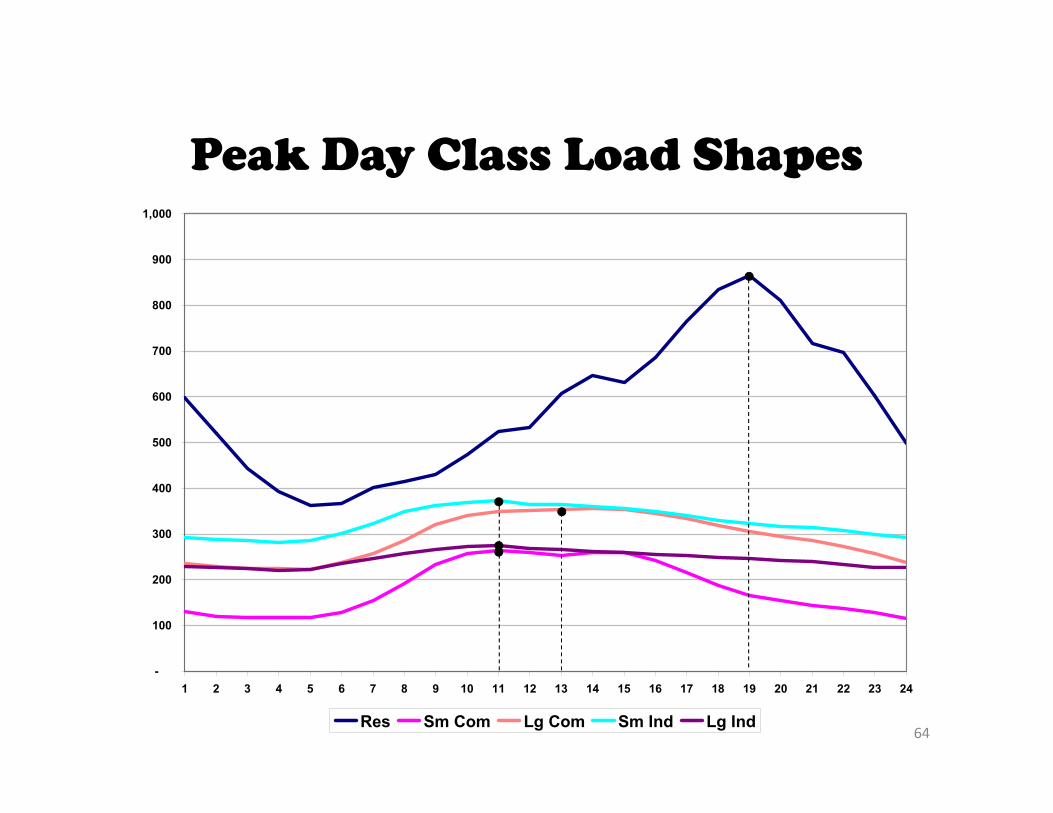
Peak Day Class Load Shapes
-
100
200
300
400
500
600
700
800
900
1,000
1 2 3 4 5 6 7 8 9 10 11 12 13 14 15 16 17 18 19 20 21 22 23 24
Res Sm Com Lg Com Sm Ind Lg Ind64

Load Research
EXAMPLE: DETERMINE THERESIDENTIAL CLASS LOAD ATTHE TIME OF SYSTEM PEAK.
POPULATION
SAMPLEGOAL: DETERMINE AVERAGE LOAD PER CUSTOMER FROM AREPRESENTATIVE SAMPLE
EXPAND SAMPLETO POPULATION
ESTABLISHOBJECTIVES
SAMPLE DESIGNAND SELECTION
DATA COLLECTIONAND PROCESSING
DATA ANALYSISAND APPLICATIONS
RECORDED DATA
65
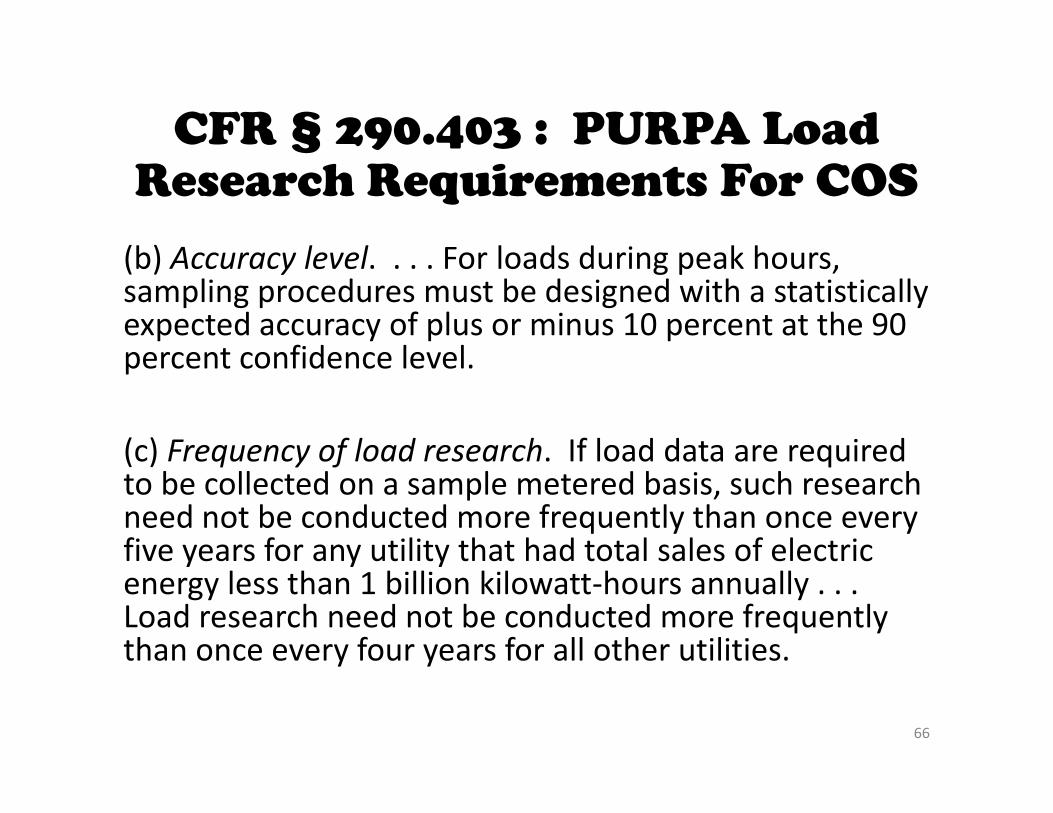
CFR § 290.403 : PURPA Load Research Requirements For COS
(b) Accuracy level. . . . For loads during peak hours, sampling procedures must be designed with a statistically expected accuracy of plus or minus 10 percent at the 90 percent confidence level.
(c) Frequency of load research. If load data are required to be collected on a sample metered basis, such research need not be conducted more frequently than once every five years for any utility that had total sales of electric energy less than 1 billion kilowatt‐hours annually . . . Load research need not be conducted more frequently than once every four years for all other utilities.
66

Sample Statistics
Mean Per Unit
Standard Deviation
Accuracye.g., ±10%
Confidence Intervale.g., 90%
n
iiY
nY
1
1
1
2
n
YYS i
Y
nSY Y 645.1
Y67
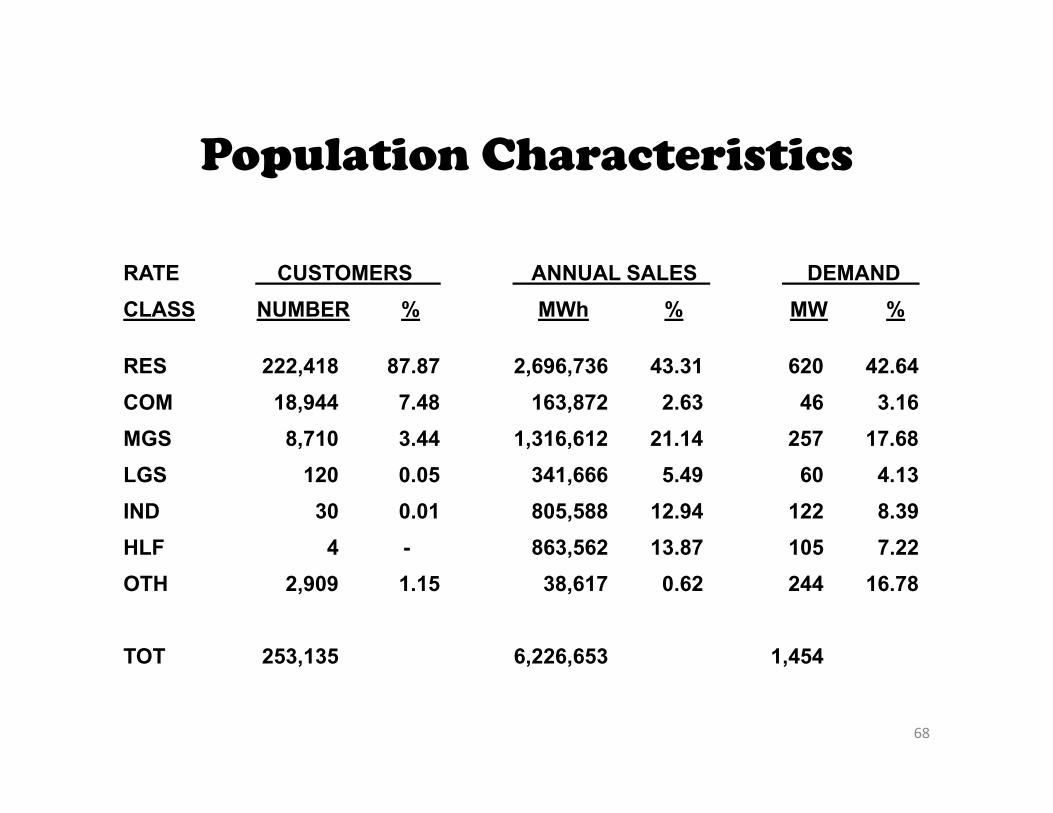
Population Characteristics
RATE CUSTOMERS ANNUAL SALES DEMANDCLASS NUMBER % MWh % MW %
RES 222,418 87.87 2,696,736 43.31 620 42.64COM 18,944 7.48 163,872 2.63 46 3.16MGS 8,710 3.44 1,316,612 21.14 257 17.68LGS 120 0.05 341,666 5.49 60 4.13IND 30 0.01 805,588 12.94 122 8.39HLF 4 - 863,562 13.87 105 7.22OTH 2,909 1.15 38,617 0.62 244 16.78
TOT 253,135 6,226,653 1,454
68

Load Research Sample Sizes
RATE 1979 1981 1983 1985 1987
RES 150 252 240 240 210COM - 30 80 300 350MGS - 120 160 160 160LGS/IND 6 50 70 77 85HLF 4 4 4 4 4
TOT 160 456 554 781 809
69
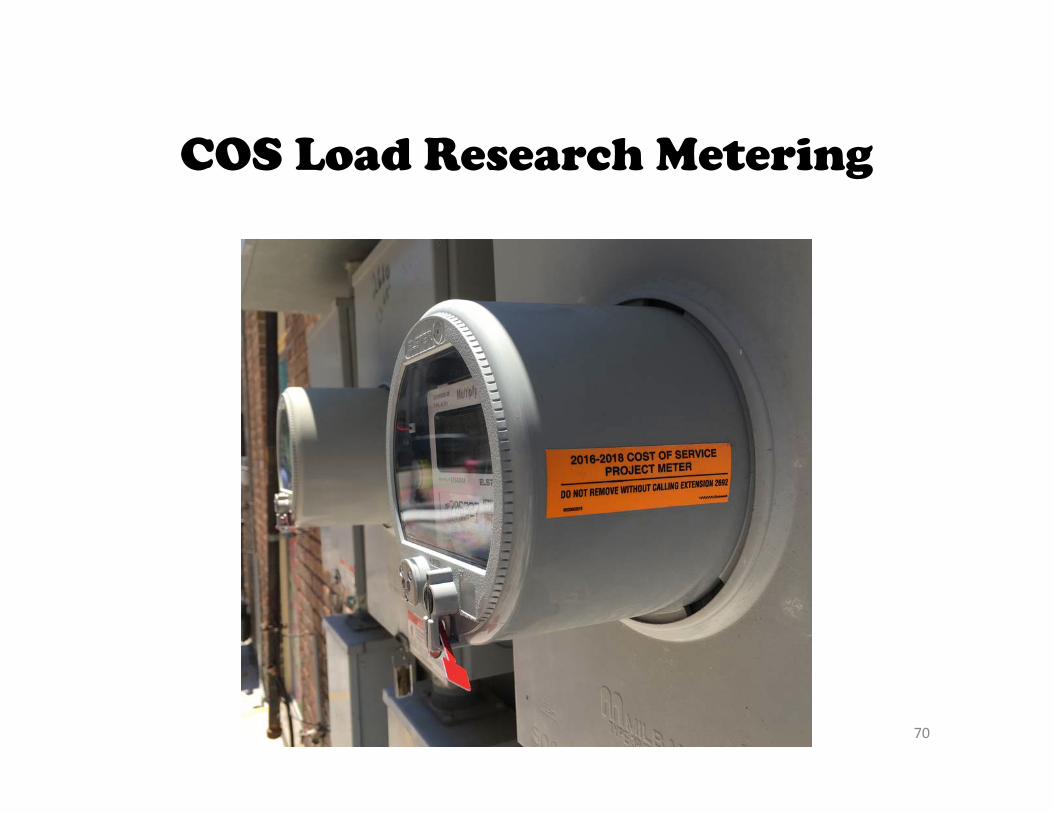
COS Load Research Metering
70

COST OF SERVICE:Study Summarization
71
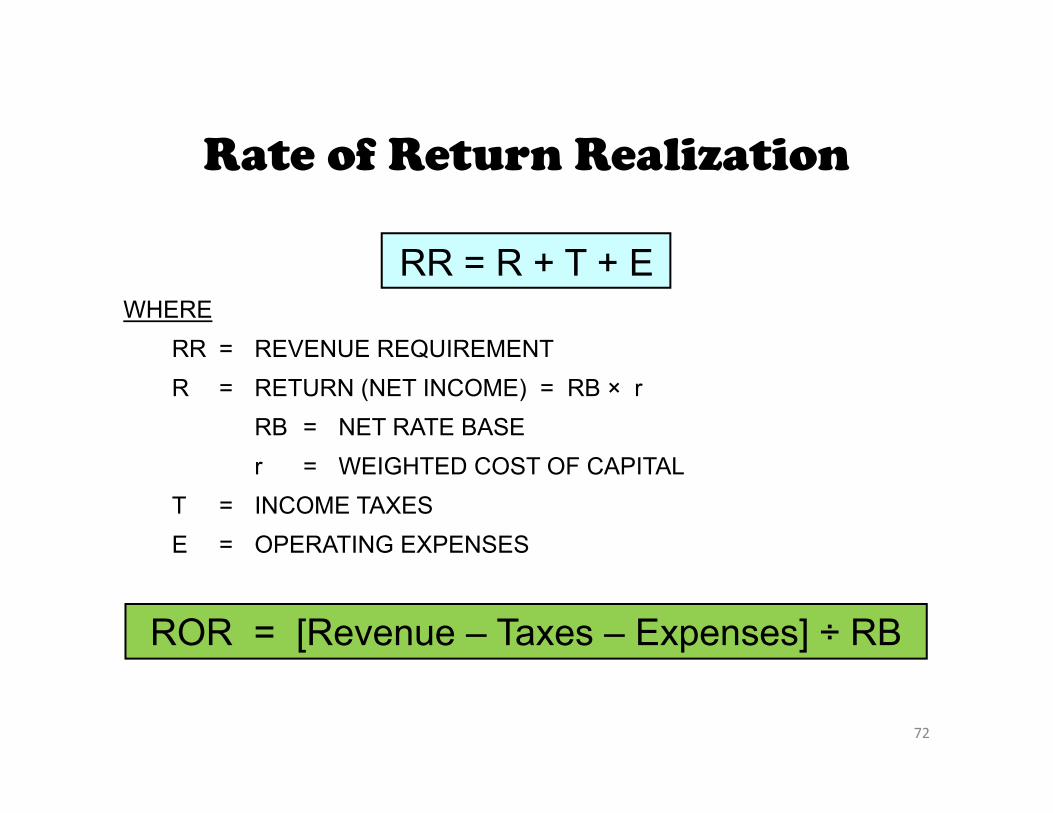
RR = R + T + EWHERE
RR = REVENUE REQUIREMENTR = RETURN (NET INCOME) = RB × r
RB = NET RATE BASEr = WEIGHTED COST OF CAPITAL
T = INCOME TAXESE = OPERATING EXPENSES
Rate of Return Realization
72
ROR = [Revenue – Taxes – Expenses] ÷ RB
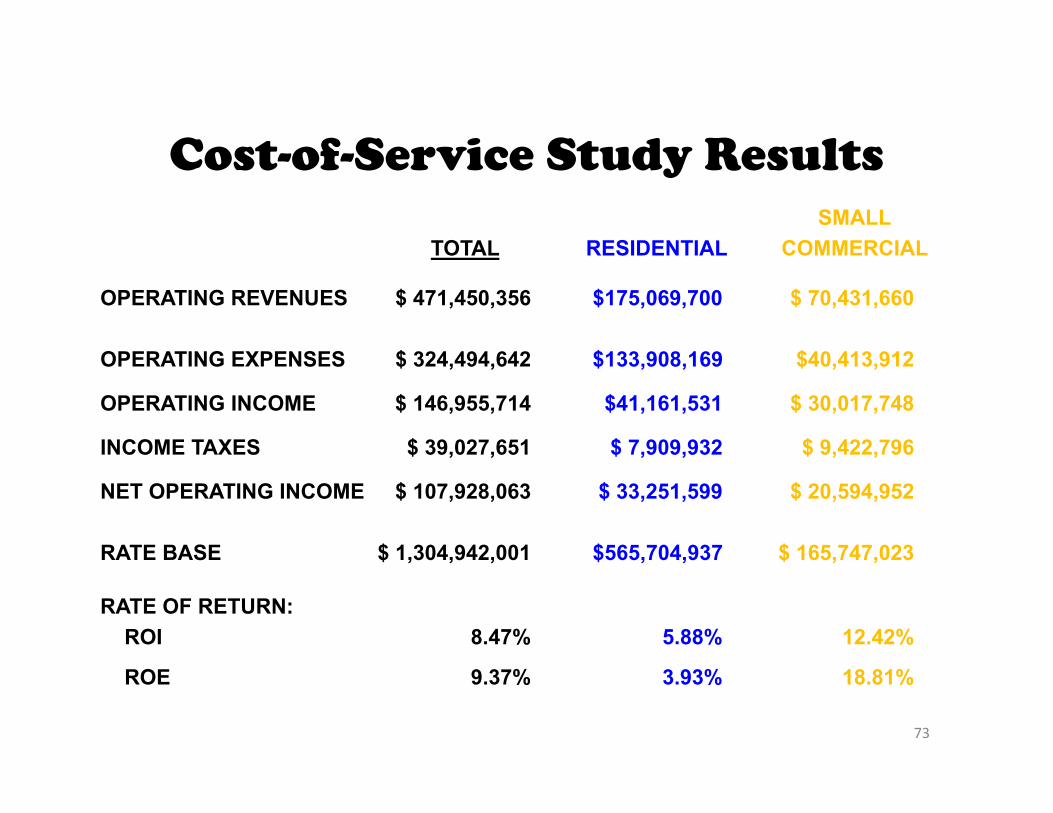
Cost-of-Service Study ResultsSMALL
TOTAL RESIDENTIAL COMMERCIAL
OPERATING REVENUES $ 471,450,356 $175,069,700 $ 70,431,660
OPERATING EXPENSES $ 324,494,642 $133,908,169 $40,413,912
OPERATING INCOME $ 146,955,714 $41,161,531 $ 30,017,748
INCOME TAXES $ 39,027,651 $ 7,909,932 $ 9,422,796
NET OPERATING INCOME $ 107,928,063 $ 33,251,599 $ 20,594,952
RATE BASE $ 1,304,942,001 $565,704,937 $ 165,747,023
RATE OF RETURN:ROI 8.47% 5.88% 12.42%
ROE 9.37% 3.93% 18.81%
73
Initial PURPA Reporting Requirements (circa 1978)
74

Larry Vogt
Q&A
75

Appendix Materials
76
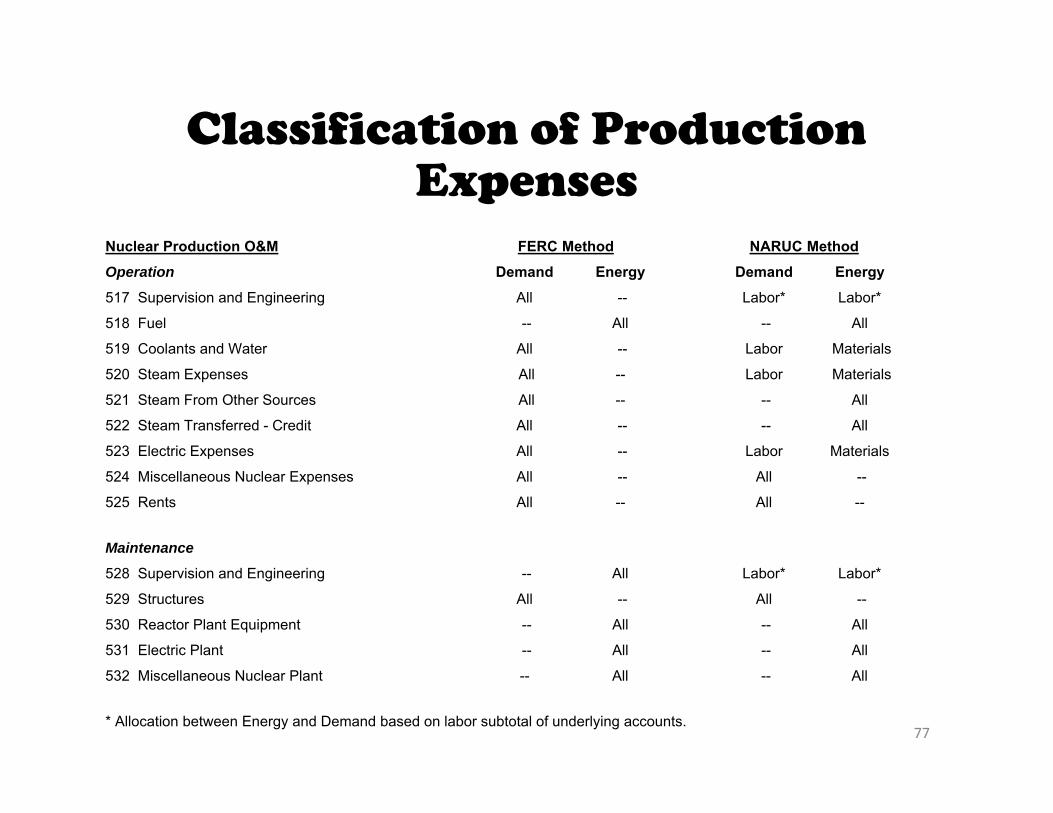
Classification of Production Expenses
Nuclear Production O&M FERC Method NARUC MethodOperation Demand Energy Demand Energy517 Supervision and Engineering All -- Labor* Labor*
518 Fuel -- All -- All
519 Coolants and Water All -- Labor Materials
520 Steam Expenses All -- Labor Materials
521 Steam From Other Sources All -- -- All
522 Steam Transferred - Credit All -- -- All
523 Electric Expenses All -- Labor Materials
524 Miscellaneous Nuclear Expenses All -- All --
525 Rents All -- All --
Maintenance
528 Supervision and Engineering -- All Labor* Labor*
529 Structures All -- All --
530 Reactor Plant Equipment -- All -- All
531 Electric Plant -- All -- All
532 Miscellaneous Nuclear Plant -- All -- All
* Allocation between Energy and Demand based on labor subtotal of underlying accounts. 77
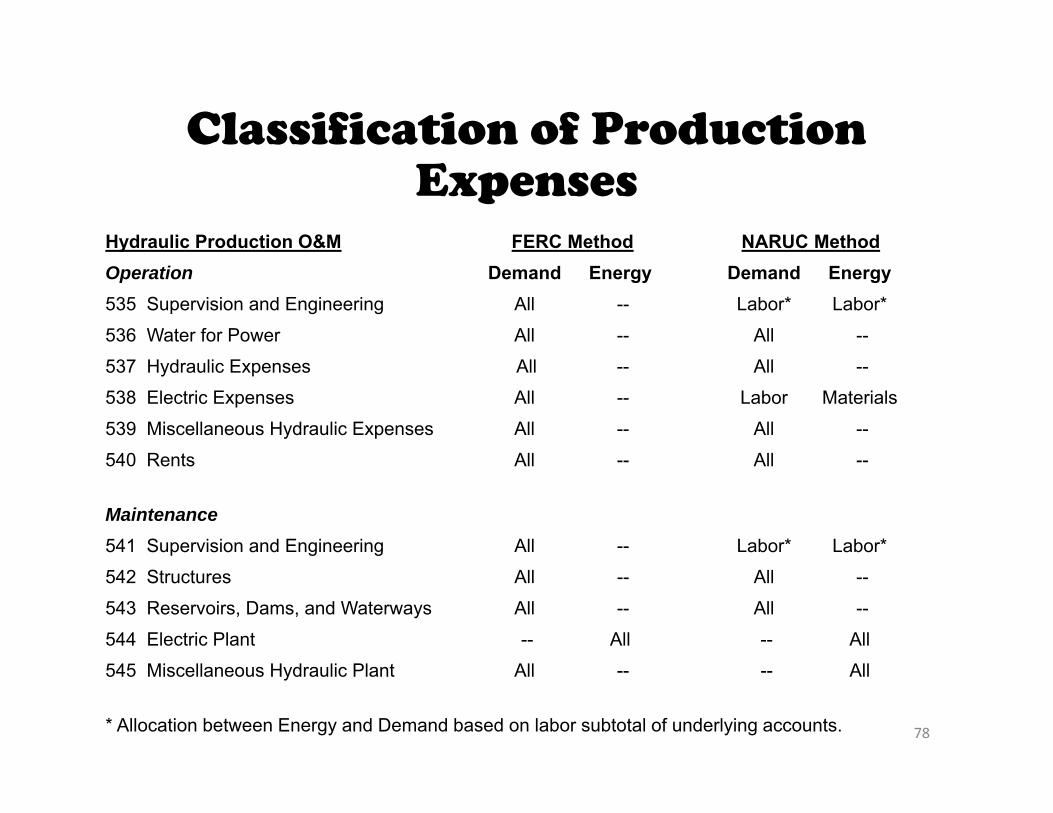
Classification of Production Expenses
Hydraulic Production O&M FERC Method NARUC MethodOperation Demand Energy Demand Energy535 Supervision and Engineering All -- Labor* Labor*536 Water for Power All -- All --537 Hydraulic Expenses All -- All --538 Electric Expenses All -- Labor Materials 539 Miscellaneous Hydraulic Expenses All -- All --540 Rents All -- All --
Maintenance541 Supervision and Engineering All -- Labor* Labor*542 Structures All -- All --543 Reservoirs, Dams, and Waterways All -- All --544 Electric Plant -- All -- All545 Miscellaneous Hydraulic Plant All -- -- All
* Allocation between Energy and Demand based on labor subtotal of underlying accounts. 78
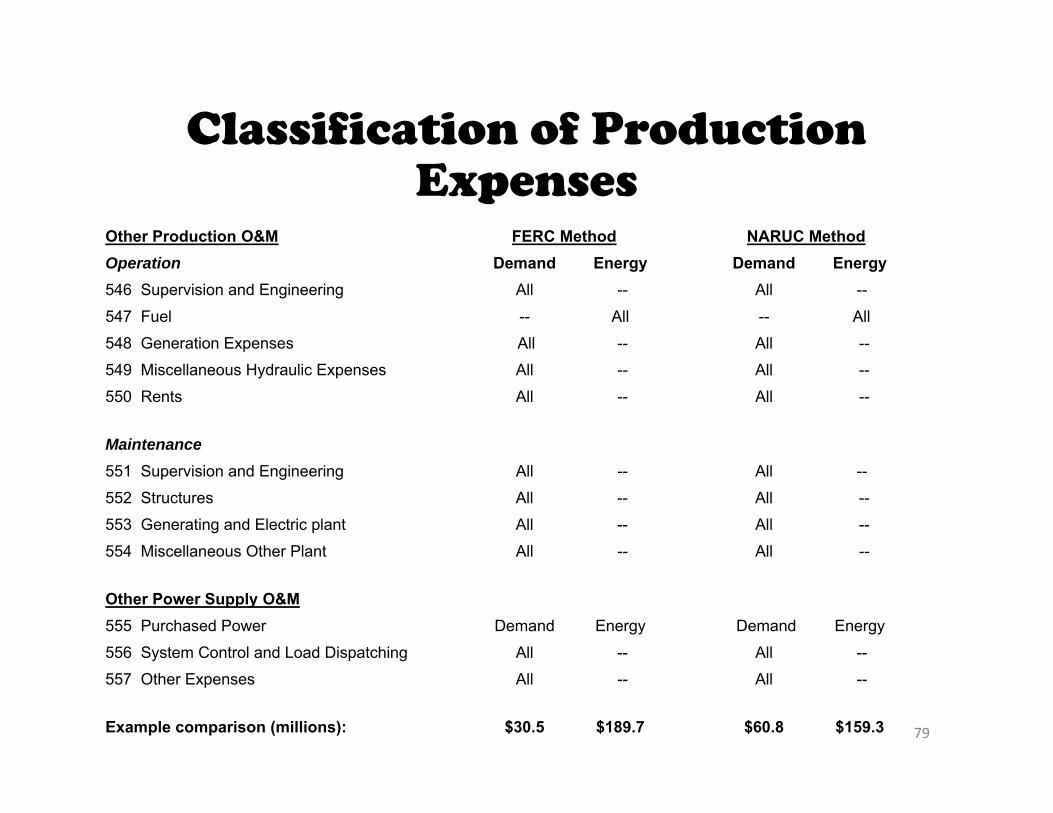
Classification of Production Expenses
Other Production O&M FERC Method NARUC MethodOperation Demand Energy Demand Energy546 Supervision and Engineering All -- All --547 Fuel -- All -- All548 Generation Expenses All -- All --549 Miscellaneous Hydraulic Expenses All -- All --550 Rents All -- All --
Maintenance551 Supervision and Engineering All -- All --552 Structures All -- All --553 Generating and Electric plant All -- All --554 Miscellaneous Other Plant All -- All --
Other Power Supply O&M555 Purchased Power Demand Energy Demand Energy 556 System Control and Load Dispatching All -- All --557 Other Expenses All -- All --
Example comparison (millions): $30.5 $189.7 $60.8 $159.3 79
FERC Demand Test 1
MAX
12-CP
4-CP3-CP
MIN
3 OFF PK 3 OFF PK4 OFF PK 4 OFF PK
MW
Y%
X%Δ% = X% - Y%
80
FERC Demand Test 2
MAX
12-CP
4-CP3-CP
MIN
3 OFF PK 3 OFF PK4 OFF PK 4 OFF PK
MW
81

FERC Demand Test 3
MAX
12-CP
4-CP3-CP
MIN
3 OFF PK 3 OFF PK4 OFF PK 4 OFF PK
MW
82
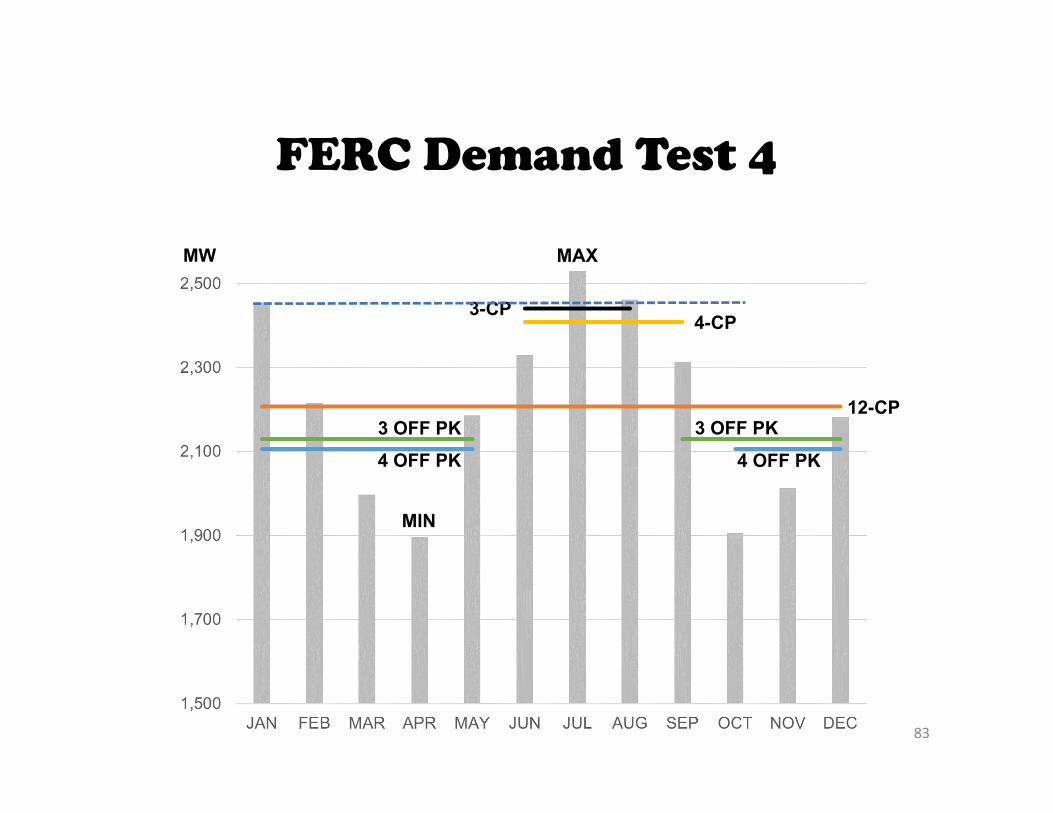
FERC Demand Test 4
MAX
12-CP
4-CP3-CP
MIN
3 OFF PK 3 OFF PK4 OFF PK 4 OFF PK
MW
83