Embed Size (px)
Citation preview
1
ECONOMICS, BARRIERS, AND RISKS OF OIL SHALE DEVELOPMENT IN THE UNITED STATES
Khosrow BiglarbigiHitesh Mohan
Peter CrawfordMarshall Carolus
INTEK, Incorporated
28th USAEE/IAEE North American ConferenceNew Orleans, LA
December 4, 2008

2
America’s Oil Shale
• Resource• Technology• Economics• Environmental• Path Forward
3
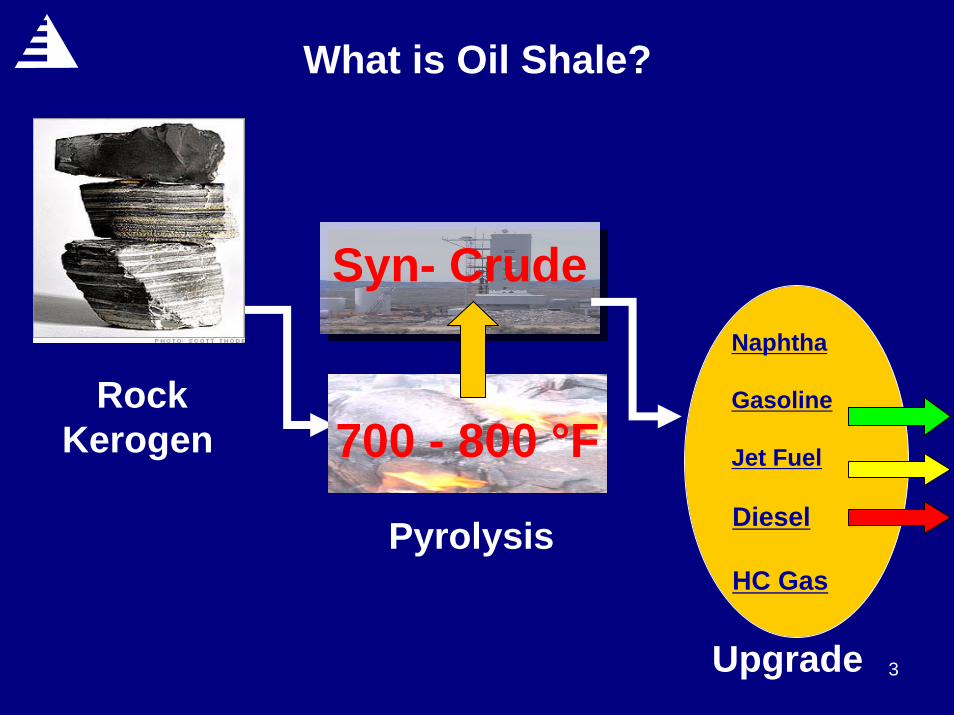
What is Oil Shale?
RockKerogen
Pyrolysis
Upgrade
700 - 800 °F
Syn- CrudeNaphtha
Gasoline
Jet Fuel
Diesel
HC Gas
4
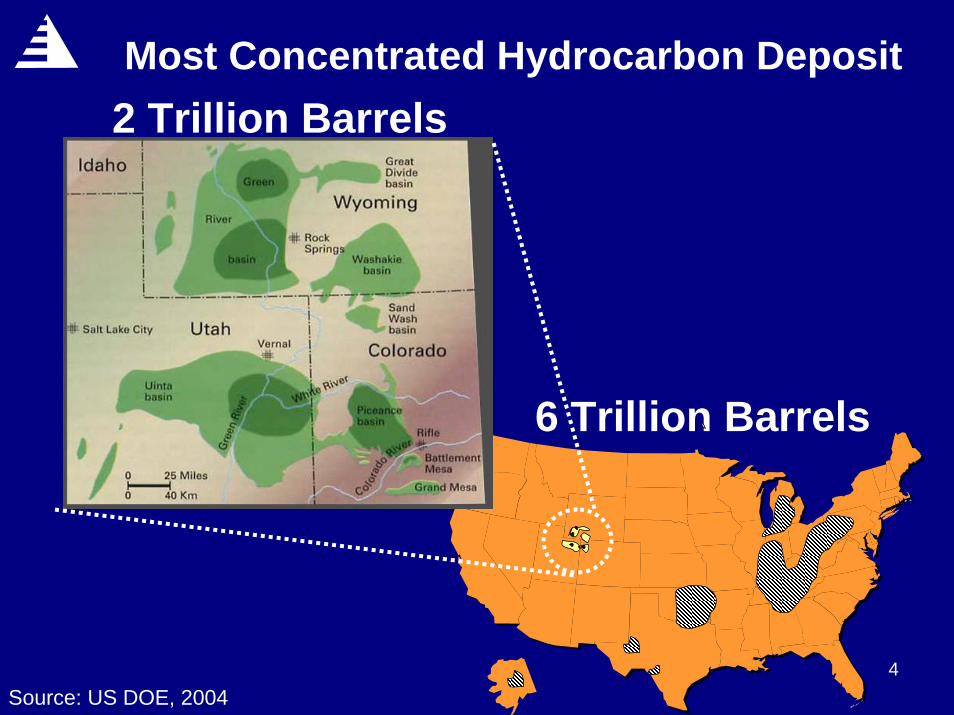
Most Concentrated Hydrocarbon Deposit2 Trillion Barrels
6 Trillion Barrels
Source: US DOE, 2004
5
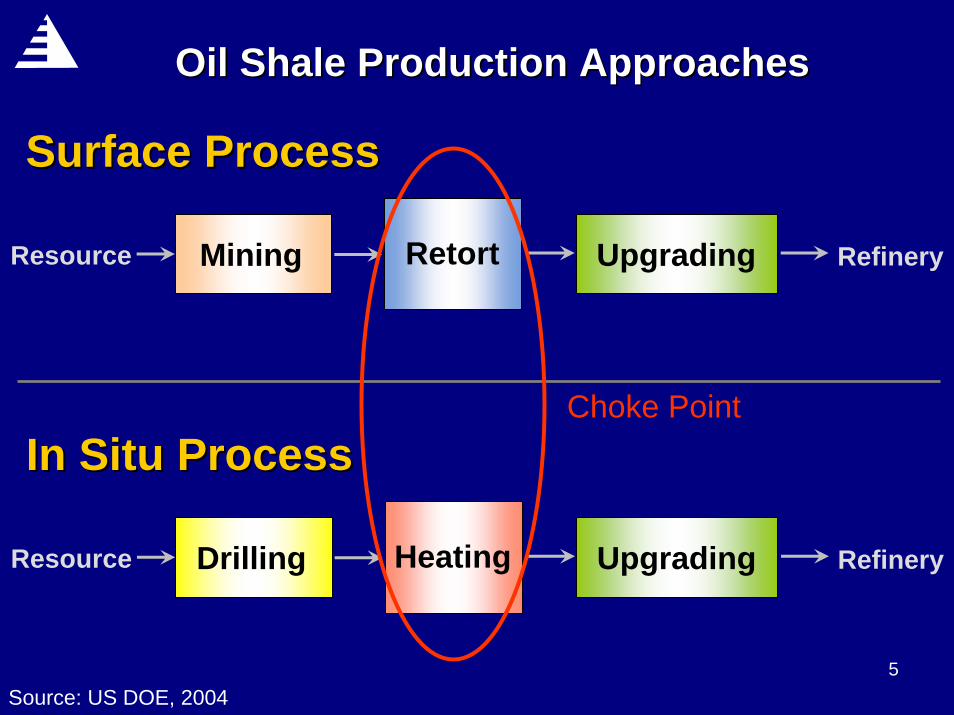
Oil Shale Production ApproachesOil Shale Production Approaches
Mining Retort UpgradingResource Refinery
Surface ProcessSurface Process
Drilling Heating UpgradingResource Refinery
In Situ ProcessIn Situ Process
Source: US DOE, 2004
Choke Point
6
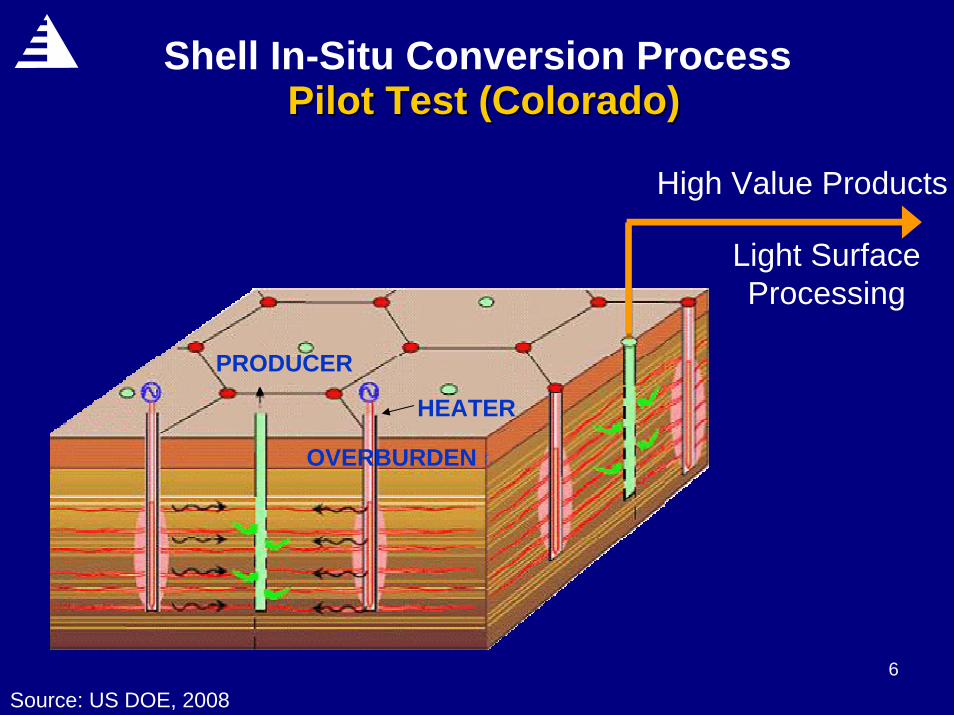
Shell In-Situ Conversion ProcessPilot Test (Colorado)Pilot Test (Colorado)
Source: US DOE, 2008
High Value Products
Light Surface Processing
HEATER
PRODUCER
OVERBURDEN
7
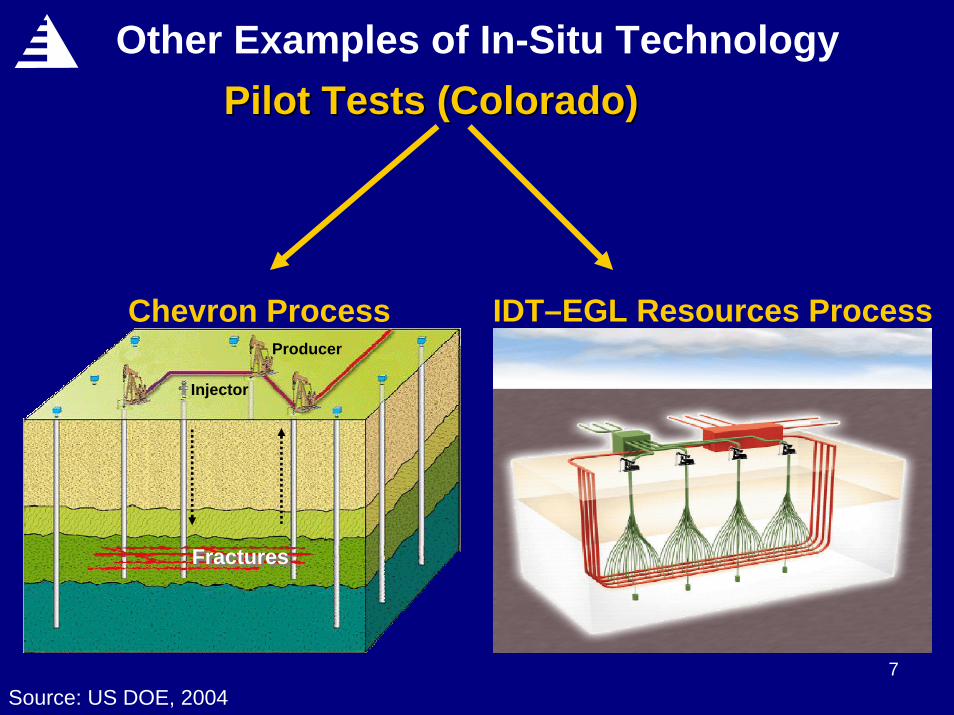
Other Examples of In-Situ TechnologyPilot Tests (Colorado)Pilot Tests (Colorado)
IDT–EGL Resources ProcessChevron Process
FracturesFractures
Injector
Producer
Source: US DOE, 2004
8
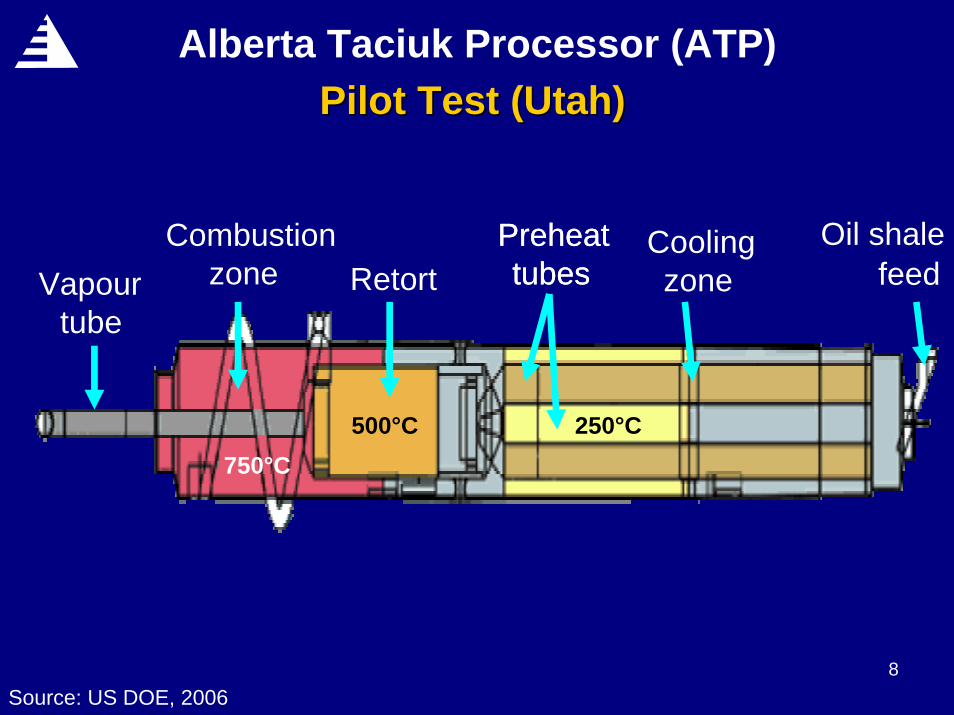
Alberta Taciuk Processor (ATP)Pilot Test (Utah)Pilot Test (Utah)
PreheattubesVapour
tube
Combustionzone Retort
Preheattubes
Coolingzone
Oil shalefeed
750°C500°C 250°C
Source: US DOE, 2006

9
Other Surface Retort Technology
• Gas Combustion Retort (GCR)
• High thermal efficiency
• High retort efficiency
• Present use– Petro-six operating in Brazil– Paraho Process being tested for a
major project abroad
Oil MistExtractors
Raw Shale
Spent Shale
RESIDUE COOLING
COMBUSTION
STRIPPING
PYROLYSIS
PREHEATINGMIST FORMATION
Oil MistExtractors
Raw Shale
Spent Shale
RESIDUE COOLING
COMBUSTION
STRIPPING
PYROLYSIS
PREHEATINGMIST FORMATION
RESIDUE COOLING
COMBUSTION
STRIPPING
PYROLYSIS
PREHEATINGMIST FORMATION
Source: US DOE, 2007
10
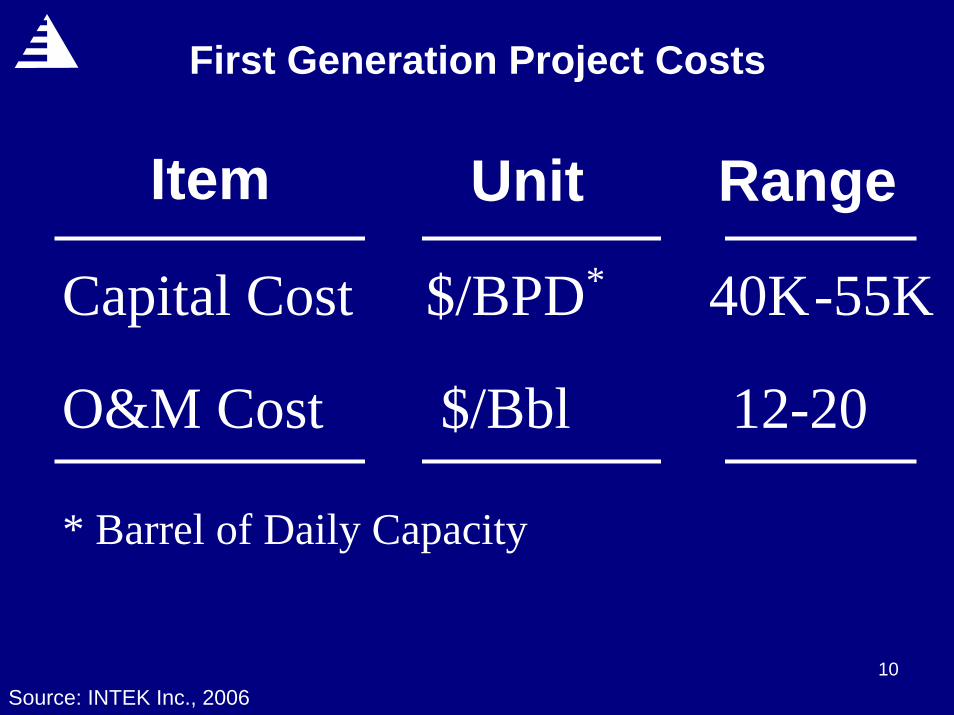
First Generation Project Costs
Item Unit Range
Capital Cost $/BPD
O&M Cost $/Bbl 12-20
40K-55K*
* Barrel of Daily Capacity
Source: INTEK Inc., 2006
11
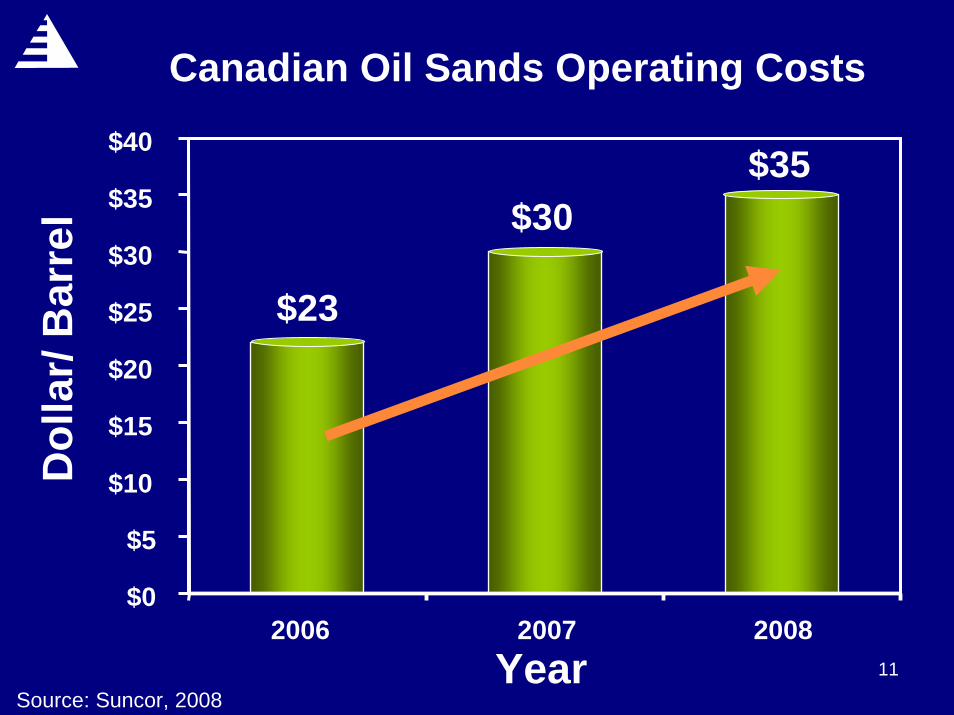
Canadian Oil Sands Operating Costs
Source: Suncor, 2008
$0
$5
$10
$15
$20
$25
$30
$35
$40
2006 2007 2008
$35$30
$23
Dol
lar/
Bar
rel
Year
12
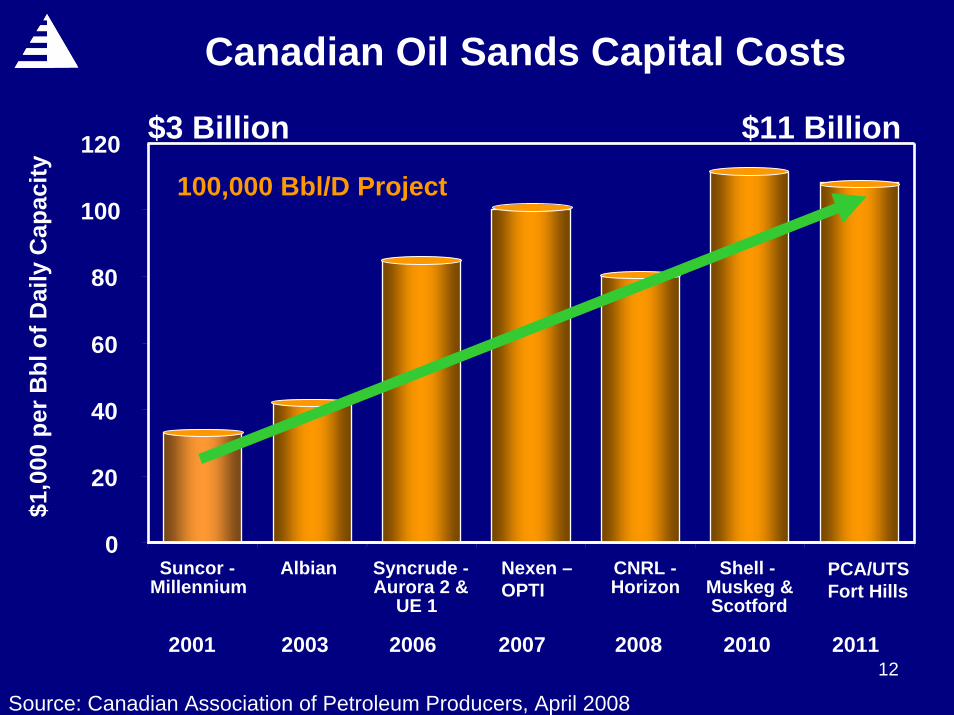
Source: Canadian Association of Petroleum Producers, April 2008
$1,0
00 p
er B
bl o
f Dai
ly C
apac
ity140000
0
20
40
60
80
100
120
Suncor -Millennium
Albian Syncrude -Aurora 2 &
UE 1
Nexen –OPTI
CNRL -Horizon
Shell -Muskeg &Scotford
PCA/UTS Fort Hills
$3 Billion $11 Billion
100,000 Bbl/D Project
2001 2003 2006 2007 2008 2010 2011
Canadian Oil Sands Capital Costs
13
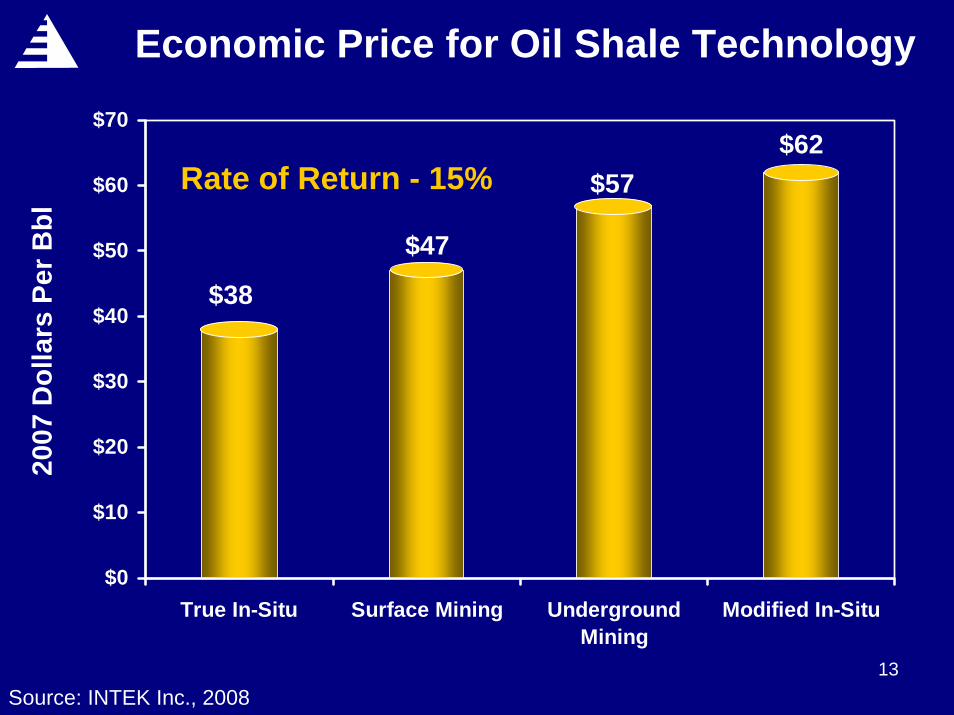
Economic Price for Oil Shale Technology20
07 D
olla
rs P
er B
bl
Source: INTEK Inc., 2008
$0
$10
$20
$30
$40
$50
$60
$70
True In-Situ Surface Mining UndergroundMining
Modified In-Situ
Rate of Return - 15%
$38
$47
$57$62
14
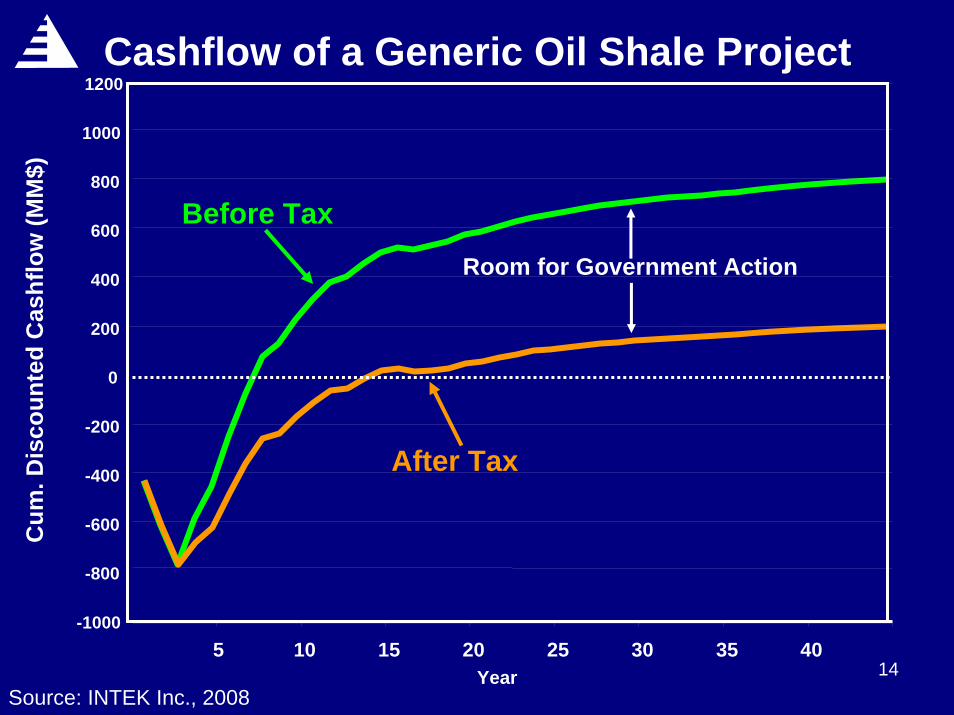
Cashflow of a Generic Oil Shale Project
-1000
-800
-600
-400
-200
0
200
400
600
800
1000
1200
5 10 15 20 25 30 35 40
After Tax
Before Tax
Year
Cum
. Dis
coun
ted
Cas
hflo
w(M
M$)
Room for Government Action
Source: INTEK Inc., 2008
15
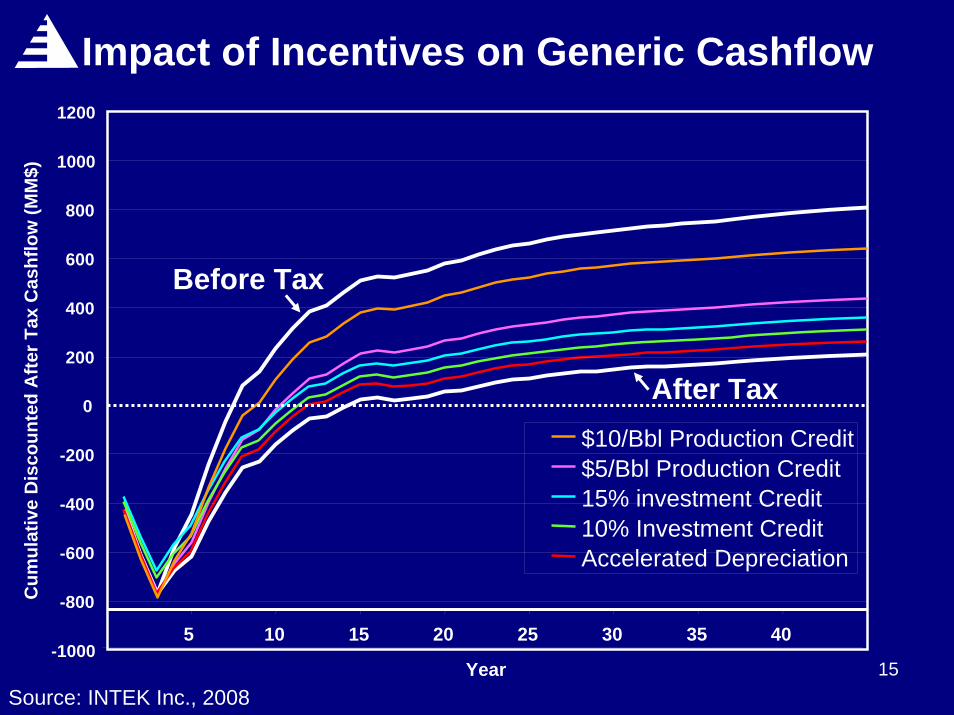
Impact of Incentives on Generic Cashflow
-1000
-800
-600
-400
-200
0
200
400
600
800
1000
1200
5 10 15 20 25 30 35 40
After Tax
Before Tax
Year
Cum
ulat
ive
Dis
coun
ted
Afte
r Tax
Cas
hflo
w (M
M$)
$10/Bbl Production Credit$5/Bbl Production Credit15% investment Credit10% Investment CreditAccelerated Depreciation
Source: INTEK Inc., 2008
16
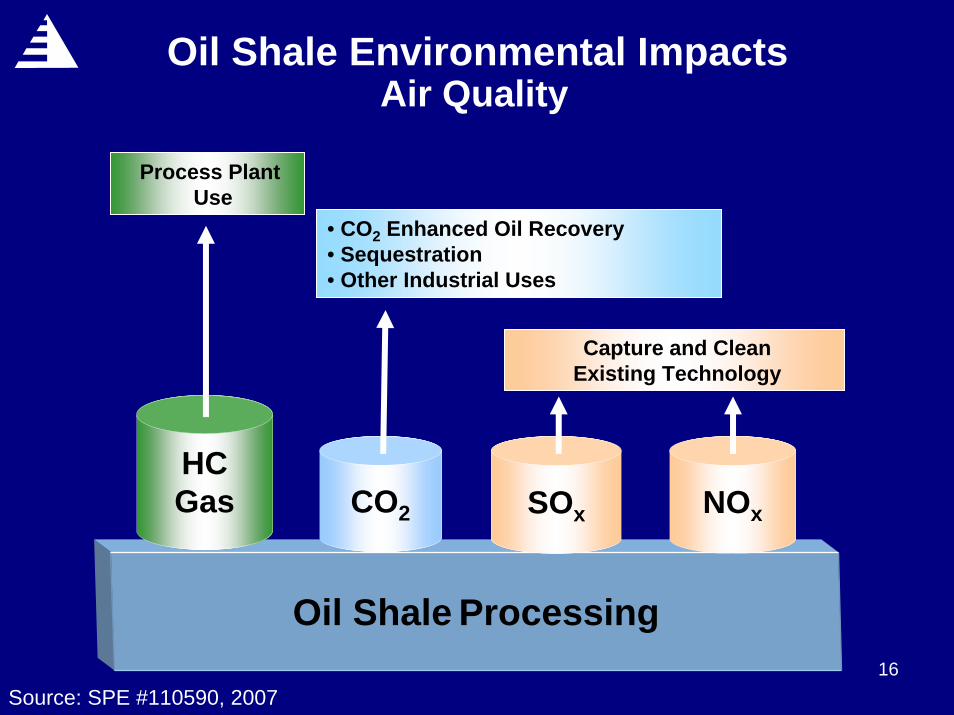
Oil Shale Environmental ImpactsAir Quality
Oil Shale Processing
HCGas CO2 SOx NOx
• CO2 Enhanced Oil Recovery• Sequestration• Other Industrial Uses
Capture and Clean Existing Technology
Process PlantUse
Source: SPE #110590, 2007
17
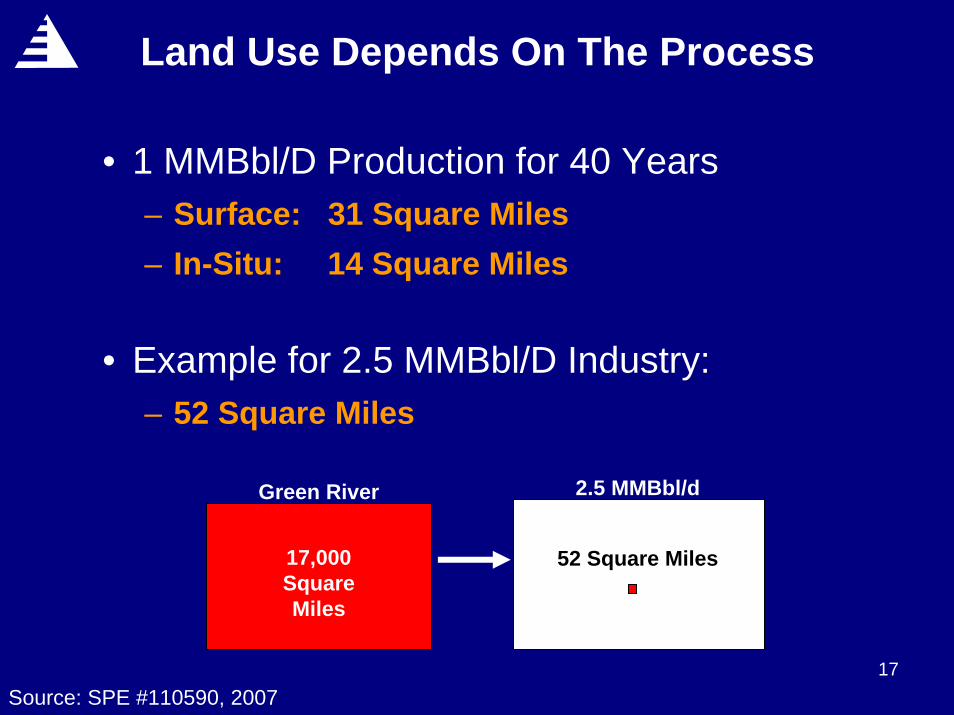
Land Use Depends On The Process
• 1 MMBbl/D Production for 40 Years– Surface: 31 Square Miles– In-Situ: 14 Square Miles
• Example for 2.5 MMBbl/D Industry: – 52 Square Miles
2.5 MMBbl/d
52 Square Miles
Green River
17,000 Square Miles
Source: SPE #110590, 2007
18
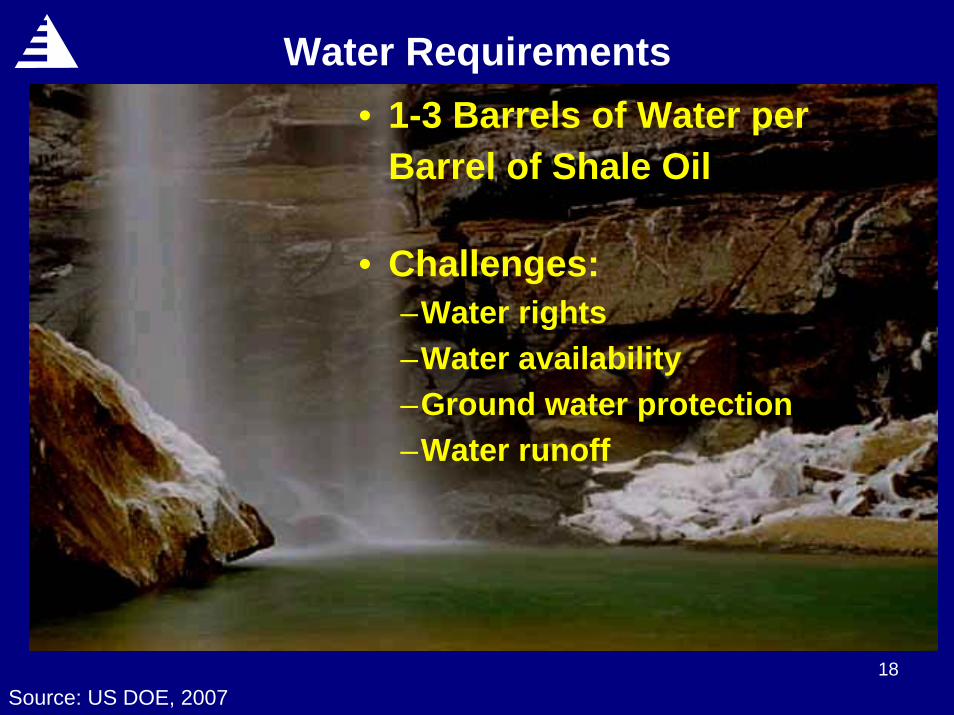
Water Requirements• 1-3 Barrels of Water per
Barrel of Shale Oil
• Challenges:–Water rights–Water availability–Ground water protection–Water runoff
Source: US DOE, 2007
19
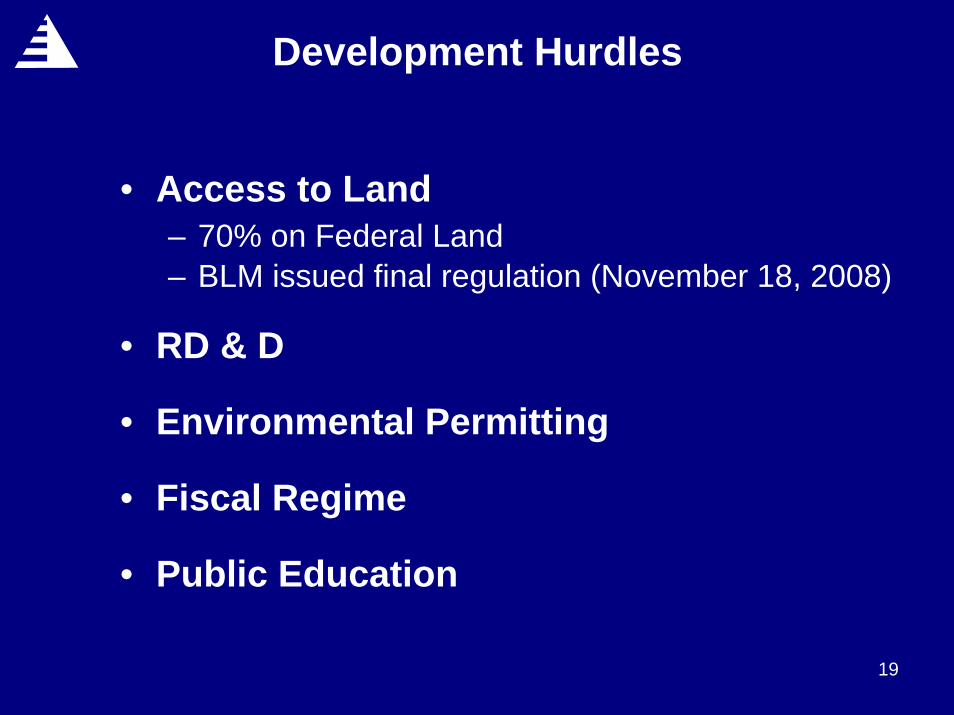
Development Hurdles
• Access to Land– 70% on Federal Land– BLM issued final regulation (November 18, 2008)
• RD & D
• Environmental Permitting
• Fiscal Regime
• Public Education
20
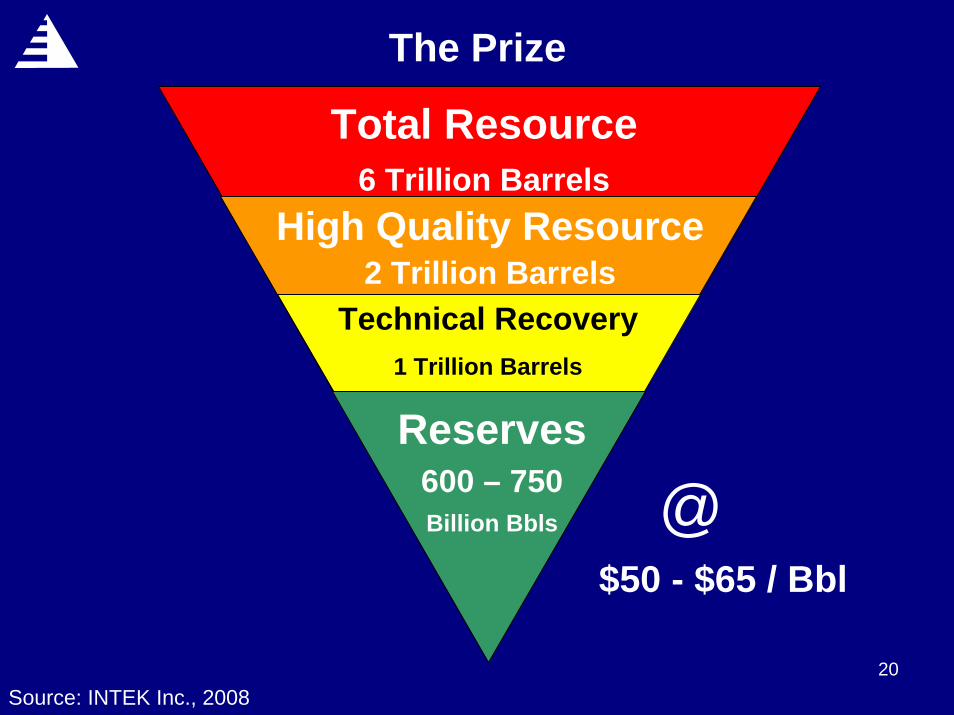
Total Resource6 Trillion Barrels
High Quality Resource2 Trillion Barrels
Technical Recovery1 Trillion Barrels
Reserves600 – 750Billion Bbls
The Prize
$50 - $65 / Bbl@
Source: INTEK Inc., 2008
21
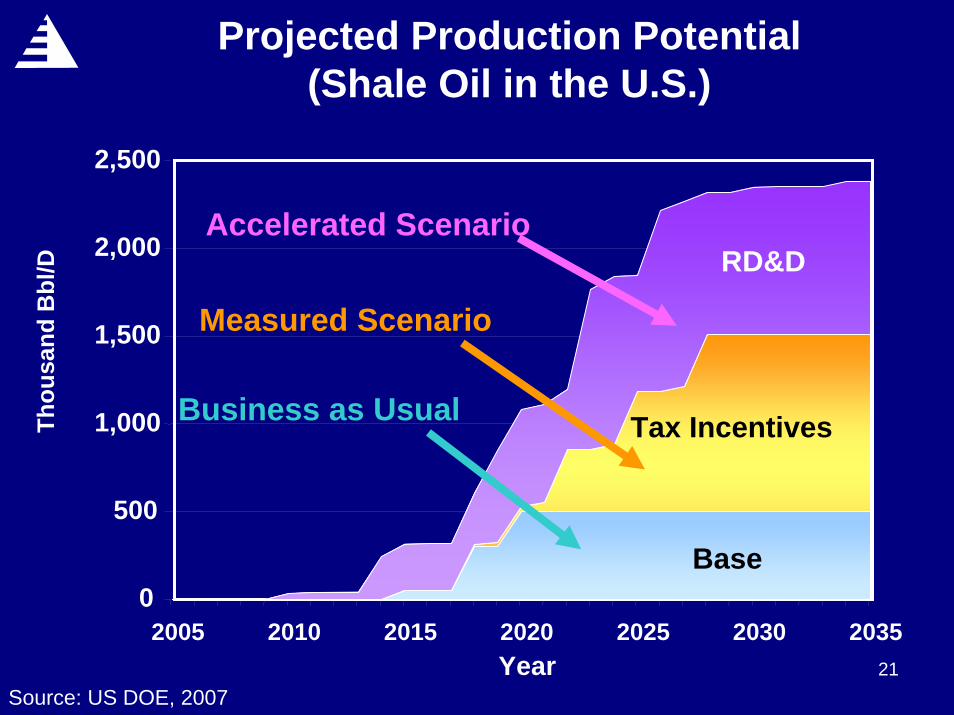
0
500
1,000
1,500
2,000
2,500
2005 2010 2015 2020 2025 2030 2035Year
Thou
sand
Bbl
/DProjected Production Potential
(Shale Oil in the U.S.)
Base
Tax Incentives
RD&DAccelerated Scenario
Measured Scenario
Business as Usual
Source: US DOE, 2007
22
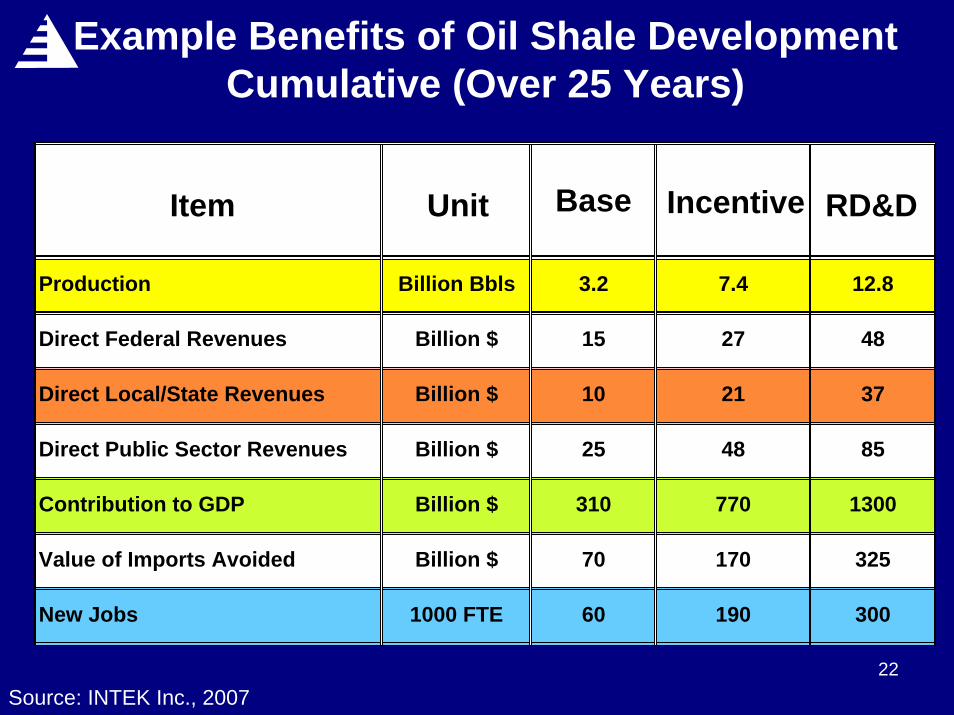
Example Benefits of Oil Shale DevelopmentCumulative (Over 25 Years)
Item RD&D
Direct Public Sector Revenues 85
Value of Imports Avoided 325
Production 12.8
Direct Federal Revenues 48
Direct Local/State Revenues 37
Contribution to GDP 1300
New Jobs 300
Unit Base Incentive
Billion $ 25 48
Billion $ 70 170
Billion Bbls 3.2 7.4
Billion $ 15 27
Billion $ 10 21
Billion $ 310 770
1000 FTE 60 190
Source: INTEK Inc., 2007
23
Summary
• Over 6 trillion barrels of in place resource
• The most concentrated hydrocarbon deposits on Earth
• Conversion technologies are advancing rapidly
• Sustained production potential of up to 2.5 MMBbl/Day
• Substantial economic benefits to the Nation
• Requires concerted effort by the private sector, Federal & State governments, and local communities