Embed Size (px)
Citation preview
Economics Department Discussion Papers Series
ISSN 1473 – 3307
The Influence of Globalization on
Taxes and Social Policy – an Empirical
Analysis for OECD Countries
Axel Dreher
Paper number 03/01
URL: http://business-school.exeter.ac.uk/economics/papers/
The Influence of Globalization on Taxes
and Social Policy – an Empirical
Analysis for OECD Countries*
Axel Dreher§
September 2003
Abstract
Using panel regression for the period 1970-2000 the paper analyzes whether globalization has
influenced the OECD countries’ social and overall spending as well as their implicit tax rates
on labor, consumption and capital. Accounting for potential endogeneity of the regressors, the
results show that globalization (measured by an index covering 23 variables) did not decrease
the leeway for independent economic policy. Globalization even increased implicit tax rates
on capital – a result that is mainly driven by economic integration. Depending on the method
of estimation, increasing social integration also plays a role, while political integration does
not matter for economic policy.
Keywords: globalization, economic policy, government expenditure, social spending,
implicit tax rates, dynamic panel
JEL-Codes: H7, H87, C23
§ University of Exeter, School of Business and Economics, Streatham Court, Rennes Drive, Exeter EX4 4PU, United Kingdom, e-mail: [email protected] * The author is grateful to David Carey for sharing his data on implicit tax rates on labor, capital and consumption.
2
1. Introduction
Critics of globalization often claim that increasing economic integration is responsible
for reduced social spending and a shift in the tax burden from capital to labor. Whether
economic globalization indeed influences policy has been analyzed in numerous empirical
studies. The results, however, are far from being conclusive. According to Swank (2001) and
Adserà and Boix (2002) globalization increases the tax burden while Rodrik (1997) and
Vaubel (1999) show, that globalization goes along with decreased tax revenue. Garrett (1995)
and Heinemann (2000) do not find any significant influence of globalization on revenue.1
Whereas Garrett (1995), Quinn (1997) and Swank (2001) show that globalization leads to
higher corporate taxes, Hansson and Olofsdotter (2003) report the contrary result. The effect
of globalization on social spending is equally disputed: Hicks and Swank (1992) and Vaubel
(1999) report a significantly positive, Swank (2001) as well as Garrett and Mitchell (1999) a
significantly negative relationship.
In the above-mentioned studies, the influence of globalization has been measured by
the extent of capital controls, openness to trade or the amount of foreign direct investment. In
doing so, a possible influence of political integration has been neglected. With rising political
integration, however, transnational enterprises will find it more difficult to circumvent
national regulation. If rising economic integration goes along with more political integration,
these effects could cancel each other out. The estimates of economic integration as reported in
previous studies would then be biased. Similar arguments can be applied to social integration.
Without capital restrictions, competition in taxes and expenditure is more likely the closer the
potential host country’s culture is to that of the source country and the easier it is to exchange
information. This social dimension of globalization could therefore be important for economic
policy as well.
1 Schulze and Ursprung (1999) summarize theoretical and empirical work on this topic.
3
Most previous empirical studies, like those of Garrett (1995), Quinn (1997) and Swank
(2001), proxied the degree of tax competition using tax revenues. However, even if tax rates
are decreasing, an improved economic environment could raise revenues. This would conceal
existing tax competition (Schulze and Ursprung 1999: 316). Simply taking statutory tax rates
instead would not improve the analysis. This is because the tax burden also depends on tax
bases. Since tax-exempt amounts, depreciation rules and other tax benefits differ largely
across countries, even with similar gross incomes tax bases would be different. To account for
this, most recent studies (Bretschger and Hettich 2002, Hansson and Olofsdotter 2003, among
others) employ average effective tax rates. According to this method, which has initially been
suggested by Mendoza, Razin and Tesar (1994), actual tax revenue is expressed in relation to
the tax base causing this revenue. This implicitly accounts for the effects of different tax
benefits. Therefore, I will use such tax rates here.
This article contributes to the literature in testing econometrically the overall influence
of globalization as well as the individual effects of economic, political and social integration
on the OECD countries’ economic policy. It is analyzed whether and to what extent
globalization influences government social and overall spending as well as implicit tax rates
on labor, consumption and capital. For the first time in such analysis, potential endogeneity of
the explanatory variables is accounted for.
In addition to the covariates that are common in the literature, my regression analysis
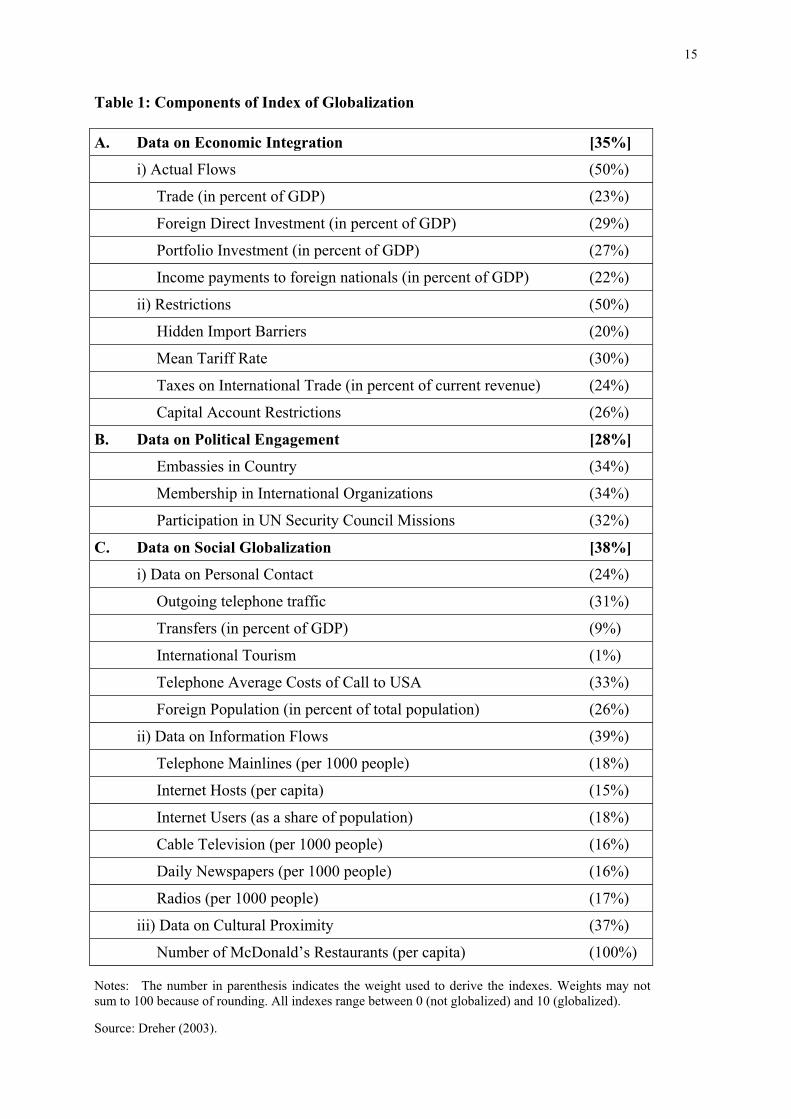
employs an index of globalization and its different components as independent variables. This
index has been developed by Dreher (2003) for 123 countries. It is based on 23 variables that
relate to different dimensions of globalization. The variables have been combined to six
groups: actual flows of trade and investment, restrictions, variables measuring the degree of
political integration, data quantifying the extent of personal contact with people living in
foreign countries, data measuring transborder flows of information and a proxy for cultural
integration. These dimensions have been combined to three sub-indexes and one overall index
4
of globalization with an objective statistical method. Table 1 reports the individual
components. As can be seen, economic, political, and social integration obtained roughly
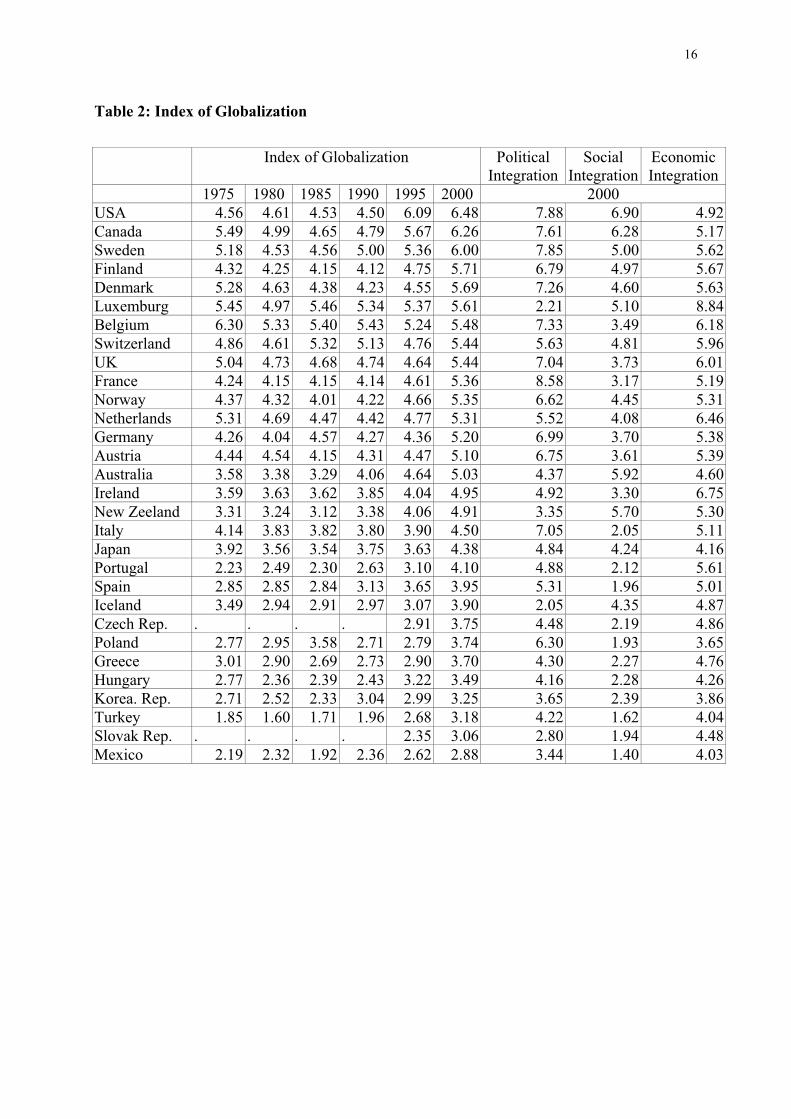
equal weights. Table 2 contains results for the overall index of globalization for the period
1975-2000 as well as the three sub-indexes in 2000.
Employing this proxy, what I find is, basically, that globalization increased average
effective tax rates on capital and did not influence the other policy instruments analyzed in
this study.
The next section discusses potential influences of globalization on economic policy.
Whether increasing integration indeed has an impact on policy is examined in Section 3. To
this end, I present combined time-series cross-section analysis for the last 30 years. The final
section summarizes the results.
2. Potential influences of globalization on economic policy
There are many ways to confine international political competition. While national
restrictions of international transactions have been drastically reduced since the eighties,
agreements among governments – be it in the form of harmonized taxes, be it in the form of
joint standards – became more frequent.2 These developments cannot be judged in isolation.
According to Vaubel (1999: 282) trade liberalization can be explained with politicians’
expectations of (at least in the short run) rising revenue through resulting efficiency gains.
Similarly, liberalization of capital account restrictions potentially improves the allocation.3
With rising presence of foreign suppliers and investors, resistance against barriers to market
entry rise (Peltzman 1989), which enables the reduction of such regulations (Vaubel 1999:
284). The resulting economic integration potentially increases political competition among
2 In the late nineties there have been initiatives to prevent „harmful“ tax competition in the EU as well as in the OECD (Devereux, Lockwood and Redoano 2002: 2). See also European Commission (1998), OECD (1998) and van der Hoek (2003).
3 Tax revenue can, however, decline in capital exporting countries.
5
governments. The more, however, political competition increases, the more governments are
interested in political integration (Vaubel 1990). The dismantling of the above mentioned
restrictions therefore leads to more cooperation in politics, since politicians want to retain
their leeway in economic policy.
The relationship between economic integration and economic policy has been
frequently analyzed in the empirical literature. The (simplified) line of reasoning is as
follows: Higher economic integration induces mobile factors of production to migrate to the
country with the lowest taxes. In order to maintain their tax bases, governments engage in
competition for the lowest tax rates and therefore reduce tax rates on capital („race to the
bottom“). Since, as a consequence, revenues decline the state’s capacity to redistribute is also
lower and expenditures decline as well. The international political competition thus confines
the governments’ scope for spending (disciplining hypothesis). Alternatively, the government
could try to develop new sources of revenue. To this end, the more immobile tax bases are
better suited. One would thus expect that taxes on labor and consumption rise with economic
globalization. Governments could, however, also react to the increasing stress of competition
with increasing political integration. They could prevent competition, for example, with
(unofficial) agreements. They could decide on a minimum tax rate (as has been done in the
EU with VAT rates).
If economic integration indeed fosters political integration, those two dimensions of
globalization might be highly correlated. If political integration – as has been done in all
previous empirical studies – is not accounted for, the estimated effect of globalization
represents the joint effect of both dimensions. Since the effect of the two dimensions could go
in opposite directions, this could result in an insignificant coefficient. If the political effect
exceeds the economic effect, this could also result in the above-mentioned results of Garrett
(1995), Quinn (1997) and Swank (2001). A country’s degree of political integration with the
rest of the world therefore necessarily has to be included in an analysis of economic
6
integration. The same is true for technical and cultural aspects, which policy can influence to
a small extent only. For what is the use to state that „globalization“ is responsible for a
changing economic policy if it is not clear which dimension of globalization accounts for
those changes. As one example, critics of globalization frequently demand to restrict capital
flows. However, restrictions could only reverse the pattern of taxation if free capital flows are
connected to taxes on capital in the first place. Independent of capital account restrictions,
increasing social integration might be responsible for reported influences of globalization on
economic policy. Social integration is probably highly correlated with economic integration
as well. If the coefficients estimated in previous studies mainly reflect technological changes
or increasing cultural proximity instead of measuring the true influence of economic
integration, recommendations derived from those studies are meaningless.
These considerations lead to the following hypotheses: Economic integration induces
tax competition; tax rates on capital decrease, while those on labor and consumption rise.
Total government expenditures decrease, since political competition confines the
governments’ leeway. The same is probably true for social spending. However, social
spending could also rise with globalization if governments expand the welfare state in order to
insure their citizens against the risks of globalization („compensation hypothesis“).
Political integration, on the other hand, can be used to confine competition. Such
integration is therefore likely to increase tax rates, since it is no longer possible to compare
the situation in one country with those in others and exit strategies become less feasible. This
reduced competition could also lead to higher government total and social spending.
In terms of social integration, likely influences are less clear. On the one hand, higher
cultural integration facilitates migration. Differences in tax burdens or expenditure can then
more easily lead to exit. The resulting increased competition should be reflected in lower tax
rates (and therefore lower expenditure). On the other hand, cultural integration can make a
7
country more attractive for foreign investment. This could even increase the governments’
leeway to raise taxes and spending.
The next section analyzes econometrically whether and to what extent the results of
previous studies can be confirmed or invalidated if the analysis does not only account for
economic, but also for political and social integration.
3. Empirical Analysis
In order to test whether and to what extent globalization affected the OECD countries’
economic policy, I estimate combined cross-section time-series regressions. The dependent
variables are total and social spending relative to GDP and average effective tax rates on
labor, consumption and capital.4 All data are averages over five years – they cover the period
1970-2000. Since some of the data are not available for all 30 OECD countries or all periods,
the panel data are unbalanced and the number of observations depends on the choice of
explanatory variables. I found significant fixed country and period effects in all specifications.
However, the coefficients of the country and time effects are not reported in the tables. All
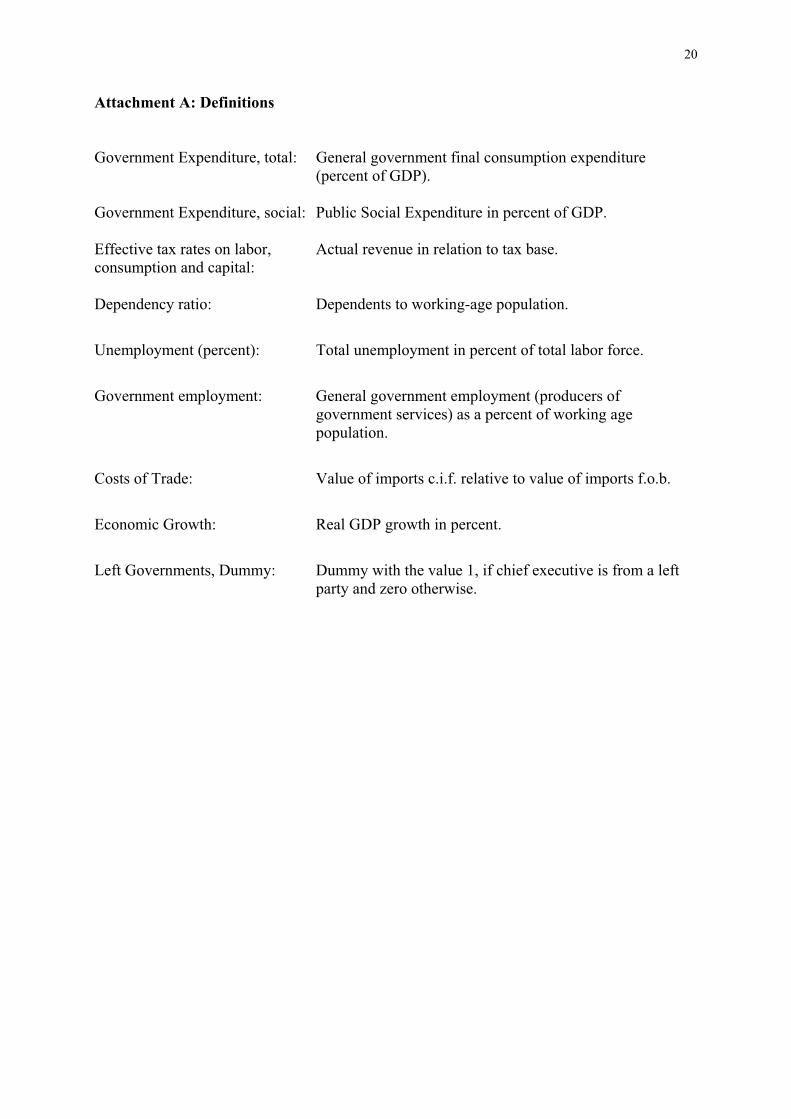
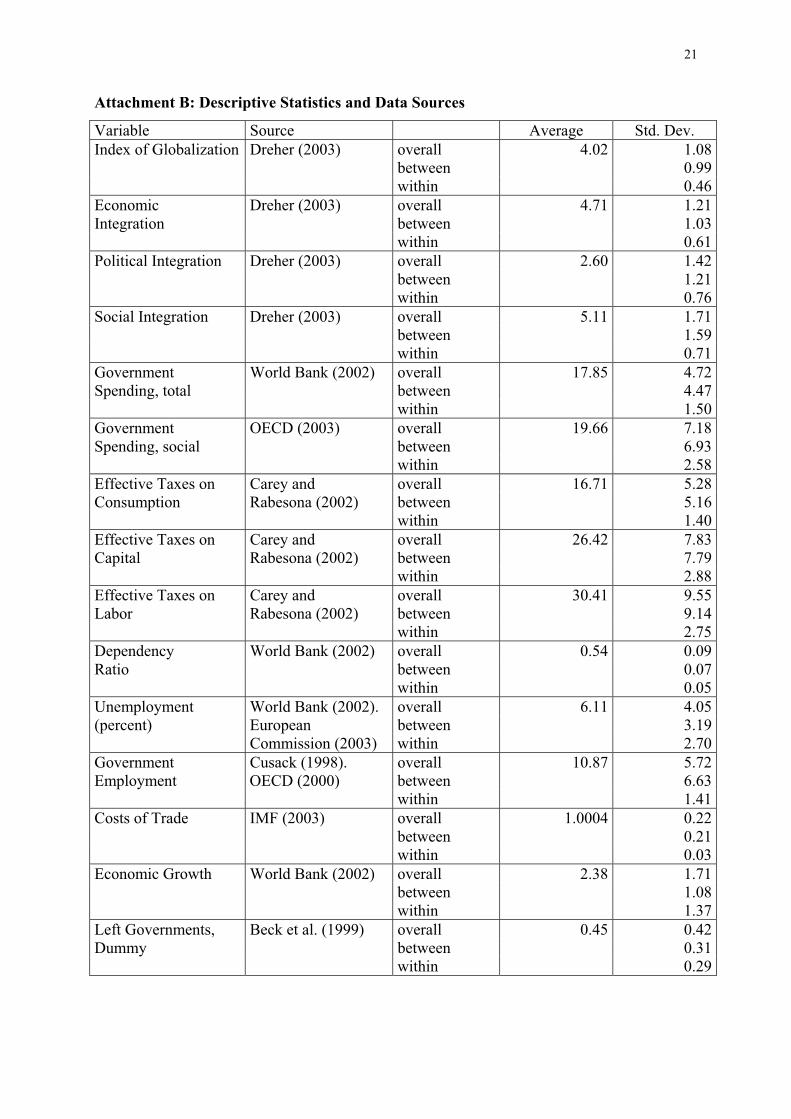
standard errors are estimated robustly. All variables, their precise definitions and data sources
are listed in the appendix.
All regressions contain the same explanatory variables. I start explaining the different
dependent variables with the overall index of globalization. The second equation adds
variables that have been shown to be significant in previous studies: The share of under 15-
year old and over 64-year old people relative to population, the rate of unemployment, the
share of government employees in all employees (Razin, Sadka and Swagel 2002), political
leaning of the government (Vaubel 1999), economic growth and a proxy for the costs of
international trade (Hansson and Olofsdotter 2003).
4 Average effective tax rates are taken from Carey and Rabesona (2002).
8
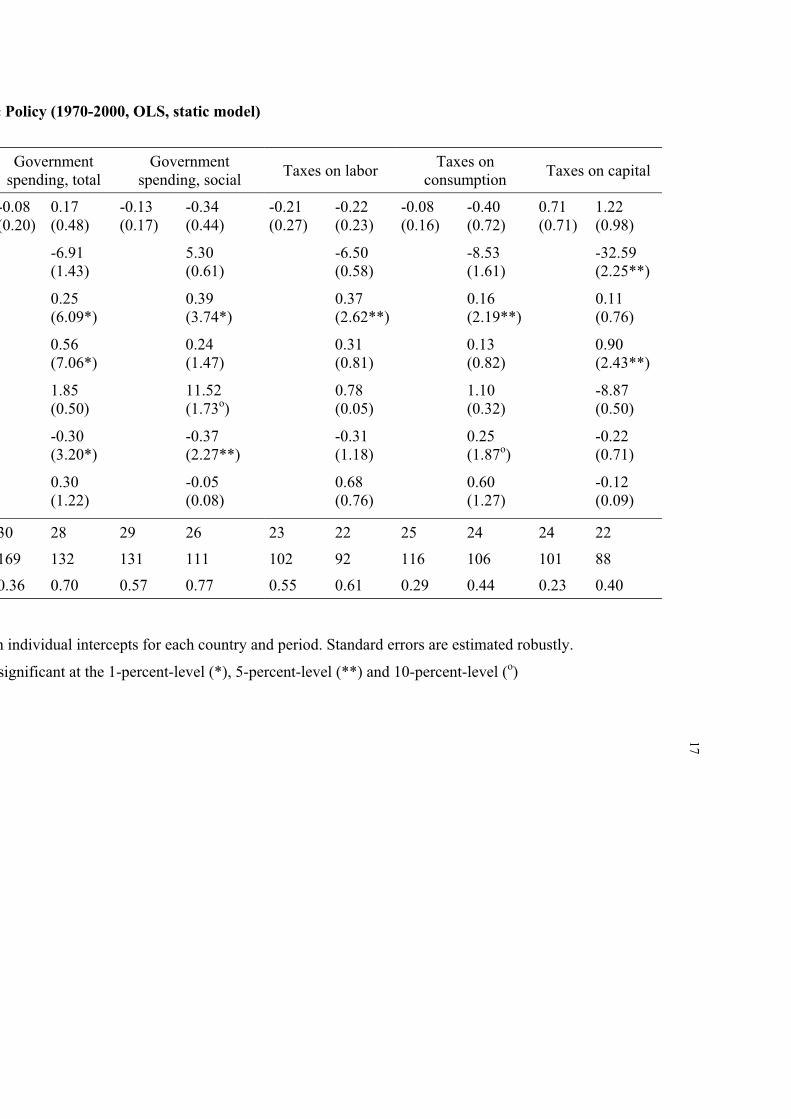
Table 3 reports the results. As can be seen, globalization does not significantly
influence taxes and social policy. The dependency ratio significantly decreases taxes on
capital, although we would expect the contrary: A higher dependency ratio implies that a
smaller group of workers has to support more non-active people – this should raise taxes. The
aging of the population can, however, enforce the aversion against higher taxes, since they
deprive those who are active (Razin, Sadka and Swagel 2002). As was to be expected, higher
unemployment leads to significantly higher government total and social expenditures. Tax
rates on labor and consumption are higher as well (at the five-percent-level of significance). A
greater public sector (as measured by government employees relative to total employees)
increases total government expenses and taxes on capital, with coefficients significant at the
one and, respectively, five percent level of significance.
In order to proxy the costs of international trade, I follow Hansson and Olofsdotter
(2003) who employ imports including costs for insurance and freight relative to imports free
on board. As the results show, this proxy is significant in one regression only (and only at the
ten-percent-level): Higher costs of international trade increase social expenditure relative to
GDP, since they reduce competition among countries.5 Higher economic growth reduces
overall and social expenditure but increases taxes on consumption. These relationships are
significant at the one-, five- and ten-percent level, respectively. While the result for
government expenditure is compatible with that of other authors (Bretschger and Hettich
2002, Hansson and Olofsdotter 2003, among others), the positive coefficient of taxes on
consumption is surprising. The governments’ political leaning is insignificant in all
regressions.
With some of the covariates there is an obvious endogeneity problem: For example, if
higher social spending leads to more (official) unemployment, the rate of unemployment is
endogenous to social spending. The same is true for total government expenditure.
5 See Hansson and Olofsdotter (2003: 4).
9
Endogeneity might even be a problem with respect to globalization. The problem of
endogeneity will be discussed in the context of Arellano-Bond estimation below.
Government spending and taxes change slowly over time instead of being changed
instantaneously. This is because those changes entail some costs (Devereux, Lockwood and
Redoano 2002: 4). Therefore, I also estimate a dynamic model containing the lagged
endogenous variable. Since in the presence of fixed country effects the OLS estimator is
inconsistent, I employ the GMM estimator as suggested by Arellano and Bond (1991) in
addition. This estimator first-differences the estimating equation and uses lags of the
dependent variable from at least two periods earlier as well as lags of the right-hand side
variables as instruments. Since there are more instruments than right-hand side variables, the
equations are over-identified and instruments must be weighted in an appropriate way. I only
present results from the Arellano-Bond one-step estimator, which uses the identity matrix as a
weighting matrix. The two-step estimator weighs the instruments asymptotically efficiently
using the GMM1 estimates. However, in small samples like the one used here, standard errors
tend to be under-estimated by the two-step estimator (Arellano and Bond 1991: 291).
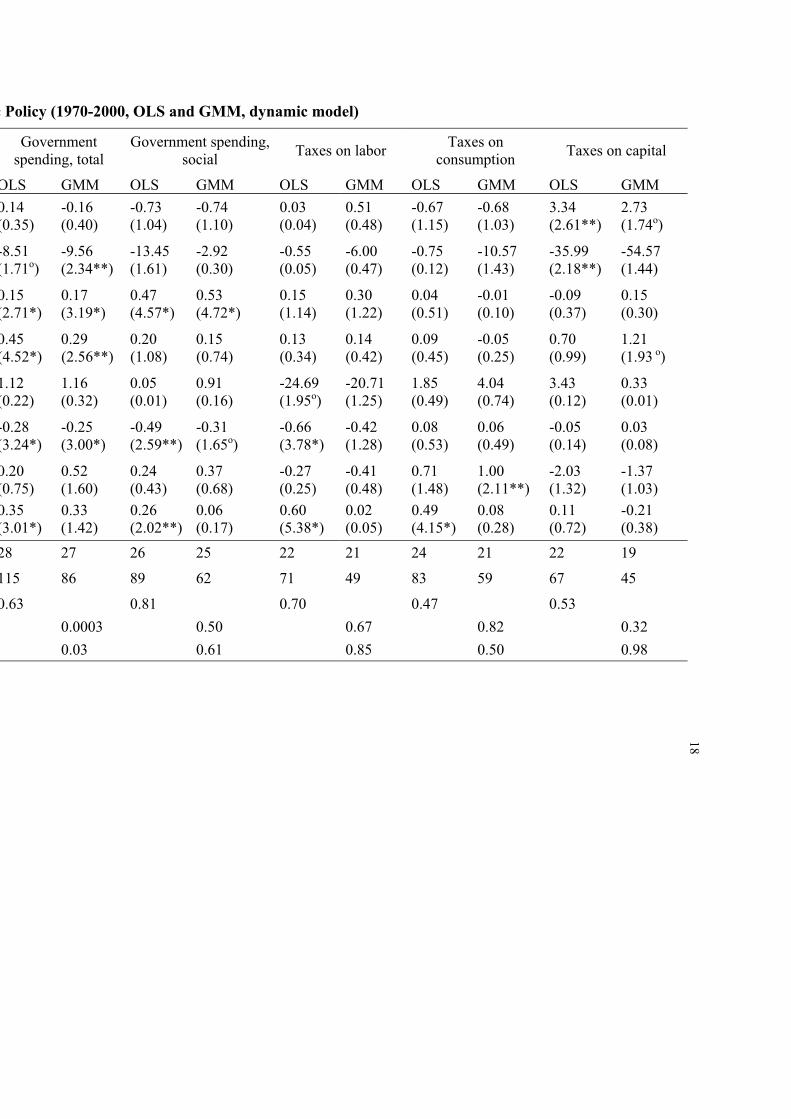
As Table 4 shows, inclusion of the lagged endogenous variable does not change most
of the results. A smaller share of working-age people relative to population now significantly
reduces total government spending. While the Arellano-Bond test of second-order
autocorrelation accepts the specification at the one percent level, the Sargan-test rejects the
overidentifying restrictions in the regression explaining overall government expenditure.
Therefore, I performed estimations treating all right-hand side variables as predetermined
instead of strictly exogenous (not reported in the table). The results are unchanged (and both
specification tests now accept the instruments). Unemployment does no longer significantly
influence taxes on labor and capital. In the OLS-regression, higher economic growth
significantly reduces taxes on labor, while taxes on consumption no longer depend on growth
if the lagged endogenous variable is taken into account. The results also show that taxes on
10
consumption are higher if a left government holds office. This relationship is significant at the
five-percent-level in the GMM regression. The lagged endogenous variable is significant in
most OLS specifications and always insignificant when estimated with GMM.
Most important, the results with respect to the index of globalization are in most cases
unchanged. This gives rise to the conclusion that the globalization of the last 30 years did not
have a major influence on tax rates end expenditure policy in OECD countries. The only
exception is tax rates on capital. These tax rates did, however, not decrease with globalization
but increased instead.6 This effect is significant at the five-percent-level in the OLS
regression. It is still significant at the ten-percent-level when estimated with GMM. The
results show that tax rates on capital rise by about three percentage points with an increase in
the index by one point. Since the index of globalization is scaled arbitrarily, it is not sensible
to interpret the absolute magnitudes of the coefficients. However, according to the estimates
the increasing integration of Canada with the rest of the world from 1985 to 1995 or
Norway’s from 1980 to 2000 is responsible for an increase in average effective tax rates on
capital of about three percentage points each.7 This leads to the conclusion that there has been
no erosion in tax rates on capital following globalization.
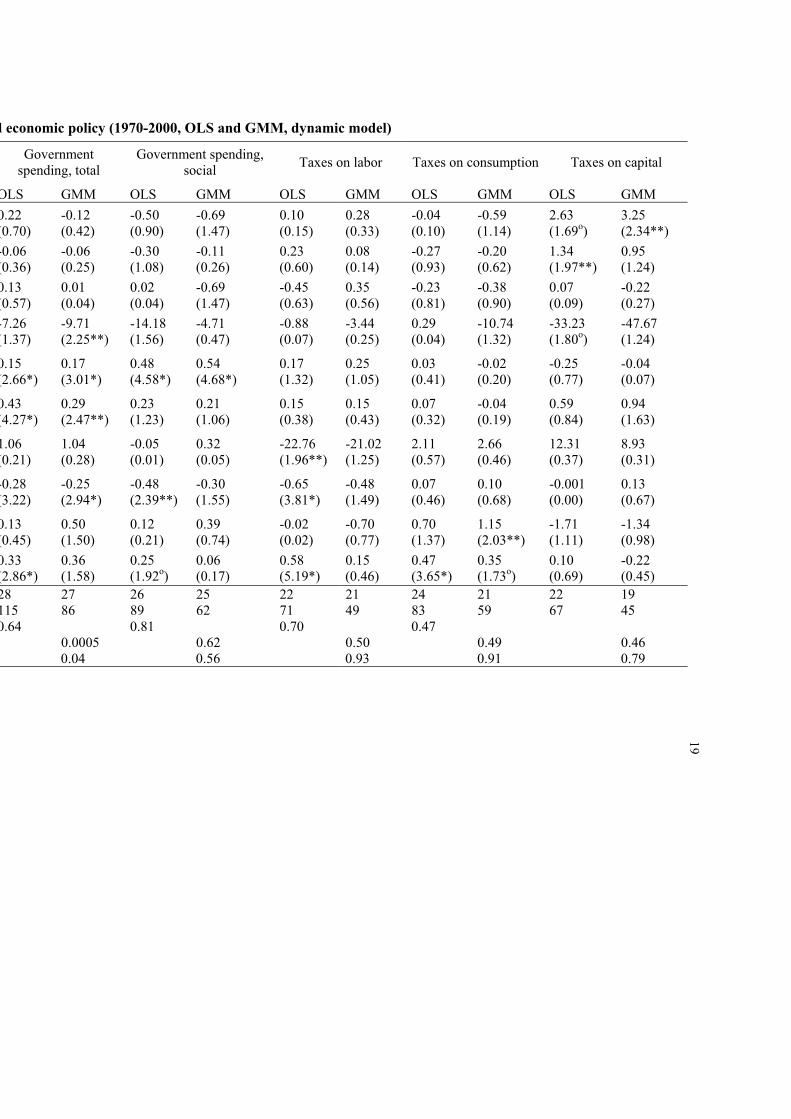
In what follows, I assess which dimensions of globalization are responsible for the
derived relationship and whether individual sub-indexes have a significant influence in spite
of the overall insignificance. Instead of the overall index of globalization the three sub-
indexes are included in the regressions. Table 5 reports the results. As can be seen, the
disaggregated analysis confirms the previous estimates: In almost all cases the coefficients of
the globalization variables are completely insignificant. Again, the tax rate on capital is the
only exception. The results show that economic integration increases these taxes, with a
6 This result is compatible with Devereux, Lockwood and Redoano (2002) who show that a county’s openness increases average tax rates on several classes of investment. It is contrary to Genschel (2001) who argues that the increasing tax competition due to globalization considerably decreased governments’ leeway for independent policy. Although Genschel concedes that taxes on capital did on average not decrease he claims they would
11
coefficient significant at the ten percent level of significance when estimated with OLS and,
respectively, the five percent level in the GMM estimation. The influence of social integration
is less clear. In the within-groups specification, the relationship is positive and significant at
the five-percent-level. Social integration seems to increase a country’s attractiveness, which
increases leeway for increasing taxes. When estimated with GMM, however, the coefficient
looses its significance. The results also show that political integration does not matter for
economic policy.
4. Summary
Globalization has been highly criticized as being responsible for a shift in tax burden
from mobile capital to immobile labor. Critics also claim that although the OECD countries’
actual spending did on average increase over the last 30 years, spending (and taxes on capital)
would be higher without globalization, because the economic environment deteriorated since
the seventies.
This paper did not make specific policy recommendations. Instead it tested whether,
overall, globalization has the effects its critics claim. It analyzed the influence of globalization
on the OECD countries’ tax and expenditure policies in the last 30 years. Contrary to previous
studies, the analysis not only took economic but also social and cultural integration explicitly
into account. For the first time in such analysis, potential endogeneity of the regressors has
been allowed for.
The results show that only average effective tax rates on capital have been influenced
by globalization. Contrary to the a priori hypothesis, however, these tax rates did not decrease
with globalization but increased instead.
nevertheless be higher without integration, since the economic environment deteriorated. My analysis refutes this conjecture since it controls for the economic environment.
7 In fact, the increase has been 7.69 and, respectively, 0.61 percentage points.
12
References
Adserà, A. and C. Boix (2002), „Trade, Democracy and the Size of the Public Sector: The
Political Underpinnings of Openness“, International Organization 56: 229-262.
Arellano, Manuel and Stephen Bond (1991), “Some Tests of Specification for Panel Data:
Monte Carlo Evidence and an Application to Employment Equations”, Review of
Economic Studies 58: 277-297.
Beck, Thorsten, Asli Demirgüç-Kunt and Ross Levine (1999), A New Database on Financial
Development and Structure.
Bretschger, Lucas and Frank Hettich (2002), Globalisation, Capital Mobility and Tax
Competition: Theory and Evidence for OECD Countries, European Journal of
Political Economy 18: 695-716.
Carey, David and Rabesona, Josette (2002), “Tax Ratios on Labour and Capital Income and
on Consumption”, OECD Economic Studies 35.
Cusack, T.R. (1998), Data on Public Employment and Wages for 21 OECD countries,
mimeo, Science Center Berlin.
Devereux, Michael P., Ben Lockwood and Michaela Redoano, “Do Countries Compete over
Corporate Tax Rates?”, mimeo, University of Warwick.
Dreher, Axel (2003), Does Globalization Affect Growth?, mimeo, University of Mannheim.
European Commission (1998), Conclusions of the ECOFIN council meeting on 1 December
1997 concerning taxation policy, Official Journal C 002(01): 001-006.
European Commission (2003), AMECO database.
Garrett, Geoffrey (1995), “Capital Mobility, Trade and the Domestic Politics of Economic
Policy”, International Organization 49: 657-687.
Garrett, Geoffrey and Deborah Mitchell (1999), “Globalization and the Welfare State”,
mimeo, Yale university.
13
Genschel, Philipp (2002), “Globalization, Tax Competition and the Welfare State”, Politics &
Society 30, 2: 245-275.
Hansson, Åsa and Karin Olofsdotter (2003), The Effects of Tax Competition and New
Economic Geography on Taxation in OECD Countries, mimeo, Land University.
Heinemann, Friedrich (2000), Does Globalization Restrict Budgetary Autonomy? A
Multidimensional Approach, Intereconomics 35, 6: 288-298.
Hicks, A.M. and Duane H. Swank (1992), “Politics, Institutions, and Welfare Spending in
Industrialized Democracies, 1960-82”, American Political Science Review 86: 658-
674.
Hoek, Peter M. van der (2003), “Tax Harmonization and Competition in the European
Union”, eJournal of Tax Research 1, 1: 19-36.
International Monetary Fund (2003), International Financial Statistics Indicators, CD-Rom,
June.
Mendoza, E., Razin, A. and L. Tesar (1994), “Effective Tax Rates in Macroeconomics: Cross-
Country Estimates of Tax Rates on Factor Income and Consumption”, Journal of
Monetary Economics 45: 46-68.
Peltzman, Sam (1989), “The Economic Theory of Regulation after a Decade of
Deregulation”, Brookings Papers on Economic Activity, Microeconomics: 1-59.
OECD (1998), Harmful Tax Competition: An Emerging Global Issue, Paris.
OECD (2000), Summary of the PSPE Data Analysis and Future Direction for HRM Data
Collection, mimeo, PUMA/HRM(2000)/7.
OECD (2003), Statistical Compendium, CD-Rom.
Quinn, Dennis (1997), “The Correlates of Change in International Financial Regulation”,
American Political Science Review 91, 3: 531-552.
Razin, Assaf, Efraim Sadka and Phillip Swagel (2002), “Tax Burden and Migration: A
Political Economy Theory and Evidence”, Journal of Public Economics 85: 167-190.
14
Rodrik, Dani (1997), “Has Globalization Gone too Far?”, Washington, Institute for
International Economics.
Schulze, Günther and Heinrich W. Ursprung (1999), “Globalisation of the Economy and the
Nation State”, The World Economy 22:3: 295–352.
Swank, Duane H. (2001), “Mobile Capital, Democratic Institutions, and the Public Economy
in Advanced Industrial Societies”, Journal of Comparative Policy Analysis 3: 133-
162.
Vaubel, Roland (1990), “Wohlfahrtsgewinne durch international organisierte
Wirtschaftspolitik?”, Koreferat, in: E. Kantzenbach (Hrsg.), Probleme der
internationalen Koordination der Wirtschaftspolitik, Berlin: 71-77.
Vaubel, Roland (1999), “Internationaler Politischer Wettbewerb: Eine europäische
Wettbewerbsaufsicht für Regierungen and die empirische Evidenz“, in: Karl-Ernst
Schenk, Dieter Schmidtchen, Manfred E. Streit, Viktor Vanberg (eds.), Jahrbuch für
Neue Politische Ökonomie: 280-309.
World Bank (2002), World Development Indicators, CD-Rom.
15
Table 1: Components of Index of Globalization
A. Data on Economic Integration [35%]
i) Actual Flows (50%)
Trade (in percent of GDP) (23%)
Foreign Direct Investment (in percent of GDP) (29%)
Portfolio Investment (in percent of GDP) (27%)
Income payments to foreign nationals (in percent of GDP) (22%)
ii) Restrictions (50%)
Hidden Import Barriers (20%)
Mean Tariff Rate (30%)
Taxes on International Trade (in percent of current revenue) (24%)
Capital Account Restrictions (26%)
B. Data on Political Engagement [28%]
Embassies in Country (34%)
Membership in International Organizations (34%)
Participation in UN Security Council Missions (32%)
C. Data on Social Globalization [38%]
i) Data on Personal Contact (24%)
Outgoing telephone traffic (31%)
Transfers (in percent of GDP) (9%)
International Tourism (1%)
Telephone Average Costs of Call to USA (33%)
Foreign Population (in percent of total population) (26%)
ii) Data on Information Flows (39%)
Telephone Mainlines (per 1000 people) (18%)
Internet Hosts (per capita) (15%)
Internet Users (as a share of population) (18%)
Cable Television (per 1000 people) (16%)
Daily Newspapers (per 1000 people) (16%)
Radios (per 1000 people) (17%)
iii) Data on Cultural Proximity (37%)
Number of McDonald’s Restaurants (per capita) (100%)
Notes: The number in parenthesis indicates the weight used to derive the indexes. Weights may not sum to 100 because of rounding. All indexes range between 0 (not globalized) and 10 (globalized).
Source: Dreher (2003).
16
Table 2: Index of Globalization
Index of Globalization Political
IntegrationSocial
Integration Economic Integration
1975 1980 1985 1990 1995 2000 2000 USA 4.56 4.61 4.53 4.50 6.09 6.48 7.88 6.90 4.92Canada 5.49 4.99 4.65 4.79 5.67 6.26 7.61 6.28 5.17Sweden 5.18 4.53 4.56 5.00 5.36 6.00 7.85 5.00 5.62Finland 4.32 4.25 4.15 4.12 4.75 5.71 6.79 4.97 5.67Denmark 5.28 4.63 4.38 4.23 4.55 5.69 7.26 4.60 5.63Luxemburg 5.45 4.97 5.46 5.34 5.37 5.61 2.21 5.10 8.84Belgium 6.30 5.33 5.40 5.43 5.24 5.48 7.33 3.49 6.18Switzerland 4.86 4.61 5.32 5.13 4.76 5.44 5.63 4.81 5.96UK 5.04 4.73 4.68 4.74 4.64 5.44 7.04 3.73 6.01France 4.24 4.15 4.15 4.14 4.61 5.36 8.58 3.17 5.19Norway 4.37 4.32 4.01 4.22 4.66 5.35 6.62 4.45 5.31Netherlands 5.31 4.69 4.47 4.42 4.77 5.31 5.52 4.08 6.46Germany 4.26 4.04 4.57 4.27 4.36 5.20 6.99 3.70 5.38Austria 4.44 4.54 4.15 4.31 4.47 5.10 6.75 3.61 5.39Australia 3.58 3.38 3.29 4.06 4.64 5.03 4.37 5.92 4.60Ireland 3.59 3.63 3.62 3.85 4.04 4.95 4.92 3.30 6.75New Zeeland 3.31 3.24 3.12 3.38 4.06 4.91 3.35 5.70 5.30Italy 4.14 3.83 3.82 3.80 3.90 4.50 7.05 2.05 5.11Japan 3.92 3.56 3.54 3.75 3.63 4.38 4.84 4.24 4.16Portugal 2.23 2.49 2.30 2.63 3.10 4.10 4.88 2.12 5.61Spain 2.85 2.85 2.84 3.13 3.65 3.95 5.31 1.96 5.01Iceland 3.49 2.94 2.91 2.97 3.07 3.90 2.05 4.35 4.87Czech Rep. . . . . 2.91 3.75 4.48 2.19 4.86Poland 2.77 2.95 3.58 2.71 2.79 3.74 6.30 1.93 3.65Greece 3.01 2.90 2.69 2.73 2.90 3.70 4.30 2.27 4.76Hungary 2.77 2.36 2.39 2.43 3.22 3.49 4.16 2.28 4.26Korea. Rep. 2.71 2.52 2.33 3.04 2.99 3.25 3.65 2.39 3.86Turkey 1.85 1.60 1.71 1.96 2.68 3.18 4.22 1.62 4.04Slovak Rep. . . . . 2.35 3.06 2.80 1.94 4.48Mexico 2.19 2.32 1.92 2.36 2.62 2.88 3.44 1.40 4.03
ation and Economic Policy (1970-2000, OLS, static model)
Government spending, total
Government spending, social
Taxes on labor Taxes on
consumption Taxes on capital
-0.08 0.17 -0.13 -0.34 -0.21 -0.22 -0.08 -0.40 0.71 1.22(0.20) (0.17)(0.48) (0.44) (0.27) (0.23) (0.16)
(0.72) (0.71) (0.98)
-6.91 5.30 -6.50 -8.53 -32.59(1.43) (0.61) (0.58) (1.61) (2.25**)
0.25 0.39 0.37 0.16 0.11(6.09*) (3.74*) (2.62**) (2.19**) (0.76)
0.56 0.24 0.31 0.13 0.90(7.06*) (1.47) (0.81) (0.82) (2.43**)
1.85 11.52 0.78 1.10 -8.87 (0.50) (1.73o) (0.05) (0.32) (0.50)
-0.30 -0.37 -0.31 0.25 -0.22(3.20*) (2.27**) (1.18) (1.87o) (0.71)
0.30 -0.05 0.68 0.60 -0.12 (1.22) (0.08) (0.76) (1.27) (0.09)
30 28 29 26 23 22 25 24 24 22
169 132 131 111 102 92 116 106 101 88
0.36 0.70 0.57 0.77 0.55 0.61 0.29 0.44 0.23 0.40
All Regressions contain individual intercepts for each country and period. Standard errors are estimated robustly.
brackets: significant at the 1-percent-level (*), 5-percent-level (**) and 10-percent-level (o)
17
ation and Economic Policy (1970-2000, OLS and GMM, dynamic model)
Government spending, total
Government spending, social
Taxes on labor Taxes on
consumption Taxes on capital
OLS GMM OLS GMM OLS GMM OLS GMM OLS GMM
0.14 -0.16 -0.73 -0.74 0.03 0.51 -0.67 -0.68 3.34 2.73(0.35)
(0.40) (1.04) (1.10) (0.04) (0.48) (1.15) (1.03) (2.61**) (1.74o)
-8.51 -9.56 -13.45 -2.92 -0.55 -6.00 -0.75 -10.57 -35.99 -54.57(1.71o) (2.34**) (1.61) (0.30) (0.05) (0.47) (0.12) (1.43) (2.18**) (1.44)
0.15 0.17 0.47 0.53 0.15 0.30 0.04 -0.01 -0.09 0.15(2.71*) (3.19*) (4.57*) (4.72*) (1.14) (1.22) (0.51) (0.10) (0.37) (0.30)
0.45 0.29 0.20 0.15 0.13 0.14 0.09 -0.05 0.70 1.21(4.52*) (2.56**) (1.08) (0.74) (0.34) (0.42) (0.45) (0.25) (0.99) (1.93 o)
1.12 1.16 0.05 0.91 -24.69 -20.71 1.85 4.04 3.43 0.33 (0.22) (0.01)(0.32) (0.16) (1.95o) (1.25) (0.49) (0.74) (0.12) (0.01)
-0.28 -0.25 -0.49 -0.31 -0.66 -0.42 0.08 0.06 -0.05 0.03(3.24*) (2.59**)(3.00*) (1.65o) (3.78*) (1.28) (0.53) (0.49) (0.14) (0.08)
0.20 0.52 0.24 0.37 -0.27 -0.41 0.71 1.00 -2.03 -1.37 (0.75) (1.60) (0.43) (0.68) (0.25) (0.48) (1.48) (2.11**)
(1.32) (1.03)
0.35 0.33 0.26 0.06 0.60 0.02 0.49 0.08 0.11 -0.21(3.01*) (1.42) (2.02**) (0.17) (5.38*) (0.05) (4.15*) (0.28) (0.72) (0.38)
28 27 26 25 22 21 24 21 22 19
115
86 89 62 71 49 83 59 67 45
0.63 0.81 0.70 0.47 0.53
0.0003 0.50 0.67 0.82 0.32
0.03 0.61 0.85 0.50 0.98
18
and economic policy (1970-2000, OLS and GMM, dynamic model)
Government spending, total
Government spending, social
Taxes on labor Taxes on consumption Taxes on capital
OLS GMM OLS GMM OLS GMM OLS GMM OLS GMM
0.22 -0.12 -0.50 -0.69 0.10 0.28 -0.04 -0.59 2.63 3.25(0.70)
(0.42) (0.90) (1.47) (0.15) (0.33) (0.10) (1.14) (1.69o)
(2.34**)
-0.06 -0.06 -0.30 -0.11 0.23 0.08 -0.27 -0.20 1.34 0.95(0.36) (0.25) (1.08) (0.26) (0.60) (0.14) (0.93) (0.62) (1.97**)
(1.24)
0.13 0.01 0.02 -0.69 -0.45 0.35 -0.23 -0.38 0.07 -0.22(0.57) (0.04) (0.04) (1.47) (0.63) (0.56) (0.81) (0.90) (0.09) (0.27)
-7.26 -9.71 -14.18 -4.71 -0.88 -3.44 0.29 -10.74 -33.23 -47.67(1.37) (2.25**) (1.56) (0.47) (0.07) (0.25) (0.04) (1.32) (1.80o) (1.24)
0.15 0.17 0.48 0.54 0.17 0.25 0.03 -0.02 -0.25 -0.04(2.66*) (3.01*) (4.58*) (4.68*) (1.32) (1.05) (0.41) (0.20) (0.77) (0.07)
0.43 0.29 0.23 0.21 0.15 0.15 0.07 -0.04 0.59 0.94(4.27*) (2.47**) (1.23) (1.06) (0.38) (0.43) (0.32) (0.19) (0.84) (1.63)
1.06 1.04 -0.05 0.32 -22.76 -21.02 2.11 2.66 12.31 8.93 (0.21) (0.28) (0.01) (0.05) (1.96**) (1.25) (0.57) (0.46) (0.37) (0.31)
-0.28 -0.25 -0.48 -0.30 -0.65 -0.48 0.07 0.10 -0.001 0.13(3.22) (2.94*) (2.39**) (1.55) (3.81*) (1.49) (0.46) (0.68) (0.00) (0.67)
0.13 0.50 0.12 0.39 -0.02 -0.70 0.70 1.15 -1.71 -1.34 (0.45) (0.21)(1.50) (0.74) (0.02) (0.77) (1.37) (2.03**) (1.11) (0.98)
0.33 0.36 0.25 0.06 0.58 0.15 0.47 0.35 0.10 -0.22(2.86*)
(1.92o)
(1.58) (0.17) (5.19*)
(0.46) (3.65*)
(1.73o)
(0.69) (0.45)
28 27 26 25 22 21 24 21 22 19
115 86 89 62 71 49 83 59 67 450.64 0.81 0.70 0.47
0.0005 0.62 0.50 0.49 0.460.04 0.56 0.93 0.91 0.79
19
20
Attachment A: Definitions
Government Expenditure, total: General government final consumption expenditure (percent of GDP).
Government Expenditure, social: Public Social Expenditure in percent of GDP. Effective tax rates on labor, consumption and capital:
Actual revenue in relation to tax base.
Dependency ratio: Dependents to working-age population.
Unemployment (percent): Total unemployment in percent of total labor force.
Government employment: General government employment (producers of government services) as a percent of working age population.
Costs of Trade: Value of imports c.i.f. relative to value of imports f.o.b.
Economic Growth: Real GDP growth in percent.
Left Governments, Dummy: Dummy with the value 1, if chief executive is from a left party and zero otherwise.
21
Attachment B: Descriptive Statistics and Data Sources
Variable Source Average Std. Dev. Index of Globalization Dreher (2003) overall 4.02 1.08 between 0.99 within 0.46Economic Dreher (2003) overall 4.71 1.21Integration between 1.03 within 0.61Political Integration Dreher (2003) overall 2.60 1.42 between 1.21 within 0.76Social Integration Dreher (2003) overall 5.11 1.71 between 1.59 within 0.71Government World Bank (2002) overall 17.85 4.72Spending, total between 4.47 within 1.50Government OECD (2003) overall 19.66 7.18Spending, social between 6.93 within 2.58Effective Taxes on Carey and overall 16.71 5.28Consumption Rabesona (2002) between 5.16 within 1.40Effective Taxes on Carey and overall 26.42 7.83Capital Rabesona (2002) between 7.79 within 2.88Effective Taxes on Carey and overall 30.41 9.55Labor Rabesona (2002) between 9.14 within 2.75Dependency World Bank (2002) overall 0.54 0.09Ratio between 0.07 within 0.05Unemployment World Bank (2002). overall 6.11 4.05(percent) European between 3.19 Commission (2003) within 2.70Government Cusack (1998). overall 10.87 5.72Employment OECD (2000) between 6.63 within 1.41Costs of Trade IMF (2003) overall 1.0004 0.22 between 0.21 within 0.03Economic Growth World Bank (2002) overall 2.38 1.71 between 1.08 within 1.37Left Governments, Beck et al. (1999) overall 0.45 0.42Dummy between 0.31 within 0.29