Embed Size (px)
Citation preview
The mission of Wageningen University & Research is “To explore the potential of nature to improve the quality of life”. Under the banner Wageningen University & Research, Wageningen University and the specialised research institutes of the Wageningen Research Foundation have joined forces in contributing to finding solutions to important questions in the domain of healthy food and living environment. With its roughly 30 branches, 5,000 employees and 12,000 students, Wageningen University & Research is one of the leading organisations in its domain. The unique Wageningen approach lies in its integrated approach to issues and the collaboration between different disciplines.
Wageningen Economic ResearchP.O. Box 297032502 LS Den HaagThe NetherlandsT +31 (0)70 335 83 30E [email protected]/economic-research
Report 2020-027ISBN 978-94-6395-366-5 P.L.M van Horne
Economic aspects within the Greenwell sustainability assessment model
Economics of broiler production systems in the Netherlands

Economics of broiler production systems in the Netherlands
Economic aspects within the Greenwell sustainability assessment model
P.L.M van Horne
This research was conducted by Wageningen Economic Research and is part of the Greenwell project, in which Wageningen Economic Research cooperates with Wageningen Livestock Research. The project is commissioned and funded by the Ministry of Agriculture, Nature and Food Quality and companies Aviagen EPI, Belgabroed/Van Hulst, De Heus BV, and Plukon Food Group, within the framework of the public-private partnership (TKI-AF-17023, project number BO-47-001-033).
Wageningen Economic Research Wageningen, April 2020
REPORT
2020-027
ISBN 978-94-6395-366-5
Horne, P.L.M. van, 2020. Economics of broiler production systems in the Netherlands; Economic aspects within the Greenwell sustainability assessment model. Wageningen, Wageningen Economic Research, Report 2020-027. 28 pp.; 8 fig.; 9 tab.; 15 ref. This report describes the economic dimension within the overall Greenwell sustainability model. Production costs, revenues and income of four broiler production systems in the Netherlands are calculated. The results show that for all cost components the costs increase when moving from conventional to Dutch Retail broilers or to Better Life one star and finally to organic. As a result of a higher revenue price in all alternative systems the farmers’ income in 2017 was similar to the conventional production system. Keywords: broiler production system, slow growing broilers, farm income, production costs This report can be downloaded for free at https://doi.org/10.18174/518522 or at www.wur.eu/economic-research (under Wageningen Economic Research publications). © 2020 Wageningen Economic Research P.O. Box 29703, 2502 LS The Hague, The Netherlands, T +31 (0)70 335 83 30, E [email protected], http://www.wur.eu/economic-research. Wageningen Economic Research is part of Wageningen University & Research.
This work is licensed under a Creative Commons Attribution-Non Commercial 4.0 International License. © Wageningen Economic Research, part of Stichting Wageningen Research, 2020 The user may reproduce, distribute and share this work and make derivative works from it. Material by third parties which is used in the work and which are subject to intellectual property rights may not be used without prior permission from the relevant third party. The user must attribute the work by stating the name indicated by the author or licensor but may not do this in such a way as to create the impression that the author/licensor endorses the use of the work or the work of the user. The user may not use the work for commercial purposes. Wageningen Economic Research accepts no liability for any damage resulting from the use of the results of this study or the application of the advice contained in it. Wageningen Economic Research is ISO 9001:2015 certified. Wageningen Economic Research Report 2020-027 | Project code 2282100278 Cover photo: Shutterstock
Contents
Preface 5
Summary 6
S.1 Key findings 6 S.2 Complementary findings 7 S.3 Methodology 7
1 Introduction 8
1.1 Production systems 8
2 Method and data 10
2.1 Method 10 2.2 Data 10
2.2.1 Technical results at farm level 10 2.2.2 Prices and variable costs at farm level 11 2.2.3 Fixed costs at farm level 12 2.2.4 Costs at the slaughterhouse 13
3 Results 14
3.1 Production costs at farm level 14 3.2 Revenue price 17 3.3 Farm income 18 3.4 Production cost of carcass and breast meat 19
4 Discussion and conclusions 21
References and websites 23
Energy use and costs 24
Photos of production system 26

Wageningen Economic Research Report 2020-027 | 5
Preface
Animal welfare gets much attention in the Netherlands. In the broiler sector in particular, the stocking density in the poultry house and the growth rate of the broilers are increasingly subject of societal discussion. As a response to these discussions, several alternative broiler production systems were developed to improve animal welfare. Until recently, within broiler production there were just conventional production systems on one side and organic production systems on the other side. To decrease the gap between conventional and organic broiler production systems, initiatives were taken in the past years in the Netherlands to develop so-called middle-segment broiler production systems. This developed into the Better Life system initiated by the Dutch Society for the Protection of Animals (SPA) (since 2007) and a Dutch retail broiler (also called ‘Chicken of Tomorrow’) (since 2014), initiated by retailers and the poultry sector.
In this report Wageningen Economic Research presents the results of an economic evaluation of four broiler production systems. The project is part of a larger Greenwell programme in which, in addition to the economic dimension, the environmental and welfare dimension of sustainability is evaluated. The results of the environmental and welfare analyses are reported by Wageningen Livestock Research, in two separate reports.
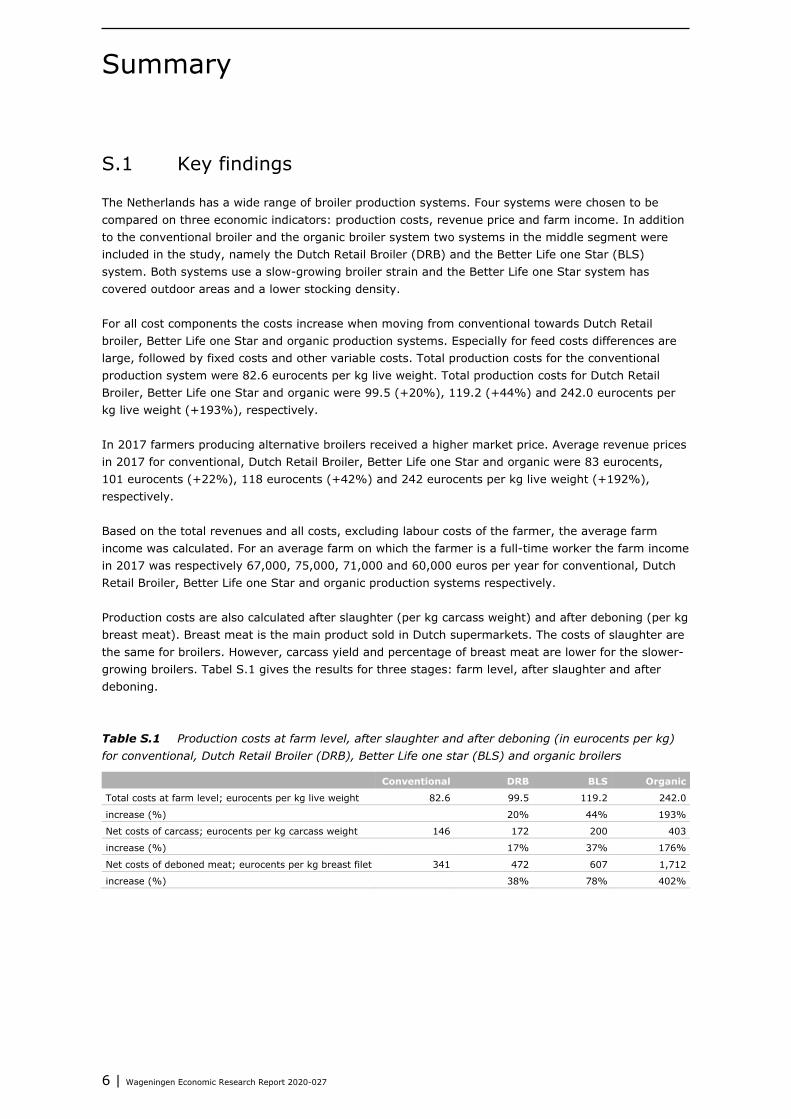
I would like to thank all persons and organisations that contributed to the study, especially the broiler farmers who were visited to collect farm data and the companies for providing their data and insights used in this report.
Ir. O. (Olaf) Hietbrink Business Unit Manager Wageningen Economic Research Wageningen University & Research
6 | Wageningen Economic Research Report 2020-027
Summary
S.1 Key findings
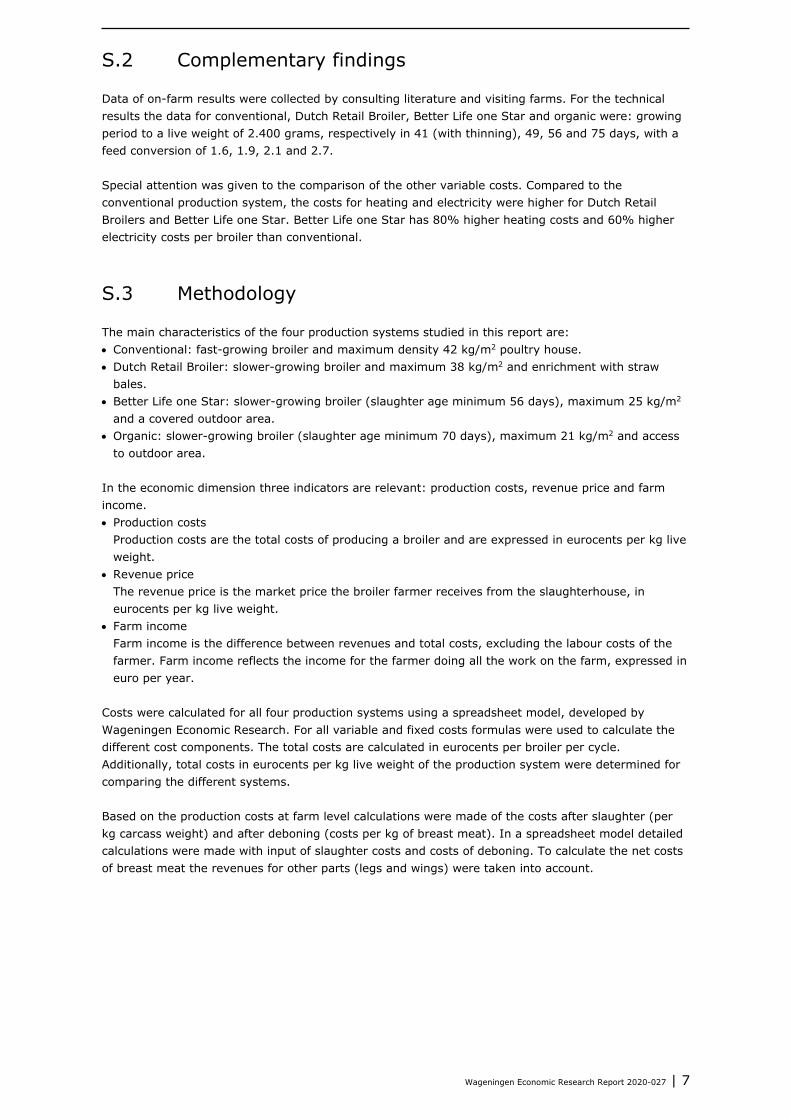
The Netherlands has a wide range of broiler production systems. Four systems were chosen to be compared on three economic indicators: production costs, revenue price and farm income. In addition to the conventional broiler and the organic broiler system two systems in the middle segment were included in the study, namely the Dutch Retail Broiler (DRB) and the Better Life one Star (BLS) system. Both systems use a slow-growing broiler strain and the Better Life one Star system has covered outdoor areas and a lower stocking density. For all cost components the costs increase when moving from conventional towards Dutch Retail broiler, Better Life one Star and organic production systems. Especially for feed costs differences are large, followed by fixed costs and other variable costs. Total production costs for the conventional production system were 82.6 eurocents per kg live weight. Total production costs for Dutch Retail Broiler, Better Life one Star and organic were 99.5 (+20%), 119.2 (+44%) and 242.0 eurocents per kg live weight (+193%), respectively. In 2017 farmers producing alternative broilers received a higher market price. Average revenue prices in 2017 for conventional, Dutch Retail Broiler, Better Life one Star and organic were 83 eurocents, 101 eurocents (+22%), 118 eurocents (+42%) and 242 eurocents per kg live weight (+192%), respectively. Based on the total revenues and all costs, excluding labour costs of the farmer, the average farm income was calculated. For an average farm on which the farmer is a full-time worker the farm income in 2017 was respectively 67,000, 75,000, 71,000 and 60,000 euros per year for conventional, Dutch Retail Broiler, Better Life one Star and organic production systems respectively. Production costs are also calculated after slaughter (per kg carcass weight) and after deboning (per kg breast meat). Breast meat is the main product sold in Dutch supermarkets. The costs of slaughter are the same for broilers. However, carcass yield and percentage of breast meat are lower for the slower-growing broilers. Tabel S.1 gives the results for three stages: farm level, after slaughter and after deboning. Table S.1 Production costs at farm level, after slaughter and after deboning (in eurocents per kg) for conventional, Dutch Retail Broiler (DRB), Better Life one star (BLS) and organic broilers
Conventional DRB BLS Organic
Total costs at farm level; eurocents per kg live weight 82.6 99.5 119.2 242.0
increase (%) 20% 44% 193%
Net costs of carcass; eurocents per kg carcass weight 146 172 200 403
increase (%) 17% 37% 176%
Net costs of deboned meat; eurocents per kg breast filet 341 472 607 1,712
increase (%) 38% 78% 402%
Wageningen Economic Research Report 2020-027 | 7
S.2 Complementary findings
Data of on-farm results were collected by consulting literature and visiting farms. For the technical results the data for conventional, Dutch Retail Broiler, Better Life one Star and organic were: growing period to a live weight of 2.400 grams, respectively in 41 (with thinning), 49, 56 and 75 days, with a feed conversion of 1.6, 1.9, 2.1 and 2.7. Special attention was given to the comparison of the other variable costs. Compared to the conventional production system, the costs for heating and electricity were higher for Dutch Retail Broilers and Better Life one Star. Better Life one Star has 80% higher heating costs and 60% higher electricity costs per broiler than conventional.
S.3 Methodology
The main characteristics of the four production systems studied in this report are: • Conventional: fast-growing broiler and maximum density 42 kg/m2 poultry house. • Dutch Retail Broiler: slower-growing broiler and maximum 38 kg/m2 and enrichment with straw
bales. • Better Life one Star: slower-growing broiler (slaughter age minimum 56 days), maximum 25 kg/m2
and a covered outdoor area. • Organic: slower-growing broiler (slaughter age minimum 70 days), maximum 21 kg/m2 and access
to outdoor area. In the economic dimension three indicators are relevant: production costs, revenue price and farm income. • Production costs
Production costs are the total costs of producing a broiler and are expressed in eurocents per kg live weight.
• Revenue price The revenue price is the market price the broiler farmer receives from the slaughterhouse, in eurocents per kg live weight.
• Farm income Farm income is the difference between revenues and total costs, excluding the labour costs of the farmer. Farm income reflects the income for the farmer doing all the work on the farm, expressed in euro per year.
Costs were calculated for all four production systems using a spreadsheet model, developed by Wageningen Economic Research. For all variable and fixed costs formulas were used to calculate the different cost components. The total costs are calculated in eurocents per broiler per cycle. Additionally, total costs in eurocents per kg live weight of the production system were determined for comparing the different systems. Based on the production costs at farm level calculations were made of the costs after slaughter (per kg carcass weight) and after deboning (costs per kg of breast meat). In a spreadsheet model detailed calculations were made with input of slaughter costs and costs of deboning. To calculate the net costs of breast meat the revenues for other parts (legs and wings) were taken into account.
8 | Wageningen Economic Research Report 2020-027
1 Introduction
One of the aims of the Greenwell project is to develop a model to assess the sustainability of broiler production systems. Such a model can be used to provide insight into the differences between production systems with respect to sustainability, to substantiate choices for production systems, and to determine the effect of system adaptations and their impact on overall sustainability. The model should provide insight into different sustainability aspects, such as animal welfare, environmental impact and economics. In this report the ‘economics dimension’ is described.
1.1 Production systems
The broiler production chain consists of several stages: from broiler breeder farm (producing hatching eggs), hatchery (producing one-day-old chicks) to broiler farm (producing slaughter-ready broilers), the subsequent transport and handling at the slaughterhouse and the retailers’ activities. In this study the focus was on the broiler farm and the slaughterhouse. The Netherlands has a wide range of broiler production systems. Within the Greenwell project, we decided to choose four systems. The conventional broiler production is the system with the minimum legal requirements. These requirements are set by the European Union (EU, 2007a) with some additional rules set by the Dutch government (‘Vleeskuikenbesluit 2010’). The organic broiler production system has the most strict requirements on housing and management at farm level. In addition to these systems, two middle segment broiler systems were included in the study: the Dutch Retail Broiler (also called ‘Chicken of Tomorrow’) and the Better Life one Star system (extensive indoor). Both systems use a slow-growing broiler strain. In addition to the new Dutch Retail Broiler, the Better Life one Star system has a covered outdoor area and a lower stocking density. The main characteristics of the four systems are described below and summarised in Table 1.1.
Conventional All broiler production systems have to be in line with the basic legal requirements set by the European Union (EU, 2007a). The conventional broiler production system (further called ‘conventional’ system) only meets the minimum legal requirements. The broilers are usually fast growing and housed at a maximum stocking density of 42 kg/m2, based on indoor housing. Conventional represents around 65 to 70% of total broiler production in the Netherlands.
Dutch Retail Broiler (DRB) The retail standard is defined by the so-called ‘Chicken of Tomorrow’ agreement. This agreement was announced in a press release by the Dutch Poultry sector and the Dutch retailers (PPE/CBL, 2013). Broiler farmers with these ‘Dutch retail broilers’ use a slower-growing breed with a maximum daily growth of 50 grams, apply a stocking density of maximum 38 kg/m2 and provide environmental enrichment, based on indoor housing. This standard is used by the largest Dutch retailer. However, some other retailers in the Netherlands have stricter requirements, especially on stocking density and the provision of daylight.
Better Life one Star (BLS) The Dutch Society for the Protection of Animals (SPA) developed the Better Life label with a three-star system. The Better Life system with one star is based on the extensive indoor system as described by the EU. The farmer has to use a slower-growing breed (slaughter age at least 56 days) and has to apply a stocking density of maximum 25 kg/m2. In the Better Life one-star system additional requirements are a covered outdoor area and environmental enrichment (bales of straw and grain for scratching/pecking). Further details are available on the SPA website (SPA, 2019).
Wageningen Economic Research Report 2020-027 | 9
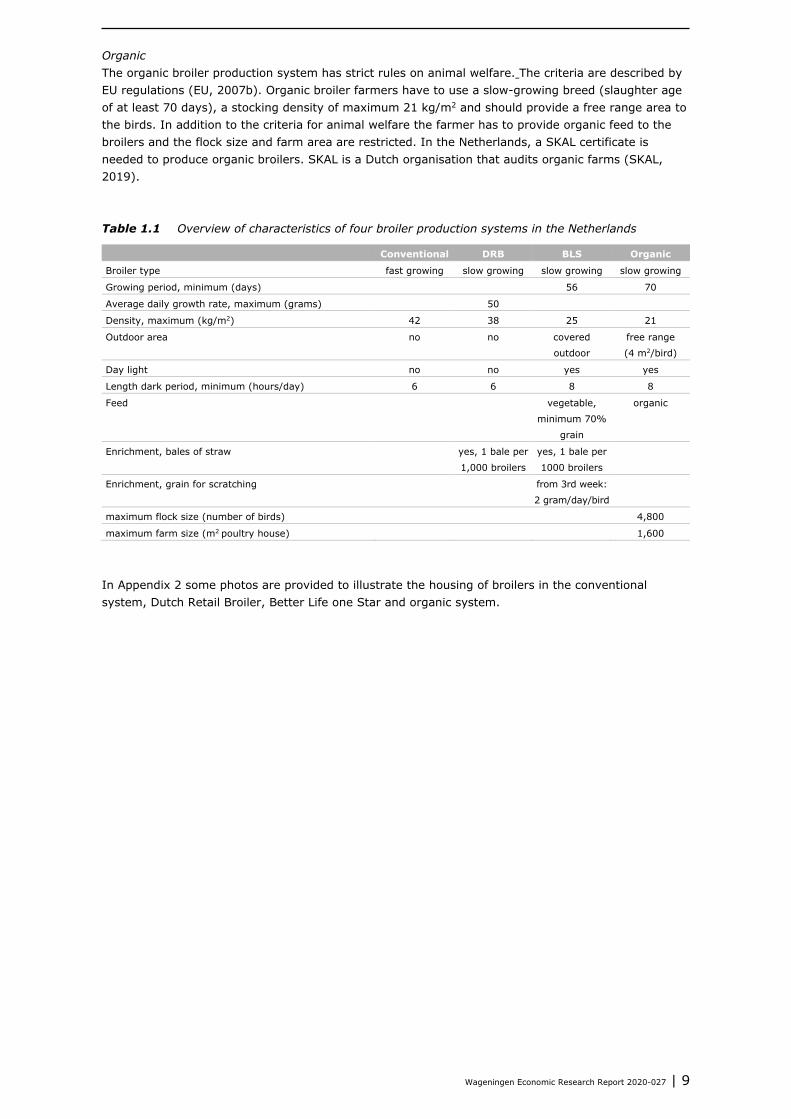
Organic The organic broiler production system has strict rules on animal welfare. The criteria are described by EU regulations (EU, 2007b). Organic broiler farmers have to use a slow-growing breed (slaughter age of at least 70 days), a stocking density of maximum 21 kg/m2 and should provide a free range area to the birds. In addition to the criteria for animal welfare the farmer has to provide organic feed to the broilers and the flock size and farm area are restricted. In the Netherlands, a SKAL certificate is needed to produce organic broilers. SKAL is a Dutch organisation that audits organic farms (SKAL, 2019). Table 1.1 Overview of characteristics of four broiler production systems in the Netherlands
Conventional DRB BLS Organic
Broiler type fast growing slow growing slow growing slow growing
Growing period, minimum (days)
56 70
Average daily growth rate, maximum (grams) 50
Density, maximum (kg/m2) 42 38 25 21
Outdoor area no no covered
outdoor
free range
(4 m2/bird)
Day light no no yes yes
Length dark period, minimum (hours/day) 6 6 8 8
Feed
vegetable,
minimum 70%
grain
organic
Enrichment, bales of straw
yes, 1 bale per
1,000 broilers
yes, 1 bale per
1000 broilers
Enrichment, grain for scratching
from 3rd week:
2 gram/day/bird
maximum flock size (number of birds)
4,800
maximum farm size (m2 poultry house) 1,600
In Appendix 2 some photos are provided to illustrate the housing of broilers in the conventional system, Dutch Retail Broiler, Better Life one Star and organic system.
10 | Wageningen Economic Research Report 2020-027
2 Method and data
2.1 Method
In the economic dimension three indicators are relevant: production costs, revenue price and farm income. • Production costs are the total costs of producing a broiler and are expressed in eurocents per kg live
weight. • Revenue price
The revenue price is the market price the broiler farmer receives from the slaughterhouse. The revenue price is expressed in eurocents per kg live weight.
• Farm income Farm income is the difference between revenues and total costs excluding the labour costs of the farmer. Farm income reflects the income for the farmer doing all the work on the farm.
Costs were calculated for all four production systems using a spreadsheet model, developed by Wageningen Economic Research. For all variable and fixed costs formulas were used to calculate the different cost components. The total costs are calculated in eurocents per broiler per cycle. Additionally, total costs in eurocents per kg live weight of the production system were determined to be able to compare the different systems. Since the market for broiler meat originating from alternative production systems is relatively new, not many reports and publications are available. Almost all information is based on the situation in the Netherlands, because other countries have very limited experience with alternative production systems using slow-growing broilers. Input for the model are technical performance data, prices, variable costs and fixed costs. In Section 2.2 all assumptions and input data are described. For the conventional system data were obtained from Quantitative Information Animal Husbandry (KWIN 2017) and Wageningen Economic Research (Wageningen Economic Research, 2019). For the alternative production systems several information sources were used. Wageningen Economic Research has data from the FADN network (Wageningen Economic Research, 2019a) and the KWIN publication gives input data and prices. Another source of information were the project partners in the Greenwell project. Finally, the author visited some farms with alternative broiler systems to collect information and to discuss the data. Calculations for the slaughterhouse were based on the calculation tool ‘Wageningen benchmark poultry meat’. In this spreadsheet model, costs of slaughter can be calculated based on specific input data of a company or country. The structure, assumptions and formulas are described in a report from Wageningen Economic Research (van Horne, 2018).
2.2 Data
2.2.1 Technical results at farm level
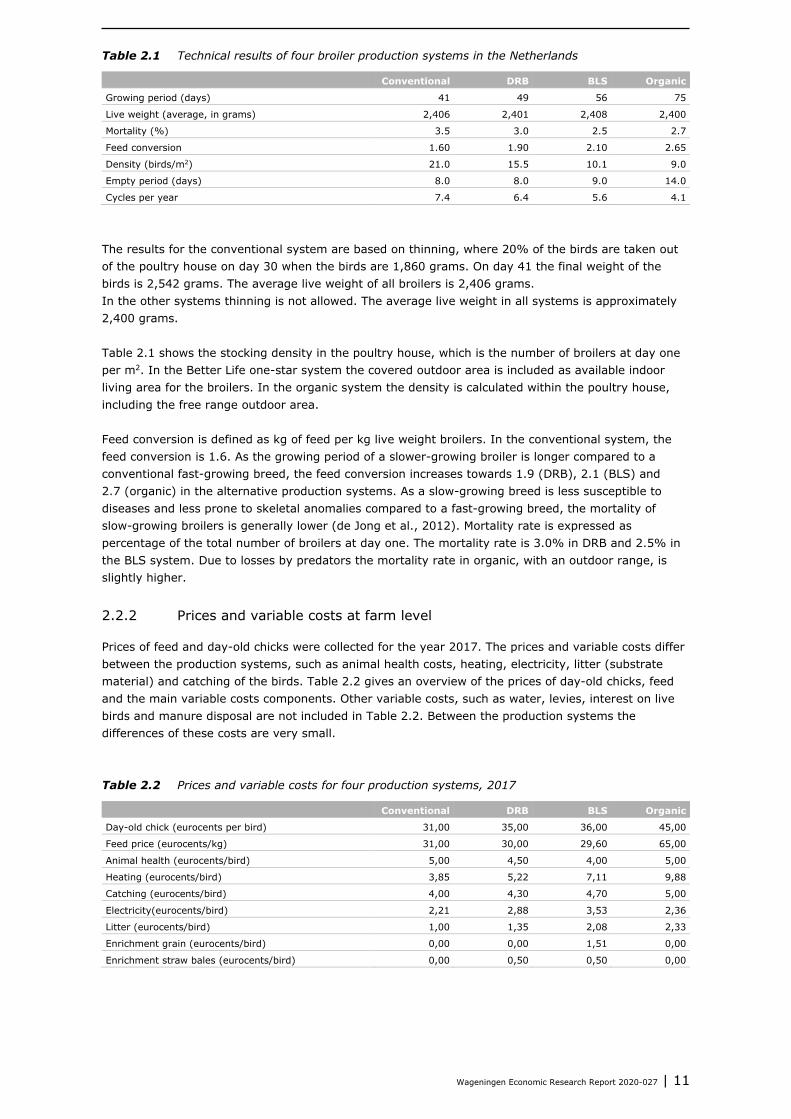
For four production systems performance data for the year 2017 were collected. Table 2.1 gives an overview of the technical results. In the Greenwell ‘Environmental’ report the calculation is based on biological performance objectives and nutritional recommendations published by the genetic companies. The ‘Environmental’ report also includes two different breeds for both the DRB (Hubbard JA287, Ranger Classic) and BLS (Hubbard JA257, Ranger Gold) because of different production performances. In the obtained field data it is not possible to distinguish between the breeds within one production system; therefore one set of data is presented for DRB and BLS.
Wageningen Economic Research Report 2020-027 | 11
Table 2.1 Technical results of four broiler production systems in the Netherlands
Conventional DRB BLS Organic
Growing period (days) 41 49 56 75
Live weight (average, in grams) 2,406 2,401 2,408 2,400
Mortality (%) 3.5 3.0 2.5 2.7
Feed conversion 1.60 1.90 2.10 2.65
Density (birds/m2) 21.0 15.5 10.1 9.0
Empty period (days) 8.0 8.0 9.0 14.0
Cycles per year 7.4 6.4 5.6 4.1
The results for the conventional system are based on thinning, where 20% of the birds are taken out of the poultry house on day 30 when the birds are 1,860 grams. On day 41 the final weight of the birds is 2,542 grams. The average live weight of all broilers is 2,406 grams. In the other systems thinning is not allowed. The average live weight in all systems is approximately 2,400 grams. Table 2.1 shows the stocking density in the poultry house, which is the number of broilers at day one per m2. In the Better Life one-star system the covered outdoor area is included as available indoor living area for the broilers. In the organic system the density is calculated within the poultry house, including the free range outdoor area. Feed conversion is defined as kg of feed per kg live weight broilers. In the conventional system, the feed conversion is 1.6. As the growing period of a slower-growing broiler is longer compared to a conventional fast-growing breed, the feed conversion increases towards 1.9 (DRB), 2.1 (BLS) and 2.7 (organic) in the alternative production systems. As a slow-growing breed is less susceptible to diseases and less prone to skeletal anomalies compared to a fast-growing breed, the mortality of slow-growing broilers is generally lower (de Jong et al., 2012). Mortality rate is expressed as percentage of the total number of broilers at day one. The mortality rate is 3.0% in DRB and 2.5% in the BLS system. Due to losses by predators the mortality rate in organic, with an outdoor range, is slightly higher.
2.2.2 Prices and variable costs at farm level
Prices of feed and day-old chicks were collected for the year 2017. The prices and variable costs differ between the production systems, such as animal health costs, heating, electricity, litter (substrate material) and catching of the birds. Table 2.2 gives an overview of the prices of day-old chicks, feed and the main variable costs components. Other variable costs, such as water, levies, interest on live birds and manure disposal are not included in Table 2.2. Between the production systems the differences of these costs are very small. Table 2.2 Prices and variable costs for four production systems, 2017
Conventional DRB BLS Organic
Day-old chick (eurocents per bird) 31,00 35,00 36,00 45,00
Feed price (eurocents/kg) 31,00 30,00 29,60 65,00
Animal health (eurocents/bird) 5,00 4,50 4,00 5,00
Heating (eurocents/bird) 3,85 5,22 7,11 9,88
Catching (eurocents/bird) 4,00 4,30 4,70 5,00
Electricity(eurocents/bird) 2,21 2,88 3,53 2,36
Litter (eurocents/bird) 1,00 1,35 2,08 2,33
Enrichment grain (eurocents/bird) 0,00 0,00 1,51 0,00
Enrichment straw bales (eurocents/bird) 0,00 0,50 0,50 0,00
12 | Wageningen Economic Research Report 2020-027
Day-old chicks Day-old chicks of slow-growing breeds are four or five eurocents more expensive than the conventional growing broilers. The price of organic day-old chicks is substantially higher, because of small-scale production (e.g. higher costs for transport) and additional vaccinations in the hatchery (e.g. Marek disease).
Feed The feed price is slightly lower for the DRB and BLS compared to conventional systems, because slow-growing broilers get feed with a lower protein content than conventional broilers. Organic broiler feed is much more expensive because the feed ingredients have to be produced organically, without artificial fertiliser and pesticides.
Animal health The animal health costs relate to the costs of vaccination, work of the veterinarian, laboratory research costs and costs of medication. In the conventional systems these costs are 5 eurocents per broiler. The costs in the DRB and BLS are slightly lower because of a lower antibiotic use. The animal health costs on organic farms are higher as a result of the small-scale production.
Heating Costs of heating of a poultry house relates directly to the surface of the house. The poultry house has to be heated to more than 30 degrees Celsius and this is, especially in the first weeks of the growing period, not related to the number of birds in the poultry house. As a result the heating costs per bird will be higher at lower densities. In Appendix 1 more details are given on the calculation of the heating costs for the four production systems.
Catching The costs of catching are slightly higher for the slow growing birds. Catching more lively birds at a lower stocking density takes more time.
Electricity Electricity costs of a poultry farm are mainly for ventilation and, to a lesser degree, for automatic feeding and lighting in the poultry house. The costs of electricity per bird are slightly higher in the production systems with a lower density and a longer growing period. In organic production the poultry house has natural ventilation. There is only support by mechanical ventilation, which results in lower electricity costs per bird compared to the other production systems. Appendix 1 gives more details on the calculation of the electricity costs for the four production systems.
Litter/bedding material The floor of the poultry house is covered with substrate material, such as wood shavings or straw. The costs are fixed per m2 poultry house. Therefore, production systems with a lower density have higher litter costs per bird.
Enrichment, grain For BLS, providing grain is compulsory. Two weeks after the beginning of the growing period the broilers should have 2 grams of grain per day per broiler. The costs are 1.5 eurocents per broiler.
Enrichment, straw bales Providing straw bales is compulsory for DRB and BLS. One straw bale is given per 1,000 broilers during a cycle. Based on a price of 5 euros per bale the costs are 0.5 eurocent per broiler.
2.2.3 Fixed costs at farm level
In the conventional and DRB the broilers are kept in a regular broiler house. The investment in the building is 205 euros per m2 (KWIN 2017). In the Better Life one-star system a covered outdoor area has to be added, with an investment of 170 euro per m2 surface. Organic broilers are kept in a more basic poultry house with investment costs of 105 euros per m2. The investment in equipment in a standard poultry house (conventional, DRB) is 100 euros per m2. These investments are lower for the
Wageningen Economic Research Report 2020-027 | 13
BLS (80 euros) and organic system (55 euros). In the organic system, especially the investment for ventilation is much lower. For all systems yearly costs of the investment in a poultry house are based on the costs of depreciation (4% of the investment), maintenance (1.5% of the investment) and interest (interest rate of 3%). The yearly cost of the investments in equipment is based on the costs of depreciation (8% of the investment), maintenance (3% of the investment) and interest (interest rate of 3%). In organic production systems the costs for the outdoor range (4 m2/chicken) have to added. These are costs of interest on the value of the land and costs of fencing (depreciation, interest and maintenance). The costs of labour of the farmer, based on a full-time job taking care of the broilers, is 60,500 euros per year.
2.2.4 Costs at the slaughterhouse
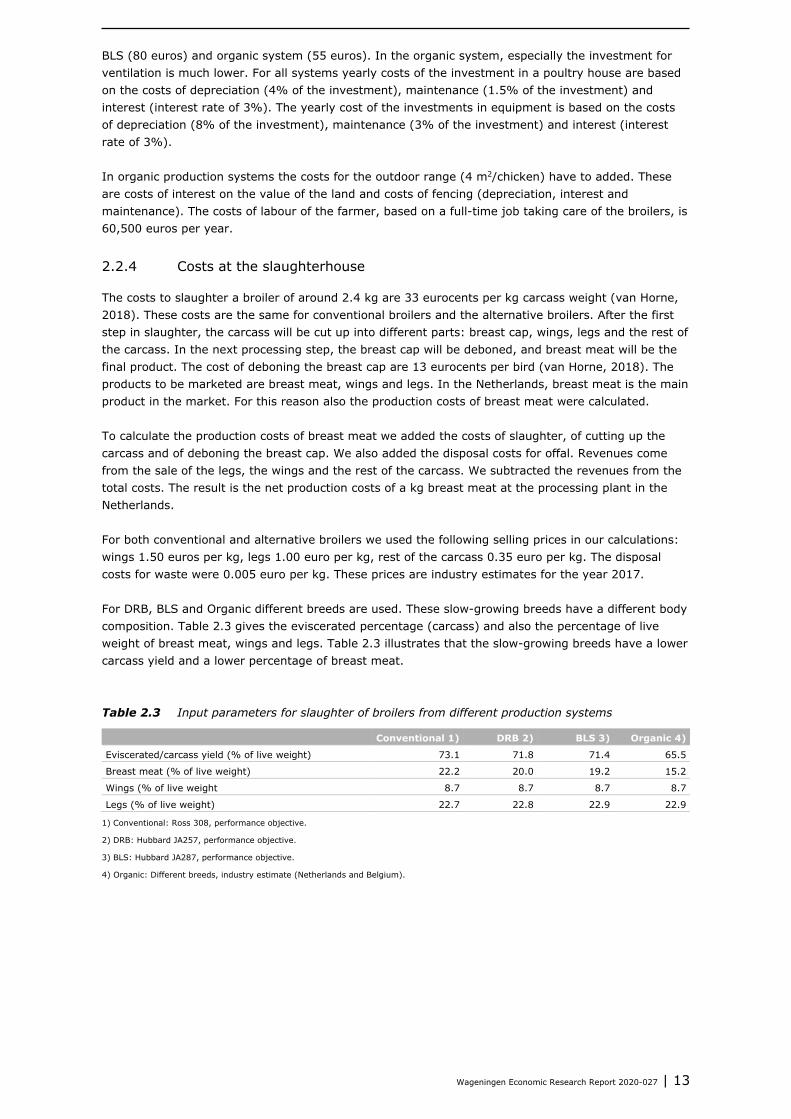
The costs to slaughter a broiler of around 2.4 kg are 33 eurocents per kg carcass weight (van Horne, 2018). These costs are the same for conventional broilers and the alternative broilers. After the first step in slaughter, the carcass will be cut up into different parts: breast cap, wings, legs and the rest of the carcass. In the next processing step, the breast cap will be deboned, and breast meat will be the final product. The cost of deboning the breast cap are 13 eurocents per bird (van Horne, 2018). The products to be marketed are breast meat, wings and legs. In the Netherlands, breast meat is the main product in the market. For this reason also the production costs of breast meat were calculated. To calculate the production costs of breast meat we added the costs of slaughter, of cutting up the carcass and of deboning the breast cap. We also added the disposal costs for offal. Revenues come from the sale of the legs, the wings and the rest of the carcass. We subtracted the revenues from the total costs. The result is the net production costs of a kg breast meat at the processing plant in the Netherlands. For both conventional and alternative broilers we used the following selling prices in our calculations: wings 1.50 euros per kg, legs 1.00 euro per kg, rest of the carcass 0.35 euro per kg. The disposal costs for waste were 0.005 euro per kg. These prices are industry estimates for the year 2017. For DRB, BLS and Organic different breeds are used. These slow-growing breeds have a different body composition. Table 2.3 gives the eviscerated percentage (carcass) and also the percentage of live weight of breast meat, wings and legs. Table 2.3 illustrates that the slow-growing breeds have a lower carcass yield and a lower percentage of breast meat. Table 2.3 Input parameters for slaughter of broilers from different production systems
Conventional 1) DRB 2) BLS 3) Organic 4)
Eviscerated/carcass yield (% of live weight) 73.1 71.8 71.4 65.5
Breast meat (% of live weight) 22.2 20.0 19.2 15.2
Wings (% of live weight 8.7 8.7 8.7 8.7
Legs (% of live weight) 22.7 22.8 22.9 22.9
1) Conventional: Ross 308, performance objective.
2) DRB: Hubbard JA257, performance objective.
3) BLS: Hubbard JA287, performance objective.
4) Organic: Different breeds, industry estimate (Netherlands and Belgium).
14 | Wageningen Economic Research Report 2020-027
3 Results
For each production system the production costs, revenue price and farm income are calculated. As described in Chapter 1, the four Dutch production systems in the comparison are conventional, the Dutch Retail Broiler (DRB), Better Life one Star (BLS) and organic. The comparison is made for the year 2017.
3.1 Production costs at farm level
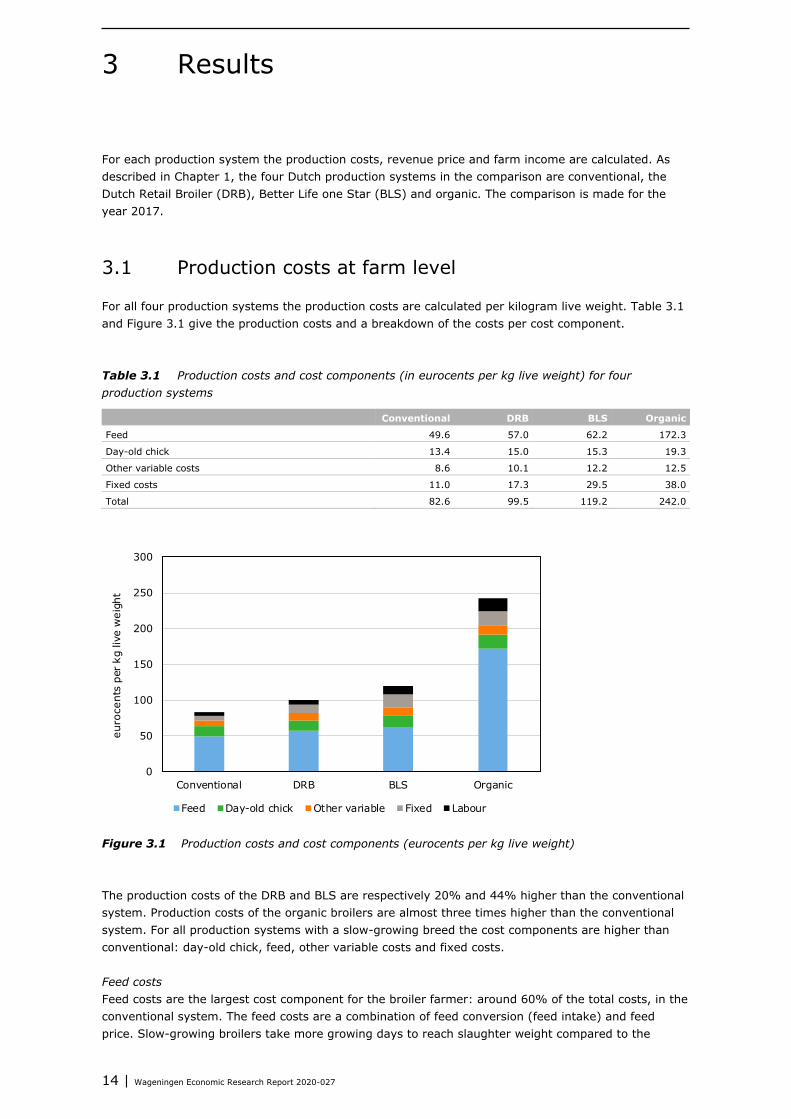
For all four production systems the production costs are calculated per kilogram live weight. Table 3.1 and Figure 3.1 give the production costs and a breakdown of the costs per cost component. Table 3.1 Production costs and cost components (in eurocents per kg live weight) for four production systems
Conventional DRB BLS Organic
Feed 49.6 57.0 62.2 172.3
Day-old chick 13.4 15.0 15.3 19.3
Other variable costs 8.6 10.1 12.2 12.5
Fixed costs 11.0 17.3 29.5 38.0
Total 82.6 99.5 119.2 242.0
Figure 3.1 Production costs and cost components (eurocents per kg live weight) The production costs of the DRB and BLS are respectively 20% and 44% higher than the conventional system. Production costs of the organic broilers are almost three times higher than the conventional system. For all production systems with a slow-growing breed the cost components are higher than conventional: day-old chick, feed, other variable costs and fixed costs.
Feed costs Feed costs are the largest cost component for the broiler farmer: around 60% of the total costs, in the conventional system. The feed costs are a combination of feed conversion (feed intake) and feed price. Slow-growing broilers take more growing days to reach slaughter weight compared to the
0
50
100
150
200
250
300
Conventional DRB BLS Organic
euro
cent
s pe
r kg
live
wei
ght
Feed Day-old chick Other variable Fixed Labour
Wageningen Economic Research Report 2020-027 | 15
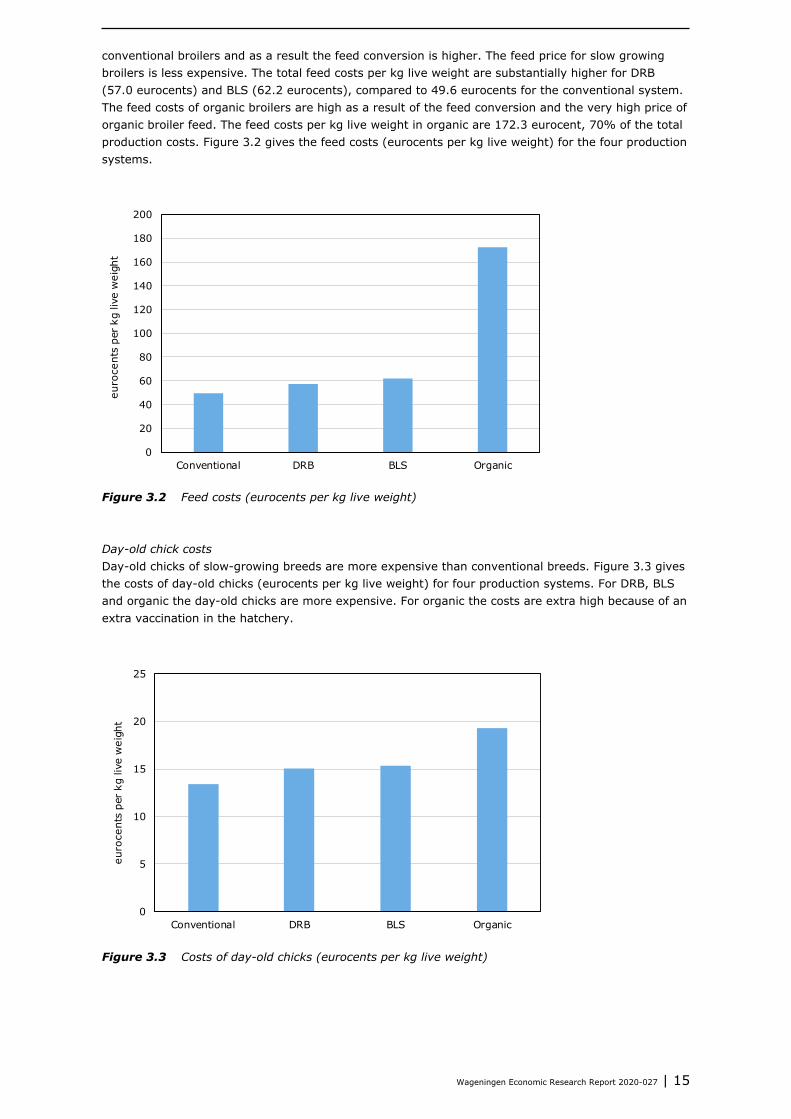
conventional broilers and as a result the feed conversion is higher. The feed price for slow growing broilers is less expensive. The total feed costs per kg live weight are substantially higher for DRB (57.0 eurocents) and BLS (62.2 eurocents), compared to 49.6 eurocents for the conventional system. The feed costs of organic broilers are high as a result of the feed conversion and the very high price of organic broiler feed. The feed costs per kg live weight in organic are 172.3 eurocent, 70% of the total production costs. Figure 3.2 gives the feed costs (eurocents per kg live weight) for the four production systems.
Figure 3.2 Feed costs (eurocents per kg live weight)
Day-old chick costs Day-old chicks of slow-growing breeds are more expensive than conventional breeds. Figure 3.3 gives the costs of day-old chicks (eurocents per kg live weight) for four production systems. For DRB, BLS and organic the day-old chicks are more expensive. For organic the costs are extra high because of an extra vaccination in the hatchery.
Figure 3.3 Costs of day-old chicks (eurocents per kg live weight)
0
20
40
60
80
100
120
140
160
180
200
Conventional DRB BLS Organic
euro
cent
s pe
r kg
live
wei
ght
0
5
10
15
20
25
Conventional DRB BLS Organic
euro
cent
s pe
r kg
live
wei
ght
16 | Wageningen Economic Research Report 2020-027
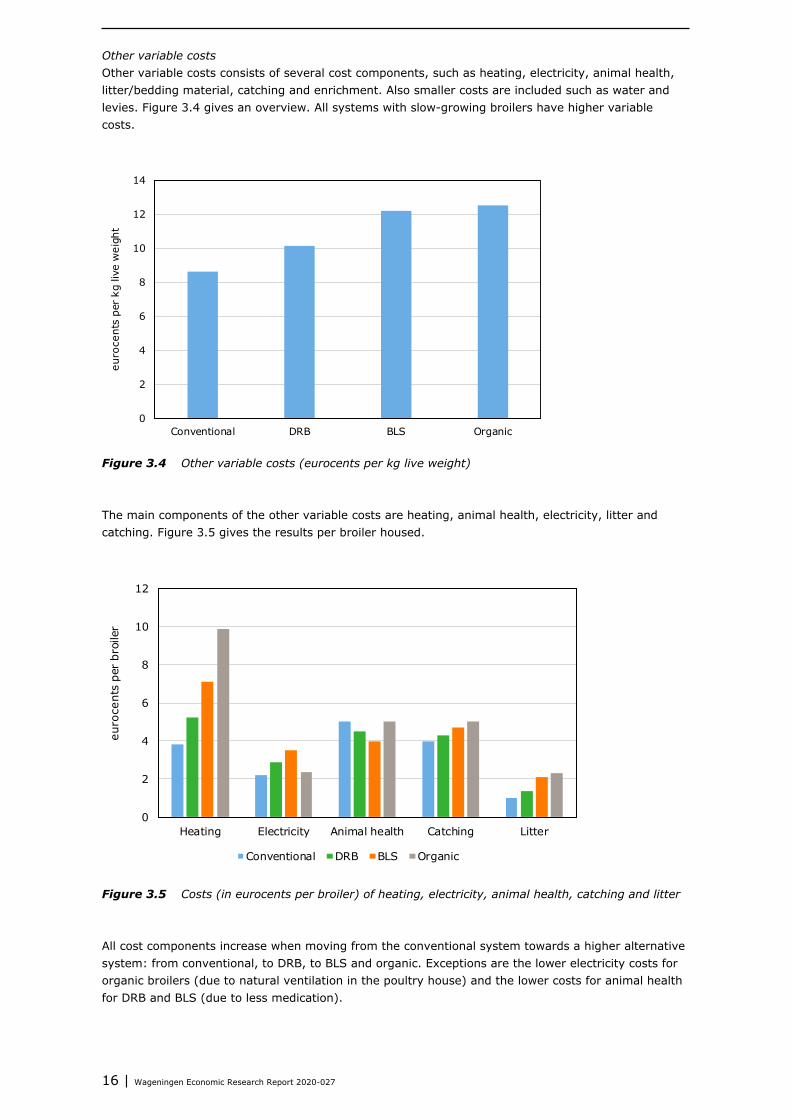
Other variable costs Other variable costs consists of several cost components, such as heating, electricity, animal health, litter/bedding material, catching and enrichment. Also smaller costs are included such as water and levies. Figure 3.4 gives an overview. All systems with slow-growing broilers have higher variable costs.
Figure 3.4 Other variable costs (eurocents per kg live weight) The main components of the other variable costs are heating, animal health, electricity, litter and catching. Figure 3.5 gives the results per broiler housed.
Figure 3.5 Costs (in eurocents per broiler) of heating, electricity, animal health, catching and litter All cost components increase when moving from the conventional system towards a higher alternative system: from conventional, to DRB, to BLS and organic. Exceptions are the lower electricity costs for organic broilers (due to natural ventilation in the poultry house) and the lower costs for animal health for DRB and BLS (due to less medication).
0
2
4
6
8
10
12
14
Conventional DRB BLS Organic
euro
cent
s pe
r kg
live
wei
ght
0
2
4
6
8
10
12
Heating Electricity Animal health Catching Litter
euro
cent
s pe
r br
oile
r
Conventional DRB BLS Organic
Wageningen Economic Research Report 2020-027 | 17
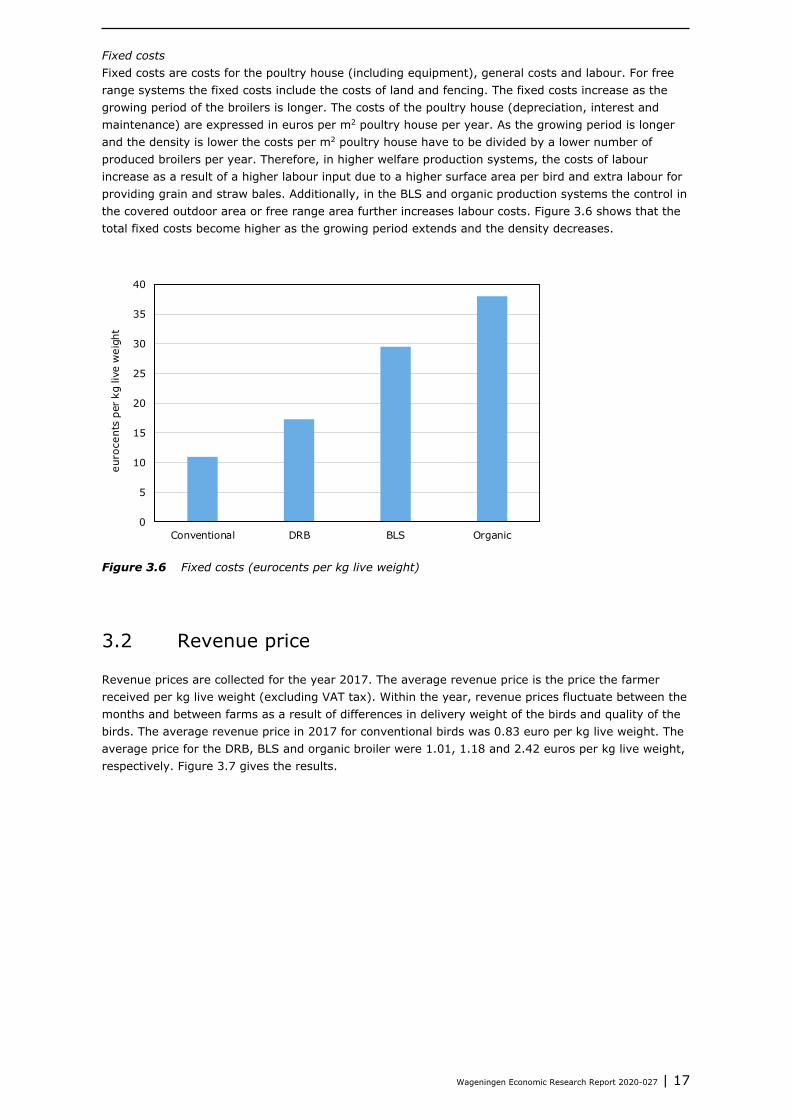
Fixed costs Fixed costs are costs for the poultry house (including equipment), general costs and labour. For free range systems the fixed costs include the costs of land and fencing. The fixed costs increase as the growing period of the broilers is longer. The costs of the poultry house (depreciation, interest and maintenance) are expressed in euros per m2 poultry house per year. As the growing period is longer and the density is lower the costs per m2 poultry house have to be divided by a lower number of produced broilers per year. Therefore, in higher welfare production systems, the costs of labour increase as a result of a higher labour input due to a higher surface area per bird and extra labour for providing grain and straw bales. Additionally, in the BLS and organic production systems the control in the covered outdoor area or free range area further increases labour costs. Figure 3.6 shows that the total fixed costs become higher as the growing period extends and the density decreases.
Figure 3.6 Fixed costs (eurocents per kg live weight)
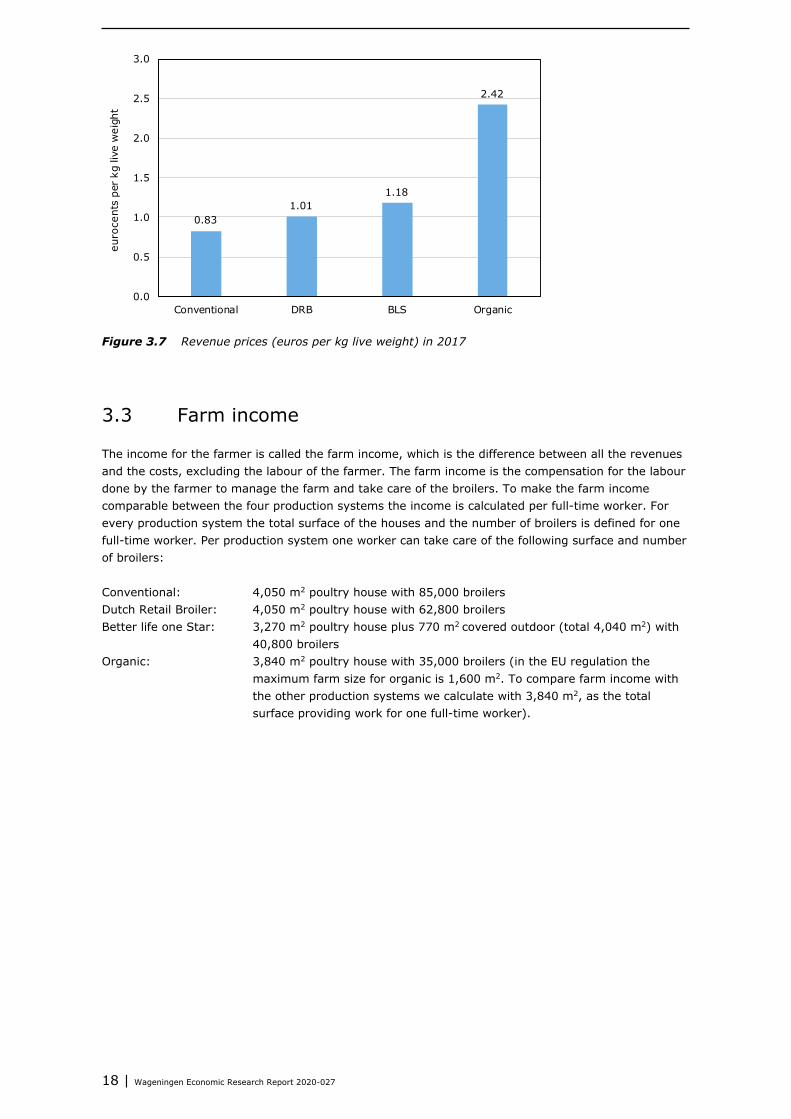
3.2 Revenue price
Revenue prices are collected for the year 2017. The average revenue price is the price the farmer received per kg live weight (excluding VAT tax). Within the year, revenue prices fluctuate between the months and between farms as a result of differences in delivery weight of the birds and quality of the birds. The average revenue price in 2017 for conventional birds was 0.83 euro per kg live weight. The average price for the DRB, BLS and organic broiler were 1.01, 1.18 and 2.42 euros per kg live weight, respectively. Figure 3.7 gives the results.
0
5
10
15
20
25
30
35
40
Conventional DRB BLS Organic
euro
cent
s pe
r kg
live
wei
ght
18 | Wageningen Economic Research Report 2020-027
Figure 3.7 Revenue prices (euros per kg live weight) in 2017
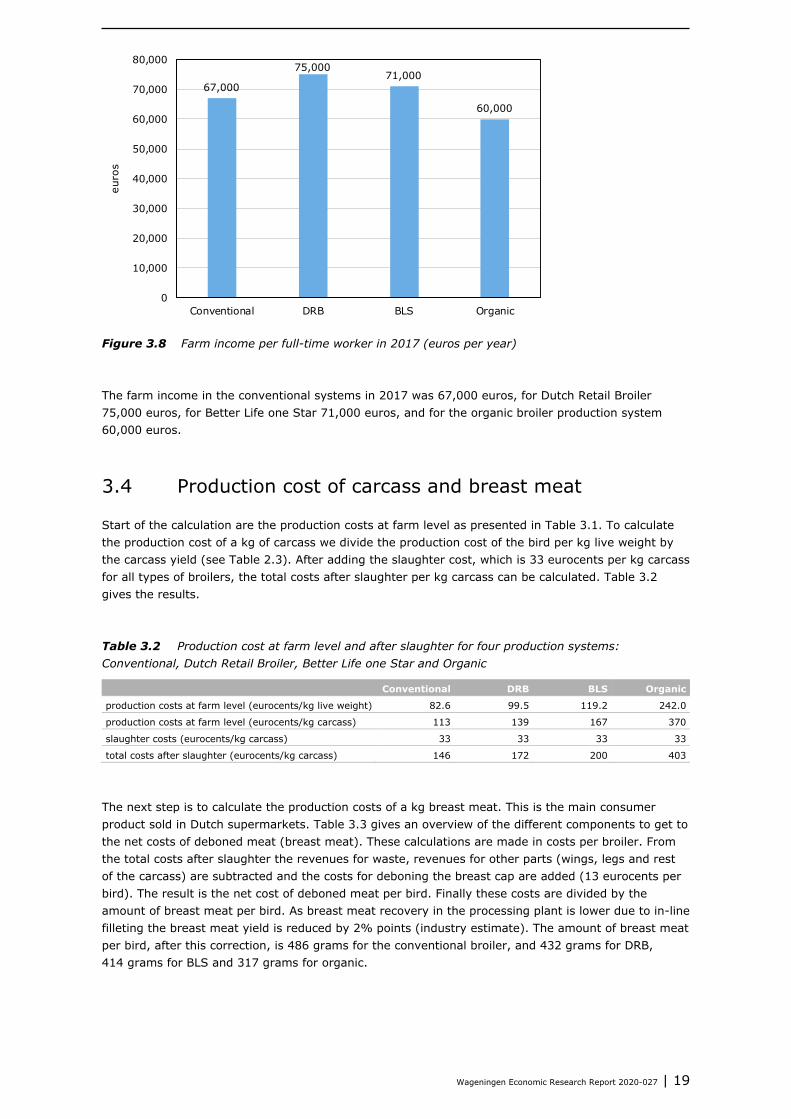
3.3 Farm income
The income for the farmer is called the farm income, which is the difference between all the revenues and the costs, excluding the labour of the farmer. The farm income is the compensation for the labour done by the farmer to manage the farm and take care of the broilers. To make the farm income comparable between the four production systems the income is calculated per full-time worker. For every production system the total surface of the houses and the number of broilers is defined for one full-time worker. Per production system one worker can take care of the following surface and number of broilers: Conventional: 4,050 m2 poultry house with 85,000 broilers Dutch Retail Broiler: 4,050 m2 poultry house with 62,800 broilers Better life one Star: 3,270 m2 poultry house plus 770 m2 covered outdoor (total 4,040 m2) with
40,800 broilers Organic: 3,840 m2 poultry house with 35,000 broilers (in the EU regulation the
maximum farm size for organic is 1,600 m2. To compare farm income with the other production systems we calculate with 3,840 m2, as the total surface providing work for one full-time worker).
0.831.01
1.18
2.42
0.0
0.5
1.0
1.5
2.0
2.5
3.0
Conventional DRB BLS Organic
euro
cent
s pe
r kg
live
wei
ght
Wageningen Economic Research Report 2020-027 | 19
Figure 3.8 Farm income per full-time worker in 2017 (euros per year) The farm income in the conventional systems in 2017 was 67,000 euros, for Dutch Retail Broiler 75,000 euros, for Better Life one Star 71,000 euros, and for the organic broiler production system 60,000 euros.
3.4 Production cost of carcass and breast meat
Start of the calculation are the production costs at farm level as presented in Table 3.1. To calculate the production cost of a kg of carcass we divide the production cost of the bird per kg live weight by the carcass yield (see Table 2.3). After adding the slaughter cost, which is 33 eurocents per kg carcass for all types of broilers, the total costs after slaughter per kg carcass can be calculated. Table 3.2 gives the results. Table 3.2 Production cost at farm level and after slaughter for four production systems: Conventional, Dutch Retail Broiler, Better Life one Star and Organic
Conventional DRB BLS Organic
production costs at farm level (eurocents/kg live weight) 82.6 99.5 119.2 242.0
production costs at farm level (eurocents/kg carcass) 113 139 167 370
slaughter costs (eurocents/kg carcass) 33 33 33 33
total costs after slaughter (eurocents/kg carcass) 146 172 200 403
The next step is to calculate the production costs of a kg breast meat. This is the main consumer product sold in Dutch supermarkets. Table 3.3 gives an overview of the different components to get to the net costs of deboned meat (breast meat). These calculations are made in costs per broiler. From the total costs after slaughter the revenues for waste, revenues for other parts (wings, legs and rest of the carcass) are subtracted and the costs for deboning the breast cap are added (13 eurocents per bird). The result is the net cost of deboned meat per bird. Finally these costs are divided by the amount of breast meat per bird. As breast meat recovery in the processing plant is lower due to in-line filleting the breast meat yield is reduced by 2% points (industry estimate). The amount of breast meat per bird, after this correction, is 486 grams for the conventional broiler, and 432 grams for DRB, 414 grams for BLS and 317 grams for organic.
67,000
75,00071,000
60,000
0
10,000
20,000
30,000
40,000
50,000
60,000
70,000
80,000
Conventional DRB BLS Organic
euro
s
20 | Wageningen Economic Research Report 2020-027
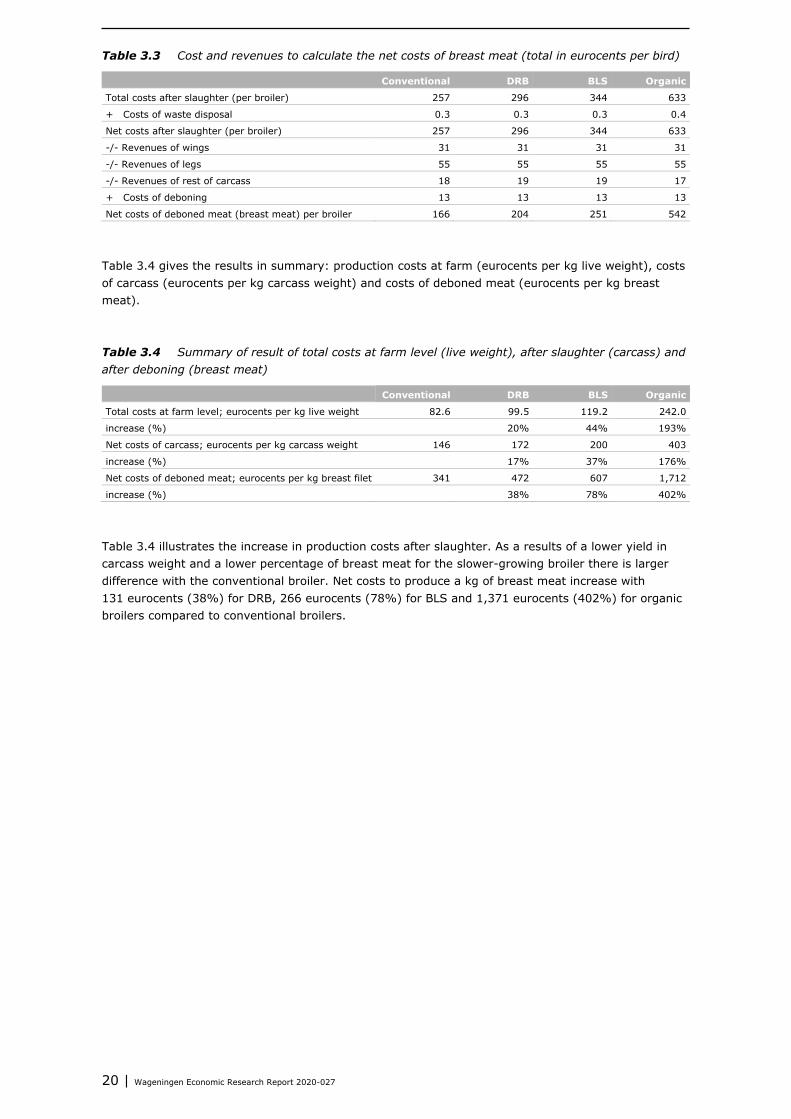
Table 3.3 Cost and revenues to calculate the net costs of breast meat (total in eurocents per bird)
Conventional DRB BLS Organic
Total costs after slaughter (per broiler) 257 296 344 633
+ Costs of waste disposal 0.3 0.3 0.3 0.4
Net costs after slaughter (per broiler) 257 296 344 633
-/- Revenues of wings 31 31 31 31
-/- Revenues of legs 55 55 55 55
-/- Revenues of rest of carcass 18 19 19 17
+ Costs of deboning 13 13 13 13
Net costs of deboned meat (breast meat) per broiler 166 204 251 542
Table 3.4 gives the results in summary: production costs at farm (eurocents per kg live weight), costs of carcass (eurocents per kg carcass weight) and costs of deboned meat (eurocents per kg breast meat). Table 3.4 Summary of result of total costs at farm level (live weight), after slaughter (carcass) and after deboning (breast meat)
Conventional DRB BLS Organic
Total costs at farm level; eurocents per kg live weight 82.6 99.5 119.2 242.0
increase (%) 20% 44% 193%
Net costs of carcass; eurocents per kg carcass weight 146 172 200 403
increase (%) 17% 37% 176%
Net costs of deboned meat; eurocents per kg breast filet 341 472 607 1,712
increase (%) 38% 78% 402%
Table 3.4 illustrates the increase in production costs after slaughter. As a results of a lower yield in carcass weight and a lower percentage of breast meat for the slower-growing broiler there is larger difference with the conventional broiler. Net costs to produce a kg of breast meat increase with 131 eurocents (38%) for DRB, 266 eurocents (78%) for BLS and 1,371 eurocents (402%) for organic broilers compared to conventional broilers.
Wageningen Economic Research Report 2020-027 | 21
4 Discussion and conclusions
Broiler production in the Netherlands used to be either conventional or organic. Since 2014 the middle segment has been developed with several concepts with slow-growing broilers, of which the Dutch Retail Broiler system and the Better Life one-Star system are the most important. The main characteristics of the four production systems studied in this report are: • Conventional
Fast-growing broiler and maximum density 42 kg /m2 poultry house. • Dutch Retail Broiler (DRB)
Slower-growing broiler and max. 38 kg/m2 and enrichment with straw bales. • Better Life one Star (BLS)
Slower-growing broiler (slaughter age minimum 56 days), max. 25 kg/m2 and a covered outdoor area.
• Organic Slower-growing (slaughter age minimum 70 days), max. 21 kg/m2 and access to outdoor area.
Data of on-farm results were collected by consulting literature and visiting farms. For the technical results the data for conventional, Dutch Retail Broiler, Better Life one Star and organic were: growing period to a live weight of 2,400 grams respectively in 41 (with thinning), 49, 56 and 75 days with a feed conversion of 1.60, 1.90, 2.10 and 2.65. All costs components increase when moving from conventional towards Dutch Retail Broiler, Better Life one Star and organic. Especially for feed costs, differences are large, followed by fixed costs and other variable costs. Total production costs for conventional were 82.6 eurocents per kg live weight. Total production costs for Dutch Retail Broiler, Better Life one Star and organic were 99.5 (+20%), 119.2 (+44%) and 242.0 eurocents per kg live weight (+193%), respectively. Special attention was given to the comparison of the other variable costs. Compared to conventional the costs for heating and electricity are higher for Dutch Retail Broilers and Better Life one Star. For Better Life one Star the costs of heating are 80% and for electricity 60% higher than conventional. In 2017 farmers producing alternative broilers received a higher market price. Average revenue prices in 2017 for conventional, Dutch Retail Broiler, Better Life one Star and organic were 83 eurocents, 1.01 eurocents (+22%), 118 eurocents (+42%) and 242 (+192%) eurocents per kg live weight. Based on the total revenue and all costs, excluding labour costs of the farmer, the average farm income was calculated. For an average farm on which the farmer is a full-time worker the farm income in 2017 was respectively 67,000, 75,000, 71,000 and 60,000 euros per year for conventional, Dutch Retail Broiler, Better Life one Star and organic production systems. In this report, production costs, revenue prices and income relate to the average situation within a production system. However, farms differ in technical results (e.g. feed conversion) and prices (e.g. feed and day-old chicks), which leads to a large variation in farm income. Wageningen Economic Research data illustrate this variation (Wageningen Economic Research, 2019b). In 2017 the average farm income on broiler farms in the Netherlands was 112,500 euros, whereas 20% of the farms had an income lower than 30,700 euros and another 20% of the farms had an income higher than 162,000 euros. The Wageningen Economic Research data are collected on a random sample of 30 broilers farms in the Netherlands. Based on input data for carcass yield and percentage of breast meat the net costs per kg of breast meat were calculated. The slower-growing broilers have a lower yield in the processing plant and as a result there is an additional increase in production costs. The increase in net costs per kg of breast
22 | Wageningen Economic Research Report 2020-027
meat compared to the conventional system are for Dutch Retail Broiler 1.31 euros (+38%), for Better Life one Star 2.66 euros (+78%) and for organic 13.71 euros (+402%). It should be noted that corrected yield data from the official performance objective of the breeders are used. In practise there is a wide variation in yield between farms, breeds and slaughterhouses. A small change in breast meat yield can have a large impact on the production costs of a kilogram of breast meat.
Wageningen Economic Research Report 2020-027 | 23
References and websites
EU, 2007a. Council Directive 2007/43/EC of 28 June 2007 laying down minimum rules for the protection of chickens kept for meat production. Brussels.
EU, 2007b. Council Directive No 834/2007 of 28 June 2007 on organic production and labelling of organic products and repealing Regulation (EEC) No 2091/91.
Horne, P. van. Oorzaken van verschillen in energieverbruik op vleeskuikenbedrijven. LEI publicatie 3.160. Den Haag, April 1995.
Horne, P. van. Competitiveness of the EU poultry meat sector, base year 2017. International comparison of production costs. Wageningen Economic Research. Report 2018-116. Wageningen, December 2018.
Jong, I. de, Berg, C., Butterworth, A., & Estevéz, I. (2012). Scientific report updating the EFSA opinions on the welfare of broilers and broiler breeders. EFSA Supporting Publications, 9(6).
KWIN 2017. Quantitative Information Animal Husbandry. Wageningen Livestock Research. Wageningen. KWIN 2017-2018. Augustus 2018.
PPE/CBL, 2013. Criteria Kip van Morgen. Zoetermeer, 26 Februari 2013 SKAL, 2019. https://www.skal.nl/veehouderij/pluimvee/huisvesting/ SPA, 2019. https://beterleven.dierenbescherming.nl/zakelijk/english-info Wageningen Economic Research, 2019a. FADN data. Website/data/farm result /broiler farms.
www.agrimatie.nl Wageningen Economic Research, 2019b. Farm income data. Website/sector/poultry farms.
www.agrimatie.nl
Other relevant literature Ellen et al., 2012. Vleeskuikenproductiesystemen in Nederland (Broiler Production Systems in the
Netherlands). Wageningen UR Livestock Research. Report 619. Gocsik, E. Animal welfare decisions in Dutch poultry and pig farms. Thesis Wageningen University.
Wageningen, December 2014. Saatkamp et al., 2019. Transition from conventional broiler meat to meat from production concepts
with higher animal welfare: experience from the Netherlands. Animals 2019, 9 (8), 483. Animals 2019, 9(8), 483; https://www.mdpi.com/2076-2615/9/8/483
Vissers, L.S.M., I.C. de Jong, P.L.M. van Horne and H.W. Saatkamp. Global prospects of the cost-efficiency of broiler welfare in middle-segment production systems. Animals. 25 July 2019.
24 | Wageningen Economic Research Report 2020-027
Energy use and costs
Detailed information was collected from different sources on energy use at farm level. We also visited some farms with the better Life one-Star systems to collect data and discuss the results. In this appendix an overview is given of the data, assumptions and results on energy use and costs for heating and electricity.
Heating In the field there is a wide variation in heating costs between farms. This is caused by differences in heating system/equipment, level of insulation of the poultry house, variation in management by the farmer and presence of a heat exchanger (estimate 50% of the farms). The costs are also influenced by the price of energy. Many farmers buy natural gas and other use propane or biomass/wood pellets for heating (approximately 40% of the farms). The farms using wood pellets have lower costs for fuel, but on the other hand there are costs of incinerator and extra labour input. All these factors make it complicated to compare energy costs between farms. In cooperation with a specialist from Wageningen Livestock Research we tried to calculate the energy input and costs based on a combination of theoretical reasoning and field data. The main source for information was KWIN 2017 and FADN data from Wageningen Economic Research.
Assumption For conventional broilers, use of natural gas was 0.07 m3 per broiler per cycle. The average price of natural gas in 2017 was 55 eurocents per m3. Farms with slow-growing broilers have the same heating costs per broiler. This can be assumed because the greater part of the heating costs is in the first two week of the growing period. When the density is reduced the heating costs have to be corrected. Based on similar heating costs per m2 poultry house a correction can be made for density to calculate the costs per broiler. For systems with a covered outdoor area, a 10% higher energy input is assumed.
Results Conventional: density is 21 birds/m2. Heating costs are 0.07 * 55 = 3,85 eurocents per broiler per cycle. Dutch retail broiler: density is 15.5 birds/m2. Use of gas is 0.07 * 21 /15.5 = 0.095 m3. Heating costs are 0.095*55=5.22 eurocents per broiler per cycle. This is 1.37 eurocents higher than conventional. Better Life one star: density is 12.5 birds/m2. Use of gas is 0.07 * 21/12.5 = 0.12 m3. With 10% correction for outdoor area this is 0.129 m3. Heating costs are 0.129 * 55 = 7.11 eurocents per broiler per year. Organic: density is 9 birds/m2. Use of gas is 0.07*21/9 = 0.163 m3. With 10% correction for outdoor area this is 0.18 m3. Heating costs are 0.18*55 = 9.9 eurocents per broiler per cycle.
Field data The database of Wageningen Economic Research contains 9 farms with the Dutch Retail Broiler system. The average heating costs of these farms are 1 to 1.5 eurocentshigher than the farms with conventional broilers. This is in line with the calculated difference of 1.37 eurocents. Three farms with the Better Life one-Star system were visited. The variation in heating costs on these farm was very large: 6.3 eurocents, 11.5 eurocents and 4 eurocents. The last number was of a farm with a new poultry house with good insulation and a heat exchanger. In the database of Wageningen Economic Research four farms with the Better Life one-Star system had average heating costs of 10 eurocents, also with a large variation. Apparently, the heating costs for Better Life one-Star systems are almost double that of conventional.
Wageningen Economic Research Report 2020-027 | 25
The company growing organic broilers estimated the heating costs to be 8.5 to 10 eurocents per broiler per cycle. However, no actual data on measurements were available.
Electricity There are just limited data available on electricity use on broiler farms. Farms with a heat exchanger have a higher use of electricity. Based on research done in the nineties (van Horne, 1995) we know that ventilation take 70 to 75% of the electricity. Electricity is also used for lighting and automatic feeding.
Assumptions Farms with conventional broilers use 0.17 kWh per broiler. The average price of electricity in 2017 was 13 eurocents per kWh. On broiler farms ventilation is done based on the live weight of the birds. With a similar final live weight in all four production systems we can assume an equal use of electricity per bird. In addition a correction for the number of days the broilers are in the poultry house is needed. It is assumed that ventilation takes 75% of the electricity and 25% is needed for lighting and automatic feeding. The use of electricity for lighting and feeding is for all production systems equal per m2 poultry house. For this part of the electricity use a correction is needed in case of a lower density to calculate the costs per broiler.
Results Conventional: density is 21 birds/m2 and growing period is 41 days. Electricity costs are 0.17 kWh * 13 eurocent/kWh = 2.2 eurocents per broiler per cycle. Dutch retail broiler: density is 15.5 birds per m2 and growing period is 49 days. Use of electricity is (0.17*0.75*49/41)+(0.17*0.25*49/41*21/15.5) = 0.221 kWh. Costs are 0.221*13 = 2.87 eurocents per broiler per cycle. Better Life one Star: density is 12.5 birds per m2 and growing period is 56 days. Use of electricity is (0.17*0.75*56/41)+(0.17*0.25*56/41*21/12.5) = 0.272 kWh. Cost are 0.272*13 = 3.54 eurocents per broiler per cycle. Organic: density is 9 birds per m2 and growing period is 75 days. Use of electricity is (0.17*0.25*75/41*21/9) = 0.181 kWh. Cost are 0.181*13 = 2.35 eurocents per broiler per cycle.
Field data We visited three farms with Better Life one-Star broilers. On these farms electricity costs were 2.3, 3 and 4 eurocents per broiler per cycle. The farm with 4 eurocents costs has a new poultry house with a heat exchanger.
26 | Wageningen Economic Research Report 2020-027
Photos of production system
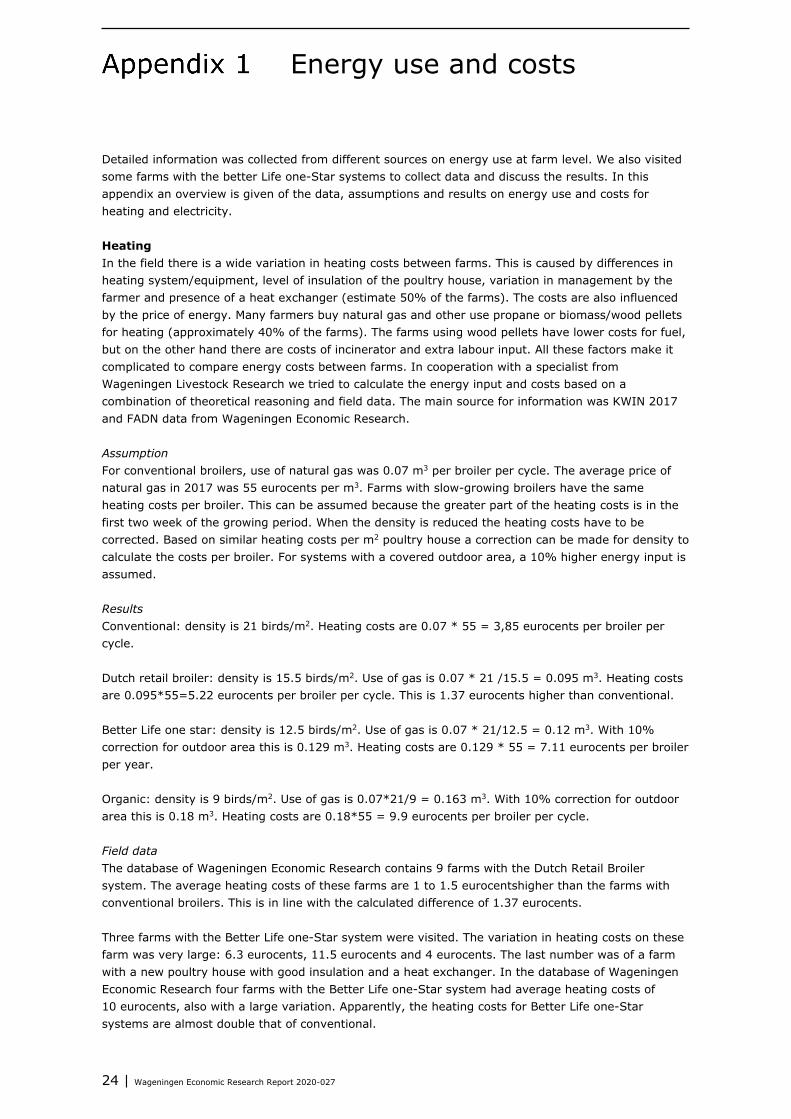
Conventional, Dutch Retail Broiler, Better Life one Star and organic.
Conventional Conventional poultry house
Photo: Peter van Horne
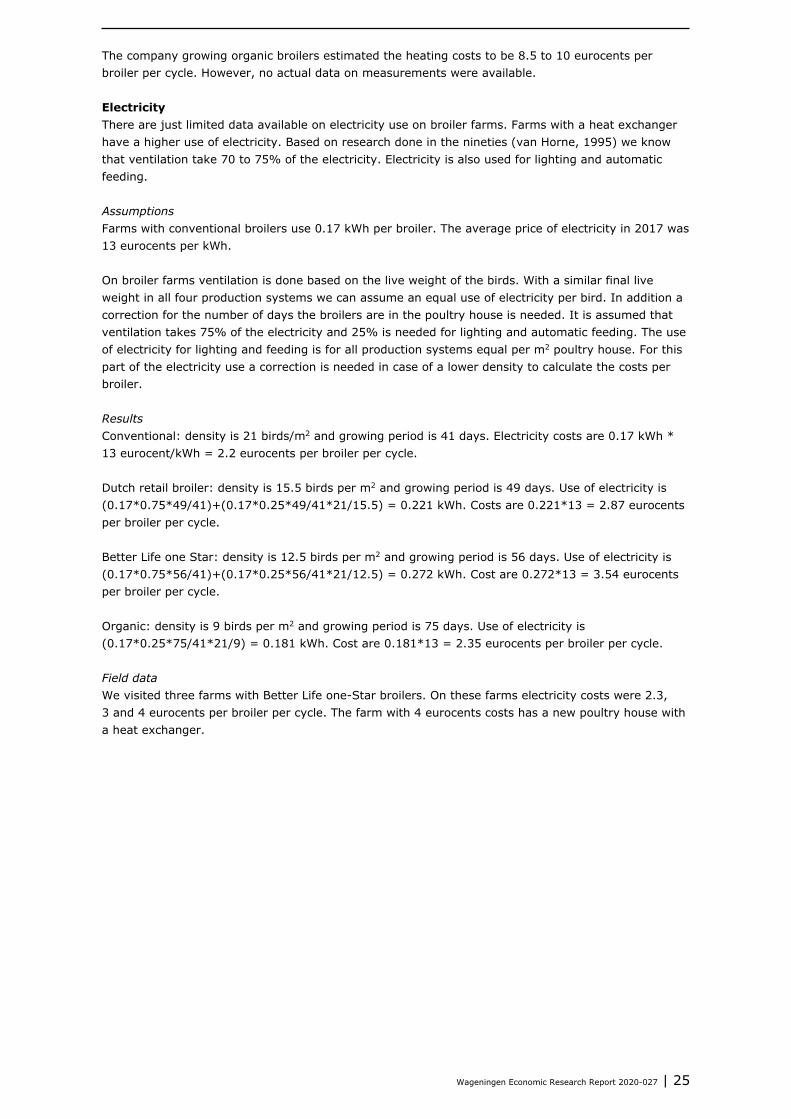
Dutch retail broiler Retail system with enrichment (straw bales)
Photo: Hubbard breeders
Wageningen Economic Research Report 2020-027 | 27
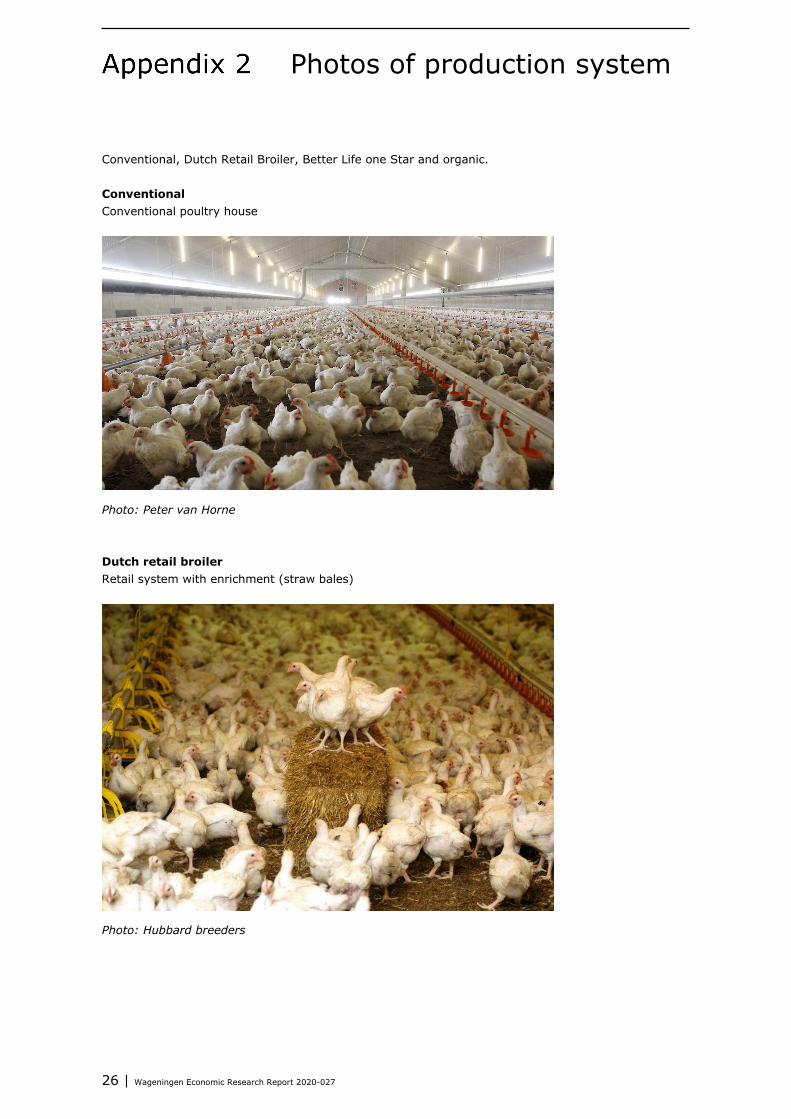
Better Life one Star Better Life one-Star system with a covered outdoor area
Photo: Hubbard breeders
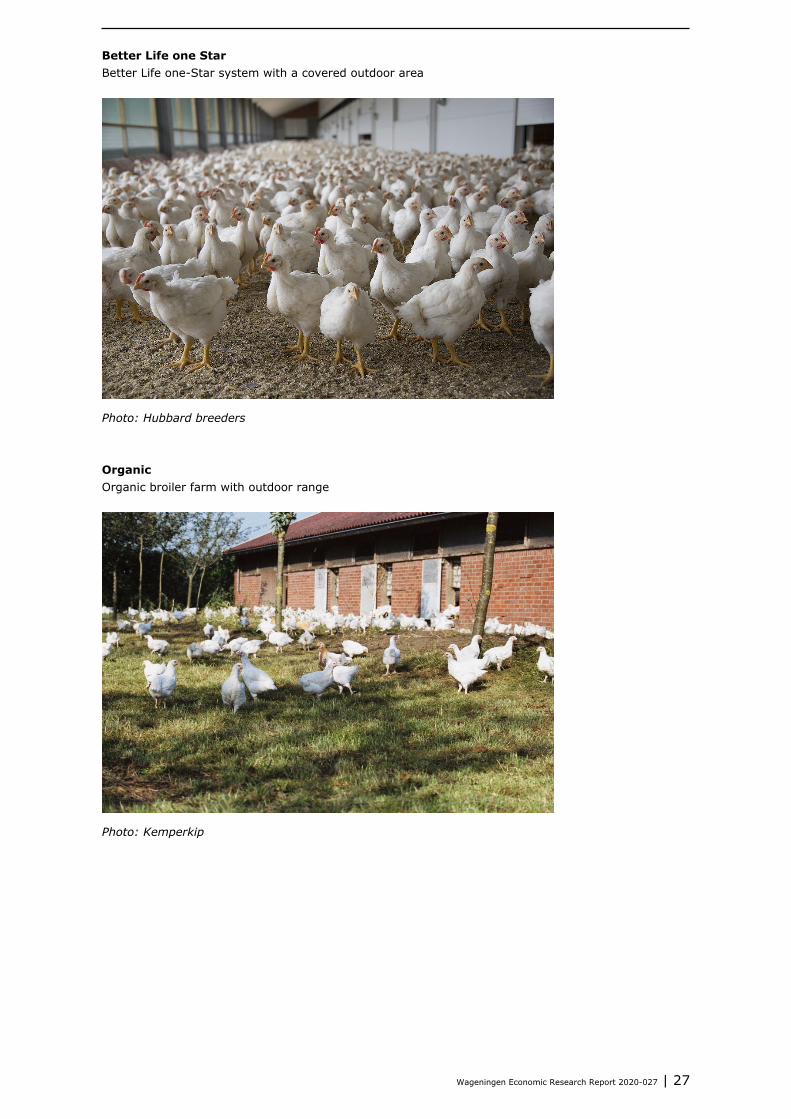
Organic Organic broiler farm with outdoor range
Photo: Kemperkip
Wageningen Economic Research P.O. Box 29703 2502 LS The Hague The Netherlands T +31 (0)70 335 83 30 E [email protected] www.wur.eu/economic-research Wageningen Economic Research REPORT 2020-027
The mission of Wageningen University & Research is “To explore the potential of nature to improve the quality of life”. Under the banner Wageningen University & Research, Wageningen University and the specialised research institutes of the Wageningen Research Foundation have joined forces in contributing to finding solutions to important questions in the domain of healthy food and living environment. With its roughly 30 branches, 5,000 employees and 12,000 students, Wageningen University & Research is one of the leading organisations in its domain. The unique Wageningen approach lies in its integrated approach to issues and the collaboration between different disciplines.

The mission of Wageningen University & Research is “To explore the potential of nature to improve the quality of life”. Under the banner Wageningen University & Research, Wageningen University and the specialised research institutes of the Wageningen Research Foundation have joined forces in contributing to finding solutions to important questions in the domain of healthy food and living environment. With its roughly 30 branches, 5,000 employees and 12,000 students, Wageningen University & Research is one of the leading organisations in its domain. The unique Wageningen approach lies in its integrated approach to issues and the collaboration between different disciplines.
Wageningen Economic ResearchP.O. Box 297032502 LS Den HaagThe NetherlandsT +31 (0)70 335 83 30E [email protected]/economic-research
Report 2020-027ISBN 978-94-6395-366-5 P.L.M van Horne
Economic aspects within the Greenwell sustainability assessment model
Economics of broiler production systems in the Netherlands