Embed Size (px)
Citation preview

Economics of the gum arabic value chain in
Senegal
Gaudiose Mujawamariya
Thesis committee Thesis supervisor Prof. dr. ir. E.H. Bulte Professor of Development Economics Wageningen University Thesis co-supervisors Dr. C.P.J. Burger Associate professor, Development Economics Group Wageningen University Dr. ir. M.F.C. D’Haese Professor, Department of Agricultural Economics Ghent University, Belgium Other members Prof. dr. F.J.J.M. Bongers, Wageningen University Prof. dr. E.C. van Ierland, Wageningen University Dr. D. Lesueur, Centre de Coopération Internationale en Recherche Agronomique pour le Développement, Montpellier, France Dr. A. van Tilburg, Wageningen University This research was conducted under the auspices of the Wageningen School of Social Sciences
Economics of the gum arabic value chain in Senegal
Gaudiose Mujawamariya
Thesis
submitted in fulfilment of the requirements for the degree of doctor
at Wageningen University
by the authority of the Rector Magnificus
Prof. dr. M.J. Kropff,
in the presence of the
Thesis Committee appointed by the Academic Board
to be defended in public
on Monday 1 October 2012
at 11 a.m. in the Aula.
Gaudiose Mujawamariya
Economics of the gum arabic value chain in Senegal
PhD Thesis, Wageningen University, Wageningen, NL (2012)
With references, with summaries in English, Dutch, and French.
ISBN: 978-94-6173-368-9
1
TABLE OF CONTENTS
Introduction 6
1.1 Problem statement 7
1.2 Study objective and research questions 10
1.3 Thesis outline 11
The setting: Acacia senegal and gum arabic trade in Senegal 13
2.1 Introduction 13
2.2 Acacia senegal and gum arabic 14
2.3 Historical context of gum trade in West Africa 19
2.4 Recent trends in gum arabic production and trade 21
2.5 Organisation of the gum supply chain in Senegal 24
2.6 Description of study area, livelihoods and gum arabic collection 28
Market considerations for gum arabic collection in Senegal 34
3.1 Introduction 34
3.2 Methodology 38
3.3 Results 53
3.4 Discussion and conclusion 66
Behaviour and performance of traders in the gum arabic supply chain in Senegal:
investigating oligopsonistic myths. 70
4.1 Introduction 70
4.2 Oligopsony markets 73
4.3 Methodology 82
4.4 Results 92
4.5 Discussion and conclusions 115
Appendix 4A 119
2
Quality of gum arabic in Senegal: linking the laboratory research to the field assessment 120
5.1 Introduction 120
5.2 Quality definition and relevance 123
5.3 Aspects of gum arabic quality 126
5.4 Methodology 130
5.5 Results 135
5.6 Discussion and conclusion 147
Appendix 5A 150
Private versus communal tenure systems in gum arabic collection 156
6.1 Introduction 156
6.2 Brief historical evolution of the gum arabic collection systems in Senegal 160
6.3 Methodology 164
6.4 Results 177
6.5 Discussion and conclusions 183
Discussion and conclusions 186
7.1 Introduction 186
7.2 Summary of the main findings 187
7.3 Policy implications 192
7.4 Limitations and future research 195
References 197
Summary 222
Samenvatting 227
Résumé 233
Acknowledgements 239
Funding 244
3
LIST OF TABLES
Table 2. 1. Main importers of gum arabic from Senegal in 2000-2009 22
Table 3. 1. Summary of factors influencing gum collection and choice of sale outlet 51
Table 3. 2. Overview of mean values of determinants of gum collection, group membership
and choice of sale place by region 54
Table 3. 3. Overview of mean values of choice-specific determinants of the choice of sale
place by region and sale place 57
Table 3. 4. Probit results of the choice for being in a group (1: being in a group; 0: not being
in a group) 59
Table 3. 5. Estimation results for gum quantity: IvTobit model (quantity collected (log)) 61
Table 3. 6. Estimates of alternative-specific conditional logit model of sale place choice
(village (0) or market (1)) 64
Table 4. 1. Features and determinants of gum arabic trade 81
Table 4. 2. Descriptive statistics of gum trade components 93
Table 4. 3. Average individual shares and normalised Herfindahl indices in gum markets 99
Table 4. 4. Descriptive statistics of trader characteristics influencing market share 101
Table 4. 5. Descriptive statistics of market characteristics influencing market share 102
Table 4. 6. Gllamm results for traders’ market shares (percentage) 104
Table 4. 7. Descriptive statistics of trade characteristics influencing gross margins 111
Table 4. 8. Weighted least square regression results for traders’ gross margins (CFA/kg) 112
Table 5. 1. Functions of gum arabic in food products 127
Table 5. 2. Sudan classification of gum arabic 129
Table 5. 3. Field assessment of quality and results of chemical analyses for 27 gum arabic
samples 136
Table 5. 4. Assessment of fulfilment of quality requirements for samples of gum arabic 137
4
Table 5. 5. Two-way table: Gum cleanliness X Size of gum nodule 138
Table 5. 6. Descriptive statistics of determinants of quality supply 140
Table 5. 7. Ordered logistic results (Nodule size: 4 categories in SPZ, 3 categories in ES;
Nodule cleanliness 3 categories in SPZ and ES) 141
Table 6. 1. Values of �/� at N=1000 170
Table 6. 2. Exogenous variables and data sources to the analysis of transition in gum arabic
collection systems in Senegal 174
Table 6. 3. Characteristics of collection management system 177
Table 6. 4. Characteristics of mixed management systems 178
Table 6. 5. Probit model (0: CMS, 1: MMS) and Flogit Model (Gradient of transition) of
transition in gum arabic collection systems in Senegal 180
5
LIST OF FIGURES
Figure 2. 1. The Gum belt in Africa 17
Figure 2. 2. Map of Senegal and study area (Edited) 18
Figure 2. 3. Exports of gum by Senegal and Sudan (2000-2009) 21
Figure 2. 4. Price trends in Senegal and Sudan (2000-2009); FOB prices 23
Figure 2. 5. Supply chain of raw and processed gum arabic 25
Figure 4. 1. The problem of double marginalisation for successive monopsonies 77
Figure 4. 2a. Prices, costs and margins per categories of traders in the Sylvopastoral Zone 97
Figure 4. 2b. Prices, costs and margins per categories of traders in Eastern Senegal 97
Figure 5. 1a. Simulation of quality supply response to changes in price at average values
(pooled data) 145
Figure 5. 1b. Simulation of quality supply response to changes in price in SPZ if
management=0, training=1, sale choice=1 145
Figure 5. 1c. Simulation of quality supply response to changes in price in ES if
management=1, training=1, sale choice=1 146
Figure 6. 1. Labour productivity and value of time 166
Figure 6. 2. A comparison of the regulated and unregulated systems 172
Figure 6. 3. Threshold in tenure systems 173
6
Introduction
Gum arabic is the product of Acacia senegal, a tree species which is naturally suitable for
(semi) arid regions. It is important for its environmental and various domestic and industrial
functions (Barbier, 1992; Fagg and Allison, 2004; Wickens et al., 1995). Despite the
availability of natural and synthetic close substitutes (e.g., ARS, 2007), gum arabic still has an
important international market specially in the European Union. It has wide industrial usage
in food and medicine such as being an additive in the food industry (in production of
beverages like Coca-Cola, juices, and confectionary), in the pharmaceutical and cosmetic
industry as well as in the production of paints, post stamps, matchsticks to name some
(Rahim, 2006; Rahim et al., 2007). Although gum arabic is just used as one of the ingredients
in these different industries, this does not make it less important. The current world annual
demand of gum arabic is estimated between 60,000 and 70,000 tons but its annual supply only
reaches around 55,000 tons and hence demand is currently not satisfied by the producer
countries (Chrétin et al., 2008). Furthermore, smaller producer countries such as Senegal
seem not to be able to increase their international market share which might be associated
with problems of developing internal markets including the lack of necessary price incentives
for the collection of gum.
Gum is generally collected in the dry season and hence the harvesting does not
coincide with agricultural or pastoral activities thereby being an important additional source
of income for the rural collectors (Chrétin et al., 2008). It enables collectors to diversify their
activities and it is also a risk aversion strategy of rural households in face of crop failure,
sudden death of livestock or other threats to household survival (Chrétin et al., 2008;
Freudenberger, 1993a).
However, the viability of Acacia senegal and consequently of gum collection, is faced
with institutional constraints: the lack of secure and clear property rights to land and Acacia
7
trees, difficult access to market, low prices due to high marketing and transaction costs, and
supply of low quality. By taking the case of gum arabic collection and commercialisation, this
research attempts to investigate factors influencing the performance of the supply chain. Two
themes are the main focus: (1) market effectiveness: including on the one hand, the
determinants of market access and its influence on collectors’ decisions, and on the other
hand, the performance of traders in market; and (2) market-driven production effectiveness:
including the terms of institutionalisation of quality supply and of realising changes in
resource governance systems.
1.1 Problem statement
Gum production and marketing is constrained by the difficult access collectors have to
efficient markets and their strong belief of being exploited by traders in terms of fixing buying
prices, unreliable quality of supplied gum and unclear organization of the collection systems.
Local markets for gum arabic are often informal, with the largest proportion of gum intended
for the export chain while a smaller proportion of the lowest quality gum or processed gum
are locally consumed (e.g., in traditional healing, laundry starch, sweets). There are many
actors at different levels of the gum supply chain: collectors; village traders involved in
monetary and non-monetary transactions where gum is supplied in exchange of money and/or
low-value commodities for daily consumption which are often taken ahead of
harvest/collection; mobile traders who operate in weekly rural markets; transporters; a few
wholesalers and even fewer exporters and processing companies (DEFCCS, 2005; Chrétin et
al., 2008). In trading relations, collectors claim to be disadvantaged in terms of low prices
associated with the lack of information, need for money to cover daily needs, access to
markets and exploitation by traders. Obviously, as these constraints negatively influence the
collectors’ production incentives; it is important to understand how producers determine
participation in a market.

8
The income of the collecting household will also be influenced by the price received
from primary traders; this price depends on conditions under which traders can buy and sell
gum and hence on factors of value distribution along the supply chain. Traders are reproached
to retain excessive margins such that in the end collectors are paid low prices for their
product. Yet, one needs to realise that traders also are subjected to marketing costs (e.g.,
transport, taxes, storage and grading) and transaction costs (e.g., search, information and
monitoring, risk premium charged due to asymmetric information on quality supplied, losses
due to commitment failures by producers and price uncertainty) in addition to the competition
arising from coexistence of different structures: spot markets; interlocked contracts with
village traders (exchange of daily commodities for harvested gum); and contracts between
companies and large transporters. The performance of traders needs to be investigated in
order to understand the factors influencing the value distribution along the chain and to
substantiate the claims on their behaviour.
Senegal’s gum is internationally recognized to be of good quality due to natural
growing conditions of the Acacia trees; but to respect and maintain these high standards, high
costs are spent at the wholesale and export level on sorting and grading. Such costs are made
at the detriment of the income of the collectors who receive low prices partly because despite
being sensitized on the quality issues, they continue to use inappropriate harvesting tools, to
mix gum arabic with other types of gum (e.g., gum seyal which is more fragile), to not
sufficiently dry and inadequately store gum which as a result loses its quality. If quality
standards were enforced at the producers’ level, costs at the higher levels of the chain could
be reduced and collectors could get rewarded for supplying good quality gum in terms of
higher prices. However economically sound this statement may be, enforcing such standards
might not be directly relevant if quality improvements do not respond to the users’
expectations and if no grading system is in place to guide collectors and traders. Therefore, it

9
is pertinent to establish a link between collectors and user in terms of quality specifications
and investigate what determines supply of quality.
Furthermore, collection of gum is organized in communal or open access forests
where land and tree rights are not well defined as reflected by numerous cases of thefts that
were reported. Formal and customary rights’ coexistence often lead to confusion: property
rights for land and forest products in general are formally defined by the Forest code,
however, indigenous acquisitions through lineage and kinship and tacit appropriations are also
commonly found (Freudenberger, 1993a; DEFCCS, 2005). Such ambiguity may inhibit
planting and management of Acacia senegal trees, constrain collection and lead to low quality
of the collected gum. There are emerging cases of private collection systems either by
individuals or companies which can be associated with efficiency both in terms of collection
quantity and quality. Understanding the limitations to the transition towards such private
tenure systems for gum collection helps to understand the reasons of continued wide
prevalence of communal systems and appropriate conditions needed for changing towards
these potentially efficient private systems.
The current research takes a market perspective for studying the effectiveness of
production in response to market conditions. While the production of gum arabic largely
depends on exogenous factors including environmental conditions, the market remains
important as its incentives can determine the quantity and quality that is collected and
supplied. The selection of Senegal as the study area is motivated as it is one of the gum
producing countries that was historically trading its gum reputed for being of good quality,
but that seems unable to increase its current production levels due to institutional market
inefficiencies.

10
1.2 Study objective and research questions
The main research objective is to investigate factors that influence the performance of the
gum arabic supply chain. Specifically, we investigate first the market effectiveness in terms of
the behaviour and decision making process of gum collectors, and gum traders’ behaviour and
performance; and second the production effectiveness in response to market conditions in
terms of quality aspects in marketing of gum and aspects of governance systems of gum
collection.
The following research questions are formulated:
(a) with regard to market effectiveness,
• what are the determinants of the collector’s decision to collect gum and the amount to
collect, and consecutively of the choice of a market outlet (sale place)?
• what are the determinants of value distribution along the gum arabic supply chain in
relation to traders’ behaviour and performance?
(b) with regard to market-driven production effectiveness,
• what is the link between the quality supplied by collectors and users’ quality
requirements and what are the factors influencing the supply of quality by gum
collectors?
• what are factors that influence the transition from communal organisation of collection
to efficient private collection systems?
The above research questions are investigated in Senegal where two zones of gum production
are purposely chosen for the study: the Northern zone which is sylvopastoral with traditional
gum collection activities in the regions of Louga, Matam and Saint Louis and the Eastern
zone which is agro-sylvopastoral with recent interest in collection of gum arabic in the region
of Tambacounda.
11
1.3 Thesis outline
This thesis follows an outline consistent with the above research questions. Yet, before
entering in their subject matter, the context of gum arabic collection and trade in Senegal is
described in chapter 2. The chapter also highlights the livelihood setting of the study area and
lists the constraints to gum marketing which also limit the people’s incentives to collect gum.
Chapters 3 and 4 examine the behaviour and performance of market chain actors.
Chapter 3 tests the hypothesis that if collectors were able to access ‘better and more
remunerative’ market, it would give them more incentives to collect gum; this is because high
transaction costs restrain collection and marketing of gum arabic. Results confirm that better
returns from gum marketing increase collection and high proportional transaction costs
restrict access to market. Chapter 4 focuses on the sequential chain of gum traders in an
investigation of whether their oligopsonist structure leads to lower prices in a multiple
marginalisation tendency. No evidence of oligopsonist power is found; rather the traders’
margins positively depend on costs, idiosyncratic and systemic risk, and uncertainty.
Chapters 5 and 6 shift the focus to aspects that are pertinent to the production
performance in the gum supply chain. Chapter 5 concentrates on quality of gum arabic. In the
first stage, the quality assessment by collectors and primary traders is compared to the users’
requirements that are measurable in a laboratory and in the second stage, determinants of
quality supply in terms of two attributes namely the size and cleanliness of gum nodules are
analysed. Quality as required by the user is not directly linked to the visible quality attributes
in the field which are influenced, among others, by harvest and post-harvest practices, and by
price expectations. Chapter 6 investigates factors that influence the currently slow transition
from communal to private systems of gum collection with mixed systems of coexistence of
both communal and private tenure found between these extremes. The shift towards private
forestry systems is initiated when the tree resources are available, markets are developing,
12
labour for collection is available, competition for resources is high, forests where gum is
collected were located near to the village or market prices are high enough to attract
occasional collectors who reinforce the effect of competition.
Finally, in Chapter 7, the main results are discussed and conclusions are drawn from
the study. Various policy interventions are identified with the purpose of improving the
performance of the gum supply chain and consequently enhancing the livelihoods of
collectors and other gum-dependent actors in Senegal. In the light of the limitations to the
current study, potential areas for future research are suggested
13
The setting: Acacia senegal and gum arabic trade in Senegal
2.1 Introduction
Gum arabic is a natural exudate from Acacia trees. There are many types of gum but the best
gum is produced by Acacia senegal (L.) Willdenow and Acacia seyal Delile; the former is
considered to yield gum of better quality (Elmqvist et al., 2005). Gum arabic is a natural oil-
in-water emulsifier (Aoki et al., 2007). It is used in production of soft-drinks, including cola-
type drinks as well as in confectionary, pharmaceutics and photography. Small quantities are
used locally as food, laundry starch and in traditional medicine (Elmqvist et al., 2005).
Worldwide, Sudan is the largest producer and exporter of gum arabic, followed by
Chad and Nigeria, together they bring about 45,000 tons of gum arabic to the market each
year (Partos, 2009). Senegal, which was once a large producer and exporter of gum arabic,
has seen its market share significantly declined over the years: in the late 50’s, Senegal’s
exports of gum arabic accounted for more than 10 per cent of the world exports; it is now in
the rank of small producers whose exports totalise less than 5 per cent of world export (FAO,
1971; Marfaing, 1991; DEFCCS, 2005; ITC, 2008). Low exports imply low production and a
loss of opportunity for collectors of gum arabic who now fail to improve their livelihoods
through income that could be generated from larger sales of gum. Such livelihoods, in the arid
and semi-arid regions where gum arabic is collected, revolve around short annual rains
followed by long periods of drought. Economic activities in these regions are pastoralism,
small-scale agriculture, and forest exploitation. Pastoralism mainly concerns grazing of
animals in a pattern of transhumance while searching for water and pastures. Agriculture is
limited by low soil fertility, insufficient water and declining rainfall (Hall, 2007). Exploitation
of timber and non-timber forest products is done with the purpose of labour diversification
and consumption smoothing (Ngugi and Nyariki, 2005). Gum arabic, produced by Acacia
senegal fits into these livelihood strategies: pastoralists use the proceeds from gum sales to
14
rebuild livestock following decimations or thefts; farmers undertake collection of gum to
compensate for crop failure; or for consumption smoothing (Barbier, 1992; Freudenberger
1993a; Wickens et al., 1995; Fagg and Allison, 2004; VALEURS, 2005; Chrétin, 2008). For
producing countries, gum arabic also generates income through its exports thereby
contributing to diversification of export products and consolidation of these countries’
economies (Mbaye, 1988).
2.2 Acacia senegal and gum arabic
Acacia trees belong to the botanical family of Leguminosae, a predominant species of the
group of Mimosaceae. There are more than two hundred species of Acacias, but only a few of
them produce gums. The only species producing gum arabic, as per FAO definition, are
Acacia senegal and Acacia seyal which have different properties and are also divided into
several varieties: for instance senegal, kerensis or rostrata for Acacia senegal and fistula or
seyal for Acacia seyal (FAO, 1971; Cossalter, 1991; Saint Sauveur, 1994; JECFA, 2006;
Couteaudier, 2007). The current research specifically concerns gum arabic as the dried
exudate produced naturally or by tapping from the trunk and branches of Acacia senegal trees.
Gum arabic exudes from cracks in bark of Acacia senegal trees. These cracks occur
mostly in the dry season as a result of natural stress factors including high temperatures from
the hot dry wind, insect or animal wounds, or cuts made into the bark (Giffard, 1966; Webb,
1985; Freudenberger, 1993a). Gum collection can be classified into simple gathering of
nodules that have oozed from the tree or deliberate tapping of trees where the collector makes
a cut and returns to the tree several days later to harvest the gum. Tapping is hence performed
to ease exudation and extract the maximum quantity of gum from the tree; it however follows
a particular technique aimed at preventing damage to the tree (Okatahi and Onyibe, 1999).
Tapping is labour intensive but it is also harsh because of the dense spiny foliage of the gum
trees; the Acacia thorns scratch the collector as he scrapes the bark (Webb, 1985). While
15
instances of wild gum gathering are still observed in certain gum producing countries (e.g., in
Kenya (Wekesa et al., 2010) and Namibia (NASSP, 2006)), tapping is mostly practiced in
natural or artificial plantations (e.g., in Senegal (AGC, 2007)), or in domesticated plantations
(e.g., in Sudan (Rahim, 2006)). In Cameroon, wild collection coexists with domestication
undertaken through agroforestry initiatives (Njomaha, 2008; Palou Madi et al., 2009).
The tree productivity of Acacia senegal ranges from 20 grams to 2 kg of gum arabic
depending on the tree; it is on average, 250 grams per annum (Iqbal, 1993; Sall, 1997; ITC,
2008). The highest yields are observed on trees aged from 8 to 13 years (CNI, 2008).
The oldest records of gum arabic use date from 4000 BC in Egypt where it was used
for mummification, medicine or making clothing and ink (Alland, 1944; Giffard, 1966; CNI,
2008). Nowadays, gum is used in food and non-food industries. Food industries absorb about
80 per cent of the gum market using it for instance as an adhesive, emulsifier, thickener,
binding and stabilizing agent in confectionery, bakery, beverages, frozen dairy products, etc.
(Wickens et al., 1995; Fagg and Allison, 2004; CNI, 2008; Phillips, 2012).
Non-food usage includes pharmaceutical applications in making syrups, tablets and as
an ingredient in different treatments of haemorrhage, stomach ulcers, obesity, etc. (Khan and
Abourashed, 2010). Ali et al. (2009) suggest a possible use of gum arabic in dentistry because
it enhances dental remineralisation and has some antimicrobial activity. Ushida (2012) and
Osman et al. (2012) propose the use of gum in obesity and gout treatment respectively. In
photography, lithography, pottery, house building and cosmetics, gum is used to add strength
and viscosity to raw materials (Barbier, 1992, 2000; Wickens et al., 1995). A substantial local
market for gum arabic exists in Senegal where it is used as a starch for laundering ceremonial
clothes (Fagg and Allison, 2004).
Studies in the 1970s predicted a dark future for gum arabic demand due to the
availability of natural and synthetic substitutes such as modified starches, algae extracts,
16
xanthan gum, or corn fibber (FAO, 1971). However, these other gums did not fulfil the
promise and despite that prediction, the wide range of uses explains the continued demand for
gum arabic (DEFCCS, 2005; ARS, 2007).
Wood from Acacia senegal is a secondary product to gum. It is usually harvested at
the end of the gum production cycle after 15 to 25 years. Wood is used for making roofing
poles, lining wells or framing huts (Fagg and Allison, 2004). The tree also produces firewood
and makes good quality charcoal (Chrétin et al., 2008). The bark of roots is twisted and
commonly used as a rope and for making mats (Fagg and Allison, 2004).
Acacia senegal is rich in proteins and phosphorus (Cossalter, 1991). It is therefore an
important source of fodder for the herbivores especially during dry periods (Wickens et al.,
1995; Mallet et al., 2002; Fagg and Allison, 2004).
Acacia senegal trees are also important for the ecology of the arid and semi-arid
zones. These trees help to fertilise the soil through the decomposition of leaves which
reinforces the anti-erosive roots of the tree (Mallet et al., 2002). They fix atmospheric
nitrogen, and serve for windbreak and dune fixation (Giffard, 1966; Gerakis and Tsangarakis,
1970; Cossalter, 1991; Barbier, 1992; Wickens et al., 1995).
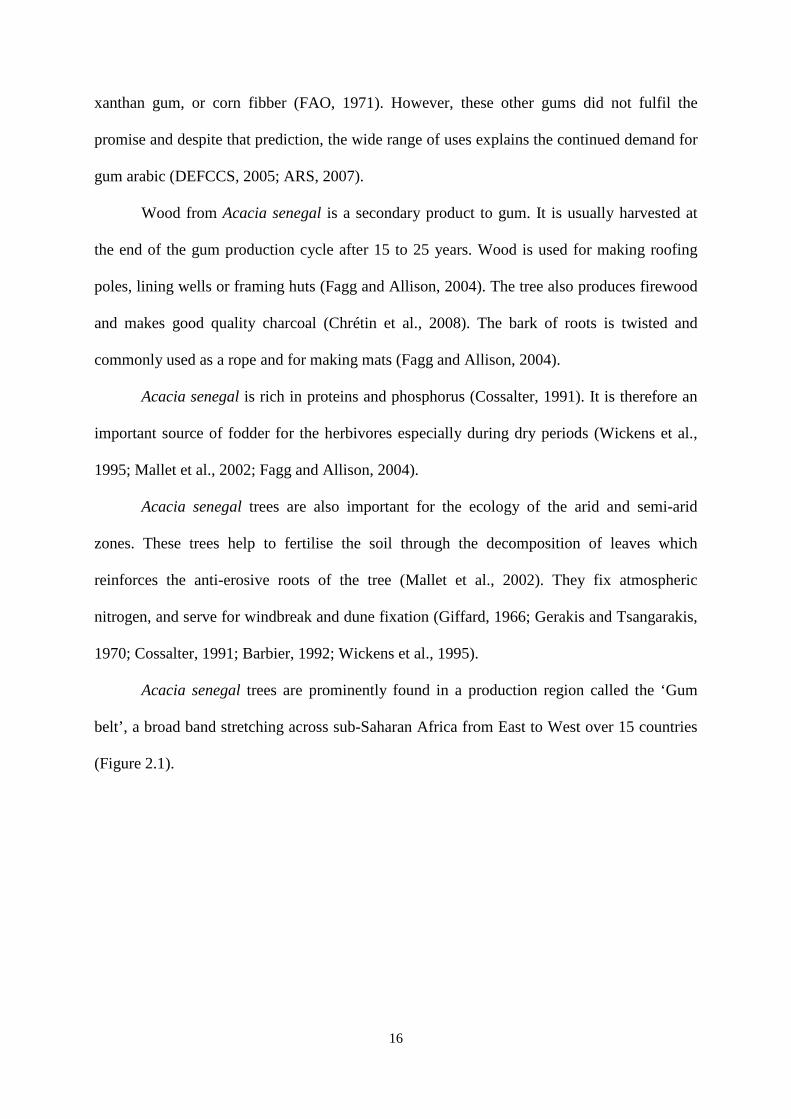
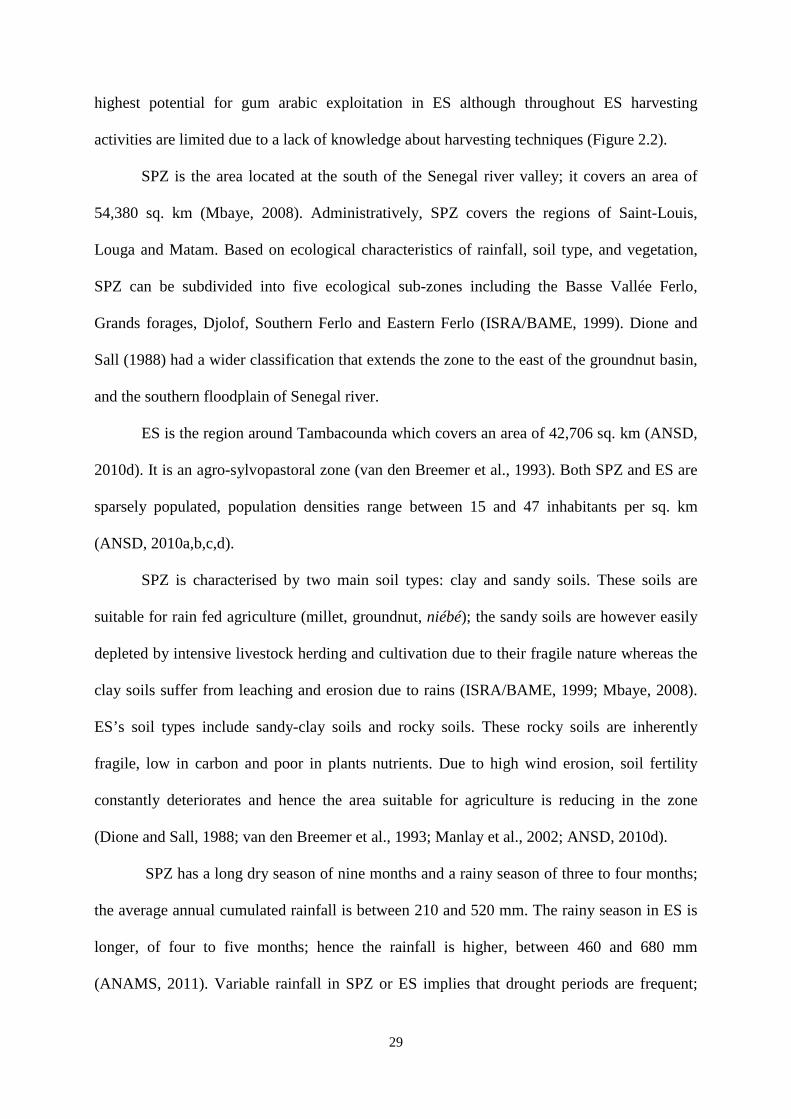
Acacia senegal trees are prominently found in a production region called the ‘Gum
belt’, a broad band stretching across sub-Saharan Africa from East to West over 15 countries
(Figure 2.1).
17
Figure 2. 1. The Gum belt in Africa
Source: Assoumane et al. (2009)
Acacia senegal trees are also found in southern Africa, India or Pakistan (Cossalter, 1991;
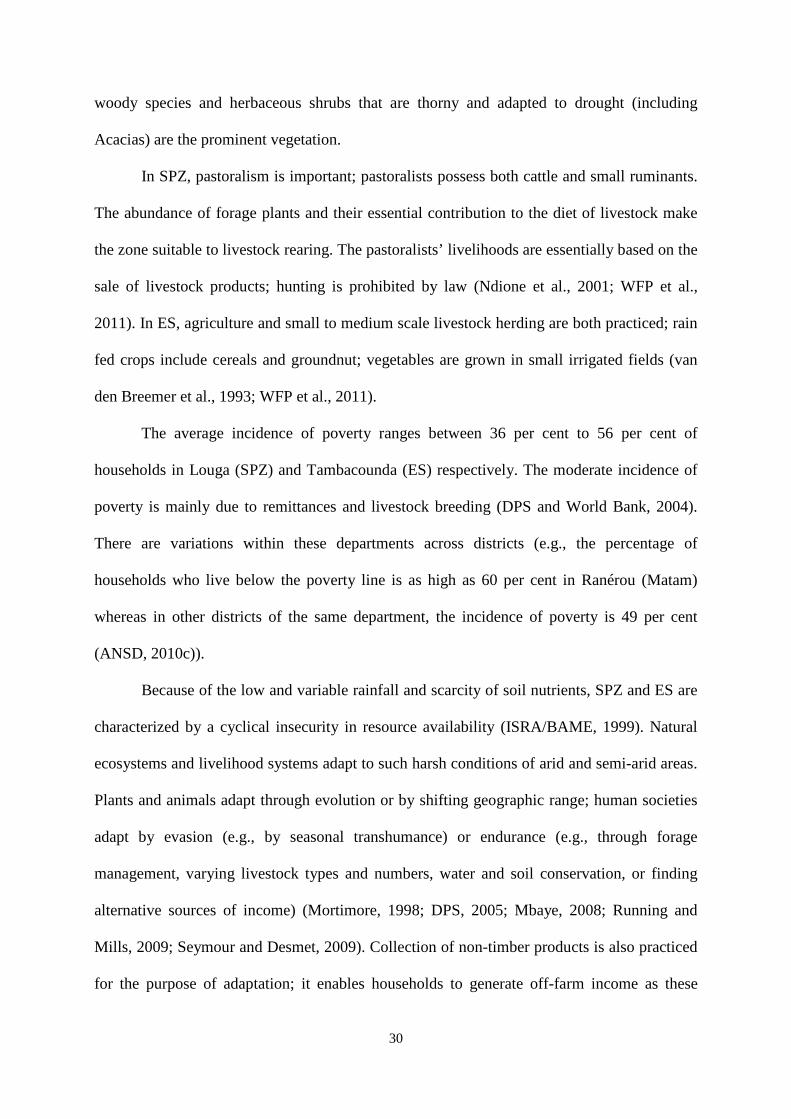
NGARA, 2008). In Senegal, the gum production zone corresponds to the northern
Sylvopastoral Zone (SPZ) commonly called the Ferlo and the agro-sylvopastoral zone also
known as Eastern Senegal (ES) (Figure 2.2)
18
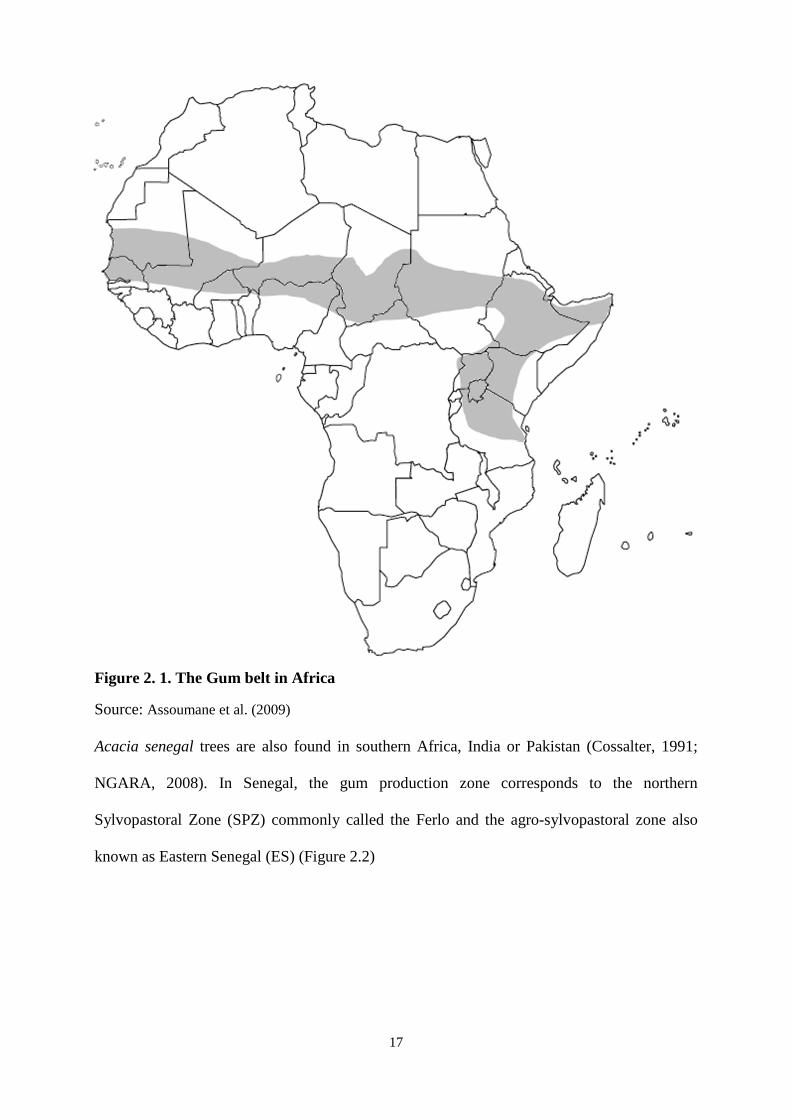
Figure 2. 2. Map of Senegal and study area (Edited)1
SPZ covers almost all parts of the regions of Louga, Saint Louis and Matam and ES covers
the region of Tambacounda. ES has high potential for gum arabic but collection is not widely
undertaken due to lack of knowledge on harvesting techniques. Furthermore, traders
concentrated their procurement activities in the SPZ with the aim of minimising transport
costs thereby maximizing their profits. Such choice was not to the advantage of producers in
the landlocked ES who received low prices and had to abandon gum collection (Asylia Gum,
Unpublished). Recent initiatives to revive the sector were undertaken by EXPERNA (Entente
intervillageoise pour la préservation et l’exploitation des ressources naturelles et agricoles
du Boundou/Gadiaga), a producer association established in ES. Its aim is to valorise the gum
product by promoting the ownership and management of natural resources in general and
Acacia senegal trees in particular (EXPERNA, 2006).
1 Edited based on World Food Programme et al.’s (2011) livelihood zones of Senegal.
0 25 50 100 150 200 Kilometres
19
2.3 Historical context of gum trade in West Africa
Gum arabic has been traded for several centuries. Webb (1985) documented that before the
European maritime revolution, gum arabic used in Europe had come from Arabia and South
Sudan. Portuguese, French and British sailors discovered gum arabic on the West coast of
Africa in the 15th century and by the 16th century, it was traded at the embouchure of Senegal
river (Saint Louis) from where it began to reach European markets; it became an important
commodity in barter systems together with cloth, sugar, tea and metals in exchange for gold,
gum arabic and ivory (Commissariat de l’AOF, 1931; Webb, 1985; Sène, 1988).
From the second half of the 17th century, industrial uses of gum arabic in cotton calico
textile printing factories and in engraving copper plates induced a steady demand for gum
arabic; it was important such that it was given attention in the explanation of the mercantile
system of Great Britain (Smith, 1776; Webb, 1995). According to Alland (1944) and FAO
(1971), the Senegalese gum sector supplied more than 10 per cent of the world demand in the
17th century.
In the early 18th century, competition between British and French traders for control
over gum trade was intense such that in the first half of the century this competition led into
open hostilities during the 'Gum Wars' (Webb, 1997). Yet, gum exports from western Sahara
continued to increase, from 500 or 600 tons per year in the early 18th century to nearly double
that amount by the 1780s. Gum was the principal export product and its value even exceeded
the value of the slave export trade (Webb, 1985, 1995). Industries in Great Britain and France
were not the final users of much of the gum they imported; Webb (1995) confirmed that for
instance of the gum shipped from Senegal in 1832, only 18 per cent was retained for use in
France; the remainder was re-exported to other countries.
In the 1830s, gum exports from Senegal averaged 2,000 tons per year. This second
doubling took place despite the discovery of the dextrin in France. Dextrin was produced at
20
less than half the price of gum but it was difficult to conserve and hence not suitable to
several uses to which gum was put (Webb, 1985). By 1850s however, the importance of the
gum sector in Senegal was gradually being eclipsed by the growth of groundnut cultivation,
which was spreading from the Upper Guinean and Gambian coasts (Webb, 1985). The French
tried to increase their area of control through conquests such as of the Djolof in 1890, in order
to open the region to trade in gum arabic (Freudenberger, 1993a).
In 1922, France imported about 7,000 tons of gum out of which about 4,000 tons were
from Senegal and the remaining from Kordofan (Marfaing, 1991). Hence, despite the
increased groundnut production, colonial administration continued to show interest in gum
production. This interest is also illustrated by the different decrees promulgated by the
colonial government in 1936, 1937, 1953, 1955 and 1956. These decrees aimed at
(re)organising marketing of gum by determining the product chain, imposing prices and
suggesting techniques for improving productivity (Dabo, 1988; Freudenberger, 1988).
Following such measures, the gum sector continued to grow even after Senegal’s
independence: in 1971, gum exports were about 10,000 tons which made it the third producer
on the world market (DEFCCS, 2005). However, in the droughts of 1968-1974 about 70 per
cent of Acacia senegal trees perished (Poupon 1977 in Freudenberger 1993a). This led to
drastic declines in gum production and exports: from 1974 to 1991, exports averaged only
550 tons (computed from DEFCCS, 2005) and in rare cases these exports exceeded 1,000 tons
such as in 1974 and 1976. Reforestation efforts undertaken in the 1970s and 1980s by public
and private projects paid off by the mid-1990s, Senegal’s production levels and exports of
about 740 tons in 1996 climbed to about 1,050 tons in 1997. However, these exports fell
dramatically again at the end of the millennium mainly due to the lack of regeneration of trees
as a result of low rainfall levels (Sène and Ndione, 2007).
21
2.4 Recent trends in gum arabic production and trade
World production of gum arabic potential is estimated at around 60,000 tons per annum, of
which 50 per cent or more originate from Sudan. Nigeria and Chad alternately dispute the
second and third ranks among the producing countries (Alter Africa, 2009). The remaining
world market supply is shared between other countries including of Sahel West Africa and
East Africa (Iqbal, 1993; ITC, 2008).
Almost all gum arabic in the Sahelian zone is exported as raw gum. Senegal is an
exception, where in addition to raw gum exports domestic gum transformation is developed.
The processed spray-dried gum is exported; sweets and gum of low quality are sold in local
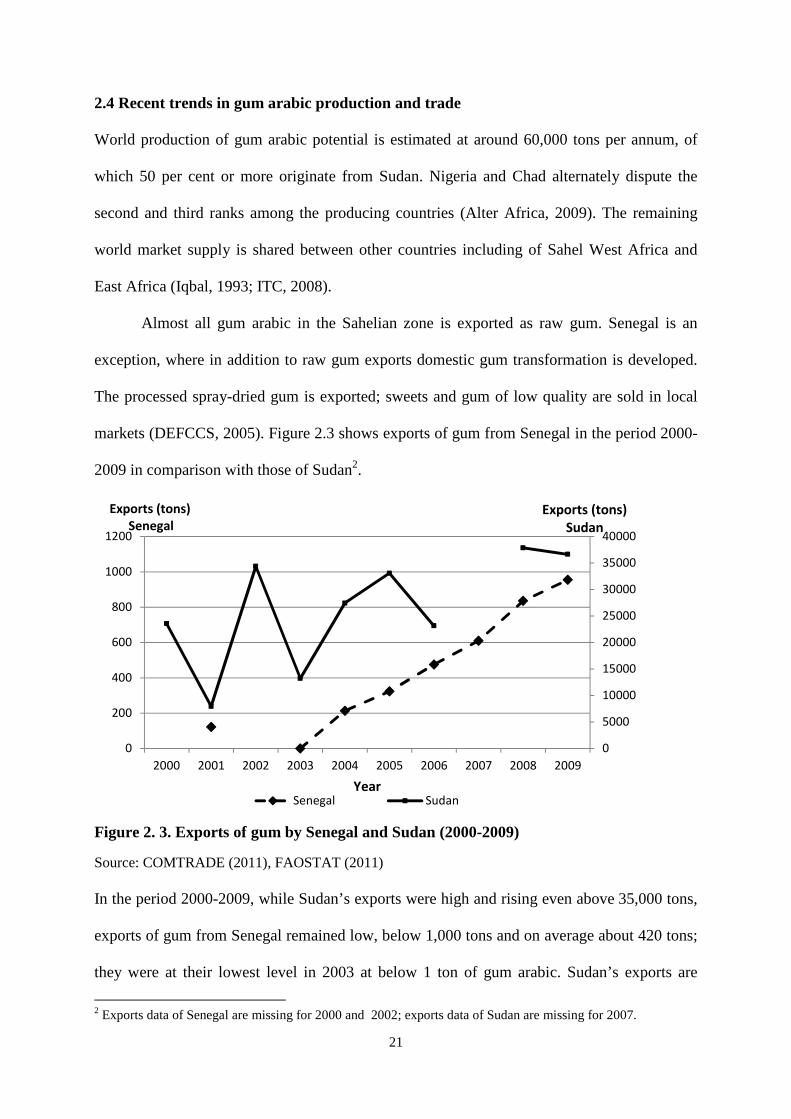
markets (DEFCCS, 2005). Figure 2.3 shows exports of gum from Senegal in the period 2000-
2009 in comparison with those of Sudan2.
Figure 2. 3. Exports of gum by Senegal and Sudan (2000-2009)
Source: COMTRADE (2011), FAOSTAT (2011)
In the period 2000-2009, while Sudan’s exports were high and rising even above 35,000 tons,
exports of gum from Senegal remained low, below 1,000 tons and on average about 420 tons;
they were at their lowest level in 2003 at below 1 ton of gum arabic. Sudan’s exports are
2 Exports data of Senegal are missing for 2000 and 2002; exports data of Sudan are missing for 2007.
0
5000
10000
15000
20000
25000
30000
35000
40000
0
200
400
600
800
1000
1200
2000 2001 2002 2003 2004 2005 2006 2007 2008 2009
Exports (tons)
Sudan
Exports (tons)
Senegal
YearSenegal Sudan
22
fluctuating, whereas exports of Senegal were slowly but steadily increasing: about 955 tons
were exported in 2009; indeed the sector’s revival is taking place since 2003. Diop (2005)
explained the low production level in Senegal was a consequence of (1) geographical factors
in production zones including landlockedness and poor infrastructure that constrain transport
and distribution channels; (2) marketing factors including that market structures may
constrain transactions, prices, competition, quality, and information; (3) organizational factors
including the lack of professionalism that constrain transparency and innovation in the gum
sector; and (4) political factors including government policies, land tenure systems and
financing that constrain the gum sector development. All these factors reduce incentives for
collectors to harvest gum.
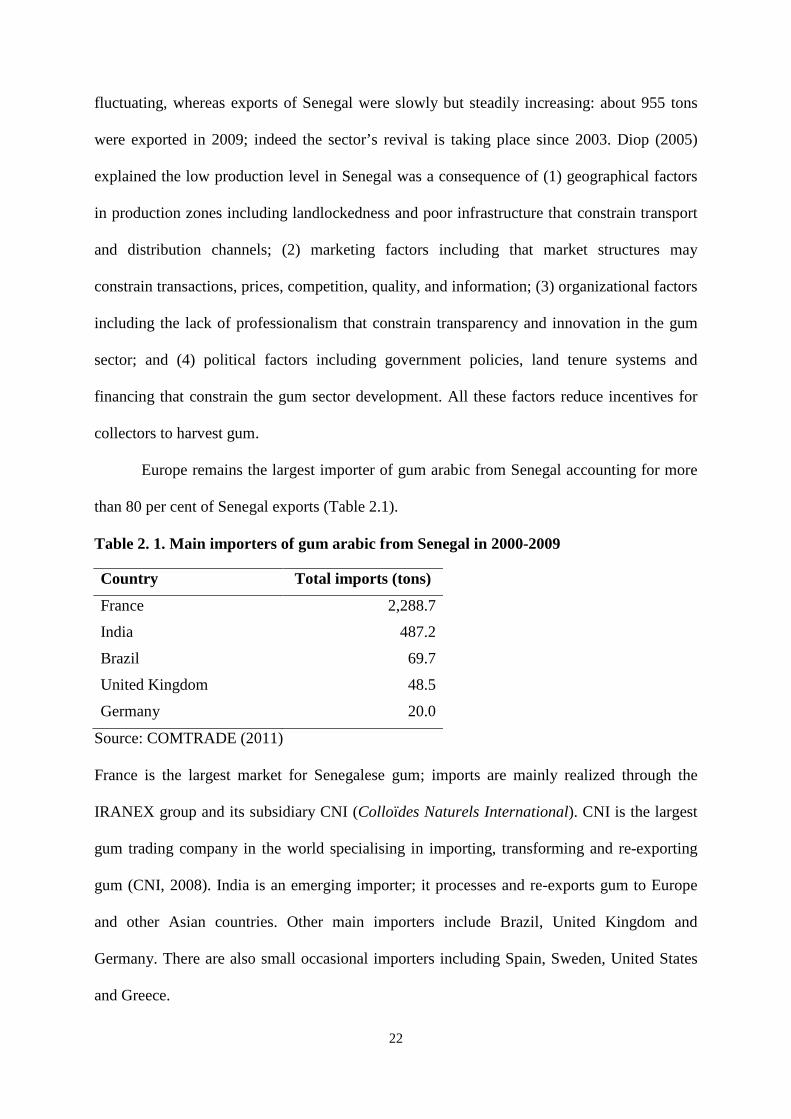
Europe remains the largest importer of gum arabic from Senegal accounting for more
than 80 per cent of Senegal exports (Table 2.1).
Table 2. 1. Main importers of gum arabic from Senegal in 2000-2009
Country Total imports (tons)
France 2,288.7
India 487.2
Brazil 69.7
United Kingdom 48.5
Germany 20.0
Source: COMTRADE (2011)
France is the largest market for Senegalese gum; imports are mainly realized through the
IRANEX group and its subsidiary CNI (Colloïdes Naturels International). CNI is the largest
gum trading company in the world specialising in importing, transforming and re-exporting
gum (CNI, 2008). India is an emerging importer; it processes and re-exports gum to Europe
and other Asian countries. Other main importers include Brazil, United Kingdom and
Germany. There are also small occasional importers including Spain, Sweden, United States
and Greece.
23
Important factors in the market of gum arabic are price, stability of supply, and
quality. Exporters fix prices in local markets by considering the FOB price of gum and the
local expenses for buying the gum (transport, packaging, cleaning, storing); the other actors in
the supply chain apply the same principle in fixing prices in the production regions based on
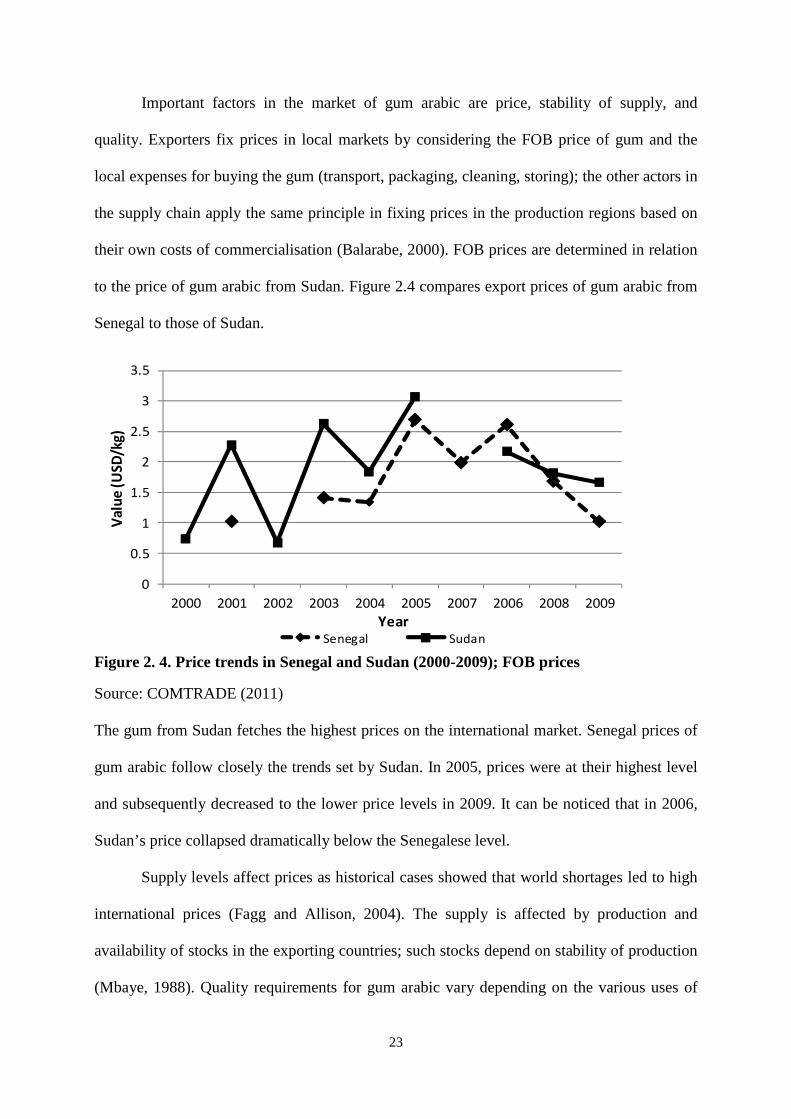
their own costs of commercialisation (Balarabe, 2000). FOB prices are determined in relation
to the price of gum arabic from Sudan. Figure 2.4 compares export prices of gum arabic from
Senegal to those of Sudan.
0
0.5
1
1.5
2
2.5
3
3.5
2000 2001 2002 2003 2004 2005 2007 2006 2008 2009
Va
lue
(U
SD
/kg
)
YearSenegal Sudan
Figure 2. 4. Price trends in Senegal and Sudan (2000-2009); FOB prices
Source: COMTRADE (2011)
The gum from Sudan fetches the highest prices on the international market. Senegal prices of
gum arabic follow closely the trends set by Sudan. In 2005, prices were at their highest level
and subsequently decreased to the lower price levels in 2009. It can be noticed that in 2006,
Sudan’s price collapsed dramatically below the Senegalese level.
Supply levels affect prices as historical cases showed that world shortages led to high
international prices (Fagg and Allison, 2004). The supply is affected by production and
availability of stocks in the exporting countries; such stocks depend on stability of production
(Mbaye, 1988). Quality requirements for gum arabic vary depending on the various uses of

24
gum; these requirements follow strict quality specifications (CNI, 2008). Grading of raw gum
is done only at the export level, based on the form of gum nodules, their sizes and colour, but
Senegal has not institutionalized a grading system as done in Sudan, Nigeria or Chad.
2.5 Organisation of the gum supply chain in Senegal
Better organisation of marketing chains has been recognised as a potential contributor to
improving supply and quality of gum arabic which would be beneficial for countries and
thereby collectors (Mbaye, 1988). At this moment, the degree of specialization in gum is low
in Senegal at collection and marketing level: at the collection level, collectors collect in the
dry season as a secondary activity, and at the market level, traders trade not only in gum
arabic, but mainly in other goods (food, non-food and other non-timber forest products).
The supply chain in Senegal is still organised following the traditionally practices of
colonial times. Private agents act on behalf of wholesalers, processors (Valdafrique) and
exporters. The sale of gum by collectors to traders is often based on barter exchanges of gum
in exchange of other commodities, or on informal contracts in which gum repays for credit or
commodities received earlier in the season. The role of the government is limited to
institutional support in terms of regulations which determine the supply chains, and fix
commercial norms including prices (Commissariat de l’AOF, 1931; FAO, 1971; DEFCCS,
2005).
A schematic overview of the current gum supply chain in Senegal is given in Figure
2.5. The main actors are: (a) local gum markets between gum collectors and local and mobile
traders; (b) transporters commonly called ‘camionneurs’ who own vehicles; (c) wholesalers;
and (d) exporters and processing company. In addition, a small branch of the chain involves
retailers for national consumption of the processed gum or gum of low quality. Each group is
discussed in more detail below.
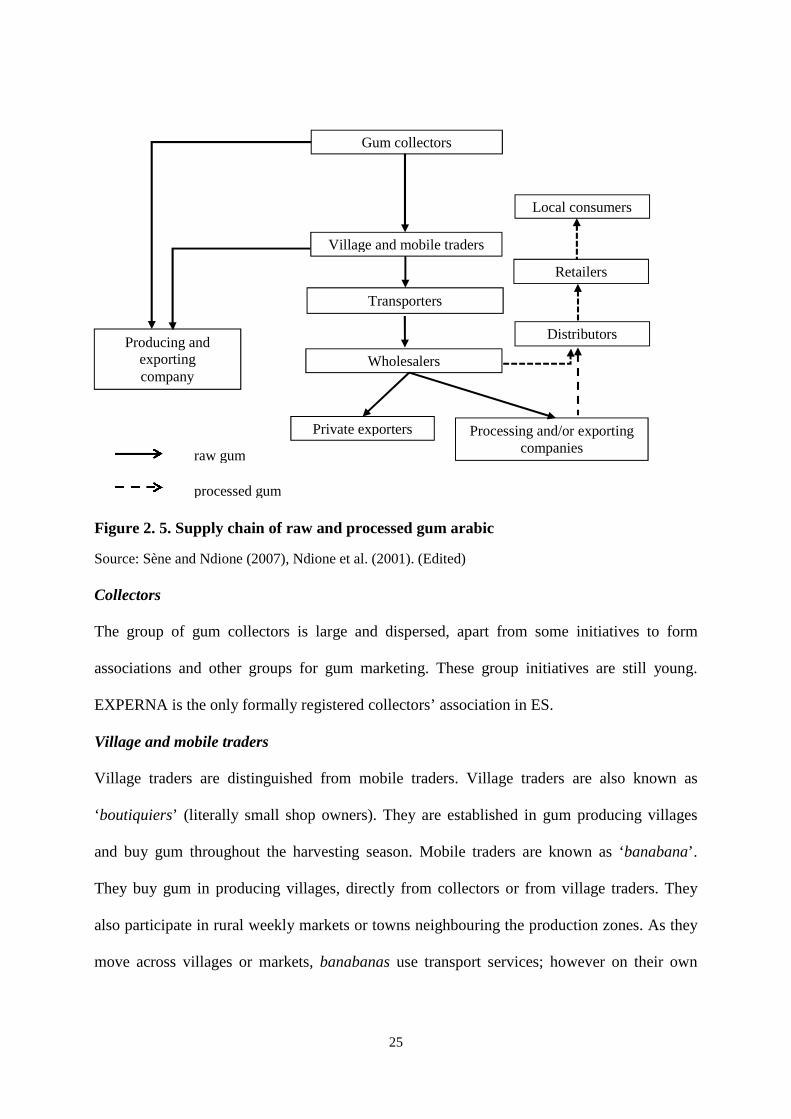
25
Figure 2. 5. Supply chain of raw and processed gum arabic
Source: Sène and Ndione (2007), Ndione et al. (2001). (Edited)
Collectors
The group of gum collectors is large and dispersed, apart from some initiatives to form
associations and other groups for gum marketing. These group initiatives are still young.
EXPERNA is the only formally registered collectors’ association in ES.
Village and mobile traders
Village traders are distinguished from mobile traders. Village traders are also known as
‘boutiquiers’ (literally small shop owners). They are established in gum producing villages
and buy gum throughout the harvesting season. Mobile traders are known as ‘banabana’.
They buy gum in producing villages, directly from collectors or from village traders. They
also participate in rural weekly markets or towns neighbouring the production zones. As they
move across villages or markets, banabanas use transport services; however on their own
Local consumers
Retailers
Distributors
Gum collectors
Producing and exporting company
Village and mobile traders
Wholesalers
Private exporters Processing and/or exporting companies
Transporters
raw gum
processed gum
26
they do not have the financial ability to own or hire trucks. Banabana can pre-finance the gum
collection activities mainly through contracting with large collectors.
Transactions in the village are done either in cash or as part of interlocked contracts.
These interlocked contracts result from traditional collaborations between gum collectors and
shop owners. These collaborations are often based on ethnic relations, friendships, or
appreciation for support in difficult times (Newbury, 1972; DEFCCS, 2005). Traders provide
money and basic commodities (water, sugar, tea, rice, etc.) during the lean period (Njomaha,
2008). In exchange, collectors supply gum to traders at prices agreed upon at the time of
entering into the contract; these prices are often lower than current market prices and they
include important interest charges (Fagg and Allison, 2004).
Apart from the village and mobile traders, the Asylia Gum Company buys gum
directly from the collectors. The Company is established in Senegal, Mauritania and Mali. In
Senegal, it started its operations in 1999, not only with the purpose of marketing gum arabic
but also producing it. Hence, in 2005, it established its own plantations of Acacia senegal on
12,000 hectares in the SPZ (DEFCCS, 2005). However, these plantations are not yet fully
productive, and the Company may occasionally buy gum from collectors or primary traders
(Ndiaye and Signaté, pers. communication).
Transporters
Village and mobile traders sell their gum to transporters. These transporters have the financial
ability to own or hire trucks for transport and are hence commonly called ‘camionneurs’. As
transporters, they can offer paid transport services to other market participants including
banabanas. These transporters often operate in weekly markets. On these markets not only
gum is traded, but many other products and commodities are also exchanged. Thus, these
transporters use their trucks to bring all kinds of bulk products to the market (e.g., rice, sugar,
cloths, and shoes), and they take non-timber forest products (gum arabic but also baobab
27
fruits and other gums), agricultural products (millet, groundnuts and others), and livestock
products (goats and sheep) to the cities.
In buying gum, transporters often rely on brokers (commonly known as ‘coxeurs’)
whose function is to serve as informants and put the transporters in direct contact with gum
sellers. With regard to gum arabic sales, camionneurs are often connected to large wholesalers
established in larger cities. Wholesalers may advance the necessary money or goods to be
taken to the market by transporters.
Wholesalers
Large traders/wholesalers are located in towns or on key trading routes. There are a few
wholesalers involved in the Senegalese gum sector: entry is primarily limited by high capital
requirements for the purpose of specialization. Investment costs include the high cost of
setting up storage houses or for acquiring transportation modes, and the need to acquire
business skills and build close business relationships. Wholesalers buy bulky gum from the
transporters and they usually have an annual contract with exporters or processors. They build
up stocks of gum and they clean, grade and repackage gum (Mallet et al., 2002); the excess
stocks or gum of low grade is sold to retailers for local use.
Exporters and processing company
As of 2009, there were three individuals and three companies that export gum arabic out of
Senegal (Niang, pers. communication). The companies are, besides Asylia Gum Company,
Management Communication International (MCI) and Valdafrique. Individual exporters are
established in Dakar and in Touba. They sort and grade the gum before exporting it. Asylia
Gum Company, as mentioned, has its own plantations and buys from collectors and primary
traders. The exact amount of exports by private operators or Asylia Gum Company is not
known.
28
MCI is a private company that exports gum arabic and other forest products (e.g., gum
karaya, powder made from baobab fruits). MCI exports on average 120 tons of gum arabic per
year; it get supplies from wholesalers established in the city of Touba from SPZ and from
EXPERNA in ES.
Valdafrique is exports raw gum and processed gum powder. It started its operations in
1943. Valdafrique specializes in the processing of gum into final products (sweets, medical
tablets, etc.). It also transforms gum into a semi-raw material product; this is the spry-dried
gum powder for the gum-using industries. To maintain its supply, Valdafrique deals directly
with large wholesalers established in Dahra and Linguère with whom the Company signs a
contract on an annual basis. Valdafrique buys on average 200 tons per year in Senegal (Sakho,
pers. communication). The raw gum and powdered gum are exported to Europe and to the
Valda Company in Brazil. The final products from gum and gum of low quality are sold in the
local markets.
The lack of organisation of chain actors and the absence of any protection measure for
collectors has led to unequal distribution of margins, and collectors continue to receive low
prices which discouraged them from further collection.
2.6 Description of study area, livelihoods and gum arabic collection
Data for the current study were collected in SPZ in departments of Linguère (region of
Louga), Podor (region of Saint Louis), and Ranérou and Matam (region of Matam) and ES in
departments of Goudiry and Bakel (region of Tambacounda); these are the regions where
Acacia senegal trees are found and gum arabic is commercially exploited. The survey in the
SPZ excluded the Djolof because gum is no longer produced in the sub-zone; a southward
movement of the production zone has been noticed due to changes in climatic conditions
(Ndiaye, personal communication, 2008). The departments of Bakel and Goudiry have the
29
highest potential for gum arabic exploitation in ES although throughout ES harvesting
activities are limited due to a lack of knowledge about harvesting techniques (Figure 2.2).
SPZ is the area located at the south of the Senegal river valley; it covers an area of
54,380 sq. km (Mbaye, 2008). Administratively, SPZ covers the regions of Saint-Louis,
Louga and Matam. Based on ecological characteristics of rainfall, soil type, and vegetation,
SPZ can be subdivided into five ecological sub-zones including the Basse Vallée Ferlo,
Grands forages, Djolof, Southern Ferlo and Eastern Ferlo (ISRA/BAME, 1999). Dione and
Sall (1988) had a wider classification that extends the zone to the east of the groundnut basin,
and the southern floodplain of Senegal river.
ES is the region around Tambacounda which covers an area of 42,706 sq. km (ANSD,
2010d). It is an agro-sylvopastoral zone (van den Breemer et al., 1993). Both SPZ and ES are
sparsely populated, population densities range between 15 and 47 inhabitants per sq. km
(ANSD, 2010a,b,c,d).
SPZ is characterised by two main soil types: clay and sandy soils. These soils are
suitable for rain fed agriculture (millet, groundnut, niébé); the sandy soils are however easily
depleted by intensive livestock herding and cultivation due to their fragile nature whereas the
clay soils suffer from leaching and erosion due to rains (ISRA/BAME, 1999; Mbaye, 2008).
ES’s soil types include sandy-clay soils and rocky soils. These rocky soils are inherently
fragile, low in carbon and poor in plants nutrients. Due to high wind erosion, soil fertility
constantly deteriorates and hence the area suitable for agriculture is reducing in the zone
(Dione and Sall, 1988; van den Breemer et al., 1993; Manlay et al., 2002; ANSD, 2010d).
SPZ has a long dry season of nine months and a rainy season of three to four months;
the average annual cumulated rainfall is between 210 and 520 mm. The rainy season in ES is
longer, of four to five months; hence the rainfall is higher, between 460 and 680 mm
(ANAMS, 2011). Variable rainfall in SPZ or ES implies that drought periods are frequent;
30
woody species and herbaceous shrubs that are thorny and adapted to drought (including
Acacias) are the prominent vegetation.
In SPZ, pastoralism is important; pastoralists possess both cattle and small ruminants.
The abundance of forage plants and their essential contribution to the diet of livestock make
the zone suitable to livestock rearing. The pastoralists’ livelihoods are essentially based on the
sale of livestock products; hunting is prohibited by law (Ndione et al., 2001; WFP et al.,
2011). In ES, agriculture and small to medium scale livestock herding are both practiced; rain
fed crops include cereals and groundnut; vegetables are grown in small irrigated fields (van
den Breemer et al., 1993; WFP et al., 2011).
The average incidence of poverty ranges between 36 per cent to 56 per cent of
households in Louga (SPZ) and Tambacounda (ES) respectively. The moderate incidence of
poverty is mainly due to remittances and livestock breeding (DPS and World Bank, 2004).
There are variations within these departments across districts (e.g., the percentage of
households who live below the poverty line is as high as 60 per cent in Ranérou (Matam)
whereas in other districts of the same department, the incidence of poverty is 49 per cent
(ANSD, 2010c)).
Because of the low and variable rainfall and scarcity of soil nutrients, SPZ and ES are
characterized by a cyclical insecurity in resource availability (ISRA/BAME, 1999). Natural
ecosystems and livelihood systems adapt to such harsh conditions of arid and semi-arid areas.
Plants and animals adapt through evolution or by shifting geographic range; human societies
adapt by evasion (e.g., by seasonal transhumance) or endurance (e.g., through forage
management, varying livestock types and numbers, water and soil conservation, or finding
alternative sources of income) (Mortimore, 1998; DPS, 2005; Mbaye, 2008; Running and
Mills, 2009; Seymour and Desmet, 2009). Collection of non-timber products is also practiced
for the purpose of adaptation; it enables households to generate off-farm income as these
31
products are widely marketed. Apart from gum arabic werek (Acacia senegal), non-timber
products collected in the SPZ and ES include soump (Balanites aegyptiaca), bouy or monkey
bread (Adansonia digitata), mbep (Sterculia setigera), and jujube (Ziziphus mauritania)
(ISRA/BAME, 1999). Note that the proportion of the non-timber forest products used at home
is very small.
Data collected among 422 collectors of gum arabic in SPZ and ES during February-
May 2009 showed that collection of gum arabic is undertaken mainly as a secondary activity
to pastoralism (68 per cent of respondents in SPZ and 5 per cent in ES) or agriculture (28 per
cent of respondents in SPZ and 82 per cent in ES). Other activities practiced include petty
trade and sales of timber (although this is normally regulated by law (Ndione et al., 2001;
DEFCCS, 2005)). Non-farm remunerated jobs and remittances also contribute to the
household income (respectively 6 per cent and 3 per cent in SPZ and 3 per cent and 4 per cent
in ES).
Ndione et al. (2001) found that revenues from gum sales are used by households for
consumption smoothing and to buy live animals and seeds; this pattern is still followed
whether for the purpose of coping with emergencies or accumulating wealth: collectors use
the income from sale of gum arabic mainly to buy food items (46 per cent of respondents in
SPZ and 52 per cent in ES), buy livestock (18 per cent in SPZ and 6 per cent in ES), buy
seeds and other agricultural inputs (4 per cent in SPZ and 10 per cent in ES). Other expenses
made from gum income include acquisition of household necessities and clothing, payments
for health services, building houses and even paying-off debts.
The contribution of gum income to the household’s food access is important as
households may not be able to sufficiently meet their food requirements especially because,
the Senegalese society being polygamous, households are quite large. On average, households
are composed of 9 to 11 members of whom 5 to 7 of these are children. While in rural

32
systems ‘the marginal utility of each additional child is normally strongly positive’ as children
can assist in home and farming activities (Gould and Brown, 1996 in Mortimore, 1998), in
gum collection, these children are not an extra source of labour as collection is undertaken
only by the adult (male) members of the household (the youngest collector in the sample was
20 years old). This is because of the need to acquire knowledge and skills associated with
tapping and collection and also due the thorny structure of Acacia trees. These skills are
mainly acquired through experience which is on average 21 years in SPZ and 6 years in ES.
Gum collection is indeed a recent activity in ES and collectors learnt about the
techniques of tapping and collection through trainings organised by EXPERNA (56 per cent
of respondents) or from their neighbours (37 per cent). In SPZ, collectors mainly learn from
their parents (82 per cent). Only 4 per cent of respondents in SPZ had attended a training on
gum collection. Instead of such formal trainings, collectors in SPZ mostly rely on informal
advices provided by forest agents (71 per cent) or other collectors (26 per cent). The latter are
also sources of information related to gum marketing including on prices or availability of
buyers.
The main constraint of collecting gum in Senegal is that forests where Acacia trees are
found are mainly community/open access zones which make the allocation and enforcement
of the rights to ownership and use difficult (Sall, 1997). These forests are located at long
distances from villages, not easily accessible (as reported by 34 per cent of respondents in
SPZ and 7 per cent in ES), and insecure due to human or animal attacks (reported by 25 per
cent of respondents in SPZ and 49 per cent in ES). Due to unclear property rights, thefts cases
are frequent where after tapping the gum is picked by another person (9 per cent of
respondents in SPZ and 16 per cent in ES reported being outraged by cases of theft). Such
cases may even lead to conflicts (Freudenberger 1993a, Sall 1997). Furthermore, livestock
migration also leads to destruction of trees and other abuses to trees inflicted by shepherds
33
(Cissokho, pers. communication); these actions lead to forest degradation and some collectors
reported that indeed trees are becoming very sparse or even extinct. Bush fires are another big
problem especially in ES according to 17 per cent of respondents. If these fires are not
controlled, they lead to considerable damage both to natural resources and the human habitat
(CSE, 2009).
Factors that constrain gum marketing include low prices (reported by 77 per cent in
SPZ and 49 per cent in ES), difficulties to reach the market (reported by 9 per cent in SPZ),
and in certain cases there is not even a buyer (20 in SPZ and 9 per cent in ES). Due to low
quantities bought each year, traders’ strategies are to restrict their area of operation to
accessible zones in order to reduce transportation costs. Producers in other locations may
therefore have no access to the market. They are compelled to accept the low prices offered
by local traders. The consequence of such strategy is that collection in remote areas is
discouraged.
Quality is another problem in gum marketing. Collectors deplore the weight loss of
gum arabic at the time of marketing (63 per cent in SPZ and 3 per cent in ES). Such loss
occurs often when gum is harvested before it sufficiently matures. This is just one aspect of
quality deficiency as for instance gum may also be not cleaned of its impurities such as barks
of trees or dust when picked from the ground.
The supply chain is not sufficiently developed to pay the collectors according to the
quality of the gum supplied. They are currently only paid on quantity and hence there is little
incentive for them to present cleaner gum or to grade the gum.
34
Market considerations for gum arabic collection in Senegal
Abstract
Low returns from marketing of non-timber forest products (NTFP) such as gum arabic restrict
their collection. In this chapter, a hypothesis is tested that access to ‘better and more
remunerative’ markets would give collectors more incentives to collect and market gum.
IvTobit models analyse the determinants of gum collection including the endogenous
expected price. A conditional logit model analyses the determinants of the choice of market
outlet including proportional transaction costs of marketing gum. Data was collected in
Northern and Eastern regions of Senegal from 422 gum collectors. Results show that gum
collection is responsive to price and hence market incentives, by expanding and securing the
collection area, and by factors improving labour productivity. The choice of a market outlet is
positively influenced by price but negatively influenced by collectors’ competition or the
preference for a particular trader, and high proportional transaction costs especially associated
with transport.
Keywords: transaction costs, market choice, IvTobit, conditional logit, semi-arid lands, gum
arabic.
3.1 Introduction
Marketing of agricultural products has been the subject of several studies that viewed the
farmers’ limited participation in markets as a constraint to market-based development
strategies. These strategies aimed at facilitating wealth creation and poverty reduction
(Makhura et al., 2001). Goetz (1992), Key et al. (2000), Holloway et al. (2001) and Bellemare
and Barrett (2006) focused on the market participation decision that involved a choice of
whether to participate in the market (buy, sell, or remain autarkic), and the volume to transact.
Their studies assumed that production was already optimized by all households. Recently,
Burke (2009) insisted on the need to recognise that products may not be produced by all
35
households. This is because households make a conscious decision regarding whether to
produce or not, which is a step prior to any market related decision. His expanded framework
thereby addressed the possibility that market participation can partially be determined by
exogenous factors, as production decisions are made on what and how much to produce.
We analyse the decision making process of gum collectors as an important non-timber
forest product in the research area: the participation decision is the decision to collect or not
and next, the choice is made of where to sell among the available alternative markets. A
particularity with regards to the collection decision is the open access to forests that a majority
of the collectors enjoy. The decision to collect can be made instantly at harvest time, with
labour being the main input. Underlying the decision to collect is the decision to sell because
of the absence of the own consumption conditions that are found e.g., in Goetz (1992) or
Bellemare and Barret (2006): in the current study, collection of gum arabic is “always”
associated with the intention to participate in the market as the household’s own consumption
of gum is very minimal. The decision to collect hence results in the quantity to collect
conditional on which, actual market participation takes place. Here collectors choose where to
transact i.e., in the village or market; this is a decision of the market in which this gum is sold.
The hypothesis tested in this paper is that if collectors (producers) were able to access a
‘better’ market, this will give them more incentives to collect (produce) and market gum (their
products).
High transaction costs were found to be key reasons for the failure of farmers to
participate in markets (e.g., Skoufias, 1995; Key et al., 2000) or for the choice between
different governance structures or different markets (Williamson 1991, 1998; Hobbs, 1997;
Fafchamps and Hill, 2005; Gong et al., 2006). Transaction costs create deviations between the
effective buying and selling price (e.g., Sadoulet et al., 1998, Burke, 2009). They also have
36
adverse effects on the amount traded (e.g., Skoufias, 1995) and productivity (e.g., Lanzona
and Evenson, 1997).
A distinction can be made between proportional and fixed transaction costs:
proportional transaction costs vary with the quantity traded whereas fixed transaction costs
are independent of the quantities traded and are household specific (e.g., de Janvry et al.,
1991; Goetz, 1992; Allen, 2000; Key et al., 2000; Holloway et al., 2001; Vakis et al., 2003;
Irle and Sass, 2006). Fixed transactions costs include search, information, bargaining and
monitoring costs (Goetz, 1992; Vakis et al., 2003). Goetz (1992) also included in these costs
the physical distance to the market and use of transport mode. Proportional transactions costs
include, for instance, the transport cost per unit of product (Vakis et al., 2003). In market
participation, a decision to trade is affected by both fixed and proportional transaction costs:
economies of scale can be gained in fixed transaction costs as quantities increase, whereas,
once the fixed transaction costs are covered, the extent of participation (i.e., amount traded)
depends on proportional costs.
Relationships between trading parties are the instruments of reducing transaction
costs. They contribute to lowering the risk of opportunistic behaviour by one or more of the
trading partners such as misrepresenting quality or running away without making payment
(Fafchamps and Gabre-Madhin, 2006). Relationships are fostered by the ability to identify a
particular trading partner. Yet, this trading partner does not very often change because the
search and screening costs for a new partner may be too high or the change may not result in
higher prices than those offered by a regular partner (Eaton et al., 2007). Regularity with
trading partners extending over a long period of time is also important as it leads to a certain
level of comprehension and ‘routines’ (Slangen et al., 2008). These routines can reduce
transaction costs such as in negotiating price or in monitoring informal agreements. Routines

37
are supported by reputation which then becomes an enforcement mechanism (Pint and
Baldwin, 1997).
The theory of transaction costs provides a framework for the analysis of gum
collectors’ decision making process in respect to collection/production and marketing: we
assume that high transaction costs not only constrain the marketing decision but also
collection. This is especially relevant in the case of open access resources and where the time
lag between collection and market decision is short. We assume that fixed transaction costs
influence the decision to collect and market simultaneously. Therefore, the decision to collect
and quantity of gum collected depend on collection/production factors (the accessibility of
trees and the labour effort exerted) and on important fixed transaction costs. We impute
proportional transaction costs to the market choice stage as the collector, having made the
choice of collecting gum, is faced with the choice of selling gum either in the village or in a
distant market. This choice is based on the level of proportional transaction costs.
In sum, we argue that transaction costs play an important role both at the level of
collection (production) and the choice of market outlet. A combination of both types of
transaction costs is of interest from a practical as well as a theoretical point of view. Fixed
transaction costs which were previously found to have an effect on whether to trade or not,
may influence the collection decision as this decision is directly associated with the intention
to participate in the market. Once the fixed transaction costs are covered and the collector
decides to ‘collect’ a certain amount of gum, the collector needs to sell the gum. Proportional
transaction costs which were previously associated with the quantity traded, may, in the
current case, be extended to the choice of market. This is because the quantity to trade is
already known from the optimisation of collection but markets have different transaction costs
structures.
38
In Senegal, gum arabic is collected during the dry season from natural forests or
artificial plantations. Collectors often tap trees (Acacia senegal), by making incisions on the
branches following specific tapping techniques (see Okatahi and Onyibe (1999) for details).
Collectors experience problems in collection because of long distances to the collection areas
and long hours of labour in harsh, dry, dusty and hot sub-Sahel conditions. In marketing,
problems include difficulties of finding a competitive market (in the few gum markets, traders
are suspected to exhibit exploitative tendencies), and low and continuously diminishing
prices. Price incentives to produce more gum or to upgrade its quality are also lacking. The
objective of this study is to investigate whether better markets are conducive to production in
terms of the gum collector’s behaviour related to the collection of gum and the amount to
collect, and consecutively on the choice of a market outlet, i.e., a local village or a more
distant market. The decisions to collect and market gum influence each other and are almost
taken simultaneously, but in this study, they are dealt with in separate models. The current
study takes the case of gum arabic collection, but the investigation is broader as it could
pertain to production and marketing decisions in other non-timber forestry or agricultural
sectors.
3.2 Methodology
A theoretical model for analysing gum collection and selling
In this section, a general theoretical model is developed with the aim of setting the economic
basis for the collector’s decision process to collect and sell gum.
Consider a household involved in gum collection: the quantity of raw gum collected in
a certain period (�) depends on labour hours (ℎ), the local presence of gum trees (�), and on
trading expectations such that:
� = (ℎ, �, �), � > 0;�� < 0 (1)
With �and �� as the first and second order conditions respectively.
39
The inclusion of labour assumes that there are no other physical inputs used as is typically the
case for open access resources. The market wage could be determined seasonally; but
generally only family labour is involved in gum collection.
Collectors are mainly members of pastoral communities and gum is collected in the
dry season when crop production activities are low and livestock has migrated. Hence, the
problem of competition in terms of labour hours that could jointly involve collection with
herding activities seldom occurs. As a consequence, collection can only be considered as a
supplementary activity to pastoralism. Moreover, a ‘professional’ collector is often a person
different from the herder and other occasional (non-professional) collectors. While the active
professional collectors know and apply the techniques for sustainable gum collection;
occasional collectors are interested in immediate gains that may accrue when gum prices are
high. Herders do not fall in either category, especially due to their young age and
inexperience. They just wildly ‘pick’ the gum.
An implicit opportunity cost of labour is leisure in terms of the trade-off between the
inconvenience of collection and the income that can be generated from collection (Beshai,
1984).
The trading behaviour of collectors is examined in steps corresponding to three types
of transaction costs namely transport costs, search for buyer and frequency of transactions or
repeated sales
Place/outlet of sale – town market versus village:
The gum collected in the period must be sold. It might be sold in the village in which the
collector resides (distance � ≈ 0), at price �� and no extra work such as grading is needed. In
this case the return to the labour hours is ����.If the opportunity costs are �, the household
will extend efforts such that:
��� = � (2)
40
The gum might also be sold in a distant ‘town’ market, without additional work on the
product, at a price ��. Assume that the village price �� is lower than the town market price �� (�� < ��); travelling to the town is therefore a way to improve the price that a collector gets.
(In some cases, however, a unique price may be offered in village and town with the purpose
of strengthening relationships and maintaining a ‘clientèle’ in gum transactions.)
Let the difference between village and town price be written as:
� = (�� − ��) (3)
If � is positive, then the collector will sell his gum in the town market and if D is negative,
the collector will remain in the village. However, �should take into account costs of
transporting to and selling gum in town by collectors or of buying gum in the village by
traders as well as costs incurred in making the transaction.
Transport costs:
Let transport costs be:
� = ��� (4)
Where �is the unit cost of distance for a standard quantity of 1: the transport costs vary with
the quantity transported through �Є[0, 1]. At constant � and at � = 0, the transport cost is
not affected by the (small) quantity; at � = 1, the cost is proportional to the quantity.
Total transport costs depend on the distance that the collector or trader has to travel
(�). Furthermore, there is a time ($) involved in going to town by the collector or to the
village by a trader. This time should be multiplied by an opportunity cost of labour (�), the
foregone leisure. For a trader, another opportunity cost is the foregone earnings from other
villages/markets he could visit (v). If transactions are made in town, we assume that the trader
will not go the village but he waits for the farmers to come to town; in this case, his cost of
going to buy in the village is higher than the cost of buying in the market and the collector
bears the transport costs.
41
Search for buyer:
The choice of a buyer involves search costs. Suppose for simplicity that the prices prevailing
in town (with different traders) are distributed homogeneously, over a range from �%to ��. Randomly selecting a trader yields the price:
& = '( (�% + ��) (5)
If the collector goes to see two traders, the expected price improves from �% + '( (�� − �%) to
�% + (* (�� − �%). For � visited traders, the expected price improves to:
�+ = �% + ++,' (�� − �%) (6)
If each visit would cost the collector -hours and each hour cost �, then the trade-off of going
to town or not is the difference between the expected benefits and opportunity costs:
[�% + ++,' (�� − �%)]� − [(�- + $�)�] (7)
For the optimal �, it should hold that:
'(+,'). /�0 − �12� − -� = 0 (8)
or
� = 3(45647)89: − 1 (9)
Thus, the number of traders visited should increase with larger price ranges and with quantity
for sale; but it diminishes with wage and time needed to visit a trader. Furthermore, if the
expected price at town level is not much higher than the expected net price at village level i.e.,
when the value added of going to town is low in comparison to the trade-off between benefits
and costs of going to town; then logically, collectors will not go to town because this will not
bring in any extra benefits.
Note that - can also be interpreted in terms of transaction cost attributes such as
uncertainty associated with price offers, regularity of transactions or specificity of the asset to
sell. For instance, when the collector sells his gum in the village, the price offered is assumed
42
to be known, at least negotiable without costs, as the collector sees the village trader often
enough and hence uncertainty with regard to price is low. In such a situation, a single or few
traders are present who are the actual buyers of gum in the village and collectors have
frequent transactions with this (these) trader(s).
From the above derivations, we see that the value added of going to town i.e.,
expected benefits minus costs over selling in the town, with � buyers visited and the best
price offer taken, is:
(�+ − ��)� − [(�- + $�)� + ����] (10)
A decision of going to town is positive only if (10) is positive:
;�% + ++,' (�� − �%) − ��< � − [(�- + $�)� + ����] > 0 (11)
or
++,' (�� − �%)� − �-� > (�� − �%)� + $�� + ���� (12)
This expression shows how a decision of going to town can be influenced by the quantity to
transact: increasing Q increases the left hand side (LHS) with increments almost equal to the
price range in town, and the right hand side (RHS) with increments equal to the difference
between the village price and the lowest price in town (this may even be negative) plus
transport costs.
For � = 1, the expression shows that :
'( (�� + �%)� − -� > ��� + $�� +�=���� (13)
Or that the expected returns to visiting one trader in town should exceed the price paid in the
village plus the costs of going to town. For larger �, the LHS of equation (12) increases by an
ever smaller share of the spread in sale revenues in town and continuously decreases by the
fixed costs of visiting extra traders. If the LHS started as positive, then for some � it must turn
negative. The optimal, feasible � is determined by the minimum of the optimal price
difference between village and town, as defined by equation (9).

43
Repeated transactions:
As a final step in the reasoning, I consider repeated transactions. A collector may go to town
once, find out that prices are unattractive compared to the village shop and decide to sell to
the village shop for a while. Only after some time, he will undertake another exploratory visit
to town to see if this would pay off.
Furthermore, a collector who strikes a good bargain in town may go there again, and
will not have to incur the costs of finding the best bargain (at least, not until he starts having
doubts about his counterpart); hence the expenditure on selecting the best trader is regarded as
an investment. In this case the comparison is made about the quantity of gum to sell and
between one visit in town and selling to the village shop. We would observe collectors who
sell in the village because their quantities are too small, their search cost is high, who had no
luck in finding a better deal in town, or whose opportunity costs of time are too high.
The model developed above assumes that choice of selling in village or travelling to a
town market is mutually exclusive. However, collectors may participate in both outlets by
deciding on distributing the quantities across the different outlets. This decision is not
included in the current study. The general model also leaves out the quality aspects by which
the collector could obtain a price premium for e.g., cleaning and grading which may differ
between the village and town. The quality aspect will be explored in the next chapter
(findings in the case study area suggest that traders (in the village or town) do not provide any
quality premium).
Operationalisation of the model
The model is operationalised by investigating factors that affect the decision to collect gum
and amount collected and subsequently the choice of sale outlet. The decision to collect is
associated with an intention to sell gum but the subsequent actual sale decision is associated
with the choice of a sale place. We argue that these decisions are affected by a different set of
44
transaction costs: fixed transactions costs have to be covered in the collection decision
whereas proportional transaction costs affect the extent of participation in terms of the choice
of sale outlet (as predicted by the model).
Defining Q
Collection of gum begins with the exudation that occurs from about four years of tree growth
depending on exogenous conditions such as rainfall, humidity, temperature, or soil conditions.
Acacia senegal trees are found in the semi-dry areas, mainly in natural forests and in artificial
plantations realized by either reforestation projects (majority), or by private companies and
individuals (Dione, 1998; AGC, 2007; CNI, 2008). Gum is harvested in the dry season.
Exudation occurs when the bark of the tree breaks due to heat or wind, or by deliberate
tapping of trees. After 7 to 15 days when the gum has sufficiently matured, it is harvested
from the tree. Apart from exogenous factors such as heat, wind, or rainfall (and consequently
the tree water retention), the actual amount of gum collected in a specific location depends on
factors such as the density of trees and the labour effort involved in collection (Equation (1)).
For a single collector, the number of trees harvested depends on factors such as tree
availability, tree accessibility, and distance to plot:
- availability of Acacia trees is indicated at village level by two variables: (a) Area of Acacia
senegal which was obtained from the Global Land cover network (GLCN) database of
Senegal (GLCN, 2009). Acacia senegal trees are found in the classification of trees and
shrubs taking into account the vegetation distribution within a radius of 15 kilometres around
the village and (b) Rainfall which is the average of the cumulated rainfall during June-
October in the period 1991-1998; it gives an indication of the normal long-term rainfall level
in the village (UMR HydroSciences, 2005). While the large Acacia senegal area shows a high
propensity for gum collection, a high normal rainfall decreases the amount collected due to
low environmental stress (Blunt, 1926, Elrayah et al., 2012).
45
- access to trees refers to private or common ownership of gum trees and/or plots. Private
plots are found with collectors who have planted their own Acacia senegal trees or through
permanent ownership by inheritance, requests from village chiefs, or formal acquisitions from
local authorities. Communal plots are harvested through formal or informal agreements, with
or without permit from the forestry service. Field visits do not suggest differences in technical
management between private and common plots. In the analysis, individual tree accessibility
is captured by a dummy variable of harvesting on a communal plot, and a variable giving the
number of collectors who harvest gum in the same plot because competition among producers
leads to a high risk of theft and hence is expected to have a negative effect on the individual
quantity of gum collected.
- distance to the plot: collection at distances closer to the village involves more competition
than at longer distances. Due to insecure ownership and required protection, collection at
longer distances may yield smaller quantities than collection at distances closer to the village.
Furthermore, such long distances have an effect on travel time.
Furthermore, the quantity harvested will also depend on the collector’s productivity.
Two variables related to labour productivity are used, namely:
- collectors’ experience: with more experience, the collector does not spend unnecessary time
in the plot; he can tap a lot faster with efficient tapping techniques. Hence experience has a
positive effect on the amount harvested through the potential knowledge acquired over time.
- number of adult collectors in the household has a positive impact on the quantity collected
through labour division in the family: the older/more experienced producers can tap and the
relatively younger collectors can pick the gum from the tree. This division of labour would
increase the total quantity of gum collected by the household.
An indication of alternative occupation to gum collection is also included as a proxy of
the opportunity cost of labour:

46
-livestock values: wealthy pastoralists may not need any income supplement from collecting
gum as they are already better off; hence for them gum collection might just be a secondary
activity. For the less wealthy, gum collection may generate substantial revenues that could
contribute to improving their livelihoods; hence they may keep gum collection as a principal
activity and realize substantial quantities. Both activities might remain complementary
especially because they do not involve labour competition.
Factors influencing expected gum sales-Defining the RHS of equation (12)
Apart from the above factors directly influencing the quantity of gum collected, a decision to
collect gum is based on expectations from trading associated with the intention to participate
in the market. The expected price is a proxy of trading expectations.
The expected price is the average price obtained from the previous gum harvesting season.
The current gum price is most often determined by the trader depending on his estimation of
marketing and transaction costs but also on the quantity supplied in relation to demand.
Moreover, there are variations in price throughout seasons and across years. Irrespective of
these variations, the average price obtained by the collectors in the previous season may give
an indication of the price on which the producer bases his decision. The inclusion of the price
implies that the collector makes a choice of collection knowing that he wants to sell his gum:
a collector intends to access a market as he has made the necessary investments in fixed
transaction costs so that he can reach this market based on the price he expects to get for the
produce.
The expected price may be economically endogenous: in the context where access to
markets improves collection because better prices are offered, reverse causal effects exist
whereby the quantity supplied on markets is the basis for market development. Statistical
instruments for the price are : (a) distance to town: this is the physical distance estimated in
kilometres from the village to the nearest rural town. It indicates that the price to the collector
47
is determined in reference to how remote his village is, the farther the village from town, the
lower would be the price; (b) interlocked relations: a dummy variable refers to whether the
collector is involved in interlocked transactions with traders. These traders finance gum arabic
harvesting activities and other economic operations by providing capital, tools and other basic
commodities (water, sugar, tea, rice, etc.) for households to get by during the lean period
(Njomaha, 2008). Collectors pay back in kind at equivalent prices topped-up with important
credit charges (Fagg and Allison, 2004). Such interlocked relations imply that the market
where to sell gum is already chosen in advance for the purpose of reimbursing the credit; (c)
fixed transaction costs arise due to household resources that must be devoted a priori to the
decision to participate in the market (Holloway et al., 2001). In this study, three variables are
used to account for these costs: (i) a dummy variable for possession of transport mean:
whether a bicycle, horse or donkey cart that would facilitate transport to the plots specially if
they are situated at a long distance from the village, the long distances normally prevent the
collector from doing frequent visits and if the collector does not possess such means, he may
be able to collect only in plots located nearby the village; (ii) access to information: given
high search costs for a buyer and negotiation costs, easy access to information plays an
important role in the collectors’ decision to collect gum and participate in the market, this
dummy variable refers to whether or not the collector said he has had information on market
conditions (the market price and other market requirements, e.g., delivery conditions); and
(iii) a dummy variable for selling through producers’ group: because the group gives a
market assurance (e.g., the association or group might secure a sale contract with a company
or exporter) and better prices (e.g., through higher bargaining power).
Economically, better collectors may group with each other and being in a group may
entail high production; this would imply a self-selection choice of being in the group. Thus,
the choice of participating in a group is instrumented by age (older producers may be attracted
48
by the group due to the experience acquired); household size (large households may need not
to participate in a group as they have power on their own); education (relatively more
educated farmer can correctly evaluate the advantages of group marketing); and dummies for
the perception of whether it is easy to collect gum in terms of distance to the collection plot or
access to trees. It is assumed that becoming part of a group is a response to perceiving such
accessibility problems. Hence, these dummies indicate whether the collector has indeed the
possibility to collect gum given the difficulties involved in travelling to the collection areas
and finding trees, but also that he can expect to be the collector of the gum exudating from the
incision made by him with relatively low risk of theft. The higher the perceived ease, the
higher will be the probability of belonging to a group.
Market choice behaviour
Similar to other non-timber forest products, gum is traded in relatively small volumes and
production is dispersed over wide areas; hence the quantity and quality of these products can
be very unreliable within and across season (Belcher and Schreckenberg, 2007; Ros-Tonen,
2011). As collection of these products is done in remote areas, with poorly developed
communications and transportation infrastructure, it makes it difficult and costly to move
products to distant physical markets. Sales may be made in the village if a village buyer is
there or an itinerant buyer is willing to come to the village.
The gum chain in Senegal comprises of three components (Figure 2.5): transactions
are made between (a) gum collectors and village/mobile traders; (b) village/mobile traders
and transporters (c) transporters and wholesalers and (d) wholesalers and private exporters or
processing companies. A small branch of the chain involves the distribution of processed gum
through retailers for national consumption. Local markets are the entry into the gum supply
chain. These markets include exchanges in the village or at distant markets in rural town.
49
Village traders are the established shop-owners (boutiquiers); mobile traders go to different
villages or markets, buying directly from farmers or boutiquiers.
More than 70 per cent of transactions in gum arabic are done on weekly markets, held
in relatively commercialized rural towns (Diop, 2005). Apart from gum arabic, village
inhabitants in general take the opportunity to participate in such weekly markets in order to
sell their products (from farming or handicrafts). In exchange, they obtain from mobile
traders, commercial goods including rice, sugar, salt, shoes, cloth or items related to livestock
keeping, etc. These mobile traders form a link between the remote villages and the rural
towns. They attend several markets in a week mainly depending on the accessibility of these
markets and possibility to minimize transport costs. The markets are also a time for social
gathering.
As predicted by our theoretical model, collectors will choose to sell either in the
village or distant town market by comparing the respective net benefits in terms of
convenience and economic profitability to the cost of transacting. Fafchamps and Hill (2005)
dealt with a similar decision of market outlet by farmers whether to sell at farm-gate or to
transport their produce to the market. They found that the preference to go to the market
entails a higher price for the crop in relation to wealth (wealth was measured as the value of
all non-land wealth of the household including the value of buildings), but that one has to
consider the quantity to sell, the distance to the market and the cost associated with
transportation.
Factors influencing the choice of gum sales place- determining the LHS of equation (12)
Having collected the gum, an actual decision of going to the market or staying in the village is
made. Following our theoretical model and in light of literature, the variables included to
investigate the choice of sale place are categorized into choice specific variables, proportional
transaction costs and individual related variables:
50
- choice specific variables are the variables that do not vary between individuals but with
respect to the specific option of selling in the village or at a distant town market. These
variables are (a) sale price: as the model would predict, a higher sale price at any selling
point, ceteris paribus, is more attractive to the collector; (b) number of potential buyers is the
total number of traders in a physical market or village who trade in gum arabic. It indicates
buyers’ competition which raises the price thereby increasing the probability of selling. Yet,
buyers may also collude and offer a lower price especially because they have higher
bargaining power in comparison to collectors; and, (c) number of sellers in the market is the
approximate number of other collectors who regularly sell in the village or at the market.
- market specific proportional transaction costs are calculated per unit of the quantity
supplied. They include (a) transport cost per unit of product which was calculated by
assuming that a collector would hire a donkey cart for transporting his gum to the market and
taking into account the distance to the selling place at an estimated flat rate of 75 CFA per
kilometre divided by the quantity to transact; (b) transaction time per unit of product: this is
the time spent delivering a unit of the product to the market obtained by the square of the
reported time (in minutes) divided by the quantity to transact. The squared time indicates that
time is expected to be a decreasing function of the quantity supplied; and (c) frequency of sale
which is the reported number of times of transacting with a buyer. Frequency has the effect of
reducing the cost of transacting through the relationships established with the trader as
proposed in literature (Pint and Baldwin, 1997; Eaton et al., 2007; Slangen et al., 2008). Note
that the transport cost per unit of product and transaction time per unit of product are
potentially endogenous because they are inversely proportional to the quantity to transact
which would then be a determinant for the market choice. In the absence of proper
instruments of these variables, a careful relational interpretation is therefore more appropriate.
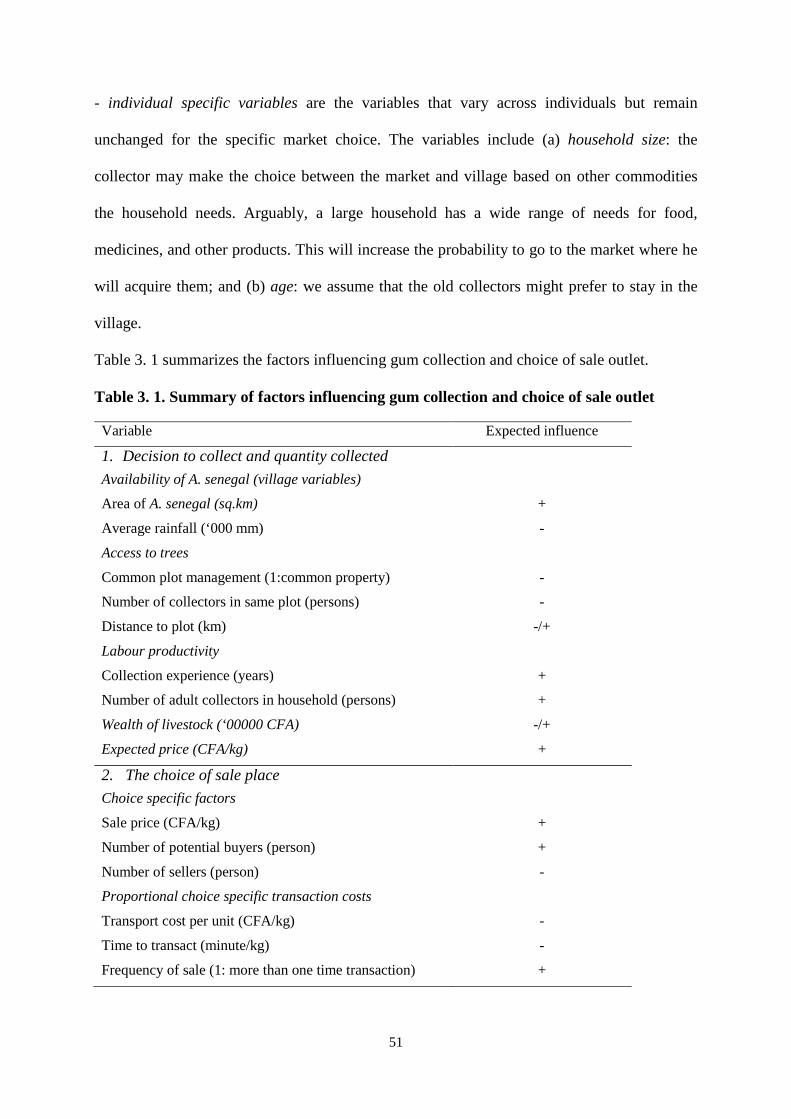
51
- individual specific variables are the variables that vary across individuals but remain
unchanged for the specific market choice. The variables include (a) household size: the
collector may make the choice between the market and village based on other commodities
the household needs. Arguably, a large household has a wide range of needs for food,
medicines, and other products. This will increase the probability to go to the market where he
will acquire them; and (b) age: we assume that the old collectors might prefer to stay in the
village.
Table 3. 1 summarizes the factors influencing gum collection and choice of sale outlet.
Table 3. 1. Summary of factors influencing gum collection and choice of sale outlet
Variable Expected influence
1. Decision to collect and quantity collected
Availability of A. senegal (village variables)
Area of A. senegal (sq.km) +
Average rainfall (‘000 mm) -
Access to trees
Common plot management (1:common property) -
Number of collectors in same plot (persons) -
Distance to plot (km) -/+
Labour productivity
Collection experience (years) +
Number of adult collectors in household (persons) +
Wealth of livestock (‘00000 CFA) -/+
Expected price (CFA/kg) +
2. The choice of sale place
Choice specific factors
Sale price (CFA/kg) +
Number of potential buyers (person) +
Number of sellers (person) -
Proportional choice specific transaction costs
Transport cost per unit (CFA/kg) -
Time to transact (minute/kg) -
Frequency of sale (1: more than one time transaction) +
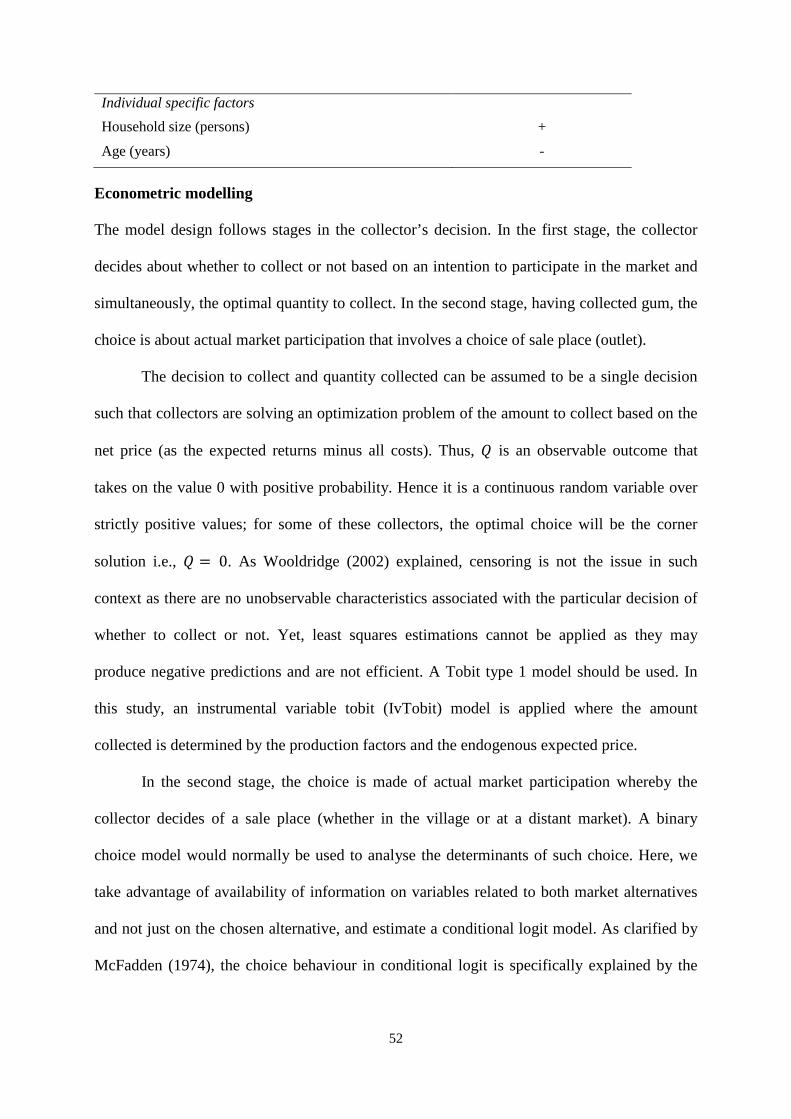
52
Individual specific factors
Household size (persons) +
Age (years) -
Econometric modelling
The model design follows stages in the collector’s decision. In the first stage, the collector
decides about whether to collect or not based on an intention to participate in the market and
simultaneously, the optimal quantity to collect. In the second stage, having collected gum, the
choice is about actual market participation that involves a choice of sale place (outlet).
The decision to collect and quantity collected can be assumed to be a single decision
such that collectors are solving an optimization problem of the amount to collect based on the
net price (as the expected returns minus all costs). Thus, � is an observable outcome that
takes on the value 0 with positive probability. Hence it is a continuous random variable over
strictly positive values; for some of these collectors, the optimal choice will be the corner
solution i.e., � = 0. As Wooldridge (2002) explained, censoring is not the issue in such
context as there are no unobservable characteristics associated with the particular decision of
whether to collect or not. Yet, least squares estimations cannot be applied as they may
produce negative predictions and are not efficient. A Tobit type 1 model should be used. In
this study, an instrumental variable tobit (IvTobit) model is applied where the amount
collected is determined by the production factors and the endogenous expected price.
In the second stage, the choice is made of actual market participation whereby the
collector decides of a sale place (whether in the village or at a distant market). A binary
choice model would normally be used to analyse the determinants of such choice. Here, we
take advantage of availability of information on variables related to both market alternatives
and not just on the chosen alternative, and estimate a conditional logit model. As clarified by
McFadden (1974), the choice behaviour in conditional logit is specifically explained by the
53
attributes of alternatives available to individuals making the decision and characteristics of
these individuals.
The conditional logit model follows a random utility model (Greene, 2008): there are
>alternatives among which a choice is made; ?= represents a vector of choice-specific
attributes such that the utility level of choosing @for an individual A is
B=C = D?=C + E=C (14)
D is constant across choices. Hence @ is chosen if it has the highest utility among all > choices:
B=C > B=F for all G ≠ @ (15)
The choice of place to sell is influenced by characteristics of the sale place (distance, price)
and proportional transaction costs associated with the outlet (such as transport per unit). In
addition, this decision might also be influenced by the collector’s characteristics. Because
these individual-specific variables do not change within each case, the alternative-specific
conditional logit is used.
Data and sampling
Data was collected during February-June 2009 in the Sylvopastoral Zone (SPZ) and Eastern
region of Senegal (ES). In the Sylvopastoral zone, the survey focused on town markets,
sixteen such markets were visited. In Eastern Senegal, three town markets and thirteen
villages were also visited. Structural interviews were held with 183 producers in the
Sylvopastoral and 239 producers in the Eastern region.
3.3 Results
A large percentage of collectors of gum arabic had decided to collect in the 2009 season but
they differ in terms of collection variables. Differences between SPZ and ES are also
observed (Table 3.2).
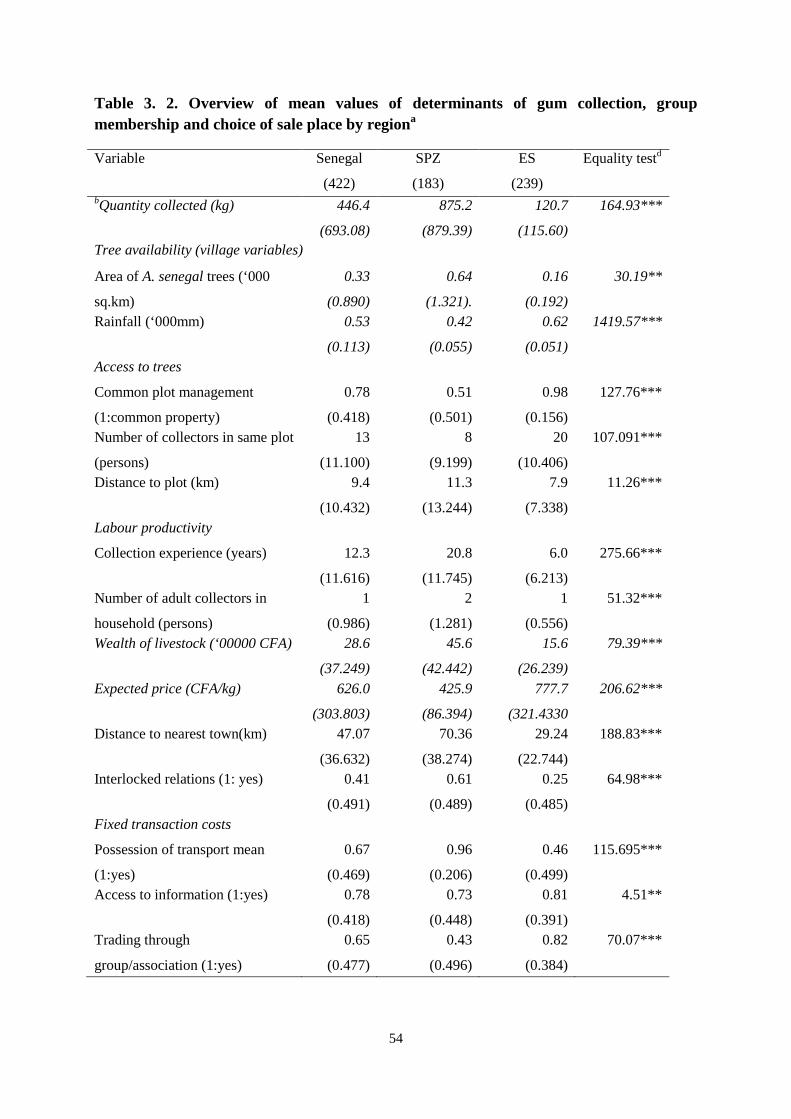
54
Table 3. 2. Overview of mean values of determinants of gum collection, group membership and choice of sale place by regiona
Variable Senegal
(422)
SPZ
(183)
ES
(239)
Equality testd
bQuantity collected (kg) 446.4
(693.08)
875.2
(879.39)
120.7
(115.60)
164.93***
Tree availability (village variables)
Area of A. senegal trees (‘000
sq.km)
0.33
(0.890)
0.64
(1.321).
0.16
(0.192)
30.19**
Rainfall (‘000mm) 0.53
(0.113)
0.42
(0.055)
0.62
(0.051)
1419.57***
Access to trees
Common plot management
(1:common property)
0.78
(0.418)
0.51
(0.501)
0.98
(0.156)
127.76***
Number of collectors in same plot
(persons)
13
(11.100)
8
(9.199)
20
(10.406)
107.091***
Distance to plot (km) 9.4
(10.432)
11.3
(13.244)
7.9
(7.338)
11.26***
Labour productivity
Collection experience (years) 12.3
(11.616)
20.8
(11.745)
6.0
(6.213)
275.66***
Number of adult collectors in
household (persons)
1
(0.986)
2
(1.281)
1
(0.556)
51.32***
Wealth of livestock (‘00000 CFA) 28.6
(37.249)
45.6
(42.442)
15.6
(26.239)
79.39***
Expected price (CFA/kg) 626.0
(303.803)
425.9
(86.394)
777.7
(321.4330
206.62***
Distance to nearest town(km) 47.07
(36.632)
70.36
(38.274)
29.24
(22.744)
188.83***
Interlocked relations (1: yes) 0.41
(0.491)
0.61
(0.489)
0.25
(0.485)
64.98***
Fixed transaction costs
Possession of transport mean
(1:yes)
0.67
(0.469)
0.96
(0.206)
0.46
(0.499)
115.695***
Access to information (1:yes) 0.78
(0.418)
0.73
(0.448)
0.81
(0.391)
4.51**
Trading through
group/association (1:yes)
0.65
(0.477)
0.43
(0.496)
0.82
(0.384)
70.07***
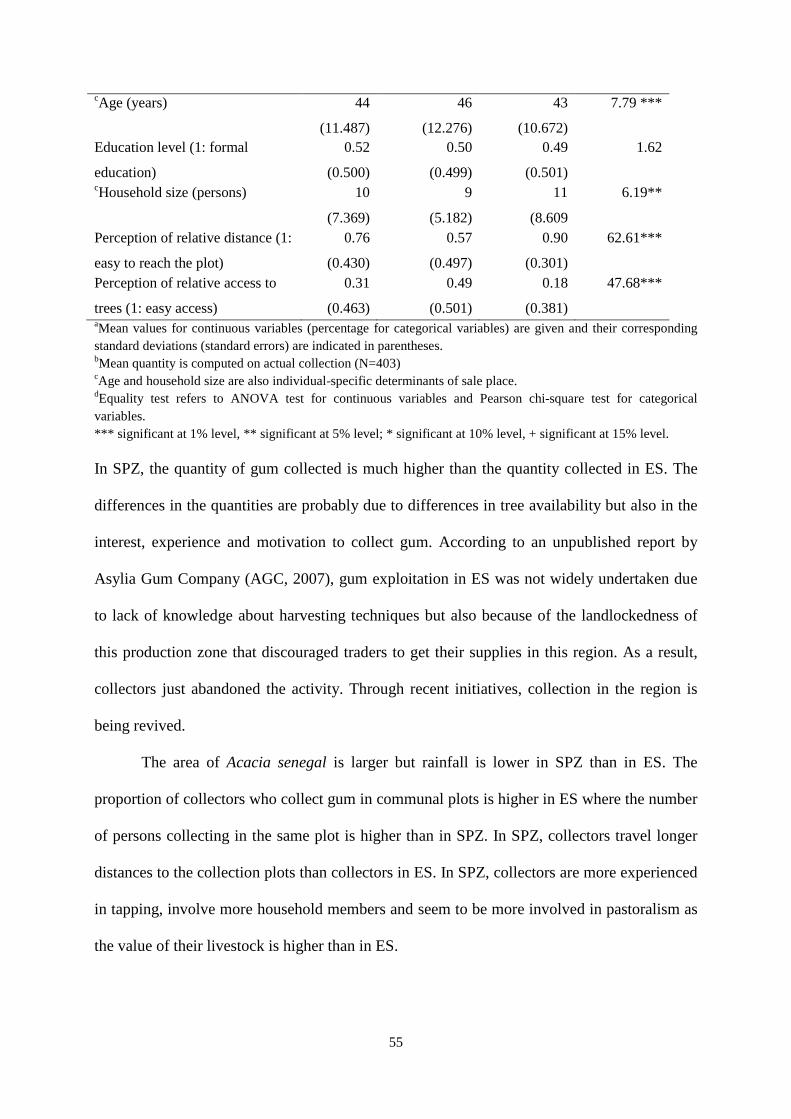
55
cAge (years) 44
(11.487)
46
(12.276)
43
(10.672)
7.79 ***
Education level (1: formal
education)
0.52
(0.500)
0.50
(0.499)
0.49
(0.501)
1.62
cHousehold size (persons) 10
(7.369)
9
(5.182)
11
(8.609
6.19**
Perception of relative distance (1:
easy to reach the plot)
0.76
(0.430)
0.57
(0.497)
0.90
(0.301)
62.61***
Perception of relative access to
trees (1: easy access)
0.31
(0.463)
0.49
(0.501)
0.18
(0.381)
47.68***
aMean values for continuous variables (percentage for categorical variables) are given and their corresponding standard deviations (standard errors) are indicated in parentheses. bMean quantity is computed on actual collection (N=403) cAge and household size are also individual-specific determinants of sale place. dEquality test refers to ANOVA test for continuous variables and Pearson chi-square test for categorical variables. *** significant at 1% level, ** significant at 5% level; * significant at 10% level, + significant at 15% level.
In SPZ, the quantity of gum collected is much higher than the quantity collected in ES. The
differences in the quantities are probably due to differences in tree availability but also in the
interest, experience and motivation to collect gum. According to an unpublished report by
Asylia Gum Company (AGC, 2007), gum exploitation in ES was not widely undertaken due
to lack of knowledge about harvesting techniques but also because of the landlockedness of
this production zone that discouraged traders to get their supplies in this region. As a result,
collectors just abandoned the activity. Through recent initiatives, collection in the region is
being revived.
The area of Acacia senegal is larger but rainfall is lower in SPZ than in ES. The
proportion of collectors who collect gum in communal plots is higher in ES where the number
of persons collecting in the same plot is higher than in SPZ. In SPZ, collectors travel longer
distances to the collection plots than collectors in ES. In SPZ, collectors are more experienced
in tapping, involve more household members and seem to be more involved in pastoralism as
the value of their livestock is higher than in ES.
56
Collectors of gum in ES have a higher expectation on the price they would receive if
they sell their gum. This is mainly due to the presence of the association EXPERNA that
bargains sale contracts on behalf of collectors. Consequently, they also have easier access to
information and a higher proportion of them is trading or has traded through the association or
any other group than in SPZ. In SPZ, a higher proportion is involved in interlocked relations
with traders than ES. Moreover, a higher proportion of these collectors in SPZ own some
transport mean (e.g., donkey cart, horse cart, and bicycle) than collectors in Eastern Senegal.
Apart from differences in production variables, collectors in ES and SPZ also differ in
terms of characteristics and behaviour towards gum marketing. The proportion of collectors
who sell their gum in villages is lower in SPZ than in ES, this may be due to sampling. Table
3.3 shows descriptive statistics for the choice-specific variables.
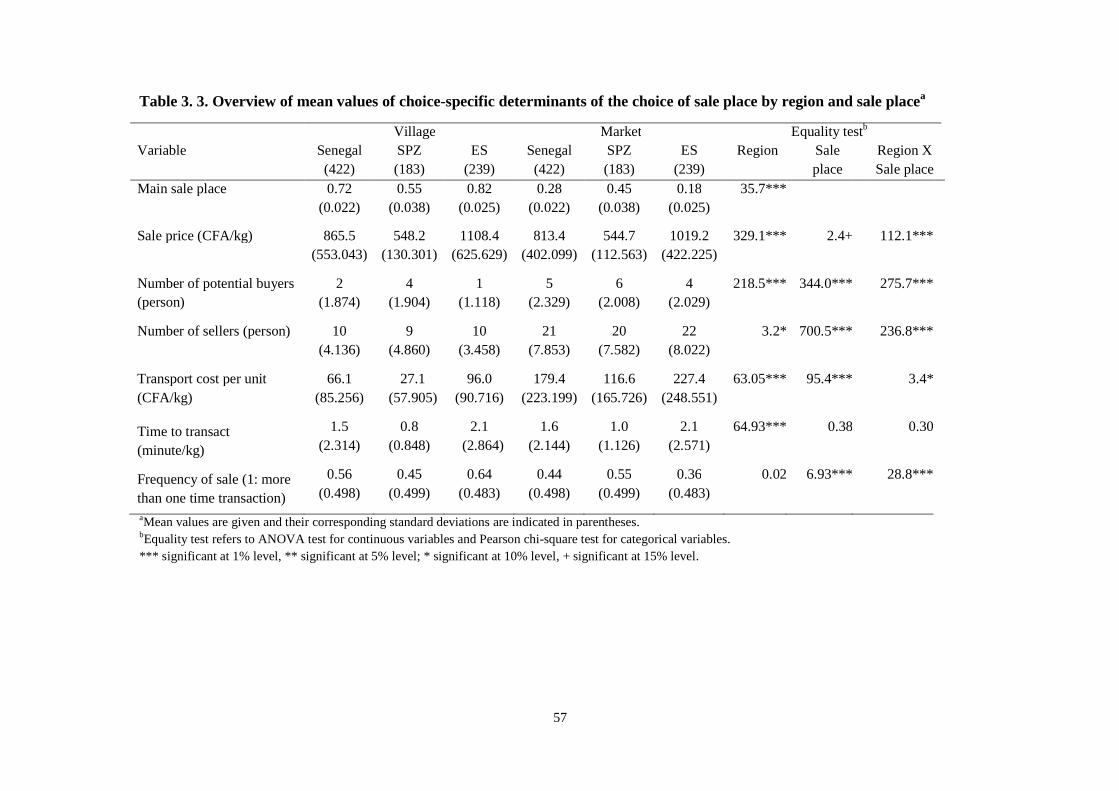
57
Table 3. 3. Overview of mean values of choice-specific determinants of the choice of sale place by region and sale placea
Variable Village Market Equality testb
Senegal (422)
SPZ (183)
ES (239)
Senegal (422)
SPZ (183)
ES (239)
Region Sale place
Region X Sale place
Main sale place 0.72 (0.022)
0.55 (0.038)
0.82 (0.025)
0.28 (0.022)
0.45 (0.038)
0.18 (0.025)
35.7***
Sale price (CFA/kg) 865.5 (553.043)
548.2 (130.301)
1108.4 (625.629)
813.4 (402.099)
544.7 (112.563)
1019.2 (422.225)
329.1*** 2.4+ 112.1***
Number of potential buyers (person)
2 (1.874)
4 (1.904)
1 (1.118)
5 (2.329)
6 (2.008)
4 (2.029)
218.5*** 344.0*** 275.7***
Number of sellers (person) 10 (4.136)
9 (4.860)
10 (3.458)
21 (7.853)
20 (7.582)
22 (8.022)
3.2* 700.5*** 236.8***
Transport cost per unit (CFA/kg)
66.1 (85.256)
27.1 (57.905)
96.0 (90.716)
179.4 (223.199)
116.6 (165.726)
227.4 (248.551)
63.05*** 95.4*** 3.4*
Time to transact (minute/kg)
1.5 (2.314)
0.8 (0.848)
2.1 (2.864)
1.6 (2.144)
1.0 (1.126)
2.1 (2.571)
64.93*** 0.38 0.30
Frequency of sale (1: more than one time transaction)
0.56 (0.498)
0.45 (0.499)
0.64 (0.483)
0.44 (0.498)
0.55 (0.499)
0.36 (0.483)
0.02 6.93*** 28.8***
aMean values are given and their corresponding standard deviations are indicated in parentheses. bEquality test refers to ANOVA test for continuous variables and Pearson chi-square test for categorical variables. *** significant at 1% level, ** significant at 5% level; * significant at 10% level, + significant at 15% level.
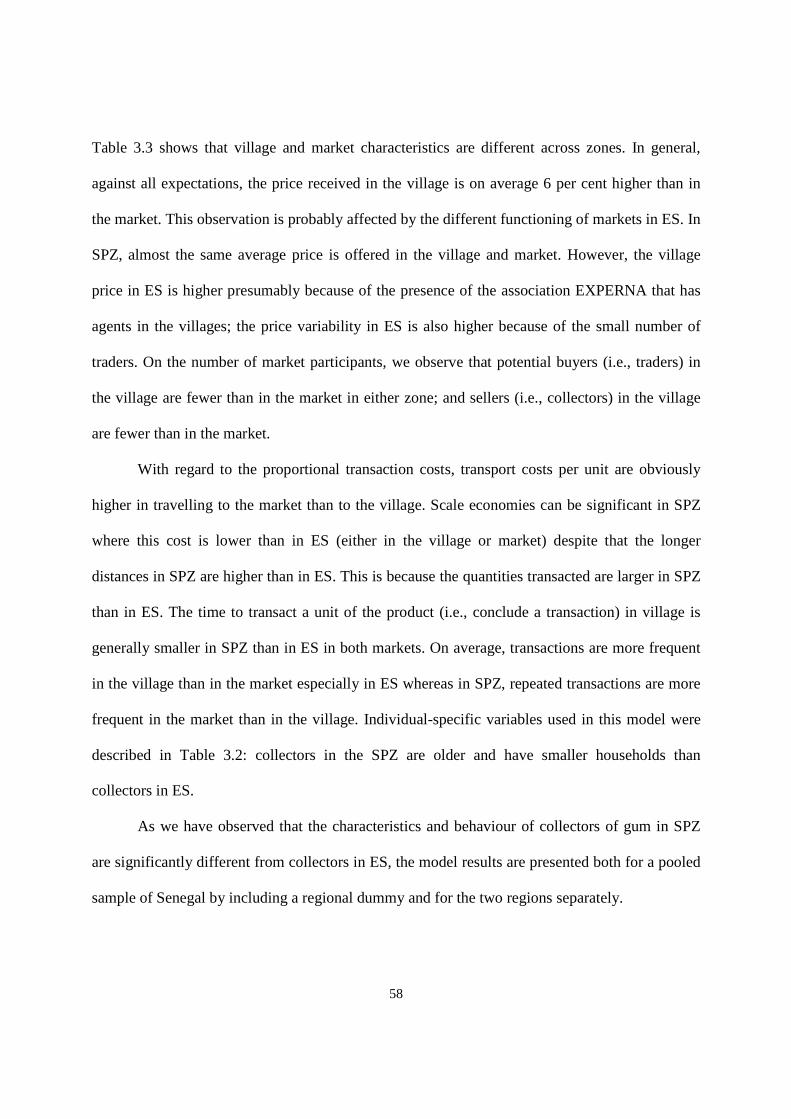
58
Table 3.3 shows that village and market characteristics are different across zones. In general,
against all expectations, the price received in the village is on average 6 per cent higher than in
the market. This observation is probably affected by the different functioning of markets in ES. In
SPZ, almost the same average price is offered in the village and market. However, the village
price in ES is higher presumably because of the presence of the association EXPERNA that has
agents in the villages; the price variability in ES is also higher because of the small number of
traders. On the number of market participants, we observe that potential buyers (i.e., traders) in
the village are fewer than in the market in either zone; and sellers (i.e., collectors) in the village
are fewer than in the market.
With regard to the proportional transaction costs, transport costs per unit are obviously
higher in travelling to the market than to the village. Scale economies can be significant in SPZ
where this cost is lower than in ES (either in the village or market) despite that the longer
distances in SPZ are higher than in ES. This is because the quantities transacted are larger in SPZ
than in ES. The time to transact a unit of the product (i.e., conclude a transaction) in village is
generally smaller in SPZ than in ES in both markets. On average, transactions are more frequent
in the village than in the market especially in ES whereas in SPZ, repeated transactions are more
frequent in the market than in the village. Individual-specific variables used in this model were
described in Table 3.2: collectors in the SPZ are older and have smaller households than
collectors in ES.
As we have observed that the characteristics and behaviour of collectors of gum in SPZ
are significantly different from collectors in ES, the model results are presented both for a pooled
sample of Senegal by including a regional dummy and for the two regions separately.
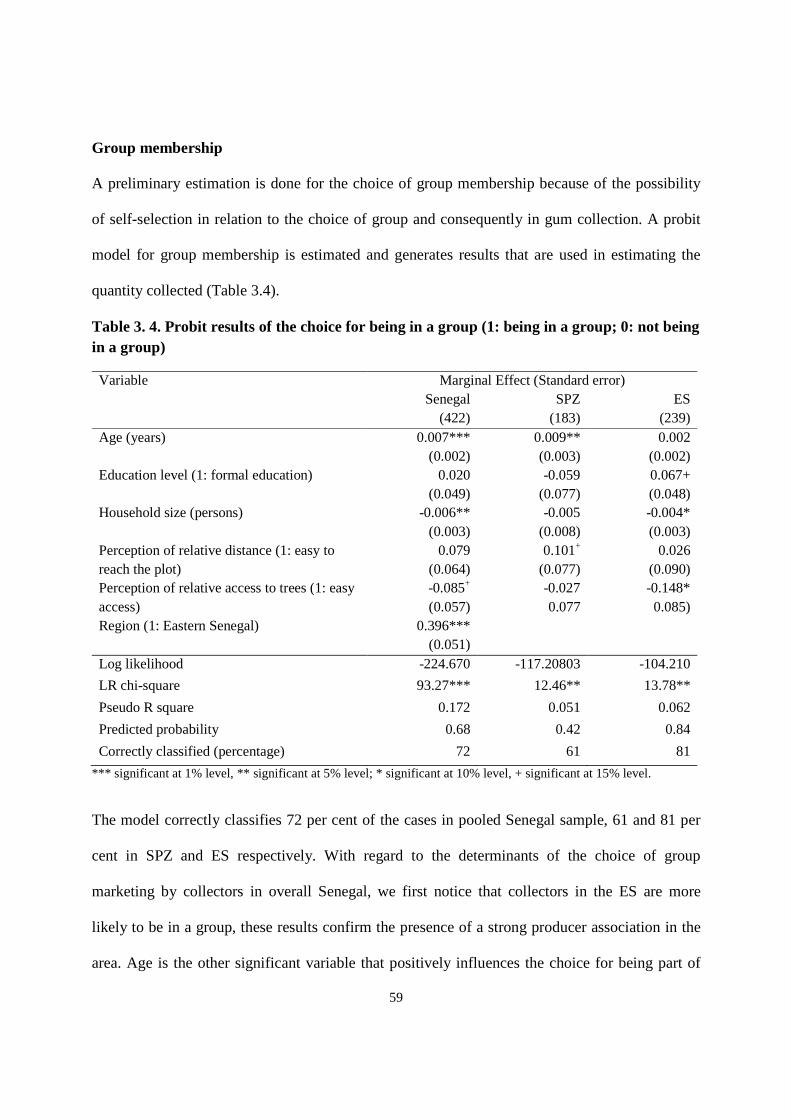
59
Group membership
A preliminary estimation is done for the choice of group membership because of the possibility
of self-selection in relation to the choice of group and consequently in gum collection. A probit
model for group membership is estimated and generates results that are used in estimating the
quantity collected (Table 3.4).
Table 3. 4. Probit results of the choice for being in a group (1: being in a group; 0: not being in a group)
Variable Marginal Effect (Standard error) Senegal
(422) SPZ
(183) ES
(239) Age (years) 0.007***
(0.002) 0.009** (0.003)
0.002 (0.002)
Education level (1: formal education) 0.020 (0.049)
-0.059 (0.077)
0.067+ (0.048)
Household size (persons) -0.006** (0.003)
-0.005 (0.008)
-0.004* (0.003)
Perception of relative distance (1: easy to reach the plot)
0.079 (0.064)
0.101+ (0.077)
0.026 (0.090)
Perception of relative access to trees (1: easy access)
-0.085+ (0.057)
-0.027 0.077
-0.148* 0.085)
Region (1: Eastern Senegal) 0.396*** (0.051)
Log likelihood -224.670 -117.20803 -104.210
LR chi-square 93.27*** 12.46** 13.78**
Pseudo R square 0.172 0.051 0.062
Predicted probability 0.68 0.42 0.84
Correctly classified (percentage) 72 61 81
*** significant at 1% level, ** significant at 5% level; * significant at 10% level, + significant at 15% level.
The model correctly classifies 72 per cent of the cases in pooled Senegal sample, 61 and 81 per
cent in SPZ and ES respectively. With regard to the determinants of the choice of group
marketing by collectors in overall Senegal, we first notice that collectors in the ES are more
likely to be in a group, these results confirm the presence of a strong producer association in the
area. Age is the other significant variable that positively influences the choice for being part of
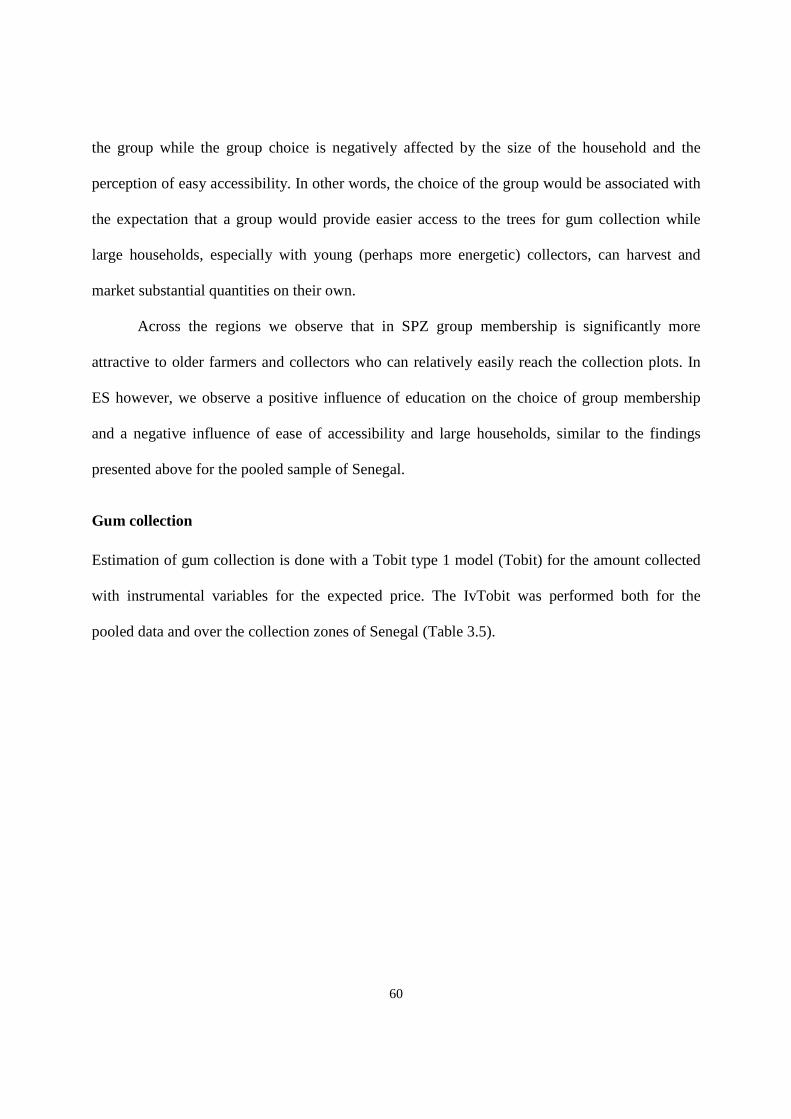
60
the group while the group choice is negatively affected by the size of the household and the
perception of easy accessibility. In other words, the choice of the group would be associated with
the expectation that a group would provide easier access to the trees for gum collection while
large households, especially with young (perhaps more energetic) collectors, can harvest and
market substantial quantities on their own.
Across the regions we observe that in SPZ group membership is significantly more
attractive to older farmers and collectors who can relatively easily reach the collection plots. In
ES however, we observe a positive influence of education on the choice of group membership
and a negative influence of ease of accessibility and large households, similar to the findings
presented above for the pooled sample of Senegal.
Gum collection
Estimation of gum collection is done with a Tobit type 1 model (Tobit) for the amount collected
with instrumental variables for the expected price. The IvTobit was performed both for the
pooled data and over the collection zones of Senegal (Table 3.5).
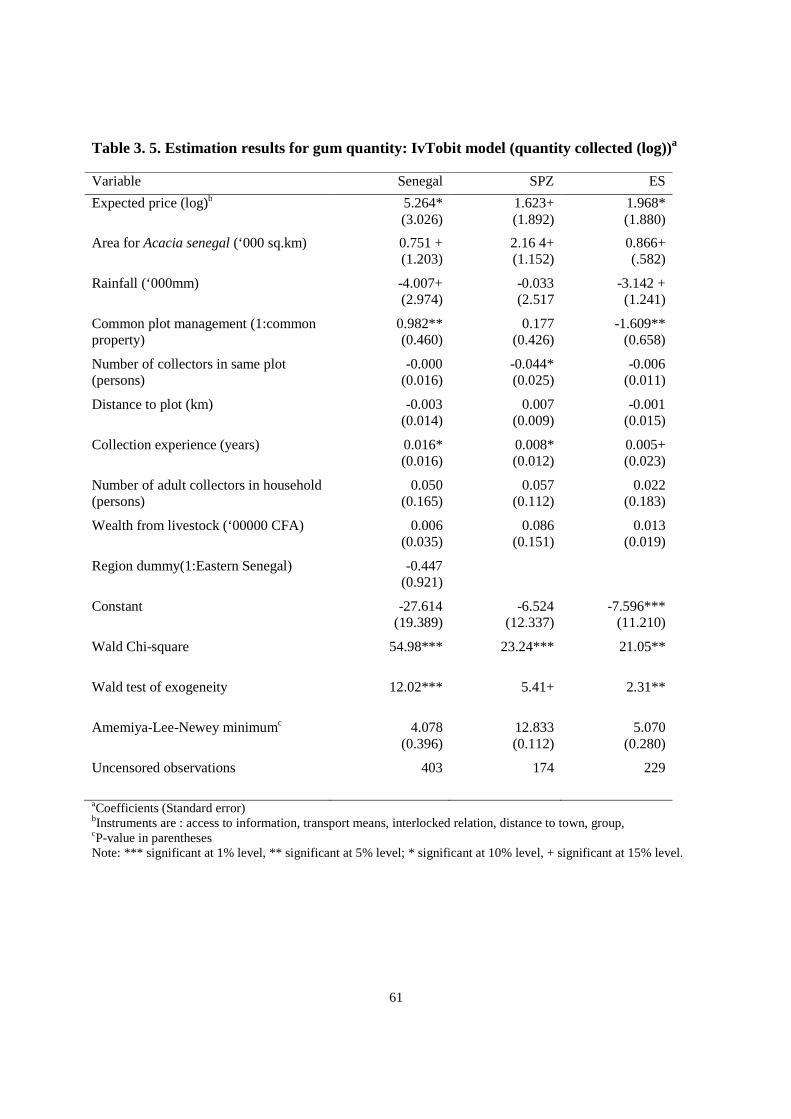
61
Table 3. 5. Estimation results for gum quantity: IvTobit model (quantity collected (log))a
Variable Senegal SPZ ES
Expected price (log)b 5.264* (3.026)
1.623+ (1.892)
1.968* (1.880)
Area for Acacia senegal (‘000 sq.km) 0.751 + (1.203)
2.16 4+ (1.152)
0.866+ (.582)
Rainfall (‘000mm) -4.007+ (2.974)
-0.033 (2.517
-3.142 + (1.241)
Common plot management (1:common property)
0.982** (0.460)
0.177 (0.426)
-1.609** (0.658)
Number of collectors in same plot (persons)
-0.000 (0.016)
-0.044* (0.025)
-0.006 (0.011)
Distance to plot (km) -0.003 (0.014)
0.007 (0.009)
-0.001 (0.015)
Collection experience (years) 0.016* (0.016)
0.008* (0.012)
0.005+ (0.023)
Number of adult collectors in household (persons)
0.050 (0.165)
0.057 (0.112)
0.022 (0.183)
Wealth from livestock (‘00000 CFA) 0.006 (0.035)
0.086 (0.151)
0.013 (0.019)
Region dummy(1:Eastern Senegal) -0.447 (0.921)
Constant -27.614 (19.389)
-6.524 (12.337)
-7.596*** (11.210)
Wald Chi-square 54.98*** 23.24*** 21.05**
Wald test of exogeneity 12.02*** 5.41+ 2.31**
Amemiya-Lee-Newey minimumc 4.078 (0.396)
12.833 (0.112)
5.070 (0.280)
Uncensored observations 403 174 229
aCoefficients (Standard error) bInstruments are : access to information, transport means, interlocked relation, distance to town, group, cP-value in parentheses
Note: *** significant at 1% level, ** significant at 5% level; * significant at 10% level, + significant at 15% level.
62
Results from IvTobit bring out the effect of the expected price on collection. The Wald test of
exogeneity is significant implying that the expected price is indeed an endogenous variable. The
test of the validity of the instruments with the Amemiya-Lee-Newey minimum chi-square
statistic shows that the instruments seem not to have a direct effect on the dependent variable and
hence are valid (perhaps weakly valid in SPZ). The effect of the expected price is positive,
confirming that better prices lead to better production.
Collection of gum is influenced by availability of trees: the area of Acacia senegal
increases the potential for gum collection but the high long-term rainfall leads to low production
because the rainfall would reduce the aridity conditions. Collection in common plots has an
unexpected positive influence on the quantity collected which can be attributed to that communal
areas are more productive. Yet, competition in common plots reduces the individual quantity (see
also chapter 6). A significantly positive effect of the collector’s experience on quantity is
observed.
There are differences between the gum producing regions captured mainly by village
effects. The effect of expected price, area of Acacia senegal and rainfall is robust in ES but in
SPZ the difference in rainfall between collection areas is not significant. The unexpectedly
positive effect of collection in common plots might have come from the SPZ where the area
covered Acacia senegal is very large; a strong negative effect of collection in communal plots is
observed in ES. Increased competition over tree resources (when the number of collectors in the
same plot increases) leads to low individual quantities. This effect is probably due to occasional
collectors who rush to 'the -freely accessible- communal plots' to collect gum especially when
prices increase, thereby reducing the individual quantity as mentioned. This may lead to
overexploitation and abuse of gum trees in order to obtain substantial quantities. The collector’s
experience remains significant either in SPZ or ES.
63
Choice of gum sale place
The next question to solve in this study is the choice of the place of gum sales. A conditional
logit model is used to analyse the collector’s decision to sell gum in the village or in a town
market. The analysis was performed for the cases where collection has actually been done, since
these are the collectors who need to make a choice of where to sell. Explanatory variables include
market specific characteristics, market proportional transaction costs, and individual
characteristics. To include the individual variables where no within-case variability is observed,
an alternative-specific conditional logit (asclogit) model was used (Table 3.6).
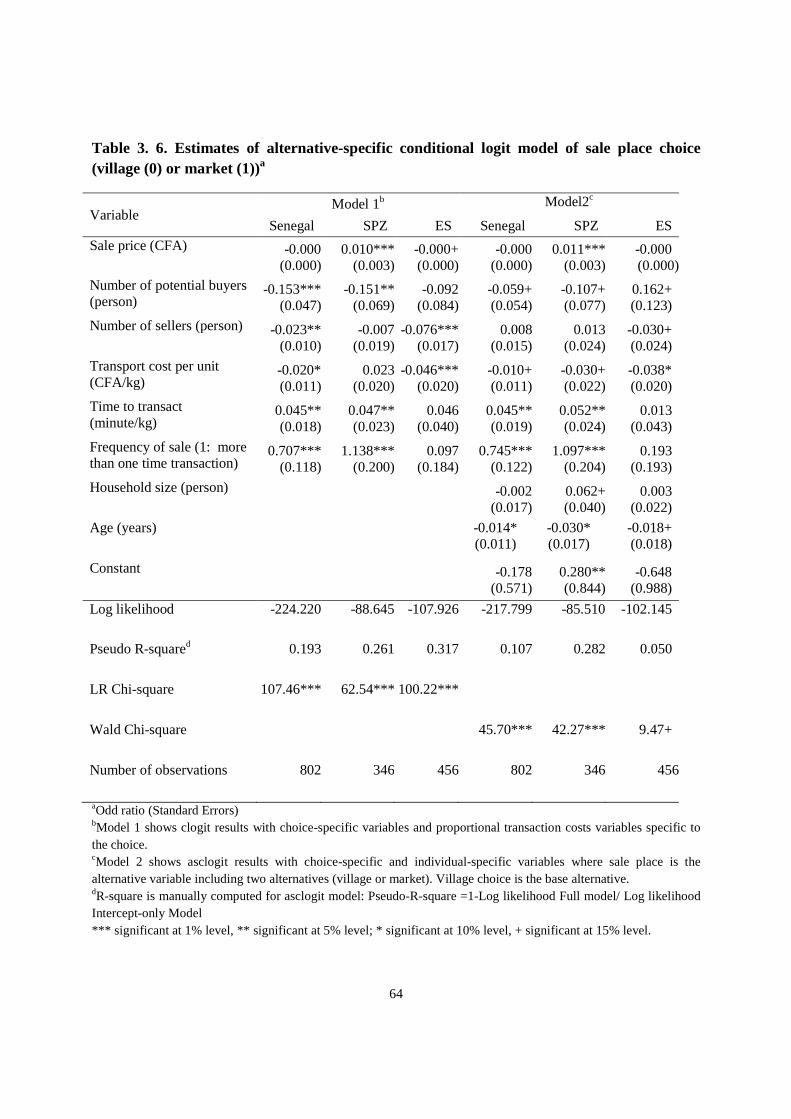
64
Table 3. 6. Estimates of alternative-specific conditional logit model of sale place choice (village (0) or market (1))a
Variable Model 1b Model2c
Senegal SPZ ES Senegal SPZ ES Sale price (CFA) -0.000
(0.000)0.010***
(0.003)-0.000+ (0.000)
-0.000(0.000)
0.011*** (0.003)
-0.000 (0.000)
Number of potential buyers (person)
-0.153***(0.047)
-0.151**(0.069)
-0.092 (0.084)
-0.059+(0.054)
-0.107+ (0.077)
0.162+ (0.123)
Number of sellers (person) -0.023**(0.010)
-0.007(0.019)
-0.076*** (0.017)
0.008(0.015)
0.013 (0.024)
-0.030+ (0.024)
Transport cost per unit (CFA/kg)
-0.020*(0.011)
0.023(0.020)
-0.046*** (0.020)
-0.010+(0.011)
-0.030+ (0.022)
-0.038* (0.020)
Time to transact (minute/kg)
0.045**(0.018)
0.047**(0.023)
0.046 (0.040)
0.045**(0.019)
0.052** (0.024)
0.013 (0.043)
Frequency of sale (1: more than one time transaction)
0.707***(0.118)
1.138***(0.200)
0.097 (0.184)
0.745***(0.122)
1.097*** (0.204)
0.193 (0.193)
Household size (person)
-0.002(0.017)
0.062+ (0.040)
0.003 (0.022)
Age (years) -0.014* (0.011)
-0.030* (0.017)
-0.018+ (0.018)
Constant
-0.178(0.571)
0.280** (0.844)
-0.648 (0.988)
Log likelihood -224.220 -88.645 -107.926 -217.799 -85.510 -102.145
Pseudo R-squared 0.193 0.261 0.317 0.107 0.282 0.050
LR Chi-square 107.46*** 62.54*** 100.22***
Wald Chi-square 45.70*** 42.27*** 9.47+
Number of observations 802 346 456 802 346 456
aOdd ratio (Standard Errors) bModel 1 shows clogit results with choice-specific variables and proportional transaction costs variables specific to the choice. cModel 2 shows asclogit results with choice-specific and individual-specific variables where sale place is the alternative variable including two alternatives (village or market). Village choice is the base alternative. dR-square is manually computed for asclogit model: Pseudo-R-square =1-Log likelihood Full model/ Log likelihood Intercept-only Model *** significant at 1% level, ** significant at 5% level; * significant at 10% level, + significant at 15% level.

65
Model 1 includes the choice-specific variables directly related to market outlet and
proportional transaction costs. We notice first that holding other variables constant, the effect
of the number of buyers on choice of market outlet is unexpected: an increase in the number
of buyers can normally lead to increase in competition and consequently increase in demand
for gum arabic and prices that are attractive to collectors. However, the negative effects
suggests that collectors tend to avoid larger markets. It also points to the reliance of collectors
to a ‘preferred’ regular buyer. This explanation may be more relevant in the interlocked
context or when prices offered by different traders are not different. Secondly, the increase in
the number of sellers decreases the likelihood of selling in a market place because of
competition. This competition would give to buyers additional power to ‘dictate’ the price
especially because these collectors have individually low bargaining power. Thirdly, an
increase in the transport cost per unit of product is associated with a decrease in the likelihood
of selling in the market but an increase in transaction time per unit of gum is associated with
an increase the likelihood of selling in the market. An increase in the frequency of transaction
would increase the likelihood of selling in the market. This would indicate that the physical
transport cost is particularly constraining, but time is not. Hence, spending time is not
regarded as inefficient but rather as an investment in a good relationship with the buyer.
A focus on the regions shows that in SPZ, an increase in the price in the village or
market leads to an increase in the probability of selling in that particular place while an
increase in the number of buyers decreases the likelihood of selling in the village or market,
holding other variables constant. Also, an increase in the time to transact is associated with an
increase the likelihood of selling in that place. Furthermore, an increase in frequency of
transactions increases the likelihood of selling in that place. In ES however, an increase in
price, number of buyers, and number of sellers in the village or market, holding other
variables constant, leads to a decrease in the probability of choosing to sell either in the
66
village or market. Moreover, an increase in transport cost per unit is associated with a
decrease in the likelihood of selling in the village or market.
Model 2 includes the individual-specific variables in addition to the choice-specific
variables. With respect to choice-specific variables, the above discussed results of Model 1
are robust for most variables. Individual-specific factors are also important in influencing the
choice of selling gum in the village or transporting it to a town market. For the pooled sample
of collectors in Senegal, relative to the probability of choosing to sell in the village (base
alternative), the negative coefficient of the age variable shows that markets seem to attract
younger collectors. Specific to SPZ, we notice that the probability of selling in the market
increases with household size. Collectors with larger families may go to the market to sell
gum and on the way back home bring marketable items needed by the household. Similar to
the pooled sample, in SPZ, age decreases the probability of selling in the market. Specific to
ES, age is also significant and decreases the likelihood of selling in the market.
The Wald chi-square test of whether all regressors are jointly significant is only
weakly significant for Model 2 in ES. This implies that caution is to be taken in interpreting
the results which are not significant.
3.4 Discussion and conclusion
The above findings confirm several theoretical propositions and previous empirical findings.
First, they confirm that the collector tries to maximize his net returns by outweighing the
production and market decisions. Hence, improving the net returns by way of higher prices
and related incentives by reducing costs can contribute to an improvement of collection.
These returns are assessed from the expected price in relation to the distance to the town,
being in interlocked relations and the extent of fixed transaction costs. The interlocked
relations imply that collection is intended to make payments to the debt contracted by a
collector and hence a choice of market and trading partner is made prior to the collection.
67
Fixed transaction costs are also important in the decision process; if they are very high, they
might make the collector decide not collect the gum (Goetz, 1992; Holloway et al., 2001).
The possession of transport means, the access to information and participation in groups or
associations for marketing may help in reducing such transaction costs (Poulton et al., 2006,
Jagwe et al., 2010). These groups/associations attract the old collectors, with small
households, or who have expectations that the group/association will provide easy access to
the tree resources.
Secondly, collection is in line with production function stipulations: gum collection
can increase through the expansion of area Acacia senegal area especially where rainfall
levels are not very high; Elrayah et al. (2012) confirm that while good rains are a signal of
good production, continuously high rainfall is bad for production. Collection can also be
increased through the use of more inputs (labour and its experience) and the expansion of the
‘farm’ size (here the area covered by Acacia trees). However since this area is exploited in
forests managed in a communal setting, accessibility to such trees for gum collection should
be secured, implying that property rights need to be well defined and enforced as the current
governance system does not successfully achieve the exclusion of occasional collectors. This
is because the non-exclusion allows competition over forests that lead to the decline in
individual collections with potential to overuse and abuse tree resources which may lead to a
tragedy of commons as described by Hardin (1968) or Oates (1999). The main reason for such
competition is the price incentives offered indiscriminately to the professional and occasional
gum collectors.
Thirdly, collectors sell in the village because the differences between village and
market price are not large enough to allow collectors to evaluate benefits of going to the
market unless other activities can be combined with travelling to the market such as acquiring
the products that a household needs. While the price is generally a motivating factor to sell in
68
the market, the constraining factors include the competition with other collectors who sell
gum and maintenance for a particular trader who buy gum. The relationship with a trading
partner is maintained most probably because there are no (large) differences in prices paid by
different traders on the market.
Fourthly, proportional transaction costs that vary with the quantity to sell remain
influential in the decision of where to sell (Vakis et al., 2003). On the one hand, the transport
cost is associated with a decline in the probability to sell at distant markets; here, the state of
the rural roads infrastructure is to be looked at, as these roads are impassable. Hence, given
the problem of transport costs, collectors who have to sell larger quantities would rather stay
in the village instead of going to the market (Fafchamps and Hill, 2005). On the other hand,
the time to transact a unit of the product was not a deterring factor in selling. Here the social,
linguistic and cultural elements are at play rather than the urge to conclude a transaction. The
frequency of transactions increases the likelihood of selling with the advantage that this
frequency reduces transaction costs involved in the search for a buyer mainly through
established relationships. Such relationships also increase reputation and are a basis for
building trust (Fafchamps and Gabre-Madhin, 2006).
Finally, the aged collectors prefer to stay in the village. Going to the market seems
more attractive to the collectors with large households who would then combine gum selling
with acquiring items of necessity to their household needs.
All in all, the results suggest that there is a link between collection and marketing of
gum, and by extension NTFPs. Through an evaluation of the net returns: a decision is made
about collection and consequently of an efficient market where the collected gum can be
profitably sold. In other words, collection can be restricted by market failures. Given that the
Acacia trees are available in open access areas and that the markets are not specialized in gum
trading, it means that unless the collector has already closed a deal with a buyer beforehand,
69
he decides to collect, goes to the forest and takes gum depending on his possibilities to put in
labour time and cover fixed transaction costs. He then decides on which market to which he
sells this gum given the amount he has collected in consideration of proportional transaction
costs and household characteristics. This is also because the market of gum is not a
specialised market, but one that is used for exchanges of other goods. The analysis also goes
in line with predictions of our theoretical model, that costs incurred in finding a good market
can be regarded as an investment, whereby the collector may continue to transact with the
same trading partner (and hence in the same market). Yet, a revision of the choices may be
done at some point depending on the quantity (e.g., if the quantity collected is smaller or
larger than expected) and other related proportional costs.
70
Behaviour and performance of traders in the gum arabic supply chain in Senegal:
investigating oligopsonistic myths.
Abstract
Farmers face monopsonist/oligopsonist structures in agricultural or forest products markets
because of the limited choice of traders/buyers. As a consequence, these farmers and traders
alike, in successive transactions along the supply chain, may get lower prices in selling their
products. This leads to a problem of double (or even multiple) marginalisation. We
investigate oligopsonist tendencies in the trade of gum arabic, a non-timber forest product
which is widely used as an additive in food and non-food industries. We compute traders’
shares and a corresponding Herfindahl index in primary, transport and wholesale markets of
gum arabic in Senegal to analyse the market concentration; through a gllamm procedure we
analyse determinants of these market shares and finally by a weighted least square regression,
we analyse determinants of marketing margins of individual traders. The computed
Herfindahl index was found too low to have any influence on margins and hence oligopsonist
powers could not be confirmed. Instead traders’ margins depend on costs, risk and uncertainty
that they face. Consequently, traders were not found exploitative; their power is derived from
access to capital and market characteristics.
Key words: oligopsony, double marginalisation, Herfindahl index, market accession, market
exit, risk, marketing margins.
4.1 Introduction
Markets of agricultural or forest products are often imperfect, especially in developing
countries. Towards the consumer end of the supply chain, monopolies or oligopolies are
found with many consumers buying from a limited number of retailers. On the other side of
the chain, farmers often face monopsonies or oligopsonies because they have a limited choice
of traders to whom they can sell. Furthermore, within the supply chain, the number of buyers
71
at different intermediary levels, from producers to the processing and/or export level, is
successively often smaller than the number of sellers. This might imply imperfect competitive
market structures with successive oligopsonist tendencies. Due to these successive
oligopsonies, buyers may offer lower prices compared to what they would pay if they were in
a competitive market, because they also face lower prices in the markets where they sell. As a
consequence, the traded volumes are smaller than if the market was perfectly competitive.
Furthermore, the market power with successive oligopsonies applied at each level of the
supply chain results in a fall in the prices consecutively paid and quantities consecutively
traded along the chain. This problem was first described by Spengler (1950) and has become
known as ‘double marginalisation’ in reference to a simultaneous exercise of market power
by trading agents against each other. Arguably, double marginalisation does not only
determine the price levels in the chain and the volume marketed, but it also affects marketing
margins (Spengler, 1950; Lantz, 2009).
The specific role of traders and intermediaries in agricultural markets in developing
countries has been subject of many studies in context of their different roles and functions: as
intermediaries in searching for a trading partner (e.g., Gabre-Madhin, 2001); as brokers in
improving market efficiency (e.g., Gabre-Madhin, 2001); or as risk bearers in exploring or
creating market exchange opportunities (e.g., Rubinstein and Wolinsky, 1987; Gadde and
Snehota, 2001). However, claims were often made that these traders exploit farmers by
capturing excessive ‘monopsonist rents’ (McMillan et al., 2002; Fafchamps and Gabre-
Madhin, 2006; Fafchamps and Hill, 2008) or by colluding (Batt, 2004). Yet, empirical studies
such as Batt et al. (2009) or Mose (2007) fail to substantiate such exploitation. In the presence
of competition among traders in the maize market in Kenya studied by Mose (2007), no
evidence of such exploitation was found.
72
Fafchamps and Hill (2008) explained that the perception of farmers’ exploitation by
traders is associated with traders taking advantage of the farmers’ low bargaining power and
their ignorance on price movements but also with high transport and transaction costs in
marketing that these traders face. Lele (1981) explained that these marketing costs result from
the long chain of intermediaries from producer to consumer. Some large traders can handle a
large share of marketed quantities and surpluses, yet rural traders are often found to work on
low margins and earn a meagre income; in fact they are ‘just rational and acting under
constrained efficiency’ (Fafchamps et al., 2003). These small rural traders transact small
quantities because of limited access to working capital, limited storage facilities, and high
marketing and transaction costs due to extensive travelling on poor roads and inadequate
transport infrastructure and services in rural areas (World Bank, 2007)
Poor infrastructure not only increases costs of transportation; it also causes delays in
transport and consequently decreases profitability (Schroeter and Azzam, 1991; Fafchamps
and Gabre-Madhin, 2001; Shackleton and Shackleton, 2004; Eskola, 2006). Price uncertainty,
inconsistent government policies and continued suspicion of trader activity are also found to
seriously constrain trade (Schroeter and Azzam, 1991). These constraints not only increase
marketing costs, but also determine the environment in which traders operate. This
environment in turn influences traders’ behaviour including the distribution of market power
and profits or margins earned in the market (Raper et al., 2000; Myers et al., 2010).
Despite the importance given to marketing costs and the distribution of market power,
both issues have seldom been investigated in the context of oligopsonies and double
marginalisation problem. In this chapter we address this gap by studying the case of the
performance of traders in the supply chain of gum arabic in Senegal. We investigate the gum
market structure and assess its impacts on market outcomes (marketing margins).
73
Different categories of intermediaries in the Senegalese supply chain of gum arabic
and in extenso of many raw agricultural and forestry products can be distinguished, namely:
(a) a primary category of village traders and mobile traders; (b) an intermediate category of
transporters; and (c) a high category of wholesalers, exporters and processors (Figure 2.5). A
successive oligopsonistic market structure in the gum arabic chain is observed as local traders
purchase gum from many producers but they sell this gum to fewer transporters, whose main
function is to move the gum. They in turn sell to fewer wholesalers; and in this high category,
the number of local processors and exporters is very limited. We focus our analysis on those
primary traders who move between producing villages or weekly markets to buy gum from
the collectors, on transporters who move to rural markets in production regions to buy gum
from primary traders, and on wholesalers who are established in cities neighbouring the
production zones. We describe their role and analyse how the market structures in which they
operate influence their performance in the gum business. We specifically investigate whether
the variations in the marketing margins are indeed a result of market power as predicted by
the double marginalisation. We base this analysis on data collected from the Sylvopastoral
and Eastern regions of Senegal from 124 traders who are village, mobile, transporters and
wholesale traders.
In the next section we develop a theoretical framework to analyse oligopsonies and to
explain the theoretical consequences of the double marginalisation problem. Next the
structure of the supply chain of gum arabic in Senegal is explored. This is followed by a
methodology and a results section. Finally we discuss these results, and give conclusions.
4.2 Oligopsony markets
As mentioned in the introduction, the agricultural marketing system in most developing
countries is characterised by oligopolistic and oligopsonistic structures. On the side of outputs
markets, oligopolistic systems are observed where there are relatively few distributors and
74
numerous consumers (Mendoza and Rosegrant, 1995). Markets of raw agricultural and forest
products mainly exhibit oligopsonistic features as there are numerous farmers or collectors,
and relatively few traders. Along supply chains of raw products, successive intermediaries
function in similar oligopsonies that are associated with the presence of non-competitive
buyers at the different levels of the market namely primary and intermediate traders,
wholesalers, or processors (Lele, 1981).
Generally in oligopsonistic markets, numerous sellers compete to sell their product to
a small number of (often larger and more powerful) buyers (Jehle and Reny, 2000). The most
important characteristics of oligopsonies are that: (1) these markets are dominated by a small
number of buyers; (2) sellers face few alternatives to sell their goods and if other alternative
buyers exist, these tend to be less desirable for instance because markets are inaccessible; and
(3) the market shows significant barriers to entry that enable buyers to attain and retain
market control (Rogers and Sexton, 1994; Bergman and Brännlund, 1995). Barriers to market
entry can be natural, formal or informal. Menzie and Prentice (1987) explain that natural
barriers include ‘natural’ or geographic barriers such as being remote or landlocked. Formal
trade barriers are defined as any direct action that restricts trade such as a government policy
or regulation (Ackah and Morrissey, 2005), and may include patents, taxes, quantitative
restrictions, and quality requirements (Menzie and Prentice, 1987). Informal trade barriers
impact on trade indirectly. These include individual constraints such as difficult access to
credit, lack of capital to expand the business or to engage in storing the products, lack of or
limited business skills/knowledge, and problems due to the institutional framework such as
long supply chains or lack of established rules of transaction. Other informal barriers include
social, linguistic or cultural differences which have an effect on negotiation (Kherallah et al.,
2000; Eskola, 2006).
75
Oligopsonistic market structures have received relatively little attention in agricultural
economics literature. Early in the 20th century, economists started to recognize the imbalance
of power between farmers and the system of sale for their produce. Cooperation for joint
performance (cooperatives, associations) was considered as a way to correct these imbalances
(Nourse, 1922). The Structure-Conduct-Performance approach was occasionally used to
analyse oligopoly power and its impacts on consumers in the context of industrial
organisation studies; yet, it is only the ‘New Empirical Industrial Organization’ (NEIO)
theory that investigated the relevance of traders’ oligopsony power over farmers in inputs
markets (Myers et al., 2010). A few studies that focused on oligopsonies laid emphasis on
testing, measuring or determining this oligopsony power in different industries and markets
(e.g., Ukrainian milk processing industry (Perekhozhuk et al., 2009), U.S. Paper Industry
(Mei and Sun, 2008), and UK Salmon markets (Fofana and Shabbar, 2008)). Other studies
focused on finding measures or strategies for mitigating this oligopsony power, e.g.,
theoretically through vertical integration (Loertscher and Reisinger, 2009) or empirically
through Fair Trade in the coffee market (Piyapromdee et al, 2008). Some authors analysed the
price determination in oligopsonic markets while others focussed on issues of double
marginalisation as a consequence of repeated oligopsonies in the chain. We take a closer look
at the literature on both issues in the next sections.
Studies by Just and Chern (1980), Sexton (1990), Chen and Lent (1992), Rogers and
Sexton (1994), and Myers et al. (2010) provide guidelines on modelling oligopsony
relationships between firms and industries. Firms operating within oligopsonies exhibit
strategic behaviour as each firm has to be aware of the actions of the other market
participants. When firms decide to cooperate, collusion takes place within the industry (e.g.,
explicitly through cartels) or price leadership occurs when one firm is followed by other firms
in the industry.
76
Profits for an oligopsonist depend not only on demand and supply but also on the
behaviour of competing traders. The more the competitors buy, the lower the market price
will be. This is due to a ‘payoff interdependency’ as explained by Church and Ware (1999).
Since traders operate in a strategic context, to determine the profit-maximizing quantity, each
trader has to figure out how much his competitor is going to buy and sell while recognizing
that the competitor is also going through the same thinking process. Each buyer knows that if
he can unilaterally increase his market share by acquiring more products, his profits will
increase. However, if all firms exercise their power and compete aggressively for more
market share, even if they are fewer on the market, they will all be worse off: the resulting
low prices will lower both aggregate and individual profits.
Successive oligopsonies in supply chain: the double marginalisation problem
The general double marginalisation problem in supply chains occurs when two (or more)
independent firms have large market power and exercise this power to set up prices at mark
ups different than MC: monopolies’ prices are above MC and monopsonies’ prices are below
MC; these deviations yield deadweight losses. With successive market imperfections, actors
reduce their combined profit by simultaneously exercising their market power and as such no
stable equilibrium is reached in the market (Lantz, 2009). In the next paragraphs the problem
of double marginalisation is illustrated by taking the case of successive monopsonies instead
of oligopsonies to facilitate graphical clarity.
Consider the case of a monopsony and three successive stages of marketing: (1) the
acquisition of the product by a trader from farmers in a particular village; (2) a trader supplies
the product from the village to a wholesaler; and (3) a wholesaler supplies to an exporter or a
processor who aims at maximizing his profits in the transformation of the raw product and
there is no vertical integration. Figure 4.1 illustrates the analysis of double marginalisation
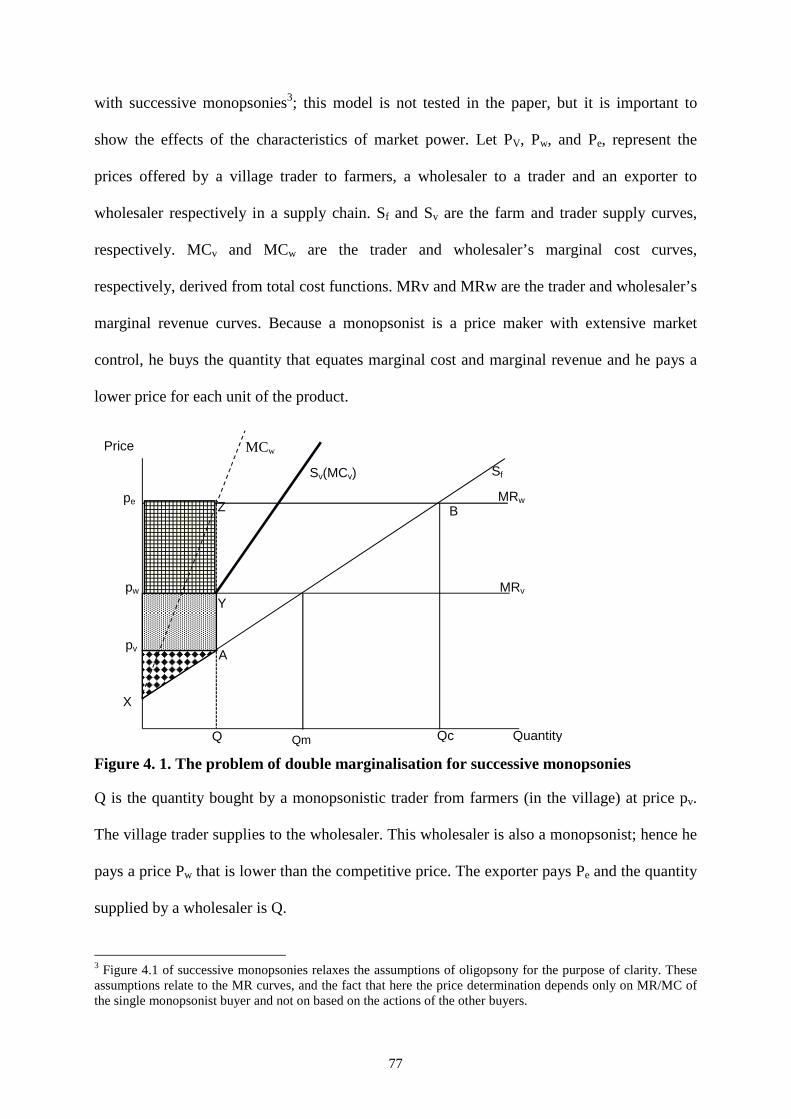
77
with successive monopsonies3; this model is not tested in the paper, but it is important to
show the effects of the characteristics of market power. Let PV, Pw, and Pe, represent the
prices offered by a village trader to farmers, a wholesaler to a trader and an exporter to
wholesaler respectively in a supply chain. Sf and Sv are the farm and trader supply curves,
respectively. MCv and MCw are the trader and wholesaler’s marginal cost curves,
respectively, derived from total cost functions. MRv and MRw are the trader and wholesaler’s
marginal revenue curves. Because a monopsonist is a price maker with extensive market
control, he buys the quantity that equates marginal cost and marginal revenue and he pays a
lower price for each unit of the product.
Figure 4. 1. The problem of double marginalisation for successive monopsonies
Q is the quantity bought by a monopsonistic trader from farmers (in the village) at price pv.
The village trader supplies to the wholesaler. This wholesaler is also a monopsonist; hence he
pays a price Pw that is lower than the competitive price. The exporter pays Pe and the quantity
supplied by a wholesaler is Q.
3 Figure 4.1 of successive monopsonies relaxes the assumptions of oligopsony for the purpose of clarity. These assumptions relate to the MR curves, and the fact that here the price determination depends only on MR/MC of the single monopsonist buyer and not on based on the actions of the other buyers.
MRw
MRv
Sf
MCw
pw
Q
Y
pv
B pe
Quantity
Price
Sv(MCv)
X
A
Z
Qc Qm
78
The farmer’s surplus is pvAX, the village trader’s surplus is pvAYPw. and the
wholesaler’ s surplus is PwYZPe. Hence with successive monopsonies, the aggregate surplus
earned along the chain is XAZPe which is obtained from trading Q quantity of the product.
If the respective traders along the chain were operating in perfectly competitive
conditions, the quantity purchased and price to the producer would be greater than in the
presence of monopsonies. For instance at the export price Pe, a farmer in a competitive setting
could supply Qc and the surplus throughout the chain would be XBPe. This competitive
surplus is greater than the aggregate monopsonists’ surplus.
As the number of imperfect marketing stages increases, the effect of such
imperfections on the farmer(price) becomes even more pronounced because each trader in
each stage aims at earning a monopsonistic profit (McMillan et al., 2002).
In successive oligopsonies, the impact of double marginalisation in depressing prices,
quantity traded and overall surplus in the chain will depend on market concentration and the
type of interaction allowed between traders.
The generally proposed solution to the double marginalisation problem is vertical
integration which should lead to higher chain profits (Spengler, 1950, Gaudet and Van Long,
1995). Vertical integration eliminates some of the monopoly (monopsony) mark-ups, leading
to a lower sale (higher buying) price and an increase in welfare (West, 2000). From a New
Institutional Economics perspective, vertical integration may also act positively on profits
through minimization of transaction costs.
While surpluses for traders have been explained above by market power in relation to
the prices and quantities in transaction, it is important to consider that these surpluses may
also depend on the determinants of the marginal costs which are associated with functions
performed by these traders. These are outlined in the next section.
79
Functions and costs of trading
The role of a trader is to transport, grade, bring to market and sell products to consumers
(Eaton et al. 2007). Kotler (1997) listed nine market functions: (1) information collection and
dissemination; (2) development and dissemination of persuasive communications about
offers; (3) negotiation attempts to reach final agreement on price and other items of the offers;
(4) ordering backward communication of intentions to buy; (5) financing acquisition and
allocation of funds required to finance the carrying of inventory; (6) risk taking in connection
with carrying out channel work; (7) successive storage, processing and movement of physical
products; (8) payment of bills; and (9) actual transfers of title of goods. All these marketing
functions are associated with marketing costs and transaction costs including the cost of
searching for an exchange partner (Gabre-Madhin, 1999); the cost of acquiring information
specially in the context of information asymmetries (Ellis, 1988; Hobbs, 1996; Upton, 1996);
and negotiation costs and costs for concluding and enforcing a contract (Hobbs, 1996).
As mentioned in the introduction, marketing costs are especially high in developing
countries due poor infrastructure and inefficient transport system, inadequate storage capacity,
lack of reliable market information or modern communication facilities, and significant
variations in product form, variety and quality (Rogers and Sexton, 1994; Harris-White, 1997;
Batt, 2004). These factors also make trade in developing countries very risky. In the markets
of non-timber forest products such as gum arabic, costs are even higher because producers are
often dispersed over large areas and markets are located in marginalized areas characterized
by poorly developed transport and communication infrastructure.
Social capital and the use of intermediaries may reduce transaction costs and risk.
According to Fafchamps and Minten (2001), social capital through kinship or networks may
help economize on transactions costs by speeding up the search for trading partners,
80
providing insurance in order to enforce contracts and facilitating the circulation of
information (Fafchamps and Minten, 2001; Le Goulven, 2001).
Finally, it should be noted that in addition to marketing functions and costs, other
factors influence marketing margins. Wohlgenant (2001) summarized several studies and
identified these factors as technical and structural changes, cooperative behaviour,
government programs, product quality and seasonality.
Structure of gum arabic supply chain in Senegal
Similar to agricultural markets in Africa studied by Fafchamps (e.g., Fafchamps and Minten,
1998, 2000; Fafchamps et al., 2003; Fafchamps and Gabre-Madhin, 2006), markets for raw
gum arabic are characterized by a large number of gum collectors and relatively few traders
and companies as described in Figure 2.5.
Table 4.1. summarizes the features of gum trade for different categories of traders in
relation to the supply of gum arabic (i.e., factors that influence the supply of gum on the
market), demand for gum arabic(i.e., factors that influence the supply of gum on the market),
transaction costs (i.e., factors that determine the extent of transaction costs in markets of gum
arabic), risks and uncertainty(i.e., factors that influence the magnitude of risk or uncertainty in
marketing gum arabic), and quality requirements (i.e., requirements for quality improvement
and maintenance).
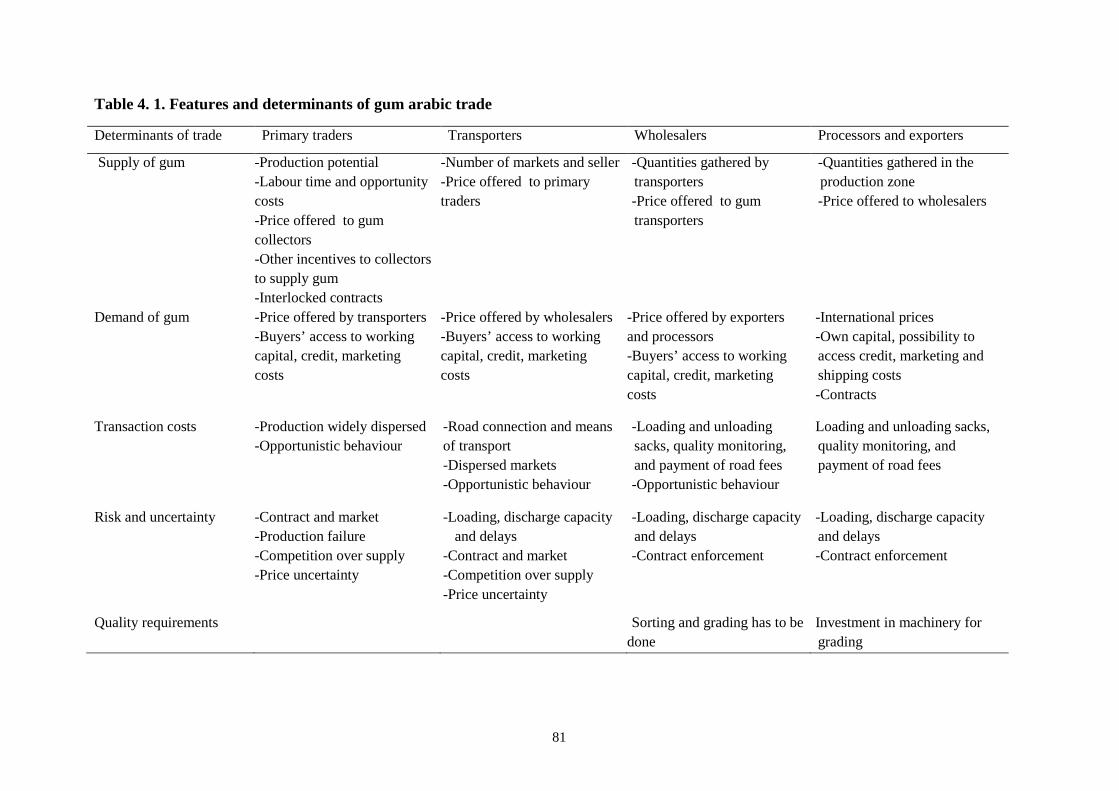
81
Table 4. 1. Features and determinants of gum arabic trade
Determinants of trade Primary traders Transporters Wholesalers Processors and exporters
Supply of gum -Production potential -Labour time and opportunity costs -Price offered to gum collectors -Other incentives to collectors to supply gum -Interlocked contracts
-Number of markets and seller -Price offered to primary traders
-Quantities gathered by transporters -Price offered to gum transporters
-Quantities gathered in the production zone -Price offered to wholesalers
Demand of gum -Price offered by transporters -Buyers’ access to working capital, credit, marketing costs
-Price offered by wholesalers -Buyers’ access to working capital, credit, marketing costs
--Price offered by exporters and processors
--Buyers’ access to working capital, credit, marketing costs
-International prices -Own capital, possibility to access credit, marketing and shipping costs -Contracts
Transaction costs -Production widely dispersed -Opportunistic behaviour
-Road connection and means of transport -Dispersed markets -Opportunistic behaviour
-Loading and unloading sacks, quality monitoring, and payment of road fees -Opportunistic behaviour
Loading and unloading sacks, quality monitoring, and payment of road fees
Risk and uncertainty -Contract and market -Production failure -Competition over supply -Price uncertainty
-Loading, discharge capacity and delays
-Contract and market -Competition over supply -Price uncertainty
-Loading, discharge capacity and delays -Contract enforcement
-Loading, discharge capacity and delays -Contract enforcement
Quality requirements Sorting and grading has to be done
Investment in machinery for grading
82
4.3 Methodology
As explained above, the behaviour and performance of a trader in a supply chain structured as
successive oligopsony are influenced by his action and his strategy towards his competitors.
The current section details the theoretical framework which identifies the role of market
power to the analysis of oligopsonistic behaviour. Empirical specifications are also presented.
Theoretical framework
Gum collectors are assumed to be homogeneous and distributed uniformly. Traders are
homogeneous and price takers in their selling markets. The final customer in the market chain
is considered to be the exporter of raw gum or a processor who uses raw gum to manufacture
various products; however the processing or exporting levels are outside the scope of the
current study.
Let us assume that the market for gum arabic is composed of � traders (i.e., the
buyers) facing numerous sellers (i.e., collectors or traders at successive levels in the chain).
The trader maximizes profits at:
I= = (�% − �9)J= − �(J=) (1)
where I= is profit of trader i, �%and�9 are his selling and buying prices, qi is the quantity
traded and c(qi) the cost function of trading this quantity, with ��(J) > 0. Typically, �9 is an
endogenous variable for a trader in an oligopsonistic position. The value of �9depends on his
activities, but also on the quantities bought by other traders so that �9 = (�)andQ=∑J= . Maximization gives as first-order condition:
��(J=) = (�% − �9) − J= P4QPRS (2)
If the trader wants to buy a larger quantity, he offers a higher price, hence the last term is
positive, making marginal cost somewhat lower than the gross margin. Lower ��(J)implies
lower values of qi, hence the trader buys smaller quantities than he would have done if �9 was
not responsive to his actions.
83
As it is, the effect of qi on �9 can be written as P4QP8 . 84Q . 4Q8 . P8PRS . The first two factors are
the inverse of the supply elasticity E. The last factor shows how total quantity responds to a
unit change in i’s purchases. Given that Q=∑J=, that factor is :
P8PRS = 1 + ∑ PRTPRSCU= ≡ 1 + D (3)
For simplicity we assume that D, a measure for the degree of collusion, is constant over all A, By replacing the elasticity and equation (3) into the formula for c’(qi), this then becomes:
��(J=) = �% − �9 − �9 ',WX RS8 (4)
Following Chen and Lent (1992) we can multiply both sides by RS8 and sum over all I and by
assuming that the marginal costs are insensitive to market shares, the result for an average
trader can be written as:
��(J) = �% − �9 − �9 ',WX ∑YRS8Z( (5)
or
��(J) = �% − �9 − �9 ',WX H (6)
where H is the Herfindahl index of market power. It is a measure of the relative average size
of traders in relation to the market and an indicator of the amount of competition among them
(Chen and Lent, 1992). If [ = 1 �⁄ , there is perfect competition or all traders are of equal
size and if [ = 1, the market behaves as a pure monopsony. Increases in the Herfindahl
index indicate a decrease in competition while reductions in the Herfindahl index indicate an
increase in competition. Values of [ between 1 ⁄ � and 1 correspond to different degrees of
oligopsony. Equation (6) shows that the higher is H (i.e., the larger and more unequal the
market shares), and the higher the level of collusion (D), the lower will be ��(J) and
therefore q itself. By implication, � will be lower too, and less will be bought, thus depressing
the buying prices, while enlarging the gross margins at the trader’s level.
84
Empirical specifications
The empirical application of the profit maximisation model in oligopsony markets of gum
arabic is made in reference to equations (1) and (6); where we explore the magnitude of
market power and the margins and explain determinants of market power (in terms of the
share of traders in market) and marketing margins. First, we compute market shares of traders
based on the transaction quantity of each trader in proportion to the total size of transactions
in that market; and on the basis of these market shares, a Herfindahl index of power in each
market is derived. We then analyse on the individual level the factors that influence the
traders’ market share and derive an interpretation for market accession. Secondly, we
compute gross margins per unit of transaction based on the buying and selling prices and then
net margins subtracting the fixed and variable costs involved in buying and selling. Finally, at
the market level, we analyse the factors that influence the marketing margins and derive an
interpretation for market exit.
(1) Computing market share and deriving the Herfindahl index
The Herfindahl index (H) is a measure of market power, and it involves the calculation of the
market share of each trader as a ratio of the total quantity of his transactions on the total
quantity of transactions conducted in each market.
Since data on the total quantities corresponding to transactions in primary,
transporting and wholesale markets were not directly available 4, the total size of each market
was estimated using one of the different approaches described below: (a) in case all traders
operating in a market were interviewed and each trader indicated the total quantity of his
transactions in the market, the sum of quantities of all traders was obtained (e.g., primary
markets of Barkédji, Labgar, Séno Youpé); (b) in case all traders in a primary market could
not be interviewed, total quantities supplied by producers were calculated based on the
4 Secondary data is scarce and that it was not possible to interview all traders in all markets due to their absence or reluctance to accept interviews.
85
average number of producers who sell in a particular market and the average quantity
supplied by producers in that market; (c) the average annual transactions in some markets
were available from secondary sources (CSE (2006) and EXPERNA (2008) in the period
2011-2004 and 2005-2006 in the SPZ and ES respectively. Such averages served as an
estimate of the current market size assuming that transactions followed similar trends over
time (e.g., Linguère, Kamb); (d) in transporting markets, the aggregation of quantities from
primary markets is computed; and (e) in wholesale markets, the weighted average production
of the last five years (COMTRADE, 2011) served as an estimate of the current exports.
Weights in the wholesale markets of the SPZ and ES were derived as 55 and 5 per cent of the
exports from SPZ and ES respectively (the remaining 40 per cent exports are from the
Northern region (DEFCCS, 2005; Diop 2005)).
A trader‘s share is computed as the proportion of his total transaction quantities over
the total market size:
Sharei = J=/� such that ∑ RS8 = 1 (7)
In the second step, the Herfindahl index is calculated by taking into account the number of
traders and variance between their shares:
H = '̂ + NV (8)
where N is the number of traders in the market and V is the statistical variance of traders’
shares defined as:
V = ∑ (RS6' a⁄ ).bScd ^ (9)
If all traders have equal shares, then e is zero and [ equals 1/�. If the number of firms in the
market is held constant, a higher share dispersion will result in a higher index value. As such
computed, the value of the Herfindahl ranges from 1/� to 1 where a very low index implies
competition while an index close to 1 implies high concentration ( refer to equation (6)).
A normalised Herfindahl index is computed so that it ranges between 0 and 1:
86
[∗ = g6'/a'6'/a (10)
When [ = 1, [∗ = 1, which is the case of pure monopsony. If traders have equal shares,
[ = 1/� and [∗ = 0 (there is no dispersion meaning that e = 0), which is the case of
perfect competition.
There are other measures of market power at the market level including the four-firm
concentration ratio5. Unlike this concentration ratio, the Herfindahl index reflects both the
distribution of the market shares of the top four firms and the composition of the market
outside the top four firms. It also gives proportionately greater weight to the market shares of
the larger firms, in accordance with their relative importance in competitive interactions
(Kelly, 1981).
(2) Computing margins
Two types of unit margins are computed as follows:
Gross margin = �% − �9 (11)
Net margin = Gross margin – �(J) (12)
With:
- Selling price (�%): the price at which the trader (a primary trader, transporter or
wholesaler) sells the gum to a ‘superior’ trader (a transporter, wholesaler or exporter
respectively). In the sale market, the trader is considered to be a price-taker, thereby having
no influence on the determination of this price;
- Buying price (�9): the price at which the buyer (primary trader, transporter or wholesaler)
obtains gum either from gum collectors in the case of primary traders and subsequently in the
chain from an ‘inferior’ trader (primary trader or transporter).
Marketing costs (�(J)) include:
5 The Lerner index is another measure of power at the firm level. It measures the extent to which a given firm’s buying prices exceed marginal costs (Rogers and Sexton, 1994).

87
- Transport cost: is a combination of distance and transport mode. Primary traders often use
horse or donkey carts in travelling to villages or hire public transport in travelling to town
market. Transporters or wholesalers who travel to rural markets use trucks. The transport
function reflects a fixed cost that varies only with distance and a proportional cost that varies
with the quantity to transport (refer to chapter 4);
- Storage cost: while building up the volumes, hoarding stocks in order to get a good price or
waiting for a buyer, traders will incur a storage cost. This the actual or imputed cost for hiring
a room in which to store gum for the duration of gum harvesting season;
- Cleaning and sorting cost: in order to improve its value, traders may clean gum by
removing impurities and mixtures, and grade gum based on visible qualities of gum including
the size of nodules and their colour;
- Hired labour cost: depends on the average daily wages, the number of days that a trader
hires labourers and the number of labourers hired in the season;
- Other costs: mainly communication and road fees as given by traders.
Data
A survey of traders involved in gum arabic marketing was conducted in Senegal in the two
major gum producing areas namely the Sylvopastoral Zone and Eastern regions between
February and May 2009. The sample of traders was designed to be representative of all the
traders involved in the gum arabic supply chain in these two regions of study where gum
arabic is actually produced and marketed. Traders interviewed in each region comprised of
primary traders (village and mobile traders), transporters and wholesalers. These traders were
interviewed using a questionnaire which pertained to individual characteristics of the traders,
market characteristics, and marketing elements. Additional informal interviews were held
with exporters and processors.
88
In total, a random sample of 124 traders were formally interviewed; 90 in SPZ and 34
in ES. The distribution of traders reflects the interest in gum production and trade in SPZ. In
the past, traders limited their procurement activities to SPZ with the aim of minimising
transport costs thereby maximizing their profits; production and trade in the more remote ES
was low (AGC, 2007).
Secondary data sources were also used. These include the Atlas published by the
Ministry of Environment (CSE, 2006) on the markets statistics in SPZ and the EXPERNA
report on production statistics in ES (EXPERNA, 2008).
(1) Explaining individual shares of traders in a market
The determinants of the market share of a trader are analysed. We distinguish trader and
market characteristics. Human capital, social capital, and wealth are variables that have been
recurrent in the study of various aspects of trading (e.g., Fafchamps and Minten, 1998, 2001);
however, market factors were not previously given attention.
(a) Variables associated with trader characteristics are:
- Education: this is a dummy that takes a value of 1 if the trader has received some form of
education whether in the Coranic or formal schools or 0 otherwise. The educated traders
might have knowledge in running their business and thereby earn high margins;
- Trader’s experience: this is the number of years that the trader has spent in the gum
business. The more experienced traders can take advantage of their knowledge and business
skills to have high shares in the market;
- Wealth: this wealth substitutes the accessibility to capital because formal institutions that
would supply credit are quasi-inexistent in the rural areas. Two variables proxy the trader’s
wealth: (1) the value of livestock owned by the trader and (2) the number of houses that the
trader possesses. These proxies are exogenous to market share because they are based on
89
historical decisions and not causally related to the trade of gum. The higher the wealth, the
higher the possibility to have funds and therefore the higher would be the market share;
- Number of family relatives involved in gum business: this number indicates the range of
trader’s network. Such network facilitates the access to information regarding the supply and
demand markets;
- Number of language spoken: this indicates the ease of communication which facilitates
transactions especially in a multilingual society like in Senegal. The more languages spoken
by a particular trader, the higher would be his market share;
- Possession of a telephone: this is a dummy variable that takes the value of 1 if a trader
possesses a (mobile) telephone or 0 otherwise. The possession of a telephone facilitates
communication in terms of accessing information on markets, prices and transactions. Hence
if a trader has a telephone, he might have a higher share of the market than a trader who does
not have the telephone; and,
- Area of operation: rural markets in Senegal held on different days in the week, hence the
area of operation is represented by the number of markets (and villages) in which traders
could have their supplies. The area of operation is exogenous to market share; a large market
share does not mean that a trader operates in several market. Instead, the larger is the area, the
larger may be the quantity of trader’s transactions.
(b) Variables associated with market characteristics are:
- Market size: this is the total of the quantities transacted in that market. This size is
expected to have a positive effect on the market share;
- Number of buyers: this is the number of all traders who operate in a particular market. This
number is expected to have a decreasing effect on the market share as it implies competition
over the transactions;
90
- Distance of the market or village from the nearest town: this is the distance in kilometres
from the town to the market or village. The longer the distance, the lower would be the
buying price;
- Distance from Dakar: this is the distance in kilometres from Dakar to the buying place.
The longer the distance, the lower would be the buying price because of the higher costs for a
buyer to transport to Dakar;
- The existence of storage in the market: this is a dummy variable that takes a value of 1 if
storage is available in the market or 0 otherwise. This variable indicates that in the market
where storage is provided, traders might take advantage of storage in terms of building-up
volumes or waiting for buyers thereby increasing their market share.
Due to the presence of explanatory variables at two levels namely the low level of
traders and the high level of market, the generalized linear latent and mixed models (gllamm)
procedure is used instead of a standard regression. This gllamm procedure takes into account
the hierarchical structure of the data by explicitly allowing a random effect of the higher level
at the market and thereby correcting for the independence of observation. This is because
traders of a certain category who are drawn from a market would be more homogeneous than
if traders were randomly sampled from a larger population (see Rabe-Hesketh et al. (2004) for
details on gllamm).
(2) Explaining marketing margins
We test the correlation between marketing margins and market power and investigate
determinants of these margins. Following our theoretical model and studies by Wohlgenant
(2001) and Fafchamps, et al. (2003), the following determinants of marketing margins are
included:
- Marketing costs (�(J)) include all the costs spent by trader in selling gum. As mentioned
above, these include the transport, storage, cleaning and sorting, labour, and other costs.
91
These costs were computed per kg of gum arabic sold. The costs have a decreasing marginal
effect on the margins and hence are expressed as a quadratic form.
- Distance to sell: this is the physical distance in kilometres from the trader’s business (base)
to the selling market. Margins are expected to increase with distance.
- Price uncertainty: this was calculated as the deviation of the price received by the trader
from the mean sale price in each market in the previous season. The higher this deviation and
hence the uncertainty, the higher would be the margin retained by the trader.
- Risk: traders in gum arabic face a number of risks that can be idiosyncratic risk or systemic
market risk. Idiosyncratic risk affects an individual trader and includes for instance the failure
to obtain gum as contractual payment, finding a buyer, or delays; systemic market risk affects
almost all traders in the market in a similar way and includes for instance production failure,
competition over supplies, or unpredictable price variations. The individual and market risk
are each indicated by a dummy that takes a value of 1 if a trader has indicated in the
interviews concern for any component of this risk or 0 otherwise6.
Due to the heteroskedasticity of the total costs variable with respect to marketing
margins, the weighted least square estimation is used instead of standard regression. Greene
(2008) defines the weighted least square estimator as:
Dh = ∑ �=i=j=+=k' ∑ �=i=i�=+=k'l (13)
Where the weight �= = 1 m=(n . Here, observations with smaller variances receive a larger
weight in the computations of the sums and therefore have greater influence in the estimates
obtained. Analytical weights were used by estimating a regression based on 1 m=(n because the
variance is not constant.
6 Due to the difficulty of quantifying risk, we relied on an indication of perception of risk related to the gum trading.

92
Having explained the variables included in the study, we now present the results of
our empirical analysis.
4.4 Results
There are differences in characteristics of market transactions, market power and the exercise
of this power towards achieving performance between primary traders, transporters and
wholesalers. In this section we first present an overview of characteristics of gum arabic
market in terms of traders’ transactions and test the concentration of market power. This leads
us to analysing determinants of such market power and discussing their potential effect.
Characteristics of the groups of traders
In terms of transactions, an overview of quantities, prices, costs and margins associated with
buying and selling gum shows differences between zones and categories of traders (Table
4.2). Because the gum production in the two zones (SPZ and ES) is different, they are
reported separately.
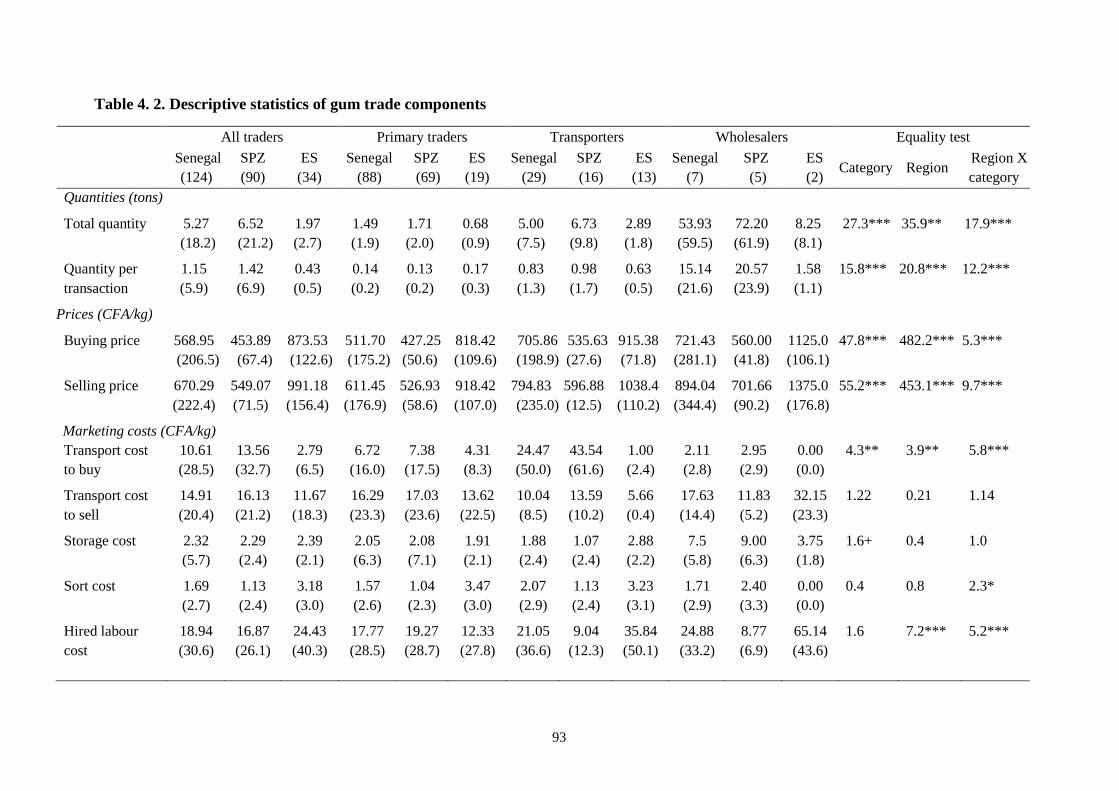
93
Table 4. 2. Descriptive statistics of gum trade components
All traders Primary traders Transporters Wholesalers Equality test
Senegal (124)
SPZ (90)
ES (34)
Senegal (88)
SPZ (69)
ES (19)
Senegal (29)
SPZ (16)
ES (13)
Senegal (7)
SPZ (5)
ES (2)
Category Region Region X category
Quantities (tons)
Total quantity 5.27 (18.2)
6.52 (21.2)
1.97 (2.7)
1.49 (1.9)
1.71 (2.0)
0.68 (0.9)
5.00 (7.5)
6.73 (9.8)
2.89 (1.8)
53.93 (59.5)
72.20 (61.9)
8.25 (8.1)
27.3*** 35.9** 17.9***
Quantity per transaction
1.15 (5.9)
1.42 (6.9)
0.43 (0.5)
0.14 (0.2)
0.13 (0.2)
0.17 (0.3)
0.83 (1.3)
0.98 (1.7)
0.63 (0.5)
15.14 (21.6)
20.57 (23.9)
1.58 (1.1)
15.8*** 20.8*** 12.2***
Prices (CFA/kg)
Buying price 568.95 (206.5)
453.89 (67.4)
873.53 (122.6)
511.70 (175.2)
427.25 (50.6)
818.42 (109.6)
705.86 (198.9)
535.63 (27.6)
915.38 (71.8)
721.43 (281.1)
560.00 (41.8)
1125.0 (106.1)
47.8*** 482.2*** 5.3***
Selling price 670.29 (222.4)
549.07 (71.5)
991.18 (156.4)
611.45 (176.9)
526.93 (58.6)
918.42 (107.0)
794.83 (235.0)
596.88 (12.5)
1038.4 (110.2)
894.04 (344.4)
701.66 (90.2)
1375.0 (176.8)
55.2*** 453.1*** 9.7***
Marketing costs (CFA/kg) Transport cost to buy
10.61 (28.5)
13.56 (32.7)
2.79 (6.5)
6.72 (16.0)
7.38 (17.5)
4.31 (8.3)
24.47 (50.0)
43.54 (61.6)
1.00 (2.4)
2.11 (2.8)
2.95 (2.9)
0.00 (0.0)
4.3** 3.9** 5.8***
Transport cost to sell
14.91 (20.4)
16.13 (21.2)
11.67 (18.3)
16.29 (23.3)
17.03 (23.6)
13.62 (22.5)
10.04 (8.5)
13.59 (10.2)
5.66 (0.4)
17.63 (14.4)
11.83 (5.2)
32.15 (23.3)
1.22 0.21 1.14
Storage cost
2.32 (5.7)
2.29 (2.4)
2.39 (2.1)
2.05 (6.3)
2.08 (7.1)
1.91 (2.1)
1.88 (2.4)
1.07 (2.4)
2.88 (2.2)
7.5 (5.8)
9.00 (6.3)
3.75 (1.8)
1.6+ 0.4 1.0
Sort cost
1.69 (2.7)
1.13 (2.4)
3.18 (3.0)
1.57 (2.6)
1.04 (2.3)
3.47 (3.0)
2.07 (2.9)
1.13 (2.4)
3.23 (3.1)
1.71 (2.9)
2.40 (3.3)
0.00 (0.0)
0.4 0.8 2.3*
Hired labour cost
18.94 (30.6)
16.87 (26.1)
24.43 (40.3)
17.77 (28.5)
19.27 (28.7)
12.33 (27.8)
21.05 (36.6)
9.04 (12.3)
35.84 (50.1)
24.88 (33.2)
8.77 (6.9)
65.14 (43.6)
1.6 7.2*** 5.2***
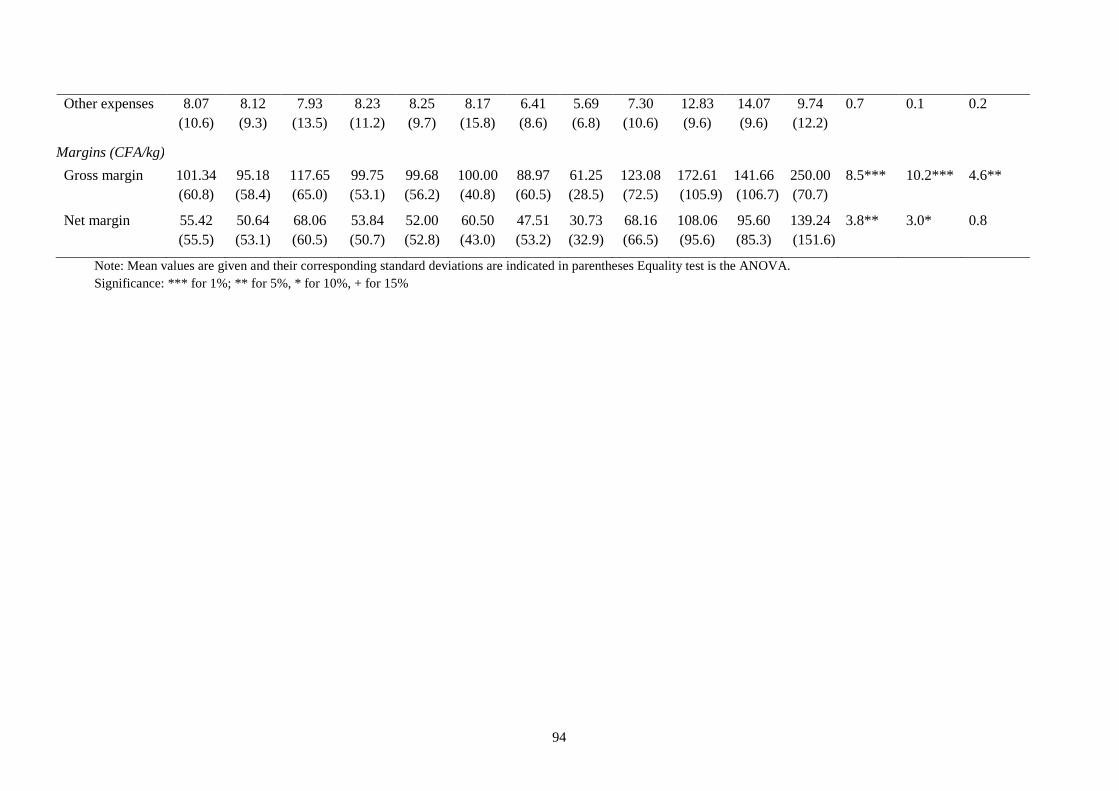
94
Other expenses 8.07 (10.6)
8.12 (9.3)
7.93 (13.5)
8.23 (11.2)
8.25 (9.7)
8.17 (15.8)
6.41 (8.6)
5.69 (6.8)
7.30 (10.6)
12.83 (9.6)
14.07 (9.6)
9.74 (12.2)
0.7 0.1 0.2
Margins (CFA/kg)
Gross margin
101.34 (60.8)
95.18 (58.4)
117.65 (65.0)
99.75 (53.1)
99.68 (56.2)
100.00 (40.8)
88.97 (60.5)
61.25 (28.5)
123.08 (72.5)
172.61 (105.9)
141.66 (106.7)
250.00 (70.7)
8.5*** 10.2*** 4.6**
Net margin
55.42 (55.5)
50.64 (53.1)
68.06 (60.5)
53.84 (50.7)
52.00 (52.8)
60.50 (43.0)
47.51 (53.2)
30.73 (32.9)
68.16 (66.5)
108.06 (95.6)
95.60 (85.3)
139.24 (151.6)
3.8** 3.0* 0.8
Note: Mean values are given and their corresponding standard deviations are indicated in parentheses Equality test is the ANOVA. Significance: *** for 1%; ** for 5%, * for 10%, + for 15%
95
The different categories of traders are significantly different in characteristics of their
transactions including quantities, prices and costs. Traders of gum arabic in the Sylvopastoral
zone (SPZ) are significantly different from traders in Eastern Senegal (ES) in quantities (the
total quantity and the average quantity per each transaction are higher in SPZ than in ES);
buying and selling prices (gum traders in SPZ buy and in turn sell gum at lower prices than
traders in ES; and price variations un ES are larger compared to SPZ which could also be due
to the fewer number of traders interviewed in ES); unit transport cost to buying within regions
(traders in SPZ have a higher cost of transportation per unit to the buying villages and
markets than traders in ES); labour cost per unit (traders in SPZ have a lower labour cost per
unit than traders in ES); and margins (traders in SPZ have lower gross and net margins than
traders in ES).
The above differences across the zones can be explained by the differences in the
magnitude of gum collection activities and the nature of gum businesses. Collection of gum
has been done in the Sylvopastoral zone for several centuries (Webb, 1985). This zone is
easily accessible from Dakar, its main town Linguère is about 260 kilometres from Dakar
with a well-built off-season road infrastructure. The cities situated along the road from
Linguère to Dakar are also important transaction points for gum trade such as Dahra and
Touba where most wholesalers and some exporters are found.
Collection of gum is a recent activity in Eastern Senegal, undertaken following the
raised awareness that the region has enormous potential in terms of the presence and
productivity of Acacia senegal trees (DEFCCS, 2005). However, collection is still done at a
very small scale and small quantities are obtained by harvesters. Furthermore, the region is
landlocked, situated at about 600 kilometres from Dakar and without proper road
infrastructure7. Apart from EXPERNA (an association of gum collectors), the other large
7 The road stretching from the city of Kaolack to Tambacounda (280 kilometres) was only constructed in 2008-2009.
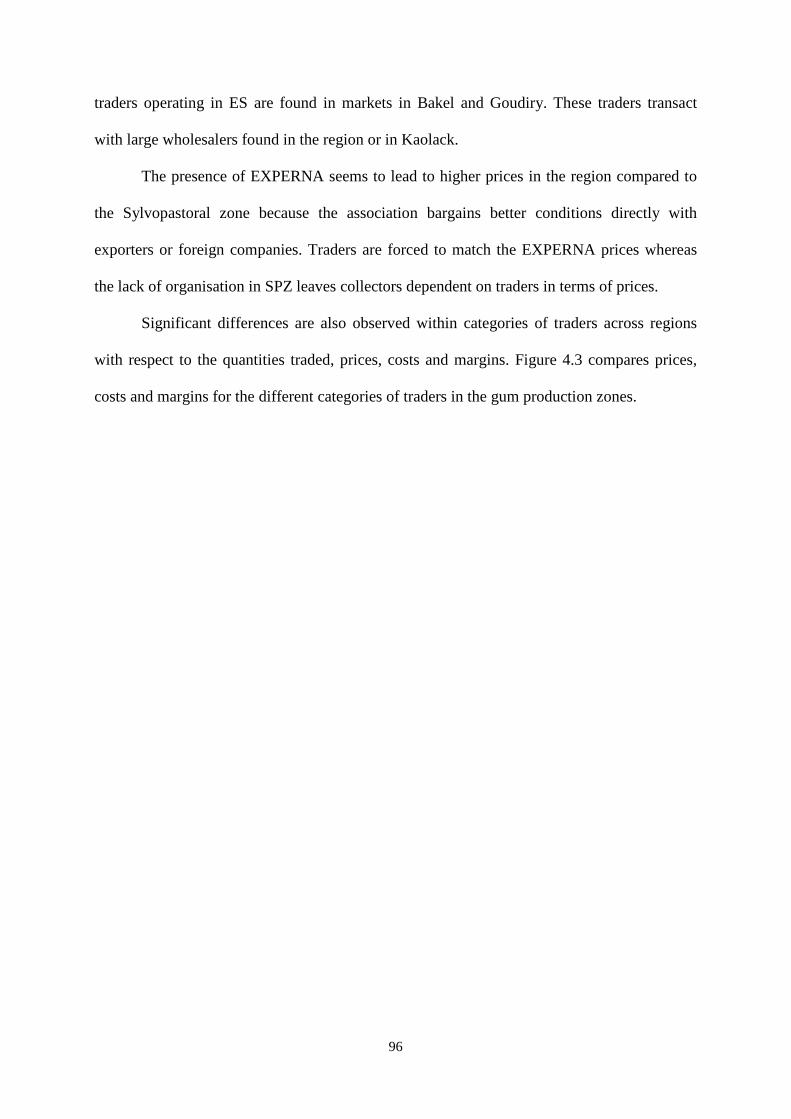
96
traders operating in ES are found in markets in Bakel and Goudiry. These traders transact
with large wholesalers found in the region or in Kaolack.
The presence of EXPERNA seems to lead to higher prices in the region compared to
the Sylvopastoral zone because the association bargains better conditions directly with
exporters or foreign companies. Traders are forced to match the EXPERNA prices whereas
the lack of organisation in SPZ leaves collectors dependent on traders in terms of prices.
Significant differences are also observed within categories of traders across regions
with respect to the quantities traded, prices, costs and margins. Figure 4.3 compares prices,
costs and margins for the different categories of traders in the gum production zones.
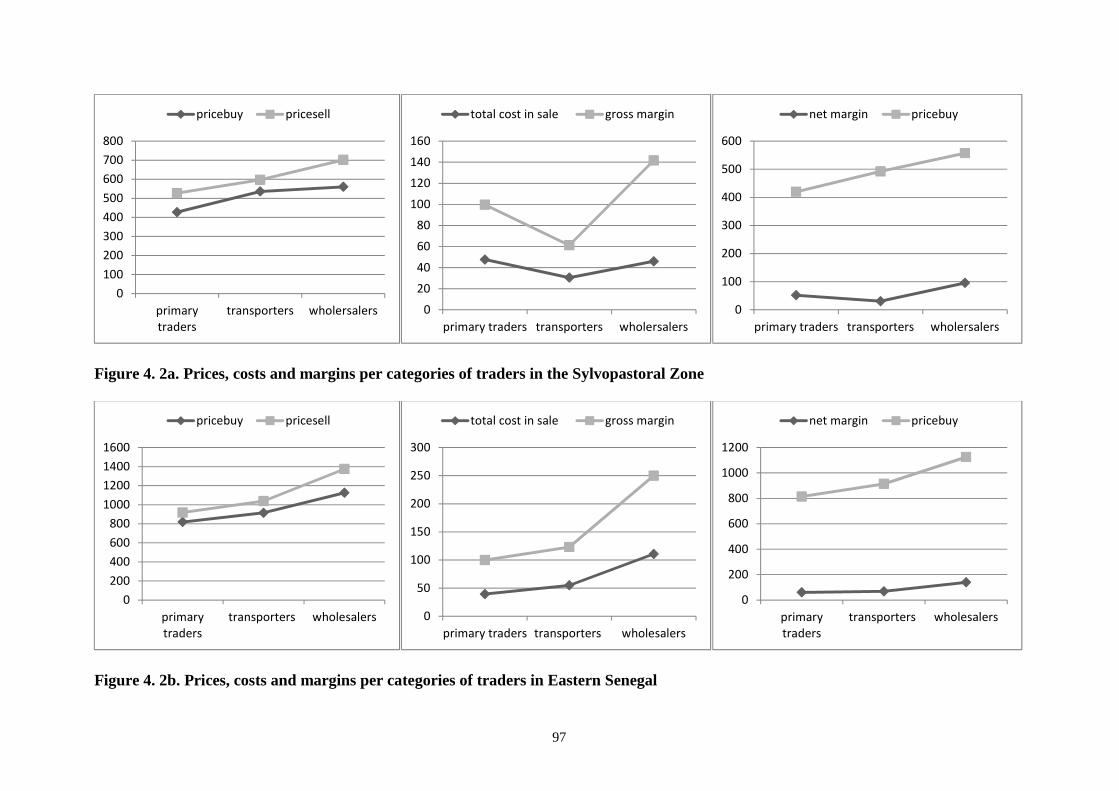
97
Figure 4. 2a. Prices, costs and margins per categories of traders in the Sylvopastoral Zone
Figure 4. 2b. Prices, costs and margins per categories of traders in Eastern Senegal
0
100
200
300
400
500
600
700
800
primary
traders
transporters wholersalers
pricebuy pricesell
0
20
40
60
80
100
120
140
160
primary traders transporters wholersalers
total cost in sale gross margin
0
100
200
300
400
500
600
primary traders transporters wholersalers
net margin pricebuy
0
200
400
600
800
1000
1200
1400
1600
primary
traders
transporters wholesalers
pricebuy pricesell
0
50
100
150
200
250
300
primary traders transporters wholesalers
total cost in sale gross margin
0
200
400
600
800
1000
1200
primary
traders
transporters wholesalers
net margin pricebuy
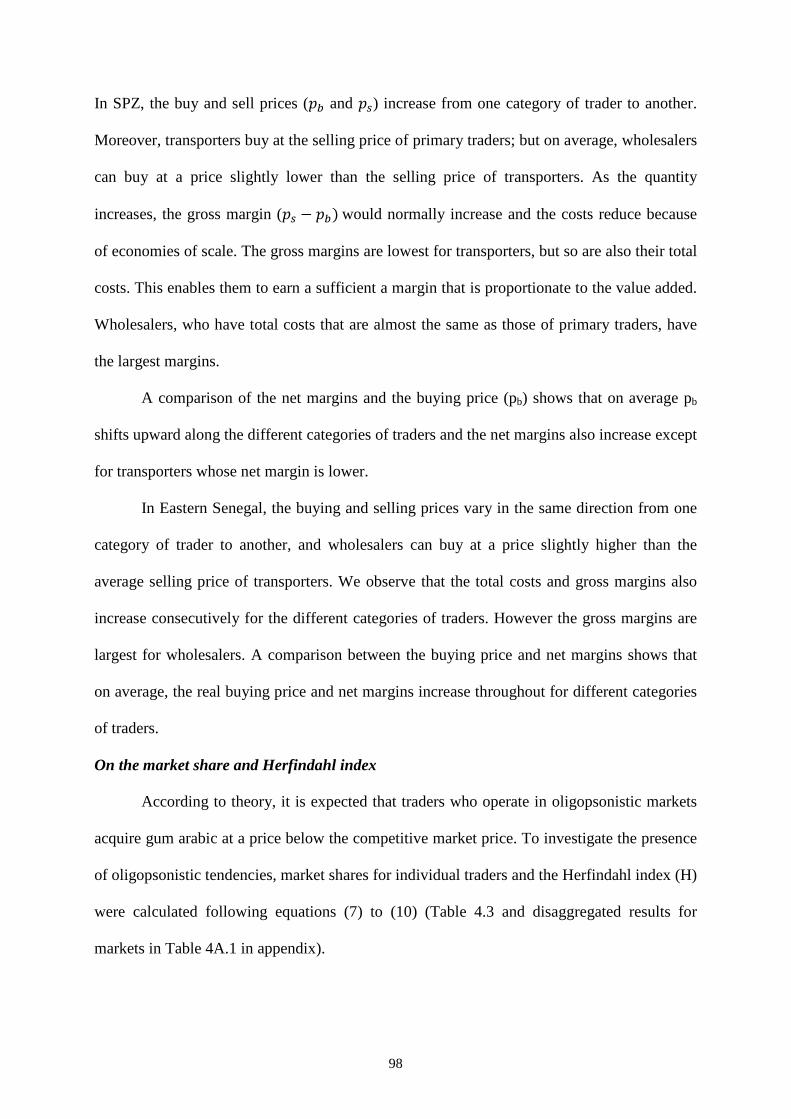
98
In SPZ, the buy and sell prices (�9 and �%) increase from one category of trader to another.
Moreover, transporters buy at the selling price of primary traders; but on average, wholesalers
can buy at a price slightly lower than the selling price of transporters. As the quantity
increases, the gross margin (�% − �9)would normally increase and the costs reduce because
of economies of scale. The gross margins are lowest for transporters, but so are also their total
costs. This enables them to earn a sufficient a margin that is proportionate to the value added.
Wholesalers, who have total costs that are almost the same as those of primary traders, have
the largest margins.
A comparison of the net margins and the buying price (pb) shows that on average pb
shifts upward along the different categories of traders and the net margins also increase except
for transporters whose net margin is lower.
In Eastern Senegal, the buying and selling prices vary in the same direction from one
category of trader to another, and wholesalers can buy at a price slightly higher than the
average selling price of transporters. We observe that the total costs and gross margins also
increase consecutively for the different categories of traders. However the gross margins are
largest for wholesalers. A comparison between the buying price and net margins shows that
on average, the real buying price and net margins increase throughout for different categories
of traders.
On the market share and Herfindahl index
According to theory, it is expected that traders who operate in oligopsonistic markets
acquire gum arabic at a price below the competitive market price. To investigate the presence
of oligopsonistic tendencies, market shares for individual traders and the Herfindahl index (H)
were calculated following equations (7) to (10) (Table 4.3 and disaggregated results for
markets in Table 4A.1 in appendix).
99
Table 4. 3. Average individual shares and normalised Herfindahl indices in gum marketsa
Number of markets
Number of traders
Mean individual share (percentage)
Normalised Herfindahl index
All traders
All markets 30 124 14.3(12.05) 0.130 (0.12)
Primary traders 21 88 13.2 (11.31) 0.127 (0.14)
Transporters 7 29 16.4 (12.18) 0.135 (0.09)
Wholesalers 2 7 25.0 (19.37) 0.148 (0.00)
Sylvopastoral Zone
All markets 21 90 13.3 (11.02) 0.132 (0.14)
Primary traders 15 69 12.0 (9.88) 0.129 (0.15)
Transporters 5 16 18.1 (13.35) 0.139 (0.11)
Wholesalers 1 5 20.1 (17.20) 0.148
Eastern Senegal
All markets 9 34 17.3 (14.42) 0.125 (0.08)
Primary traders 6 19 17.6 (14.83) 0.121 (0.10)
Transporters 2 13 13.3 (9.39) 0.125 (0.03)
Wholesalers 1 2 33.3 (23.57) 0.148 a Mean values are given and their corresponding standard deviations are indicated in parentheses.
The shares of individual traders and Herfindahl index of market power vary between markets;
while some markets display competitive tendencies, other markets display (strong)
oligopsonistic features.
A comparison between the Sylvopastoral zone and Eastern Senegal shows that the
average market share of traders in the SPZ is lower than that of traders in ES. Furthermore,
the average individual shares of traders are lower in SPZ than in ES except for transporters.
The average Herfindahl index of markets in the SPZ is higher than that of markets in ES
because this normalised index adjusts for the number of traders which is smaller in ES than in
SPZ. Furthermore, the average Herfindahl indices in primary traders’ and transporters’
markets are higher in SPZ than in ES, while the average Herfindahl index of wholesalers is
the same in both regions. As on average the indices are low, we observe the presence of
competition or at the most, moderate concentration. In both regions, the Herfindahl index

100
increases as trading of gum moves along the supply chain: it is lowest in primary markets and
highest in wholesale market. This situation is realistic because the move along the chain is
associated with fewer and fewer buyers, with relatively ‘stronger’ (oligopsony) power.
In sum, the computations of market power revealed that on average there are no or at
the most low oligopsonist tendencies. Yet, it remains important to investigate factors that
might influence this market power through the distribution of individual shares of traders.
Individual shares of trader in a market
Market shares express the relative size of the trader’s transactions; these shares vary in
accordance to several factors including the market size and the number of buyers. However,
the question arises as to why there are wide differences in the computed shares, implying that
besides the market size and the number of buyers there are other factors at play. These factors
are grouped into trader characteristics and market characteristics (Tables 4.4 and 4.5).
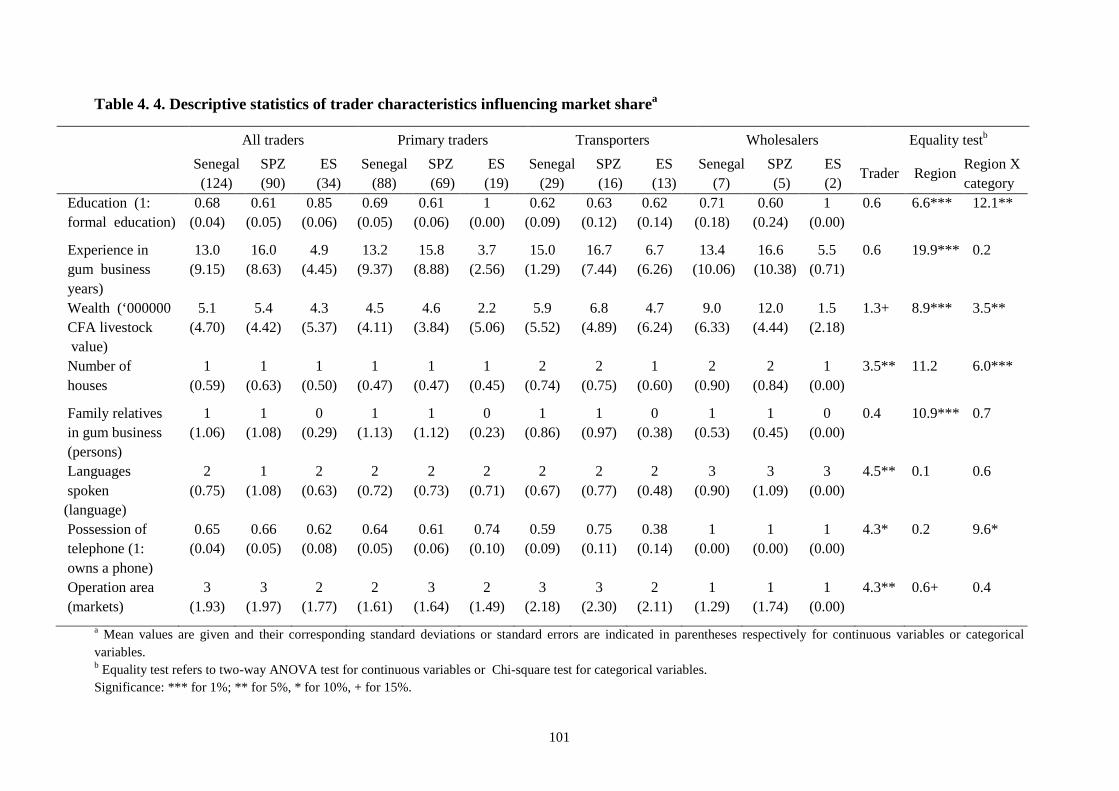
101
Table 4. 4. Descriptive statistics of trader characteristics influencing market sharea
All traders Primary traders Transporters Wholesalers Equality testb
Senegal (124)
SPZ (90)
ES (34)
Senegal (88)
SPZ (69)
ES (19)
Senegal (29)
SPZ (16)
ES (13)
Senegal (7)
SPZ (5)
ES (2)
Trader Region Region X category
Education (1: formal education)
0.68 (0.04)
0.61 (0.05)
0.85 (0.06)
0.69 (0.05)
0.61 (0.06)
1 (0.00)
0.62 (0.09)
0.63 (0.12)
0.62 (0.14)
0.71 (0.18)
0.60 (0.24)
1 (0.00)
0.6 6.6*** 12.1**
Experience in gum business years)
13.0 (9.15)
16.0 (8.63)
4.9 (4.45)
13.2 (9.37)
15.8 (8.88)
3.7 (2.56)
15.0 (1.29)
16.7 (7.44)
6.7 (6.26)
13.4 (10.06)
16.6 (10.38)
5.5 (0.71)
0.6 19.9*** 0.2
Wealth (‘000000 CFA livestock value)
5.1 (4.70)
5.4 (4.42)
4.3 (5.37)
4.5 (4.11)
4.6 (3.84)
2.2 (5.06)
5.9 (5.52)
6.8 (4.89)
4.7 (6.24)
9.0 (6.33)
12.0 (4.44)
1.5 (2.18)
1.3+ 8.9*** 3.5**
Number of houses
1 (0.59)
1 (0.63)
1 (0.50)
1 (0.47)
1 (0.47)
1 (0.45)
2 (0.74)
2 (0.75)
1 (0.60)
2 (0.90)
2 (0.84)
1 (0.00)
3.5** 11.2 6.0***
Family relatives in gum business (persons)
1 (1.06)
1 (1.08)
0 (0.29)
1 (1.13)
1 (1.12)
0 (0.23)
1 (0.86)
1 (0.97)
0 (0.38)
1 (0.53)
1 (0.45)
0 (0.00)
0.4 10.9*** 0.7
Languages spoken (language)
2 (0.75)
1 (1.08)
2 (0.63)
2 (0.72)
2 (0.73)
2 (0.71)
2 (0.67)
2 (0.77)
2 (0.48)
3 (0.90)
3 (1.09)
3 (0.00)
4.5** 0.1 0.6
Possession of telephone (1: owns a phone)
0.65 (0.04)
0.66 (0.05)
0.62 (0.08)
0.64 (0.05)
0.61 (0.06)
0.74 (0.10)
0.59 (0.09)
0.75 (0.11)
0.38 (0.14)
1 (0.00)
1 (0.00)
1 (0.00)
4.3* 0.2 9.6*
Operation area (markets)
3 (1.93)
3 (1.97)
2 (1.77)
2 (1.61)
3 (1.64)
2 (1.49)
3 (2.18)
3 (2.30)
2 (2.11)
1 (1.29)
1 (1.74)
1 (0.00)
4.3** 0.6+ 0.4
a Mean values are given and their corresponding standard deviations or standard errors are indicated in parentheses respectively for continuous variables or categorical variables. b Equality test refers to two-way ANOVA test for continuous variables or Chi-square test for categorical variables. Significance: *** for 1%; ** for 5%, * for 10%, + for 15%.
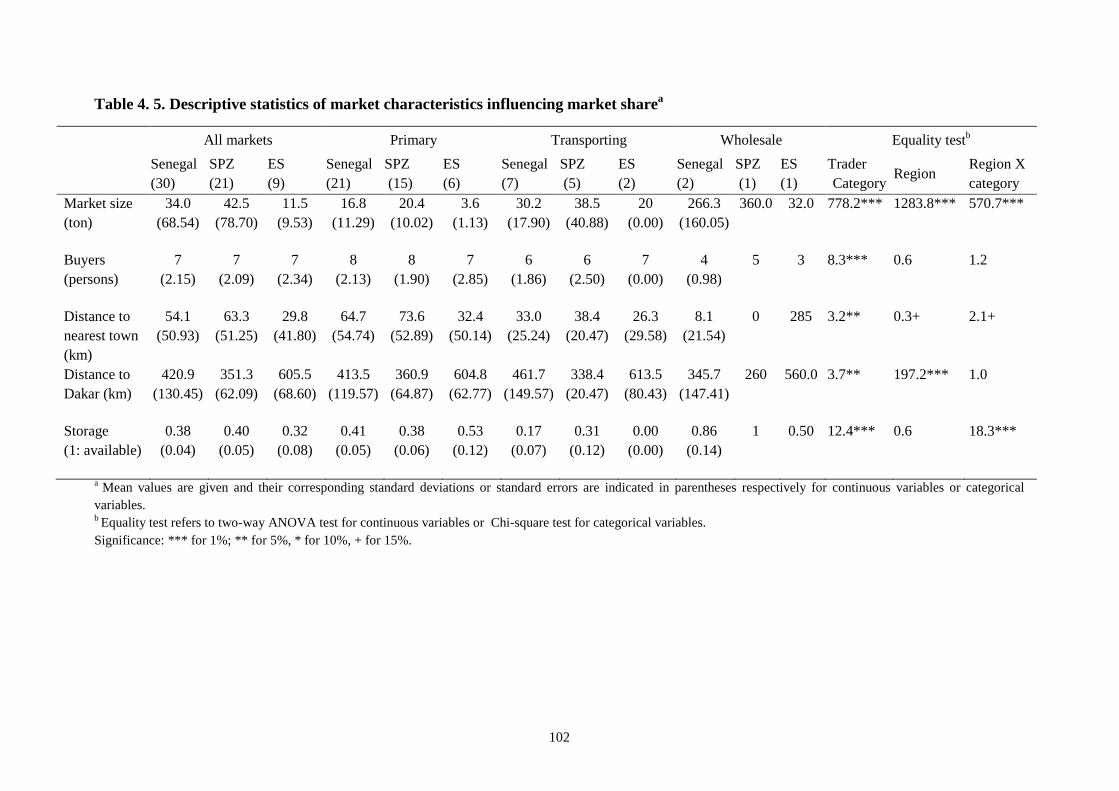
102
Table 4. 5. Descriptive statistics of market characteristics influencing market sharea
All markets Primary Transporting Wholesale Equality testb
Senegal (30)
SPZ (21)
ES (9)
Senegal (21)
SPZ (15)
ES (6)
Senegal (7)
SPZ (5)
ES (2)
Senegal (2)
SPZ (1)
ES (1)
Trader Category
Region Region X category
Market size (ton)
34.0 (68.54)
42.5 (78.70)
11.5 (9.53)
16.8 (11.29)
20.4 (10.02)
3.6 (1.13)
30.2 (17.90)
38.5 (40.88)
20 (0.00)
266.3 (160.05)
360.0
32.0
778.2*** 1283.8*** 570.7***
Buyers (persons)
7 (2.15)
7 (2.09)
7 (2.34)
8 (2.13)
8 (1.90)
7 (2.85)
6 (1.86)
6 (2.50)
7 (0.00)
4 (0.98)
5
3
8.3*** 0.6 1.2
Distance to nearest town (km)
54.1 (50.93)
63.3 (51.25)
29.8 (41.80)
64.7 (54.74)
73.6 (52.89)
32.4 (50.14)
33.0 (25.24)
38.4 (20.47)
26.3 (29.58)
8.1 (21.54)
0
285
3.2** 0.3+ 2.1+
Distance to Dakar (km)
420.9 (130.45)
351.3 (62.09)
605.5 (68.60)
413.5 (119.57)
360.9 (64.87)
604.8 (62.77)
461.7 (149.57)
338.4 (20.47)
613.5 (80.43)
345.7 (147.41)
260
560.0
3.7** 197.2*** 1.0
Storage (1: available)
0.38 (0.04)
0.40 (0.05)
0.32 (0.08)
0.41 (0.05)
0.38 (0.06)
0.53 (0.12)
0.17 (0.07)
0.31 (0.12)
0.00 (0.00)
0.86 (0.14)
1
0.50
12.4*** 0.6 18.3***
a Mean values are given and their corresponding standard deviations or standard errors are indicated in parentheses respectively for continuous variables or categorical variables. b Equality test refers to two-way ANOVA test for continuous variables or Chi-square test for categorical variables. Significance: *** for 1%; ** for 5%, * for 10%, + for 15%.
103
On average the proportion of traders who are educated is smaller in SPZ than in ES; not
surprisingly traders in SPZ have longer experience in gum business than traders in ES; in
terms of livestock values, traders in SPZ are wealthier than traders in ES; traders in SPZ have
more relatives involved in gum business than traders in ES; and the area of operation of
traders in the SPZ is larger than in ES.
There are also significant differences in characteristics of traders across different
market type. For instance, in terms of livestock ownership value, primary traders are less
wealthy especially compared to wholesalers. Primary traders have less relatives involved in
the business; wholesalers speak on average 2 languages; the proportion of traders who own a
telephone is smallest for transporters; and primary traders operate in most markets.
Nevertheless, there are significant differences within categories of traders across regions with
respect to education, wealth, house ownership and possession of telephone.
Furthermore, there are significant differences in market characteristics across the
zones. Markets in the SPZ are larger as the average quantity transacted is higher than in ES;
markets in the SPZ are nearer to Dakar than in ES; and markets in the SPZ are further from
towns than in ES. There are also significant differences across market categories. For
instance, primary markets are smallest and wholesale markets are largest in size; buyers are
most numerous in primary markets and least numerous in wholesale markets; primary
markets are located furthest from the town and wholesale markets are located nearest to town;
and transporters buy in markets that are located furthest from Dakar. Furthermore, the lowest
proportion of transporting markets have adequate storage. Market categories across regions
differ with respect to market size, distance to nearest town and availability of adequate
storage.
The influence of trader and market characteristics on the trader’s individual share in
the market are shown in table 4.6.
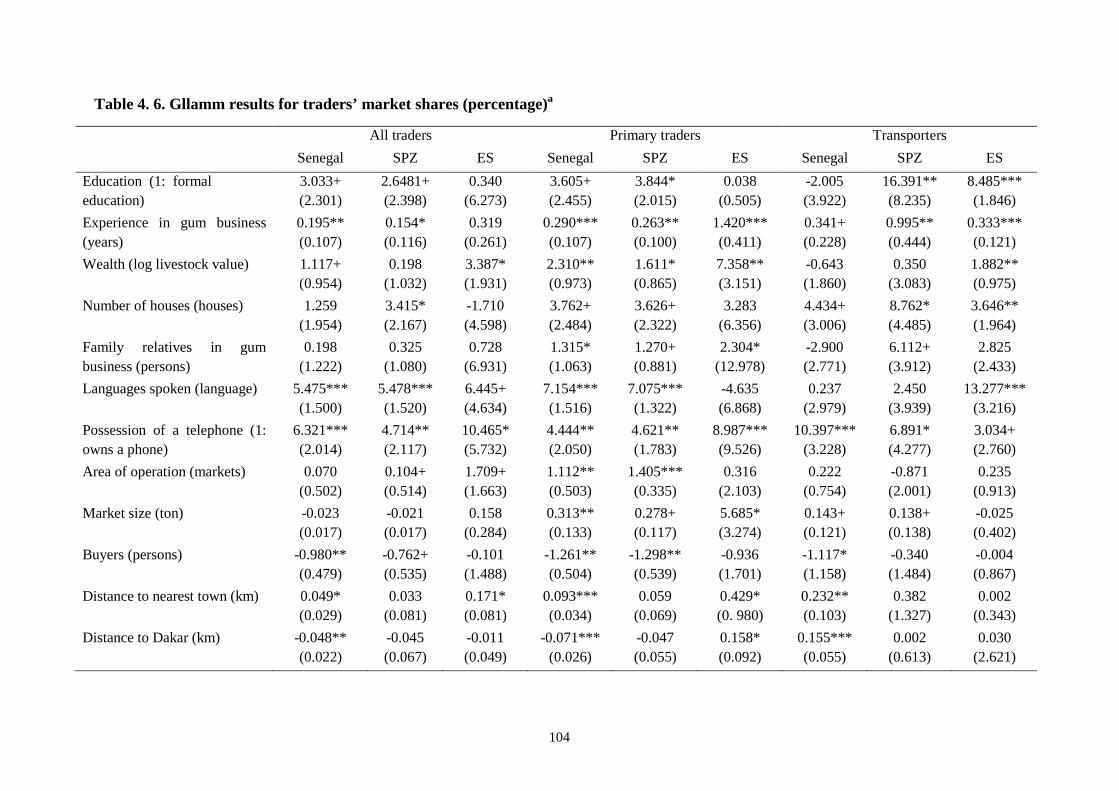
104
Table 4. 6. Gllamm results for traders’ market shares (percentage)a
All traders Primary traders Transporters
Senegal SPZ ES Senegal SPZ ES Senegal SPZ ES
Education (1: formal education)
3.033+ (2.301)
2.6481+ (2.398)
0.340 (6.273)
3.605+ (2.455)
3.844* (2.015)
0.038 (0.505)
-2.005 (3.922)
16.391** (8.235)
8.485*** (1.846)
Experience in gum business (years)
0.195** (0.107)
0.154* (0.116)
0.319 (0.261)
0.290*** (0.107)
0.263** (0.100)
1.420*** (0.411)
0.341+ (0.228)
0.995** (0.444)
0.333*** (0.121)
Wealth (log livestock value) 1.117+ (0.954)
0.198 (1.032)
3.387* (1.931)
2.310** (0.973)
1.611* (0.865)
7.358** (3.151)
-0.643 (1.860)
0.350 (3.083)
1.882** (0.975)
Number of houses (houses) 1.259 (1.954)
3.415* (2.167)
-1.710 (4.598)
3.762+ (2.484)
3.626+ (2.322)
3.283 (6.356)
4.434+ (3.006)
8.762* (4.485)
3.646** (1.964)
Family relatives in gum business (persons)
0.198 (1.222)
0.325 (1.080)
0.728 (6.931)
1.315* (1.063)
1.270+ (0.881)
2.304* (12.978)
-2.900 (2.771)
6.112+ (3.912)
2.825 (2.433)
Languages spoken (language) 5.475*** (1.500)
5.478*** (1.520)
6.445+ (4.634)
7.154*** (1.516)
7.075*** (1.322)
-4.635 (6.868)
0.237 (2.979)
2.450 (3.939)
13.277*** (3.216)
Possession of a telephone (1: owns a phone)
6.321*** (2.014)
4.714** (2.117)
10.465* (5.732)
4.444** (2.050)
4.621** (1.783)
8.987*** (9.526)
10.397*** (3.228)
6.891* (4.277)
3.034+ (2.760)
Area of operation (markets) 0.070 (0.502)
0.104+ (0.514)
1.709+ (1.663)
1.112** (0.503)
1.405*** (0.335)
0.316 (2.103)
0.222 (0.754)
-0.871 (2.001)
0.235 (0.913)
Market size (ton) -0.023 (0.017)
-0.021 (0.017)
0.158 (0.284)
0.313** (0.133)
0.278+ (0.117)
5.685* (3.274)
0.143+ (0.121)
0.138+ (0.138)
-0.025 (0.402)
Buyers (persons) -0.980** (0.479)
-0.762+ (0.535)
-0.101 (1.488)
-1.261** (0.504)
-1.298** (0.539)
-0.936 (1.701)
-1.117* (1.158)
-0.340 (1.484)
-0.004 (0.867)
Distance to nearest town (km) 0.049* (0.029)
0.033 (0.081)
0.171* (0.081)
0.093*** (0.034)
0.059 (0.069)
0.429* (0. 980)
0.232** (0.103)
0.382 (1.327)
0.002 (0.343)
Distance to Dakar (km) -0.048** (0.022)
-0.045 (0.067)
-0.011 (0.049)
-0.071*** (0.026)
-0.047 (0.055)
0.158* (0.092)
0.155*** (0.055)
0.002 (0.613)
0.030 (2.621)
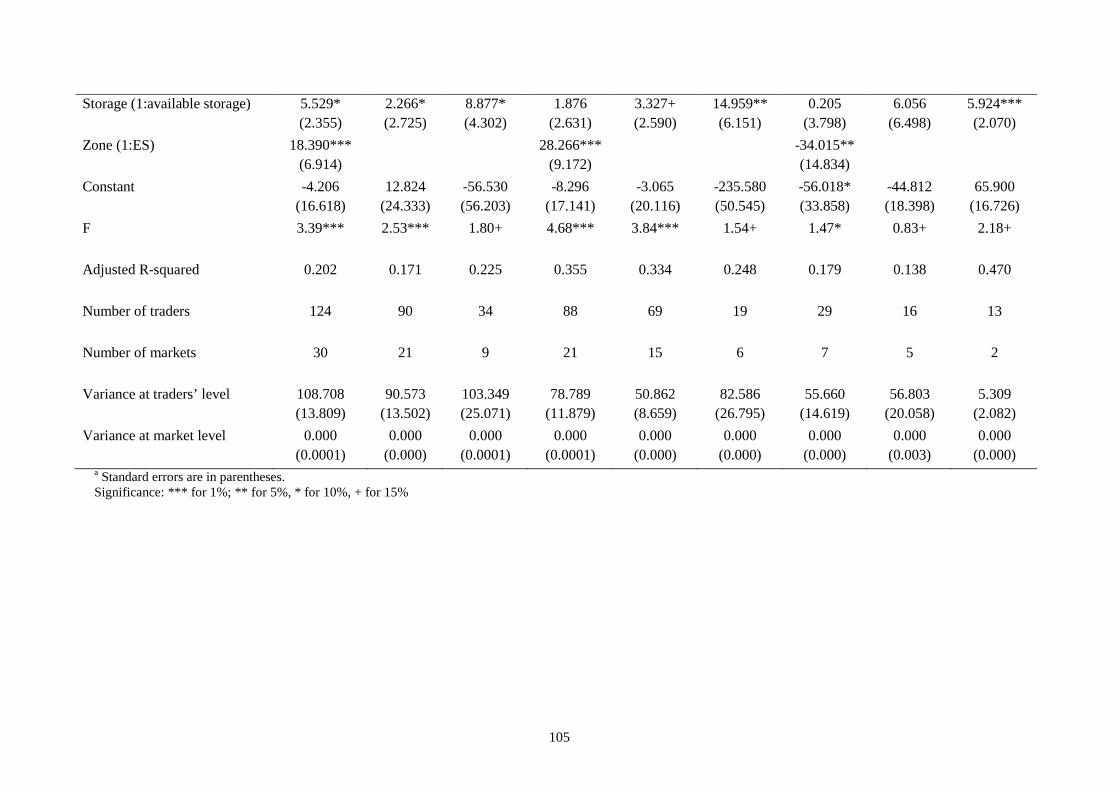
105
Storage (1:available storage) 5.529* (2.355)
2.266* (2.725)
8.877* (4.302)
1.876 (2.631)
3.327+ (2.590)
14.959** (6.151)
0.205 (3.798)
6.056 (6.498)
5.924*** (2.070)
Zone (1:ES) 18.390*** (6.914)
28.266*** (9.172)
-34.015** (14.834)
Constant -4.206 (16.618)
12.824 (24.333)
-56.530 (56.203)
-8.296 (17.141)
-3.065 (20.116)
-235.580 (50.545)
-56.018* (33.858)
-44.812 (18.398)
65.900 (16.726)
F 3.39*** 2.53*** 1.80+ 4.68*** 3.84*** 1.54+ 1.47* 0.83+ 2.18+
Adjusted R-squared 0.202 0.171 0.225 0.355 0.334 0.248 0.179 0.138 0.470
Number of traders 124 90 34 88 69 19 29 16 13
Number of markets 30 21 9 21 15 6 7 5 2
Variance at traders’ level 108.708 (13.809)
90.573 (13.502)
103.349 (25.071)
78.789 (11.879)
50.862 (8.659)
82.586 (26.795)
55.660 (14.619)
56.803 (20.058)
5.309 (2.082)
Variance at market level 0.000 (0.0001)
0.000 (0.000)
0.000 (0.0001)
0.000 (0.0001)
0.000 (0.000)
0.000 (0.000)
0.000 (0.000)
0.000 (0.003)
0.000 (0.000)
a Standard errors are in parentheses. Significance: *** for 1%; ** for 5%, * for 10%, + for 15%
106
The results show a large variance at the traders’ level but a close to zero variance at the
market level. Pooled over all types of traders, the market share of an individual trader is
positively influenced in a significant way by education, experience in gum business, wealth in
livestock value, knowledge of languages and possession of a telephone that is used to gather
market information; these possibly refer to communication and negotiation skills. A large
number of buyers operating in a market has a negative effect on the individual market share.
Traders’ individual market shares evolve with increased physical distance of the market from
the town, and better availability of storage facilities. But the longer the physical distance of
the market from Dakar, the smaller is the trader’s individual market share; this would be the
effect of primary markets in SPZ. Furthermore, the regional dummy indicates that individual
market shares in Eastern Senegal are larger than shares in the SPZ.
Specifically for traders in SPZ, the individual market share is positively influenced by
education, experience in gum business, his wealth in number of houses possessed, knowledge
of languages, possession of a telephone that is used to gather the market information, and area
of operation. The lower the number of buyers who operate in a market and the better the
availability of storage facilities in a market, the larger would be the trader’s individual market
share. Specifically for traders in ES, the individual market share is positively influenced by
wealth in value of livestock owned, knowledge of languages and possession of a telephone
that is used to gather the market information, and the area of operation. The longer the
distance to the nearest town, the larger would be the trader’s individual market share.
Variables that have a positive influence on the market share of an individual traders in
primary markets are education, experience in gum business, and access to funds as
represented by the wealth in livestock value owned and house possessed, family network in
business, knowledge of languages, possession of a telephone, area of operation, size of the
market and distance to nearest town. The variables that have a negative influence are the
107
number of buyers who operate in a market and distance of the market from Dakar.
Furthermore, the regional dummy indicates that individual market shares in ES are larger than
shares in the SPZ in primary markets. Within these primary markets, the influential
determinants may differ in the SPZ than ES.
Variables that have a positive influence on the market share of an individual traders in
transport markets are experience in gum business, access to funds as represented by the
houses possessed, knowledge of languages, possession of a telephone that is used to gather
the market information, the size of the market, distance to nearest town, distance to Dakar and
availability of storage. The number of buyers who operate in a market has a negative
influence on the market share. Furthermore, the regional dummy indicates that individual
market shares in ES are smaller than shares in the SPZ in transport markets. Also within these
transport markets, the influential determinants differ between the SPZ and ES.
The significant influence of variables vary within markets or zones, and even if data
set was not large enough to elicit the determinants of wholesalers’ market shares, the results
above enable us to substantiate that all in all there is positive influence of education and
business experience of the trader (these factors can be designated as human capital); access to
funds represented by ownership of livestock or houses (financial capital); the network of
relatives who are also involved in gum business (social capital); information accessibility
represented by the number of languages spoken and telephone ownership (communication
capital); and area of operation (physical capital). Market characteristics such as market size
and availability of storage have a positive impact on the individual market shares whereas
competition over transactions indicated by the number of buyers reduces the market share. If
the market is physically located far away from town, it might attract only a few buyers and
hence lead to large individual shares in the market. Primary traders who are located nearer to
Dakar have larger individual market shares. Transporters who are located further away from

108
Dakar have larger individual market shares. The latter can be explained by the function of
transporters.
Interpretation on the accession to gum arabic markets
The relatively low levels of concentration of market power observed in gum arabic markets
might be an indication of free entry in these markets. However, in some markets high entry
requirements are set implying that there may be barriers restricting market accession and
expansion within the market or expansion of the area of operation. Such barriers determine
not only the structure of the market but also the performance of the market actors. Here, we
re-interpret determinants of the market share distribution in terms of factors influencing
market accession bearing in mind that the importance of such factors varies along stages of
the gum supply chain.
Market accession may be influenced by access to capital: (1) human capital: while
education might be or not always be important in starting a gum business, at least some
experience in general business is a prerequisite as an indication of the skills to transact in gum
markets; (2) financial capital: with difficulties to access credit especially in rural areas, the
backup of own (old) capital is needed to start or expand the business; (3) social capital: most
gum business are families directly or indirectly supported by a system of networks of family
relatives. These networks serve not only the purpose of information provider but can also act
as transaction partners; (4) communication capital: information systems play an important
role in determinant market shares. Such information systems pertain to the markets, prices
and gum-transaction related conditions. and (5) physical capital. Other influences of market
accession may include geographical barriers reflected by distances to towns or Dakar. These
barriers imply that there are high transport costs which are intensified by missing roads or the
generally bad conditions of rural roads. As the gum producers are dispersed, extending the
area of operation may be very difficult for a trader. Furthermore, legal requirements must be
109
fulfilled in order to start and register the business in terms of start-up capital and further fiscal
duties (AEPC, 2007). These requirements may be difficult to achieve for individuals and even
companies.
Marketing margins
Computations of the market power revealed no or at the most low oligopsonist tendencies.
This would imply that little evidence is found for oligopsonistic margins while determining
their buying prices. We explored, at the market level, whether the margins observed are
associated with market power and found no correlation between the margins and market
power.
The net margins as proportions of selling price are 17.3, 9.6 and 18.5 per cent in
primary, transporting and wholesale markets respectively. The above margins were compared
to margins earned in other markets for agricultural inputs or products, or for non-timber forest
products. For instance, in the yellow maize market of Mozambique, Zucula and Massinga
(1993) found that net margins ranged from 8.3 to 19 per cent of the total price for the
retailers; in the fertilizer market in Uganda, Omamo (2003) found that retail margins ranged
from 5 (in Bukedea) to 28 per cent (in Kabale); in the market of non-timber forests in
Cameroon, Ndoye et al. (1998) found that the marketing margins obtained by traders varied
between 16 per cent for African pear (Dacryodes edulis) and 30 per cent for wild mangoes
(Irvingia spp.) of the value of sales; in the market of frankincense in Tigray, Kassa et al.
(2011) found that the wholesalers earned marketing margins of 41.1 per cent and 31.4 per
cent in 2007 and 2010 respectively. This comparison implies that the margins earned by
traders in the gum arabic sector are not as excessive as in the comparison cases, and these
traders might hence not just be labelled as exploitative.
Even if the exercise of market power by buyers could not be confirmed, the question
remains as to why these margins are large, at least in some markets, even larger in comparison
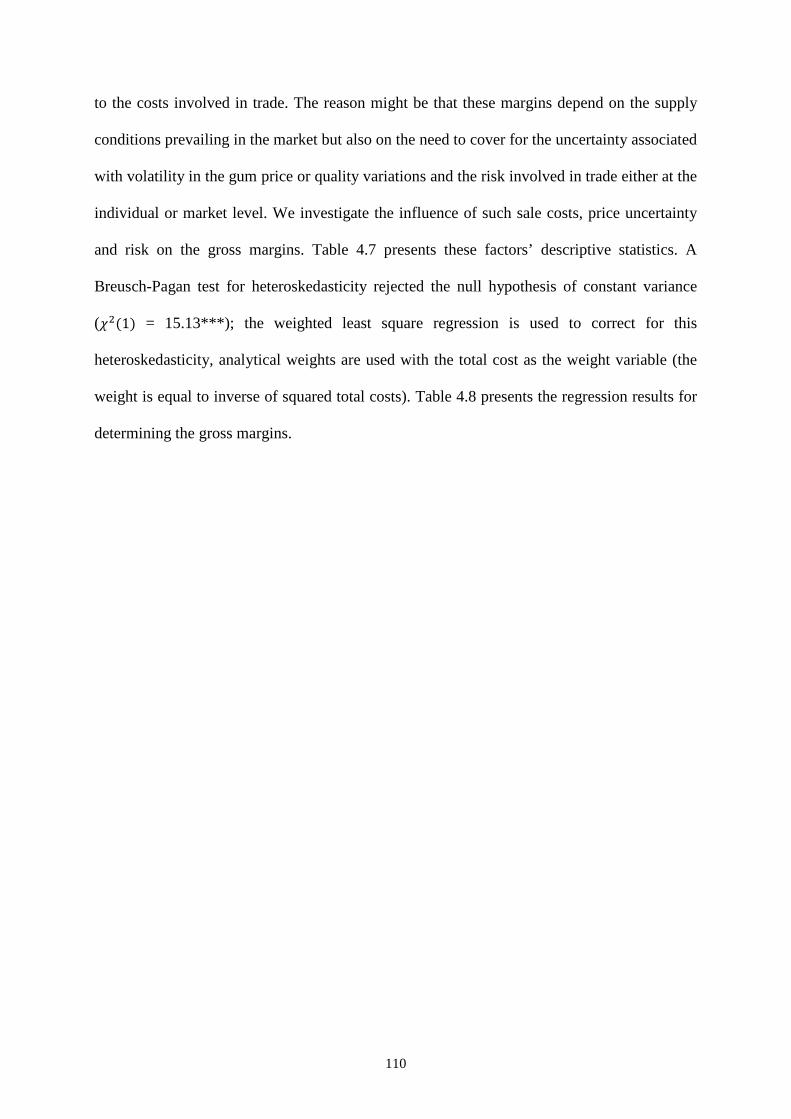
110
to the costs involved in trade. The reason might be that these margins depend on the supply
conditions prevailing in the market but also on the need to cover for the uncertainty associated
with volatility in the gum price or quality variations and the risk involved in trade either at the
individual or market level. We investigate the influence of such sale costs, price uncertainty
and risk on the gross margins. Table 4.7 presents these factors’ descriptive statistics. A
Breusch-Pagan test for heteroskedasticity rejected the null hypothesis of constant variance
(o((1) = 15.13***); the weighted least square regression is used to correct for this
heteroskedasticity, analytical weights are used with the total cost as the weight variable (the
weight is equal to inverse of squared total costs). Table 4.8 presents the regression results for
determining the gross margins.
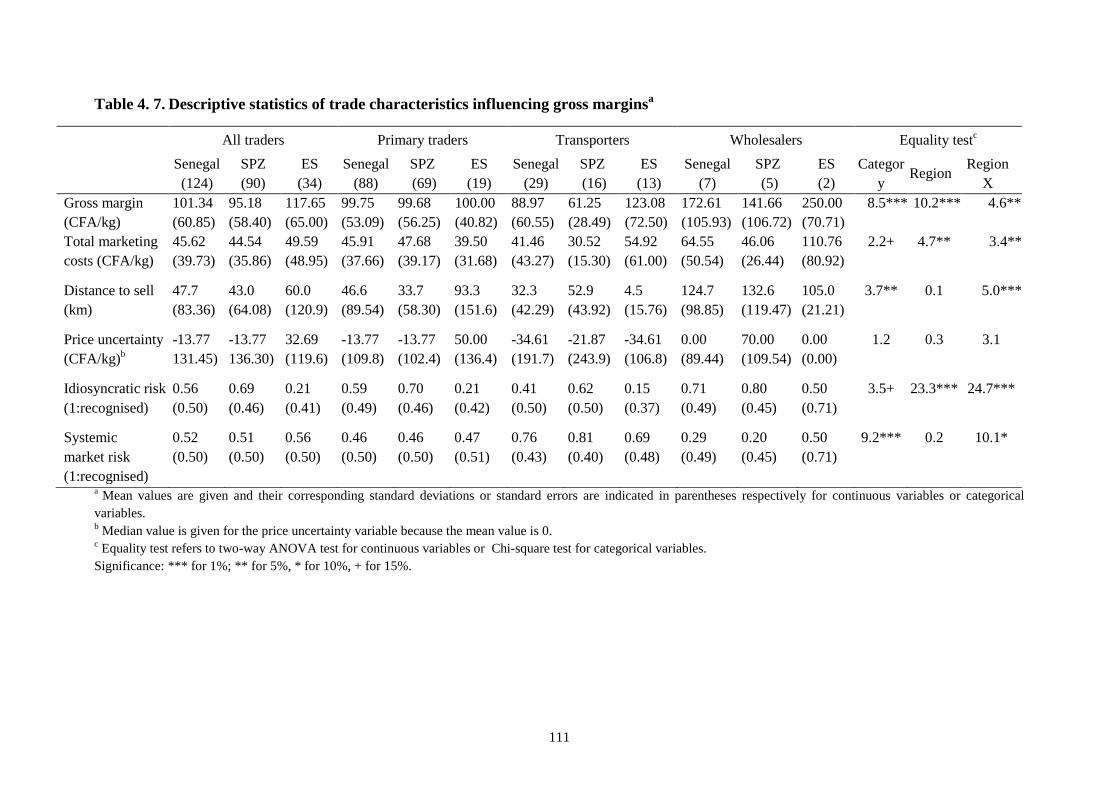
111
Table 4. 7. Descriptive statistics of trade characteristics influencing gross marginsa
All traders Primary traders Transporters Wholesalers Equality testc
Senegal (124)
SPZ (90)
ES (34)
Senegal (88)
SPZ (69)
ES (19)
Senegal (29)
SPZ (16)
ES (13)
Senegal (7)
SPZ (5)
ES (2)
Category
Region Region
X Gross margin (CFA/kg)
101.34 (60.85)
95.18 (58.40)
117.65 (65.00)
99.75 (53.09)
99.68 (56.25)
100.00 (40.82)
88.97 (60.55)
61.25 (28.49)
123.08 (72.50)
172.61 (105.93)
141.66 (106.72)
250.00 (70.71)
8.5*** 10.2*** 4.6**
Total marketing costs (CFA/kg)
45.62 (39.73)
44.54 (35.86)
49.59 (48.95)
45.91 (37.66)
47.68 (39.17)
39.50 (31.68)
41.46 (43.27)
30.52 (15.30)
54.92 (61.00)
64.55 (50.54)
46.06 (26.44)
110.76 (80.92)
2.2+ 4.7** 3.4**
Distance to sell (km)
47.7 (83.36)
43.0 (64.08)
60.0 (120.9)
46.6 (89.54)
33.7 (58.30)
93.3 (151.6)
32.3 (42.29)
52.9 (43.92)
4.5 (15.76)
124.7 (98.85)
132.6 (119.47)
105.0 (21.21)
3.7** 0.1 5.0***
Price uncertainty (CFA/kg)b
-13.77 131.45)
-13.77 136.30)
32.69 (119.6)
-13.77 (109.8)
-13.77 (102.4)
50.00 (136.4)
-34.61 (191.7)
-21.87 (243.9)
-34.61 (106.8)
0.00 (89.44)
70.00 (109.54)
0.00 (0.00)
1.2 0.3 3.1
Idiosyncratic risk (1:recognised)
0.56 (0.50)
0.69 (0.46)
0.21 (0.41)
0.59 (0.49)
0.70 (0.46)
0.21 (0.42)
0.41 (0.50)
0.62 (0.50)
0.15 (0.37)
0.71 (0.49)
0.80 (0.45)
0.50 (0.71)
3.5+ 23.3*** 24.7***
Systemic market risk (1:recognised)
0.52 (0.50)
0.51 (0.50)
0.56 (0.50)
0.46 (0.50)
0.46 (0.50)
0.47 (0.51)
0.76 (0.43)
0.81 (0.40)
0.69 (0.48)
0.29 (0.49)
0.20 (0.45)
0.50 (0.71)
9.2*** 0.2 10.1*
a Mean values are given and their corresponding standard deviations or standard errors are indicated in parentheses respectively for continuous variables or categorical variables. b Median value is given for the price uncertainty variable because the mean value is 0. c Equality test refers to two-way ANOVA test for continuous variables or Chi-square test for categorical variables. Significance: *** for 1%; ** for 5%, * for 10%, + for 15%.
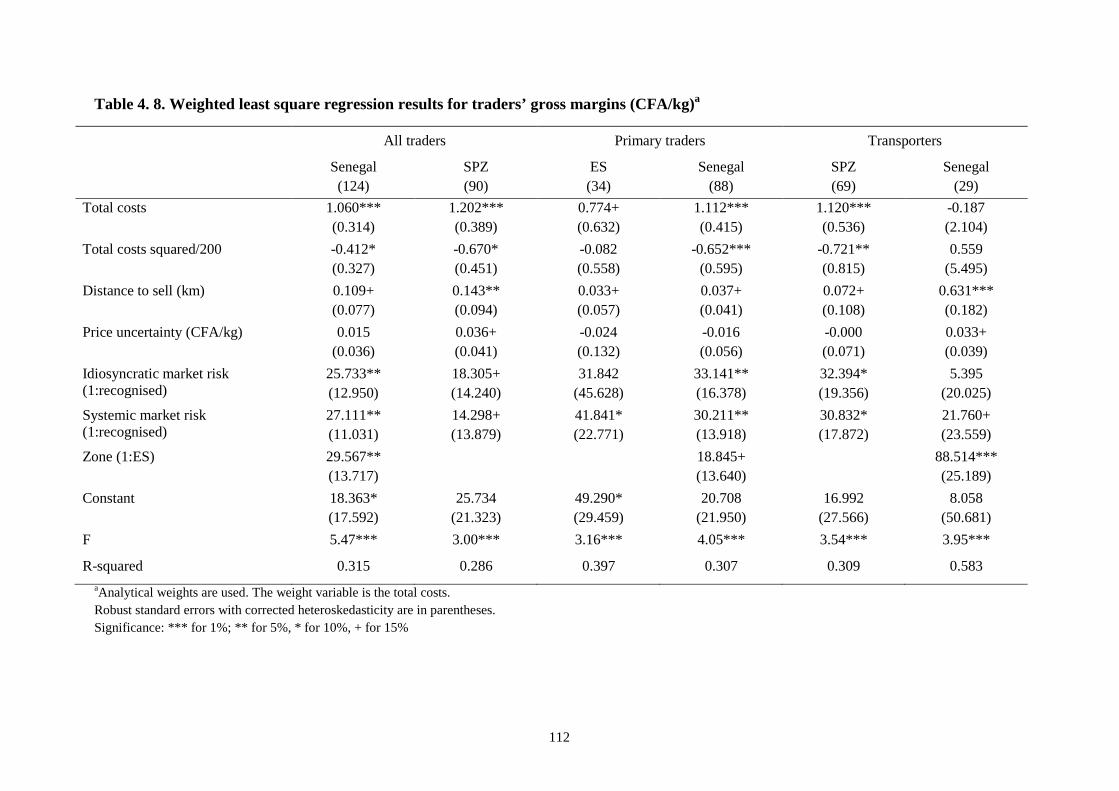
112
Table 4. 8. Weighted least square regression results for traders’ gross margins (CFA/kg)a
All traders Primary traders Transporters
Senegal (124)
SPZ (90)
ES (34)
Senegal (88)
SPZ (69)
Senegal (29)
Total costs 1.060*** (0.314)
1.202*** (0.389)
0.774+ (0.632)
1.112*** (0.415)
1.120*** (0.536)
-0.187 (2.104)
Total costs squared/200 -0.412* (0.327)
-0.670* (0.451)
-0.082 (0.558)
-0.652*** (0.595)
-0.721** (0.815)
0.559 (5.495)
Distance to sell (km) 0.109+ (0.077)
0.143** (0.094)
0.033+ (0.057)
0.037+ (0.041)
0.072+ (0.108)
0.631*** (0.182)
Price uncertainty (CFA/kg) 0.015 (0.036)
0.036+ (0.041)
-0.024 (0.132)
-0.016 (0.056)
-0.000 (0.071)
0.033+ (0.039)
Idiosyncratic market risk (1:recognised)
25.733** (12.950)
18.305+ (14.240)
31.842 (45.628)
33.141** (16.378)
32.394* (19.356)
5.395 (20.025)
Systemic market risk (1:recognised)
27.111** (11.031)
14.298+ (13.879)
41.841* (22.771)
30.211** (13.918)
30.832* (17.872)
21.760+ (23.559)
Zone (1:ES) 29.567** (13.717)
18.845+ (13.640)
88.514*** (25.189)
Constant 18.363* (17.592)
25.734 (21.323)
49.290* (29.459)
20.708 (21.950)
16.992 (27.566)
8.058 (50.681)
F 5.47*** 3.00*** 3.16*** 4.05*** 3.54*** 3.95***
R-squared 0.315 0.286 0.397 0.307 0.309 0.583 aAnalytical weights are used. The weight variable is the total costs. Robust standard errors with corrected heteroskedasticity are in parentheses. Significance: *** for 1%; ** for 5%, * for 10%, + for 15%

113
As mentioned above, traders in ES earn a higher gross margin than traders in SPZ; the gross
margin is highest for wholesalers. The cost of selling gum is lower in SPZ than in ES, while
the concern for individual risk is indicated by a higher proportion of traders in SPZ than in
ES, and the concern for market risks is more pronounced among traders in ES.
There are also significant differences in characteristics of trade across different market
types. For instance, transporters have the lowest cost of selling gum especially compared to
wholesalers; the distance to sell is lowest among transporters and highest among wholesalers;
the proportion of traders who indicated concern for individual risk is lowest with transporters
and highest with wholesalers; and the proportion of traders who indicated concern for market
risk is highest with transporters and lowest with wholesalers. Furthermore, there are
significant differences within categories of traders across regions with respect to cost of
selling gum, distance to sell, and concerns for individual and market risk.
In general and specifically in SPZ, the gross margin will increase with price
uncertainty, distance to sale place and concerns for individual and market risk. The gross
margin also increases with the costs however at decreasing rate. In ES, larger margins are
typically retained than in SPZ. Specifically in ES, longer distance to sale and higher concerns
for individual and market risk significantly increase the need for retaining larger margins.
Gross margins for traders in primary markets and specifically in SPZ are positively
influenced by distance to sale, concerns for individual and market risk, and costs. Primary
traders in ES retain larger margins; the most influential factor for these traders is market risk.
Gross margins for transporters are positively influenced by the distance to sale, price
uncertainty, and concerns for individual risk. These margins are a decreasing function of cost
involved in selling. In the SPZ, the significant variables influencing gross margins are price
uncertainty, distance to sale, and concerns for individual and market risk. Transporters in ES
114
retain larger margins; the most influential factors for these traders are the distance to sale, and
concerns for market risk.
Influential factors could not be determined for wholesalers. However, the analysis
suggests that gum traders retain margins due to high marketing costs, long distances to sale,
high price uncertainty, and higher perception of idiosyncratic and systemic market risk.
According to the traders during the interviews, marketing costs in the gum arabic are high due
poor infrastructure and inefficient transport system, and lack of market information. Trade in
markets involves a lot of price uncertainty and high risks especially in terms of regularity of
supply that can be associated with production failure, finding a market, and inability or high
costs of enforcing contract. These factors make trade in gum arabic not only costly but also
very risky and due to risk averseness, traders retain higher margins.
Interpretation on the exit from gum arabic markets
We did not interview traders who withdrew from gum trade. However, the analysis of factors
influencing the traders’ margins enables us to reflect on potential causes of exit of traders
from gum arabic markets. Therefore, we re-interpret the determinants of the gross margins in
terms of factors influencing market exit bearing in mind that the importance of such factors
varies along stages of the gum supply chain.
Market exit results from the unprofitability of business: for the pooled data, the fixed
cost was estimated at 45 CFA per kilogram of gum arabic bought (less than 10 per cent of the
buying price); hence it is not excessively high to drive a trader out of business. The
infrastructural problem as reflected by the distance and the uncertainty could lay some strain
on the trader’s profitability; and the importance of risk is certainly noticeable. In the systemic
context, supply shortages may be the main causes of exit: if there are recurrent production
failures, traders may move out of the gum arabic sector and invest their time and money
elsewhere; the low production levels implying large variable costs may cause losses to traders
115
especially if they cannot negotiate higher selling prices. On an individual level, the risk of
contract defaulting is important especially at the primary trading level: a trader who has
offered commodities or funds to be reimbursed by the supply of gum in an interlocked system
is often deceived by the collector who side-sells his product to another buyer (DEFCCS,
2005). Such repetitive defaults may seriously jeopardize the trader’s profitability as he may
even need to incur some cost to enforce the contract if at all he wants to stay in business.
4.5 Discussion and conclusions
This study investigates the behaviour and performance of gum traders in the oligopsonistic
market for gum arabic in Senegal. Oligopsonic markets are characterised by a small number
of buyers who face a relatively larger number of sellers; this is a situation that is often
observed in the marketing of raw agricultural or forest products in developing regions and
specially in the rural areas where accessibility to the production zones, high transaction costs
and various other barriers significantly restrict entry and expansion of traders. Institutions
such as associations/cooperatives or contracts which could change the structure of markets in
such a way that buyers and sellers get equivalent market power, are often missing in these
areas. Oligopoly markets for the supply of consumable products have received attention;
however, despite that the oligopsonist situation is commonly observed on the production side,
it seemed not to have caught the interest of researchers who at times merely confirmed the
common belief that traders are exploitative. Such idea of exploitation is usually associated
with the fact that even in markets where traders could act competitively, they would choose to
collude or excessively exert their market power in order to bring down the price.
As oligopsonies are observed at the consecutive levels of the supply chain, the
tendencies to drive-down the buying price result in lowering the transaction volumes and total
margins of the chain. These tendencies hence cause a double/multiple marginalisation
problem. Furthermore, a formal profit maximisation model shows that a firm involved in
116
oligopsony markets is directly linked to the actions of the competitors and suppliers. These
principles form the theoretical basis for the current study.
After classifying traders in the gum business into primary traders, transporters and
wholesalers, we found that these categories of traders are significantly different in the
characteristics of their transactions. A comparison of buying and selling prices, various
marketing costs and derived margins show that the wholesalers earn the highest margins
along the gum supply chain while the transporters earn the lowest margins. Wholesalers
benefit from the wide deviations between the buying and selling price, and hence earn high
gross margins. Furthermore, as the wholesalers transact with large quantities, their unit costs
remain relative low which lead them to even higher net margins. This cost situation remains a
problem to the business of primary traders because even if they can earn large margins,
transacting small quantities entails high unit costs which lead them to low net margins and
little payment to gum collectors. More specifically, this may explain the slow market
development in Eastern Senegal: because of low production capacity in region, the unit cost
remains high for all categories of traders specially in terms of labour and transport as the
region is also constrained by problems of accessibility and remoteness. Fafchamps and Gabre-
Madhin (2006) and Kwoka (1977) also found that the larger traders or firms can earn higher
margins. The same conclusion also applies by considering the buying circumstances: primary
traders need to get their supplies in visiting dispersed villages with scattered collectors that
each sell small quantities, transporters need to visit several markets in the production zones to
obtain gum from the primary traders, and wholesalers just generally remain established in
their own shops and are supplied by transporters, hence with lower marketing costs and risks.
Investigations of whether the performance of the traders was driven by their relative
power in the market started with the calculation of the market shares of traders and the
Herfindahl index. Within the markets, there are variations in the shares of individual traders

117
and between markets there are variations in the values of the Herfindahl index. These values
generally increase from primary traders to transporters and wholesalers implying that the
upward move along the chain leads to higher market power and stronger oligopsonistic
tendencies. We found that the share of a trader in a market is influenced by several factors
that can be grouped into the elements of capital: human capital (experience in business and
the possibility to communicate); financial capital (possibility to make available funds to be
used in trade); physical capital (area of operation); and social capital (a network of relatives
involved in business who can act as source of information and knowledge, and possibly as
transaction partners). Fafchamps (1996, 1999, 2002, 2006), Fafchamps and Minten (2000)
and Fafchamps and Gabre-Madhin (2006) had also found that traders rely extensively on such
networks as relationships increase trust by granting and receiving credit, exchanging price
information, and economizing on quality inspection thereby reducing transactions costs and
increasing trading margins. At market level, its size and the availability of storage increase the
trader’s individual market share whereas competition over transactions indicated by the
number of buyers reduces the market share. While this share can be increased by expansion of
trading area, barriers due to capital constraints and the legal framework may be significant.
Capital and market factors could also be the main cause of market accession.
Computations of market power showed that there were no or very small oligopsonistic
tendencies in the gum arabic market. Market power was not found to influence the margins
earned by traders. Rather these margins seem to depend on the supply conditions, marketing
costs, perception of price uncertainty and risk. According to Harris-White (1997) or Batt
(2004), shortcomings associated with poor infrastructure and inefficient transport system, and
lack of market information increase marketing costs. Brorsen et al. (1985), Schroeter and
Azzam (1991) and Holt (1993) found that price uncertainty and risk indeed influence the
marketing margins. The magnitude of risk could also be the main cause of market exit.

118
These findings imply that traders in the gum market, while working towards enlarging
their supplies do not follow the oligopsonistic tendencies or exercise their power in an
exploitative manner. Such exploitation on the seller would constrain supply and profits for the
whole chain because the buying price is kept artificially low. Instead, the margins that traders
keep are a reflection of the costs, uncertainty and risk that they face while conducting their
trade. The study has therefore shown that traders are not necessarily exploitative in terms of
using their market power towards producers in the primary markets or other traders in the
intermediate or wholesale markets; they may pay a low price because they face risk and
uncertainty, and high costs, especially if they are not able to exploit scale economies. In other
words, the benefits that they could obtain from gum trading may be limited by poor market
access conditions such as poor transportation conditions, lack of infrastructure and market
information in addition to individual and market related risks. Our results show interesting
similarities on the performance of rural money lenders who act as a source of informal rural
credit. While they are often accused of being usurious by charging high interests, their returns
can be justified by their methods of screening borrowers and enforcing repayment in the
presence of imperfect information (Aleem, 1990; Hoff and Stiglitz, 1995). The study has also
served to remind about the important functions of rural traders in general and of the gum
traders in particular in regard to the gum sector despite the difficult marketing conditions.
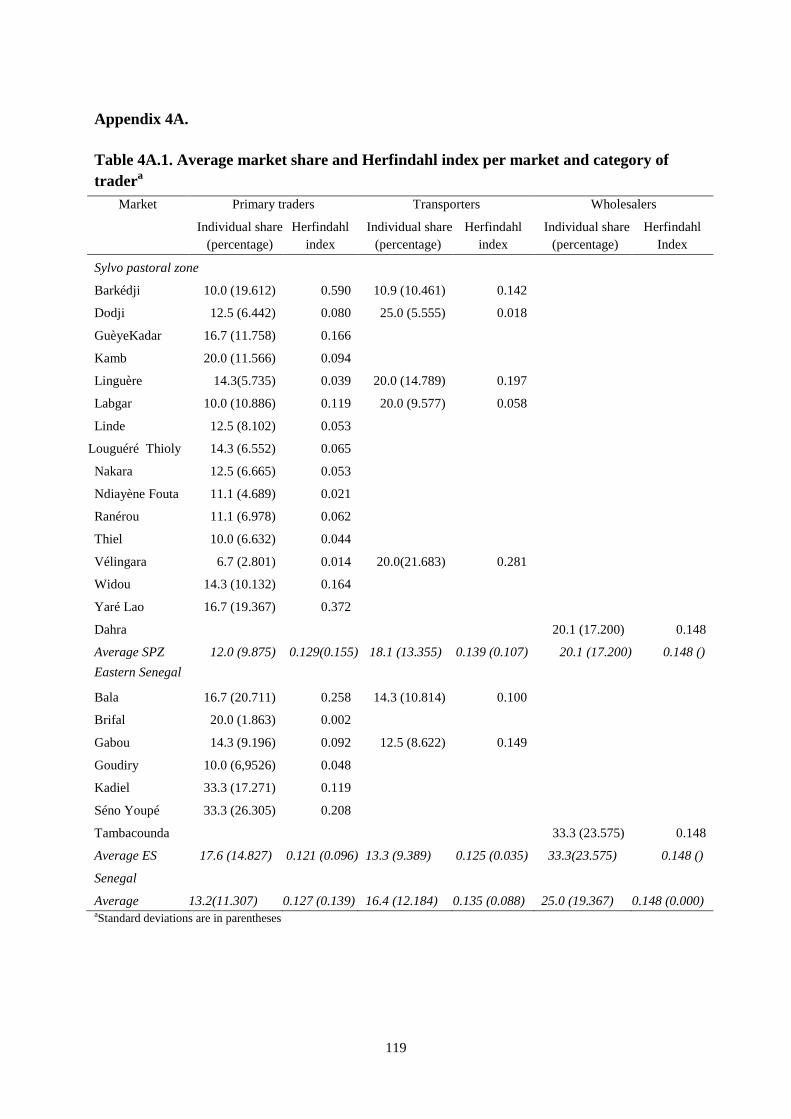
119
Appendix 4A.
Table 4A.1. Average market share and Herfindahl index per market and category of tradera
aStandard deviations are in parentheses
Market Primary traders Transporters Wholesalers
Individual share(percentage)
Herfindahl index
Individual share(percentage)
Herfindahl index
Individual share (percentage)
Herfindahl Index
Sylvo pastoral zone
Barkédji 10.0 (19.612) 0.590 10.9 (10.461) 0.142
Dodji 12.5 (6.442) 0.080 25.0 (5.555) 0.018
GuèyeKadar 16.7 (11.758) 0.166
Kamb 20.0 (11.566) 0.094
Linguère 14.3(5.735) 0.039 20.0 (14.789) 0.197
Labgar 10.0 (10.886) 0.119 20.0 (9.577) 0.058
Linde 12.5 (8.102) 0.053
Louguéré Thioly 14.3 (6.552) 0.065
Nakara 12.5 (6.665) 0.053
Ndiayène Fouta 11.1 (4.689) 0.021
Ranérou 11.1 (6.978) 0.062
Thiel 10.0 (6.632) 0.044
Vélingara 6.7 (2.801) 0.014 20.0(21.683) 0.281
Widou 14.3 (10.132) 0.164
Yaré Lao 16.7 (19.367) 0.372
Dahra 20.1 (17.200) 0.148
Average SPZ 12.0 (9.875) 0.129(0.155) 18.1 (13.355) 0.139 (0.107) 20.1 (17.200) 0.148 ()
Eastern Senegal
Bala 16.7 (20.711) 0.258 14.3 (10.814) 0.100
Brifal 20.0 (1.863) 0.002
Gabou 14.3 (9.196) 0.092 12.5 (8.622) 0.149
Goudiry 10.0 (6,9526) 0.048
Kadiel 33.3 (17.271) 0.119
Séno Youpé 33.3 (26.305) 0.208
Tambacounda 33.3 (23.575) 0.148
Average ES 17.6 (14.827) 0.121 (0.096) 13.3 (9.389) 0.125 (0.035) 33.3(23.575) 0.148 ()
Senegal
Average 13.2(11.307) 0.127 (0.139) 16.4 (12.184) 0.135 (0.088) 25.0 (19.367) 0.148 (0.000)

120
Quality of gum arabic in Senegal: linking the laboratory research to the field assessment
Abstract
This chapter links the field assessment of gum quality based on visible attributes of gum to
chemical analyses based on invisible attributes of gum with a purpose of finding links in the
definition of gum quality by collectors and traders on the one hand and by users on the other
hand. We find that good quality as defined by collectors and traders is not always good when
measured in the laboratory; however, an opportunity to increase good quality on the field
increases the likelihood of obtaining chemically good gum. Furthermore, we investigated
determinants of quality supply in terms of two attributes of visual inspection namely the size
and cleanliness of gum nodules, the latter is especially the basis for obtaining chemically
good gum. Quality is determined by several factors on which the collector has no influence
including the selection of tree species, edaphic conditions and climatic factors. However,
quality maintenance and improvement can be positively influenced by harvest and post-
harvest practices and participation in trainings that sharpen good practices, the behaviour and
experience of traders, and price expectations especially if these expectations are related to tree
management.
Keywords: ordered logit, gum arabic, quality, marketing
5.1 Introduction
Gum arabic is widely used in food and non-food industries where it functions as an
emulsifier, stabilizer, thickener, flavouring or coating agent (Wickens et al., 1995;
Nussinovitch, 1997; Verbeken et al., 2003; ITC, 2008). These functions are associated with
certain quality requirements fulfilled by gum properties such as absorption, tastelessness,
odourlessness, solubility, viscosity and rheological behaviour (Glicksman, 1969). According
to Chikamai and Odera (2002), these properties are determined by several factors including
121
the botanical sources of Acacia senegal trees, tapping methods and harvesting period, soil
conditions and climatic factors.
Gum arabic, similar to agricultural and other non-timber forest products, possesses
both intrinsic and extrinsic quality attributes. According to van Boekel (2005) and Luning and
Marcelis (2009), intrinsic quality attributes are physically linked to the product while extrinsic
quality attributes do not necessarily have a direct relationship with the product properties but
can affect the users’ quality perception or the product’s acceptance. Extrinsic attributes of
forest products include for instance being organically or sustainably collected. As gum arabic
is not directly consumed but just an ingredient in processing, the extrinsic quality aspects may
be less important in trade; hence, these attributes are not the emphasis of our current study.
Rather, we focus on intrinsic physical attributes. These attributes may be visible such as the
gum size and fullness or hardness of its nodules, its colour, and cleanliness; or invisible such
as the gum’s chemical composition. While certain attributes are permanent, others may be
changed intentionally (e.g., through post-harvest cleaning) or unintentionally through the
product’s interaction with the environment (e.g., as the gum matures or dries, it can change
colour).
The visible quality attributes are not the only determinant in gum trading, but, they are
important for grading the gum in absence of any more sophisticated method. Grading is
important because it helps in targeting markets which are undersupplied, in finding market
niches suitable to different uses, or in awarding price premiums. These premiums could
reflect the costs of all efforts in cleaning, sorting and supplying top quality gum. The sum of
gains of graded gum is supposed to be higher than what the collector would be paid for bulk
gum. Factors influencing quality attributes need to be well understood if a grading system has
to be maintained or improved. These influencing factors are human (such as collectors’
harvesting practices and involvement in post-harvest activities); environmental (such as soil
122
conditions or climate variability which are different from region to region); or market
development (such as price premiums, costs, and users’ demands).
In this chapter, our aim is to investigate the factors that contribute to the current
supply of quality by gum collectors. In the first instance we analyse the relevance of the
quality assessment by collectors and primary traders as compared to the users’ requirements
that are measurable by laboratory tests. It is important to establish a link between the field and
laboratory assessment of quality because even if these two sides may talk a different
language, they should converge to the same meaning of quality such that collectors may
indeed supply what is needed by users and thereby benefit from the maintenance and
improvement of such quality. Such a link will also pave ways for small gum producing
countries to establish a grading system which is not just based on the distinction of different
species (e.g., gum from the Acacia senegal is hard, while gum from Acacia seyal is flaky) or
different varieties within a species (e.g., Acacia senegal var. senegal found in Sudan and
Senegal vs. Acacia senegal var. kerensis found in Kenya), but a distinction of quality grades
within a certain variety itself. Second, we empirically analyse determinants of quality
attributes namely the size and cleanliness of gum nodules using a dataset constructed through
monitoring of quality supplied by collectors throughout the gum collection season of 2009-
2010 in 16 markets in the Sylvopastoral Zone and Eastern Region of Senegal. This
monitoring followed a training conducted at the beginning of the collection season which
aimed at sensitizing collectors on good practices for quality improvement and maintenance.
In the next section we introduce the definition of quality and its relevance, and then
specify the aspects of quality of gum arabic. The section is followed by the methodology and
subsequently results are presented. In the last section we discuss these results and present
conclusions.
123
5.2 Quality definition and relevance
Quality is generally defined as a measure of excellence. It is a widely used concept that
however remains abstract and complex. In production, quality is a state of being free from
defects and significant variations, brought about by the strict and consistent adherence to
measurable and verifiable standards to achieve uniformity of output that satisfies specific user
requirements (Dale et al., 1997). In business, quality of the goods and services refers to the
creation of customer satisfaction and is one of the elements that contribute to profitability
(Evans and Lindsay, 2005).
Evans and Lindsay (2005) distinguished five perspectives from which quality is
considered. These are: (1) judgemental perspective of considering quality as absolute and
universally recognisable; (2) product-based perspective with quality as a function of specific
measurable variables of the product; (3) user-based perspective that considers the product
performance within its intended function or use; (4) value-based perspective that takes into
account the relationship between the product usefulness to its price; and (5) manufacturing-
based perspective where quality is considered as conformance to manufacturing
specifications. The first four perspectives are important for gum arabic.
However, it should be recognised that the meaning of quality is not static but evolves
through time and depends on the people involved in the supply chain. For instance, producers
might put emphasis on agronomic practices (seeds, disease resistance) while distributors
might focus more on storage conditions (shelf-life, little waste); the ultimate aim is that the
end-user/consumer is satisfied (Ruben et al., 2007). Variations in quality perspectives imply
that from producers to users through traders and distributors, there might different measures
and rewards of quality.
Quality has several attributes. On the one hand, in the introduction, a division between
intrinsic and extrinsic quality attributes of a certain product was suggested. Van Boekel
124
(2005), Ruben et al. (2007) and Luning and Marcelis (2009) explain that intrinsic attributes
are physically inherent to the product while extrinsic attributes are not directly a physical
property of the product. Intrinsic attributes can be noticeable by sensory observation and are
the result of physicochemical and other properties of a product. Examples of intrinsic
attributes include texture, taste, protein content or microbial condition. Extrinsic attributes can
affect the consumer’s quality perception or the product’s acceptance. Examples of extrinsic
attributes include religious rules, organic production, or brand name which can influence the
consumers’ quality perception or products’ acceptance. On the other hand, Fafchamps et al.
(2008) suggested that a product’s quality is determined by both observable (e.g., colour, size,
shape) and non-observable attributes. In their research of non-staple food markets in India,
they concluded that observable attributes formed the basis for rewarding producers with a
price premium associated with drying, grading, and packaging the crops whereas agricultural
practices (irrigation, usage of seeds, or the application of pesticide) did generally not
influence the price.
The reward for quality is associated with the fact that even if quality may be seen as
an attribute of the product, it has its own cost and price. Tollens and Gilbert (2003) explain
that buyers and sellers trade higher or lower quality products depending on the quality
premium; in other words, quality is determined by the interaction between the demand for
quality and the quality level that producers seek to provide. Hence differences in price are
normally associated with quality differences; these differences may even be translated into
well-defined grades (Fafchamps et al., 2008).
Quality is not only used to obtain high prices; according to Alexiades and Shanley
(2004), producers can choose to supply high quality products in order to access and maintain
position in high-value markets. Evans and Lindsay (2005) confirmed that quality is an
important source of competitive advantage generating higher returns on investments and
125
increased market share. However, achieving top quality is not costless because quality needs
appropriate technology, which may be simple, but costly in labour and time. Furthermore,
especially in context of international trade, compliance with (more strictly enforced) standards
and food safety control systems can be difficult to manage or prohibitively expensive in
particular for small exporters. The consequence of investing in quality may be the reduced
short-run profitability but in the long-run such investments and related improved capacities
and awareness lead to improved profitability (Henson and Jaffee, 2006; Belcher and
Schreckenberg, 2007).
The positive relation between price and quality is assumed to be the norm implying
that if the higher quality is not rewarded by a higher price, there are no incentives to improve
quality. However, if the relation between quality and price is not explicit, there may be cases
where rising prices result in poor or declining quality of the product. For instance, in the
forestry sector, Martinez et al. (2007) found that in the market of Linaloe (Bursera aloexylon)
used for wood, increased competition led to increased levels of extraction of the linaloe
resource even before maturity thereby leading to low wood quality; Neumann and Hirsch
(2000) report that in Nepal, when buyers pay according to weight regardless of quality,
harvesters of non-timber forest products supply without selecting quality products (quoting
Edwards, 1996) or increased competition leads to harvesting of low-quality immature seeds of
timur (zanthoxylum armatum) because there is a strong incentive to harvest any seeds before a
competitor does (quoting Rawal, 1995). The reason for this negative relation between price
and quality is associated with the nature of resource tenure especially for forest products. In
private and community-managed forests where competition is regulated, the quality is much
better whereas in open-access forests where the ‘first come, first serve’ rule operates, insecure
tenure over collection areas leads to risk of over-exploitation and inability to manage the
quality (Belcher and Schreckenberg, 2007). Furthermore, quality cannot be rewarded due to
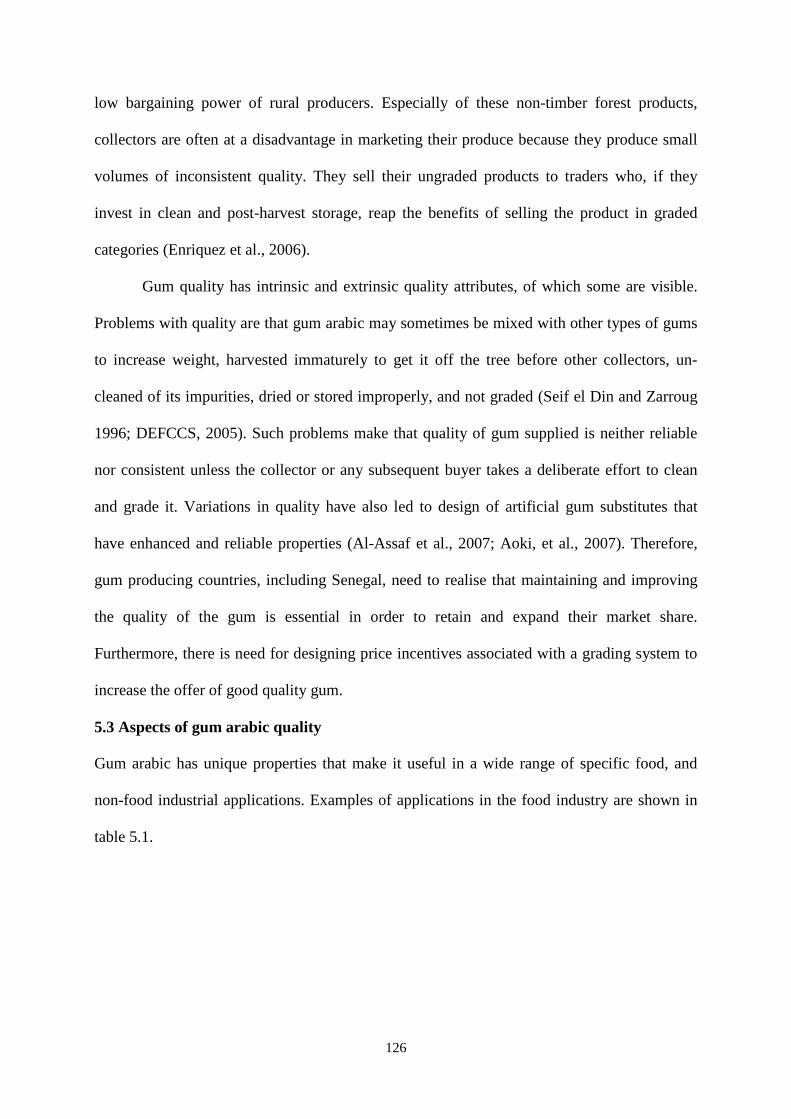
126
low bargaining power of rural producers. Especially of these non-timber forest products,
collectors are often at a disadvantage in marketing their produce because they produce small
volumes of inconsistent quality. They sell their ungraded products to traders who, if they
invest in clean and post-harvest storage, reap the benefits of selling the product in graded
categories (Enriquez et al., 2006).
Gum quality has intrinsic and extrinsic quality attributes, of which some are visible.
Problems with quality are that gum arabic may sometimes be mixed with other types of gums
to increase weight, harvested immaturely to get it off the tree before other collectors, un-
cleaned of its impurities, dried or stored improperly, and not graded (Seif el Din and Zarroug
1996; DEFCCS, 2005). Such problems make that quality of gum supplied is neither reliable
nor consistent unless the collector or any subsequent buyer takes a deliberate effort to clean
and grade it. Variations in quality have also led to design of artificial gum substitutes that
have enhanced and reliable properties (Al-Assaf et al., 2007; Aoki, et al., 2007). Therefore,
gum producing countries, including Senegal, need to realise that maintaining and improving
the quality of the gum is essential in order to retain and expand their market share.
Furthermore, there is need for designing price incentives associated with a grading system to
increase the offer of good quality gum.
5.3 Aspects of gum arabic quality
Gum arabic has unique properties that make it useful in a wide range of specific food, and
non-food industrial applications. Examples of applications in the food industry are shown in
table 5.1.
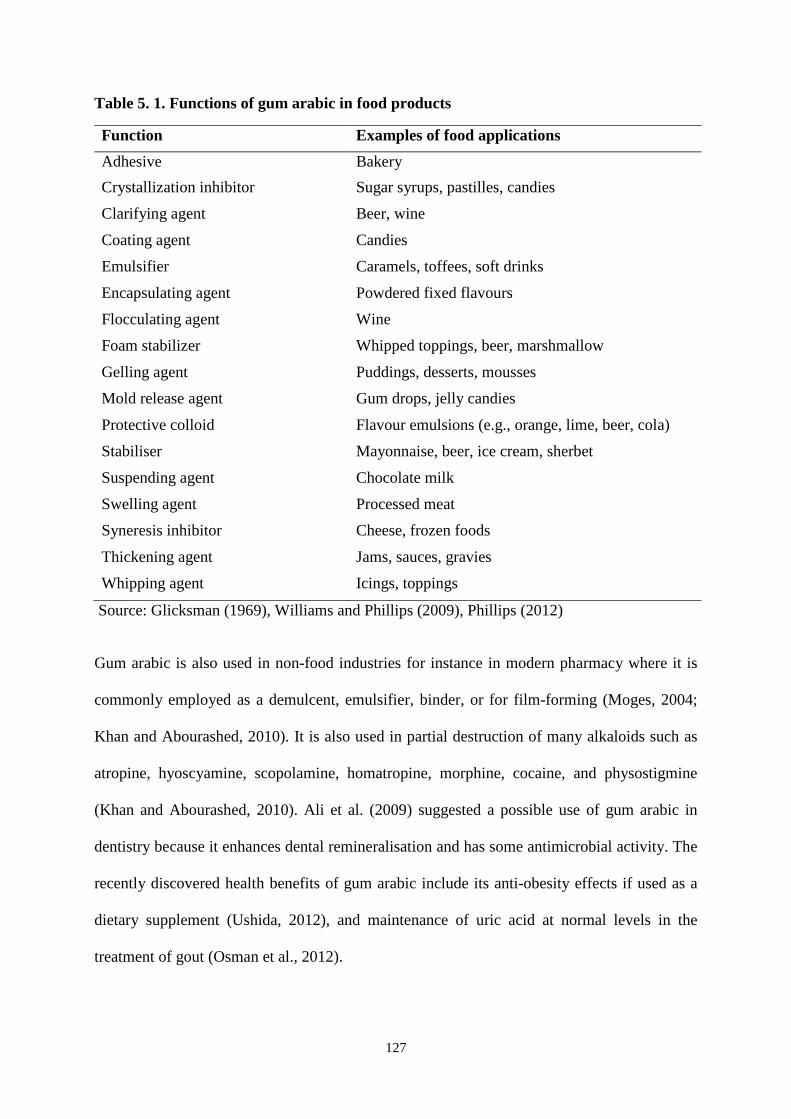
127
Table 5. 1. Functions of gum arabic in food products
Function Examples of food applications
Adhesive Bakery
Crystallization inhibitor Sugar syrups, pastilles, candies
Clarifying agent Beer, wine
Coating agent Candies
Emulsifier Caramels, toffees, soft drinks
Encapsulating agent Powdered fixed flavours
Flocculating agent Wine
Foam stabilizer Whipped toppings, beer, marshmallow
Gelling agent Puddings, desserts, mousses
Mold release agent Gum drops, jelly candies
Protective colloid Flavour emulsions (e.g., orange, lime, beer, cola)
Stabiliser Mayonnaise, beer, ice cream, sherbet
Suspending agent Chocolate milk
Swelling agent Processed meat
Syneresis inhibitor Cheese, frozen foods
Thickening agent Jams, sauces, gravies
Whipping agent Icings, toppings
Source: Glicksman (1969), Williams and Phillips (2009), Phillips (2012)
Gum arabic is also used in non-food industries for instance in modern pharmacy where it is
commonly employed as a demulcent, emulsifier, binder, or for film-forming (Moges, 2004;
Khan and Abourashed, 2010). It is also used in partial destruction of many alkaloids such as
atropine, hyoscyamine, scopolamine, homatropine, morphine, cocaine, and physostigmine
(Khan and Abourashed, 2010). Ali et al. (2009) suggested a possible use of gum arabic in
dentistry because it enhances dental remineralisation and has some antimicrobial activity. The
recently discovered health benefits of gum arabic include its anti-obesity effects if used as a
dietary supplement (Ushida, 2012), and maintenance of uric acid at normal levels in the
treatment of gout (Osman et al., 2012).
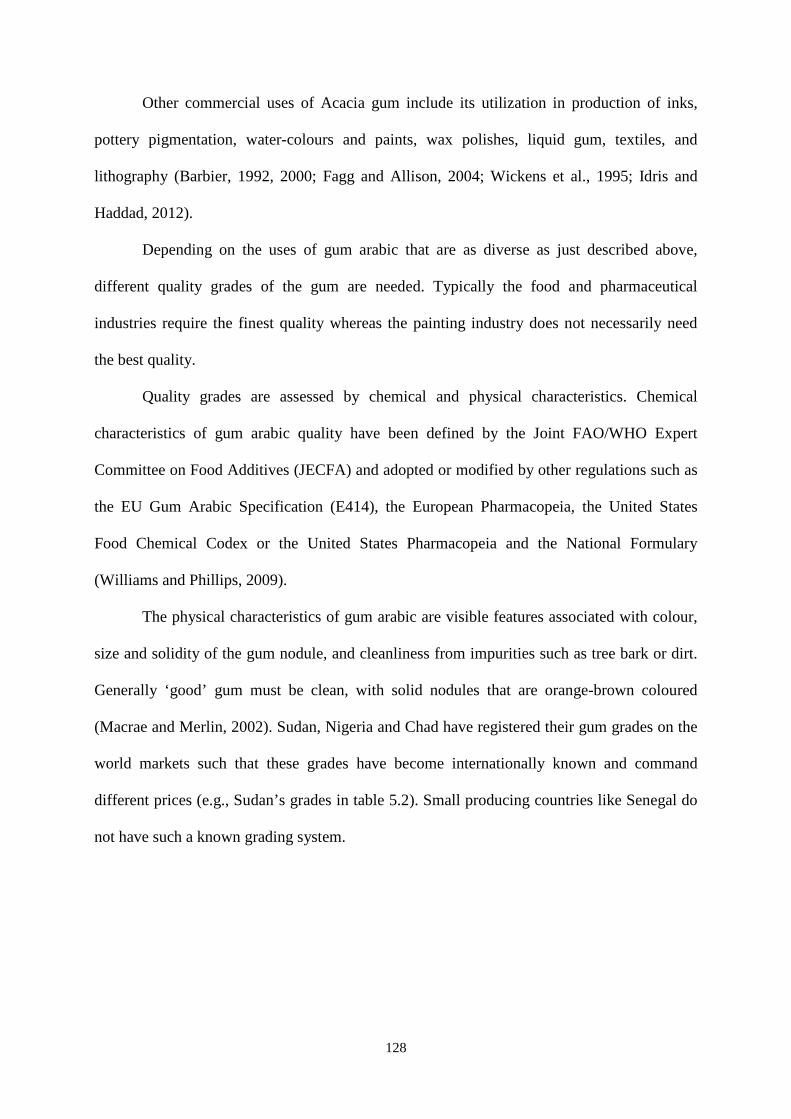
128
Other commercial uses of Acacia gum include its utilization in production of inks,
pottery pigmentation, water-colours and paints, wax polishes, liquid gum, textiles, and
lithography (Barbier, 1992, 2000; Fagg and Allison, 2004; Wickens et al., 1995; Idris and
Haddad, 2012).
Depending on the uses of gum arabic that are as diverse as just described above,
different quality grades of the gum are needed. Typically the food and pharmaceutical
industries require the finest quality whereas the painting industry does not necessarily need
the best quality.
Quality grades are assessed by chemical and physical characteristics. Chemical
characteristics of gum arabic quality have been defined by the Joint FAO/WHO Expert
Committee on Food Additives (JECFA) and adopted or modified by other regulations such as
the EU Gum Arabic Specification (E414), the European Pharmacopeia, the United States
Food Chemical Codex or the United States Pharmacopeia and the National Formulary
(Williams and Phillips, 2009).
The physical characteristics of gum arabic are visible features associated with colour,
size and solidity of the gum nodule, and cleanliness from impurities such as tree bark or dirt.
Generally ‘good’ gum must be clean, with solid nodules that are orange-brown coloured
(Macrae and Merlin, 2002). Sudan, Nigeria and Chad have registered their gum grades on the
world markets such that these grades have become internationally known and command
different prices (e.g., Sudan’s grades in table 5.2). Small producing countries like Senegal do
not have such a known grading system.
129
Table 5. 2. Sudan classification of gum arabic
Grade Description Percentage
at sorting
Hand Picked Selected Cleanest, lightest colour, and whole nodule, Ø
>30 mm; most expensive grade
0 to 5
Cleaned amber and sifted Clean, siftings are removed, pale to dark amber
colour, whole or broken nodule, Ø >20 mm
5-10
Cleaned Standard grade, contains siftings but dust is
removed, whole nodule plus fragments, 10 <Ø
<20 mm
70
Siftings Fine particles left after sorting, contains sand,
bark and dirt, 2.5<Ø < 10 mm
5
Dust Very fine particles collected after the cleaning
process, Ø< 2.5 mm
5
Red gum Dark and red particles, only for local use
Ø - Diameter Source: Macrae and Merlin (2002), Williams and Phillips (2009)
The main factors affecting these grades of gum arabic quality are different botanical sources,
tapping methods and harvesting period, soil conditions and climatic factors (Chikamai and
Odera, 2002). To maintain gum quality during gum collection, collectors need to apply good
tapping techniques and tap at the appropriate time (following climatic and ecological cues),
respecting the waiting period after tapping. They should harvest gum off the tree carefully
without taking the bark, and prevent it from touching the soil. Post-harvesting handling is also
important; indeed cleaning, drying or storage improve the quality of gum arabic.
While different prices are associated with different grades at the export level, the same
rule should be applicable within the gum producing countries at the level of collectors so that
a high price rewards the efforts in conversion from low to high quality either during or post
harvesting. A predicting model that explains relationships between gum grading, costs and
price is included in the appendix A1. This model investigates reasons as to why collectors
130
seem to supply gum of standard quality and not implement quality maintenance or
improvement when conversion costs are too high vis-à-vis price premiums (which are quasi-
absent on local markets in Senegal). Yet, arguably, quality maintenance, improvement and
hence grading can potentially improve the price of gum for collectors and increase their
incomes. Yet, the model in A1 also attempts to explain why traders do not provide these
incentives for enforcing quality maintenance or improvement8.
5.4 Methodology
1. Formalisation of quality
A first step in investigating the quality of gum supplied by collectors is to test the
understanding of its meaning by collectors and traders on the one side and by users on the
other side. The collector’s assessment of gum quality was done on the field whereas the users’
assessment is determined in the laboratory by analysis of the chemical components which
determine its properties and thereby its usage in different industries. Both assessments are
brought together in a comparative analysis that is based on specifications recognized by FAO
and Valdafrique.
Field assessment
A field assessment of gum samples was conducted during the visit of 11 random villages from
the Sylvopastoral zone and Eastern region of Senegal between March and April 2010. In total,
27 random samples of gum were taken from the gum intended for sale and these samples were
assessed by collectors and traders in the village. In this assessment, samples were classified as
of best, first, second or standard quality on the basis of a visual inspection of quality attributes
including the size of the gum nodule, clarity of colour, and cleanliness.
8 Currently, gum sales are not rewarded according to quality but collectors receive a low price for their product. The lack of statistics in relation to different grades of gum arabic has made that the available data could not substantiate this model.
131
Laboratory chemical analyses
Chemical analyses were done in the laboratory to determine the intrinsic invisible quality
attributes of the gum samples. These samples were ground in powder on a cutting mill
(Retsch SM100) with a sieve of aperture size of 1mm. They were then solubilized in distilled
water at a rate of 10 per cent w/w (weight by weight). The solution was then filtrated on a
filter with porosity P2 in order to eliminate the particles in suspension (sand, bark etc.). The
laboratory analysis include measurements such as dry matter (determined on gum powder by
heating at 103°C during 24h), mineral matter or ashes (determined on gum powder by
combustion at 550°C during 4h), and the specific rotatory power (determined by direct
reading of rotator power on a Bellingham + Stanley’s ADP220 polarimeter).
Linking the field to the laboratory
Results from the chemical analyses were compared with the field assessment to determine the
extent to which the samples graded in the field fulfilled users’ requirements. Users’ quality
requirements provided the basis for comparison namely the JECFA specifications for food
products in general on the international level, and Valdafrique specifications for chemical
products on the national level. These specifications of gum arabic are found in appendices A2
and A3 respectively.
2. Determinants of quality supply by gum collectors
In the second step we analyse the determinants of supply of quality for two attributes namely
the size and cleanliness of the nodules: the bigger and/or the cleaner the gum nodule, the
higher is its quality.
The variable indicating the size of gum nodules is defined by the quantity brought by
the collector to market which includes many nodules that are smaller than 2cm (0), a few
nodules that are smaller than 2 cm (1), a few nodules that are larger than 2cm (2), and many
nodules that are larger than 2cm (3). The variable indicating the cleanliness of nodules is
132
defined by the quantity brought by the collector to market which includes a few nodules that
are clean (0), about half of the nodules that are clean (1), and many nodules that are clean (2).
These values indicate attributes of the ordered observed outcome in the supply of quality.
Determinants of the attributes of quality include tapping aspects, post-harvest
handling, market characteristics, and environmental factors.
Tapping aspects include:
- Time between tapping the Acacia senegal tree and collecting the gum off the tree: the
recommended minimum time between tapping and collection is 14 days so that gum has
sufficiently matured. Any time lesser than 14 days has a negative effect on quality in terms of
size and hardness, because a wet nodule will easily carry impurities. A dummy variable
expressing this time takes the value of 1 if 14 days or more are taken between tree tapping and
collecting gum or 0 if there is no information regarding the time or less time was taken
between tapping and collection.
- Forest management: refers to private or common ownership of gum trees and/or plots.
Private plots are found with collectors who have planted their own trees or through permanent
ownership by inheritance, requests from village chiefs, or by formal or informal divisions of
plantations. Communal plots are obtained through temporary ownership or just through
collection with or without permit from the forestry service. Generally no investment in
management practices is done (such as pruning, coppicing, or fertilization); hence there is no
difference in tree management between private and common plots. However, the risk of
appropriation of the gum oozing from the tree by competing collectors who are unrestricted to
the common plots is high; hence this is expected to have a negative effect on the quality of
gum collected. A dummy variable expressing forest management takes the value of 1 if
collection is organized in communal plots or 0 if collection is organized in private plots.
Post-harvest handling includes:
133
- Participation in training on quality: a training that pertained to quality aspects of gum
arabic was specifically organized for collectors at the beginning of the collection season of
2009-2010. Collectors who participated in such training were expected to supply gum of
better quality than those who did not participate in the training. The variable expressing
participation in training takes the value of 1 if the collector participated or 0 if he did not
participate.
- Post-harvest time per kg of gum arabic: this is the number of minutes spent in post-
harvest activities such as cleaning, grading and sorting gum before taking it to the buyer. This
is calculated as the total time (in minutes) the collector devoted to post harvest activities
divided by the total amount of gum he sold The longer the time, the better the quality.
Market characteristics include:
- Sale place choice: village shop owners, whose cost of quality inspection may be low
because they were established in the village, might enforce quality requirements more
rigorously than mobile traders. These mobile traders come to the market with an interest in
gathering large quantities in order to minimize their marketing costs. The variable expressing
the collector’s choice of sale place9 takes the value of 1 if gum was sold to a village
boutiquier or 0 if gum was sold to a mobile trader.
- Trader experience: the effect of the trader’s experience on gum quality depends on the
supply base and type of markets where the trader in turn sells the gum. A less experienced
trader who wants to establish himself in business might put a bigger emphasis on the gum
quality to satisfy the buyer or as he needs to establish a large customer base, he may not need
to enforce strong quality requirements.
- Price in previous season: the price received by collectors last year gives an indication
of the expected price. The higher this price, the higher the incentive to upgrade quality.
9 Both boutique and mobile trader may accept all grades of gum, but they are mutually exclusive for a single transaction: the collector sells to either one place.
134
However, as the number of collectors increases (the higher expected prices may attract non-
professionals), the quality of gum may go down as competition in common forests increases.
Furthermore, if the price is high, quality may also deteriorate as there is relatively more
demand for lower quality.
Environmental factors are control variables on which the collector has no influence. They
include:
- Seasonal differences: the time in the season when the quantity is supplied, assuming
that storage is not done for a long time and, the collector did not bring to the market in period
2 the gum harvested in period 1. Seasonal differences capture the differences in quality due to
variations in exogenous climatic differences (e.g., heat). The variable for seasonal time takes
the value of 0 for collection at the beginning of season, 1 for the mid-season and 2 for the end
of season.
- Regional differences: there might also be environmental factors which differ across
regions (e.g., rainfall) that affect the quality of gum. The variable for region takes a value of 1
for Eastern Senegal or 0 for the Sylvopastoral zone.
3. Data and econometric model
Two training sessions on gum quality aspects were conducted in the Sylvopastoral Zone and
Eastern region at the beginning of the gum season of 2009-2010 previous to starting
collection. Following these sessions, monitoring of markets was done between January and
May 2010 such that the quality brought to the markets was immediately recorded together
with the specific details that could be the determinants of this quality. This monitoring was
done fortnightly in 16 markets and resulted in 219 formal records.
The analysis of determinants of quality aspects is done through an ordered logit model
whereby the observed attributes of the size or cleanliness of gum nodules are the dependent
135
variables. According to Greene (2008), the ordered logit model is built around a latent
regression:
j∗ = ip� + E (1)
where y* is unobserved.; x is the vector of independent variables, and β is the vector of
regression coefficients which are estimated.
Categories of response of response are observed:
j =
qrrrsrrrt0Aj∗ ≤ 01A0 ≤ j∗ ≤ v'2Av' ≤ j∗ ≤ v(...�Av+6' ≤ j∗
(2)
Then the ordered logit technique will use the observations on y, which are a form of censored
data on y* to fit the parameter vector β, � is the number of categories in the dependent
variable and µ are the cut-off points.
Cameron and Trivaldi (2010) show that the ordered logit is a model of cumulative
probabilities associated with the ordered categories such that:
Pr(j = �) = qrrsrrtPr(v+6' <j∗ ≤ v+)Pr(v+6' <ip� + E ≤ v+)Pr(v+6' −ip� < E ≤ v+ −ip�)F(v+ −ip�) − {(v+6' −ip�)
(3)
Where F is the cumulative distribution function of E which is logistically distributed.
5.5 Results
1. Assessment of quality
The classification of samples according to the field criteria and the results from chemical
analyses are presented in Table 5.3.
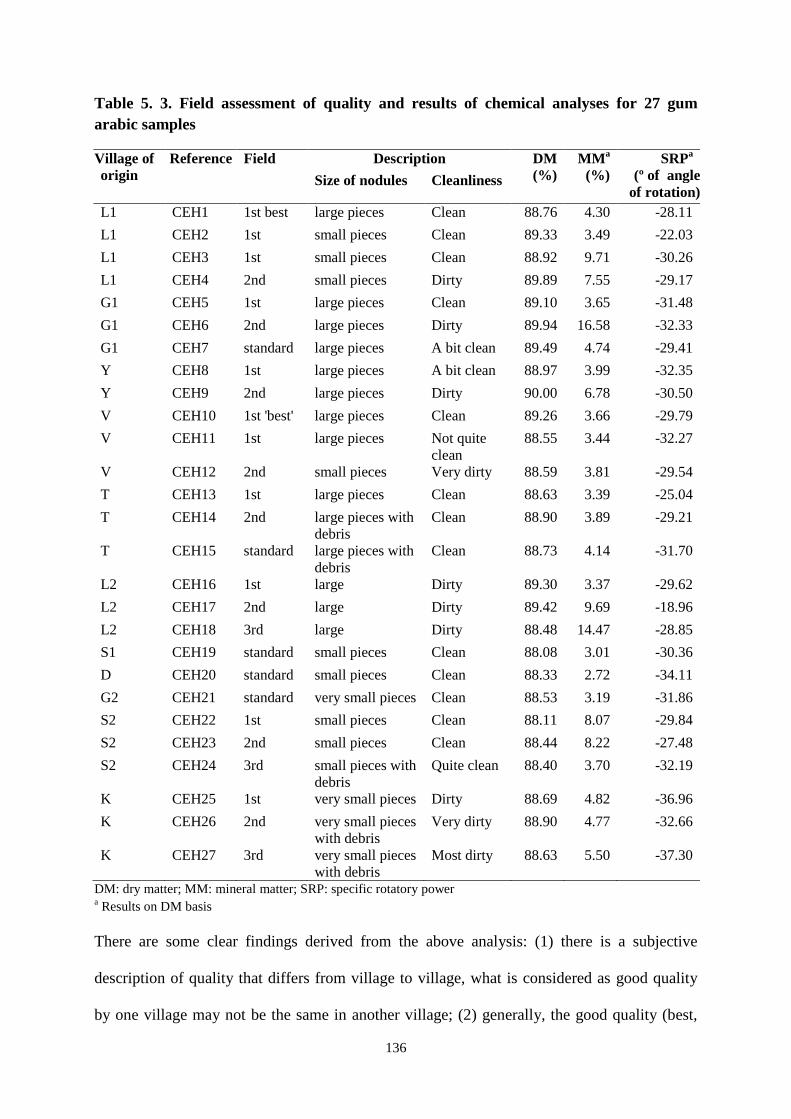
136
Table 5. 3. Field assessment of quality and results of chemical analyses for 27 gum arabic samples
Village of origin
Reference Field assessme
Description DM (%)
MM a
(%) SRPa
(º of angle of rotation)
Size of nodules Cleanliness
L1 CEH1 1st best large pieces Clean 88.76 4.30 -28.11
L1 CEH2 1st small pieces Clean 89.33 3.49 -22.03
L1 CEH3 1st small pieces Clean 88.92 9.71 -30.26
L1 CEH4 2nd small pieces Dirty 89.89 7.55 -29.17
G1 CEH5 1st large pieces Clean 89.10 3.65 -31.48
G1 CEH6 2nd large pieces Dirty 89.94 16.58 -32.33
G1 CEH7 standard large pieces A bit clean 89.49 4.74 -29.41
Y CEH8 1st large pieces A bit clean 88.97 3.99 -32.35
Y CEH9 2nd large pieces Dirty 90.00 6.78 -30.50
V CEH10 1st 'best' large pieces Clean 89.26 3.66 -29.79
V CEH11 1st large pieces Not quite clean
88.55 3.44 -32.27
V CEH12 2nd small pieces Very dirty 88.59 3.81 -29.54
T CEH13 1st large pieces Clean 88.63 3.39 -25.04
T CEH14 2nd large pieces with debris
Clean 88.90 3.89 -29.21
T CEH15 standard large pieces with debris
Clean 88.73 4.14 -31.70
L2 CEH16 1st large Dirty 89.30 3.37 -29.62
L2 CEH17 2nd large Dirty 89.42 9.69 -18.96
L2 CEH18 3rd large Dirty 88.48 14.47 -28.85
S1 CEH19 standard small pieces Clean 88.08 3.01 -30.36
D CEH20 standard small pieces Clean 88.33 2.72 -34.11
G2 CEH21 standard very small pieces Clean 88.53 3.19 -31.86
S2 CEH22 1st small pieces Clean 88.11 8.07 -29.84
S2 CEH23 2nd small pieces Clean 88.44 8.22 -27.48
S2 CEH24 3rd small pieces with debris
Quite clean 88.40 3.70 -32.19
K CEH25 1st very small pieces Dirty 88.69 4.82 -36.96
K CEH26 2nd very small pieces with debris
Very dirty 88.90 4.77 -32.66
K CEH27 3rd very small pieces with debris
Most dirty 88.63 5.50 -37.30
DM: dry matter; MM: mineral matter; SRP: specific rotatory power a Results on DM basis
There are some clear findings derived from the above analysis: (1) there is a subjective
description of quality that differs from village to village, what is considered as good quality
by one village may not be the same in another village; (2) generally, the good quality (best,
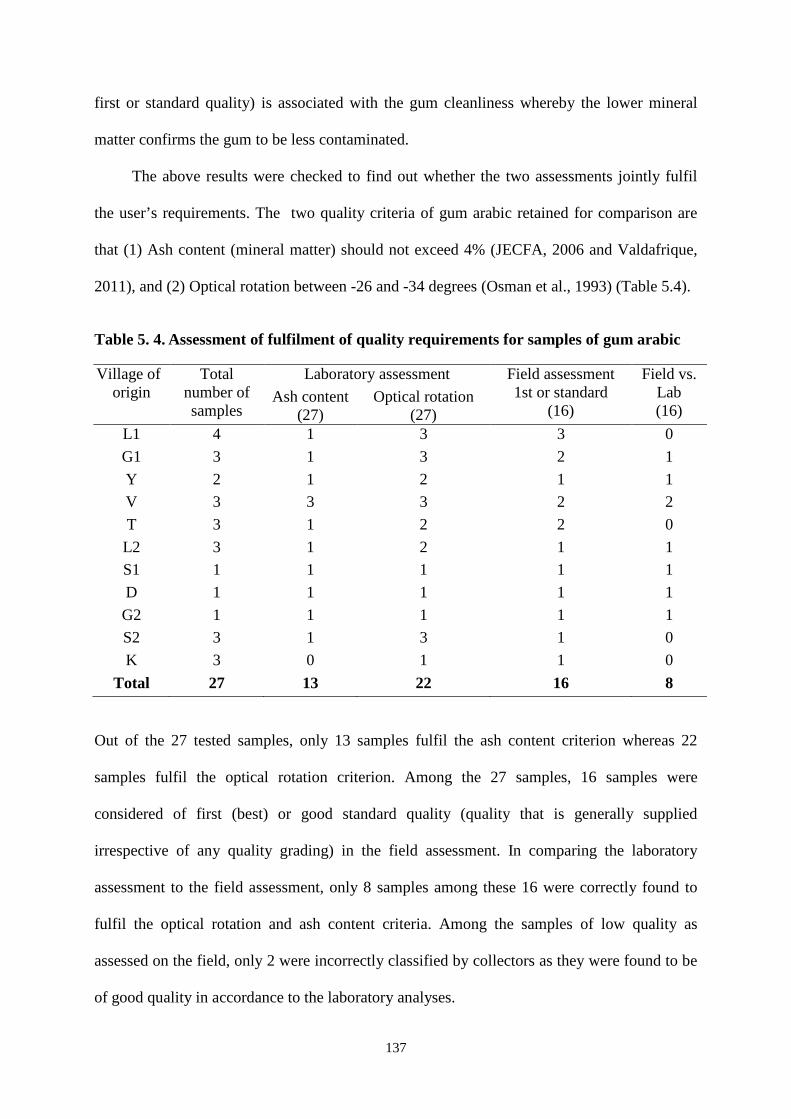
137
first or standard quality) is associated with the gum cleanliness whereby the lower mineral
matter confirms the gum to be less contaminated.
The above results were checked to find out whether the two assessments jointly fulfil
the user’s requirements. The two quality criteria of gum arabic retained for comparison are
that (1) Ash content (mineral matter) should not exceed 4% (JECFA, 2006 and Valdafrique,
2011), and (2) Optical rotation between -26 and -34 degrees (Osman et al., 1993) (Table 5.4).
Table 5. 4. Assessment of fulfilment of quality requirements for samples of gum arabic
Village of origin
Total number of samples
Laboratory assessment Field assessment 1st or standard
(16)
Field vs. Lab (16)
Ash content (27)
Optical rotation (27)
L1 4 1 3 3 0
G1 3 1 3 2 1
Y 2 1 2 1 1
V 3 3 3 2 2
T 3 1 2 2 0
L2 3 1 2 1 1
S1 1 1 1 1 1
D 1 1 1 1 1
G2 1 1 1 1 1
S2 3 1 3 1 0
K 3 0 1 1 0
Total 27 13 22 16 8
Out of the 27 tested samples, only 13 samples fulfil the ash content criterion whereas 22
samples fulfil the optical rotation criterion. Among the 27 samples, 16 samples were
considered of first (best) or good standard quality (quality that is generally supplied
irrespective of any quality grading) in the field assessment. In comparing the laboratory
assessment to the field assessment, only 8 samples among these 16 were correctly found to
fulfil the optical rotation and ash content criteria. Among the samples of low quality as
assessed on the field, only 2 were incorrectly classified by collectors as they were found to be
of good quality in accordance to the laboratory analyses.
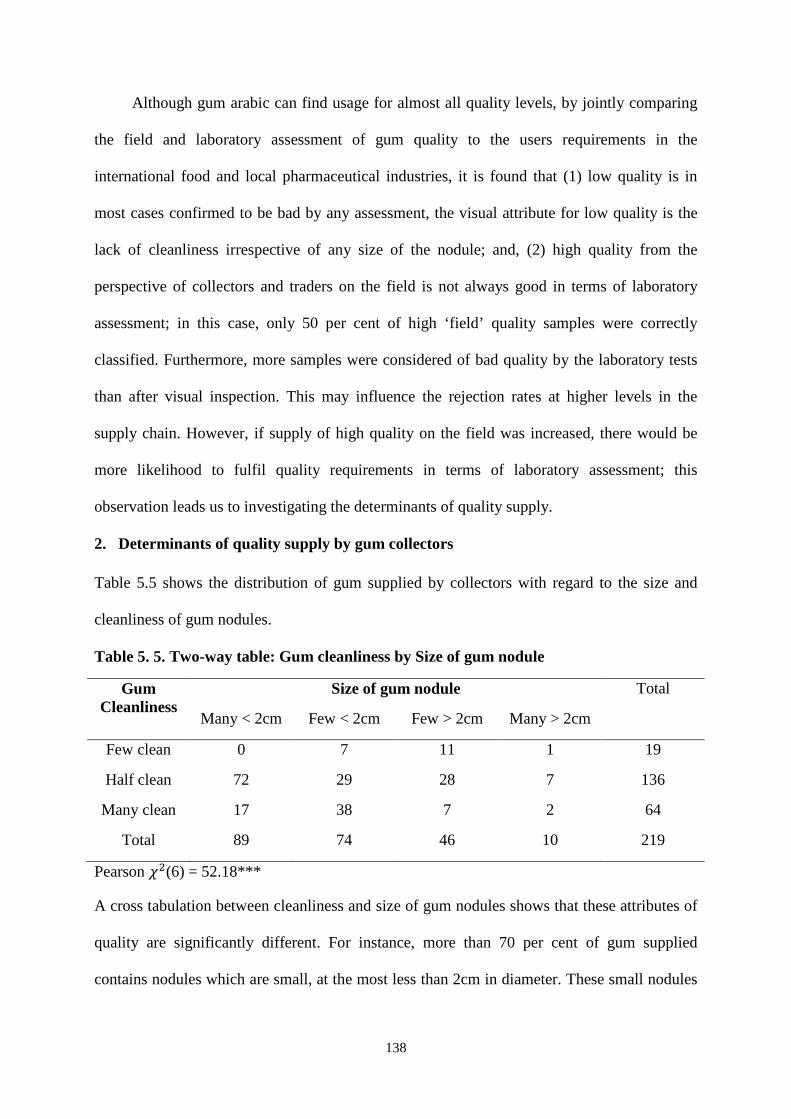
138
Although gum arabic can find usage for almost all quality levels, by jointly comparing
the field and laboratory assessment of gum quality to the users requirements in the
international food and local pharmaceutical industries, it is found that (1) low quality is in
most cases confirmed to be bad by any assessment, the visual attribute for low quality is the
lack of cleanliness irrespective of any size of the nodule; and, (2) high quality from the
perspective of collectors and traders on the field is not always good in terms of laboratory
assessment; in this case, only 50 per cent of high ‘field’ quality samples were correctly
classified. Furthermore, more samples were considered of bad quality by the laboratory tests
than after visual inspection. This may influence the rejection rates at higher levels in the
supply chain. However, if supply of high quality on the field was increased, there would be
more likelihood to fulfil quality requirements in terms of laboratory assessment; this
observation leads us to investigating the determinants of quality supply.
2. Determinants of quality supply by gum collectors Table 5.5 shows the distribution of gum supplied by collectors with regard to the size and
cleanliness of gum nodules.
Table 5. 5. Two-way table: Gum cleanliness by Size of gum nodule
Gum Cleanliness
Size of gum nodule Total
Many < 2cm Few < 2cm Few > 2cm Many > 2cm
Few clean 0 7 11 1 19
Half clean 72 29 28 7 136
Many clean 17 38 7 2 64
Total 89 74 46 10 219
Pearson o((6) = 52.18***
A cross tabulation between cleanliness and size of gum nodules shows that these attributes of
quality are significantly different. For instance, more than 70 per cent of gum supplied
contains nodules which are small, at the most less than 2cm in diameter. These small nodules
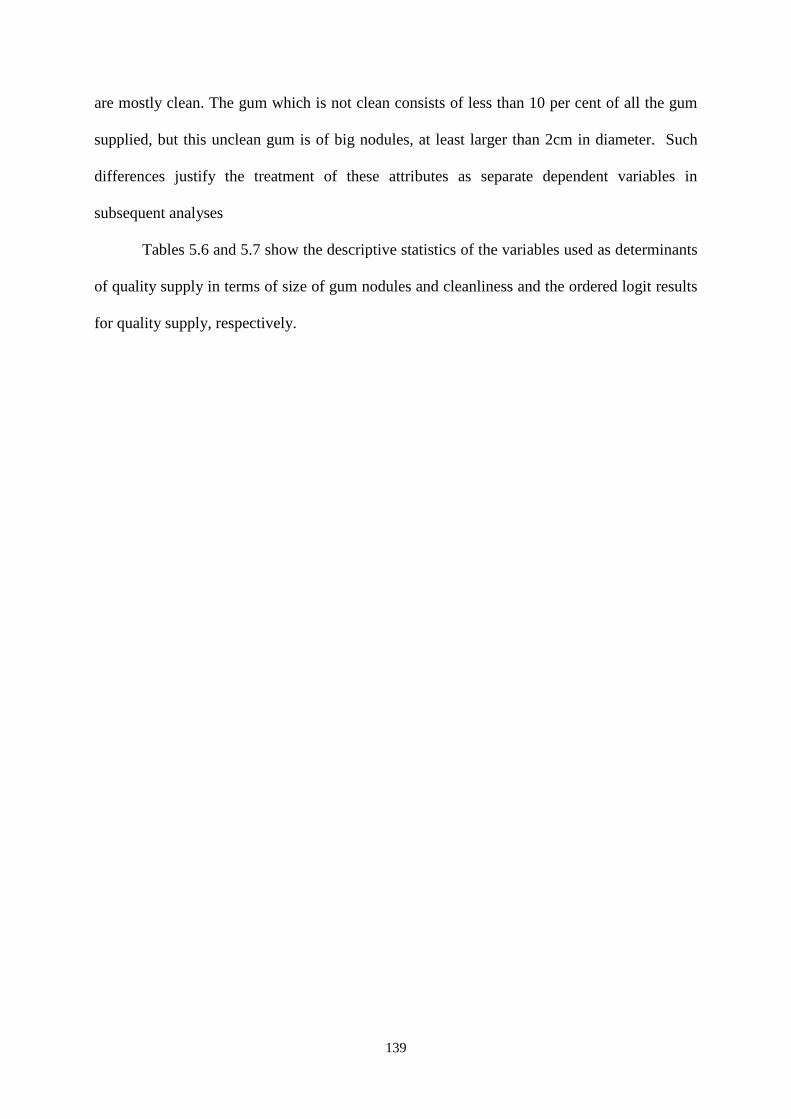
139
are mostly clean. The gum which is not clean consists of less than 10 per cent of all the gum
supplied, but this unclean gum is of big nodules, at least larger than 2cm in diameter. Such
differences justify the treatment of these attributes as separate dependent variables in
subsequent analyses
Tables 5.6 and 5.7 show the descriptive statistics of the variables used as determinants
of quality supply in terms of size of gum nodules and cleanliness and the ordered logit results
for quality supply, respectively.
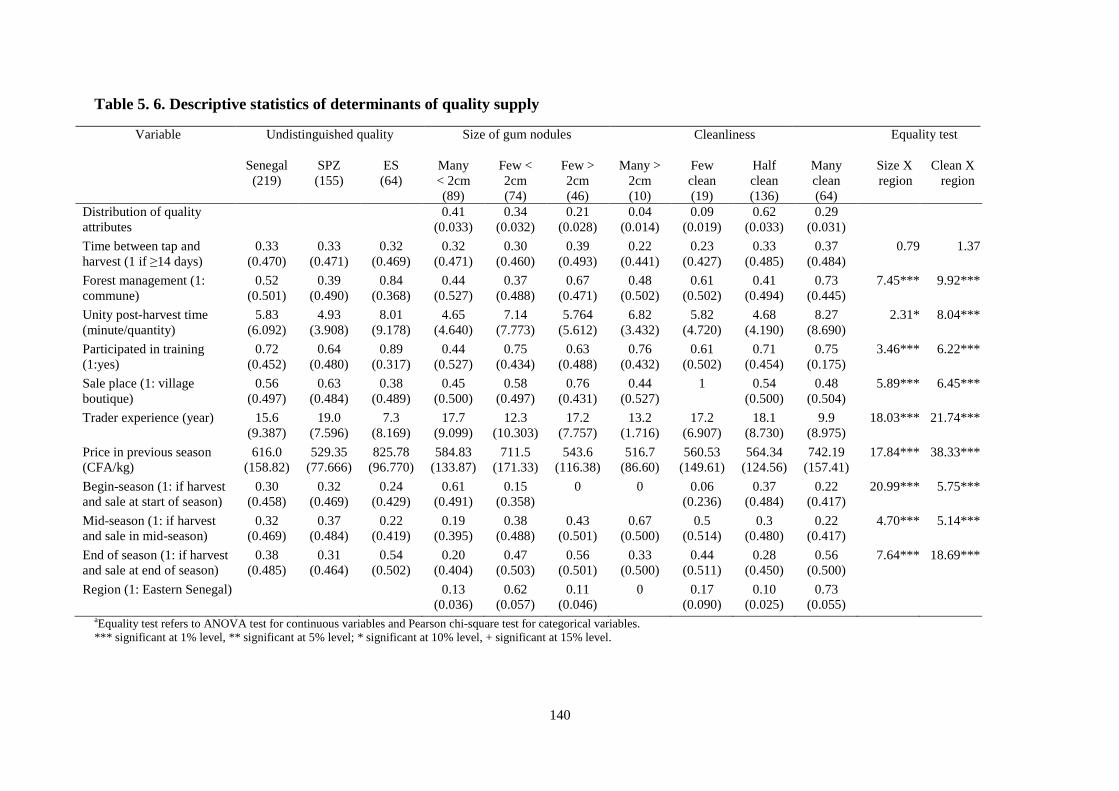
140
Table 5. 6. Descriptive statistics of determinants of quality supply
Variable Undistinguished quality Size of gum nodules Cleanliness Equality test
Senegal (219)
SPZ (155)
ES (64)
Many < 2cm (89)
Few < 2cm (74)
Few > 2cm (46)
Many > 2cm (10)
Few clean (19)
Half clean (136)
Many clean (64)
Size X region
Clean X region
Distribution of quality attributes
0.41 (0.033)
0.34 (0.032)
0.21 (0.028)
0.04 (0.014)
0.09 (0.019)
0.62 (0.033)
0.29 (0.031)
Time between tap and harvest (1 if ≥14 days)
0.33 (0.470)
0.33 (0.471)
0.32 (0.469)
0.32 (0.471)
0.30 (0.460)
0.39 (0.493)
0.22 (0.441)
0.23 (0.427)
0.33 (0.485)
0.37 (0.484)
0.79 1.37
Forest management (1: commune)
0.52 (0.501)
0.39 (0.490)
0.84 (0.368)
0.44 (0.527)
0.37 (0.488)
0.67 (0.471)
0.48 (0.502)
0.61 (0.502)
0.41 (0.494)
0.73 (0.445)
7.45*** 9.92***
Unity post-harvest time (minute/quantity)
5.83 (6.092)
4.93 (3.908)
8.01 (9.178)
4.65 (4.640)
7.14 (7.773)
5.764 (5.612)
6.82 (3.432)
5.82 (4.720)
4.68 (4.190)
8.27 (8.690)
2.31* 8.04***
Participated in training (1:yes)
0.72 (0.452)
0.64 (0.480)
0.89 (0.317)
0.44 (0.527)
0.75 (0.434)
0.63 (0.488)
0.76 (0.432)
0.61 (0.502)
0.71 (0.454)
0.75 (0.175)
3.46*** 6.22***
Sale place (1: village boutique)
0.56 (0.497)
0.63 (0.484)
0.38 (0.489)
0.45 (0.500)
0.58 (0.497)
0.76 (0.431)
0.44 (0.527)
1 0.54 (0.500)
0.48 (0.504)
5.89*** 6.45***
Trader experience (year) 15.6 (9.387)
19.0 (7.596)
7.3 (8.169)
17.7 (9.099)
12.3 (10.303)
17.2 (7.757)
13.2 (1.716)
17.2 (6.907)
18.1 (8.730)
9.9 (8.975)
18.03*** 21.74***
Price in previous season (CFA/kg)
616.0 (158.82)
529.35 (77.666)
825.78 (96.770)
584.83 (133.87)
711.5 (171.33)
543.6 (116.38)
516.7 (86.60)
560.53 (149.61)
564.34 (124.56)
742.19 (157.41)
17.84*** 38.33***
Begin-season (1: if harvest and sale at start of season)
0.30 (0.458)
0.32 (0.469)
0.24 (0.429)
0.61 (0.491)
0.15 (0.358)
0 0 0.06 (0.236)
0.37 (0.484)
0.22 (0.417)
20.99*** 5.75***
Mid-season (1: if harvest and sale in mid-season)
0.32 (0.469)
0.37 (0.484)
0.22 (0.419)
0.19 (0.395)
0.38 (0.488)
0.43 (0.501)
0.67 (0.500)
0.5 (0.514)
0.3 (0.480)
0.22 (0.417)
4.70*** 5.14***
End of season (1: if harvest and sale at end of season)
0.38 (0.485)
0.31 (0.464)
0.54 (0.502)
0.20 (0.404)
0.47 (0.503)
0.56 (0.501)
0.33 (0.500)
0.44 (0.511)
0.28 (0.450)
0.56 (0.500)
7.64*** 18.69***
Region (1: Eastern Senegal) 0.13 (0.036)
0.62 (0.057)
0.11 (0.046)
0 0.17 (0.090)
0.10 (0.025)
0.73 (0.055)
aEquality test refers to ANOVA test for continuous variables and Pearson chi-square test for categorical variables. *** significant at 1% level, ** significant at 5% level; * significant at 10% level, + significant at 15% level.
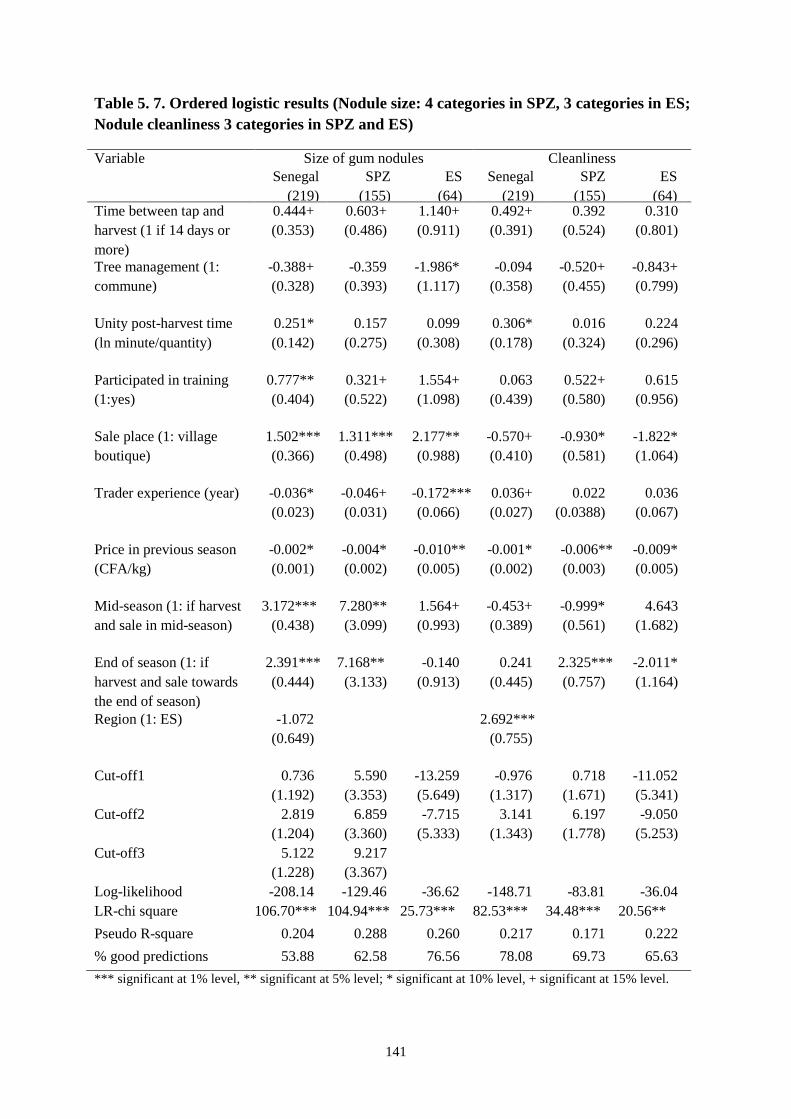
141
Table 5. 7. Ordered logistic results (Nodule size: 4 categories in SPZ, 3 categories in ES; Nodule cleanliness 3 categories in SPZ and ES)
Variable Size of gum nodules Cleanliness Senegal
(219) SPZ
(155) ES
(64) Senegal
(219) SPZ
(155) ES
(64) Time between tap and harvest (1 if 14 days or more)
0.444+ (0.353)
0.603+ (0.486)
1.140+ (0.911)
0.492+ (0.391)
0.392 (0.524)
0.310 (0.801)
Tree management (1: commune)
-0.388+ (0.328)
-0.359 (0.393)
-1.986* (1.117)
-0.094 (0.358)
-0.520+ (0.455)
-0.843+ (0.799)
Unity post-harvest time (ln minute/quantity)
0.251* (0.142)
0.157 (0.275)
0.099 (0.308)
0.306* (0.178)
0.016 (0.324)
0.224 (0.296)
Participated in training (1:yes)
0.777** (0.404)
0.321+ (0.522)
1.554+ (1.098)
0.063 (0.439)
0.522+ (0.580)
0.615 (0.956)
Sale place (1: village boutique)
1.502*** (0.366)
1.311*** (0.498)
2.177** (0.988)
-0.570+ (0.410)
-0.930* (0.581)
-1.822* (1.064)
Trader experience (year) -0.036* (0.023)
-0.046+ (0.031)
-0.172*** (0.066)
0.036+ (0.027)
0.022 (0.0388)
0.036 (0.067)
Price in previous season (CFA/kg)
-0.002* (0.001)
-0.004* (0.002)
-0.010** (0.005)
-0.001* (0.002)
-0.006** (0.003)
-0.009* (0.005)
Mid-season (1: if harvest and sale in mid-season)
3.172*** (0.438)
7.280** (3.099)
1.564+ (0.993)
-0.453+ (0.389)
-0.999* (0.561)
4.643 (1.682)
End of season (1: if harvest and sale towards the end of season)
2.391*** (0.444)
7.168** (3.133)
-0.140 (0.913)
0.241 (0.445)
2.325*** (0.757)
-2.011* (1.164)
Region (1: ES) -1.072 (0.649)
2.692*** (0.755)
Cut-off1 0.736 (1.192)
5.590 (3.353)
-13.259 (5.649)
-0.976 (1.317)
0.718 (1.671)
-11.052 (5.341)
Cut-off2 2.819 (1.204)
6.859 (3.360)
-7.715 (5.333)
3.141 (1.343)
6.197 (1.778)
-9.050 (5.253)
Cut-off3 5.122 (1.228)
9.217 (3.367)
Log-likelihood -208.14 -129.46 -36.62 -148.71 -83.81 -36.04 LR-chi square 106.70*** 104.94*** 25.73*** 82.53*** 34.48*** 20.56**
Pseudo R-square 0.204 0.288 0.260 0.217 0.171 0.222
% good predictions 53.88 62.58 76.56 78.08 69.73 65.63
*** significant at 1% level, ** significant at 5% level; * significant at 10% level, + significant at 15% level.

142
In comparing determinants of the nodules size and cleanliness in pooled data or across the
region, we observe differences in forest management, participation in training, choice of sale
outlet, the buyer’s experience, price in previous season, and harvest and sale of gum arabic
either at start or middle of the season.
Large gum nodules were supplied by collectors who can respect the sufficient duration
required for gum maturity between tree tapping and gum harvesting, spend sufficient time on
post-harvest activities (including cleaning and sorting), have participated in training, and
choose to sell to the boutique. In comparison with the beginning of the season, larger gum
nodules are best obtained during the mid or towards the end of season of collecting and
selling the gum. Collection in communal forests has a negative effect on the size of nodule as
probably the competition to collect gum off the tree leads to picking it before its maturity;
such competition increases due to higher expected price, hence this also has a negative effect
on quality. Traders who are newer in gum business prefer large nodules.
The clean gum is supplied by collectors who can respect a sufficient duration required
for gum maturity between tapping and harvesting of gum, and spend sufficient time on post-
harvest activities (including cleaning and sorting). Experienced traders prefer cleaner nodules;
Eastern Senegal is the region where cleaner gum is mostly produced. However, the choice of
boutique as the sale place and the expected price have a negative effect on cleanliness.
Furthermore, in comparison to the beginning of the season, the gum collected during the mid-
season is less clean.
Although quality remains determined by selection of tree species, tapping methods,
harvesting period, edaphic conditions and climatic factors; the harvest and post-harvest
handling were also found to have a positive influence on quality implying that there is need
for an emphasis on the basics of the techniques of gum harvesting and practices to maintain
and improve its quality. Collectors can acquire the related knowledge and skills through
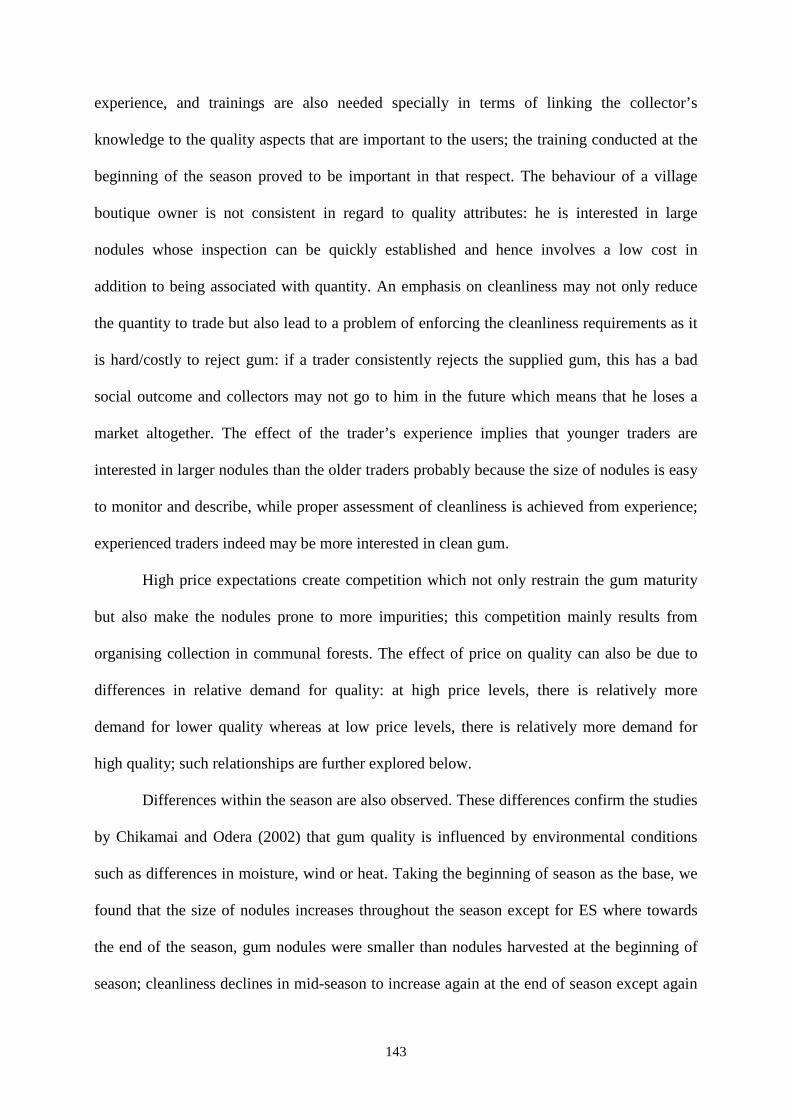
143
experience, and trainings are also needed specially in terms of linking the collector’s
knowledge to the quality aspects that are important to the users; the training conducted at the
beginning of the season proved to be important in that respect. The behaviour of a village
boutique owner is not consistent in regard to quality attributes: he is interested in large
nodules whose inspection can be quickly established and hence involves a low cost in
addition to being associated with quantity. An emphasis on cleanliness may not only reduce
the quantity to trade but also lead to a problem of enforcing the cleanliness requirements as it
is hard/costly to reject gum: if a trader consistently rejects the supplied gum, this has a bad
social outcome and collectors may not go to him in the future which means that he loses a
market altogether. The effect of the trader’s experience implies that younger traders are
interested in larger nodules than the older traders probably because the size of nodules is easy
to monitor and describe, while proper assessment of cleanliness is achieved from experience;
experienced traders indeed may be more interested in clean gum.
High price expectations create competition which not only restrain the gum maturity
but also make the nodules prone to more impurities; this competition mainly results from
organising collection in communal forests. The effect of price on quality can also be due to
differences in relative demand for quality: at high price levels, there is relatively more
demand for lower quality whereas at low price levels, there is relatively more demand for
high quality; such relationships are further explored below.
Differences within the season are also observed. These differences confirm the studies
by Chikamai and Odera (2002) that gum quality is influenced by environmental conditions
such as differences in moisture, wind or heat. Taking the beginning of season as the base, we
found that the size of nodules increases throughout the season except for ES where towards
the end of the season, gum nodules were smaller than nodules harvested at the beginning of
season; cleanliness declines in mid-season to increase again at the end of season except again
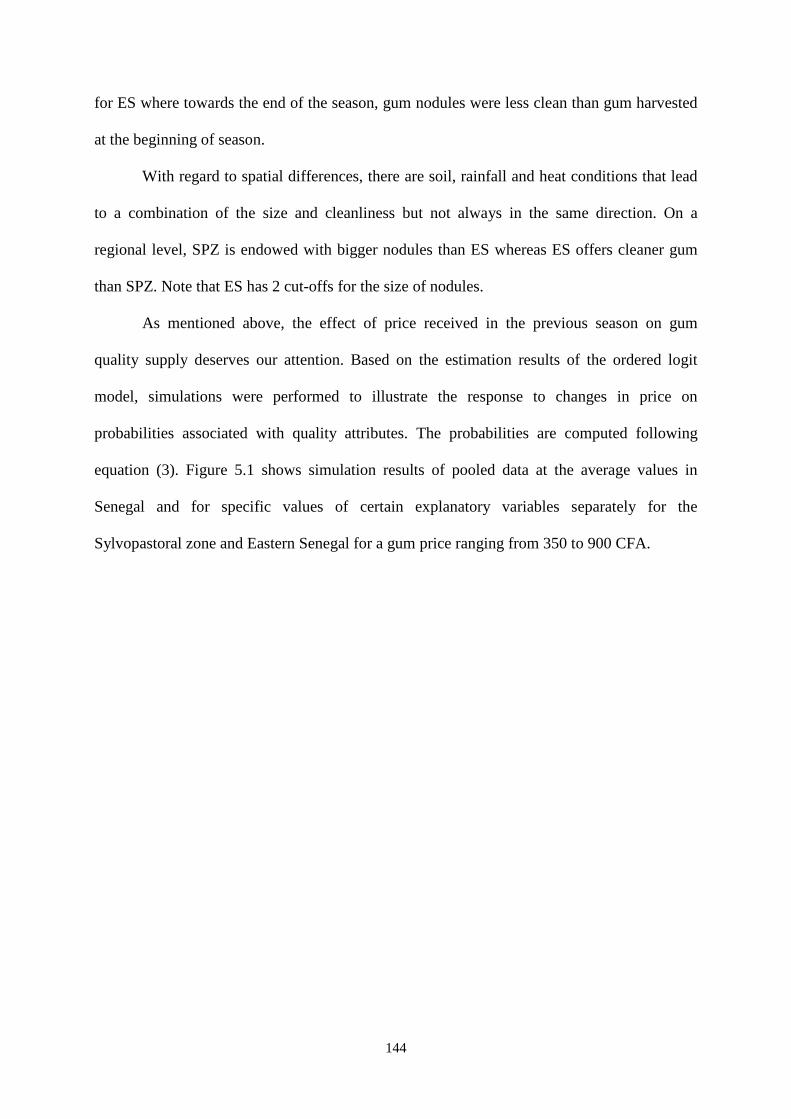
144
for ES where towards the end of the season, gum nodules were less clean than gum harvested
at the beginning of season.
With regard to spatial differences, there are soil, rainfall and heat conditions that lead
to a combination of the size and cleanliness but not always in the same direction. On a
regional level, SPZ is endowed with bigger nodules than ES whereas ES offers cleaner gum
than SPZ. Note that ES has 2 cut-offs for the size of nodules.
As mentioned above, the effect of price received in the previous season on gum
quality supply deserves our attention. Based on the estimation results of the ordered logit
model, simulations were performed to illustrate the response to changes in price on
probabilities associated with quality attributes. The probabilities are computed following
equation (3). Figure 5.1 shows simulation results of pooled data at the average values in
Senegal and for specific values of certain explanatory variables separately for the
Sylvopastoral zone and Eastern Senegal for a gum price ranging from 350 to 900 CFA.
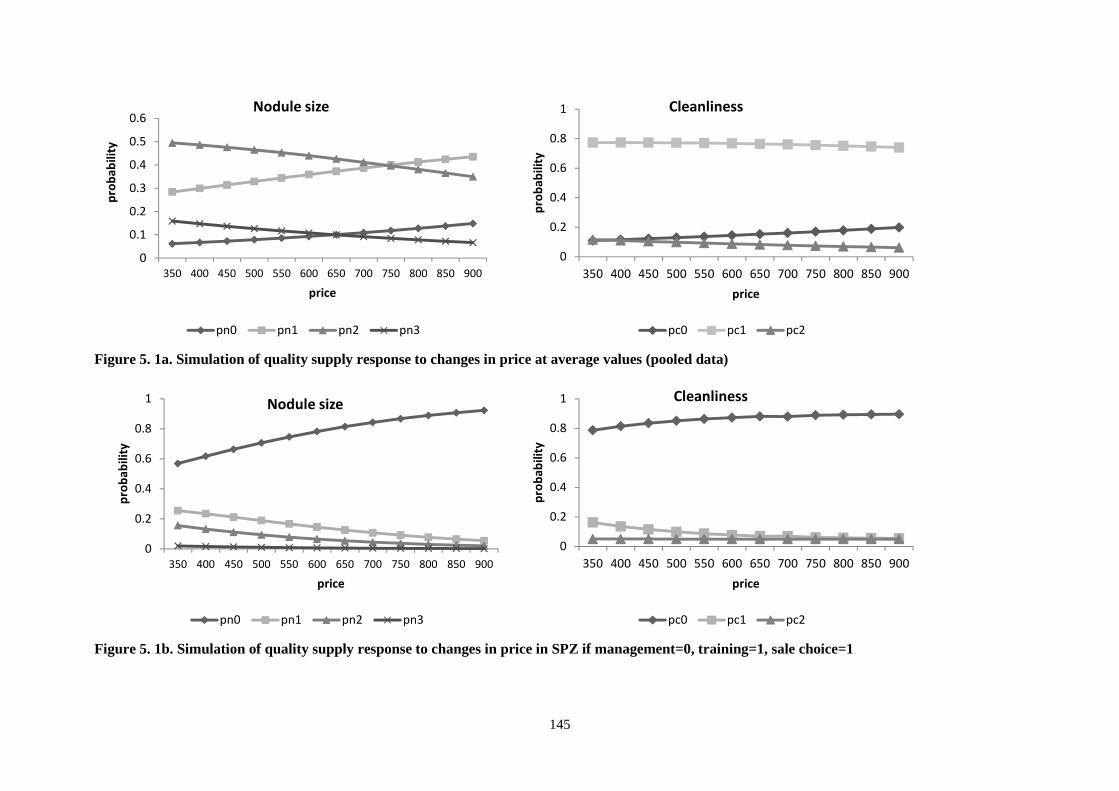
145
Figure 5. 1a. Simulation of quality supply response to changes in price at average values (pooled data)
Figure 5. 1b. Simulation of quality supply response to changes in price in SPZ if management=0, training=1, sale choice=1
0
0.1
0.2
0.3
0.4
0.5
0.6
350 400 450 500 550 600 650 700 750 800 850 900
pro
ba
bil
ity
price
Nodule size
pn0 pn1 pn2 pn3
0
0.2
0.4
0.6
0.8
1
350 400 450 500 550 600 650 700 750 800 850 900
pro
ba
bil
ity
price
Cleanliness
pc0 pc1 pc2
0
0.2
0.4
0.6
0.8
1
350 400 450 500 550 600 650 700 750 800 850 900
pro
ba
bil
ity
price
Nodule size
pn0 pn1 pn2 pn3
0
0.2
0.4
0.6
0.8
1
350 400 450 500 550 600 650 700 750 800 850 900
pro
ba
bil
ity
price
Cleanliness
pc0 pc1 pc2
146
Figure 5. 1c. Simulation of quality supply response to changes in price in ES if management=1, training=1, sale choice=1
pno: probability of supplying nodules that are smaller than 2cm pn1: probability of supplying a few nodules that are smaller than 2 cm pn2: probability of supplying a few nodules that are larger than 2cm pn3: probability of supplying many nodules that are larger than 2cm pco: probability of supplying a few nodules that are clean pc1: probability of supplying about half of the nodules that are clean pc2: probability of supplying many nodules that are clean
0
0.2
0.4
0.6
0.8
1
350 400 450 500 550 600 650 700 750 800 850 900
pro
ba
bil
ity
price
Nodule size
pn0 pn1 pn2
0
0.2
0.4
0.6
0.8
1
1.2
350 400 450 500 550 600 650 700 750 800 850 900
pro
ba
bil
ity
price
Cleanliness
pc0 pc1 pc2
147
At the average values of the explanatory variables in the pooled data, the probability of
supplying low quality (pn0 or pn1 associated with nodules of small size and pc0 associated
with less clean nodules) directly increases with expected price whereas the probability of
supplying high quality (pn2 or pn3 associated with nodules of large size and pc1 or pc2
associated with cleaner nodules) declines with expected price increases. Apart from small
variations, the same results hold for simulations within the SPZ and ES (assuming that
collection is organised in private property in SPZ or communal forests in ES, collectors are
trained, and sales are made to the village shop): as the effect of an increase in expected price
in SPZ, pn0 increases while pn1, pn2 and pn3 decrease, pc0 increases while pc1 and pc2
decrease. In ES, as the effect of an increase in expected price, pn0 and pn1 increase while pn2
decreases, pc0 and pc1 increase while and pc2 decreases.
The simulation results confirm that at high prices, supply of low quality gum increases
whereas when prices are low, the gum supplied is of good quality. These results can be
associated with the effort of the collector towards achieving a certain quality level, his
expected income and competition in communal forests. They can also be explained by the
trader’s behaviour: at a high price, the collectors whose supply of low quality is not rejected
by a trader will continue supplying low quality whereas at the low price, the collectors whose
supply of low quality may be rejected by a trader will have to put more effort to increase
quality at least to a top segment of the gum quality, in order to reach a target income.
5.6 Discussion and conclusion
Linking field assessment to laboratory measurements of quality and then investigating
determinants of quality has led to several interesting findings. First, the results proved the
divergence in quality definition not only between collectors and users but also among the
collectors, and from village to village. Furthermore, it has become apparent that the study of
quality needs to be inclusive of the main stakeholders in order to achieve a common
148
understanding which can then be translated to each stakeholder’s language and be acted upon.
In this study of the quality of gum arabic, it was found that the measured quality was not
always directly in accordance with visible quality attributes in the field. Among visible
attributes, cleanliness (or low mineral matter) is a good indicator of quality. Hence field
assessment was found not to consistently correspond to the user requirements; while bad
quality is identified both on the field and in the laboratory, good quality gum is not always
correctly identified.
Secondly, even if any quality of gum arabic can find usage, it became evident that
collectors should be encouraged to put effort specially in cleaning gum, thereby supplying
their good quality as this would increase the likelihood of obtaining the true good quality on
the basis of invisible attributes. The sensitization of collectors should be accompanied by
price incentives by which high quality is rewarded by a quality premium. As simulation
showed, quality is not stimulated by price but by price differentiation; consequently, in the
situation when quality is not differentiated, producers/collectors are paid a price that is only
associated with low quality (as corresponding to equation (8) in appendix 5A.1). Also Leakey
and Izac (1996) found that non-timber forest products do not get a premium for their physical
or genetic improvement. In case conversion is undertaken to achieve high quality, this
conversion involves a cost which will be in line with the quality premium in efficient supply
chains: while for welfare reasons it is common to suggest that the premium be paid to
producers/collectors to improve their livelihoods, quality conversion could still be performed
by traders who have advantages of economies of scale.
Thirdly, the improvement in quality calls for practices to be respected both in
harvesting and post-harvest handling. Lamien et al. (1996) for instance showed that the non-
respect of harvesting practices and notably the maturity time reduces the quality of the
product. Therefore, even if these practices may not always be directly rewarded as Fafchamps
149
et al. (2008) found, they nevertheless have an effect on the visual attributes such as
cleanliness and size of nodules as we find for gum arabic. Traders are hereby called upon as
their behaviour is rather ambiguous towards the quality attributes. As actors in the supply
chain and intermediaries between the collectors and users, they should have a definition of
quality that is coherent and responsive to the actions and needs of collectors and users
respectively. As quality uncertainties may also negatively affect the price that traders pay,
these traders could play important role on transmission of quality information.
Finally, the current study has strengthened the need to understand the role of forest
(tree and/or land) management on the quality of the gum. Clear rules of management are
needed to counteract the influence of market forces (price) on competition in forests. Forest
management is also a pertinent issue as recurrent competitions may be detrimental to the
resource and lead to degradation.
150
Appendix 5A
5A.1. A theoretical model for quality supply and demand Let the quality of gum be differentiated into low (ungraded) and high quality on the basis of
intrinsic attributes. Suppose producers supply a product with a certain quality, and traders
offer a price, based on demand for this product split into high quality demand and ungraded
quality demand. Let there be two demand curves:
�| = }| − -|�| (1)
�~ = }~ − -~�~ (2)
We expect b� >b�, indicating that at high prices, low quality may suffice (�~ >�|); but
when prices are low, more consumers demand high quality (�� <��).
A trader faces supply of q, which can be split into a quantity of high quality qh, and a
remaining fraction which is sold as low quality. The conversion towards grading and selecting
high quality can – in the simplest approach – be done a fixed cost per unit. If these costs are c,
then we have the following set of equations determining the prices and the quantity converted
into high quality
�| − �~ = � (3)
�| = J| (4)
�~ = J −J| (5)
Exogenous variables are the total quantity produced (q) and the unit conversion costs (c).
With the demand equations (1) and (2), this leads to:
�| = � D⁄ + D~� − J D⁄ (6)
where D = -| + -~ ; � = }| + }~ and D~ = -~ D⁄
J| = }| − D|(� + �-~) + D|J (7)
where β� = b� β⁄
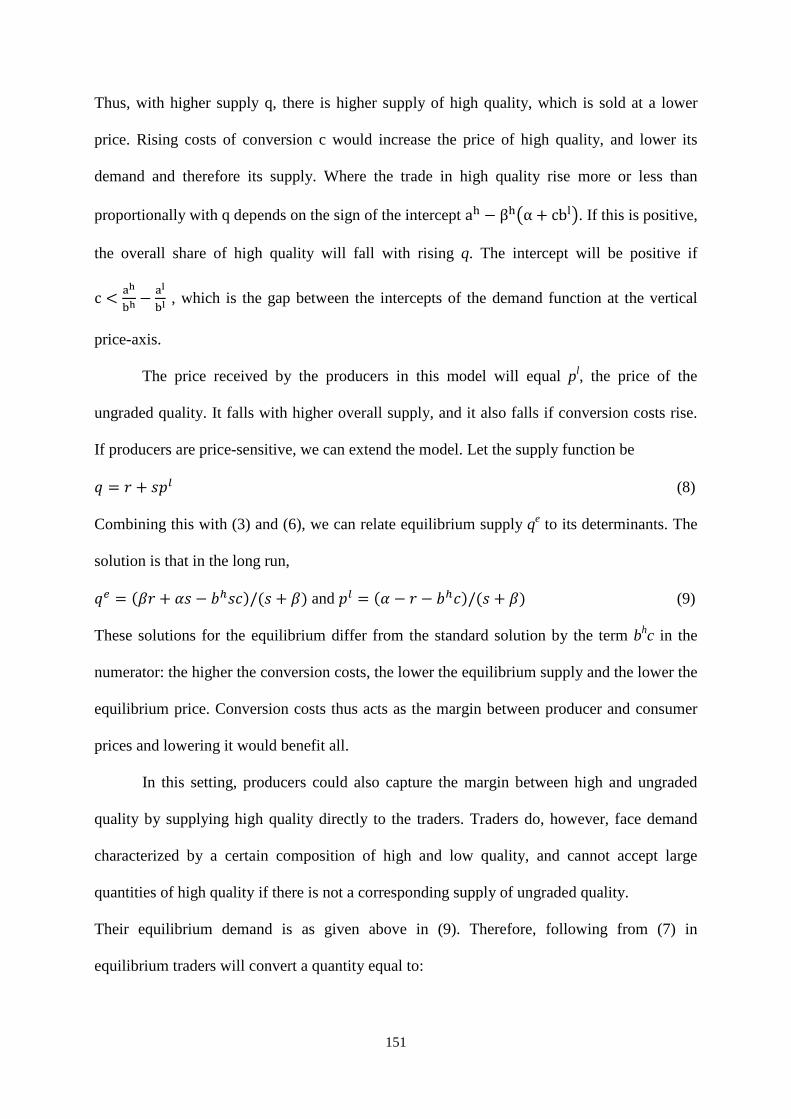
151
Thus, with higher supply q, there is higher supply of high quality, which is sold at a lower
price. Rising costs of conversion c would increase the price of high quality, and lower its
demand and therefore its supply. Where the trade in high quality rise more or less than
proportionally with q depends on the sign of the intercept a� − β�/α + cb�2. If this is positive,
the overall share of high quality will fall with rising q. The intercept will be positive if
c < ���� − ���� , which is the gap between the intercepts of the demand function at the vertical
price-axis.
The price received by the producers in this model will equal pl, the price of the
ungraded quality. It falls with higher overall supply, and it also falls if conversion costs rise.
If producers are price-sensitive, we can extend the model. Let the supply function be
J = $ + 1�~ (8)
Combining this with (3) and (6), we can relate equilibrium supply qe to its determinants. The
solution is that in the long run,
J� = (D$ + �1 − -|1�)/(1 + D) and �~ = (� − $ − -|�)/(1 + D) (9)
These solutions for the equilibrium differ from the standard solution by the term bhc in the
numerator: the higher the conversion costs, the lower the equilibrium supply and the lower the
equilibrium price. Conversion costs thus acts as the margin between producer and consumer
prices and lowering it would benefit all.
In this setting, producers could also capture the margin between high and ungraded
quality by supplying high quality directly to the traders. Traders do, however, face demand
characterized by a certain composition of high and low quality, and cannot accept large
quantities of high quality if there is not a corresponding supply of ungraded quality.
Their equilibrium demand is as given above in (9). Therefore, following from (7) in
equilibrium traders will convert a quantity equal to:

152
J�| = }| − D|�-~ +-| �6%6W��%%,W (10)
The higher the conversion cost, the lower will be the quantity of high quality converted by the
trader. The conversion cost per unit of product may fall through economies of scale.
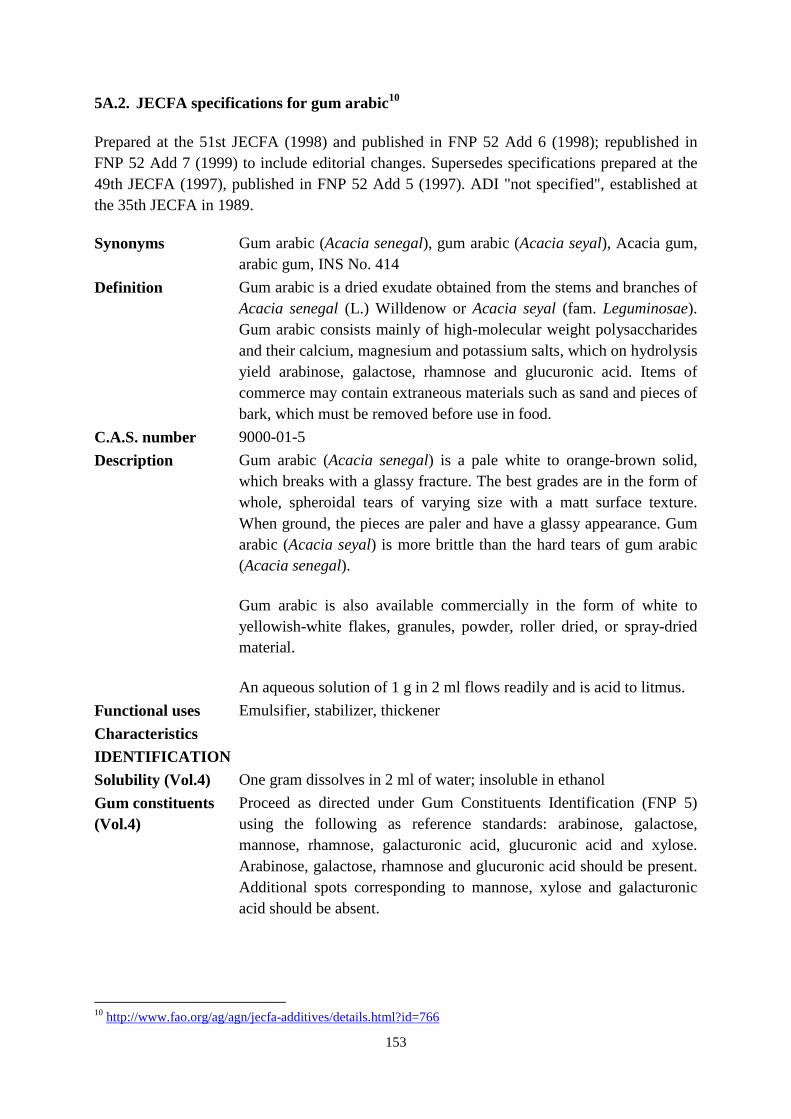
153
5A.2. JECFA specifications for gum arabic10 Prepared at the 51st JECFA (1998) and published in FNP 52 Add 6 (1998); republished in FNP 52 Add 7 (1999) to include editorial changes. Supersedes specifications prepared at the 49th JECFA (1997), published in FNP 52 Add 5 (1997). ADI "not specified", established at the 35th JECFA in 1989.
Synonyms Gum arabic (Acacia senegal), gum arabic (Acacia seyal), Acacia gum, arabic gum, INS No. 414
Definition Gum arabic is a dried exudate obtained from the stems and branches of Acacia senegal (L.) Willdenow or Acacia seyal (fam. Leguminosae). Gum arabic consists mainly of high-molecular weight polysaccharides and their calcium, magnesium and potassium salts, which on hydrolysis yield arabinose, galactose, rhamnose and glucuronic acid. Items of commerce may contain extraneous materials such as sand and pieces of bark, which must be removed before use in food.
C.A.S. number 9000-01-5
Description Gum arabic (Acacia senegal) is a pale white to orange-brown solid, which breaks with a glassy fracture. The best grades are in the form of whole, spheroidal tears of varying size with a matt surface texture. When ground, the pieces are paler and have a glassy appearance. Gum arabic (Acacia seyal) is more brittle than the hard tears of gum arabic (Acacia senegal).
Gum arabic is also available commercially in the form of white to yellowish-white flakes, granules, powder, roller dried, or spray-dried material.
An aqueous solution of 1 g in 2 ml flows readily and is acid to litmus.
Functional uses Emulsifier, stabilizer, thickener
Characteristics
IDENTIFICATION
Solubility (Vol.4) One gram dissolves in 2 ml of water; insoluble in ethanol
Gum constituents (Vol.4)
Proceed as directed under Gum Constituents Identification (FNP 5) using the following as reference standards: arabinose, galactose, mannose, rhamnose, galacturonic acid, glucuronic acid and xylose. Arabinose, galactose, rhamnose and glucuronic acid should be present. Additional spots corresponding to mannose, xylose and galacturonic acid should be absent.
10 http://www.fao.org/ag/agn/jecfa-additives/details.html?id=766
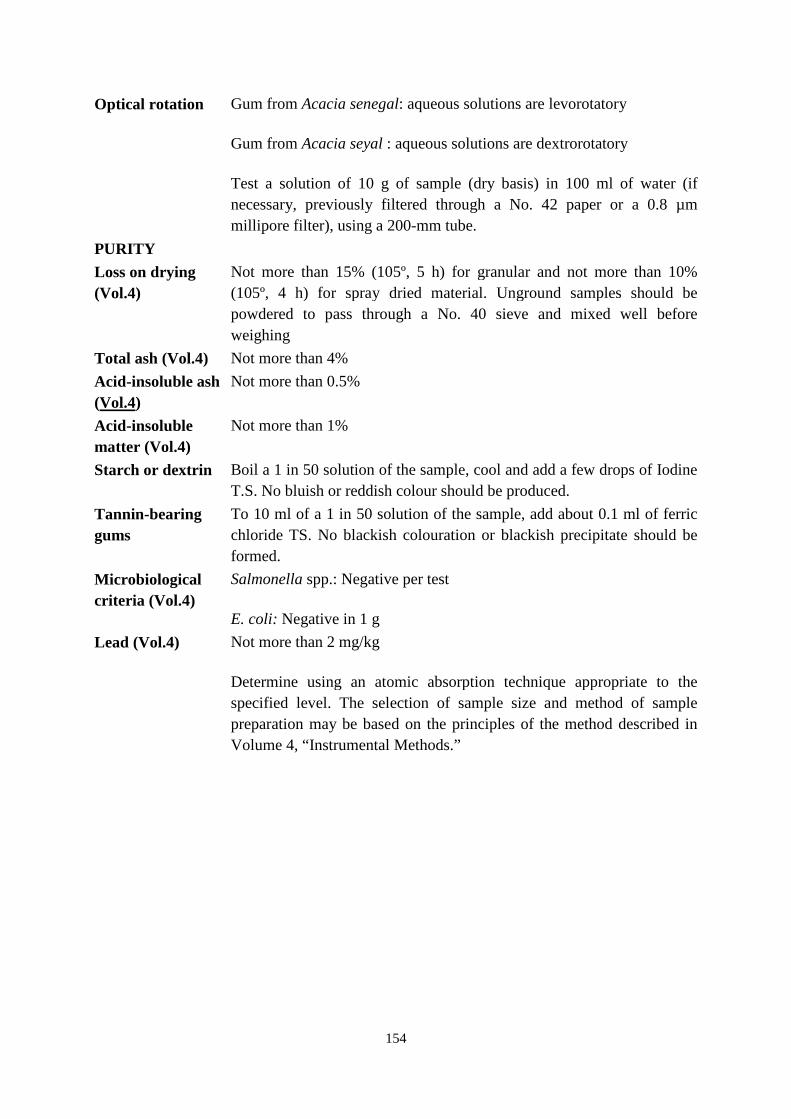
154
Optical rotation Gum from Acacia senegal: aqueous solutions are levorotatory
Gum from Acacia seyal : aqueous solutions are dextrorotatory
Test a solution of 10 g of sample (dry basis) in 100 ml of water (if necessary, previously filtered through a No. 42 paper or a 0.8 µm millipore filter), using a 200-mm tube.
PURITY
Loss on drying (Vol.4)
Not more than 15% (105º, 5 h) for granular and not more than 10% (105º, 4 h) for spray dried material. Unground samples should be powdered to pass through a No. 40 sieve and mixed well before weighing
Total ash (Vol.4) Not more than 4%
Acid-insoluble ash (Vol.4)
Not more than 0.5%
Acid-insoluble matter (Vol.4)
Not more than 1%
Starch or dextrin Boil a 1 in 50 solution of the sample, cool and add a few drops of Iodine T.S. No bluish or reddish colour should be produced.
Tannin-bearing gums
To 10 ml of a 1 in 50 solution of the sample, add about 0.1 ml of ferric chloride TS. No blackish colouration or blackish precipitate should be formed.
Microbiological criteria (Vol.4)
Salmonella spp.: Negative per test
E. coli: Negative in 1 g
Lead (Vol.4) Not more than 2 mg/kg
Determine using an atomic absorption technique appropriate to the specified level. The selection of sample size and method of sample preparation may be based on the principles of the method described in Volume 4, “Instrumental Methods.”
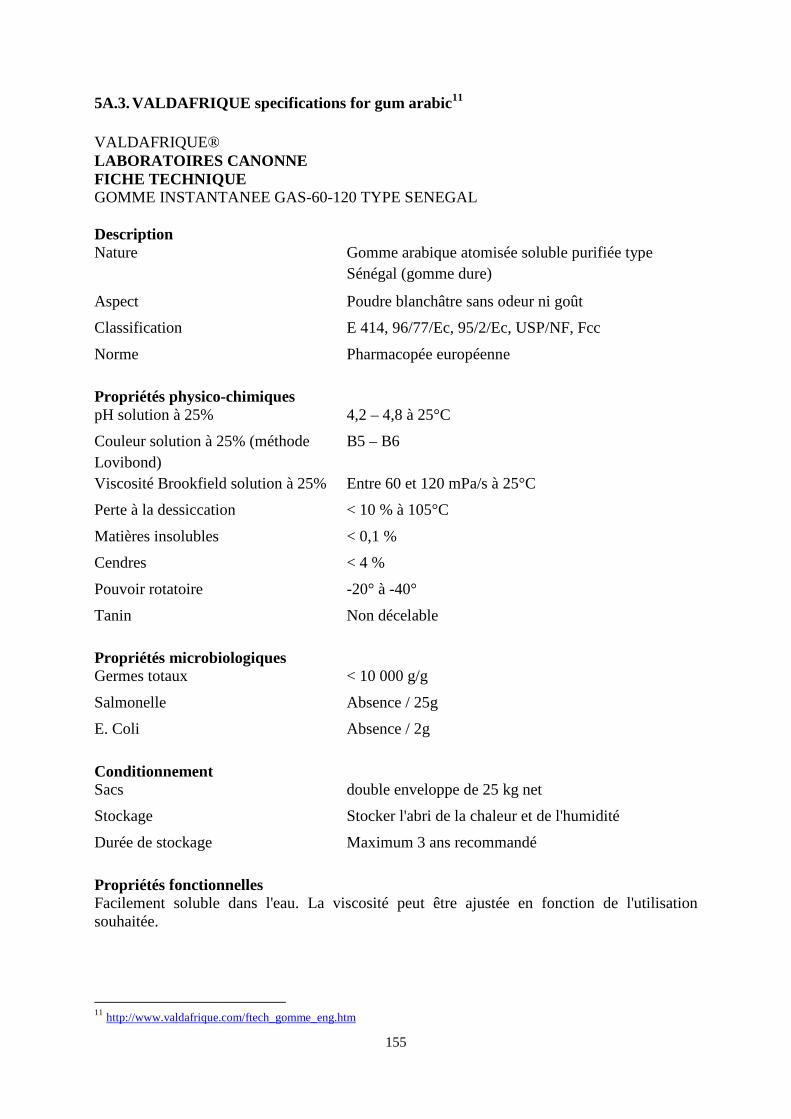
155
5A.3. VALDAFRIQUE specifications for gum arabic11 VALDAFRIQUE® LABORATOIRES CANONNE FICHE TECHNIQUE GOMME INSTANTANEE GAS-60-120 TYPE SENEGAL Description Nature Gomme arabique atomisée soluble purifiée type
Sénégal (gomme dure)
Aspect Poudre blanchâtre sans odeur ni goût
Classification E 414, 96/77/Ec, 95/2/Ec, USP/NF, Fcc
Norme Pharmacopée européenne
Propriétés physico-chimiques pH solution à 25% 4,2 – 4,8 à 25°C
Couleur solution à 25% (méthode Lovibond)
B5 – B6
Viscosité Brookfield solution à 25% Entre 60 et 120 mPa/s à 25°C
Perte à la dessiccation < 10 % à 105°C
Matières insolubles < 0,1 %
Cendres < 4 %
Pouvoir rotatoire -20° à -40°
Tanin Non décelable
Propriétés microbiologiques Germes totaux < 10 000 g/g
Salmonelle Absence / 25g
E. Coli Absence / 2g
Conditionnement Sacs double enveloppe de 25 kg net
Stockage Stocker l'abri de la chaleur et de l'humidité
Durée de stockage Maximum 3 ans recommandé
Propriétés fonctionnelles Facilement soluble dans l'eau. La viscosité peut être ajustée en fonction de l'utilisation souhaitée.
11 http://www.valdafrique.com/ftech_gomme_eng.htm
156
Private versus communal tenure systems in gum arabic collection
Abstract
Communal management systems of acacia stands are still prominent in the semi-arid gum
producing areas. Competition in the plots leads to lower quantities per household and
compared with private access systems, the gum collected is of lower quality. These communal
systems also decrease the collectors’ incentives for tree management, may lead to
overexploitation and even be sources of conflict over resources. Private systems are emerging
in some villages either at the individual level or through companies; in a gradual transition,
mixed systems are found in which privately owned properties and communal forests co-exist.
This study investigates factors that influence the currently observed transition from communal
to private collection systems at the village level. We derive a theoretical model to show the
advantages of either system in relation to population density and tree productivity. Using data
from 53 villages in Senegal, a probit model is used to analyse the choice of organising
collection in communal systems or mixed systems and a fractional logit model explains the
gradient of transition in systems of collection. Mixed system are preferred if resource is
available, markets are developing, labour for collection is available, competition for resource
is high, forests where gum is collected are located near to the village, or market prices are
high enough to attract occasional collectors who reinforce the effect of competition.
Keywords: resource governance, evolution, transition, fractional logit, gum arabic.
6.1 Introduction
Theories of transition in farming systems suggested on the one hand, that the shift to
agriculture/animal husbandry was due to decreasing productivity in hunting and gathering
production systems (Grigg, 1974; Jones, 2001); the causes of decreasing productivity include
increased population pressure and sedentism, and the resulting overexploitation of the
environment. Technological progress was hence regarded as pushing the shift to agriculture
157
(Grigg, 1974; Myers and Marceau, 2006). Environment is also among the recognised factors
of change; Layton et al. (1991) suggested that climatic change pushed the shift from hunting
and gathering to intensive husbandry. An interplay between population pressure and
technological sophistication in explaining the adoption of agriculture was suggested by Baker
(2008) following the theories developed by Boserup. According to him, societies that practice
agriculture are indeed more technologically sophisticated, have greater population densities
and operate in environments which appear to be richer and more amenable to agriculture.
Specific to animal husbandry, besides the influence of the above factors, animal
domestication was driven by resource conservationism (Alvard and Kuznar, 2001). Resource
conservation is also one the main reasons for domesticating forest trees but their morphology
may be a constraint to its adoption especially for thorny trees such as Acacia senegal (Mallet
et al., 2002).
Changes in farming systems, animal husbandry or tree domestication were almost
always accompanied by a change in resource governance from open to exclusive property
rights system. North and Thomas (1977) confirmed that the private system provided a direct
incentive for innovation in order to improve efficiency. According to Ruttan (1989, 2002), the
change in governance systems originates both from the demand for and supply of institutions.
On the demand side, changes in factor productivity and product demand; and on the supply
side, distribution of political resources, cost of achieving social consensus and cultural
endowments (e.g., ideology and religion) could explain the change in institutions. Ruttan
(2002) gave examples of the enclosure movement in England during the 15th and 16th
centuries whereby the expansion in the export demand for wool required the conversion of
open arable and common lands to private pastures. Also, an increase in the demand for rice in
Thailand in 19th century made investments in land development for rice production profitable.
This induced a demand for the reform of property rights. Note that authors like Cohen and
158
Weitzman (1974) however dispute the wool trade story as a factor of enclosures, arguing that
the opposite was the case. What is important here is to realize the contribution of market
developments to the dynamics of transition by adding value to the resource and motivating
decisions to enforce property rights which are necessary to give individuals the long-term
incentives to invest in resources and use them efficiently (Demsetz, 1967; Alchian and
Demsetz, 1972; Behnke, 1997). Another source of institutional change includes land scarcity.
Production in agriculture can be increased from expansion in land area by deforestation which
however reduces the stock of natural resources; as continued population pressure constrains
the availability of land, a formalisation of land ownership becomes a requirement in order to
undertake investments so that the land productivity can be increased (Ruttan, 1989;
Quisumbing and Otsuka, 2001; Grimm and Klasen, 2009).
Similar to farming, market developments and higher demand or prices provide
incentive for increasing the production of non-timber forest product. According to Belcher
and Schrekenberg (2007), higher production can be achieved through intensive or extensive
harvesting or by intensified management. Intensive harvesting to obtain more product per unit
area may lead to over-exploitation of the species and a decline in resource base depending on
the resource tenure system and the reproductive capacity of the resource: in conditions of
open access and common management, increased value leads to uncontrolled competition for
resources, inefficient and damaging harvesting through the pressure to harvest immature
product, or harvest beyond sustainable levels with the explanation that another person would
harvest the product. Marshall et al. (2006) support that in such circumstances, profits for
harvesters are pushed to the minimum. Extensive harvesting implies the possibility of
extending the area under collection which can happen when competition for the resource and
hence pressure are low. In situations where the resource base is limiting and the competition
among harvesters is too high, intensified management (such as cultivation or tree
159
domestication) is the only option for increasing the quantity of production. Intensified
management can also give better quality products and more control over the timing of
production. Hence, as demand or prices increase, the rewards for intensified management also
increase. Intensive production is possible where producers have access to individually held
land or trees or if the resource is held under communal tenure with clear management rules.
From the above review, private property is always presumed to be efficient and to
increase production whereas open resource management is found not only to decrease the
producers’ incentives for resource management, but also to lead to overexploitation and cause
conflicts over resources (e.g., Hardin, 1968; Dafinger and Pelican, 2006). The question
remains however that if the private property system is recommendable, why are there still
several cases where communal and open systems are preferred? In other words, it is pertinent
to understand reasons behind the slow transition to private property. To answer this question,
an exogenous context is needed whereby the influence of factors such as population pressure,
market, resource availability (land or trees) on resource governance systems can be
investigated. Gum collection in Senegal provides a relevant study case: the currently observed
slow transition from communal to private collection systems helps us to analyse why
communal systems continue to exist despite that competition may intensify in communal plots
and decrease the individually collected quantity (in chapter 3) and that these communal
systems directly have negative consequences on the quality of gum collected (in chapter 5).
As collection is mostly done through tapping (the collector makes a cut to the tree and
returns to the tree several days later to harvest the gum that has exuded), the collector should
hold certain ownership or user rights to the tree and/or property such that he has certainty to
find the gum; hence private collection systems would generally emerge together with tapping.
These private systems also provide an incentive to plant and manage trees as suggested by
agroforestry literature (e.g., Fortmann, 1985; Wiersum, 1997). In Senegal, however, even if
160
tapping has been performed as early as the 18th century, the communal system of management
of Acacia plantations is still prominent. Private systems slowly emerge in some gum
producing villages where collectors or companies (e.g., Asylia Gum Company) can have
ownership of forest plots12. In such gradual transition, mixed systems are found where
privately owned properties and communal forests coexist. We examine whether the transition
in systems of gum collection may be explained by the expansion of the market for gum
arabic, competition in and for property, or resource availability.
In the next section, we present an account of the historical evolution of the gum arabic
collection systems. A methodology section then follows where we first develop a model
showing the household’s behaviour in different collection governance systems and secondly
present an empirical strategy of analysing factors that influence the choice of collection
systems. Subsequently results are presented. In the last section we discuss these results, and
present conclusions.
6.2 Brief historical evolution of the gum arabic collection systems in Senegal
Gum collection in West Africa was practiced as early as the 15th century when Muslim
merchants (Trarza emirs in Southwest Mauritania) used to send slaves into forests to collect
gum either as organized slave groups or as part of their daily labour; these emirs tightly
controlled trade with the Djolof (an area which is part of the current Sylvopastoral zone in
Senegal) (Freudenberger, 1993a; Webb, 1985, 1995). Until the 18th century, wild collection
prevailed in the Djolof, and it is only during the 19th century that the black maures (from
Mauritania) introduced tapping and showed the use of bush fire to induce higher yields from
Acacia senegal trees. With the colonisation, the French administration built an infrastructure
of roads, wells and railroad in an effort to draw Wolof cultivators and fulbe pastoralists into
gum collection: villages were coerced to collecting gum through debt peonage by European
12 A distinction was not made between land rights and tree rights because it is not evident that they are substitutes (see for e.g. Bruce and Fortmann (1999) for cases when tree rights substitute for land rights).
161
merchants in which villagers were required to pay back in terms gum arabic the loans granted
at usurious rates. By the 1910s, gum arabic had become one of the principal cash crops
exchanged for over-valued imported items such as fabrics. Hence Acacia senegal rapidly
evolved from being a user-value species, long employed by the fulbe and wolof for livestock
forage and timber, into an exchange-value species highly esteemed for the readily marketable
gum (Webb, 1985).
According to Freudenberger (1993a), the expansion of the market for gum arabic
stimulated a transformation in labour relations and in the tree tenure systems that determined
access rights and resource management practices: the wolof nobility was granted access to the
areas with the densest concentration of Acacia senegal and hired the black maures to harvest
and transport gum to the market centres; the wolof farmers collected gum in a second zone
found primarily around the villages of the Senegal river valley, here heads of lineages
received gum collection rights from the chief and then allocated subsections to relatives and
dependents. Surprisingly, the maures were also granted access to the forests in the far north-
eastern of the Djolof through seasonal collection rights. This was achieved through the
intervention of Muslim clerics who in turn received tithes in form of the collected gum.
In the 1930’s, French hydrologists discovered the Maestrichian aquifer which enabled
the construction of boreholes. As a consequence, pastoralists changed their transhumance
patterns in the dry season and settled around these boreholes and their presence in the zone
attracted them to gum collection: young fulbe herders could furtively collect gum nodules
after the maures had tapped their trees (Freudenberger, 1993a,b; ISRA/BAME, 1999).
Moreover, while pastoralism by transhumant fulbe was previously complementary to gum
collection by maures along the seasonal patterns, competition over gum resources ensued
especially as the settled fulbe also took on gum collection. The competition increased even
more during the Great sahelian drought of 1968-1974 that decimated the livestock;
162
pastoralists took collection as a coping strategy (Adriansen 1999; Wane et al., 2006). Conflict
over the forest areas followed and the fulbe were granted collection rights on trees found
within the immediate vicinity of their scattered encampments. Maures migrated to the south-
eastern part of Linguère (in SPZ) were they pioneered gum collection. There, they were in
competition over land with wolof agriculturalists. Continued mobility of collectors in search
for trees and land lead to the spread of gum collection farther to Eastern Senegal. However,
the decrease in international prices of gum arabic in the 1990s resulted in a decline of gum
collection to a marginal activity, used as a survival strategy (Adriansen 2006, Freudenberger,
1993a).
The historical overview of gum collection in the Sylvopastoral zone reflects the
involvement of different ethnic groups through their establishments and economic activities,
differences in collection rights, and market pressures. It has also shown problems associated
with competition over resources induced changes in collection systems, based on ethnicity
and movement. The boxes illustrate such process of change towards the current collection
systems where we observe not only the traditional communal collection but also a trend
towards privatisation by division of the area into individualised family plots and formal
acquisition of private plots.
Illustration 1. Louguéré Thioly, Sylvopastoral Zone
Lougéré Thioly was formed around 1920 by migrant fulbe pastoralists who found a water
pond and pastures and camped in the area. In 1950s with the construction of a borehole
(DPS, 2005), the pastoralists were joined by wolof agriculturists. The borehole facilitated
sedentism; occasional livestock migrations only occur during the dry season towards the
southern Fouta. Cultivators who grew millet during the rainy season were the first to
discover the importance of Acacia senegal using its bark as ropes for tying their sacks of
millet. In decorticating the tree off its bark, these cultivators noticed the gum oozing from

163
the tree. They collected and sold it to traders who passed by the village in search of water.
The gum attracted not only the attention of agriculturalist, but also of pastoralists and later
of the maures who were professional gum collectors. The maures settled in and they would
go into the forest, tap trees and collect gum until the end of the season. While forests were
open to collection by anybody, the increased number of collectors led to the division of
forests into individualised plots according to the size of the family. In this division,
markings were made on trees such that each mark would be associated with a single family;
a family could have several plots. Such markings ushered in privatised systems with clear
distribution of plots and recognised exclusion rights. Theft cases were referred to authorities.
However, these markings confer only seasonal or at the most lifetime ownership; permanent
ownership is only conferred by legal registration. Nevertheless, as competition over land is
not excessive, the need for registration has not yet arisen.
(Recorded in Louguéré Thioly, 15-03-2010)
Illustration 2. Kadiel, Eastern Senegal
In the old times, agriculture used to be the main economic activity in Kadiel. But due to
declining soil productivity resulting from degradation, the agro-pastoral system is now
common practice in the village; it is supplemented by gum exploitation. There are about 30
gum collectors in the village. They collect mainly from natural forests; but there are also
plantations by past tree planting projects such as PROVOBIL (Projet de Boisement
Villageois) (Dione and Sall, 1988) and private initiatives (e.g., Tijaane, a Muslim
community, planted more than 2000 seedlings); some collectors have even started
plantations on their own land properties whereas other collectors obtained portions of the
forests through formal requests from the rural community administration.
There are different management systems of the above properties: owners of private plots are
able to exclude collectors who are not their relatives with the advantage of having
164
permanent control over the use of the product and appropriation of the income realized from
collection. The common forests/plantations are so large that rules of collection have to be
agreed upon by six other villages that also have access to these forests/plantations.
Within the coverage of Kadiel, an informal division of the forest exists, however, there are
many cases of theft when a collector deliberately crosses the limits of his ‘property’ to
harvest gum from another person’s property. Such conflict cases are generally resolved
within the village. Private properties seem to produce more gum than common property.
Soil degradation and bushfires are the main problems faced by the village; they lead to
declines in tree density and production.
(Recorded in Kadiel, 16-04-2010)
6.3 Methodology
The above historical trend and illustrations show that a change is slowly taking place in
systems of governance of gum arabic collection. The change is not however spontaneous; it is
part of a decision that involves an optimization of utility from collection. Such decision is
theoretically modelled in terms of the number of trees and distance between them,
competition in labour time between collection and leisure, and competition over resources.
Beshai (1984) believed in the existence of resource excess capacity such that collection only
depends on the intensity of effort and there is no diminishing marginal productivity. We
hereby show that the utility of a collector reduces if there is competition from others
especially when collection is unregulated.
A model of gum arabic collection
Consider first a single household in a setting without competition. Let production per tree be
dependent on the labour per tree:
= (ℓ), say ℓ�, with 0 < � < 1 (1)
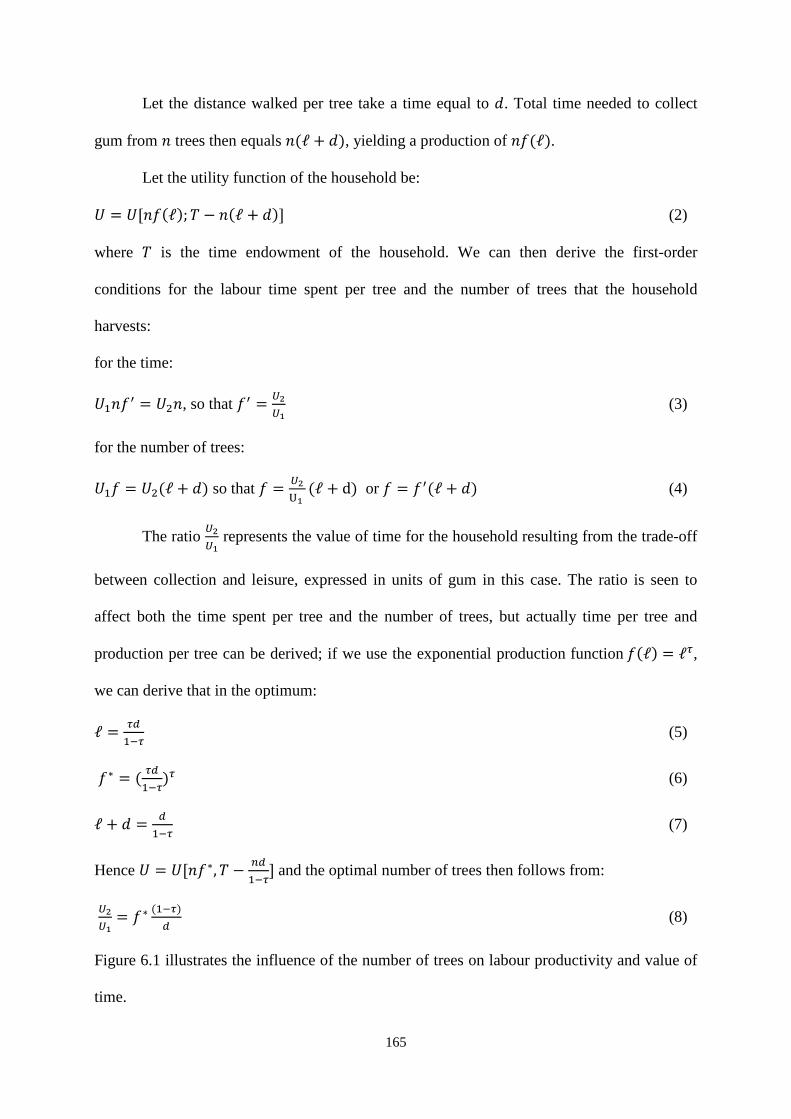
165
Let the distance walked per tree take a time equal to �. Total time needed to collect
gum from � trees then equals �(ℓ + �), yielding a production of �(ℓ). Let the utility function of the household be:
B = B[�(ℓ); � − �(ℓ + �)] (2)
where � is the time endowment of the household. We can then derive the first-order
conditions for the labour time spent per tree and the number of trees that the household
harvests:
for the time:
B'�� = B(�, so that � = �.�d (3)
for the number of trees:
B' = B((ℓ + �) so that = �.�d (ℓ + d) or = �(ℓ + �) (4)
The ratio �.
�d represents the value of time for the household resulting from the trade-off
between collection and leisure, expressed in units of gum in this case. The ratio is seen to
affect both the time spent per tree and the number of trees, but actually time per tree and
production per tree can be derived; if we use the exponential production function(ℓ) = ℓ�,
we can derive that in the optimum:
ℓ =��
'6� (5)
∗ = (��
'6�)� (6)
ℓ + � =�
'6� (7)
Hence B = B[�∗, � −+�
'6�] and the optimal number of trees then follows from:
�.
�d= ∗
('6�)
� (8)
Figure 6.1 illustrates the influence of the number of trees on labour productivity and value of
time.
166
Figure 6. 1. Labour productivity and value of time
The marginal product of labour (�) in the optimum tends to be lower if trees are farther apart
(at large �, more time is spent per tree). As normally the value of time is a positive function
of �, the optimal number of trees will be smaller for larger distances.
For a simple Cobb-Douglas utility function B = ?�(� − 0)9, where ? is income and 0 is time spent in collection, it is straightforward to derive that the optimal number of trees
would be:
� = ��(�,9)(ℓ,�) or �('6�)�(�,9)� (9)
This equation shows that the number of trees picked increases if the household has more time
available, attaches more value to income (parameter }), or less to leisure (-), or the forest is
more dense (lower d).
If the household would not have � as income ?, but other sources of income too, say
�, then the expression for optimal � changes to:
� = �('6�)�69�� �∗⁄(�,9)� (10)
in which the relative importance of other income, expressed as ��∗ , induces the household to
spend less time in collection.
B(B'
’}01&}���’}0�}$���
�, �.�d
�

167
More households with competition for trees
If there are more households collecting gum, and the total optimally chosen number of trees
of the households exceeds the total number of available trees, two options arise to regulate
competition as of privatisation of the resource or to let competition follow from unregulated
collection.
In the privatization process, trees are allocated to households. Typically, if we have &
households (presumed identical) that optimally would each exploit �∗ trees, a case may arise
that &. �∗ > �, the total number of trees available. Privatization would then entail a division
of the � trees over the m households, each receiving � = a�. This implies that an individual
household will collect less than the optimal number of trees, and the only optimizing variable
is the amount of time it will spend in collection. Thus only the first of the first-order
conditions will apply. The restricted lower level � will imply that the ratio �.�d will be lower,
leading to a lower shadow price for the labour of the household, and (using (3)) somewhat
lower marginal product of labour �, implying that more time per tree is spent.
In the example of a Cobb-Douglas utility function, the optimum with a restricted value
for n is given by:
ℓ = (�+ − �) ( 9�� + 1)n (11)
This expression is different from what we had before in (5). In the unrestricted case of a
single household, time spent per tree increased with distance, and the adjustment was made in
the number of trees (�∗ falls if � increases). In the restricted case, larger distances between
the trees induce the household to spend less time per tree so that the household can visit the
given number of trees. Total time spent in the optimal case (and the simple Cobb-Douglas
function) would be +∗�'6�, with �∗ as shown above in (9), or optimal labour equal to
���,9 − �. In
the restricted privatized case, total labour time for gum picking comes at ���,9+���,9 . From this,
168
the corresponding utility can be derived. This case applies where the community responds to
competition by regulating access and dividing the trees equally amongst collectors.
Suppose there is an exogenous factor � that affects the productivity of labour such as
making a good collection in a year if � > 1 or bad collection if � < 1. The production per tree
is thus = λ(ℓ). This factor does not have any effect on the household’s value of time but
leads to new equations for the optimal number of trees in the unrestricted case and optimal
labour in the restricted, privatized case respectively as:
� = ��(�,9)(�ℓ,�) (12)
ℓ = � +⁄ 6�(9 ��⁄ ,')� (13)
This implies that in a good year, the collector needs to harvest fewer trees or spend less time
in collection (for e.g., harvesting from nearby branches) whereas the reverse would happen in
a bad year.
Furthermore we can extend the case of regulation to include a monitoring cost. The
process of entering into privatisation itself involves a cost to reach an agreement as to how to
divide the area. Additional costs are fixed (e.g., investment in fencing or lump sum payment
to a third-party to assure protection of trees) and variable (labour for monitoring). Suppose
that the household pays a fixed cost G out of his income ?. Then the expression for optimal
labour becomes:
ℓ = ���+(�,9)6(9F �∗⁄ ) (14)
The household utility falls with increasing cost of privatisation and due to the relative cost F�∗,
the household has to spend more time in collection.
169
Unregulated access with competition
The unregulated case is elaborated to allow for competition even when trees are still
abundant. It reflects the possibility that households can hinder one another by (deliberately or
not) harvesting trees that are also visited by other households. Hence, we model this case as if
households randomly select trees, for each tree covering a distance �, and collect gum from
the tree if it is there. If another household had selected this tree before, no gum is there and
the time costs � are made without returns to this effort.
Let there be & households interested in gum collection, all presumed identical. The
first trees selected (out of � trees) will bring each household gum, = (ℓ). The effort
involved is � + ℓ. The trees selected form a share � of all trees � = �a. The second collection
round costs � again, but a share � of the trees visited will bear no gum anymore. A share
1 − � will be picked with an effort ℓ again. Hence production is (1 − �)(ℓ); effort is
� + (1 − �)ℓ. The ��| round will require an effort of � + (1 − �)+6'ℓ with a harvest of
(1 − �)+6'(ℓ). In total, therefore, picking � trees will require �� plus the sum of the
picking efforts which is �ℓ with:
� = ∑ (1 − �)+6'� = = '6('6�)b� (15)
Each household then maximizes utility B = B(?, � − 0) with ? being the gum collected equal
to �(ℓ) and 0 being the time spent in collection equal to �ℓ + ��. First-order condition for a
maximum of B[�(ℓ), � − (�ℓ + ��)] for ℓ is that:
B'�� = B(� or � =�.�d (16)
First-order condition for � requires differentiation of:
� �+ = − '� (1 − �)+ ln(1 − �) = ¢ (17)
The condition for optimal � then becomes:
B'¢ = B((¢ℓ + �) (18)
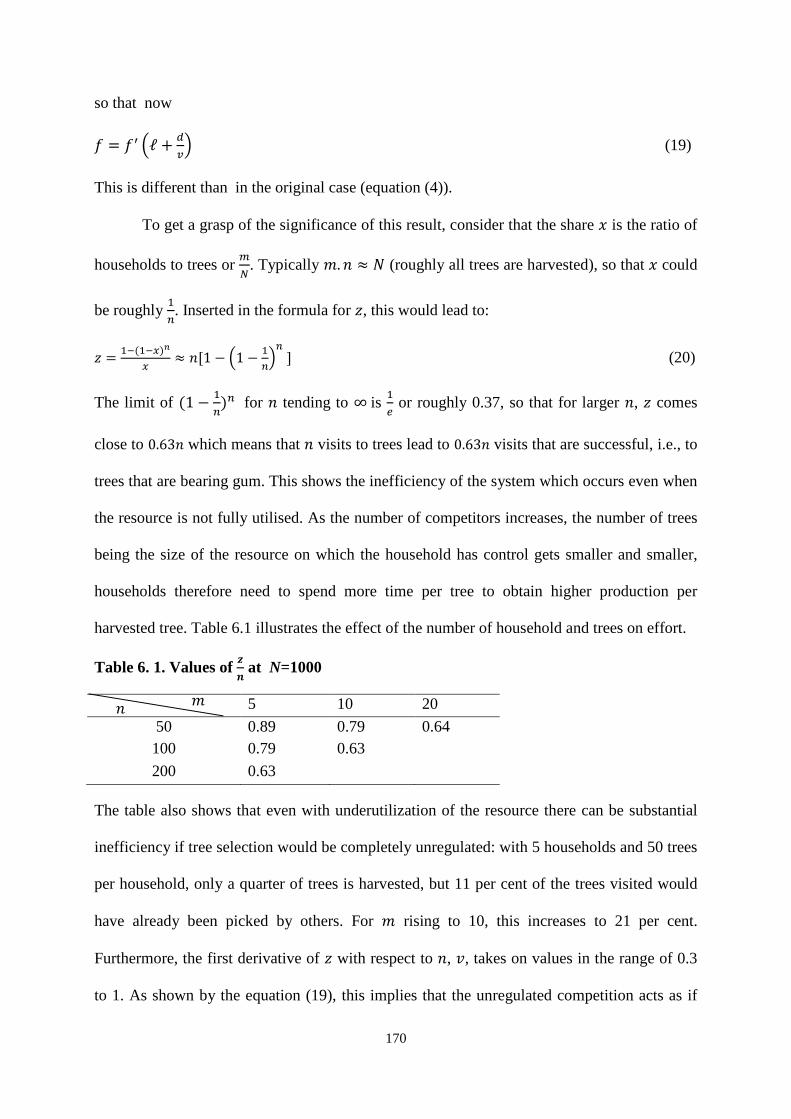
170
so that now
= � Yℓ + ��Z (19)
This is different than in the original case (equation (4)).
To get a grasp of the significance of this result, consider that the share � is the ratio of
households to trees or �a. Typically &. � ≈ � (roughly all trees are harvested), so that � could
be roughly '+. Inserted in the formula for �, this would lead to:
� = '6('6�)b� ≈ �[1 − Y1 − '+Z+] (20)
The limit of (1 − '+)+ for � tending to ∞is '� or roughly 0.37, so that for larger �, � comes
close to 0.63� which means that � visits to trees lead to 0.63� visits that are successful, i.e., to
trees that are bearing gum. This shows the inefficiency of the system which occurs even when
the resource is not fully utilised. As the number of competitors increases, the number of trees
being the size of the resource on which the household has control gets smaller and smaller,
households therefore need to spend more time per tree to obtain higher production per
harvested tree. Table 6.1 illustrates the effect of the number of household and trees on effort.
Table 6. 1. Values of ¦§ at N=1000
5 10 20
50 0.89 0.79 0.64 100 0.79 0.63
200 0.63
The table also shows that even with underutilization of the resource there can be substantial
inefficiency if tree selection would be completely unregulated: with 5 households and 50 trees
per household, only a quarter of trees is harvested, but 11 per cent of the trees visited would
have already been picked by others. For & rising to 10, this increases to 21 per cent.
Furthermore, the first derivative of � with respect to �, ¢, takes on values in the range of 0.3
to 1. As shown by the equation (19), this implies that the unregulated competition acts as if
� &
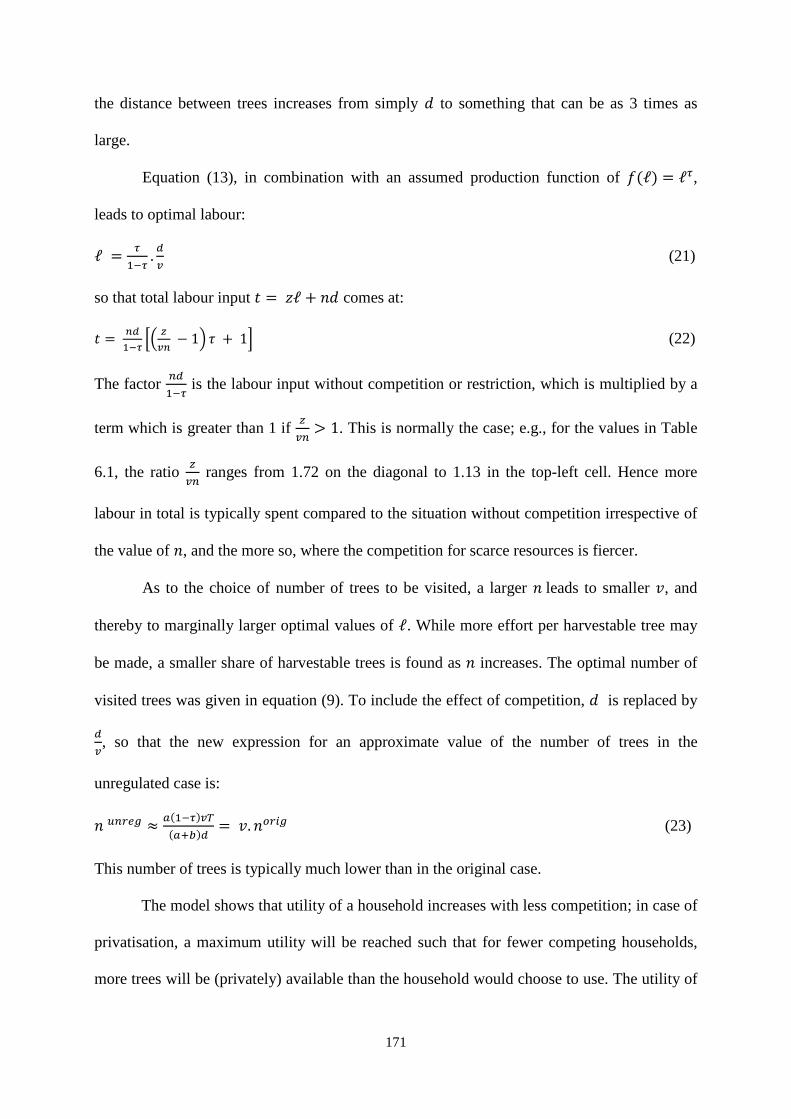
171
the distance between trees increases from simply � to something that can be as 3 times as
large.
Equation (13), in combination with an assumed production function of (ℓ) = ℓ�, leads to optimal labour:
ℓ = �'6� . �� (21)so that total labour input 0 = �ℓ + �� comes at:
0 = +�'6� ;Y �+ − 1Z � + 1< (22)
The factor +�'6� is the labour input without competition or restriction, which is multiplied by a
term which is greater than 1 if �+ > 1. This is normally the case; e.g., for the values in Table
6.1, the ratio �+ ranges from 1.72 on the diagonal to 1.13 in the top-left cell. Hence more
labour in total is typically spent compared to the situation without competition irrespective of
the value of �, and the more so, where the competition for scarce resources is fiercer.
As to the choice of number of trees to be visited, a larger �leads to smaller ¢, and
thereby to marginally larger optimal values of ℓ. While more effort per harvestable tree may
be made, a smaller share of harvestable trees is found as � increases. The optimal number of
visited trees was given in equation (9). To include the effect of competition, � is replaced by
��, so that the new expression for an approximate value of the number of trees in the
unregulated case is:
�¨+��© ≈ �('6�)��(�,9)� = ¢. �ª�=© (23)This number of trees is typically much lower than in the original case.
The model shows that utility of a household increases with less competition; in case of
privatisation, a maximum utility will be reached such that for fewer competing households,
more trees will be (privately) available than the household would choose to use. The utility of
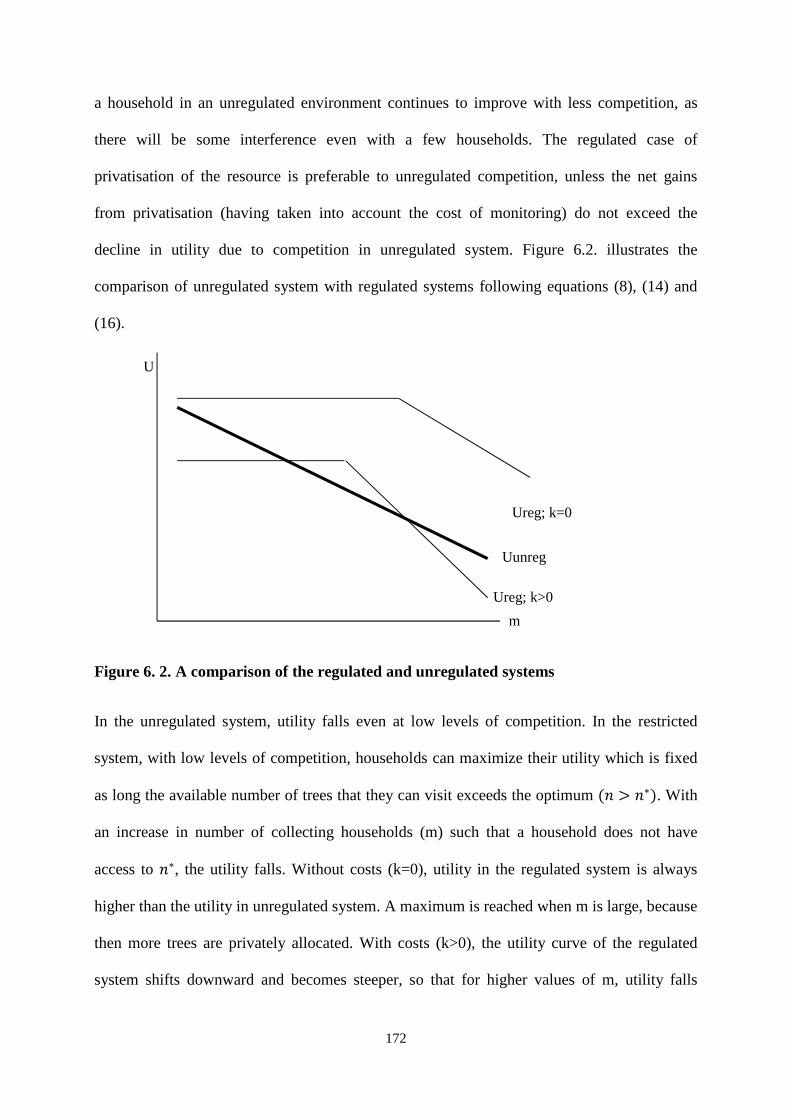
172
a household in an unregulated environment continues to improve with less competition, as
there will be some interference even with a few households. The regulated case of
privatisation of the resource is preferable to unregulated competition, unless the net gains
from privatisation (having taken into account the cost of monitoring) do not exceed the
decline in utility due to competition in unregulated system. Figure 6.2. illustrates the
comparison of unregulated system with regulated systems following equations (8), (14) and
(16).
Figure 6. 2. A comparison of the regulated and unregulated systems
In the unregulated system, utility falls even at low levels of competition. In the restricted
system, with low levels of competition, households can maximize their utility which is fixed
as long the available number of trees that they can visit exceeds the optimum (� > �∗). With
an increase in number of collecting households (m) such that a household does not have
access to �∗, the utility falls. Without costs (k=0), utility in the regulated system is always
higher than the utility in unregulated system. A maximum is reached when m is large, because
then more trees are privately allocated. With costs (k>0), the utility curve of the regulated
system shifts downward and becomes steeper, so that for higher values of m, utility falls
m
U
Ureg; k=0
Ureg; k>0
Uunreg
173
below the unregulated system. At low values of m, the unregulated system is preferred, but
this is due to the application of the cost even when the regulated system is not constraining.
This will not normally occur as it implies that something is regulated at a cost without
bringing additional benefits. In case where the cost is low, even at low population levels, a
private system is preferred. But with increasing population and fixed costs per household, the
unregulated system may be again preferred. This is counterintuitive, but is explained by the
fixity of the costs per household, which weigh heavily in case of small allocations of trees
(and large m).
A threshold line of the ratio of the population to the cost of regulation can be derived
at which the household chooses to change from unregulated to a regulated private system
(Figure 6.3.)
Figure 6. 3. Threshold in tenure systems
There are clear cases of preference of tenure system: private regulated system is preferred
when competition is high and regulation cost is low (high m, low k) and the communal
unregulated system is preferred when competition is low and cost is high (low m, high k).
Moreover, due to the fixed costs per household, the threshold level where mixed systems may
occur is identified such that when competition is low and cost is low (low m, low k),
k
m
Threshold line
Unregulated system
Regulated system
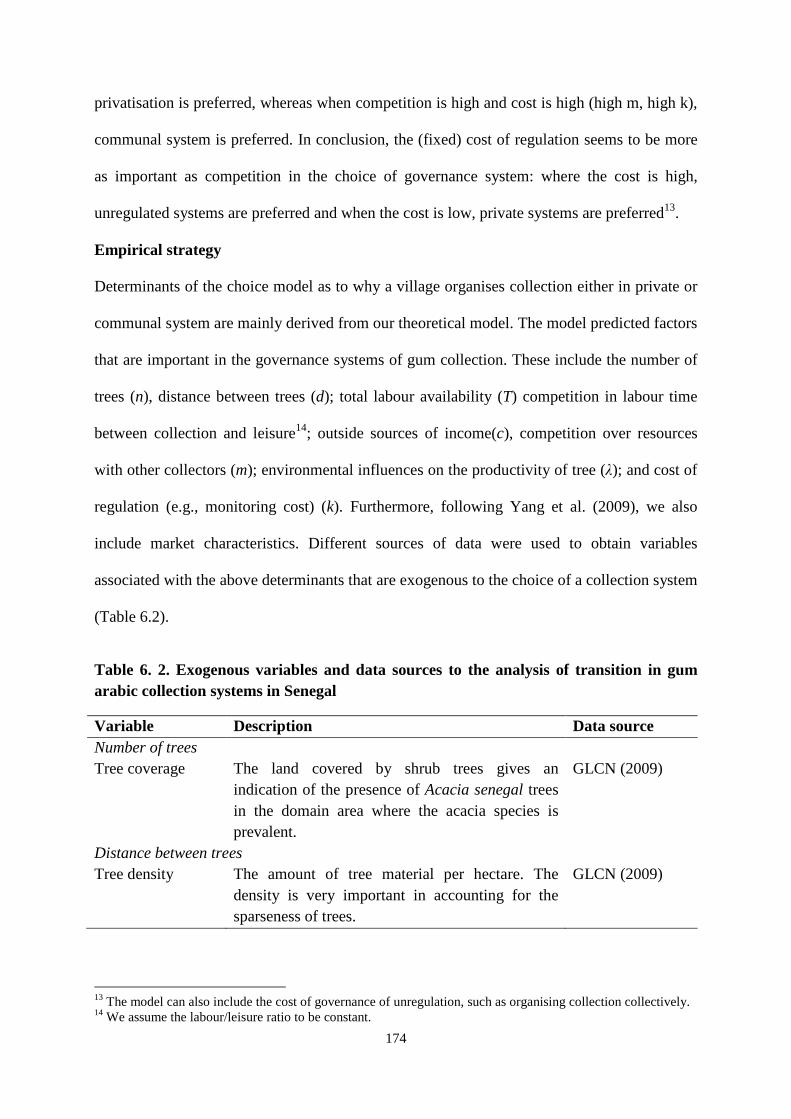
174
privatisation is preferred, whereas when competition is high and cost is high (high m, high k),
communal system is preferred. In conclusion, the (fixed) cost of regulation seems to be more
as important as competition in the choice of governance system: where the cost is high,
unregulated systems are preferred and when the cost is low, private systems are preferred13.
Empirical strategy
Determinants of the choice model as to why a village organises collection either in private or
communal system are mainly derived from our theoretical model. The model predicted factors
that are important in the governance systems of gum collection. These include the number of
trees (n), distance between trees (d); total labour availability (T) competition in labour time
between collection and leisure14; outside sources of income(c), competition over resources
with other collectors (m); environmental influences on the productivity of tree (λ); and cost of
regulation (e.g., monitoring cost) (k). Furthermore, following Yang et al. (2009), we also
include market characteristics. Different sources of data were used to obtain variables
associated with the above determinants that are exogenous to the choice of a collection system
(Table 6.2).
Table 6. 2. Exogenous variables and data sources to the analysis of transition in gum arabic collection systems in Senegal
Variable Description Data source Number of trees Tree coverage The land covered by shrub trees gives an
indication of the presence of Acacia senegal trees in the domain area where the acacia species is prevalent.
GLCN (2009)
Distance between trees Tree density The amount of tree material per hectare. The
density is very important in accounting for the sparseness of trees.
GLCN (2009)
13 The model can also include the cost of governance of unregulation, such as organising collection collectively. 14 We assume the labour/leisure ratio to be constant.
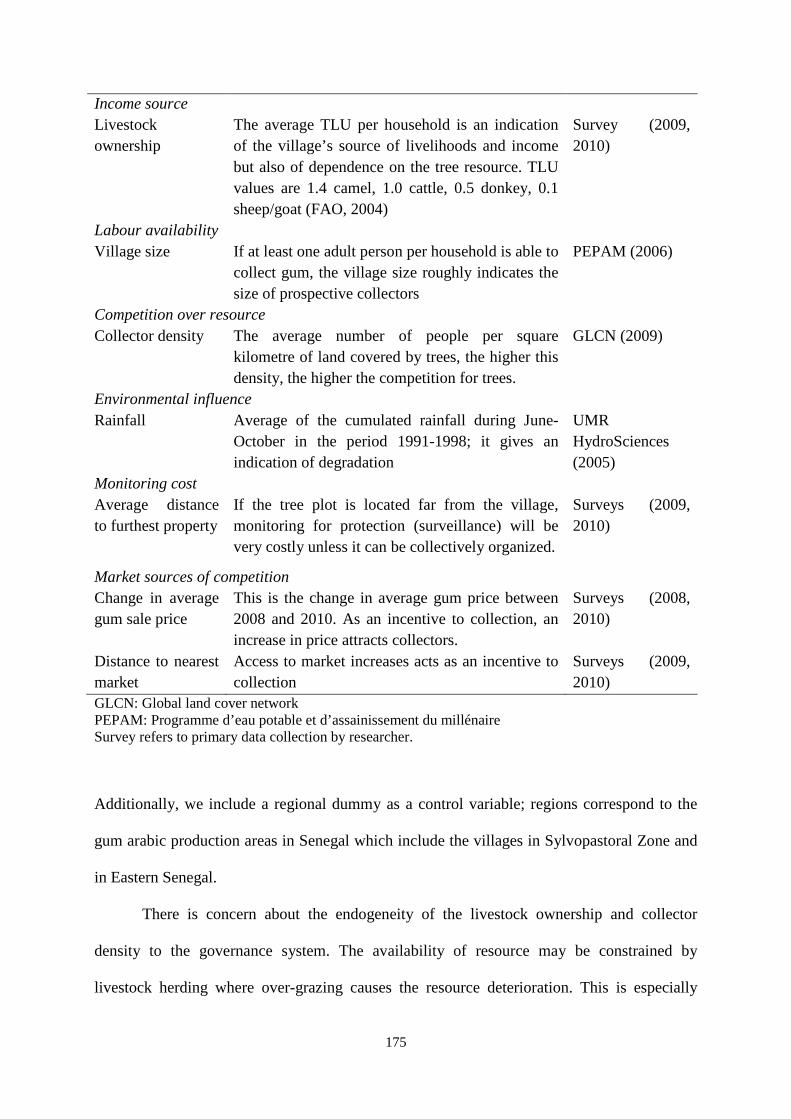
175
Income source Livestock ownership
The average TLU per household is an indication of the village’s source of livelihoods and income but also of dependence on the tree resource. TLU values are 1.4 camel, 1.0 cattle, 0.5 donkey, 0.1 sheep/goat (FAO, 2004)
Survey (2009, 2010)
Labour availability Village size If at least one adult person per household is able to
collect gum, the village size roughly indicates the size of prospective collectors
PEPAM (2006)
Competition over resource Collector density The average number of people per square
kilometre of land covered by trees, the higher this density, the higher the competition for trees.
GLCN (2009)
Environmental influence Rainfall Average of the cumulated rainfall during June-
October in the period 1991-1998; it gives an indication of degradation
UMR HydroSciences (2005)
Monitoring cost Average distance to furthest property
If the tree plot is located far from the village, monitoring for protection (surveillance) will be very costly unless it can be collectively organized.
Surveys (2009, 2010)
Market sources of competition Change in average gum sale price
This is the change in average gum price between 2008 and 2010. As an incentive to collection, an increase in price attracts collectors.
Surveys (2008, 2010)
Distance to nearest market
Access to market increases acts as an incentive to collection
Surveys (2009, 2010)
GLCN: Global land cover network PEPAM: Programme d’eau potable et d’assainissement du millénaire Survey refers to primary data collection by researcher.
Additionally, we include a regional dummy as a control variable; regions correspond to the
gum arabic production areas in Senegal which include the villages in Sylvopastoral Zone and
in Eastern Senegal.
There is concern about the endogeneity of the livestock ownership and collector
density to the governance system. The availability of resource may be constrained by
livestock herding where over-grazing causes the resource deterioration. This is especially
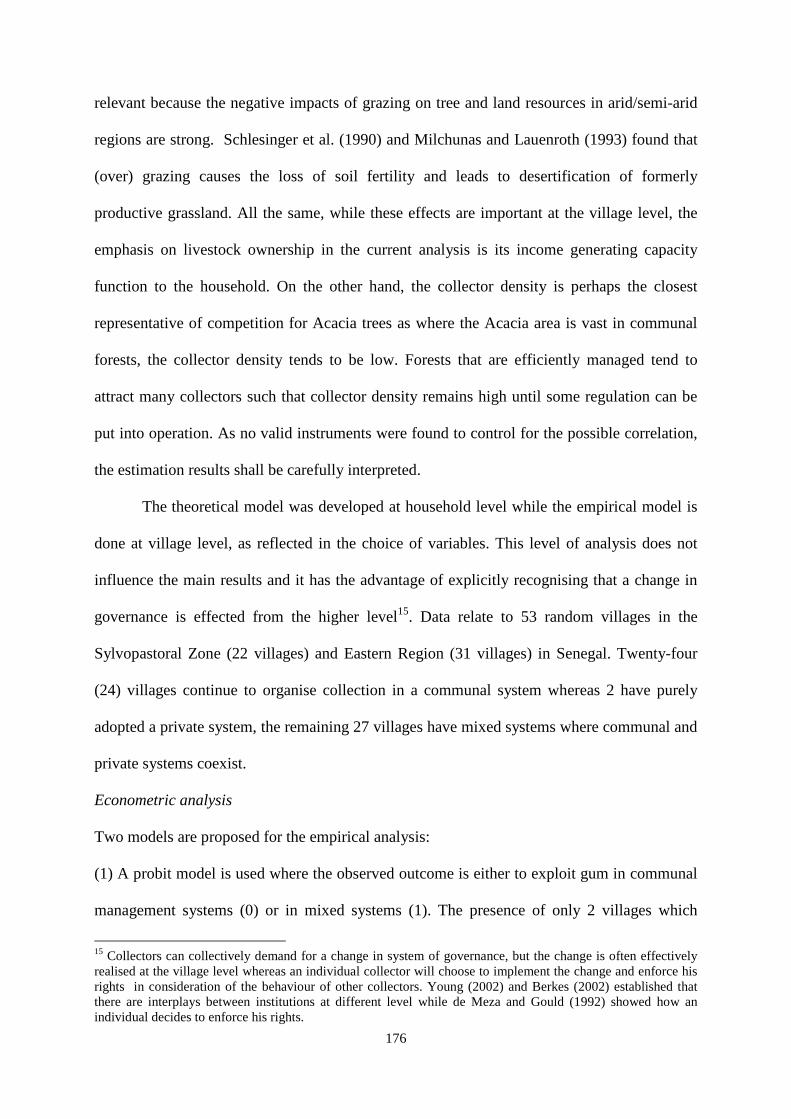
176
relevant because the negative impacts of grazing on tree and land resources in arid/semi-arid
regions are strong. Schlesinger et al. (1990) and Milchunas and Lauenroth (1993) found that
(over) grazing causes the loss of soil fertility and leads to desertification of formerly
productive grassland. All the same, while these effects are important at the village level, the
emphasis on livestock ownership in the current analysis is its income generating capacity
function to the household. On the other hand, the collector density is perhaps the closest
representative of competition for Acacia trees as where the Acacia area is vast in communal
forests, the collector density tends to be low. Forests that are efficiently managed tend to
attract many collectors such that collector density remains high until some regulation can be
put into operation. As no valid instruments were found to control for the possible correlation,
the estimation results shall be carefully interpreted.
The theoretical model was developed at household level while the empirical model is
done at village level, as reflected in the choice of variables. This level of analysis does not
influence the main results and it has the advantage of explicitly recognising that a change in
governance is effected from the higher level15. Data relate to 53 random villages in the
Sylvopastoral Zone (22 villages) and Eastern Region (31 villages) in Senegal. Twenty-four
(24) villages continue to organise collection in a communal system whereas 2 have purely
adopted a private system, the remaining 27 villages have mixed systems where communal and
private systems coexist.
Econometric analysis
Two models are proposed for the empirical analysis:
(1) A probit model is used where the observed outcome is either to exploit gum in communal
management systems (0) or in mixed systems (1). The presence of only 2 villages which
15 Collectors can collectively demand for a change in system of governance, but the change is often effectively realised at the village level whereas an individual collector will choose to implement the change and enforce his rights in consideration of the behaviour of other collectors. Young (2002) and Berkes (2002) established that there are interplays between institutions at different level while de Meza and Gould (1992) showed how an individual decides to enforce his rights.
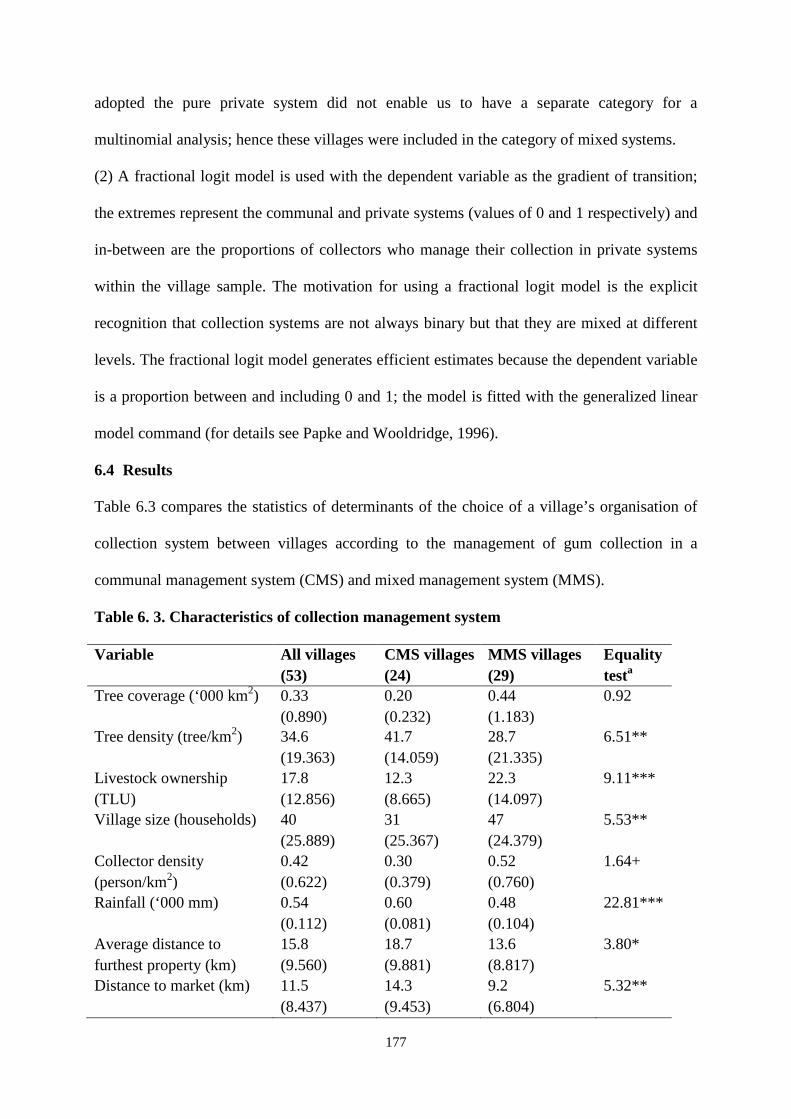
177
adopted the pure private system did not enable us to have a separate category for a
multinomial analysis; hence these villages were included in the category of mixed systems.
(2) A fractional logit model is used with the dependent variable as the gradient of transition;
the extremes represent the communal and private systems (values of 0 and 1 respectively) and
in-between are the proportions of collectors who manage their collection in private systems
within the village sample. The motivation for using a fractional logit model is the explicit
recognition that collection systems are not always binary but that they are mixed at different
levels. The fractional logit model generates efficient estimates because the dependent variable
is a proportion between and including 0 and 1; the model is fitted with the generalized linear
model command (for details see Papke and Wooldridge, 1996).
6.4 Results
Table 6.3 compares the statistics of determinants of the choice of a village’s organisation of
collection system between villages according to the management of gum collection in a
communal management system (CMS) and mixed management system (MMS).
Table 6. 3. Characteristics of collection management system
Variable All villages (53)
CMS villages (24)
MMS villages (29)
Equality testa
Tree coverage (‘000 km2) 0.33 (0.890)
0.20 (0.232)
0.44 (1.183)
0.92
Tree density (tree/km2) 34.6 (19.363)
41.7 (14.059)
28.7 (21.335)
6.51**
Livestock ownership (TLU)
17.8 (12.856)
12.3 (8.665)
22.3 (14.097)
9.11***
Village size (households) 40 (25.889)
31 (25.367)
47 (24.379)
5.53**
Collector density (person/km2)
0.42 (0.622)
0.30 (0.379)
0.52 (0.760)
1.64+
Rainfall (‘000 mm) 0.54 (0.112)
0.60 (0.081)
0.48 (0.104)
22.81***
Average distance to furthest property (km)
15.8 (9.560)
18.7 (9.881)
13.6 (8.817)
3.80*
Distance to market (km) 11.5 (8.437)
14.3 (9.453)
9.2 (6.804)
5.32**
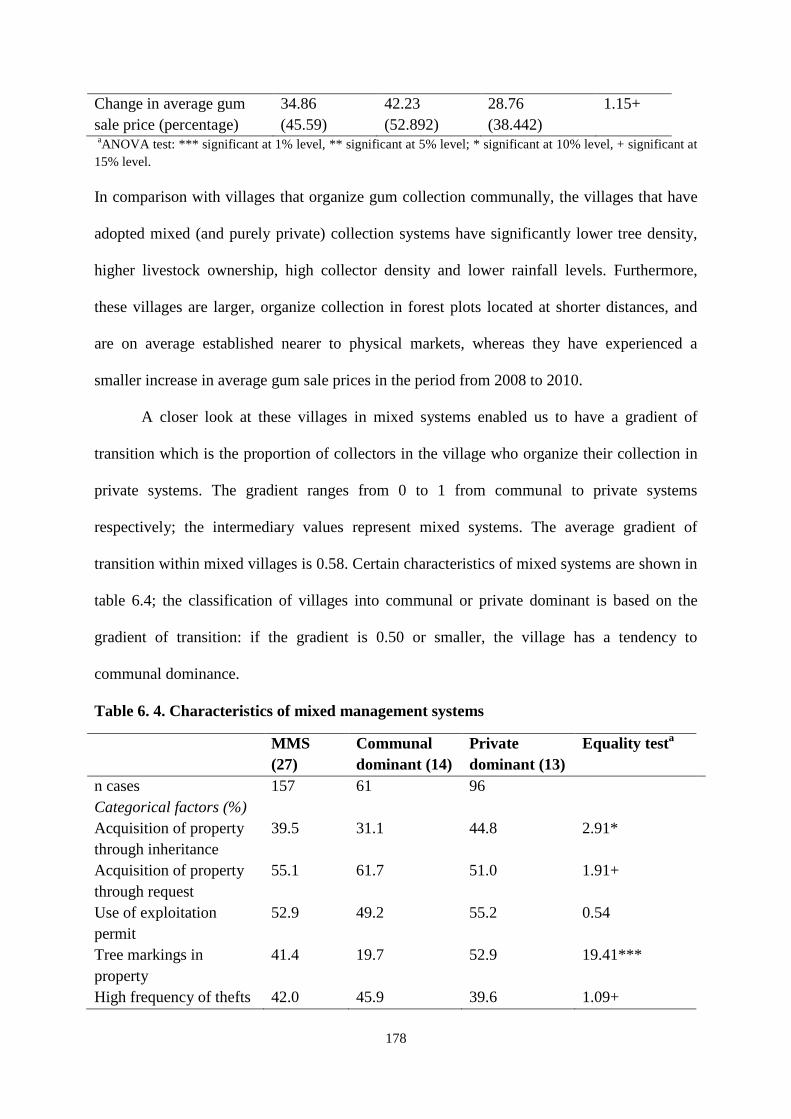
178
Change in average gum sale price (percentage)
34.86 (45.59)
42.23 (52.892)
28.76 (38.442)
1.15+
aANOVA test: *** significant at 1% level, ** significant at 5% level; * significant at 10% level, + significant at 15% level.
In comparison with villages that organize gum collection communally, the villages that have
adopted mixed (and purely private) collection systems have significantly lower tree density,
higher livestock ownership, high collector density and lower rainfall levels. Furthermore,
these villages are larger, organize collection in forest plots located at shorter distances, and
are on average established nearer to physical markets, whereas they have experienced a
smaller increase in average gum sale prices in the period from 2008 to 2010.
A closer look at these villages in mixed systems enabled us to have a gradient of
transition which is the proportion of collectors in the village who organize their collection in
private systems. The gradient ranges from 0 to 1 from communal to private systems
respectively; the intermediary values represent mixed systems. The average gradient of
transition within mixed villages is 0.58. Certain characteristics of mixed systems are shown in
table 6.4; the classification of villages into communal or private dominant is based on the
gradient of transition: if the gradient is 0.50 or smaller, the village has a tendency to
communal dominance.
Table 6. 4. Characteristics of mixed management systems
MMS (27)
Communal dominant (14)
Private dominant (13)
Equality testa
n cases 157 61 96 Categorical factors (%) Acquisition of property through inheritance
39.5 31.1 44.8 2.91*
Acquisition of property through request
55.1 61.7 51.0 1.91+
Use of exploitation permit
52.9 49.2 55.2 0.54
Tree markings in property
41.4 19.7 52.9 19.41***
High frequency of thefts 42.0 45.9 39.6 1.09+
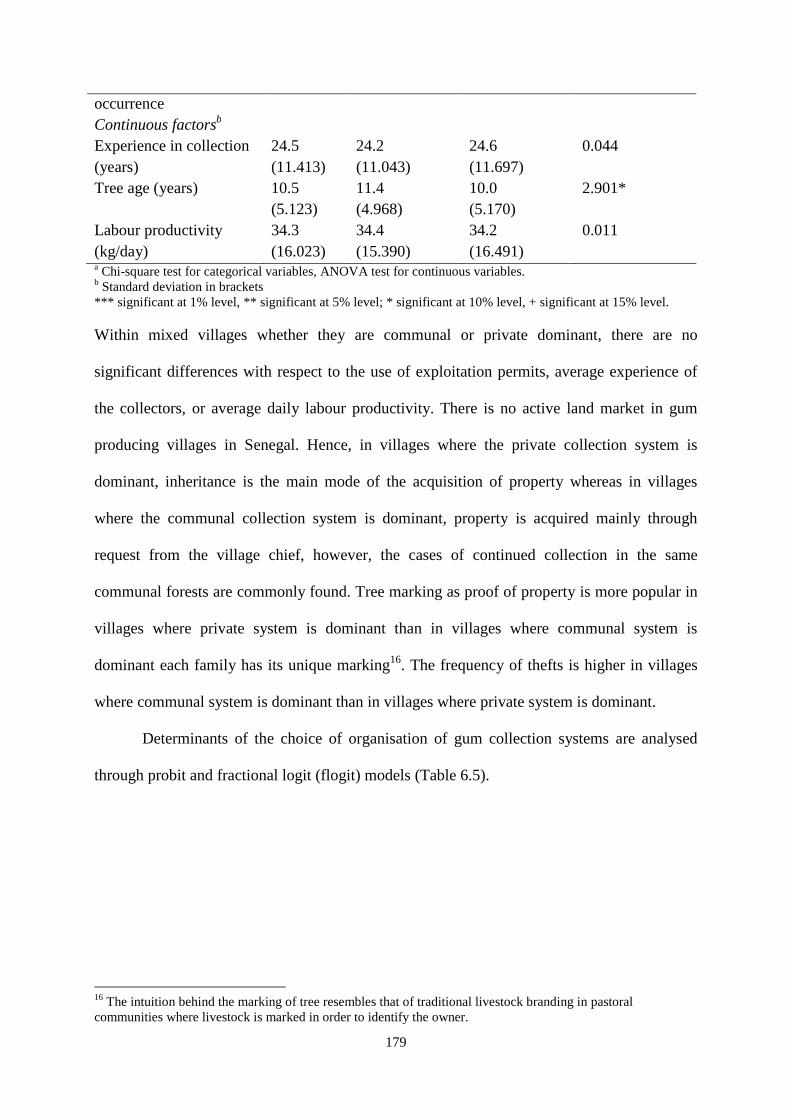
179
occurrence Continuous factorsb Experience in collection (years)
24.5 (11.413)
24.2 (11.043)
24.6 (11.697)
0.044
Tree age (years) 10.5 (5.123)
11.4 (4.968)
10.0 (5.170)
2.901*
Labour productivity (kg/day)
34.3 (16.023)
34.4 (15.390)
34.2 (16.491)
0.011
a Chi-square test for categorical variables, ANOVA test for continuous variables. b Standard deviation in brackets *** significant at 1% level, ** significant at 5% level; * significant at 10% level, + significant at 15% level.
Within mixed villages whether they are communal or private dominant, there are no
significant differences with respect to the use of exploitation permits, average experience of
the collectors, or average daily labour productivity. There is no active land market in gum
producing villages in Senegal. Hence, in villages where the private collection system is
dominant, inheritance is the main mode of the acquisition of property whereas in villages
where the communal collection system is dominant, property is acquired mainly through
request from the village chief, however, the cases of continued collection in the same
communal forests are commonly found. Tree marking as proof of property is more popular in
villages where private system is dominant than in villages where communal system is
dominant each family has its unique marking16. The frequency of thefts is higher in villages
where communal system is dominant than in villages where private system is dominant.
Determinants of the choice of organisation of gum collection systems are analysed
through probit and fractional logit (flogit) models (Table 6.5).
16 The intuition behind the marking of tree resembles that of traditional livestock branding in pastoral communities where livestock is marked in order to identify the owner.
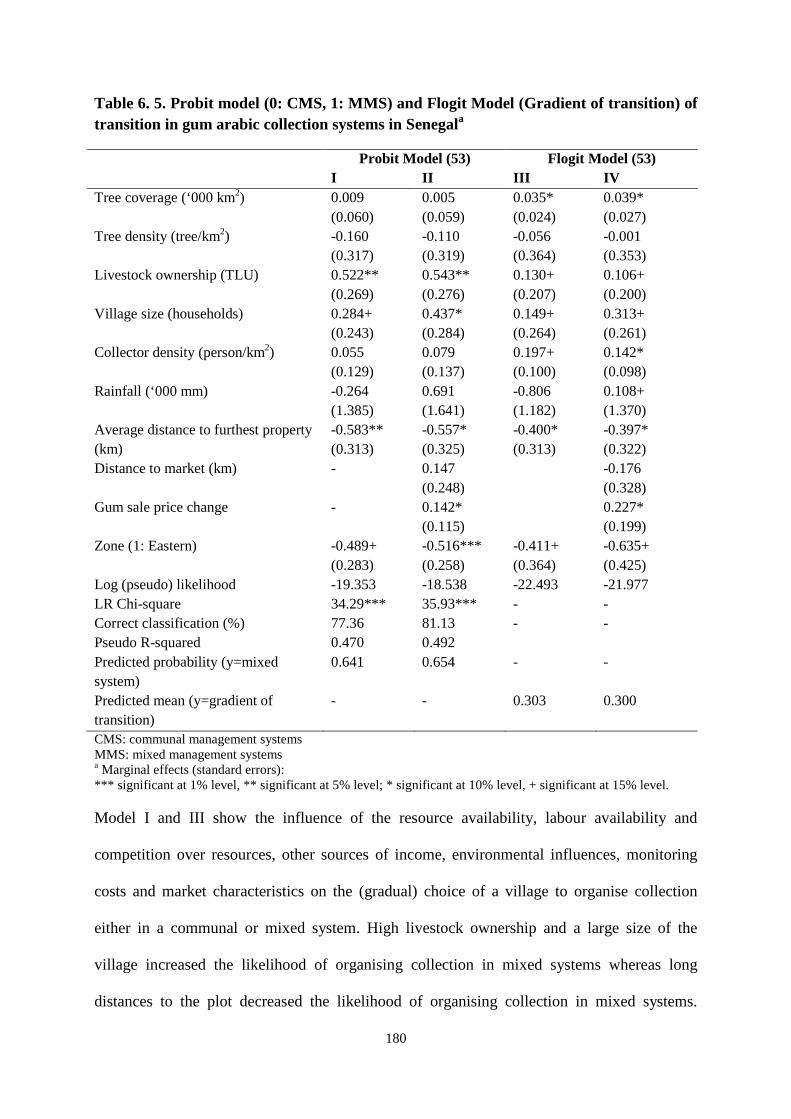
180
Table 6. 5. Probit model (0: CMS, 1: MMS) and Flogit Model (Gradient of transition) of transition in gum arabic collection systems in Senegala
Probit Model (53) Flogit Model (53) I II III IV Tree coverage (‘000 km2) 0.009
(0.060) 0.005 (0.059)
0.035* (0.024)
0.039* (0.027)
Tree density (tree/km2) -0.160 (0.317)
-0.110 (0.319)
-0.056 (0.364)
-0.001 (0.353)
Livestock ownership (TLU) 0.522** (0.269)
0.543** (0.276)
0.130+ (0.207)
0.106+ (0.200)
Village size (households) 0.284+ (0.243)
0.437* (0.284)
0.149+ (0.264)
0.313+ (0.261)
Collector density (person/km2) 0.055 (0.129)
0.079 (0.137)
0.197+ (0.100)
0.142* (0.098)
Rainfall (‘000 mm) -0.264 (1.385)
0.691 (1.641)
-0.806 (1.182)
0.108+ (1.370)
Average distance to furthest property (km)
-0.583** (0.313)
-0.557* (0.325)
-0.400* (0.313)
-0.397* (0.322)
Distance to market (km) - 0.147 (0.248)
-0.176 (0.328)
Gum sale price change - 0.142* (0.115)
0.227* (0.199)
Zone (1: Eastern) -0.489+ (0.283)
-0.516*** (0.258)
-0.411+ (0.364)
-0.635+ (0.425)
Log (pseudo) likelihood -19.353 -18.538 -22.493 -21.977 LR Chi-square 34.29*** 35.93*** - - Correct classification (%) 77.36 81.13 - - Pseudo R-squared 0.470 0.492 Predicted probability (y=mixed system)
0.641 0.654 - -
Predicted mean (y=gradient of transition)
- - 0.303 0.300
CMS: communal management systems MMS: mixed management systems a Marginal effects (standard errors): *** significant at 1% level, ** significant at 5% level; * significant at 10% level, + significant at 15% level.
Model I and III show the influence of the resource availability, labour availability and
competition over resources, other sources of income, environmental influences, monitoring
costs and market characteristics on the (gradual) choice of a village to organise collection
either in a communal or mixed system. High livestock ownership and a large size of the
village increased the likelihood of organising collection in mixed systems whereas long
distances to the plot decreased the likelihood of organising collection in mixed systems.
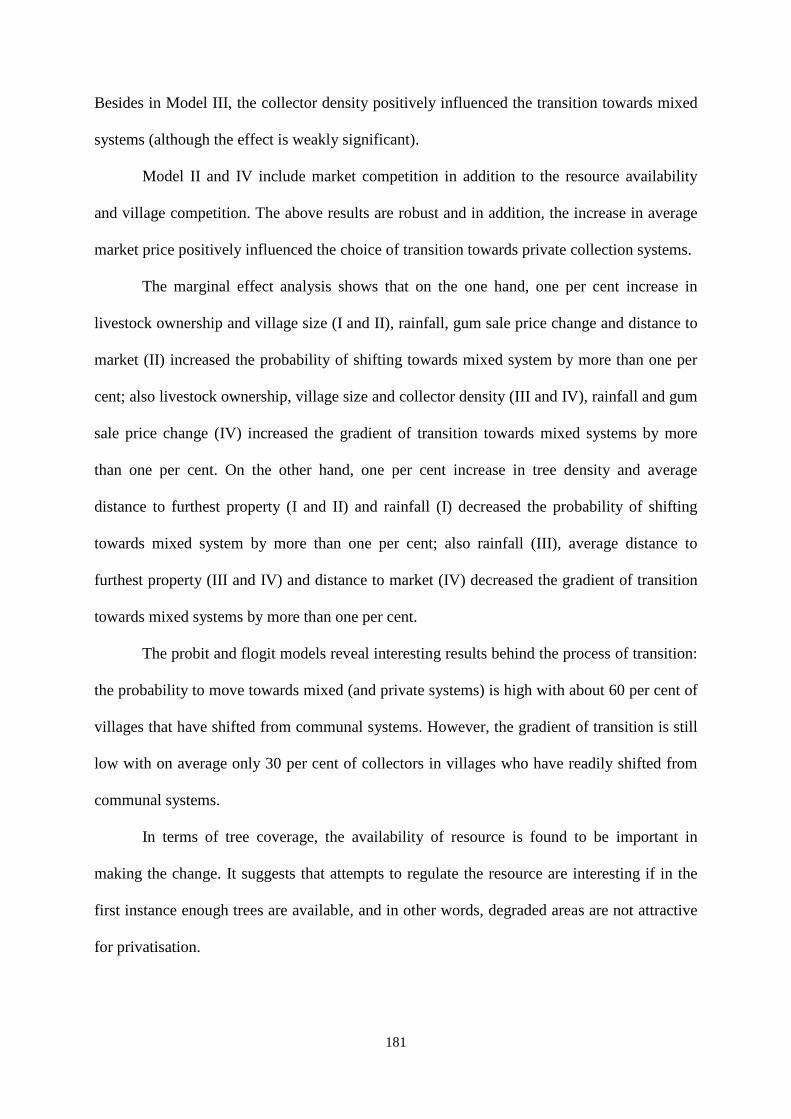
181
Besides in Model III, the collector density positively influenced the transition towards mixed
systems (although the effect is weakly significant).
Model II and IV include market competition in addition to the resource availability
and village competition. The above results are robust and in addition, the increase in average
market price positively influenced the choice of transition towards private collection systems.
The marginal effect analysis shows that on the one hand, one per cent increase in
livestock ownership and village size (I and II), rainfall, gum sale price change and distance to
market (II) increased the probability of shifting towards mixed system by more than one per
cent; also livestock ownership, village size and collector density (III and IV), rainfall and gum
sale price change (IV) increased the gradient of transition towards mixed systems by more
than one per cent. On the other hand, one per cent increase in tree density and average
distance to furthest property (I and II) and rainfall (I) decreased the probability of shifting
towards mixed system by more than one per cent; also rainfall (III), average distance to
furthest property (III and IV) and distance to market (IV) decreased the gradient of transition
towards mixed systems by more than one per cent.
The probit and flogit models reveal interesting results behind the process of transition:
the probability to move towards mixed (and private systems) is high with about 60 per cent of
villages that have shifted from communal systems. However, the gradient of transition is still
low with on average only 30 per cent of collectors in villages who have readily shifted from
communal systems.
In terms of tree coverage, the availability of resource is found to be important in
making the change. It suggests that attempts to regulate the resource are interesting if in the
first instance enough trees are available, and in other words, degraded areas are not attractive
for privatisation.

182
Ownership of livestock also influences the tendency towards private/mixed systems
despite that pastoralism is another source of income that would normally indicate less
dependency on gum resource for livelihoods and hence less competition. This is not the case
however, as in the first instance, income from livestock (sales of animals or animal products)
is not profitably generated in the dry season when gum is collected. In the second instance,
livestock ownership as sign of wealth at the village level can be linked to institutional
development and better market access.
Competition within the village implies that on the one hand, large villages, which are
an indication of the number of prospective collectors, prefer to orient collection towards
private/mixed systems as stronger competition in the forest would lead to lower collection
quantities for each collector. The cost of communal organisation or the risk of conflict over
resource may also be very high if the number of involved potential users is high. Indeed, if
there are several collectors competing for the resource such that the collector density is high,
the village would prefer to adopt a mixed system.
If the plots/forests where gum is collected are located far away from the village, then
communal systems are preferable because the monitoring cost is too high for a private owner
to enforce his rights and protect the plot. Also in this case, not many collectors would venture
into those plots and hence competition is also lower.
Market competition is straightforward in impact: higher prices attract occasional
collectors whose behaviour is in contrast with that of professional gum collectors.
Professionals are regular collectors but occasional collectors collect only when the price and
market conditions are good. They do so because there are no (strong) exclusive mechanisms
to the communally governed forests. Such non-professional behaviour leads to reduced
productivity in communal resources and thereby creates the need for organising collection in
private/mixed system.
183
6.5 Discussion and conclusions
Theories of origin and transition in farming systems advanced population pressure,
environmental aspects and technological developments as the main factors influencing a shift
in farming systems. These changes were accompanied or associated by changes in systems for
resource governance. In the current study, we investigate the case of a non-timber forest
product, gum arabic, with respect to changes in governance systems of collection from
communal systems towards private systems, with mixed systems in the transition. These
systems are distinguishable by the mode of the acquisition, with tree marking as an effective
proof of property that limits the frequency of thefts; such markings are an indication of
exclusive use rights (Wiersum, 1997).
The theoretical model confirms the early theories whereby the utility of a household
was found to increase with less competition (or less pressure); factors that might influence the
change in governance systems include resource and labour availability, competition over
resources, monitoring costs, and market characteristics.
Empirical results confirm that the choice of private systems depends on resource
availability. This is important as it directly determines the amount that a collector can expect
to harvest and gives incentives for possible division of resource area into private plots. If the
resource area is large, there is a possibility to practice extensive collection and at the same
time increase productivity and quality of the harvested product (Belcher and Schrekenberg,
2007). However, it should be noted that very large resource areas may be difficult to manage
(Yang et al., 2009); hence the area should be proportionate to the available labour as
exemplified by the village size. The reverse side implies that resource degradation should be
contained. Not explicitly included in the current study, but also an important factor causing
the resource degradation in gum producing regions are bush fires as consistently found in the
monitoring of such fires by the Centre de Suivi Ecologique in Senegal (CSE, 2009); if these

184
fires are not controlled, they can be devastating. Privatisation the resource can thus be
associated with limiting destructive action and resource conservation (Homma, 1996; Alvard
and Kuznar, 2001).
Livestock ownership and gum collection were presumed to be complementary sources
of livelihoods which means that earning some income from livestock eases the necessity to
collect gum and hence reduces the burden on the resource. Perhaps, a direct measure of
income (which could be generated off-farm or by remittances) would have clarified the
relationship between supplementary income and collection. What is observed here is a
possible market development. Livestock ownership can be associated with development of
livestock markets which can subsequently attract buyers of gum. As the markets develop and
buyers are not exploitative as found in chapter 5, there is a possibility to increase income
through collecting and marketing gum. However, these market developments will attract an
increasing number of collectors and the result suggests that competition indeed plays a role in
governance choice or change. This competition was found mainly to be the result of price
incentives. In case of rise in price, these occasional collectors compete with professionals in
plots to collect gum thereby reducing the individual quantity of gum obtained by each
collector. Also in order to obtain the gum before the other collector gets it, gum may be
harvested before maturity, thereby leading to inconsistent quality. The influence of market
and related competition on systems of collection is also found in commercialisation of
agricultural products (e.g., Quisumbing and Otsuka, 2001) or other non-timber forest products
(e.g., Yang et al., 2009). These trends are in line with Ruttan’s (2002) description of the
change in governance.
While the organization of collection in private system is preferable for the purpose of
increasing productivity and quality, preventing overexploitation of the resource, and
generating short and long term incentives for tree management, there are cases when the cost

185
of enforcing such system is economically and socially too prohibitive such that communal
systems are maintained. This cost is for instance related to monitoring: the monitoring cost
would depend on the size of and distance to the collection area. If the area is located far away
from the village, surveillance is efficiently done collectively by the villagers. Another reason
not directly included here is of the mutual insurance offered by communal area. As resource
users live in drylands where income streams are uncertain, communal systems may be indeed
be more appropriate as they allow flexible and mobile responses to uncertainty and risk. In the
case of study, this implies that the collector will not be restricted to his private plot
particularly in a bad year. Hence, as popularised by authors like Grell and Kirk (2000),
communal systems of resource governance would be preferred because they are an insurance
mechanism in high-risk environments.
186
Discussion and conclusions
7.1 Introduction
Senegal is in the rank of small producers whose exports total to less than 5 per cent of world
export, its registered exports have not exceeded 1,000 tons in the last decade (ITC, 2008;
COMTRADE, 2011). Low exports imply that the country may lose some export revenues and
that collectors of gum arabic may fail to see their livelihoods improved from larger incomes
that could have been generated from the sale of gum. Such livelihoods, in the arid and semi-
arid regions where gum arabic is harvested, revolve around short and erratic rains, and poor
and fragile soils on which agriculture is not widely suitable except for some cereals and
irrigated vegetables. Pastoralism is practiced in these regions, allowing for transhumance in
the drought period.
Acacias species including Acacia senegal trees are among the drought-tolerant
vegetation naturally suitable for the arid and semi-arid regions. These trees which have
ecological benefits, household functionalities and palatable attractiveness to animals, also
exudate gum arabic. Collection of gum arabic, similar to other non-timber forest products, is
done with the purpose of labour diversification, consumption smoothing, coping with
emergencies or accumulating wealth.
In Senegal, gum arabic is collected in the Sylvopastoral Zone (SPZ) commonly called
the Ferlo and the agro-sylvopastoral zone also known as Eastern Senegal (ES). The SPZ
covers almost all parts of the regions of Louga, Saint Louis and Matam; ES covers the region
of Tambacounda. An average collector of gum arabic could annually harvest and market near
to 900 kilograms in the SPZ and 120 kilograms in ES (in chapter 3), thereby earning about
500,000 CFA and 120,000 CFA respectively17; at prices prevailing in the season of 2009.
Such income is substantial to the household given that collection is often a secondary activity.
17 About 760 EUR and 180 EUR respectively.
187
Collection is open to rural households; however, continued low production and exports levels
observed in the country imply that there might be inefficiencies on the marketing side that
result from the lack of necessary price incentives. These prices are indeed very low compared
to the efforts that are needed to collect gum. Hence the current study’s main aim was to link
the market side to the collection side in order to investigate sources of inefficiencies and
explore ways to improve the performance of markets and thereby collection
production/collection. Four questions became the focus: (1) do collectors have enough
incentives from the market in terms of the net returns from collection and marketing? (2) do
consecutive traders along the marketing chain exploit each other leading to low prices to
collectors and therefore low supply? (3) are collectors supplying the gum of quality that is
required by users? and (4) why is the transition from communal systems is slow despite their
too many inefficiencies? Chapters of this thesis are an attempt to respond to these particular
issues.
7.2 Summary of the main findings
Market incentives are fundamental to gum collection
The behaviour of gum collectors involves a decision of whether to collect or not with an
intention to participate in the market where they can sell their product (as gum is only
marginally consumed by households and a decision to collect can be made instantly at harvest
time). The purpose of the decisions is to maximize their net expected returns. These returns
are a function of the expected price excluding marketing costs and taking into account the
distance to the nearest town and honouring the commitment to transact with a certain trading
partner. The amount of gum collected is optimised depending on availability trees, usage of
inputs and level of competition in gum producing forests.
Once the gum is collected, a choice of where to sell gum among the available
alternative markets either in the village or at distant town market needs to be made. This
188
choice depends on the assessment of differences between village and town market prices
which should be large enough to pay for going to the market. The choice also depends on the
level of competition between collectors and the preference for certain a trader. While
transport costs restrain the collector from going to a distant market, the investment incurred in
concluding a transaction and repeated transactions with a trader increase the probability of
going to the town market particularly when the household is able to combine its other
activities with travelling to the market in order to sell gum.
The results suggested that gum collection is largely determined by marketing
incentives in terms of price expectations. The choice of physical market where he sells his
gum is the result of an evaluation of the price prevailing in markets and other market
characteristics but also the level of proportional costs and the possibility to reduce the
household labour opportunity cost through combining gum sales with other activities such as
acquisition of household items. Methods to increase the amount collected can be adopted such
as increasing labour productivity and regulating competition in forests, yet, market incentives
are essential for the continuation of collection; they should be sufficiently high to cover for
the costs of collection and marketing gum.
Traders cannot always be accused of exploitation
Traders of gum arabic operate in oligopsonistic market structures. These structures are
observed consecutively along the gum arabic supply chain in Senegal, from primary traders to
transporters and then wholesalers. The latter earn the highest margins as they transact large
quantities and their unit costs remain relatively low because of economies of scale. High unit
marketing costs are found in primary markets because of the small size of transactions
occurring in dispersed markets. As a consequence, payments to gum collectors are low.
In this chapter, market shares of traders in their respective markets were computed and
corresponding Herfindahl indices were derived. The results proved an increase in market
189
power as the number of buyers becomes smaller along the supply chain. However, they were
not sufficiently high to confirm strong oligopsonistic tendencies.
The findings implied that, traders in the gum market, while working towards enlarging
their supplies, do not necessary behave as oligopsonists by exercising their power in an
exploitative manner. Their entry and performance in the market depends on the capital
invested (human, financial, physical, communication and social capital) but they are
constrained by competition. The value distribution along the chain (margins taken by each
trader) depends on marketing costs, supply conditions, uncertainty and risk. The magnitude of
risk could also be the main cause of market exit.
Benefits that traders obtain from gum trading are limited by poor market access
conditions such as poor transportation, lack of infrastructure and market information in
addition to individual and market related risks. The study also reminds of the important
functions that these traders play in the gum sector in spite of the difficult marketing
conditions. It is also a contribution towards breaking the myth that traders are always
exploitative.
Supply of quality does not always meet the user’s requirements
Gum quality assessed by collectors and traders does not always coincide with the users’
assessment of quality. Collectors and traders’ assessment is highly subjective and differs from
village to village. The bad quality recognised by collectors and traders is confirmed by the
users’ assessment, but good quality from the perspective of collectors and traders may not
always be good in terms of user’s requirements; the link between the assessment by collectors
and traders and that of users is cleanliness or low mineral matter which is a visible attribute of
quality. Yet, other minimal quality attributes are also needed. This finding implies that when
gum is supplied as being good quality, it may be rejected by users when this quality does not
meet the users’ requirements. Yet, the increase in the supply of good quality after visual
190
inspection increases the probability of obtaining the quality that meets the users’
requirements.
Important are also the findings on how this quality could be increased. Quality supply
in terms of the size and cleanliness of the gum nodules depends on harvest and post-harvest
practices. It is also a response to market conduct and market-driven collection incentives. The
market conduct shows inconsistencies in the preference for quality attributes because the
traders’ knowledge of quality is not very much higher than that of collectors unless they have
long experience in the trade.
Results also showed that undifferentiated price incentives offered by the market
restrict the supply of good quality because these incentives create competition in communal
forests where gum is collected by attracting occasional collectors. Competition for gum
inhibits its maturity as the collector targets to harvest the gum before another collector.
Immature gum has high probability of not reaching its full size and is more likely to attract
impurities. These price incentives also have an effect on the relative demand for quality: at
high price levels, there is relatively more demand for undifferentiated or lower quality
whereas at low price levels, there is relatively more demand for high quality. An incentive to
supply high quality gum is a price differentiation such that good quality is rewarded by its
premium.
Change of tenure systems is mainly driven by economic considerations Communal systems are preferred to private systems when the cost of regulation is high
particularly when competition over resource is low. In Senegal, the current change in tenure
of Acacia senegal resource from communal to private collection systems is slow; mixed
systems are found in a gradual transition where privately owned properties and communal
forests coexist.

191
The study found that private systems emerge when the resource is sufficiently
available in proportion to labour such that the collector can expect to increase his collection.
The environmental function of privatisation is thus acknowledged where the collector has the
incentive to protect the resource and limit destructive action.
Market developments and incentives are a source of competition that also generates
the need for moving towards private systems. The competition arises from the unrestricted
entry of occasional collectors. These findings imply that privatisation is undertaken because
of its economic benefits by regulating competition which may not only restrict the quantity
but also the quality of gum collected.
Results confirmed the reason for the maintenance of communal systems as the high
cost of regulation; e.g., if monitoring cost that depends on the size of and distance to the
collection area is high, communal tenure is preferred because surveillance can be efficiently
done by the community. The social function fulfilled by these systems in the community is
also very important: communal systems may be more preferred than private systems because
they act as an insurance mechanism in the drylands. As such, a collector can spread the risk
from environmental uncertainties instead of solely relying on his own plot. The transition
from communal organisation of collection to efficient private collection systems hence
depends mainly on the assessment of economic benefits and costs. However, the importance
attached to environmental and social considerations may also play a role in the process of
change.
With the objective of investigating factors that influence the performance of the gum
arabic supply chain, the study has therefore found that (1) the main determinants of the
collector’s decision to collect gum and amount to collect are the expected marketing
incentives whereas the choice of physical market where a collector sells his gum is
determined by the comparison of prices and costs associated with different market outlets ; (2)

192
value distribution along the gum arabic supply chain depends on market power and also
marketing costs, supply conditions, uncertainty and risk in trade; (3) the quality supplied by
collectors does not consistently correspond to users’ quality requirements as good quality gum
is not always identified on the field and harvest and post-harvest practices, market conduct
and market-driven collection incentives are the main factors influencing the supply of quality
by gum collectors; and (4) the transition from communal organisation of collection to
efficient private collection systems mainly depends on an evaluation of the benefits and costs
associated with any governance system of collection taking into account the environmental
and social considerations.
7.3 Policy implications
Interventions in the gum arabic sector require a wide approach that ranges from aspects of
resource governance to functioning of markets. Some policy opportunities are suggested for
improving collection and marketing of gum arabic.
Acacia senegal resource
Although (Acacia senegal) trees are naturally grown, the resource base should be expanded,
or at least maintained. Hence, efforts in tree planting and maintenance are required to preserve
the resource base such that production/collection and supply of gum are sustained. The
community and forestry services should be empowered to control degradation through social
and economic means or by law enforcement respectively. Most importantly, the population
should constantly be sensitized to improve their knowledge of resource potential in order to
limit destructive action and conserve the resource.
Clear rules of management are needed to counteract the influence of market forces
(price) on competition in forests and motivate collectors to manage their plots and thereby
increase collection and quality of the product. The legislative and institutional aspects of
managing acacia trees offer the best strategy; but these should also take into account the

193
consistency between the formal codes and forestry opportunities for people to manage trees.
Also the role of government, particularly the forest administration should be clearly outlined.
As forest resources serve to improve the livelihoods of resource users who live in the
high-risk drylands where income streams are uncertain, there is need to explore and extend
the diversification of livelihoods sources not only off-farm but also off-forest in order to
reduce over-dependence on resource especially in the dry season.
Direct market interventions
Direct market interventions are required. These would involve a consolidation of the position
of Senegal as a producer country so that a regular demand can be maintained: this regular
demand implies that traders would be insured of having a market for the acquired products
and hence act competitively towards their suppliers. An emphasis on market regularity is
needed because of the fragile balance between the professional collection and casual high
demands lead to over-harvesting of gum trees thereby destroying the resource.
Another option is the provision of price incentives in terms of higher price or price
guarantees. For the price transferred by traders to really be an incentive, this price should be
attractive. As this price is a transfer from the international price, it is important that exporters
aim to achieve a higher price in international markets. On these markets, several factors could
influence price such as the availability of industrial substitutes. Market consolidation should
be explored and the supply of good quality gum emphasized so that users who have
discovered the uniqueness of the gum arabic continue to demand the product. There might be
a need for market regulation in terms of supply or price stabilization to retain incentives for
efficient and sustainable collection. A clear price differentiation policy should also be
formulated to stimulate quality in the supply of the product.

194
Training
Continuous sensitization of collectors and traders is desirable. It can be achieved through
trainings where knowledge and skills are exchanged. These training would focus for instance
on harvesting practices, post-harvesting handling and quality upgrading, management of
forest resources, or market requirements. These exchanges lead to improving product quantity
and quality and an opportunity to explore different market niches with a purpose of obtaining
a higher price. Sensitization is needed as knowledge and awareness creation are probably the
first entry points in markets in the absence of a third control party.
Organisation of the marketing system
A better organization of the marketing system is required with the purpose of distinguishing
professional collectors and reducing costs from marketing. In this context, a market
information system can be developed at the local level so that collectors have easy access to
information on market demands and prices. This can lead to various choices regarding the
market outlets with the advantage of reducing the cost associated with selling gum and
benefitting from better market opportunities.
Traders will also benefit from such information systems which provide information on
market and product quality in terms of reducing transaction costs and price and quality
uncertainties. Infrastructural developments are required in terms of road construction and
maintenance so that transport costs are reduced. Financial institutions should be improved in
terms of easy access to credit such that traders could improve access to the capital needed to
conduct their business.
Associations
Associations of collectors should be encouraged: marketing groups/associations reduce
transaction costs and thereby encourage production. They also bargain higher prices because
they are in direct contact with buyers. Associations can stimulate partnerships with exporters

195
and industry and be a channel through which services could be provided such as financial
assistance or training.
The possibility of creating a traders’ cooperative can also be explored so that provision of
trade services could be done collectively at a low cost. Such services could for instance be in
relation to market assurance, design and enforcement of contracts, provision of market
information, building storage facilities, and facilitating access to finance. However, the
cooperative should act in accordance with certain regulations to avoid that it curbs the
interests of collectors. It should encourage competition for better market performance and
serve as a potential entry and expansion of the market.
7.4 Limitations and future research
Further research is recommended to keep improving our understanding of aspects of the gum
sector in Senegal. In general, the current study has focused on supply markets of gum arabic
in Senegal. However, it has become apparent that the study of a component of the supply
chain needs to have information of other components which may not be its direct target.
Therefore, it is important to have information on the consumer side and understand the
functioning of demand markets.
Specific to the study of quality aspects in chapter 5, we presumed that as different
prices are associated with different grades at the export level in countries that have adopted a
grading system, the same rule should be applicable within the gum producing countries at the
level of collectors so that a high price rewards the efforts in conversion from low to high
quality either during or post harvesting. A theoretical model that explains relationships
between gum grading, costs and price was suggested (appendix 5A.1). It would be interesting
to test the applicability of this model to investigate reasons as to why collectors seem to
supply gum of standard quality and not implement quality maintenance or improvement when
conversion costs are too high vis-à-vis price premiums and why traders do not provide these

196
incentives for enforcing quality maintenance or improvement. Furthermore, there is need to
know the influence of specific environmental factors on quality so that collectors can
anticipate quality changes between and during seasons, such a study would be beneficial in
terms of determining the consistency of quality.
While it was suggested that associations should be encouraged, there are specific areas
that should be explored in the performance of such associations. A research area would be to
investigate their role in the adoption of grades and standards aimed at improving quality and
safety of products. As such adoption may be constrained by capital and transaction costs that
might hinder the development of high quality products (Vandeplas et al., 2009), it is
presumed that these associations can better deal with these challenges compared to individual
producers/collectors; research would confirm whether the associations are indeed able to be
pro-active in the issue of gum quality improvement and maintenance. This is pertinent as
previous studies (e.g., Francesconi, 2009) found that cooperatives/associations may not do
well in terms of quality improvement and products safety.
Specific to chapter 6, we concluded that social and environmental considerations may
be important in the change of systems of tenure. While the environmental aspect has received
attention in the early farming theories, the role of social factors should also be studied.
Finally, another aspect of research could be to explore other forms of institutions in
the gum supply chain (such direct contracts with collectors) and investigate their effects on
livelihoods of collectors and performance of other stakeholders in the gum sector.
197
References
Ackah, C. and Morrissey O. (2005). Trade policy and performance in Sub-Saharan Africa
since the 1980s. Centre for Research in Economic Development and International Trade.
Working Paper 78. Tunis: ADB.
Adriansen H.K. (1999). Pastoral mobility as a response to climate variability in African
drylands. Danish Journal of Geography 99, 1–10.
Adriansen H.K. (2006). Continuity and change in pastoral livelihoods of Senegalese Fulani.
Agriculture and Human Values 23, 215–229.
Agence pour la création d’entreprises (AEPC). (2007). Comment s'implanter au Sénégal?
http://www.apce.com/cid62449/comment-s-implanter-au-senegal.html?pid=92.
Agricultural Research Institute (ARS). (2007). Gum Arabic Substitute.
www.ars.usda.gov/SP2UserFiles/Place/36200000/GumArabicSub_flyer.pdf.
Al-Assaf S., Phillips G.O., Aoki H. and Sasaki Y. (2007). Characterization and properties of
Acacia senegal (L.) Willd. Var. senegal with enhanced properties (Acacia (sen) SUPER
GUMTM): Part 1-Controlled maturation of Acacia senegal var. senegal to increase
viscoelasticity, produce a hydrogel form and convert a poor into a good emulsifier. Food
Hydrocolloids 21, 319-328.
Alchian A.A., and Demsetz H. (1972). Production, information costs, and economic
organization. American Economic Review 62(5), 777–795.
Aleem I.(1990). Imperfect information, screening, and the costs of informal lending: A study
of a rural credit market in Pakistan. The World Bank Economic Review 4 (3), 329-349.
Alexiades M.N. and Shanley P. (2004). Forest products, livelihoods and conservation: case
studies of non-timber forest product systems. Vol 3. Bogor : CIFOR.
Ali B.H., Ziada A. and Blunden G. (2009). Biological effects of gum arabic: A review of
some recent research. Food and Chemical Toxicology 47, 1-8.
198
Alland, R. (1944). Les gommes industrielles. Cours conférences 1310. Jourdan: Maison de la
Chimie.
Allen D.W. (2000). Transaction costs. In Bouckaert B. and De Geest G. (eds.). Encyclopedia
of Law and Economics. Vol. 1. Cheltenham: Edward Elgar.
Alter Africa. (2009). http://www.alterafrica.com/gomme-arabique.htm.
Alvard M.S. and Kuznar L. (2001). Deferred harvests: The transition from hunting to animal
husbandry. American Anthropologist 103(2), 295-311.
Agence Nationale de la Météorologie du Sénégal (ANAMS).(2012) http://www.meteo-
senegal.net/
Agence Nationale de la Statistique et de la Démographie (ANSD). (2010a). Situation
économique et sociale de la région de Louga–2009. Dakar: ANSD
Agence Nationale de la Statistique et de la Démographie (ANSD). (2010b). Situation
économique et sociale de la région de Matam–2009. Dakar: ANSD
Agence Nationale de la Statistique et de la Démographie (ANSD). (2010c). Situation
économique et sociale de la région de Saint Louis–2009. Dakar: ANSD
Agence Nationale de la Statistique et de la Démographie (ANSD). (2010d). Situation
économique et sociale de la région de Tambacounda–2009. Dakar: ANSD
Aoki H., Al-Assaf S., Katayama T. and Phillips G.O. (2007). Characterization and properties
of Acacia senegal (L.) Willd. var. senegal with enhanced properties (Acacia (sen) SUPER
GUM™): Part 2–Mechanism of the maturation process. Food Hydrocolloids 21, 329–
337.
Assoumane A., Delmas D., Favreau B., Vaillant A., Rodier-Goud M., Bastianelli D., Bonnal
L., Zoubeirou A.M., Bezançon G., and Verhaegen D. (2009). Genetic and environmental
basis of gum quality and assessment of range-wide variation. Dakar: Projet
ACACIAGUM.
199
Asylia Gum Company (AGC). (2007). Sylviculture du gommier (Acacia senegal (L.) Willd.)
and production de gomme arabique. Unpublished.
Baker M.J. (2008). A structural model of the transition to agriculture. Journal of Economic
Growth 13 (4), 257–292.
Balarabe O. (2000). Filière Gomme arabique dans le département du Logone et Chari-
Fonctionnement et perspectives d’amélioration. Dschang: FASA
Barbier E.B. (1992). Rehabilitating gum arabic systems in Sudan: Economic and
environmental implications. Environmental and Resource Economics 2 (4), 341-358.
Barbier E.B. (2000). The economic linkages between rural poverty and land degradation:
some evidence from Africa. Agriculture, Ecosystems and Environment 82, 355–370.
Batt P.J. (2004). Incorporating measures of satisfaction, trust and power-dependence into an
analysis of agribusiness supply chains. In Johnson G.I. and Hofman P.J. (eds.).
Agriproduct supply-chain management in developing countries. Bali: ACIAR.
Batt P.J., R. Murray-Prior, Muresk Institute, Dambui C., Api F., Aroga L.K., and Coffee
Industry Corporation (CIC). (2009). Assessing and extending schemes to enhance the
profitability of the Papua New Guinea coffee industry via price premiums for quality.
Canberra: ACIAR.
Belcher B. and Schreckenberg K. (2007). Commercialization of non-timber forest products: a
reality check. Development Policy Review 25(3), 355-377.
Bellemare M.F. and Barrett, C.B. (2006). An ordered tobit model of market participation:
evidence from Kenya and Ethiopia. American Journal of Agricultural Economics 88 (2),
324-337.
Behnke R.H. (1997). Perspective article: Economic models of pastoral land tenure, African
Journal of Range and Forage Science 14(1): 32-37.
200
Berkes F. (2002). Cross-scale institutional linkages: Perspectives from the bottom up. In
Ostrom E., Dietz T., Dolsak N., Stern P.C., Stonich S. and Weber E.U. (eds.). The Drama
of the Commons. Washington: National Academy Press.
Bergman M.A., and Brännlund R. (1995). Measuring oligopsony power. Review of Industrial
Organization 10 (3), 307-321.
Beshai A.A. (1984). The economics of a primary commodity: gum arabic. Oxford Bulletin of
Economics and Statistics 46 (4), 371-381.
Blunt, H.S. 1926. Gum arabic : with special reference to its production in the Sudan. London:
Oxford University Press.
van den Breemer J.P.M., Bergh R.R., and Hesseling G. (1993). La foresterie rurale au
Senegal : participation villageoise et gestion locale. Leiden: Universite de Leiden.
Brorsen B.W., Chavasj P., Grant W.R., and Schnake L.D. (1985). Marketing margins and
price uncertainty: the case of the U.S. wheat market. American Journal of Agricultural
Economics 67(3), 521-528.
Bruce J.W., and Fortmann L. (1999). Contemporary uses of tree tenure. In Buck L.E., Lassoie
J.P., and Fernandes E.C.M. (eds.) Agroforestry in sustainable agricultural systems. Boca
Raton: CRC Press.
Burke W.J. (2009). Triple hurdle model of smallholder production and participation in
Kenya's dairy sector. Msc. Thesis, Michigan State University.
Cameron A.C. and Trivedi P.K. (2010). Microeconometrics using STATA. Revised Edition.
Stata Press.
Centre de suivi Ecologique (CSE). (2006. Projet de valorisation des espèces pour une
utilisation durable des ressources sauvages. Dakar: CSE.
Centre de Suivi Ecologique (CSE). 2009. Annuaire sur l’Environnement et les Ressources
Naturelles du Sénégal (2nd ed). Dakar: CSE.
201
Chen Z., and Lent R. (1992). Supply analysis in an oligopsony model. American Journal of
Agricultural Economics 74 (4), 973-979.
Chikamai B.N., and Odera J.A. (2002). Commercial plant gums and gum resins in Kenya:
sources of alternative livelihood and economic development in the drylands. Nairobi:
Executive Printers.
Chrétin M., Chikamai B., Ekai Loktari P., Ngichili J., Loupa N., Odee D. and Lesueur D.
(2008). The current situation and prospects for gum arabic in Kenya: a promising sector
for pastoralists living in arid lands. International forestry review 10 (1), 18-22.
Church J.R., and Ware R. (1999). Industrial Organization: A Strategic Approach. New York:
McGraw-Hill.
Cohen J.S., and Weitzman M.L. (1974). A Marxian type model of enclosure. Journal of
Development Economics 1(4), 287-336.
Colloïdes Naturels International (CNI). 2008. Acacia gum. www.cniworld.com
Commissariat de l’Afrique Occidentale Française (AOF). (1931). Les grands produits de
l’AOF-La gomme arabique. Paris : Larose.
Cossalter C. (1991). Acacia senegal, gum tree with promise for agroforestry. Hawaii:
Nitrogen Fixing Tree Association.
Couteaudier T.Y. (2007). Export Marketing of Sudanese Gum Arabic. Khartoum: The World
Bank.
Dabo M. (1988). Situation et organisation du commerce intérieur de la gomme arabique au
Senegal. Troisième symposium sur le gommier et la gomme arabique, Saint Louis :
DRPF.
Dafinger A., and Pelican M. (2006) Sharing or dividing the land? :Land rights and herder-
farmer relations in a comparative view. Canadian journal of African studies 40(1), 127-
151.
202
Dale B.G., Williams A.R.T., Barber K.D., van der Wiele A. (1997). Managing quality in
manufacturing versus services: a comparative analysis. Management Service Quality
7(5), 242-247.
Demsetz H. (1967). Toward a theory of property rights. American Economic Review 67 (2),
347–359.
de Janvry A., Fafchamps M., and Sadoulet E. (1991). Peasant household behaviour with
missing markets: some paradoxes explained. Economic Journal 101(409), 1400-1417.
Dione M. (1998). Role des peuplements d'Acacia-gommier de la zone nord et nord est du
Sénégal: bilan d'actions et perspective. Dakar: CNRF.
Dione M., and Sall P.N. (1988). Le gommier et la gomme arabique au Sénégal. Bilan des
actions de recherche et de développement. Perspectives d’avenir. Troisième symposium
sur le gommier et la gomme arabique. Saint Louis : DRPF.
Diop A.A. (2005). Contribution à la conception de programme-Filière gomme arabique.
Dakar : Projet VALEURS.
Direction des Eaux, Forêts, Chasses et de la Conservation des Sols (DEFCCS). 2005. Etude
diagnostique de la filière des gommes et résines et plan décennal de développement du
projet. Dakar: Projet Opération Acacia.
Direction de la Prévision et de la Statistique (DPS). 2005. Région de Matam-Situation
Economique et sociale. Matam : Ministère de l’économie et des finances.
Direction de la prevision et de la statistique (DPS) and World Bank. (2004). La pauvrete au
Sénégal: de la dévaluation de 1994 à 2001-2002. Dakar: DPS.
Eaton D., Meijerink G., Bijman J., and Belt J. (2007). Analysing the role of institutional
arrangements: vegetable value chains in East Africa. Paper presented at the 106th seminar
of the EAAE. Montpellier, 25-27 October.
203
Ellis F. (1988). Peasant economics, farm household and agrarian development. Cambridge :
Cambridge University Press.
Elmqvist B., Olsson L., Elamin E.M., and Warren A. (2005). A traditional agroforestry
system under threat: an analysis of the gum arabic market and cultivation in the Sudan.
Agroforestry Systems 64 (3), 211-218.
Elrayah H.H., Osman M.E., Al-Assaf S., and Ali H.I. (2012). An overview of pre and post-
harvest practices of gum arabic in Sudan. In Kennedy J.F., Phillips G.O., Williams P.A.
(eds). Gum Arabic. World Conference on “New developments in Acacia Gums Research
and Products”, 20-22 September, Wales, UK.
Enriquez C., Arancibia E., and Marshall E. (2006). Incense and copal: Clusia cf. ramosa
(Guttiferae) and Protium sp. (Burseraceae). Two resins: different values, different uses,
one value chain. In Marshall E., Schreckenberg K., and Newton A.C. (eds.).
Commercialization of non-timber forest products: factors influencing success. lessons
learned from Mexico and Bolivia and policy implications for decision-makers.
Cambridge: UNEP.
Entente intervillageoise pour la préservation et l’exploitation des ressources naturelles et
agricoles du Boundou/Gadiaga (EXPERNA). (2006). Rapport d’ activites 2005-2006.
Goudiry: EXPERNA.
Entente inter-villageoise pour la préservation et l’exploitation des ressources naturelles et
agricoles du Boundou/Gadiaga (EXPERNA). (2008). Rapport d’activités. Goudiry:
EXPERNA.
Eskola E. (2006). Agricultural marketing and supply chain management in Tanzania: A case
study. Study on Globalisation and East Africa Economies. Working Paper Series No. 16.
Dar es Salaam: ESRF.
204
Evans J.R., and Lindsay W.M. (2005). The management and control of quality. 6th ed.
Mason: Thomson South-Western.
Fafchamps M. (1996). The enforcement of commercial contracts in Ghana. World
Development 24 (3), 427-448.
Fafchamps M. (1999). Networks, communities, and markets in Sub-Saharan Africa:
Implications for firm growth and investment. Centre for the Study of African Economies.
Working Paper Series 24. Oxford: University of Oxford.
Fafchamps M. (2002). Ethnicity and networks in African trade. Centre for the Study of
African Economies Working Paper Series 20. Oxford: University of Oxford.
Fafchamps M. (2006). Spontaneous markets, networks, and social capital: Lessons from
Africa. Global Poverty Research Group. Working Paper 70. Oxford: University of
Oxford.
Fafchamps M., and Gabre-Madhin E. (2006). Agricultural Trade in Benin and Malawi.
African Journal of Agricultural and Resource Economics 1(1), 67-85.
Fafchamps M., Gabre-Madhin E., and Minten B. (2003). Increasing returns and market
efficiency in agricultural trade. MTID Discussion paper 60. Washington: IFPRI.
Fafchamps M., and Hill R.V. (2005). Selling at farm gate or traveling to market. American
Journal of Agricultural Economics 87(3), 717-734.
Fafchamps M., and Hill R.V. (2008). Price transmission and trader entry in domestic
commodity markets. Global Poverty Research Group. Working Paper 38. Oxford:
University of Oxford.
Fafchamps M., Hill R.V., and Minten B. (2008). Quality control in non-staple food markets:
evidence from India. Agricultural Economics 38(3), 251-266.
Fafchamps M., and Minten B. (1998). Relationships and traders in Madagascar. MTID
discussion papers 24. Washington: IFPRI.
205
Fafchamps M., and Minten B. (2000). Returns to social network capital among traders.
Oxford Economic Papers 54(2), 173-206.
Fafchamps M., and Minten B. (2001). Social capital and agricultural trade. American Journal
of Agricultural Economics 83 (3), 680–685.
Fagg C.W., and Allison G.E. (2004). Acacia senegal and the gum arabic trade. Department of
plant sciences. Tropical forestry papers 42. Oxford: University of Oxford.
Fofana A., and Shabbar J. (2008). Measuring oligopsony power of UK salmon retailers. Land
Economy Research Group. Working Papers 61116. Scottish Agricultural College.
Fortmann L. (1985). The tree tenure factor in agroforestry with particular reference to Africa."
Agroforestry Systems 2(4),229-251.
Francesconi G.N. (2009). Cooperation for competition: linking Ethiopian farmers to markets.
Unpublished doctoral dissertation, Wageningen: Wageningen University.
Freudenberger M.S. (1988). Contradiction des projets de reboisement gommiers: observations
faites dans le département de Linguère (Sénégal). Troisième symposium sur le gommier
et la gomme arabique. Saint Louis : DRPF.
Freudenberger M.S. (1993a). Regenerating the gum arabic economy: local level resource
management in northern Senegal. In: Friedman J., and Rangen H. (eds.). In defense of
livelihood: comparative studies on environmental action. West Hartford: Kumarian Press.
Freudenberger M.S. (1993b). Land tenure, local institutions and natural resources in Senegal
(Synthesis. Volume I). Resource Management and Planning Study. Dakar: USAID.
Gabre-Madhin E. (1999). Transaction costs and market institutions: grain brokers in Ethiopia.
MSSD Discussion paper 31. Washington: IFPRI.
Gabre-Madhin E. (2001). The role of intermediaries in enhancing market efficiency in the
Ethiopian grain market. Agricultural Economics 25 (2/3), 311–320.
206
Gadde L.E., and Snehota I. (2001). Rethinking the Role of Middlemen. Paper for IMP. Oslo,
9-11 September.
Gaudet G., and van Long N. (1993). Vertical integration, foreclosure and profits in the
presence of double marginalisation. Cahiers de recherche du Département des sciences
économiques 9308. Québec: Université du Québec.
Gerakis P.A., and Tsangarakis C.Z. (1970). The influence of Acacia senegal on the fertility of
a sand sheet ('goz') soil in the Central Sudan. Plant and Soil 33 (1), 81-86.
Giffard P.L. (1966). Les gommiers: Acacia senegal Willd. Acacia laeta R. Br. Bois et Forêts
des Tropiques 105 (2), l-32.
Glicksman M. (1969). Gum technology in the food industry. Food science and technology 8.
New York: New York Academic Press.
Global Land cover network (GLCN). (2009). Senegal Land Cover database.
http://www.fao.org/geonetwork/srv/en/main.home?uuid=545be438-bc87-480b-83ec-
ba3f4e486daf
Goetz S.J. (1992). A selectivity model of household food marketing behavior in Sub-Saharan
Africa. American Journal of Agricultural Economics 74(2), 444-452.
Gong W., Parton K., Cox R.J., and Zhou Z. (2006). Transaction costs and cattle farmers’
choice of marketing channels in China: A Tobit analysis. Management Research News 30
(1), 47-56.
Greene W. (2008). Econometric analysis, 6th ed. Jersey: Prentice Hall.
Grell H., and Kirk M. (2000). The role of the donors in influencing property rights over
pastoral resources in Sub-Saharan Africa. In McCarthy N., Swallow B., Kirk M. and
Hazell P. (eds.). Property rights, risk, and livestock development in Africa. Washington:
IFPRI.
207
Grigg D.B. (1974). The agricultural systems of the world: An evolutionary approach.
Cambridge University Press: London.
Grimm M. and Klasen S. (2009). Endogenous institutional change and economic
development: A micro-level analysis of transmission channels, Courant Research Centre:
Poverty, Equity and Growth - Discussion Papers.
Hardin G. (1968). The Tragedy of the Commons. Science New Series 162(3859), 1243-1248.
Hall A.E. (2007). Sahelian Droughts: A Partial Agronomic Solution.
http://www.plantstress.com/Files/Sahel_Drought.pdf.
Harris-White B. (1997). Staple food market efficiency in developing countries: introduction.
Journal of International Development 9 (1), 97–100.
Henson S., and Jaffee S. (2006). Food safety standards and trade: Enhancing competitiveness
and avoiding exclusion of developing countries. European Journal of Development
Research, 18(4), 593‐621.
Hobbs J.E. (1996). A transaction cost approach to supply chain management. Supply Chain
Management: An International Journal 1 (2), 15 – 27.
Hobbs J.E. (1997). Measuring the importance of transaction costs in cattle marketing.
American Journal of Agricultural Economics 79 (4), 1083-1095.
Hoff K., and Stiglitz E.J. (1997). Moneylenders and bankers: price-increasing subsidies in a
monopolistically competitive market. Journal of Development Economics 52, 429-462.
Holloway G., Nicholson C., Delgado C., Staal S., and Ehui S. (2000). Agro-industrialization
through institutional innovation transaction costs, cooperatives and milk-market
development in the East-African Highlands. Agricultural Economics 23 (3), 279-288.
Holt M.T. (1993). Risk response in the beef marketing channel: A multivariate generalized
ARCH-M approach. American Journal of Agricultural Economics 75 (3), 559-571.
208
Homma A.K.O. (1996). Modernisation and technological dualism in the extractive economy
in Amazonia. In Ruiz Perez M. and Arnold J.E.M. (eds). Current issues in non-timber
forest products research. CIFOR: Bogor.
Idris O.H.M. and Haddad G.M. (2012). Gum arabic’s (gum acacia’s) journey from tree to end
user. In Kennedy J.F., Phillips G.O., Williams P.A. (eds). Gum Arabic. World
Conference on “New developments in Acacia Gums Research and Products”, 20-22
September, Wales, UK.
Institut Sénégalais de Recherches Agricoles/ Bureau d’analyses macro-économiques
(ISRA/BAME). (1999). Ressources sauvages du Sénégal : un diagnostic participatif en
zone sylvo-pastorale, Dakar: BAME.
International Trade Center (ITC). (2008). Market News Service.
Iqbal M. (1993). International trade in non-wood forest products: an overview. FAO Working
Paper FO: Misc/93/11. Rome: FAO.
Irle A., and Sass J. (2006) Optimal portfolio policies under fixed and proportional transaction
costs. Advances in Applied Probability 38, 916-942.
Jagwe J., Machethe C., and Ouma E. (2010). Transaction costs and smallholder farmers’
participation in banana markets in the Great Lakes Region of Burundi, Rwanda and the
Democratic Republic of Congo. African Journal of Agricultural and Resource Economics
6(1), 302-317.
Jehle G., and Reny P. (2000). Advanced Microeconomic Theory: 2nd ed. Boston: Addison-
Wesley.
Just R.E., and Chern W.S. (1980). Tomatoes, Technology, and Oligopsony. Bell Journal of
Economics 11(2), 584-560.
Joint FAO/WHO Expert Committee on Food Additives (JECFA), 2006. Combined
Compendium of Food Additive Specifications, Monographs 1(4). Rome: FAO.
209
Jones C.I. (2001). Was an industrial revolution inevitable? Economic growth over the very
long run. Advances in Macroeconomics 1(2).
Kassa H., Tefera B., and Fitwi G. (2011). Preliminary value chain analysis of gums and resins
marketing in Ethiopia: Issues for policy and research. Bogor: CIFOR.
Kelly A.W. (1981). A generalized interpretation of the Herfindahl Index. Southern Economic
Journal 48(1), 50-57.
Key N., Sadoulet E., and de Janvry A. (2000). Transactions costs and agricultural household
supply response. American Journal of Agricultural Economics 82 (2), 245-259.
Khan I.E.,, and Abourashed E.A. (2010). Leung’s Encyclopedia of common natural
ingredients used in food, drugs and cosmetics. New York: John Wiley and Sons.
Kherallah M., Delgado C., Gabre-Madhin E., Minot N. and Johnson M. (2000). The road half
travelled: agricultural market reform in Sub-Saharan Africa. Food Policy Report.
Washington: IFPRI.
Kotler P. (1997). Marketing management: analysis, planning, implementation, and control.
New Jersey: Prentice Hall International.
Kwoka J.E. (1977). Large firm dominance and price-cost margins in manufacturing
industries. Southern Economic Journal 44(1), 183-189.
Lamien N., Sidibe A. and Bayala J. (1996). Use and commercialization of non-timber forest
products in Western Burkina Faso. In Leakey R.R.B., Temu A.B., Melnyk M. and
Vantomme P. (eds.). Domestication and commercialization of non-timber forest products
in agroforestry systems. Proceedings of an international conference held in Nairobi,
Kenya, 19–23 February. Non-wood forest products 9. Rome: FAO.
Lantz B. (2009). The double marginalization problem of transfer pricing: Theory and
experiment. European Journal of Operational Research 196(2), 434-439.
210
Lanzona L., and Evenson R.E. (1997). The effects of transaction costs on labour market
participation and earnings: evidence from rural Philippine markets. Economic Growth
Center, Discussion Paper 790. New Haven: Yale University.
Layton R., Foley R., Williams Chang E., C., Ingold T., Olszewski D.I., Rosenberg M.,
Shackley M.S., Smith E.A. and Zvelebil M. (1991). The Transition between hunting and
gathering and the specialized husbandry of resources: A Socio-ecological approach [and
Comments and Reply]. Current Anthropology 32(3), 255-274.
Leakey R.R.B., and Izac A.M.N. (1996). Linkages between domestication and
commercialization of non-timber forest products: implications for agroforestry. In Leakey
R.R.B., Temu A.B., Melnyk M. and Vantomme P. (eds.). Domestication and
commercialization of non-timber forest products in agroforestry systems. Proceedings of
an international conference held in Nairobi, Kenya, 19–23 February. Non-wood forest
products 9. Rome: FAO.
Lele U. (1981). Co-operatives and the poor: A perspective comparative. World Development
9, 55-72.
Le Goulven K. (2001). Institutions and price transmission in the Vietnamese hog market.
International Food and Agribusiness Management Review 2(2/4), 375-390.
Loertscher S., and Reisinger M. (2009). Competitive Effects of Vertical Integration with
Downstream Oligopsony and Oligopoly. Governance and the Efficiency of Economic
Systems. Discussion Papers 278. Berlin: Free University of Berlin.
Luning P.A. and Marcelis W.J. (2009). Food quality management: Techno-managerial
principles and practices. Wageningen: Wageningen Academic Publishers.
Macrae J. and Merlin G. (2002). The prospects and constraints of development of gum arabic
in Sub-Saharan Africa. A document based on the available literature and field trips to
Chad, Mali and Niger. Africa Tree Crops Initiative. Washington: World Bank.
211
Makhura M.-N., Kirsten J., Delgado C. (2001). Transaction costs and smallholder
participation in the maize market in the Northern province of South Africa. Seventh
Eastern and Southern regional maize conference. 11-15 February.
Mallet B., Besse F., Gautier D., Muller D., Bouba N., and Njiti C. (2002). Quelles
perspectives pour les gommiers en zones de savanes d'Afrique centrale? In Jamin J.Y.,
Seiny Boukar L., and Floret C. (eds.) Actes du colloque-Savanes africaines : des espaces
en mutation, des acteurs face à de nouveaux défis. 27-31 mai, Garoua.
Manlay R.J., Chotte J.L., Masse D., Laurent J.Y., and Feller C. (2002). Carbon, nitrogen and
phosphorus allocation in agro-ecosystems of a West African savanna. Agriculture,
Ecosystems and Environment 88, 249-269.
Marfaing L. (1991). Evolution du commerce au Sénégal: 1820-1930. Racines du présent.
Paris: L’Harmattan.
Marshall E., Schreckenberg K., and Newton A.C. (2006). Commercialization of non-timber
forest products: factors influencing success. Lessons learned from Mexico and Bolivia
and policy implications for decision-makers. Cambridge: UNEP.
Martinez P.H., Glass R. and Alvarez A.F. (2007). Linaloe [Bursera aloexylon (Schiede)
Engl.]: An aromatic wood caught between tradition and economic pressure. Development
Policy Review 25(3), 355-377.
Mbaye I. (1988). Situation et organisation du commerce international de la gomme arabique.
Troisième symposium sur le gommier et la gomme arabique. Saint Louis : DRPF.
Mbaye M.M. (2008). Exploitation de la gomme arabique issue de Acacia senegal. Mémoire
de fins d’études. Thiès: ENSA
McFadden D. (1974). Conditional logit analysis of qualitative choice behaviour. In Zarembka
P. (ed.). Frontiers in Econometrics. New York: Academic Press.
212
McMillan M., Rodrik D., and Welch K.H. (2002). When economic reform goes wrong:
cashews in Mozambique. NBER Working Paper Series 9117. NBER.
Mei B., and Sun C. (2008). Accessing time-varying oligopsony and oligopoly power in the
U.S. paper industry. Journal of Agricultural and Applied Economics 40(3), 927-939.
de Meza D. and Gould J.R. (1992). The social efficiency of private decisions to enforce
property rights. Journal of Political Economy 100 (3), 561-580.
Mendoza M.S., and Rosegrant M.W. (1995). Pricing behaviour in Philippine corn markets:
implications for market efficiency. Research reports 101. Washington: IFPRI.
Menzie E.L., and Prentice B.E. 1987. Formal and informal barriers to trade in agricultural
products. Canada-United States. American Journal of Agricultural Economics 69 (5),
946-951.
Milchunas D. G. and Lauenroth W. K. (1993). Quantitative effects of grazing on vegetation
and soils over a global range of environments. Ecological Monographs 63(4), 327-366.
Moges Y. (2004). Gum and Incense: Recommendations for improved production and income
generation. Consultancy Sub-report No. 6 FARM Africa/SOS Sahel.
Mortimore M. (1998). Roots in the African dust : sustaining the sub-Saharan drylands.
Cambridge: Cambridge University Press.
Mose O.L. (2007). Who gains, who loses? The impact of market liberalisation on rural
households in North-western Kenya. Unpublished doctoral dissertation. Wageningen:
Wageningen University.
Myers G., and Marceau N. (2006). On the early Holocene: Foraging to early agriculture.
Economic Journal 116(513), 751–772.
Myers J.R., Sexton R.J., and Tomek W.G. (2010). A century of research on agricultural
markets. American Journal of Agricultural Economics 92(2), 376–402.
213
National Agricultural Support Services Programme (NASSP). (2006). Opportunities for
Namibian Farmers-Gum Arabic. Novel Products Series (5). Namibia.
Neumann R.P. and Hirsch E. (2000). Commercialization of non-timber forest products:
review and analysis of research. Bogor: CIFOR
Newbury C. W. (1972). Credit in early nineteenth century West African Trade. The Journal of
African History 13(1), 81-95.
Ndione C.M, Sène A., Dieng A.B., Diop O. (2001). Etude de l’organisation et des
performances de filières forestières. Dakar: BAME.
Ndoye O., Ruiz-Perez M., and Eyebe A. (1998). The markets of non-timber forest products in
the humid forest zone of Cameroon. Rural Development Forestry Network Paper 22c.
Overseas Development Institute.
The Network for Natural Gums and Resins in Africa (NGARA) (2008). Acacia gum locations
in Africa. www.ngara.org.
Ngugi K.R., and Nyariki D.M. (2005). Rural livelihoods in the arid and semi-arid
environments of Kenya: Sustainable alternatives and challenges. Agriculture and Human
Values 22, 65-71.
Njomaha C. (2008). Etude socio-économique de la filière gomme arabique dans le Nord et
l’Extrême-Nord Cameroun. Maroua : SNV.
North D.C., and Thomas R.P. (1977). The first economic revolution. Economic History
Review 30(2), 229–241.
Nourse E.G., (1922). The Economic philosophy of co-operation. American Economic Review
12(4), 577-597.
Nussinovitch A. (1997). Hydrocolloid applications : gum technology in the food and other
industries. London: Chapman and Hall.
214
Oates J.F. (1999). Myth and reality in the rain forest : how conservation strategies are failing
in West Africa. Berkeley: University of California Press.
Okatahi S.S., and Onyibe J.E. (1999). Production of gum arabic. National Agricultural
Extension and Research Liaison Services, Extension Bulletin 78. Zaria: Ahmadu Bello
University.
Omamo S.W. (2003). Fertilizer trade and pricing in Uganda. Journal of the South African
Agricultural Economics Association 42, 310-324.
Osman M.E., Abu Zeid I.M., and Adam F.A. (2012). In Kennedy J.F., Phillips G.O., Williams
P.A. (eds). Gum Arabic. World Conference on “New developments in Acacia Gums
Research and Products”, 20-22 September, Wales, UK.
Osman M.E., Williams P.A., Menzies A.R. and Phillips G.0. (1993). Characterization of
commercial samples of gum arabic. Journal of Agricultural and Food Chemistry (41),
71-77.
Palou Madi O., Peltier R., Balarabe O., Ntoupka M., and Sibelet N. (2009). Les filières
gomme arabique au Nord-Cameroun-Impacts du fonctionnement des filières gomme sur
l’organisation des producteurs, la gestion des forêts naturelles et l’encouragement des
plantations d’acacias. In Seiny-Boukar L. and Boumard P. (eds.). Actes du colloque:
Savanes africaines en développement: innover pour durer, 20-23 avril, Garoua.
Partos L. (2009). Sudan scraps gum arabic monopoly to liberalise market.
http://www.foodnavigator.com/Financial-Industry/.
Papke L. E., and Wooldridge J. (1996). Econometric methods for fractional response
variables with an application to 401(k) plan participation rates. Journal of Applied
Econometrics 11, 619–632.
215
Perekhozhuk, O., Grings M., and Glauben T. (2009). Regional-level analysis of oligopsony
power in the Ukrainian milk processing industry: Evidence from Transition Countries.
Paper presented at CEA 43rd Annual Conference. Ontario, 28 - 31 May.
Phillips G.O. (2012) Preface. In Kennedy J.F., Phillips G.O., Williams P.A. (eds). Gum
Arabic. World Conference on “New developments in Acacia Gums Research and
Products”, 20-22 September, Wales, UK.
Pint E.M., and Baldwin L.H. (1997). Strategic Sourcing: Theory and Evidence from
Economics and Business Management. Santa Monica: RAND.
Piyapromdee S., Hillberry R., and MacLaren D. (2008). ‘Fair Trade' coffee and the mitigation
of local oligopsony power. Department of Economics. Working Papers Series 1057,
Melboune: University of Melbourne.
Poulton C., Kydd J., Doward A. (2006). Overcoming market constraint on pro-poor
agricultural growth in Sub-Saharan Africa. Development Policy Review 24 (3), 243-277.
Programme d’eau potable et d’assainissement du millénaire (PEPAM). 2006. Accès à l'eau
potable et à l'assainissement. http://www.pepam.gouv.sn/acces.php?rubr=serv.
Projet valorisation des espèces pour une utilisation des ressources sauvages au senegal
(VALEURS). 2005. Revue des politiques et stratégies forestières-Zone Sylvopastorale
(rapport d’études). Dakar : MEPN.
Quisumbing A., and Otsuka K. (2001). Land, trees, and women evolution of land tenure
institutions in Western Ghana and Sumatra. Research report.
Rabe-Hesketh S., Skrondal A., and Pickles A. (2004). GLLAMM manual. Technical report
160. Division of Biostatistics. Working Paper Series 160. Berkeley: University of
California.
Rahim A.H.A (2006). Economic analysis of deforestation-The case of gum belt in Sudan.
Unpublished doctoral dissertation. Wageningen: Wageningen University,.
216
Rahim A.H.A, van Ierland E.C., and Wesseler J. (2007). Economic incentives for abandoning
or expanding gum arabic production in Sudan. Forest Policy and Economics 10(1/2), 36-
47.
Raper K.C., Love H.A., and Shumway C.R.. 2000. Determining market power exertion
between buyers and sellers. Journal of Applied Econometrics 15 (3), 225-252.
Renkow M., Hallstrom D.G., Karanja D.D. (2004). Rural infrastructure, transactions costs and
market participation in Kenya. Journal of Development Economics 73 (3), 349–367.
Rogers R.T., and Sexton R.J. (1994). Assessing the importance of oligopsony power in
agricultural markets. American Journal of Agricultural Economics 76 (5), 1143-1150.
Ros-Tonen M. (2011). Forest Products-Non-Timber. The Berkshire Encyclopedia of
Sustainability. University of Amsterdam.
Ruben R., van Boekel M., van Tilburg A. and Trienekens J. (eds.). (2007), Tropical food
chains; Governance regimes for quality management. Wageningen: Wageningen
Academic Publishers
Rubinstein A., and Wolinsky A. (1987). Middlemen. The Quarterly Journal of Economics
102 (3), 581-594.
Running S.W., and Mills L.S. (2009). Terrestrial Ecosystem Adaptation. Resources for the
Future. Washington.
Ruttan V. (1989). Institutional-Innovation and Agricultural Development. World
Development 17 ( 9), 1375-1387.
Ruttan V. (2002). Social science knowledge and institutional innovation. Paper prepared for
presentation at the annual meeting of the Society for the Advancement of Socio-
Economics, University of Minnesota. June 28, Minnesota.
Sadoulet E., de Janvry A. and Benjamin C. (1998). Household behavior with imperfect labour
market. Industrial Relations 37(1), 85-108.
217
de Saint Sauveur A. (1994). Improvement of gum and resin production and marketing in
Kenya-Preliminary study. PROPAGE : Nairobi.
Sall N.P. (1997). Acacia senegal (L.) Willd. UNESCO, Paris.
Schlesinger W.H., Reynolds J.F., Cunningham G.L., Huenneke L.F., Jarrell W.M., Virginia
R.A., and Whitford W.G. (1990). Biological feedbacks in global desertification. Science
247,1043-1048.
Schroeter, J., and Azzam A. (1991). Marketing margins, market power, and price uncertainty.
American Journal of Agricultural Economics 73 (4), 990-999.
Seif el Din A.G., and Zarroug M. (1996). Production and commercialization of gum arabic in
Sudan. In Leakey R.R.B., Temu A.B., Melnyk M. and Vantomme P. (eds.).
Domestication and commercialization of non-timber forest products in agroforestry
systems. Proceedings of an international conference held in Nairobi, Kenya, 19–23
February. Non-wood forest products 9. Rome: FAO.
Sène A. (1988). La gomme arabique dans l’économie coloniale de Saint-Louis du Senegal
(18ème-19ème siècle). Troisième symposium sur le gommier et la gomme arabique.
Saint Louis : DRPF.
Sène A., Ndione C.M. (2007). La situation de la filière gomme arabique au Sénégal. Dakar:
Projet ACACIAGUM.
Sexton R.J. (1990). Imperfect competition in agricultural markets and the role of
cooperatives: a spatial analysis. American Journal of Agricultural Economics 72 (3), 709-
720.
Seymour C., and Desmet P. (2009). Coping with drought-do science and policy agree? South
African Journal of Science 105, 18-19.
218
Shackleton C.M., and Shackleton S.E. (2004). The importance of non-timber forest products
in rural livelihood security and as safety nets: A review of evidence from South Africa.
South African Journal of Science 100, 658-664.
Skoufias E. (1995). Household resources, transaction costs, and adjustment through land
tenancy. Land Economics 71(1), 42-56.
Slangen L.H.G., Loucks L.A., and Slangen A.H.L. (2008). Institutional economics and
economic organisation theory: an integrated approach. Wageningen: Wageningen
Academic Publishers.
Smith A. (1776). An inquiry into the nature and causes of the wealth of nations. Oxford: The
Clarendon Press.
Spengler J.J. (1950). Vertical integration and antitrust policy. Journal of Political Economy
50(4), 347-352.
Staal S., Delgado C., Nicholson C.F. (1997). Small-holder dairying under transactions costs in
East Africa. World Development 25(5), 779-794.
Tollens E.F., and Gilbert C.L. (2003). Does market liberalisation jeopardise export quality?
Cameroonian Cocoa, 1988–2000. Journal of African Economies 12 (3), 303–342.
UMR HydroSciences. (2005). Grilles de pluies mensuelles IRD-HSM. Système
d’informations environnementales sur les ressources en eau et leur modélisation
(SIEREM). http://www.hydrosciences.fr/sierem/produits/Grilles/GrillesIRD.asp.
Upton M. (1996). The economics of tropical farming systems. Cambridge: Cambridge
University Press.
United Nations-Food and Agriculture Organization (FAO). (1971). La gomme arabique-
Tendances et perspectives. Commission des Forêts pour l’Afrique. Troisième Session,
Nairobi.
219
United Nations-Food and Agriculture Organization-Statistics Division (FAOSTAT). (2011).
Gum arabic trade statistics. http://faostat.fao.org/site/535/default.aspx#ancor.
United Nations-Food and Agriculture Organization (FAO). (2004). Tropical Livestock Units
(TLU). Virtual Livestock Centre, Livestock and Environment Toolbox.
http://www.fao.org/ag/againfo/programmes/en/lead/toolbox/Mixed1/TLU.htm.
United Nations Statistics Division-COMTRADE ( 2011).
http://unstats.un.org/unsd/databases.htm.
Ushida K. (2012). Gum arabic and its anti-obese effect. In Kennedy J.F., Phillips G.O.,
Williams P.A. (eds). Gum Arabic. World Conference on “New developments in Acacia
Gums Research and Products”, 20-22 September, Wales, UK.
Vakis R., Sadoulet E., and de Janvry A. (2003). Measuring transactions costs from observed
behavior: market choices in Peru. Working Papers 962, Department of Agriculture and
Resource Economics. Berkeley: University of California.
Valdafrique, 2011. Specifications for gum arabic. http://www.valdafrique.com .
Vandeplas A., Minten B. and Swinnen J.F.M. (2009). On food quality in domestic markets of
developing economies. Paper presented at the International Association of Agricultural
Economists Conference. August 16-22, Beijing.
Verbeken D., Dierckx S., and Dewettinck K. (2003). Exudate gums: occurrence, production,
and applications. Applied Microbiology and Biotechnology 63,10-21.
Wane A., Ancey V. and Grosdidier B. (2006). Les unités pastorales du Sahel sénégalais,
outils de gestion de l’élevage et des espaces pastoraux. projet durable ou projet de
développement durable? Développement durable et territoires, Dossier 8 : Méthodologies
et pratiques territoriales de l’évaluation en matière de développement durable.
Webb J.L.A. (1985). The trade in gum arabic: prelude to French conquest in Senegal. Journal
of African History 26(2/3), 149-168.
220
Webb J.L.A. (1995). Desert frontier. ecological and economic change along the Western
Sahel 1600-1850. Madison: University of Wisconsin Press.
Webb J.L.A. (1997). The mid‐eighteenth century gum Arabic trade and the British conquest
of Saint‐Louis du Senegal, 1758. The Journal of Imperial and Commonwealth History
25(1), 37-58.
Wekesa C., Makenzi P.M., Chikamai B.N., Luvanda A.M. and Muga M. (2010). Traditional
ecological knowledge associated with Acacia senegal (Gum arabic tree) management and
gum arabic production in Northern Kenya. International Forestry Review 12 (3), 240-
246.
West D. (2000). Double marginalization and privatization in liquor retailing. Review of
Industrial Organization 16(4), 388-415.
Wickens G.E., Seif El Din A.G., Guinko S., and Nahal I. (1995). Role of Acacia species in
the rural economy of dry Africa and the Near East. Conservation guide 27. FAO: Rome.
Wiersum K.F. (1997). Indigenous exploitation and management of tropical forest resources:
an evolutionary continuum in forest-people interactions. Agriculture, Ecosystems and
Environment 63, 1-16.
Williams P.A., and Phillips G.O. (2009). Gum arabic. In Phillips G.O. and Williams P.A.
(eds.) Handbook of Hydrocolloids, 2nd ed. Cambridge: Woodhead Publishing Ltd.
Williamson O.E. (1991). Comparative economic organization: The analysis of discrete
structural alternatives. Administrative Science Quarterly 36(2), 269-296.
Williamson O.E. (1998). Transaction cost economics: how it works, where it is headed. De
Economist 146 (1), 23-58.
Wohlgenant M.K. (2001). Marketing margins: empirical analysis. In B. Gardner, and G.
Rausser, (eds.). Handbook of Agricultural Economics, Vol.1. Amsterdam: Elsevier
Science B.V.
221
Wooldridge J. (2002). Econometric Analysis of Cross Section and Panel Data. MIT Press.
World Bank (2007). World development report 2008: Agriculture for development.
Washington: World Bank.
World Food Programme (WFP), United Nations-Food and Agriculture Organization (FAO),
Centre de Suivi Ecologique (CSE), Commissariat National à la Sécurité Alimentaire
(SE/CNSA) and Famine Early Warning Systems Network (FEWS NET). (2011)
Comprehensive food security and vulnerability analysis (CFSVA)- Livelihood Zone
Descriptions.
Yang X., Wilkes A., Yang Y., Xu J., Geslani C.S., Yang X., Gao F., Yang J., and Robinson
B. (2009). Common and privatized: conditions for wise management of matsutake
mushrooms in Northwest Yunnan province, China. Ecology and Society 14(2), 30.
Young O.R. Institutional Interplay: The environmental consequences of cross-scale
interactions. In Ostrom E., Dietz T., Dolsak N., Stern P.C., Stonich S. and Weber E.U.
(eds.). The Drama of the Commons. Washington: National Academy Press.
Zucula P.F., and Massinga J. (1993). The organization, behaviour, and performance of the
informal food marketing system in Maputo. Research Working Paper 10,
MOA/MSU/UA.

222
Summary
Gum arabic has an important international market due to its in various industries. Senegal is a
small producing country whose exports are low probably due to problems of developing
internal markets resulting from the lack of price incentives. The study’s main aim is to link
the market side to the collection side in order to investigate factors influencing the
performance of the supply chain of gum arabic. Two themes are the main focus: (1) market
effectiveness in terms of behaviour, decision making process and performance of gum
collectors and gum traders; and (2) market-driven production effectiveness in terms of
quality aspects in marketing of gum and aspects of governance systems of gum collection.
The study area comprises the Sylvopastoral zone and Eastern Region of Senegal where
Acacia senegal trees are found and gum arabic is commercially exploited.
Chapter 2 describes the context of gum arabic collection and trade in Senegal,
highlights the livelihood settings in the study area and lists the constraints to gum marketing
which also limit the people’s incentives to collect gum.
Chapters 3 and 4 examine the market effectiveness in terms of the behaviour and
performance of market chain actors. Chapter 3 examines the behaviour of gum collectors
concerning the decision and amount of gum to collect and subsequently the choice of where
to sell among the available alternative markets. The hypothesis is that access to better and
more remunerative markets provides incentives to collect and market gum; these incentives
are restrained by high transaction costs. Collectors choose to collect and participate in market
with the aim of maximizing their net returns. The quantity collected increases with better
market incentives (i.e., higher expected price), through the use of more inputs such as labour
and by expansion of the area under harvest. Although price is an incentive factor to collect
and sell, it is associated with competition in the communally governed forests. Collectors
prefer to sell in a market where the price is highest and competition with other collectors is
223
lowest or prefer to transact with a regular partner particularly when there are no differences in
prices offered by different traders. In the price-cost trade-off for alternative markets,
collectors also take into consideration transaction costs proportional to the quantity to sell and
the possibility to combine travelling to the market with other activities such as buying
consumer goods.
Chapter 4 focuses on the sequential chain of gum traders and investigates whether the
oligopsonist structure of the chain leads to lower prices following multiple marginalisation
tendencies. Gum traders are classified in primary, transport and wholesale markets depending
on the size of their transactions. Benefiting from economies of scale, wholesalers earn the
highest margins whereas primary traders have high unit costs, which results in low payments
to gum collectors. Shares of traders in markets are calculated and corresponding Herfindahl
indices are derived. The Herfindahl indices are not sufficiently high to point to strong
oligopsonistic tendencies. The market share of a trader is positively influenced by their access
to capital and market infrastructure and negatively by the level of competition in the market in
which they operate. The market power does not influence the margins earned by traders.
These margins seem to depend more on supply conditions, marketing costs, perception of
price uncertainty and risk. High risk perception is probably the most important cause of
market exit.
Chapters 5 and 6 examine the production/collection effectiveness in terms of the
quality of the gum supplied and the property rights systems for gum collection. In chapter 5,
the field and laboratory assessments of quality are compared. On the field, collectors and
traders classified gum samples based on visible quality attributes. The laboratory assessment
was based on the analysis of chemical components of these samples which were matched to
the minimal chemical quality requirements set by users (defined in terms of cleanness and low
mineral matter). The comparison of field and laboratory assessments shows that the

224
assessment of good gum quality by collectors and traders does not always match the
laboratory minimum standards. The assessment by collectors and traders is highly subjective
and differs from village to village. The bad quality gum as indicated by collectors and traders
was also bad in the chemical assessment, but gum that was classified as good by collectors
and traders was not always good in terms of user’s requirements. An examination of the
determinants of quality supply for two visible attributes (size and cleanliness of gum nodules)
shows the importance of good harvest and post-harvest practices. Supply of quality gum is
also a response to market conduct and market-driven collection incentives. The market
conduct shows inconsistencies in the preference for quality attributes because the traders’
knowledge of quality is not much higher than that of collectors, except for traders with a long
experience. In the current market setting, no price premiums are given for better quality gum.
High gum prices in one season seem to attract occasional collectors to the communal forests,
which again reduces the collector’s incentive to invest in gum quality. These price incentives
also have an effect on the relative demand for quality because at high price levels, demand for
undifferentiated or lower quality gum increases whereas demand for high quality gum is
relatively higher at low price levels. Therefore, only quality premiums may have a positive
effect on the supply of good quality gum.
Chapter 6 investigates factors that influence the currently slow transition from
communal systems of gum collection to efficient private systems. The theoretical model
predicts that private systems may be preferred to communal systems when competition
increases because the household utility declines and communal systems are preferred when
the cost of regulation is high. The systems of management of Acacia resources in Senegal are
distinguished by the mode of acquisition, and tree markings, these are an indication of
exclusive use rights. Empirical results confirmed that the emergence of private systems in
gum collection depends on the availability of the gum resource which should be proportionate
225
to the available labour in such a way that the collector can expect to increase his collection.
Market developments are also important but they lead to an increase in competition over
resources notably when the price is sufficiently high to attract occasional collectors. Private
systems are preferred because of their economic and potential environmental benefits.
Communal systems are maintained when the monitoring cost of regulation and enforcement
of the property rights in private systems is economically and socially high and when the
insurance function performed by these communal systems is important. While the transition
from communal organisation of collection to efficient private collection systems mainly
depends on the assessment of economic benefits and costs, the transition process is guided by
the importance attached to environmental and social considerations.
In chapter 7, the main findings of the study are summarized and their policy
implications are discussed. The study limitations and future research areas are also given. The
findings are that, first, productivity-enhancing methods may be adopted such as increasing
labour productivity and regulating competition in forests where gum is collected. Market
incentives are also fundamental for the continuation of collection; they should be sufficiently
high to cover for the costs of collection and marketing gum. Secondly, traders in the gum
markets do not necessarily take advantage of their oligopsonistic structure and exercise their
power in an exploitative manner. A trader’s accession and share in the market depends on the
access to various forms of capital and the market characteristics. The margin he earns reflects
the costs, uncertainty and risk of trade which may even cause his exit from the market.
Thirdly, quality as required by the user may not be directly linked to the visible quality
attributes in the field; an opportunity to increase good quality on the field increases the
likelihood of obtaining chemically good gum. Good harvest and post-harvest practices are
crucial to the supply of quality. To stimulate the supply of good quality gum, a price
differentiation is required such that good quality is rewarded with a premium. Finally, the

226
transition from communal organisation of collection to efficient private collection systems
depends mainly on the assessment of economic benefits and costs. However, the importance
attached to environmental and social considerations may also play a role in the process of
change of governance systems especially in the drylands where gum arabic is collected.
The main policy implications include the need for expansion and maintenance of the
Acacia senegal resource base, direct market interventions, continuous sensitization of
collectors and traders, and a better organization of the marketing system. Furthermore,
associations of collectors and of traders could potentially contribute to market access because
of the various functions that these associations may possibly perform in the gum sector.
227
Samenvatting
De internationale markt voor arabische gom is belangrijk voor verschillende industriële
sectoren. Senegal is een klein productieland voor arabische gom; het lage productiecijfer is
mede een gevolg van problemen die de ontwikkeling van een interne markt verhinderen,
waardoor de prijs die aan gom producenten/verzamelaars wordt aangeboden, te laag wordt
bevonden. Het doel van deze studie is om marktontwikkeling te linken aan de productie-
aspecten om zo de factoren te kunnen bepalen die een invloed hebben op het functioneren van
de keten voor arabische gom. De focus ligt op twee thema’s, namelijk (1) de markt
effectiviteit in termen van het gedrag, de besluitvormingsprocessen en de economische
bijdrage van producenten, en handelaren in gom; en (2) de marktgestuurde effectiviteit van
productie in termen van kwaliteit en het beheer van de productie gebieden van gom. Het
studiegebied is de Sylvopastoral zone en de Eastern Region van Senegal waar Acacia senegal
bomen voorkomen en arabische gom wordt gecommercialiseerd.
Hoofdstuk 2 beschrijft de context waarin arabische gom wordt verzameld en
verhandeld in Senegal; het bespreekt de vormen van levensonderhoud in het
onderzoeksgebied en geeft een overzicht van de beperkingen in de handel van gom, die op
hun beurt de prikkel tot het verzamelen van gom negatief beïnvloeden.
Hoofdstukken 3 en 4 bespreken de markteffectiviteit in termen van het gedrag en de
prestatie van de actoren in de markt. Hoofdstuk 3 bestudeert de beslissingen van verzamelaars
om al dan niet gom te verzamelen en hoeveel gom er wordt verzameld, met daaropvolgend de
keuze in welke van de alternatieve toegankelijke markten de gom wordt verkocht. De
hypothese is, dat de toegang tot een betere en meer winstgevende markt een aansporing zal
zijn tot het verzamelen en vermarkten van gom: deze prikkel wordt echter sterk beïnvloed
door de hoge transactiekosten. Verzamelaars van gom kiezen er voor gom te verzamelen en te
vermarkten met het doel om netto winsten te maximaliseren. De hoeveelheid gom die wordt

228
verzameld, neemt toe met betere marktprikkels (meer bepaald door een hogere verwachte
prijs), met een grotere inzet van inputs zoals arbeid en een uitbreiding van het gebied waarin
de gom wordt verzameld. Een hogere prijs wordt echter geassocieerd met een grotere mate
van concurrentie van verzamelaars in de wouden die gemeenschappelijk beheerd worden.
Verzamelaars verkiezen om hun gom te verkopen in een markt waar ze de hoogste prijs zullen
krijgen en waar de concurrentie met andere verzamelaars het laagst is, of ze verkiezen om hun
gom te verkopen aan een vertrouwde handelspartner als er geen duidelijk prijsverschil is
tussen de prijzen die worden aangeboden door de verschillende handelaren. De verzamelaars
houden ook rekening met variabele transactiekosten (dit zijn de transactiekosten die
proportioneel zijn aan de te verkopen hoeveelheid) en de mogelijkheid om het transport naar
de markt te combineren met andere activiteiten zoals het aankopen van algemene
benodigdheden van het gezin.
Hoofdstuk 4 focust op de opeenvolgende handelaren in de keten van gom met het doel
te onderzoeken of oligopsonistische structuren leiden tot lagere prijzen als gevolg van
meervoudig marginalisatie in de keten. Verschillende groepen handelaren in gom kunnen
worden onderscheiden op basis van de omvang van hun transacties, meer bepaald gaat het
over primaire handelaren, transporteurs, en groothandelaren. Als gevolg van schaalvoordelen
kunnen groothandelaren de hoogste marges realiseren, terwijl de primaire handelaren de
hoogste kosten per eenheid hebben wat resulteert in een lage prijs die wordt betaald aan
gomverzamelaars. Het marktaandeel van de individuele handelaren in de markten werd
berekend evenals de overeenkomstige Herfindahl indices. Deze zijn echter niet voldoende
hoog om te kunnen zeggen dat er sterke oligopsonistische tendensen zijn in de markten. Het
marktaandeel dat een individuele handelaar realiseert, is positief gerelateerd met diens
kapitaal en marktinfrastructuur terwijl meer concurrentie in de markt het marktaandeel van
een handelaar doet dalen. Kapitaal en marktkarakteristieken bepalen eveneens de mogelijke

229
markttoegang. Marktmacht heeft ook verder geen invloed op de marges die de handelaren
realiseren. Deze marges blijken af te hangen van het aanbod, marketingkosten, en perceptie
van onzekerheid over de prijs en risico. Een hoge perceptie van risico is waarschijnlijk één
van de belangrijkste oorzaken van het verlaten van de markt.
Hoofdstukken 5 en 6 bepalen de effectiviteit in productie/verzameling in termen van
de kwaliteit van gom en het systeem van eigendomsrechten voor gomverzameling. In
hoofdstuk 5 worden kwaliteitswaarnemingen in het veld en uit laboratoriumtesten vergeleken
op basis van specificaties die de gebruikers aangeven. In het veld werden verzamelaars
gevraagd om de gomstalen te klasseren op basis van visuele kwaliteitsattributen. De resultaten
uit het laboratorium zijn gebaseerd op een analyse van de chemische componenten van deze
stalen. Een vergelijking van beide resultaten toont dat de waarnemingen van gomkwaliteit
door de verzamelaars en de handelaren niet altijd overeenkomen met de evaluatie in het
laboratorium van wat gebruikers aan chemische kwaliteit van de gom eisen. Verzamelaars en
handelaren bepalen kwaliteit op een subjectieve manier en de beoordeling verschilt van dorp
tot dorp. Gom die door verzamelaars en handelaren als van slechte kwaliteit wordt
beschouwd, werd ook steeds zo aangeduid door de laboratoriumtesten. Gom die door de
verzamelaar of handelaar als van goede kwaliteit werd aangeduid, voldeden echter niet aan de
minimale chemische kwaliteitsnormen van de gebruikers. Voor de waarneming van kwaliteit
door zowel de verzamelaars en handelaars, en de gebruikers, zijn helderheid en laag mineraal
gehalte van belang. Een analyse van de determinanten van gom kwaliteit gemeten door de
twee visuele attributen (grootte en zuiverheid van de gom klompjes) wijst op het belang van
oogsttechnieken en de verwerking na de oogst. De kwaliteit van de aangeboden gom reageert
ook op de markt en de prikkels die deze verschaft. De markt lijkt niet consistent te reageren
op de voorkeur voor kwaliteitsattributen omdat de handelaren kwaliteit niet beter kunnen
onderscheiden dan verzamelaars tenzij zij al een langere tijd in de handel van gom actief zijn.
230
De prijs is niet gedifferentieerd naar de verschillende kwaliteitsniveaus van gom, waardoor
het aanbod van gom van betere kwaliteit beperkt blijft. Dit is ook omdat bij een hogere prijs
meer verzamelaars worden aangetrokken om gom te verzamelen in de communale bossen. De
prijs zou ook een effect hebben op de relatieve vraag voor kwaliteit. Bij hogere marktprijzen
is er een grotere vraag naar niet-gedifferentieerde gom of gom van lagere kwaliteit, terwijl de
vraag naar gom van hoge kwaliteit groter is wanneer de marktprijzen relatief laag zijn. Er
ontstaat dan een prijstoeslag die aanzet tot het aanleveren van gom van hogere kwaliteit.
Hoofdstuk 6 onderzoekt de factoren die een invloed hebben op de trage transitie van
een communaal systeem van gomverzameling naar een efficiënter privaat systeem. Het
theoretische model voorspelt dat private systemen te verkiezen zijn boven communale
systemen wanneer de concurrentie van verzamelaars toeneemt omdat het nut van een
individueel huishouden dan afneemt. De netto winsten van privatisering moeten echter ook
groter zijn dan het nut van het communale systeem. Dit communale systeem is te verkiezen
wanneer de kosten van regulering te hoog oplopen. De beheerssystemen van Acacia bomen in
Senegal zijn te onderscheiden naar de manier waarop de bomen zijn verworven, en de
aanduiding op de bomen. Deze aanduidingen geven exclusieve gebruiksrechten weer. De
empirische resultaten bevestigen dat huishoudens gom verzamelen op privaat land als er
voldoende Acacia bomen aanwezig zijn, en als er navenant voldoende arbeidskrachten zijn in
het gezin om de gom te verzamelen. De ontwikkeling van de markt is ook belangrijk maar het
verhoogt de concurrentie om Acacia bomen, zeker wanneer de prijs voor gom voldoende
hoog is om occasionele verzamelaars aan te trekken. Private systemen zijn te verkiezen
omwille van de economische voordelen en het mogelijk positief effect op de
milieubescherming. Communale systemen blijven behouden wanneer de sociale en
economische kosten voor het controleren van het naleven van de wetgeving en het opleggen
van de toegangsrechten hoog zijn, en wanneer het communale bos een vorm van verzekering

231
betekent voor de huishoudens. De transitie van een communale organisatie van de
gomverzameling naar een efficiënte privaat systeem voor verzameling hangt voornamelijk af
van een afweging van economische baten en kosten, terwijl het transitie proces meer afhangt
van het belang dat wordt gehecht aan milieu en sociale randvoorwaarden.
Hoofdstuk 7 vat de belangrijkste bevindingen van de studie samen en bespreekt de
beleidsimplicaties. De beperkingen van de studie en de mogelijke vragen voor toekomstig
onderzoek worden gegeven. De bevinding zijn dat, ten eerste, er maatregelen om de
productiviteit te verhogen kunnen worden genomen: de arbeidsproductiviteit kan hoger en de
concurrentie in het bos waar gom wordt verzameld kan beter geregeld worden. Verder is de
markt bepalend om van gomverzameling een blijvende activiteit te maken. De prikkels door
de markt gecreëerd, moeten voldoende groot zijn om de kosten van verzameling en het
vermarkten van gom te dekken. Ten tweede, handelaren in de markten van gom profiteren
niet noodzakelijk van de oligopsonische structuren en ze buiten hun markmacht niet uit. Het
toetreden van een handelaar en het marktaandeel hangen af van de toegang tot verschillende
vormen van kapitaal en marktkarakteristieken. De marge die een handelaar verdient, is meer
een weergave van de kosten, onzekerheidsgevoel en perceptie van risico; deze factoren
kunnen zelfs een exit uit de markt betekenen. Ten derde, kwaliteit zoals minimaal
aanvaardbaar door de gebruiker is niet steeds gelinkt aan de uiterlijke kwaliteitskenmerken
zoals die in het veld kunnen worden waargenomen; toch is de kans groter op een goede
chemische kwaliteit als de gom ook als goed werd bevonden in het veld. Gepaste oogst- en
na-oogsttechnieken zijn cruciaal voor het aanleveren van kwaliteitsgom. Om het aanbod van
kwaliteit te stimuleren is echter wel een prijsdifferentiatie nodig. Tot slot, hangt de transitie
van een communale organisatie van Acacia bossen naar meer efficiënte private
verzamelsystemen voornamelijk af van het afwegen van economische baten en kosten.

232
Daarnaast is zijn ook sociale aspecten en milieu belangrijk in het veranderingsproces van de
beheerssystemen, voornamelijk in de droge gebieden waar arabische gom wordt verzameld.
Een belangrijke implicatie voor het beleid zijn de vragen naar een uitbreiding en
onderhoud van de bossen met Acacia senegal, directe marktinterventie, voortdurende
sensibilisering van verzamelaars en handelaars en een betere organisatie van het
marktsysteem. Daarenboven kunnen associaties of groeperingen van verzamelaars en
handelaren worden aangemoedigd omdat deze op tal van vlakken mogelijk kunnen bijdragen
tot de gomsector.
233
Résumé
La gomme arabique a un marché international important dans diverses industries. Le Sénégal
est un petit pays producteur de la gomme arabique dont les exportations sont faibles sans
doute en raison des problèmes de développement des marchés internes, ceux-ci résultent de
l'absence des prix incitatifs. L’objectif principal de cette étude est de relier le côté du marché
à celui de la récolte de la gomme arabique afin d'étudier les facteurs qui influencent la
performance de la chaîne de valeur de la gomme arabique. Deux thèmes font l’objet principal
de l’étude: (1) l'efficacité du marché en termes de comportement et de processus décisionnel
des récolteurs de la gomme, ainsi que le comportement et la performance des commerçants de
la gomme; et (2) l'efficacité de la production axée sur le marché en termes d'aspects de la
qualité lors de la commercialisation de la gomme, et des systèmes de gouvernance de la
récolte de la gomme. La zone d'étude comprend la Zone Sylvopastorale et la Région Orientale
du Sénégal où les arbustes d’Acacia senegal sont localisés et la gomme arabique y est
exploitée commercialement.
Le chapitre 2 décrit le contexte de la récolte et du commerce de la gomme arabique au
Sénégal, souligne les moyens de subsistance de la zone d'étude et dresse la liste des
contraintes à la commercialisation de la gomme qui, également limitent les incitations des
gens pour récolter la gomme.
Les chapitres 3 et 4 examinent l'efficacité du marché en termes de comportement et de
performance des acteurs du marché dans la chaîne de valeur. Le chapitre 3 examine le
comportement des récolteurs de la gomme concernant la décision d’effectuer la récolte et la
quantité de la gomme à récolter. Par la suite, le choix se porte sur le marché de vente parmi
les marchés alternatifs disponibles. L'hypothèse de l’étude est que l'accès aux marchés plus
efficaces et plus rémunérateurs est un facteur incitant la récolte et la commercialisation de la
gomme; l’effet incitatif est atténué par les coûts de transaction élevés. En effet, les récolteurs

234
choisissent de récolte et de participer au marché dans le but de maximiser leurs rendements.
La quantité collectée est stimulée par le marché (meilleurs prix) tout en augmentant l'usage
d’'intrants tels que le labeur ou l'expansion de la zone de récolte. Bien que le prix est un
facteur d'incitation à récolter et vendre la gomme, il est associé à la concurrence dans les
forêts gouverne en commun. Lors de la commercialisation, les récolteurs choisissent un point
de vente où le prix est plus élevé et la concurrence avec d'autres récolteurs est plus basse.
Dans plusieurs cas, ces récolteurs préfèrent traiter avec un partenaire régulier et en particulier
quand il n’existe pas de grandes différences dans les prix offerts par différents commerçants.
Dans leurs décisions, les récolteurs prennent également en considération les coûts de
transaction proportionnels à la quantité à vendre, et la possibilité de combiner la fréquentation
du marché avec d'autres activités telles que l'acquisition d'autres articles ménagers.
Le chapitre 4 enquête sur la chaîne séquentielle des commerçants de la gomme. Le but
de l’étude est de savoir si leur structure oligopsoniste conduit à une baisse des prix dans une
tendance de marginalisation multiple. Une classification des commerçants de la gomme
arabique est effectuée dans les marchés primaires, de transport et des grossistes en fonction de
la taille de leurs opérations. Grâce aux économies d'échelle, les grossistes gagnent de très
élevées marges tandis que les commerçants primaires ont des coûts unitaires élevés qui
résultent de faibles paiements aux récolteurs de gomme. Les parts des commerçants dans les
marchés ont été calculés et les correspondants indices de Herfindahl ont été tirées. Ces indices
n'étaient pas suffisamment élevées pour confirmer de fortes tendances oligopsonistiques. La
part d'un opérateur dans un marché dépend positivement du capital et de l’ infrastructure du
marché alors que la concurrence sur le marché la réduit. Les caractéristiques du capital et du
marché déterminent également les possibilités d'accès au marché. Le pouvoir du marché n'a
aucune influence sur les marges perçues par les commerçants. Ces marges semblent dépendre
des conditions d'approvisionnement, des coûts de commercialisation, de la perception de

235
l'incertitude du prix et du risque. L'ampleur du risque est probablement la cause la plus
importante de la sortie du marché.
Les chapitres 5 et 6 examinent l'efficacité de production/récolte en termes de la qualité
de la gomme et des systèmes des droits de propriété associés à la récolte de la gomme. Dans
le chapitre 5, une comparaison basée sur les spécifications des usagers de la gomme arabique
a été effectuée. Cette comparaison incluait différentes évaluations de la qualité de la gomme,
l’une faite sur terrain par les récolteurs et les commerçants de la gomme arabique et l’autre
faite au laboratoire. Sur terrain, les récolteurs et les commerçants ont classé les échantillons
de gomme en fonction des attributs visibles de la qualité. L'évaluation au laboratoire a été
basée sur l'analyse des composants chimiques de ces échantillons. La comparaison montre
que l'évaluation de la qualité de gomme par les récolteurs et les commerçants ne coïncident
pas toujours avec l'évaluation de la qualité par les utilisateurs. L’évaluation par les récolteurs
et les commerçants est en fait très subjective et diffère d’un village a un autre. La mauvaise
qualité reconnue par les récolteurs et les commerçants est néanmoins confirmée par
l'évaluation des utilisateurs, mais la bonne qualité du point de vue des récolteurs et des
commerçants n’est pas toujours trouvée bonne en termes des besoins des usagers ; le lien
commun entre l'évaluation par les récolteurs et commerçants et celle des utilisateurs est la
propreté ou la faible contenance de la matière minérale. L'analyse des déterminants de l'offre
de la qualité de la gomme arabique en termes de deux de ses visibles attributs (taille et
propreté des nodules de gomme) montre l'importance du respect des procédures de récolte et
d’après la récolte. La qualité dépend également de la conduite des marchés et des incitations
de récolte axées sur le marché. Le comportement du marché montre des incohérences dans la
préférence des attributs de qualité parce que la connaissance de la qualité par les commerçants
n'est pas plus élevée que celle des récolteurs à moins qu'ils aient une longue expérience dans
le commerce. Les prix plurivalents offerts par le marché limitent l'offre de bonne qualité parce
236
que les prix incitatifs créent une concurrence dans les forêts communales où la gomme est
recueillie en attirant les récolteurs occasionnels. Ces incitations par les prix ont également un
effet sur la demande relative de la qualité : en raison des prix élevés, la demande pour la
qualité indifférenciée ou moins bonne est plus élevée alors que la demande de haute qualité
est relativement plus élevé à un bas prix. Par conséquent, une incitation effective à fournir la
gomme de haute qualité est une différenciation des prix de telle sorte que celle de bonne
qualité est récompensée par sa prime.
Le Chapitre 6 examine les facteurs qui influencent la lente transition en cours dans les
systèmes de gouvernance de la récolte de la gomme des systèmes collectifs aux systèmes
privés efficaces. Entre les extrêmes de ces systèmes se trouvent des systèmes mixtes. Le
modèle théorique prédit que les systèmes privés peuvent être préférés des systèmes collectifs
lorsque la concurrence s'intensifie, parce que l'utilité recueillie par les ménages baisse, alors
que les gains nets provenant de la privatisation dépassent l'utilité acquise lors de la récolte
dans les systèmes collectifs. Ces derniers sont préférés lorsque le coût de réglementation est
élevé. Les systèmes de gestion des ressources d'acacia au Sénégal se distinguent par le mode
d'acquisition et le marquage des arbres. Celui-ci est une indication des droits d'utilisation
exclusifs. Les résultats empiriques ont confirmé que l'émergence des systèmes privés dans la
récolte de gomme dépend de la disponibilité des ressources qui doivent être proportionnée à
un main-d'œuvre disponible de telle sorte que le récolteur peut s'attendre à augmenter sa
collection. L'évolution du marché est également importante, son seul inconvénient est qu’elle
conduirait à une augmentation de la concurrence sur les ressources, notamment lorsque le prix
est suffisamment élevé pour attirer les récolteurs occasionnels. Les systèmes privés sont
préférés en raison de leur potentiel économique et des avantages environnementaux. Les
systèmes collectifs sont maintenus lorsque le coût des droits de réglementation et leur
application est économiquement et socialement élevé en termes de coût de la surveillance et la

237
fonction d'assurance effectuées par ces systèmes. Alors que la transition de l'organisation
communale de la récolte aux systèmes de récolte privés dépend principalement de l'évaluation
des avantages et des coûts économiques, le processus de transition résulte de l'importance
accordée aux considérations environnementales et sociales.
Dans le chapitre 7, les principales conclusions de l'étude sont résumés et leurs
implications politiques sont discutées. Les limites de l'étude et les domaines de recherche
futurs sont également indiqués. Les conclusions sont que, premièrement, pour accroître la
productivité, différentes méthodes peuvent être adoptées telle que l'augmentation de la
productivité du travail et la régulation de la concurrence dans les forêts où la gomme est
recueillie. Les incitations du marché sont également fondamentales pour la poursuite de la
récolte, ils devraient être suffisamment élevées pour couvrir les coûts de récolte et de
commercialisation de la gomme. Deuxièmement, les commerçants dans le marché de la
gomme arabique ne sont pas nécessairement exploiteur de leur structure oligopsoniste en
exerçant leur pouvoir de manière abusive. L'entrée d'un commerçant dans un marché et ses
parts dépendent de l'accès à diverses formes du capital et aux caractéristiques du marché. La
marge qu'il gagne reflète les coûts, l'incertitude sur les prix et les risques du commerce qui
peuvent même causer sa sortie du marché. Troisièmement, la qualité tel que requise par
l’usager n’est pas toujours directement liée aux attributs de la qualité observés sur le terrain;
une occasion d'améliorer la qualité dès la collecte augmente la probabilité d'obtenir une bonne
gomme selon une analyse chimique. De bonne pratiques lors de la récolte et post-récolte sont
cruciales pour la provision de la qualité. Pour stimuler cette provision, une différenciation des
prix est nécessaire de telle sorte que celle la bonne qualité soit récompensée par une prime de
qualité. Enfin, la transition de l'organisation collectif aux systèmes privés de récolte dépend
principalement de l'évaluation économique des avantages et coûts. Toutefois, l'importance
accordée aux considérations environnementales et sociales devrait également jouer un rôle

238
dans le processus de transition dans les systèmes de gouvernance des ressources en particulier
dans les milieux arides où la gomme arabique est récoltée.
Les implications politiques principales comprennent une nécessité d'expansion et
maintenance des ressources de base, notamment Acacia senegal, des interventions directes sur
le marché, une sensibilisation continue orientée aux récolteurs qu’aux commerçants de la
gomme et une meilleure organisation du système de commercialisation. En outre, les
associations des récolteurs et celles des commerçants devraient être explorées et encouragées
en raison de différentes fonctions qu’elle pourraient éventuellement effectuer dans le secteur
de gomme.

239
Acknowledgements
I now remember the talks I held with my family in 2007 when I was convincing my parents,
husband and siblings that I understood what I was going to do for the next four years; they
were worried about embarking on something totally new, in a new environment, in a place
where I knew nobody. Maybe, if I had been wiser, I wouldn’t be here now, but I am glad that
I took on this challenge and worked on this thesis. I am thankful for the invaluable support
from many individuals and organisations that contributed to the completion of this thesis.
I take this opportunity to first thank my promoter, Prof. Erwin Bulte for your guidance
and critical comments both during the period of formulising my research proposal and during
the thesis write-up. I thank my supervisors, your constructive suggestions and comments have
shaped my thinking and writing which led to this final product: Dr. Kees Burger, thank you
very much for your critical insights and astute comments, I have learnt a lot from you and I
appreciate your patience in directing me through my crazy ideas; Dr. Marijke D’Haese, I am
very grateful that you accepted to be stuck with me for this long period since my Master
thesis, for your constructive ideas and sketches, for your support, concern and
encouragements and for the time you spent in Rwanda during which you greatly helped me to
have a focus and from then progress in analysing my data.
Many thanks to Prof Cees Leuwis and Dr. Hofstede Gertjan for your comments and
constructive suggestions.
I am indebted to the colleagues of CNRF/ISRA and KEFRI who were involved in the
ACACIAGUM Project. You patiently led my steps and supported me throughout my study
and field work either in Kenya or Senegal: Dr. Didier Lesueur, Dr. Ben Chikamai, Dr. Daniel
Nyamai, Dr. Macoumba Diouf, Abdourahmane Tamba, Abibou Gaye, Thomas, Momar
Wade, Mayécor Diouf, Mame Sokhna Sarr, Adja, Sheila Mbiru, and the brothers: Meshack
Muga, Luvanda Albert, and Chemuku Wekesa, thank you very much to you all. To Damaris,

240
Mercy Chembuku, and Rose O’ganga, thanks for the welcome and the care in NGARA and
KEFRI.
Many special thanks to late Mme Astou Sène. Dear Mme Sène, I hope that you left,
knowing that I appreciated your hospitality in Senegal and in your family and all your help
and comments.
To my other ACACIAGUM colleagues in Cameroon and Nigel especially Oumarou
Palou Madi and Dr. Alzouma Zouberiou, thanks for the good collaboration and your insights.
My sincere thanks to Dr. Julia Wilson for your collaboration, interest in the quality issues of
gum arabic. Many thanks to the laboratories of CEH and CIRAD for their analysis of the gum
samples properties.
Special thanks to Mamadou Ndiaye of Asylia Gum Company for a long introduction
on Acacia senegal and gum arabic, and to Pr. Abdoulaye Sanokho of MCI, Dr. Sakho of
Valdafrique and to Mme Condey Sylla then in DEFCCS for your time and inputs.
A big thank you to Opa Cissokho, you not only welcomed me in Tambacounda, but
also in Experna, ARD and to your home. I sincerely appreciate your help in organising and
conducting the surveys, trainings and discussions and your willingness to share your
experiences.
In particular, I am also indebted to James Odour for welcoming me in the Arid Lands
Resource Management Project and to his team specially Kennedy Karani for introducing me
to the GIS world.
I also express my sincere thanks to the gum collectors and various traders in Senegal
and Kenya who provided me with the data on which this thesis is built, thanks for your trust
in accepting to share your life and time. Special thanks to Amadou Signaté who welcomed in
Dahra, the Marsabit South-District commissioner, the Préfet of Goudiry, and several families
for their hospitality and help in organising interviews and group discussion: Laety Niang,

241
Aliyou Ndiaye , Seydou Soumé, Ousmane Mangane, Dame Niang, Daouda Mangane, Ndoula
Sarr, Hamet Baby, Chief Dieng, Yéro Diallo, Daouda Fadé, and Pape Ndiaye. Dame Niang,
thanks for accepting me as a visitor and for making me a special member of your family by
naming your baby after me, I hope the little Gaudiose will grow up well to fulfil her dreams.
I am equally grateful to Lamine Ndiaye, Ibou Sène, Oumar Sakho, Demba Diallo, Aly
Bocar Anne, Houssenou Cissokho, Ndour, Abdi Somo, Ibrahim Hassan, Daudi and Oduori:
thank you very much for you assisted in planning and implementing the field surveys and also
taught me to be patient and ‘meditate’ when the pressure was becoming just too hard to bear.
I am sincerely grateful to the family of Ousenou Dia including Koumba, Fati, Diama
and Bintou and to the neighbour Aicha, for accepting in your family and community in Dahra.
Many special thanks to Deborah: you joined me as an intern and I made you work
hard on the field yet you never complained about taking good care of me. Thanks to James
too, for your reflections and support.
Whether in Dakar or Nairobi, I found many friends who made my stay very interesting
and enjoyable: Sokhna, Adja, Ly, Marcel, Malick, François, Denyse, Olive, Regine, Zuena,
Patrick, Bugondo, Marie Claire, Robert and Léonie, with you I felt as a colleague, a sister and
friend and I treasure the discussions and stories we shared which were a source of comfort
and strength, thank you very much.
I also thank the colleagues at the Development Economics Group for their logistical
arrangements and a good working environment: Henny, Ingrid, Remko, Marian, Dineke,
Betty, Nico, Hagsma, Ezra, Pan Lei, Roselia, Aifa, Lonekke, Marteen, Gonne, Fedes,
Mesharch, Camillo, Zhang Lei, Judith, Admire and Godwin. Roselia, thanks a lot foryou’re
your help and good avices. Aifa, Fedes, Camillo, Lei, Judith and Godwin, thanks for the good
moments we shared in the office, Aifa, I was lucky to have you as a big sister from Senegal,
thank you very much for the crash course on Senegal and for all the advices.

242
My special thanks to Merima, thanks for being my friend and advisor; I will always
remember the talks we shared over the muffins.
Many thanks to you Brigitte: I remember us when we started our journey to
Wageningen, those times seem very far but I am glad that you have been there for me always.
Even though the paths have now separated us, I will always treasure our long talks and
discussions.
I appreciate the support and company of the Rwandan group in Wageningen, the
social events were particularly refreshing not only because of the good food we shared but
also because of the relaxing times.
Many thanks to my long-term friends in Rwanda and other places, you supported me
through your prayers and encouragements, I will always treasure your friendship.
I owe a big thank to my Facebook friends. In a special way you have been there for
me, checking up on me and cheering me up; with you, even the very bad days were bearable.
Special thanks to the Student Chaplaincy, my stay in Wageningen would have been
too difficult without the spiritual environment that you offered. A big thank you for your work
and support.
Many thanks to the Tax Office and Municipality of Wageningen for their day care
subsidies which enabled me to have Joel in the day care such that I could concentrate on my
thesis. To the wonderful family at Villa Bestenboel specially Mariska, Birgit, Geralda and
Sharon, thanks for taking good care of Joel with adequate professionalism and affection.
Thanks to all the children who gladly accepted him as a friend.
I express my gratitude to my family, your support and love have contributed to the
successful completion of this work. Special thanks to my mother and father, you have
contributed greatly to my character and support throughout my life, thanks for your advices
and belief in my capabilities. My sister Liliose, thank you very much for your constant

243
support and for being there for me, I appreciate your love and all the advices that made easier
my paths. To my brothers, thanks for your keeping alive the funny side of me and your
unwavering care. I also owe a big thank you to my parents, brothers and sisters-in-law for all
your support.
To the two men in my life I dedicate this thesis: Dear Joseph, you know I do not have
sufficient words to express my gratitude to you. You are my loving husband and my best
friend, your steadfast support, patience, understanding and encouragement were the source of
motivation during this study period. My dear son Joel, you came in my life as a ray of joy and
sunshine; you accepted the little time I could be with you, I saw you being unhappy when I
had to work on the computer whereas you just wanted me to hold you or play with you. I
remember the times when I just felt tired and beaten up by this academic life, but your energy
was my fountain of strength to go on. I hope that you continue to grow up, knowing that I
love you very much.
Finally, many thanks to all the others who have contributed to the successful
completion of this work in one way or other.
I give thanks to God for keeping me in good health, and giving me strength and
determination to go on. Thank you Lord for journeying with me and carrying me in difficult
times.
244
Funding
The research described in this thesis was supported by Wageningen University through the
INCO-DEV Project "Innovative management of Acacia senegal trees to improve resource
productivity and gum arabic production in sub-Saharan Africa” (ACACIAGUM), financed by
the European Union (INCO-CT-2006, contract n°032233).
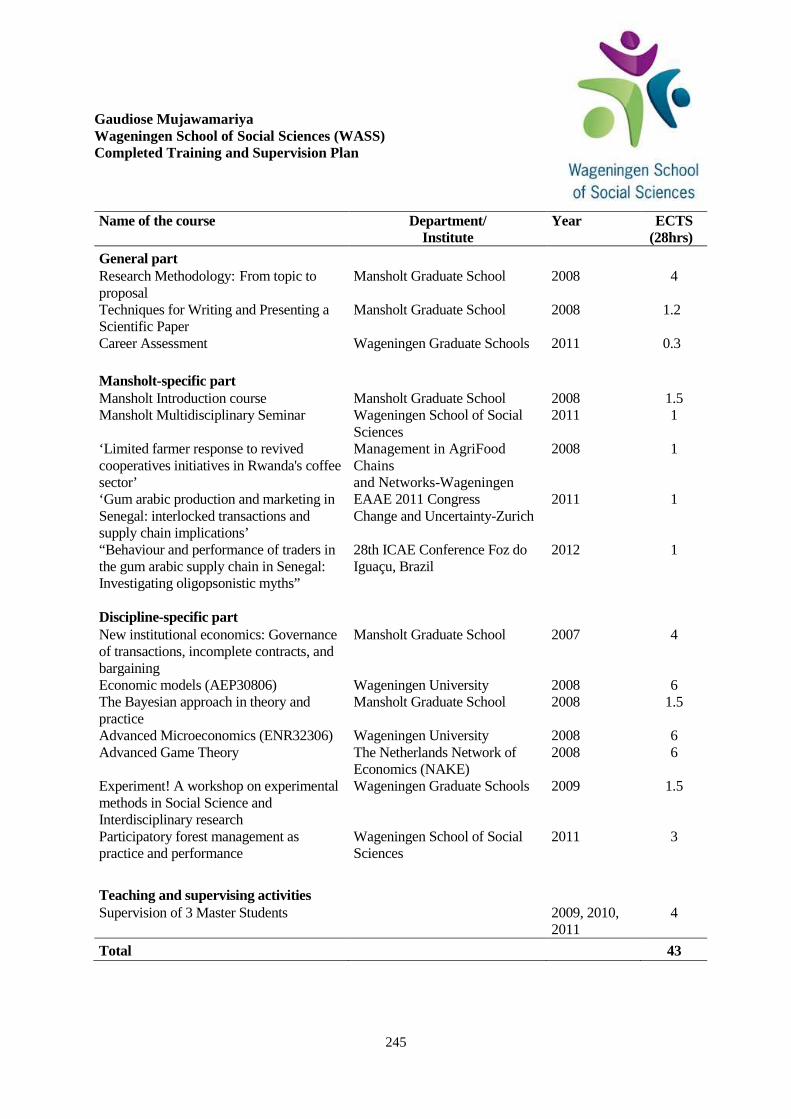
245
Gaudiose Mujawamariya Wageningen School of Social Sciences (WASS) Completed Training and Supervision Plan Name of the course Department/
Institute Year ECTS
(28hrs) General part
Research Methodology: From topic to proposal
Mansholt Graduate School 2008 4
Techniques for Writing and Presenting a Scientific Paper
Mansholt Graduate School 2008 1.2
Career Assessment
Wageningen Graduate Schools 2011 0.3
Mansholt-specific part Mansholt Introduction course Mansholt Graduate School 2008 1.5 Mansholt Multidisciplinary Seminar Wageningen School of Social
Sciences 2011 1
‘Limited farmer response to revived cooperatives initiatives in Rwanda's coffee sector’
Management in AgriFood Chains and Networks-Wageningen
2008 1
‘Gum arabic production and marketing in Senegal: interlocked transactions and supply chain implications’
EAAE 2011 Congress Change and Uncertainty-Zurich
2011 1
“Behaviour and performance of traders in the gum arabic supply chain in Senegal: Investigating oligopsonistic myths”
28th ICAE Conference Foz do Iguaçu, Brazil
2012 1
Discipline-specific part New institutional economics: Governance of transactions, incomplete contracts, and bargaining
Mansholt Graduate School 2007 4
Economic models (AEP30806) Wageningen University 2008 6 The Bayesian approach in theory and practice
Mansholt Graduate School 2008 1.5
Advanced Microeconomics (ENR32306) Wageningen University 2008 6 Advanced Game Theory The Netherlands Network of
Economics (NAKE) 2008 6
Experiment! A workshop on experimental methods in Social Science and Interdisciplinary research
Wageningen Graduate Schools 2009 1.5
Participatory forest management as practice and performance
Wageningen School of Social Sciences
2011 3
Teaching and supervising activities Supervision of 3 Master Students 2009, 2010,
2011 4
Total 43
246
Curriculum Vitae
Mujawamariya Gaudiose was born on 10th September, 1981 in Rwanda. After completing
high school in Rwanda, she joined Stella Maris College affiliated with the University of
Madras in India to study economics, obtaining a Bachelor of Arts Degree in Economics in
2003. In 2003-2005, she worked as a Research Officer and subsequently as a Planning Officer
in the National Unity and Reconciliation Commission in Rwanda.
With a scholarship from the Netherlands Fellowship Program (NFP-NUFFIC), Gaudiose
joined Wageningen University in 2005. She obtained a Master of Science Degree in
International Development Studies in 2007. In February 2008, she joined the Development
Economics Group of Wageningen University to pursue a PhD degree under the European
Union funding of the INCO-DEV ACACIAGUM Project.
From May 2012, Gaudiose is a lecturer at the Independent Institute of Lay Adventists of
Kigali in Rwanda. In October until December 2012, she is going to work as an intern within
the United Nations University at the World Institute for Development Economics Research in
Finland.


![[XLS]fta.mofcom.gov.cnfta.mofcom.gov.cn/dongmeng/annex/wenlaijiangshui.xls · Web view- Lac 1301.20.00 - Gum Arabic 1301.90.10 - - Gum benjamin 1301.90.20 - - Gum damar 1301.90.30](https://img.pdfslide.net/doc/110x75/5aaa14e37f8b9a95188daa0e/xlsfta-view-lac-13012000-gum-arabic-13019010-gum-benjamin-13019020.jpg)