Embed Size (px)
Citation preview
7/23/2019 Economics of Transition, 2010, FDI EU (1)
http://slidepdf.com/reader/full/economics-of-transition-2010-fdi-eu-1 1/25
FDI spillovers in new EUmember statesWhich firms create them and which firmsreally benefit?1
Marcella Nicolini* and Laura Resmini***Fondazione Eni Enrico Mattei (FEEM), Corso Magenta, 63 – I-20100, Milano, Italy.
E-mail: [email protected]
**Universita della Valle d’Aosta, Faculty of Political Science and International Relations, Loc.
Grand Chemin 73/75 – I-11020 Saint Christophe, Aosta, Italy; and ISLA, Bocconi University,
Milan, Italy. E-mail: [email protected]
Abstract
Using an unbalanced panel of firm-level data in Bulgaria, Poland and Romania,we examine the impact of foreign firms on domestic firms’ productivity. In par-ticular, we try to answer the following research questions: (1) Are there any spill-over effects of foreign direct investments (FDI), and if so, are they positive ornegative? (2) Are spillover effects more likely to occur within or across sectors?(3) Are the existence, the direction and the magnitude of spillovers conditioned
by sector and firm-specific characteristics? Our findings show that FDI spilloversexist both within and across sectors. The former arise when foreign firms operatein labour-intensive sectors, while the latter occur when foreign firms operate in
high-tech sectors. Moreover, we find that domestic firm size conditions theexploitation of FDI spillovers even after controlling for absorptive capacity. We
Received: February 5, 2007; Acceptance: July 13, 2009
1 We are grateful to participants at the E.A.R.I.E. and ETSG 2006 conferences in Amsterdam and Vienna,and the A.I.S.Re 2006 conference in Pisa (Italy) for their observations and suggestions on earlier drafts of thisarticle. Our gratitude also goes to the anonymous referees, who provided helpful comments. This researchhas benefited from financial support through the European Commission VI framework programme (Ref. no.28818).
Economics of TransitionVolume 18(3) 2010, 487–511DOI: 10.1111/j.1468-0351.2009.00379.x
2010 The Authors Journal compilation 2010 The European Bank for Reconstruction and Development.Published by Blackwell Publishing Ltd, 9600 Garsington Road, Oxford OX4 2DQ, UK and 350 Main St, Malden, MA 02148, USA
7/23/2019 Economics of Transition, 2010, FDI EU (1)
http://slidepdf.com/reader/full/economics-of-transition-2010-fdi-eu-1 2/25
also detect a great deal of heterogeneity across countries consistent with the tech-nology gap hypothesis.
JEL classifications: F23, P31, P52.Keywords: Foreign direct investment, transition countries, spillovers.
1. Introduction
In recent decades, many governments in developing and transition countrieshave offered significant incentives to attract foreign direct investments (FDI),
being motivated to do so by expectations of possible spillover benefits. Thisstrong belief in the positive effects of FDI, however, does not receive supportfrom the empirical evidence. Recent surveys on this topic (Gorg and Greenaway,2004; Alfaro and Rodriguez-Clare, 2004; Glass et al., 2001) suggest that the lackof consistency in the empirical literature on FDI-induced spillovers depends onthe estimation techniques adopted by researchers (cross-section vs. panel data,industry-data vs. firm-level data) and the use of different measures of foreignpresence in the host countries. In this paper, we argue that other factors, inde-pendent of data characteristics and methodologies, may affect the existence, thedirection, and the magnitude of spillover effects, as recently argued also by
Lipsey and Sjoholm (2005). By using the same methodology and comparabledata, we examine intra- and inter-sectoral spillovers in the context of Bulgaria,Poland and Romania and demonstrate how the results vary depending on thecountry analysed. While previous studies on this topic have focused on whetherFDI spillovers exist, this paper conducts comprehensive discussion on whichhost country is affected by inward FDI, what the impact is on that country, andwhether and to what extent FDI spillovers are conditioned by firms’ characteris-tics, such as the technology intensity of foreign affiliates’ products and the sizeof the indigenous firms.
We find evidence of positive intra- and inter-sectoral FDI spillovers, which are
on average exploited by indigenous firms according to their absorptive capacity.These results change substantially when we consider the technology intensity of foreign firms and the size of the indigenous ones. A great deal of heterogeneityamong countries is also detected.
The paper is organized as follows. The next section reviews the main theoreticaland empirical literature on FDI productivity spillovers, dealing in particular withstudies focused on the evidence from Central and Eastern European countries. Sec-tion 3 describes the data source and the empirical strategy that we adopted toachieve our research objectives. Section 4 discusses the results of our estimationsand Section 5 summarizes our conclusions.
488 Nicolini and Resmini
2010 The Authors Journal compilation 2010 The European Bank for Reconstruction and Development
7/23/2019 Economics of Transition, 2010, FDI EU (1)
http://slidepdf.com/reader/full/economics-of-transition-2010-fdi-eu-1 3/25
2. FDI productivity spillovers in the theoretical and empiricalliterature
The concept of FDI spillovers embodies the idea that multi-national enterprises(MNEs) own intangible assets, such as a superior technology,2 which, given theirpublic goods nature, can be transmitted to indigenous firms thereby increasingtheir productivity levels. Therefore, the spread of productivity spillovers is a matterof externalities being transmitted from foreign to domestic firms through severalchannels. In particular, foreign firms can help local suppliers and/or clients toimprove the quality, speed and reliability of delivery and/or processing techniques
by providing technical and financial assistance (Hirschman, 1958; Rodriguez-Clare,1996; Markusen and Venables, 1999). Foreign entry may also increase competitionin the domestic market, thereby stimulating local firms to use resources more effi-
ciently and adopt new technologies to maintain their market shares. Local competi-tors may also profit from the demonstration effect in management and productiontechniques, while the mobility of workers trained by foreign firms may facilitatenot only the access to new technologies but also imitation of the technologies inquestion (Fosfuri et al., 2001; Mansfield and Romeo, 1980; Dunning, 1993).3 The
benefits spilling over to domestic firms through closer client/supplier relationshipsare usually referred to as vertical spillovers or inter-sectoral spillovers, because theyentail firms operating at a different stage of the production chain, while externali-ties accruing to local competitors are also called horizontal or intra-sectoral spill-overs since they entail firms operating at the same stage of the production chain.
Generally speaking, spillovers of the former kind involve flows of generic knowl-edge, while the latter concern flows of specific knowledge (Kugler, 2006). The theo-retical literature on FDI suggests that, whereas foreign firms can derive advantagesfrom generic knowledge diffusion among downstream clients and upstream sup-pliers, they may be damaged by allowing specific knowledge to be appropriable bylocal competitors, because this implies dissipation of their specific advantages.Therefore, foreign firms will try to minimize outflows of specific knowledge whileencouraging outflows of generic knowledge to local clients and suppliers.
This theoretical idea of almost automatic and effective benefits from FDI is notconfirmed by the empirical evidence, which instead suggests that FDI-induced pro-
ductivity spillovers are neither exclusively nor necessarily positive. Yet the empiri-cal literature on FDI spillovers, recently summarized in a number of survey papers(Alfaro and Rodriguez-Clare, 2004; Gorg and Greenaway, 2004; Gorg and Strobl,2001; Glass et al., 2001; Lipsey and Sjoholm, 2005; UN/ECE, 2001) argues that the
2 According to Blomstrom et al. (2001), the concept of technology should be interpreted in a broad sensewhich includes product, process and distribution technology, as well as management and marketing skills.3 Of course, foreign firms may also generate negative effects for domestic firms, such as tougher competitionin the final markets as well as in the source (including labour) ones. It is widely believed, however, that posi-tive effects outweigh negative ones (UNCTAD, 2001).
FDI Spillovers in New EU Member States 489
2010 The Authors Journal compilation 2010 The European Bank for Reconstruction and Development
7/23/2019 Economics of Transition, 2010, FDI EU (1)
http://slidepdf.com/reader/full/economics-of-transition-2010-fdi-eu-1 4/25
effects of foreign investments have been neutral or negative – or, in the best cases,unclear, especially in the case of developing and transition countries.4
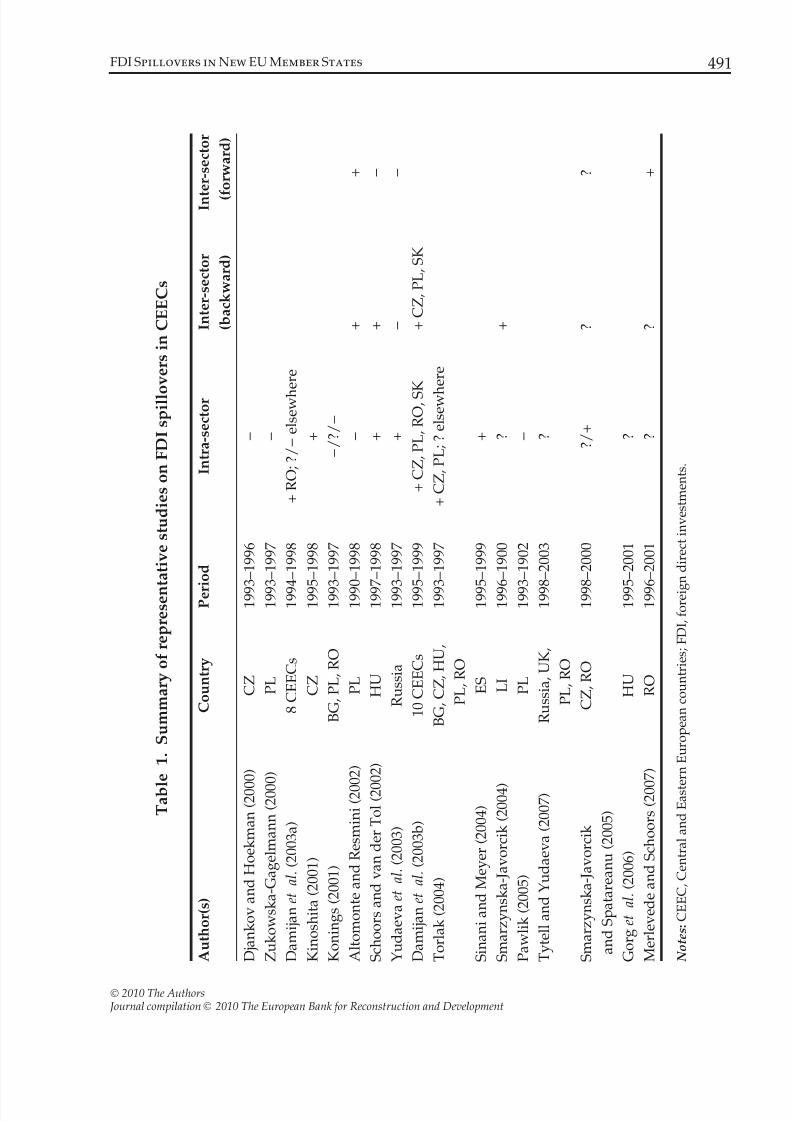
With regard to the latter, analysis of the impact of foreign firms on domestic
firms’ productivity is usually carried out using firm-level panel data. Table 1 sum-marizes the main results. As mentioned above, there is weak support for FDI spill-overs to domestic firms, either within the same sector or across vertically linkedsectors. Nevertheless, inter-sectoral spillovers seem to be more important than hori-zontal spillovers (Altomonte and Resmini, 2002; Damijan et al., 2003b; Merlevedeand Schoors, 2007; Schoors and van der Tol, 2002). There are several reasons forthese unsatisfactory results. First, MNEs may be very effective in minimizing hori-zontal spillovers, as suggested by the conventional wisdom. Second, MNEs in tran-sition countries may have a low propensity to source locally, given the low qualityof intermediate inputs produced in those countries, especially at the beginning of
the transition phase. Therefore, there is less scope for vertical linkages between for-eign and domestic firms. This consideration is further reinforced by the fact thatmost negative spillovers are detected in the early 1990s, while the number of nega-tive and significant relationships between foreign and domestic firms decreaseswhen more recent periods of time are considered. This suggests that progress inindustry restructuring may have made the transmission of productivity spilloversfrom FDI to indigenous firms more likely.5
The empirical evidence thus suggests that while positive effects from FDI arelikely, they are far from automatic; they should therefore be demonstrated ratherthan assumed. This consideration shifts the debate on FDI spillovers from a theoret-
ical perspective to a more technical and empirical one which helps in gatheringfresh empirical evidence as a new basis for future theoretical studies.
3. Data and methodology
The data used in this study constitute an unbalanced panel with annual informa-tion on more than 40,000 domestic manufacturing firms and about 10,000 foreignowned firms operating in three transition countries, namely Bulgaria, Poland, andRomania during the period from 1998 to 2003. Although these countries started
with very similar technological levels and managerial skills, their transition to amarket economy has followed very different paths: Poland became a member of the European Union in 2004, while Bulgaria and Romania had to wait another three
4 More positive effects are found in the case of industrialized countries. See Haskel et al. (2007) and Liu et al.(2000) on UK, Keller and Yeaple (2003) on the USA, and Jabbour and Mucchielli (2005) on France.5 Another reason may be the empirical approach applied by studies, which usually include measures for both backward and forward linkages in the same regression. These two measures, however, are strongly cor-related, reflecting the fact that manufacturing sectors are very often either the suppliers or the clients of many other manufacturing sectors, and that client/supplier relationships are often of the same intensity.This implies that the results may have been affected by multicollinearity.
490 Nicolini and Resmini
2010 The Authors Journal compilation 2010 The European Bank for Reconstruction and Development
7/23/2019 Economics of Transition, 2010, FDI EU (1)
http://slidepdf.com/reader/full/economics-of-transition-2010-fdi-eu-1 5/25
T a b l
e 1 .
S u m m a r y o f r e p r e s e n
t a t i v e s t u d i e s o n F D I s p i l l o
v e r s i n C E E C s
A u t h o r ( s )
C o u n t r y
P e r
i o d
I n t r a - s e c t o r
I n t e r - s e c t o r
( b a c k w a r d )
I n t e r - s e c t o r
( f o r w a r d )
D j a n k o v a n d H o e k m a n ( 2 0 0
0 )
C Z
1 9 9 3 – 1 9 9 6
)
Z u k o w s k a - G a g e l m a n n ( 2 0 0 0 )
P L
1 9 9 3 – 1 9 9 7
)
D a m i j a n e t
a l . ( 2 0 0 3 a )
8 C E E C s
1 9 9 4 – 1 9 9 8
+ R O ; ? / )
e l s e w h
e r e
K i n o s h i t a ( 2 0 0 1 )
C Z
1 9 9 5 – 1 9 9 8
+
K o n i n g s ( 2 0 0 1 )
B G , P L , R O
1 9 9 3 – 1 9 9 7
) / ? / )
A l t o m o n t e a n d R e s m i n i ( 2 0 0 2 )
P L
1 9 9 0 – 1 9 9 8
)
+
+
S c h o o r s a n d v a n d e r T o l ( 2 0
0 2 )
H U
1 9 9 7 – 1 9 9 8
+
+
)
Y u d a e v a e t
a l . ( 2 0 0 3 )
R u s s i a
1 9 9 3 – 1 9 9 7
+
)
)
D a m i j a n e t
a l . ( 2 0 0 3 b )
1 0 C E E C s
1 9 9 5 – 1 9 9 9
+ C Z , P L , R O , S K
+ C Z , P L , S K
T o r l a k ( 2 0 0 4 )
B G , C Z , H U ,
P L , R O
1 9 9 3 – 1 9 9 7
+ C Z , P L ; ? e l s e w h
e r e
S i n a n i a n d M e y e r ( 2 0 0 4 )
E S
1 9 9 5 – 1 9 9 9
+
S m a r z y n s k a - J a v o r c i k ( 2 0 0 4 )
L I
1 9 9 6 – 1 9 0 0
?
+
P a w l i k ( 2 0 0 5 )
P L
1 9 9 3 – 1 9 0 2
)
T y t e l l a n d Y u d a e v a ( 2 0 0 7 )
R u s s i a , U K ,
P L , R O
1 9 9 8 – 2 0 0 3
?
S m a r z y n s k a - J a v o r c i k
a n d S p a t a r e a n u ( 2 0 0 5 )
C Z , R O
1 9 9 8 – 2 0 0 0
? / +
?
?
G o r g e t
a l . ( 2 0 0 6 )
H U
1 9 9 5 – 2 0 0 1
?
M e r l e v e d e a n d S c h o o r s ( 2 0 0
7 )
R O
1 9 9 6 – 2 0 0 1
?
?
+
N o t e s : C E E C , C e n t r a l a n d E a s t e r n E u r o p e a n c o u n t r i e s ; F D I , f o r e i g
n d i r e c t i n v e s t m e n t s .
FDI Spillovers in New EU Member States 491
2010 The Authors Journal compilation 2010 The European Bank for Reconstruction and Development
7/23/2019 Economics of Transition, 2010, FDI EU (1)
http://slidepdf.com/reader/full/economics-of-transition-2010-fdi-eu-1 6/25
years before joining the EU. The development of the transition phase has affectedthe inflows of FDI (Resmini, 2000), which have responded positively to the struc-tural reforms undertaken in Poland and negatively to stagnation of the reform pro-
cess in Bulgaria and Romania. Consequently, Poland has rapidly become one of themost important FDI recipients in the area, while Bulgaria and Romania have failedto attract a substantial stock of foreign capital. Given our research objectives, theseand other socioeconomic characteristics make comparisons among these threecountries of considerable interest.
The data are taken from the Amadeus database published by Bureau Van Djik,which besides standard financial information gives details on several qualitativevariables, such as ownership characteristics, industry classification, and geographi-cal location within countries.6 Firms with a share of foreign ownership greater than10 percent have been classified as foreign affiliates, using the definition provided
by the OECD and the IMF. All other firms with a percentage of foreign ownership below 10 per cent have been classified as domestic. Although it seems commonpractice to classify a firm as domestic even in the absence of any information on thenationality of the ownership (Peri and Urban, 2006), we prefer to adopt a morerestrictive strategy to avoid overestimating the possible impact of foreign firms ondomestic firm performance. We consequently excluded from the sample all firmswhose ownership could not be properly identified.7
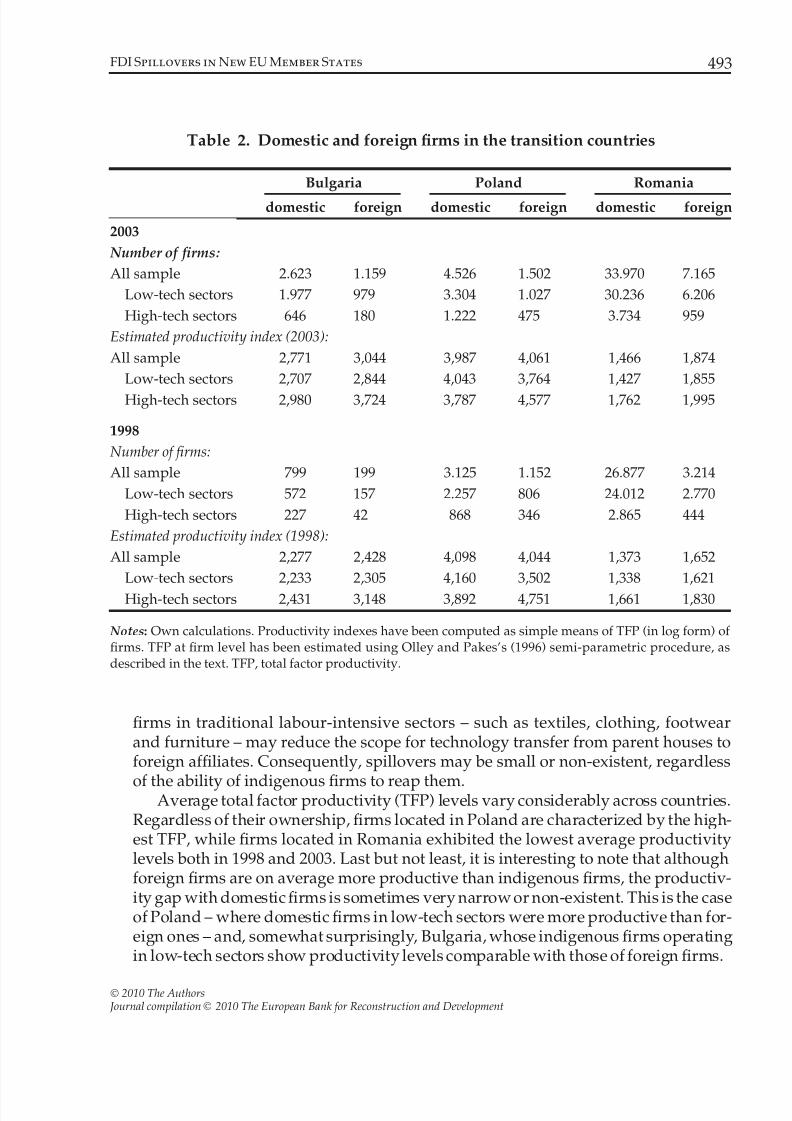
Table 2 summarizes the most important facts and figures concerning domesticand foreign firms in the above-mentioned countries. Important insights can begained from how the three countries differ in terms of the characteristics of both
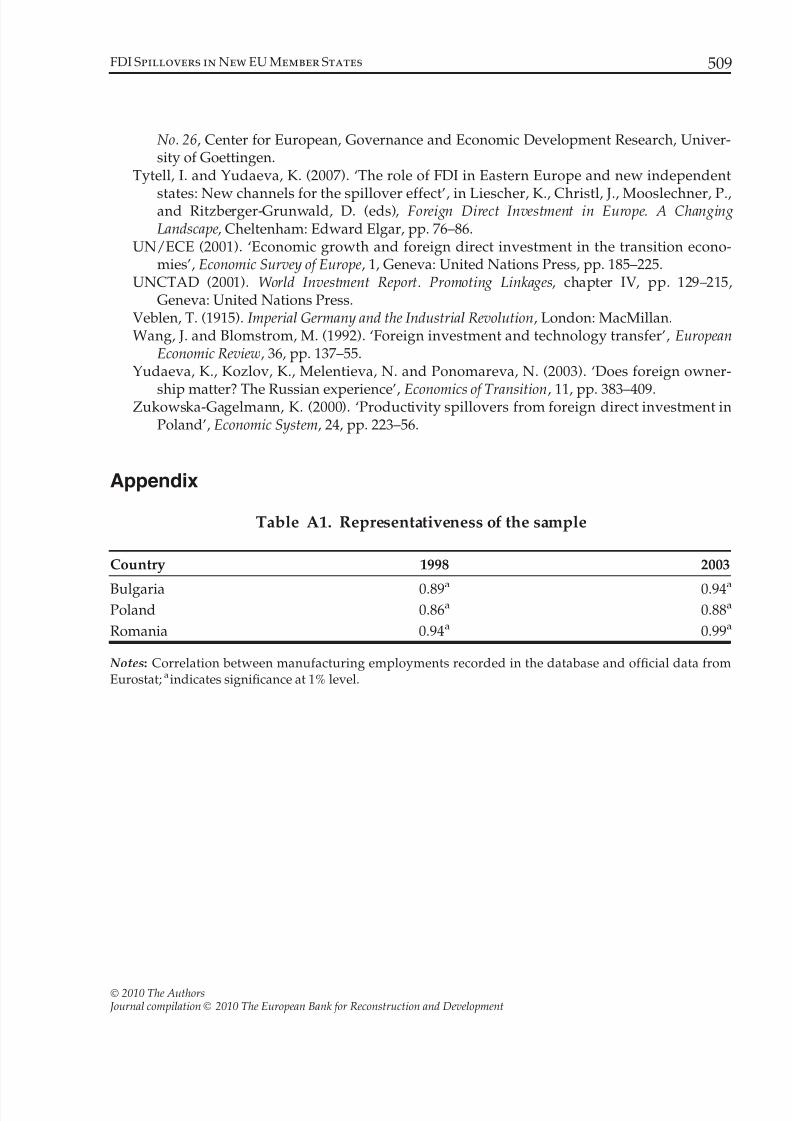
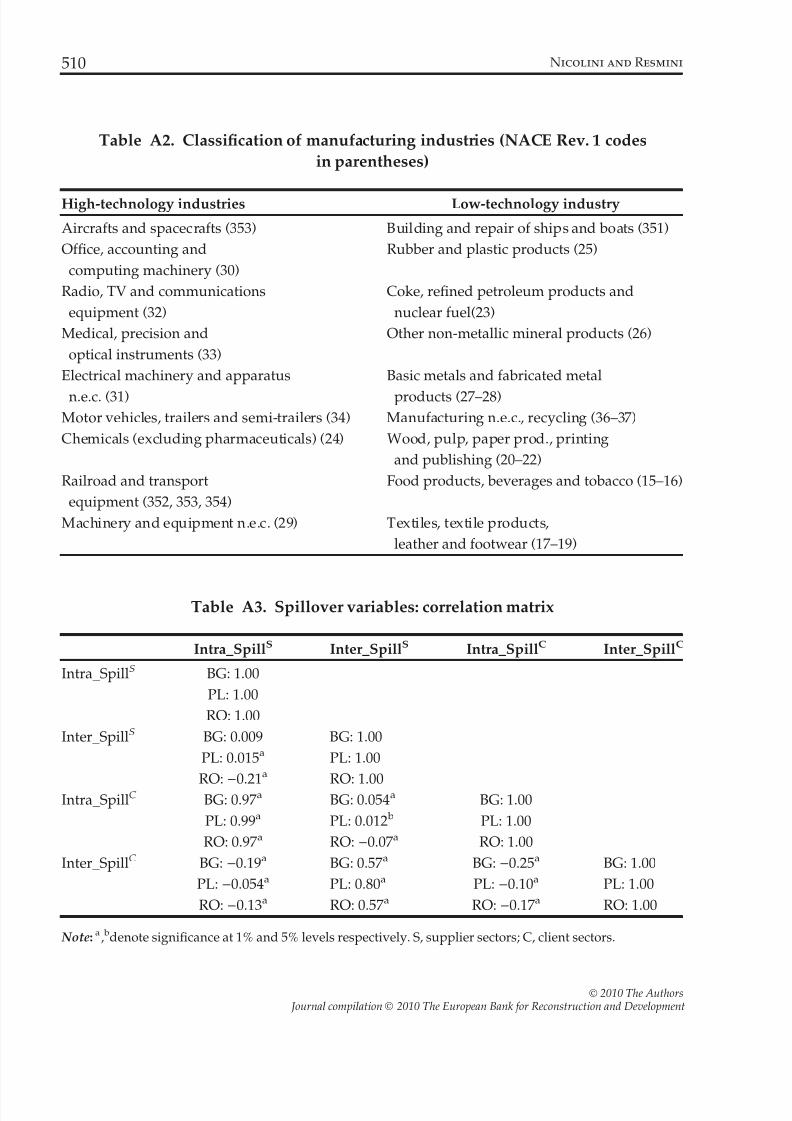
foreign and indigenous firms operating within their boundaries.First to be noted is that most of the FDI undertaken in Bulgaria, Poland and
Romania pertains to low-tech manufacturing sectors.8 In 2003, the share of this kindof FDI ranged from 68 percent in Poland to 87 percent in Romania. This share wasmore or less stable over time and did not differ substantially from that of domesticfirms, at least as far as Romania is concerned. Although this fact may be a directconsequence of the international specialization of both source and destination coun-tries, it has important analytical implications. In fact, the large presence of foreign
6 Amadeus contains information on each company’s ownership structure, including the name of the owners,
their country of origin, their own ownership shares and the date when the information was updated. Sincethe database is released annually, it is possible to trace the ownership structure from the beginning to theend of the considered period. In so doing, we used six different releases, starting from 1 January 1999. Weassumed that the ownership information included in this release was that corresponding to 1998. We thenanalysed all subsequent releases until 1 January 2004, updating the ownership information with the corre-sponding new information and carrying the initial ownership status over to future years if no updatesappeared in the database. In the case of contrasting or missing information, we dropped the firm from thedatabase.7 Because of this restrictive strategy, our sample did not cover the whole population of indigenous and for-eign firms operating in each country and sector included in the analysis. Nevertheless, it was able to repro-duce country dynamics without large biases, as is shown in Table A1 in the appendix.8 See the appendix for the classification of low- and high-tech manufacturing sectors (Table A2).
492 Nicolini and Resmini
2010 The Authors Journal compilation 2010 The European Bank for Reconstruction and Development
7/23/2019 Economics of Transition, 2010, FDI EU (1)
http://slidepdf.com/reader/full/economics-of-transition-2010-fdi-eu-1 7/25
firms in traditional labour-intensive sectors – such as textiles, clothing, footwearand furniture – may reduce the scope for technology transfer from parent houses toforeign affiliates. Consequently, spillovers may be small or non-existent, regardless
of the ability of indigenous firms to reap them.Average total factor productivity (TFP) levels vary considerably across countries.Regardless of their ownership, firms located in Poland are characterized by the high-est TFP, while firms located in Romania exhibited the lowest average productivitylevels both in 1998 and 2003. Last but not least, it is interesting to note that althoughforeign firms are on average more productive than indigenous firms, the productiv-ity gap with domestic firms is sometimes very narrow or non-existent. This is the caseof Poland – where domestic firms in low-tech sectors were more productive than for-eign ones – and, somewhat surprisingly, Bulgaria, whose indigenous firms operatingin low-tech sectors show productivity levels comparable with those of foreign firms.
Table 2. Domestic and foreign firms in the transition countries
Bulgaria Poland Romania
domestic foreign domestic foreign domestic foreign
2003
Number of firms:
All sample 2.623 1.159 4.526 1.502 33.970 7.165
Low-tech sectors 1.977 979 3.304 1.027 30.236 6.206
High-tech sectors 646 180 1.222 475 3.734 959
Estimated productivity index (2003):
All sample 2,771 3,044 3,987 4,061 1,466 1,874
Low-tech sectors 2,707 2,844 4,043 3,764 1,427 1,855
High-tech sectors 2,980 3,724 3,787 4,577 1,762 1,995
1998
Number of firms:
All sample 799 199 3.125 1.152 26.877 3.214
Low-tech sectors 572 157 2.257 806 24.012 2.770
High-tech sectors 227 42 868 346 2.865 444
Estimated productivity index (1998):
All sample 2,277 2,428 4,098 4,044 1,373 1,652
Low-tech sectors 2,233 2,305 4,160 3,502 1,338 1,621
High-tech sectors 2,431 3,148 3,892 4,751 1,661 1,830
Notes: Own calculations. Productivity indexes have been computed as simple means of TFP (in log form) of firms. TFP at firm level has been estimated using Olley and Pakes’s (1996) semi-parametric procedure, asdescribed in the text. TFP, total factor productivity.
FDI Spillovers in New EU Member States 493
2010 The Authors Journal compilation 2010 The European Bank for Reconstruction and Development
7/23/2019 Economics of Transition, 2010, FDI EU (1)
http://slidepdf.com/reader/full/economics-of-transition-2010-fdi-eu-1 8/25
The dynamics over time differ across countries. In Poland, indigenous firmswere unable to improve their productivity levels, while foreign firms acquired acertain amount of efficiency. In Bulgaria, both kinds of firms increased their pro-
ductivity levels, but foreign firms grew especially in high-tech sectors, while indige-nous firms did so in low-tech sectors. Finally, in Romania, foreign firms almostdoubled their productivity levels, further increasing the gap with domestic firms.Given this picture, we wondered whether FDI-induced spillovers occurred andwere to the benefit of indigenous firms.
3.1 The empirical strategy
To investigate the above-mentioned research questions, we first generated anappropriate measure for local firms’ TFP. For this purpose, firms were assumed to
use the following Cobb–Douglas production function:
yit ¼ a0 þ allit þ ammit þ akkit þ xit þ eit; ð1Þ
where yit is the log of output from plant i at time t, lit, mit and kit are the logs of labour, intermediate and capital input, respectively, and xit and eit are unobserv-able productivity disturbances.9 While xit is known to the firm when it decideshow much labour and materials to use, eit is not known.
Following the approach most commonly used in the recent literature on thetopic, we estimated Equation (1) by applying the semi-parametric estimation tech-nique developed by Olley and Pakes (1996). This technique takes into account the
simultaneity bias due to the endogeneity of the firm’s input selection, which mayarise if a firm responds to unobservable productivity shocks by adjusting its inputchoice. This would imply a correlation between the inputs and the error term which
biases traditional OLS coefficient estimates. Olley and Pakes suggest that this prob-lem can be solved by using the firm’s investment decisions as a proxy for unob-served productivity shock.10 By applying this procedure on a sectoral base, we
9 TFP at firm level was estimated using turnover as a proxy for total output, the stock of tangible fixed assetsas a proxy for physical capital, material costs and the number of employees. We lacked both industry- andfirm-specific deflators, so that financial data are expressed in thousands of US dollars. This implies that the
resulting productivity estimates still capture price and demand shocks, which are likely to be correlated withchanges in the operating environment, thus invalidating any evaluation of welfare implications (De Loecker,2007). However, Mairesse and Jaumandreu (2005) demonstrate that the estimated coefficients of a simpleCobb–Douglas production function vary more with the estimation procedures than with the particular spec-ification of the production function equation, the latter being a real output function, a revenue functiondeflated either by individual prices or industry prices, and a not deflated revenue function. In conclusion,the omitted variable bias claimed by De Loecker (2007) and other scholars seems to be negligible. For thisreason, we used a not deflated revenue function to estimate plant level TFP, while controlling for the impactof price shocks on TFP levels in the second step of our empirical analysis, as explained later.10 This entailed that all firms with zero or negative investment could not be included in the sample. Alterna-tively, Levinsohn and Petrin (2003) suggest that material inputs may be used as a proxy for the firm’s reac-tion to productivity shocks.
494 Nicolini and Resmini
2010 The Authors Journal compilation 2010 The European Bank for Reconstruction and Development
7/23/2019 Economics of Transition, 2010, FDI EU (1)
http://slidepdf.com/reader/full/economics-of-transition-2010-fdi-eu-1 9/25
obtained sector-specific input intensities.11 We then fitted Equation (1) and con-structed the individual error terms uit, which were the logs of our estimated plantTFP.12 We used this variable to analyse the existence and the magnitude of FDI
spillovers over the period 1998–2003. More specifically, we tested whether theobserved indigenous firms’ productivity was a function of the FDI presence andother characteristics at industry level.
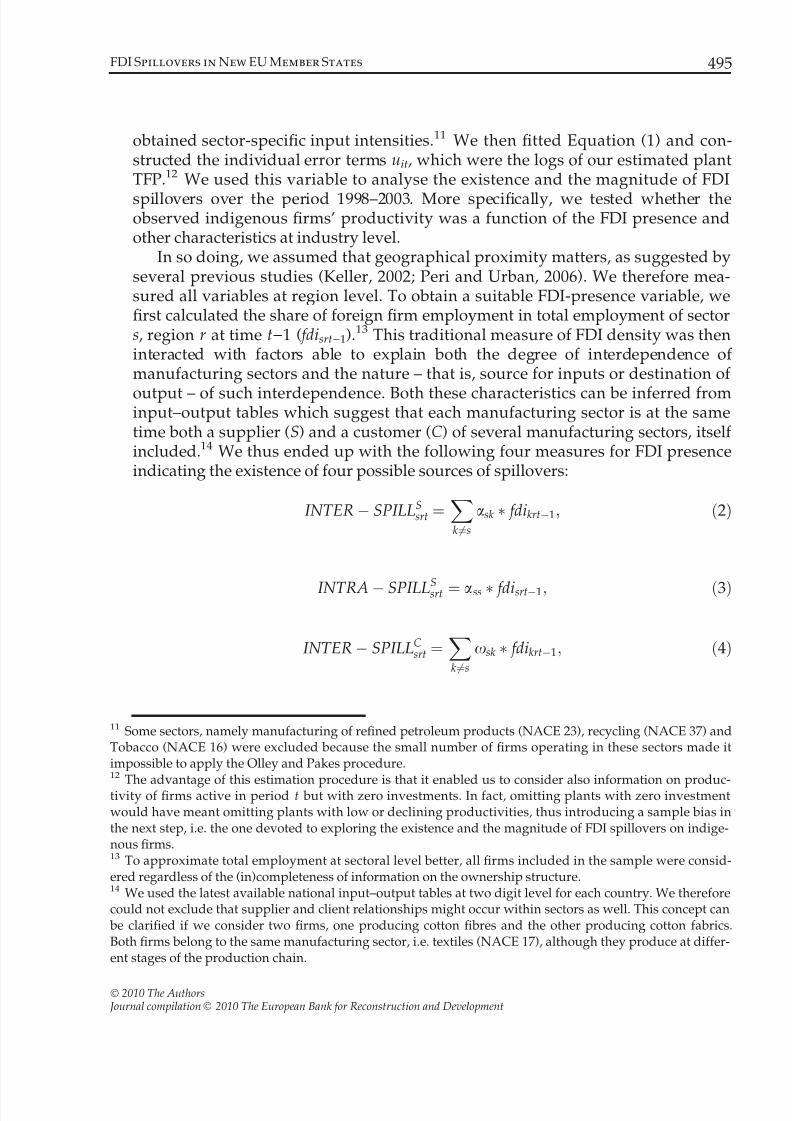
In so doing, we assumed that geographical proximity matters, as suggested byseveral previous studies (Keller, 2002; Peri and Urban, 2006). We therefore mea-sured all variables at region level. To obtain a suitable FDI-presence variable, wefirst calculated the share of foreign firm employment in total employment of sectors, region r at time t)1 ( fdisrt)1).13 This traditional measure of FDI density was theninteracted with factors able to explain both the degree of interdependence of manufacturing sectors and the nature – that is, source for inputs or destination of
output – of such interdependence. Both these characteristics can be inferred frominput–output tables which suggest that each manufacturing sector is at the sametime both a supplier (S) and a customer (C) of several manufacturing sectors, itself included.14 We thus ended up with the following four measures for FDI presenceindicating the existence of four possible sources of spillovers:
INTER SPILLSsrt ¼X
k6¼s
ask fdikrt1; ð2Þ
INTRA SPILLSsrt ¼ ass fdisrt1;
ð3Þ
INTER SPILLCsrt ¼X
k6¼s
xsk fdikrt1; ð4Þ
11 Some sectors, namely manufacturing of refined petroleum products (NACE 23), recycling (NACE 37) andTobacco (NACE 16) were excluded because the small number of firms operating in these sectors made itimpossible to apply the Olley and Pakes procedure.12
The advantage of this estimation procedure is that it enabled us to consider also information on produc-tivity of firms active in period t but with zero investments. In fact, omitting plants with zero investmentwould have meant omitting plants with low or declining productivities, thus introducing a sample bias inthe next step, i.e. the one devoted to exploring the existence and the magnitude of FDI spillovers on indige-nous firms.13 To approximate total employment at sectoral level better, all firms included in the sample were consid-ered regardless of the (in)completeness of information on the ownership structure.14 We used the latest available national input–output tables at two digit level for each country. We thereforecould not exclude that supplier and client relationships might occur within sectors as well. This concept can be clarified if we consider two firms, one producing cotton fibres and the other producing cotton fabrics.Both firms belong to the same manufacturing sector, i.e. textiles (NACE 17), although they produce at differ-ent stages of the production chain.
FDI Spillovers in New EU Member States 495
2010 The Authors Journal compilation 2010 The European Bank for Reconstruction and Development
7/23/2019 Economics of Transition, 2010, FDI EU (1)
http://slidepdf.com/reader/full/economics-of-transition-2010-fdi-eu-1 10/25
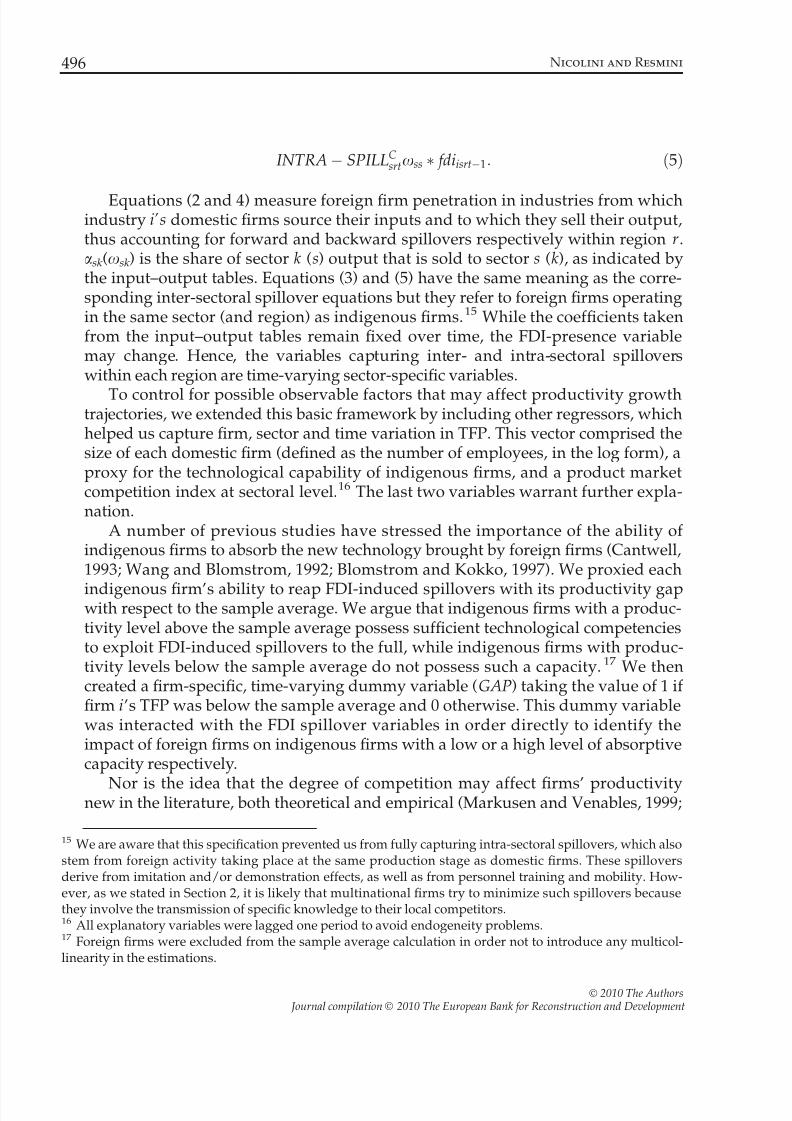
INTRA SPILLCsrtxss fdiisrt1: ð5Þ
Equations (2 and 4) measure foreign firm penetration in industries from whichindustry i’s domestic firms source their inputs and to which they sell their output,thus accounting for forward and backward spillovers respectively within region r.ask(xsk) is the share of sector k (s) output that is sold to sector s (k), as indicated bythe input–output tables. Equations (3) and (5) have the same meaning as the corre-sponding inter-sectoral spillover equations but they refer to foreign firms operatingin the same sector (and region) as indigenous firms.15 While the coefficients takenfrom the input–output tables remain fixed over time, the FDI-presence variablemay change. Hence, the variables capturing inter- and intra-sectoral spilloverswithin each region are time-varying sector-specific variables.
To control for possible observable factors that may affect productivity growthtrajectories, we extended this basic framework by including other regressors, whichhelped us capture firm, sector and time variation in TFP. This vector comprised thesize of each domestic firm (defined as the number of employees, in the log form), aproxy for the technological capability of indigenous firms, and a product marketcompetition index at sectoral level.16 The last two variables warrant further expla-nation.
A number of previous studies have stressed the importance of the ability of indigenous firms to absorb the new technology brought by foreign firms (Cantwell,1993; Wang and Blomstrom, 1992; Blomstrom and Kokko, 1997). We proxied each
indigenous firm’s ability to reap FDI-induced spillovers with its productivity gapwith respect to the sample average. We argue that indigenous firms with a produc-tivity level above the sample average possess sufficient technological competenciesto exploit FDI-induced spillovers to the full, while indigenous firms with produc-tivity levels below the sample average do not possess such a capacity.17 We thencreated a firm-specific, time-varying dummy variable (GAP) taking the value of 1 if firm i’s TFP was below the sample average and 0 otherwise. This dummy variablewas interacted with the FDI spillover variables in order directly to identify theimpact of foreign firms on indigenous firms with a low or a high level of absorptivecapacity respectively.
Nor is the idea that the degree of competition may affect firms’ productivitynew in the literature, both theoretical and empirical (Markusen and Venables, 1999;
15 We are aware that this specification prevented us from fully capturing intra-sectoral spillovers, which alsostem from foreign activity taking place at the same production stage as domestic firms. These spilloversderive from imitation and/or demonstration effects, as well as from personnel training and mobility. How-ever, as we stated in Section 2, it is likely that multinational firms try to minimize such spillovers becausethey involve the transmission of specific knowledge to their local competitors.16 All explanatory variables were lagged one period to avoid endogeneity problems.17 Foreign firms were excluded from the sample average calculation in order not to introduce any multicol-linearity in the estimations.
496 Nicolini and Resmini
2010 The Authors Journal compilation 2010 The European Bank for Reconstruction and Development
7/23/2019 Economics of Transition, 2010, FDI EU (1)
http://slidepdf.com/reader/full/economics-of-transition-2010-fdi-eu-1 11/25
Blomstrom et al., 2001; Haskel et al., 2007; Sinani and Meyer, 2004). Competitionmay stimulate firms to use the existing technology more efficiently to maintain theirmarket shares. However, it may also be detrimental to firms if the entry of a new
competitor forces incumbent firms to move up their average cost curves. Both theseeffects can be a direct consequence of the entry of a MNE. Therefore, without adirect control on competition, the coefficients of spillover variables may pick up
both technological spillovers and pro-competitive effects. To obtain a measure asclose to technological spillovers as possible, we decided to control for the degree of competition faced by firms in their respective product markets. The variable thatwe included in the set of the explanatory variables ( MARKUP) was computed atsectoral level as operational turnover minus employment and material costs overoperational turnover. Its interpretation was straightforward: the greater the differ-ence between revenues and variable costs, the greater the power of firms to set
prices, and the less competitive is the local sector s, considered at region level.18
Given the opposite effects that competition may exert on firm productivity, wecould not predict its sign.
As we are considering transition countries, it is important to account for time-varying industry and region characteristics. Given data constraints, we used as con-trols a set of time and region interaction dummies and a set of time and industryinteraction dummies. We also included firm fixed effects in the estimates, to controlfor unobserved characteristics at firm level.
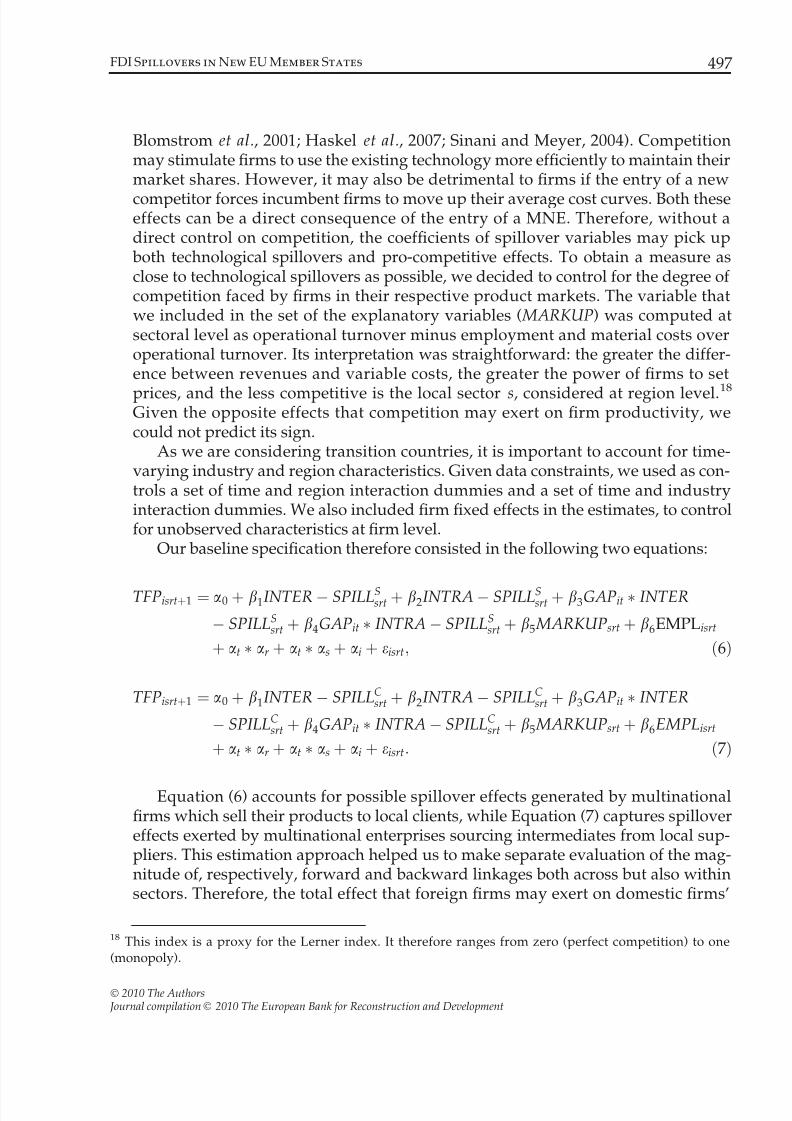
Our baseline specification therefore consisted in the following two equations:
TFPisrtþ1 ¼ a0 þ b1 INTER SPILLSsrt þ b2 INTRA SPILLS
srt þ b3GAPit INTER
SPILLSsrt þ b4GAPit INTRA SPILLS
srt þ b5 MARKUPsrt þ b6EMPLisrt
þ at ar þ at as þ ai þ eisrt; ð6Þ
TFPisrtþ1 ¼ a0 þ b1 INTER SPILLCsrt þ b2 INTRA SPILLC
srt þ b3GAPit INTER
SPILLCsrt þ b4GAPit INTRA SPILLC
srt þ b5 MARKUPsrt þ b6EMPLisrt
þ at ar þ at as þ ai þ eisrt: ð7Þ
Equation (6) accounts for possible spillover effects generated by multinationalfirms which sell their products to local clients, while Equation (7) captures spillovereffects exerted by multinational enterprises sourcing intermediates from local sup-pliers. This estimation approach helped us to make separate evaluation of the mag-nitude of, respectively, forward and backward linkages both across but also withinsectors. Therefore, the total effect that foreign firms may exert on domestic firms’
18 This index is a proxy for the Lerner index. It therefore ranges from zero (perfect competition) to one(monopoly).
FDI Spillovers in New EU Member States 497
2010 The Authors Journal compilation 2010 The European Bank for Reconstruction and Development
7/23/2019 Economics of Transition, 2010, FDI EU (1)
http://slidepdf.com/reader/full/economics-of-transition-2010-fdi-eu-1 12/25
productivity depends on the sign and the magnitude of the estimated bs in equa-tion (6) and the corresponding cs in equation (7).19 In particular, if both the bs andthe cs are positive and statistically significant, we have evidence of spillovers gen-
erated through both forward and backward linkages, either within or across manu-facturing sectors. Instead, if only the bs (cs) are positive and statistically significant,this indicates that domestic firms are able to reap spillovers only from their foreignsupplier (client), provided that b >|c|(c >|b|).
Separate analyses were conducted forthe three countries included in the database.Regressions were run using panel fixed effect techniques, since these enabled us toaccommodate unobservableheterogeneity at firm, industry, region and timelevel.20
4. Estimation results
In this section, we present and discuss the empirical estimates of the impact of FDI-induced spillovers on domestic firms’ TFP. We first focus on the estimations of equations (6) and (7) and then discuss how, whether, and to what extent generalresults are conditioned by two factors, namely the concentration of FDI in tradi-tional labour-intensive manufacturing sectors, and the size of the indigenous firms.
4.1 The baseline model
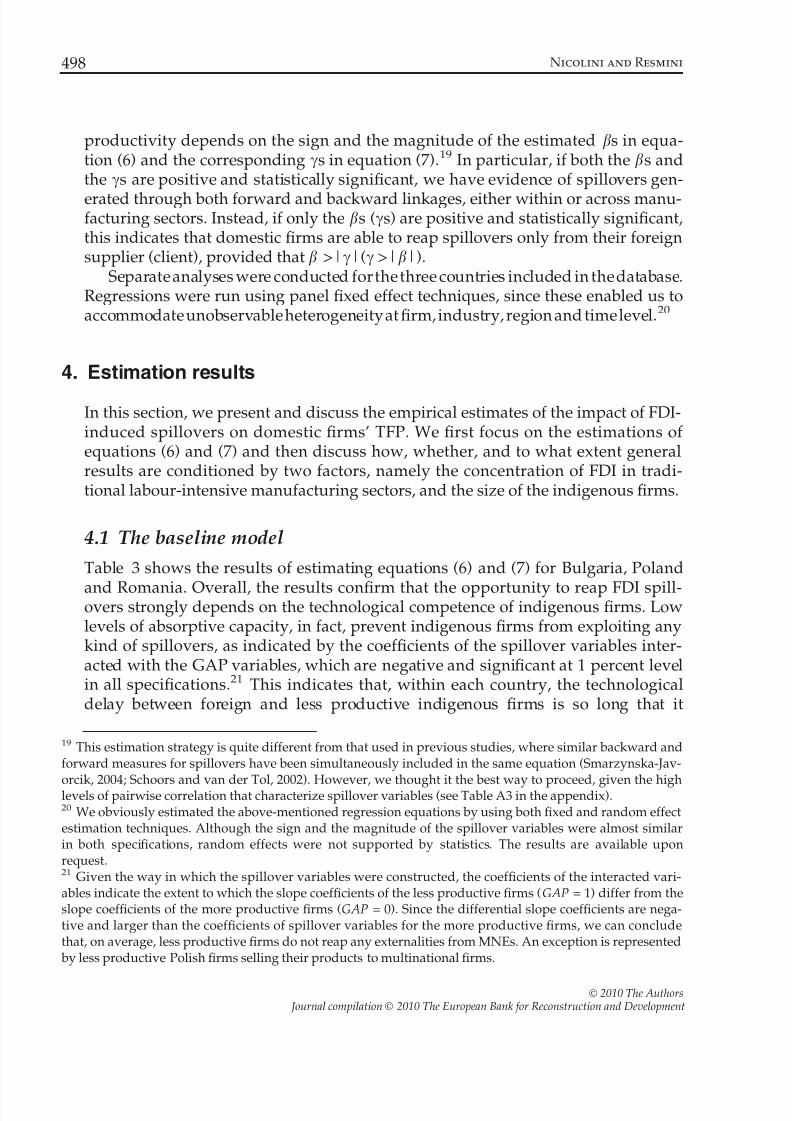
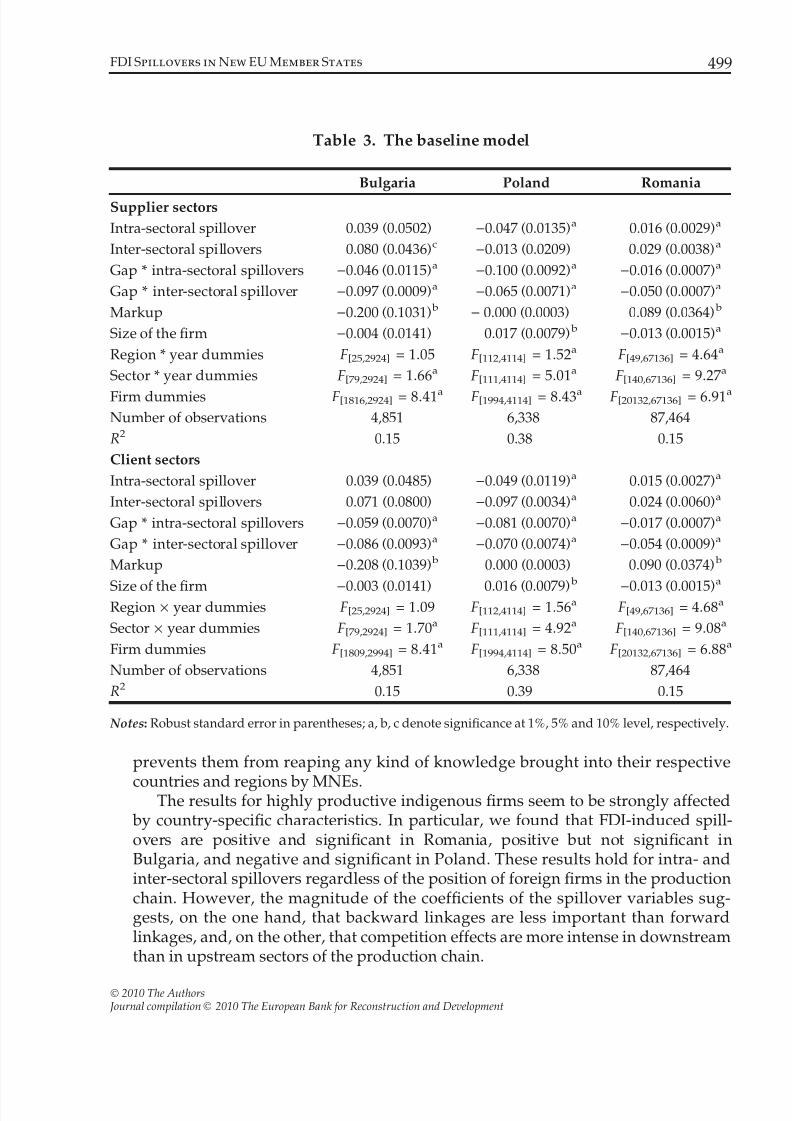
Table 3 shows the results of estimating equations (6) and (7) for Bulgaria, Poland
and Romania. Overall, the results confirm that the opportunity to reap FDI spill-overs strongly depends on the technological competence of indigenous firms. Lowlevels of absorptive capacity, in fact, prevent indigenous firms from exploiting anykind of spillovers, as indicated by the coefficients of the spillover variables inter-acted with the GAP variables, which are negative and significant at 1 percent levelin all specifications.21 This indicates that, within each country, the technologicaldelay between foreign and less productive indigenous firms is so long that it
19 This estimation strategy is quite different from that used in previous studies, where similar backward andforward measures for spillovers have been simultaneously included in the same equation (Smarzynska-Jav-
orcik, 2004; Schoors and van der Tol, 2002). However, we thought it the best way to proceed, given the highlevels of pairwise correlation that characterize spillover variables (see Table A3 in the appendix).20 We obviously estimated the above-mentioned regression equations by using both fixed and random effectestimation techniques. Although the sign and the magnitude of the spillover variables were almost similarin both specifications, random effects were not supported by statistics. The results are available uponrequest.21 Given the way in which the spillover variables were constructed, the coefficients of the interacted vari-ables indicate the extent to which the slope coefficients of the less productive firms (GAP = 1) differ from theslope coefficients of the more productive firms (GAP = 0). Since the differential slope coefficients are nega-tive and larger than the coefficients of spillover variables for the more productive firms, we can concludethat, on average, less productive firms do not reap any externalities from MNEs. An exception is represented by less productive Polish firms selling their products to multinational firms.
498 Nicolini and Resmini
2010 The Authors Journal compilation 2010 The European Bank for Reconstruction and Development
7/23/2019 Economics of Transition, 2010, FDI EU (1)
http://slidepdf.com/reader/full/economics-of-transition-2010-fdi-eu-1 13/25
prevents them from reaping any kind of knowledge brought into their respective
countries and regions by MNEs.The results for highly productive indigenous firms seem to be strongly affected by country-specific characteristics. In particular, we found that FDI-induced spill-overs are positive and significant in Romania, positive but not significant inBulgaria, and negative and significant in Poland. These results hold for intra- andinter-sectoral spillovers regardless of the position of foreign firms in the productionchain. However, the magnitude of the coefficients of the spillover variables sug-gests, on the one hand, that backward linkages are less important than forwardlinkages, and, on the other, that competition effects are more intense in downstreamthan in upstream sectors of the production chain.
Table 3. The baseline model
Bulgaria Poland Romania
Supplier sectors
Intra-sectoral spillover 0.039 (0.0502) )0.047 (0.0135)a 0.016 (0.0029)a
Inter-sectoral spillovers 0.080 (0.0436)c )0.013 (0.0209) 0.029 (0.0038)a
Gap * intra-sectoral spillovers )0.046 (0.0115)a )0.100 (0.0092)a )0.016 (0.0007)a
Gap * inter-sectoral spillover )0.097 (0.0009)a )0.065 (0.0071)a )0.050 (0.0007)a
Markup )0.200 (0.1031) b ) 0.000 (0.0003) 0.089 (0.0364) b
Size of the firm )0.004 (0.0141) 0.017 (0.0079) b )0.013 (0.0015)a
Region * year dummies F[25,2924] = 1.05 F[112,4114] = 1.52a F[49,67136] = 4.64a
Sector * year dummies F[79,2924] = 1.66a F[111,4114] = 5.01a F[140,67136] = 9.27a
Firm dummies F[1816,2924] = 8.41a F[1994,4114] = 8.43a F[20132,67136] = 6.91a
Number of observations 4,851 6,338 87,464
R2 0.15 0.38 0.15
Client sectors
Intra-sectoral spillover 0.039 (0.0485) )0.049 (0.0119)a 0.015 (0.0027)a
Inter-sectoral spillovers 0.071 (0.0800) )0.097 (0.0034)a 0.024 (0.0060)a
Gap * intra-sectoral spillovers )0.059 (0.0070)a )0.081 (0.0070)a )0.017 (0.0007)a
Gap * inter-sectoral spillover )0.086 (0.0093)a )0.070 (0.0074)a )0.054 (0.0009)a
Markup )0.208 (0.1039) b 0.000 (0.0003) 0.090 (0.0374) b
Size of the firm )
0.003 (0.0141) 0.016 (0.0079) b
)0.013 (0.0015)
a
Region · year dummies F[25,2924] = 1.09 F[112,4114] = 1.56a F[49,67136] = 4.68a
Sector · year dummies F[79,2924] = 1.70a F[111,4114] = 4.92a F[140,67136] = 9.08a
Firm dummies F[1809,2994] = 8.41a F[1994,4114] = 8.50a F[20132,67136] = 6.88a
Number of observations 4,851 6,338 87,464
R2 0.15 0.39 0.15
Notes: Robust standard error in parentheses; a, b, c denote significance at 1%, 5% and 10% level, respectively.
FDI Spillovers in New EU Member States 499
2010 The Authors Journal compilation 2010 The European Bank for Reconstruction and Development
7/23/2019 Economics of Transition, 2010, FDI EU (1)
http://slidepdf.com/reader/full/economics-of-transition-2010-fdi-eu-1 14/25
We can thus draw the preliminary conclusion that competition effects dominateover technological spillovers in more advanced countries, as the Polish experienceindicates, and that a substantial initial backwardness helps neutralize this negative
effect, as suggested by the technology gap hypothesis (Findlay, 1978).22As far as the other explanatory variables are concerned, it can be seen that, ceteris
paribus, larger firms have a higher TFP level in Poland and a lower one in Romania,while the TFP level of indigenous firms does not depend on their size in Bulgaria.Finally, market competition decreases plant-level productivity in Romania andincreases it in Bulgaria, while it is not statistically significant in Poland. As expected,
both region-time and sector-time dummies turn out to be significant, with theexception of region-time dummies in Bulgaria. Firm-level fixed effects are alwayssignificant at the 1 per cent level, indicating that firm heterogeneity does exist.
4.2 Are all foreign firms able to generate spillovers?
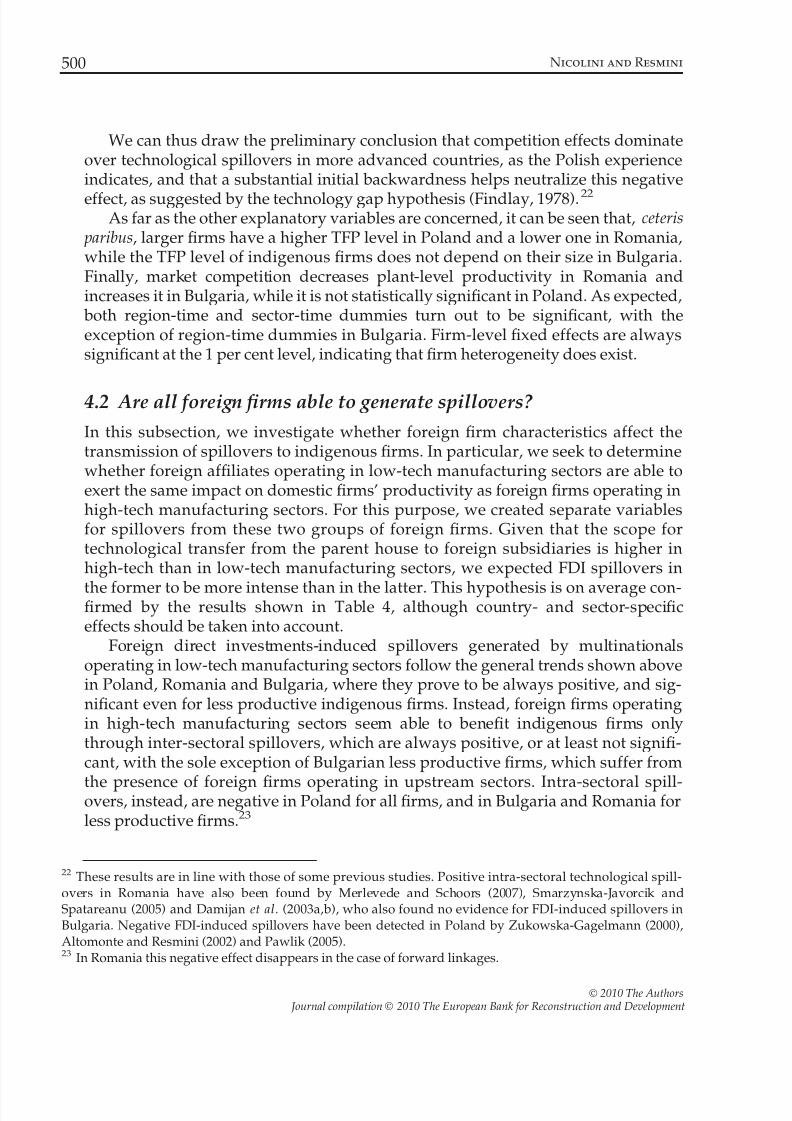
In this subsection, we investigate whether foreign firm characteristics affect thetransmission of spillovers to indigenous firms. In particular, we seek to determinewhether foreign affiliates operating in low-tech manufacturing sectors are able toexert the same impact on domestic firms’ productivity as foreign firms operating inhigh-tech manufacturing sectors. For this purpose, we created separate variablesfor spillovers from these two groups of foreign firms. Given that the scope fortechnological transfer from the parent house to foreign subsidiaries is higher inhigh-tech than in low-tech manufacturing sectors, we expected FDI spillovers in
the former to be more intense than in the latter. This hypothesis is on average con-firmed by the results shown in Table 4, although country- and sector-specificeffects should be taken into account.
Foreign direct investments-induced spillovers generated by multinationalsoperating in low-tech manufacturing sectors follow the general trends shown abovein Poland, Romania and Bulgaria, where they prove to be always positive, and sig-nificant even for less productive indigenous firms. Instead, foreign firms operatingin high-tech manufacturing sectors seem able to benefit indigenous firms onlythrough inter-sectoral spillovers, which are always positive, or at least not signifi-cant, with the sole exception of Bulgarian less productive firms, which suffer from
the presence of foreign firms operating in upstream sectors. Intra-sectoral spill-overs, instead, are negative in Poland for all firms, and in Bulgaria and Romania forless productive firms.23
22 These results are in line with those of some previous studies. Positive intra-sectoral technological spill-overs in Romania have also been found by Merlevede and Schoors (2007), Smarzynska-Javorcik andSpatareanu (2005) and Damijan et al. (2003a,b), who also found no evidence for FDI-induced spillovers inBulgaria. Negative FDI-induced spillovers have been detected in Poland by Zukowska-Gagelmann (2000),Altomonte and Resmini (2002) and Pawlik (2005).23 In Romania this negative effect disappears in the case of forward linkages.
500 Nicolini and Resmini
2010 The Authors Journal compilation 2010 The European Bank for Reconstruction and Development
7/23/2019 Economics of Transition, 2010, FDI EU (1)
http://slidepdf.com/reader/full/economics-of-transition-2010-fdi-eu-1 15/25
Table 4. High-tech vs. low-tech foreign firms
Bulgaria Poland Romania
Supplier sectors
Low-tech manufacturing sectors:
Intra-sectoral spillover 0.041 (0.0515) )0.039 (0.0146)a 0.013 (0.0034)a
Inter-sectoral spillovers 0.085 (0.0483)c )0.003 (0.0222) 0.026 (0.0039)a
Gap · intra-sectoral spillovers )0.039 (0.0122)a )0.102 (0.0096)a )0.017 (0.0008)a
Gap · inter-sectoral spillover )0.073 (0.0138)a )0.077 (0.0132)a )0.050 (0.0010)a
High-tech manufacturing sectors:
Intra-sectoral spillover )0.022 (0.2343) )0.091 (0.0359) b )0.014 (0.0133)
Inter-sectoral spillovers 0.122 (0.0896) )0.070 (0.0695) 0.078 (0.0166)a
Gap · intra-sectoral spillovers )0.155 (0.1198) )0.109 (0.0311)a )0.014 (0.0049)a
Gap · inter-sectoral spillover )0.183 (0.0423)a )0.013 (0.0504) )0.041 (0.0031)a
Markup )0.197 (0.1045) b )0.000 (0.0003) 0.085 (0.0365) b
Size of the firm )0.003 (0.0141) 0.017 (0.0079) b )0.014 (0.0015)a
Region · year dummies F[25,2920] = 1.01 F[113,4110] = 1.52a F[49,67132] = 4.67a
Sector · year dummies F[79,2920] = 1.65a F[110,4110] = 4.86a F[140,67132] = 8.98a
Firm dummies F[1816,2920] = 8.32a F[1994,4110] = 8.39a F[201321,67132] = 6.91a
Number of observations 4,851 6,338 87,464
R2 0.16 0.38 0.15
Client sectors
Low-tech manufacturing sectors: Intra-sectoral spillover 0.061 (0.0503) )0.059 (0.0157)a 0.015 (0.0030)a
Inter-sectoral spillovers 0.118 (0.0954) )0.095 (0.0438) b 0.018 (0.0067)a
Gap · intra-sectoral spillovers )0.061 (0.0070)a )0.093 (0.0079)a )0.017 (0.0007)a
Gap · inter-sectoral spillover )0.086 (0.0142)a )0.144 (0.0179)a )0.059 (0.0012)a
High-tech manufacturing sectors:
Intra-sectoral spillover 0.115 (0.2185) )0.042 (0.0180) b )0.012 (0.0106)
Inter-sectoral spillovers )0.071 (0.1254) )0.098 (0.0636) 0.041 (0.0123)a
Gap · intra-sectoral spillovers )0.560 (0.1243)a )0.070 (0.0146)a )0.035 (0.0026)a
Gap · inter-sectoral spillover )0.010 (0.0283) 0.115 (0.0416)a )0.040 (0.0022)a
Markup )
0.190 (0.1043) b
)0.000 (0.0003) 0.085 (0.0375)
b
Size of the firm )0.000 (0.0141) 0.015 (0.0079) b )0.013 (0.0015)a
Region · year dummies F[25,2920] = 1.05 F[112,4110] = 1.53a F[49,67132] = 4.64a
Sector · year dummies F[79,2920] = 1.69a F[111,4110] = 4.82a F[140,67132] = 8.55a
Firm dummies F[1816,2920] = 8.37a F[1994,4110] = 8.43a F[20132,67132] = 6.87a
Number of observations 4,851 6,338 87,464
R2 0.16 0.39 0.15
Notes: Robust standard error in parentheses; a, b, c denote significance at 1%, 5% and 10% level,respectively.
FDI Spillovers in New EU Member States 501
2010 The Authors Journal compilation 2010 The European Bank for Reconstruction and Development
7/23/2019 Economics of Transition, 2010, FDI EU (1)
http://slidepdf.com/reader/full/economics-of-transition-2010-fdi-eu-1 16/25
Overall, these results confirm the theory that multinational enterprises do notwant to dissipate specific advantages, while they are more willing to transmitgeneric knowledge to their local clients and or suppliers.
4.3 The size of the indigenous firms
As a final step, we investigated whether spillovers may depend on the scale of theindigenous firms. As suggested by the microeconomic theory, large firms havemore resources to exploit innovative opportunities than do small and medium-sized firms. However, the latter are less bureaucratic and are therefore able toadjust their structures more quickly than large firms, which in the less advancedtransition countries like Bulgaria and Romania may also be former state-ownedenterprises, with a burdensome inheritance of inefficiencies and old technologies
not adapted to compete with foreign firms operating domestically and abroad.To test whether small and medium-sized firms are better than large firms in
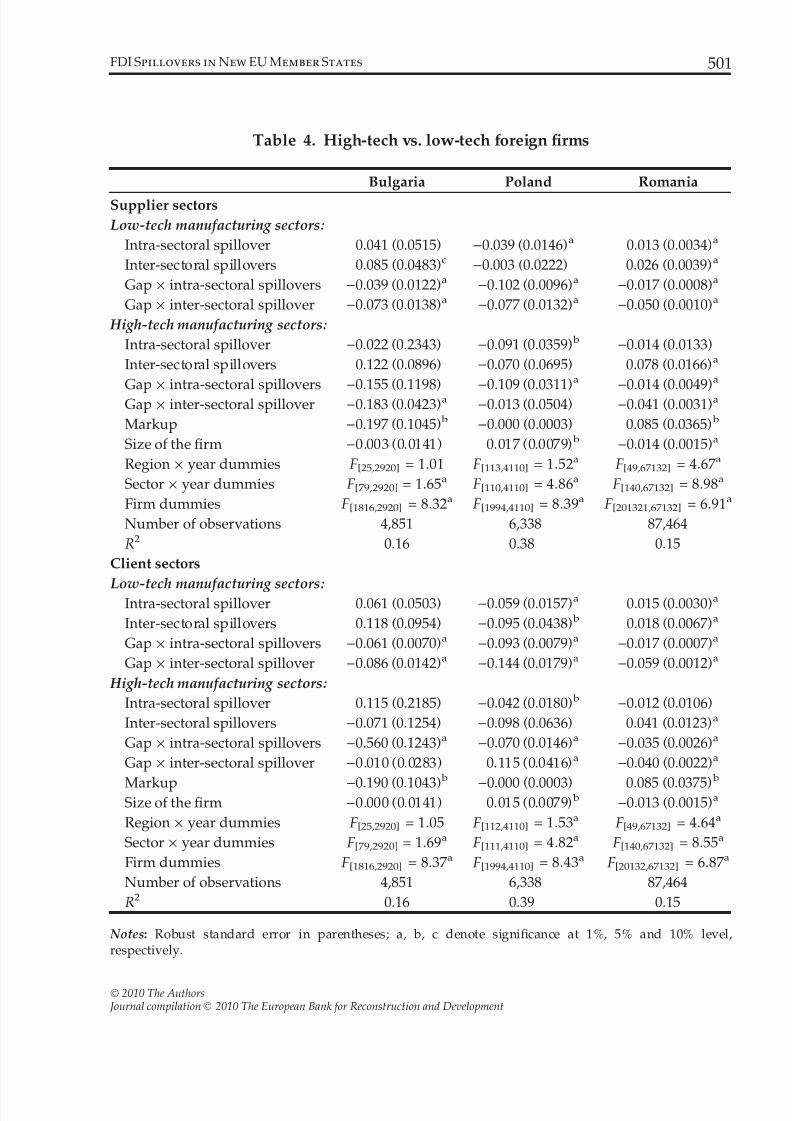
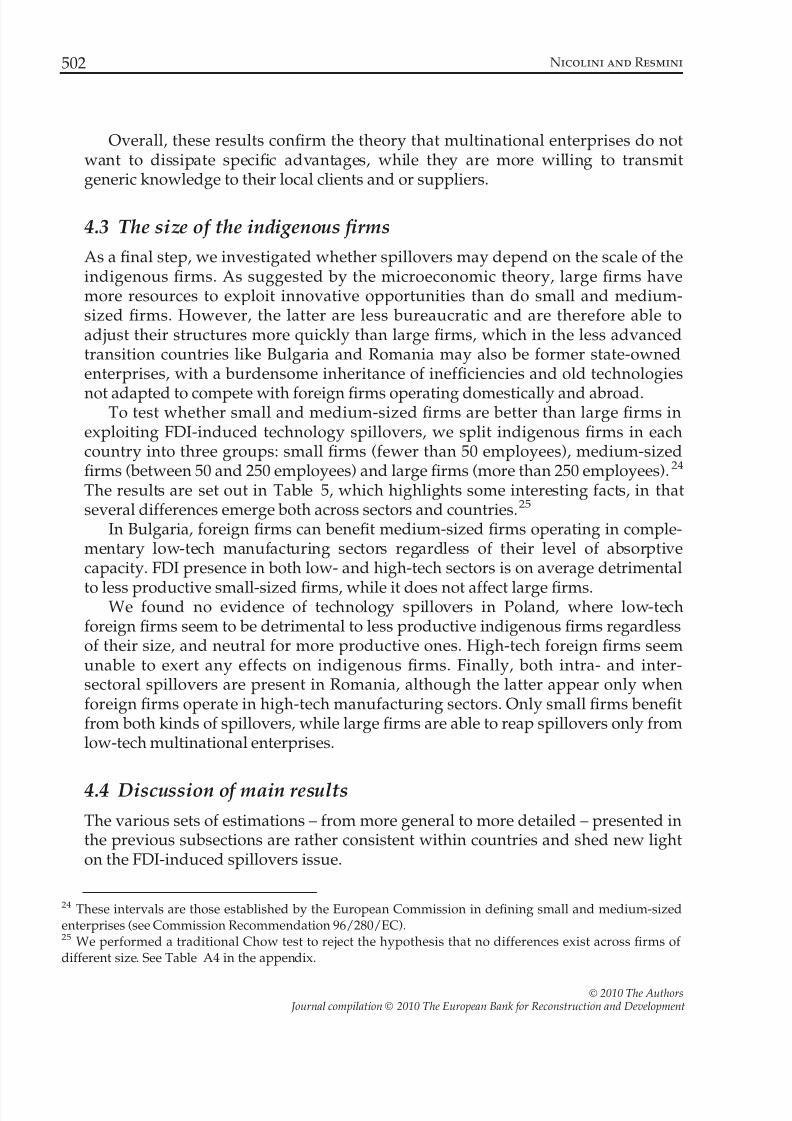
exploiting FDI-induced technology spillovers, we split indigenous firms in eachcountry into three groups: small firms (fewer than 50 employees), medium-sizedfirms (between 50 and 250 employees) and large firms (more than 250 employees).24
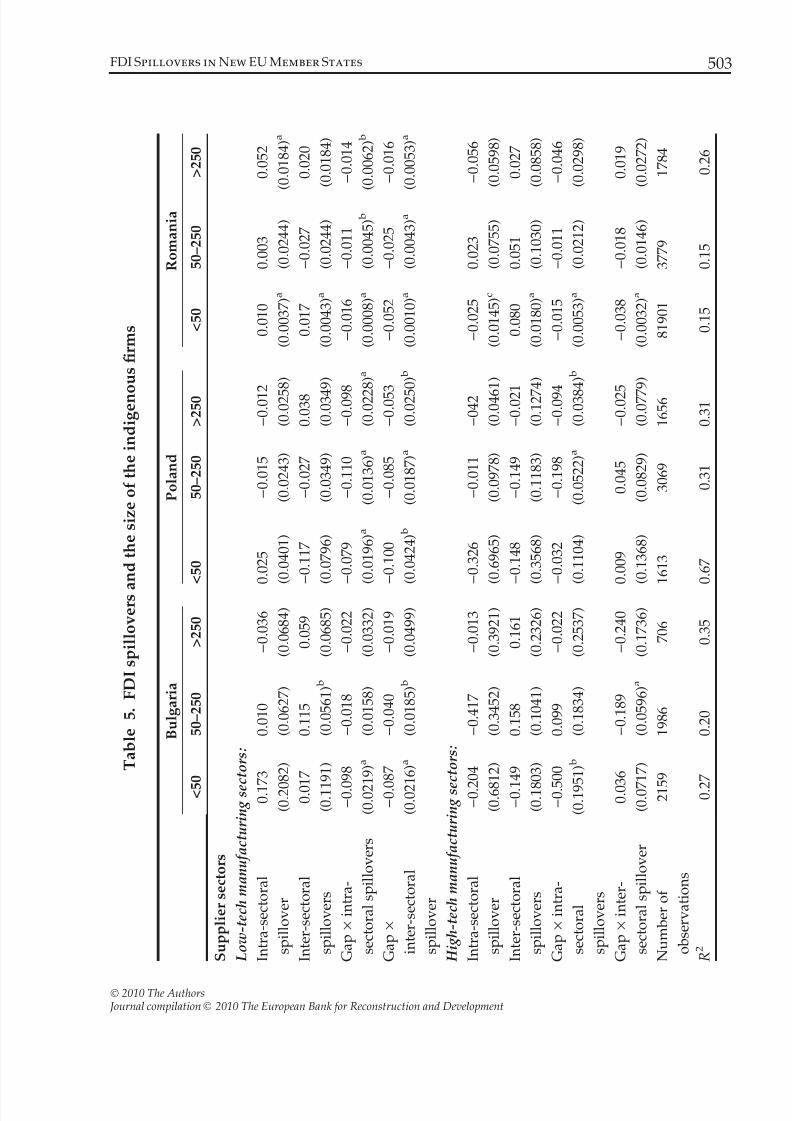
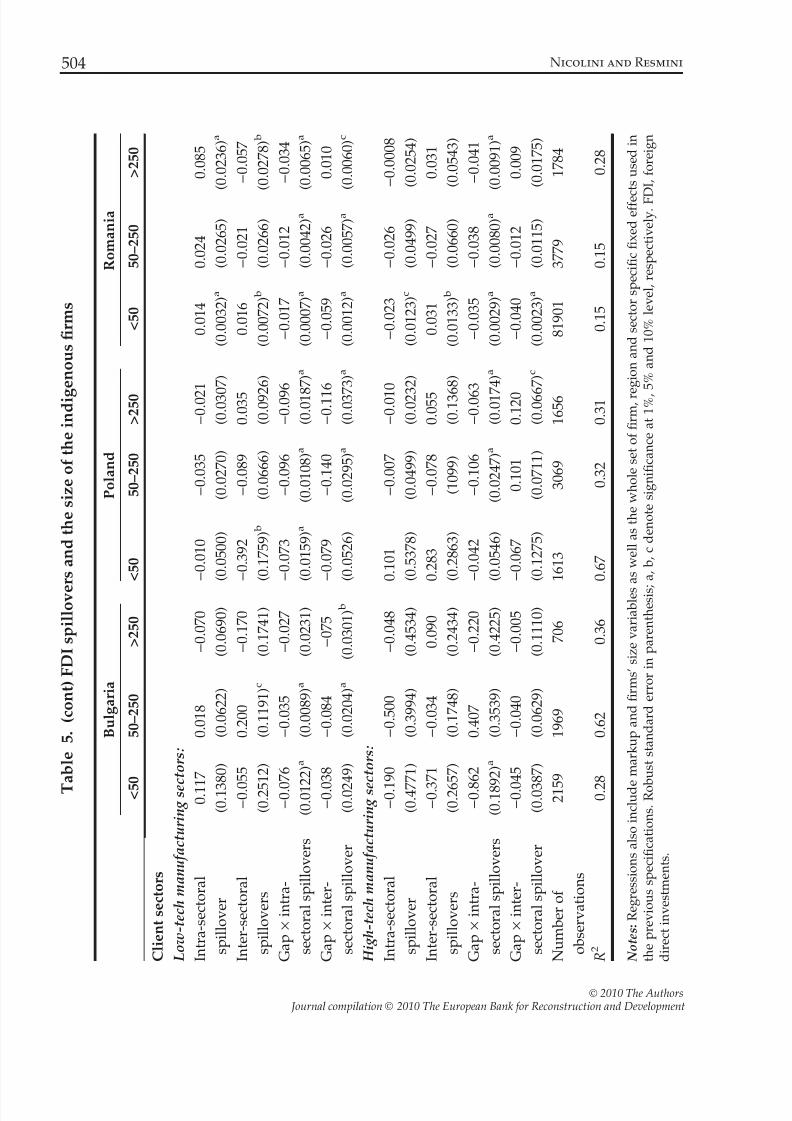
The results are set out in Table 5, which highlights some interesting facts, in thatseveral differences emerge both across sectors and countries.25
In Bulgaria, foreign firms can benefit medium-sized firms operating in comple-mentary low-tech manufacturing sectors regardless of their level of absorptivecapacity. FDI presence in both low- and high-tech sectors is on average detrimental
to less productive small-sized firms, while it does not affect large firms.We found no evidence of technology spillovers in Poland, where low-tech
foreign firms seem to be detrimental to less productive indigenous firms regardlessof their size, and neutral for more productive ones. High-tech foreign firms seemunable to exert any effects on indigenous firms. Finally, both intra- and inter-sectoral spillovers are present in Romania, although the latter appear only whenforeign firms operate in high-tech manufacturing sectors. Only small firms benefitfrom both kinds of spillovers, while large firms are able to reap spillovers only fromlow-tech multinational enterprises.
4.4 Discussion of main results
The various sets of estimations – from more general to more detailed – presented inthe previous subsections are rather consistent within countries and shed new lighton the FDI-induced spillovers issue.
24 These intervals are those established by the European Commission in defining small and medium-sizedenterprises (see Commission Recommendation 96/280/EC).25 We performed a traditional Chow test to reject the hypothesis that no differences exist across firms of different size. See Table A4 in the appendix.
502 Nicolini and Resmini
2010 The Authors Journal compilation 2010 The European Bank for Reconstruction and Development
7/23/2019 Economics of Transition, 2010, FDI EU (1)
http://slidepdf.com/reader/full/economics-of-transition-2010-fdi-eu-1 17/25
T a b l e 5 . F D I s p i l l o v e r s a
n d t h e s i z e o f t h e i n d i g e n o
u s fi r m s
B u l g a r i a
P o l a n d
R o m a n i a
< 5
0
5 0 – 2 5 0
> 2 5 0
< 5 0
5 0 – 2 5 0
> 2 5 0
< 5 0
5 0 – 2 5 0
> 2 5 0
S u p p l i e r s e c t o r s
L o w - t e c h m a n u f a c t u r i n g s e c t o r s :
I n t r a - s e c t o r a l
s p i l l o v e r
0 . 1 7 3
( 0 . 2 0
8 2 )
0 . 0 1 0
( 0 . 0 6 2 7 )
) 0 . 0 3 6
( 0 . 0 6 8 4 )
0 . 0 2 5
( 0 . 0 4 0 1 )
) 0 . 0 1 5
( 0 . 0 2 4 3 )
) 0 . 0 1 2
( 0 . 0 2 5
8 )
0 . 0 1 0
( 0 . 0 0 3 7 ) a
0 . 0 0 3
( 0 . 0 2 4 4 )
0 . 0 5 2
( 0 . 0 1 8 4 ) a
I n t e r - s e c t o r a l
s p i l l o v e r s
0 . 0 1 7
( 0 . 1 1
9 1 )
0 . 1 1 5
( 0 . 0 5 6 1 ) b
0 . 0 5 9
( 0 . 0 6 8 5 )
) 0 . 1 1 7
( 0 . 0 7 9 6 )
) 0 . 0 2 7
( 0 . 0 3 4 9 )
0 . 0 3 8
( 0 . 0 3 4
9 )
0 . 0 1 7
( 0 . 0 0 4 3 ) a
) 0 . 0 2 7
( 0 . 0 2 4 4 )
0 . 0 2 0
( 0 . 0 1 8 4 )
G a p ·
i n t r a -
s e c t o r a l s p i l l o v e r s
) 0 . 0
9 8
( 0 . 0 2 1 9 ) a
) 0 . 0 1 8
( 0 . 0 1 5 8 )
) 0 . 0 2 2
( 0 . 0 3 3 2 )
) 0 . 0 7 9
( 0 . 0 1 9 6 ) a
) 0 . 1 1 0
( 0 . 0 1 3 6 ) a
) 0 . 0 9 8
( 0 . 0 2 2
8 ) a
) 0 . 0 1 6
( 0 . 0 0 0 8 ) a
) 0 . 0 1 1
( 0 . 0 0 4 5 ) b
) 0 . 0 1 4
( 0 . 0 0 6 2 ) b
G a p ·
i n t e r - s e c t o r a l
s p i l l o v e r
) 0 . 0
8 7
( 0 . 0 2 1 6 ) a
) 0 . 0 4 0
( 0 . 0 1 8 5 ) b
) 0 . 0 1 9
( 0 . 0 4 9 9 )
) 0 . 1 0 0
( 0 . 0 4 2 4 ) b
) 0 . 0 8 5
( 0 . 0 1 8 7 ) a
) 0 . 0 5 3
( 0 . 0 2 5
0 ) b
) 0 . 0 5 2
( 0 . 0 0 1 0 ) a
) 0 . 0 2 5
( 0 . 0 0 4 3 ) a
) 0 . 0 1 6
( 0 . 0 0 5 3 ) a
H i g h - t e c h m a n u f a c t u r i n g s e
c t o r s :
I n t r a - s e c t o r a l
s p i l l o v e r
) 0 . 2
0 4
( 0 . 6 8
1 2 )
) 0 . 4 1 7
( 0 . 3 4 5 2 )
) 0 . 0 1 3
( 0 . 3 9 2 1 )
) 0 . 3 2 6
( 0 . 6 9 6 5 )
) 0 . 0 1 1
( 0 . 0 9 7 8 )
) 0 4 2
( 0 . 0 4 6
1 )
) 0 . 0 2 5
( 0 . 0 1 4 5 ) c
0 . 0 2 3
( 0 . 0 7 5 5 )
) 0 . 0 5 6
( 0 . 0 5 9 8 )
I n t e r - s e c t o r a l
s p i l l o v e r s
) 0 . 1
4 9
( 0 . 1 8
0 3 )
0 . 1 5 8
( 0 . 1 0 4 1 )
0 . 1 6 1
( 0 . 2 3 2 6 )
) 0 . 1 4 8
( 0 . 3 5 6 8 )
) 0 . 1 4 9
( 0 . 1 1 8 3 )
) 0 . 0 2 1
( 0 . 1 2 7
4 )
0 . 0 8 0
( 0 . 0 1 8 0 ) a
0 . 0 5 1
( 0 . 1 0 3 0 )
0 . 0 2 7
( 0 . 0 8 5 8 )
G a p ·
i n t r a -
s e c t o r a l
s p i l l o v e r s
) 0 . 5
0 0
( 0 . 1 9 5 1 ) b
0 . 0 9 9
( 0 . 1 8 3 4 )
) 0 . 0 2 2
( 0 . 2 5 3 7 )
) 0 . 0 3 2
( 0 . 1 1 0 4 )
) 0 . 1 9 8
( 0 . 0 5 2 2 ) a
) 0 . 0 9 4
( 0 . 0 3 8
4 ) b
) 0 . 0 1 5
( 0 . 0 0 5 3 ) a
) 0 . 0 1 1
( 0 . 0 2 1 2 )
) 0 . 0 4 6
( 0 . 0 2 9 8 )
G a p ·
i n t e r -
s e c t o r a l s p i l l o v e r
0 . 0 3 6
( 0 . 0 7
1 7 )
) 0 . 1 8 9
( 0 . 0 5 9 6 ) a
) 0 . 2 4 0
( 0 . 1 7 3 6 )
0 . 0 0 9
( 0 . 1 3 6 8 )
0 . 0 4 5
( 0 . 0 8 2 9 )
) 0 . 0 2 5
( 0 . 0 7 7
9 )
) 0 . 0 3 8
( 0 . 0 0 3 2 ) a
) 0 . 0 1 8
( 0 . 0 1 4 6 )
0 . 0 1 9
( 0 . 0 2 7 2 )
N u m b e r o f
o b s e r v a t i o n s
2 1 5
9
1 9 8 6
7 0 6
1 6 1 3
3 0 6 9
1 6 5 6
8 1 9 0 1
3 7 7 9
1 7 8 4
R 2
0 . 2
7
0 . 2 0
0 . 3 5
0 . 6 7
0 . 3 1
0 . 3 1
0 . 1 5
0 . 1 5
0 . 2 6
FDI Spillovers in New EU Member States 503
2010 The Authors Journal compilation 2010 The European Bank for Reconstruction and Development
7/23/2019 Economics of Transition, 2010, FDI EU (1)
http://slidepdf.com/reader/full/economics-of-transition-2010-fdi-eu-1 18/25
T a b l e 5 .
( c o n t ) F D I s p i l l o v e
r s a n d t h e s i z e o f t h e i n d i g
e n o u s fi r m s
B u l g a r i a
P o l a n d
R o m a n i a
< 5 0
5 0 – 2 5 0
> 2 5 0
< 5 0
5 0 – 2 5 0
> 2 5 0
< 5 0
5 0 – 2 5 0
> 2 5 0
C l i e n t s e c t o r s
L o w - t e c h m a n u f a c t u r i n g s e c t o r s :
I n t r a - s e c t o r a l
s p i l l o v e r
0 . 1 1 7
( 0 . 1 3
8 0 )
0 . 0 1 8
( 0 . 0 6 2 2 )
) 0 . 0 7 0
( 0 . 0 6 9 0 )
) 0 . 0 1 0
( 0 . 0 5 0 0 )
) 0 . 0 3 5
( 0 . 0 2 7 0 )
) 0 . 0 2 1
( 0 . 0 3 0
7 )
0 . 0 1 4
( 0 . 0 0 3 2 ) a
0 . 0 2 4
( 0 . 0 2 6 5 )
0 . 0 8 5
( 0 . 0 2 3 6 ) a
I n t e r - s e c t o r a l
s p i l l o v e r s
) 0 . 0
5 5
( 0 . 2 5
1 2 )
0 . 2 0 0
( 0 . 1 1 9 1 ) c
) 0 . 1 7 0
( 0 . 1 7 4 1 )
) 0 . 3 9 2
( 0 . 1 7 5 9 ) b
) 0 . 0 8 9
( 0 . 0 6 6 6 )
0 . 0 3 5
( 0 . 0 9 2
6 )
0 . 0 1 6
( 0 . 0 0 7 2 ) b
) 0 . 0 2 1
( 0 . 0 2 6 6 )
) 0 . 0 5 7
( 0 . 0 2 7 8 ) b
G a p ·
i n t r a -
s e c t o r a l s p i l l o v e r s
) 0 . 0
7 6
( 0 . 0 1 2 2 ) a
) 0 . 0 3 5
( 0 . 0 0 8 9 ) a
) 0 . 0 2 7
( 0 . 0 2 3 1 )
) 0 . 0 7 3
( 0 . 0 1 5 9 ) a
) 0 . 0 9 6
( 0 . 0 1 0 8 ) a
) 0 . 0 9 6
( 0 . 0 1 8
7 ) a
) 0 . 0 1 7
( 0 . 0 0 0 7 ) a
) 0 . 0 1 2
( 0 . 0 0 4 2 ) a
) 0 . 0 3 4
( 0 . 0 0 6 5 ) a
G a p ·
i n t e r -
s e c t o r a l s p i l l o v e r
) 0 . 0
3 8
( 0 . 0 2
4 9 )
) 0 . 0 8 4
( 0 . 0 2 0 4 ) a
) 0 7 5
( 0 . 0 3 0 1 ) b
) 0 . 0 7 9
( 0 . 0 5 2 6 )
) 0 . 1 4 0
( 0 . 0 2 9 5 ) a
) 0 . 1 1 6
( 0 . 0 3 7
3 ) a
) 0 . 0 5 9
( 0 . 0 0 1 2 ) a
) 0 . 0 2 6
( 0 . 0 0 5 7 ) a
0 . 0 1 0
( 0 . 0 0 6 0 ) c
H i g h - t e c h m a n u f a c t u r i n g s e
c t o r s :
I n t r a - s e c t o r a l
s p i l l o v e r
) 0 . 1
9 0
( 0 . 4 7
7 1 )
) 0 . 5 0 0
( 0 . 3 9 9 4 )
) 0 . 0 4 8
( 0 . 4 5 3 4 )
0 . 1 0 1
( 0 . 5 3 7 8 )
) 0 . 0 0 7
( 0 . 0 4 9 9 )
) 0 . 0 1 0
( 0 . 0 2 3
2 )
) 0 . 0 2 3
( 0 . 0 1 2 3 ) c
) 0 . 0 2 6
( 0 . 0 4 9 9 )
) 0 . 0 0 0 8
( 0 . 0 2 5 4 )
I n t e r - s e c t o r a l
s p i l l o v e r s
) 0 . 3
7 1
( 0 . 2 6
5 7 )
) 0 . 0 3 4
( 0 . 1 7 4 8 )
0 . 0 9 0
( 0 . 2 4 3 4 )
0 . 2 8 3
( 0 . 2 8 6 3 )
) 0 . 0 7 8
( 1 0 9 9 )
0 . 0 5 5
( 0 . 1 3 6
8 )
0 . 0 3 1
( 0 . 0 1 3 3 ) b
) 0 . 0 2 7
( 0 . 0 6 6 0 )
0 . 0 3 1
( 0 . 0 5 4 3 )
G a p ·
i n t r a -
s e c t o r a l s p i l l o v e r s
) 0 . 8
6 2
( 0 . 1 8 9 2 ) a
0 . 4 0 7
( 0 . 3 5 3 9 )
) 0 . 2 2 0
( 0 . 4 2 2 5 )
) 0 . 0 4 2
( 0 . 0 5 4 6 )
) 0 . 1 0 6
( 0 . 0 2 4 7 ) a
) 0 . 0 6 3
( 0 . 0 1 7
4 ) a
) 0 . 0 3 5
( 0 . 0 0 2 9 ) a
) 0 . 0 3 8
( 0 . 0 0 8 0 ) a
) 0 . 0 4 1
( 0 . 0 0 9 1 ) a
G a p ·
i n t e r -
s e c t o r a l s p i l l o v e r
) 0 . 0
4 5
( 0 . 0 3
8 7 )
) 0 . 0 4 0
( 0 . 0 6 2 9 )
) 0 . 0 0 5
( 0 . 1 1 1 0 )
) 0 . 0 6 7
( 0 . 1 2 7 5 )
0 . 1 0 1
( 0 . 0 7 1 1 )
0 . 1 2 0
( 0 . 0 6 6
7 ) c
) 0 . 0 4 0
( 0 . 0 0 2 3 ) a
) 0 . 0 1 2
( 0 . 0 1 1 5 )
0 . 0 0 9
( 0 . 0 1 7 5 )
N u m b e r o f
o b s e r v a t i o n s
2 1 5
9
1 9 6 9
7 0 6
1 6 1 3
3 0 6 9
1 6 5 6
8 1 9 0 1
3 7 7 9
1 7 8 4
R 2
0 . 2
8
0 . 6 2
0 . 3 6
0 . 6 7
0 . 3 2
0 . 3 1
0 . 1 5
0 . 1 5
0 . 2 8
N o t e s : R e g r e s s i o n s a l s o i n c l u d e m a r k u p a n d fi r m s ’ s i z e v a r i a b l e s
a s w e l l a s t h e w h o l e s e t o f fi r m , r e
g i o n a n d s e c t o r s p e c i fi c fi x e d e f f e c t s u s e d i n
t h e p r e v i o u s s p e c i fi c a t i o n s . R o b u s t s t a n d a r d e r r o r i n p a r e n t h e s i s ; a , b , c d e n o t e s i g n i fi c a n c e a t 1 % ,
5 % a n d 1 0 % l e v e l , r e s p e c t i v e l y . F D
I , f o r e i g n
d i r e c t i n v e s t m e n t s .
504 Nicolini and Resmini
2010 The Authors Journal compilation 2010 The European Bank for Reconstruction and Development
7/23/2019 Economics of Transition, 2010, FDI EU (1)
http://slidepdf.com/reader/full/economics-of-transition-2010-fdi-eu-1 19/25
In particular, our results confirm that inter-sectoral spillovers are more likely tooccur than intra-sectoral spillovers. This result is consistent not only with the the-ory, which suggests that multinational enterprises are more likely to encourage the
transmission of technology spillovers to local clients and suppliers than to localcompetitors, but also with previous studies on transition countries (Merlevede andSchoors, 2007; Smarzynska-Javorcik, 2004; Schoors and van der Tol, 2002; Alto-monte and Resmini, 2002).
Secondly, the findings indicate that FDI-induced spillovers are not automaticfor indigenous firms. Rather, they suggest that positive FDI-induced spillovers onlocally-owned firms have been conditioned by specific factors, namely the technol-ogy intensity of foreign firms’ products and the size of the indigenous firms. Thisresult holds across all the countries considered.
Thirdly, we find evidence of positive spillovers in Romania and, albeit to a les-
ser extent, in Bulgaria, but not in Poland, which was the most advanced country inour sample. This result supports the technology gap hypothesis (Veblen, 1915;Gerschenkron, 1962; Findlay, 1978) to the effect that the wider the technology gap,the easier it is to pick up appropriable technologies and thus obtain productivitygains. As indicated by the figures in Table 2, in 1998 the productivity gap betweenPolish and foreign firms was either very narrow or in favour of indigenous firms,as in the case of low-tech manufacturing sectors. Although the Polish technologygap had increased over time, in 2003 it was still the smallest in the three countriesconsidered. Therefore, there was no or less scope for technology spillovers inPoland as opposed to Romania and Bulgaria, creating room for competition effects,
which are not surprisingly more intense when domestic and foreign firms operatein the same sectors rather than in complementary manufacturing sectors.
If we consider what happened within each country, different stories can be toldabout who generates technology spillovers and who benefits from them. In Bulgaria,we found evidence of only inter-sectoral spillovers generated by low-tech foreign firmsand benefiting only medium-sized indigenous firms. Instead, the pattern in Romaniacomprises both intra- and inter-sectoral spillovers from foreign firms operating in low-tech manufacturing sectors, and inter-sectoral spillovers from foreign firms in high-techmanufacturing sectors. Unlike in Bulgaria, intra-sectoral spillovers accrue to smallmore productive firms and large firms, regardless of their absorptive capacity, while
inter-sectoral spillovers accrue to small more productive firms. In Poland there is noroom for spillover effects, given the small gap in productivity between indigenous andforeign firms. Hence, competitive effects dominate, indicating that foreign firmsreduced indigenous firms’ market shares, forcing them up their average cost curve.
5. Summary and Conclusions
The main objective of this paper has been to analyse the importance of FDI-inducedspillovers on a set of comparable countries by using the same methodology. For this
FDI Spillovers in New EU Member States 505
2010 The Authors Journal compilation 2010 The European Bank for Reconstruction and Development
7/23/2019 Economics of Transition, 2010, FDI EU (1)
http://slidepdf.com/reader/full/economics-of-transition-2010-fdi-eu-1 20/25
purpose, we have differentiated not only between intra- and inter-sectoral spill-overs, and backward and forward linkages, but also explored the role that somefirms’ characteristics can play in the transmission process. We have argued that
determining which type of foreign firm is better able to create spillovers and whichtype of indigenous firm benefits from FDI-induced spillovers is more informativethan the mean benefit across a pool of heterogeneous source and host countryfirms.
The analysis, performed on a firm-level database including more than 40,000indigenous firms operating in 18 manufacturing sectors in Bulgaria, Poland andRomania during the period 1998–2003, contributes to the literature in several ways.
Overall, substantial heterogeneity in how FDI-induced spillovers are generatedand distributed across indigenous firms has been found, the main results being: (1)foreign firms operating in low-tech manufacturing sectors generate intra-sectoral
spillovers, while foreign firms operating in high-tech foreign firms generate inter-sectoral spillovers; (2) FDI effects operate through both supplier and client relation-ships; (3) FDI-induced spillovers are significant in Romania and to a lesser extent inBulgaria; but they are not significant in Poland, where the technological gap
between foreign and domestic firms is so narrow that it produces competitioneffects rather than technology spillovers; (4) firms’ size matters in the transmissionof FDI-induced spillovers but not in the case of competition effects. Moreover, itseffects vary not only across manufacturing sectors but also across countries.
Our findings suggest that more research is needed to enhance our understand-ing of sector- and firm-specific factors able to affect the nature and the magnitude
of FDI-induced spillovers.
References
Alfaro, L. and Rodriguez-Clare, A. (2004). ‘Multinationals and linkages: An empiricalinvestigation’, Economia, 4, pp. 113–69.
Altomonte, C. and Resmini, L. (2002). ‘Multinational enterprises as a catalyst for local indus-trial development. The case of Poland’, Scienze Regionali. The Italian Journal of Regional Sci-ence, 1, pp. 29–58.
Blomstrom, M. and Kokko, A. (1997). ‘How foreign investment affects host countries’, Policy
Research Working Paper Series n. 1745, Washington, DC: The World Bank.Blomstrom, M., Globerman, S. and Kokko, A. (2001). ‘The determinants of host country
spillovers from foreign direct investment: A review and synthesis of the literature’, inPain N. (ed.), Inward Investment, Technological Change and Growth: The Impact of Multina-tional Corporations on the UK Economy, New York: Houndmills, pp. 34–65.
Cantwell, J. (1993). ‘Technological competence and evolving patterns of internationalproduction’, in Cox H., Clegg J., Ietto-Gilles G. (eds), The Growth of Global Business,London: Routledge, pp. 19–37.
Damijan, J. P., Knell, M., Majcen, B. and Rojec, M. (2003a). ‘Technology transfer through FDIin top-10 transition countries: How important are direct effects, horizontal and vertical
506 Nicolini and Resmini
2010 The Authors Journal compilation 2010 The European Bank for Reconstruction and Development
7/23/2019 Economics of Transition, 2010, FDI EU (1)
http://slidepdf.com/reader/full/economics-of-transition-2010-fdi-eu-1 21/25
spillovers?’ William Davidson Working Paper No. 549, Ann Arbor, MI: William DavidsonInstitute, http://www.wdi.bus.umich.edu/research/working_papers.htm.
Damijan, J., Knell, J., Maicen, B. and Rojec, M. (2003b). ‘The role of FDI, R&D accumulation
and trade in transferring technology to transition countries: Evidence from firm paneldata for eight transition countries’, Economic Systems, 27, pp. 189–204.
De Loecker, J. (2007). ‘Product differentiation, multi-product firms and estimating the impactof trade liberalization on productivity’, NBER Working Paper No. W13155, Cambridge,MA: National Bureau of Economic Research.
Djankov, S. and Hoekman, B. (2000). ‘Foreign investment and productivity growth in Czechenterprise’, World Bank Economic Review, 14, pp. 49–64.
Dunning, J. (1993). Multinational Enterprises and the Global Economy, Wokingham: AddisonWesley.
Findlay, R. (1978). ‘Relative backwardness, direct foreign investment, and the transfer of technology: A simple dynamic model’, The Quarterly Journal of Economics, 92, pp. 1–16.
Fosfuri, A., Motta, M. and Ronde, T. (2001). ‘Foreign direct investment and spilloversthrough worker mobility’, Journal of International Economics, 53, pp. 205–22.
Gerschenkron, A. (1962). Relative Backwardness in Historical Perspective, Cambridge, MA:Harvard University Press.
Glass, A., Kosteas, V. and Saggi, K. (2001). ‘Linkages, multinationals and industrial develop-ment’, in Lipsey R., Mucchielli J. L. (eds), Multinational Firms and Impacts on Employment,Trade and Technology, London: Routledge, pp. 137–153.
Gorg, H. and Greenaway, D. (2004). ‘Much ado about nothing? Do domestic firms really benefit from foreign investment?’ World Bank Research Observer, 19, pp. 171–97.
Gorg, H. and Strobl, E. (2001). ‘Multinational companies and productivity spillovers: Ameta-analysis’, The Economic Journal, 111, pp. 723–39.
Gorg, H., Hijzen, A. and Murakozy, B. (2006). ‘The productivity spillover potential of foreign-owned firms: Firm-level evidence for Hungary’, Research Paper No. 8, TheUniversity of Nottingham.
Haskel, J., Pereira, S. and Slaughter, M. (2007). ‘Does inward foreign direct investment boostthe productivity of domestic firms?’ The Review of Economics and Statistics, 89, pp. 482–96.
Hirschman, A. (1958). The Strategy of Economic Development, New Haven, CT: Yale UniversityPress.
Jabbour, L. and Mucchielli, J. L. (2005). ‘Foreign affiliates in the French manufacturingindustry: Source or recipient of technology spillovers?’ Mimeo.
Keller, W. (2002). ‘Geographic localization of international technology diffusion’, AmericanEconomic Review, 92, pp. 120–42.
Keller, W. and Yeaple, S. (2003). ‘Multinational enterprises, international trade, and produc-tivity growth: Firm level evidence from the United States’, NBER Working Paper No. 9504,Cambridge MA: National Bureau of Economic Research.
Kinoshita, Y. (2001). ‘R&D and technology spillovers through FDI: Innovation and absorptivecapacity’, CEPR Discussion Paper No. 2775, London: Centre for Economic and PolicyResearch.
Konings, J. (2001). ‘The effect of direct foreign investment on domestic firms: Evidence fromfirm level panel data in emerging economies’, Economics of Transition, 9, pp. 619–33.
Kugler, M. (2006). ‘Spillovers from foreign direct investment: Within or between industries?’ Journal of Development Economics, 80, pp. 444–77.
FDI Spillovers in New EU Member States 507
2010 The Authors Journal compilation 2010 The European Bank for Reconstruction and Development
7/23/2019 Economics of Transition, 2010, FDI EU (1)
http://slidepdf.com/reader/full/economics-of-transition-2010-fdi-eu-1 22/25
Levinsohn, J. and Petrin, A. (2003). ‘Estimating production functions using inputs to controlfor unobservables’, Review of Economic Studies, 70, pp. 317–41.
Lipsey, R. and Sjoholm, F. (2005). ‘The impact of inward FDI on host countries: Why such dif-
ferent answers?‘ in Moran, T. H., Graham, E. M. and Blomstrom, M. (eds), Does ForeignDirect Investment Promote Development? Washington, DC: Institute for InternationalEconomics, pp. 23–43.
Liu, X., Siler, P., Wang, C. and Wei, Y. (2000). ‘Productivity spillovers from foreign directinvestment: Evidence from UK industry level panel data’, Journal of International BusinessStudies, 31, pp. 407–25.
Mairesse, J. and Jaumandreu, J. (2005). ‘Panel-data estimates of the production function andthe revenue function: What difference does it make?’ Scandinavian Journal of Economics,107, pp. 651–72.
Mansfield, E. and Romeo, A. (1980). ‘Technology transfer to overseas subsidiaries by US based firms’, Quarterly Journal of Economics, 95, pp. 737–50.
Markusen, J. and Venables, A. (1999). ‘Foreign direct investment as a catalyst for industrialdevelopment’, European Economic Review, 43, pp. 335–56.
Merlevede, B. and Schoors, K. (2007). ‘FDI and the consequences towards more completecapture of spillover effects’, William Davidson Working Papers Series No. 886, Ann Arbor:William Davidson Institute at the University of Michigan Stephen M. Ross BusinessSchool.
Olley, S. and Pakes, A. (1996). ‘The dynamics of productivity in the telecommunicationequipment industry’, Econometrica, 64, pp. 1263–97.
Pawlik, K. (2005). ‘Effects of foreign presence and affiliate control on the productivity of domestic companies in a transition economy: The case of the Polish manufacturing 1993–2002’, Working Paper No. 11, Aarhus: Aarhus School of Business, Department of Manage-
ment.Peri, G. and Urban, D. (2006). ‘Catching-up to foreign technology? Evidence on the ‘‘Veblen-Gerschenkron’’ effect of foreign investment’, Regional Science and Urban Economics, 36,pp. 72–98.
Resmini, L. (2000). ‘The determinants of foreign direct investment into the CEECs: Newevidence from sectoral patterns’, Economics of Transition, 8, pp. 665–89.
Rodriguez-Clare, R. (1996). ‘Multinationals, linkages, and economic development’, AmericanEconomic Review, 86, pp. 852–73.
Schoors, K. and van der Tol, B. (2002). ‘The productivity effect of foreign ownership ondomestic firms in Hungary’, Working Paper No. 157, Gent: University of Gent.
Sinani, E. and Meyer, K. (2004). ‘Spillovers of technology transfer from FDI: The case of Esto-
nia’, Journal of Comparative Economics, 32, pp. 445–66.Smarzynska-Javorcik, B. (2004). ‘Does foreign direct investment increase the productivity of domestic firms? In search of spillovers through backward linkages’, American EconomicReview, 94, pp. 605–27.
Smarzynska-Javorcik, B. and Spatareanu, M. (2005). ‘Disentangling FDI spillover effects:What do firm perceptions tell us?‘ in Moran, T. H., Graham, E. M., Blomstrom, M. (eds),Does Foreign Direct Investment Promote Development? Washington, DC: Institute for Inter-national Economics, pp. 45–71.
Torlak, E. (2004). ‘Foreign direct investment, technology transfer, and productivity growthin transition countries: Empirical evidence from panel data’, CEGE-Discussion Paper
508 Nicolini and Resmini
2010 The Authors Journal compilation 2010 The European Bank for Reconstruction and Development
7/23/2019 Economics of Transition, 2010, FDI EU (1)
http://slidepdf.com/reader/full/economics-of-transition-2010-fdi-eu-1 23/25
No. 26, Center for European, Governance and Economic Development Research, Univer-sity of Goettingen.
Tytell, I. and Yudaeva, K. (2007). ‘The role of FDI in Eastern Europe and new independent
states: New channels for the spillover effect’, in Liescher, K., Christl, J., Mooslechner, P.,and Ritzberger-Grunwald, D. (eds), Foreign Direct Investment in Europe. A ChangingLandscape, Cheltenham: Edward Elgar, pp. 76–86.
UN/ECE (2001). ‘Economic growth and foreign direct investment in the transition econo-mies’, Economic Survey of Europe, 1, Geneva: United Nations Press, pp. 185–225.
UNCTAD (2001). World Investment Report. Promoting Linkages, chapter IV, pp. 129–215,Geneva: United Nations Press.
Veblen, T. (1915). Imperial Germany and the Industrial Revolution, London: MacMillan.Wang, J. and Blomstrom, M. (1992). ‘Foreign investment and technology transfer’, European
Economic Review, 36, pp. 137–55.Yudaeva, K., Kozlov, K., Melentieva, N. and Ponomareva, N. (2003). ‘Does foreign owner-
ship matter? The Russian experience’, Economics of Transition, 11, pp. 383–409.Zukowska-Gagelmann, K. (2000). ‘Productivity spillovers from foreign direct investment in
Poland’, Economic System, 24, pp. 223–56.
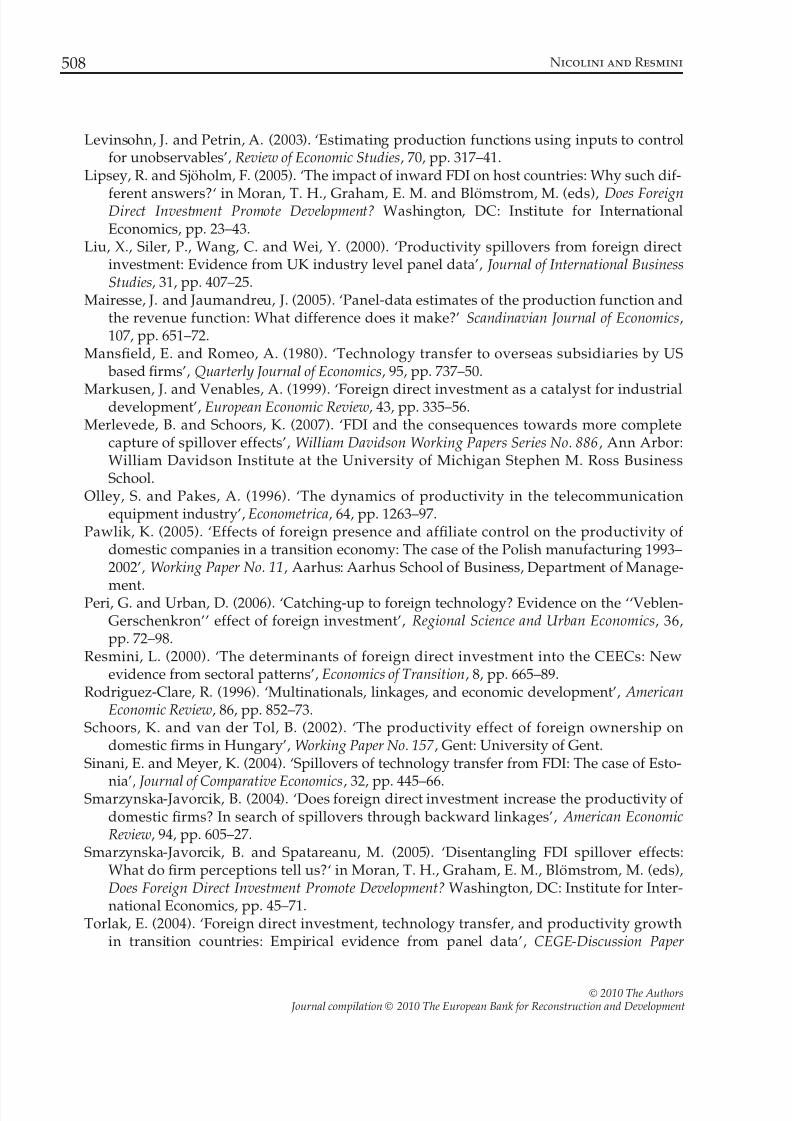
Appendix
Table A1. Representativeness of the sample
Country 1998 2003
Bulgaria 0.89a
0.94a
Poland 0.86a 0.88a
Romania 0.94a 0.99a
Notes: Correlation between manufacturing employments recorded in the database and official data fromEurostat; aindicates significance at 1% level.
FDI Spillovers in New EU Member States 509
2010 The Authors Journal compilation 2010 The European Bank for Reconstruction and Development
7/23/2019 Economics of Transition, 2010, FDI EU (1)
http://slidepdf.com/reader/full/economics-of-transition-2010-fdi-eu-1 24/25
Table A2. Classification of manufacturing industries (NACE Rev. 1 codes
in parentheses)
High-technology industries Low-technology industry
Aircrafts and spacecrafts (353) Building and repair of ships and boats (351)
Office, accounting and
computing machinery (30)
Rubber and plastic products (25)
Radio, TV and communications
equipment (32)
Coke, refined petroleum products and
nuclear fuel(23)
Medical, precision and
optical instruments (33)
Other non-metallic mineral products (26)
Electrical machinery and apparatus
n.e.c. (31)
Basic metals and fabricated metal
products (27–28)Motor vehicles, trailers and semi-trailers (34) Manufacturing n.e.c., recycling (36–37)
Chemicals (excluding pharmaceuticals) (24) Wood, pulp, paper prod., printing
and publishing (20–22)
Railroad and transport
equipment (352, 353, 354)
Food products, beverages and tobacco (15–16)
Machinery and equipment n.e.c. (29) Textiles, textile products,
leather and footwear (17–19)
Table A3. Spillover variables: correlation matrix
Intra_SpillS Inter_SpillS Intra_SpillC Inter_SpillC
Intra_SpillS BG: 1.00
PL: 1.00
RO: 1.00
Inter_SpillS BG: 0.009 BG: 1.00
PL: 0.015a PL: 1.00
RO:)
0.21
a
RO: 1.00Intra_SpillC BG: 0.97a BG: 0.054a BG: 1.00
PL: 0.99a PL: 0.012 b PL: 1.00
RO: 0.97a RO: )0.07a RO: 1.00
Inter_SpillC BG: )0.19a BG: 0.57a BG: )0.25a BG: 1.00
PL: )0.054a PL: 0.80a PL: )0.10a PL: 1.00
RO: )0.13a RO: 0.57a RO: )0.17a RO: 1.00
Note: a, bdenote significance at 1% and 5% levels respectively. S, supplier sectors; C, client sectors.
510 Nicolini and Resmini
2010 The Authors Journal compilation 2010 The European Bank for Reconstruction and Development

7/23/2019 Economics of Transition, 2010, FDI EU (1)
http://slidepdf.com/reader/full/economics-of-transition-2010-fdi-eu-1 25/25
Table A4. Chow tests for structural breaks in splitting the sample by
indigenous firm size
Bulgaria Poland Romania
MNEs in supplier sectors F[114,4509] = 18.82a F[233,6338] = 22.88a F[199,86867] = 28.49a
MNEs in client sectors F[114,4509] = 19.16a F[233,6338] = 22.74a F[199,86867] = 28.23a
Note: adenotes significance at 1% level.
FDI Spillovers in New EU Member States 511
2010 The Authors Journal compilation 2010 The European Bank for Reconstruction and Development