Embed Size (px)
Citation preview
ECONOMICS
RIDING THE IRON ORE CYCLE: ACTIONS OF AUSTRALIA’S MAJOR PRODUCERS
by
Jaimie Donovan and
Peter Hartley
Business School University of Western Australia
DISCUSSION PAPER 16.15
RIDING THE IRON ORE CYCLE: ACTIONS OF AUSTRALIA’S MAJOR PRODUCERS
By
Jaimie Donovan∗ University of Western Australia
Peter Hartley∗ University of Western Australia
18 April, 2016
DISCUSSION PAPER 16.15
KEYWORDS: Resources, Market Efficiency, Commodity Cycles, Investment, Competition, Iron Ore
ABSTRACT: Since 2014, a more challenging operating environment has developed for iron ore producers. Prices have declined and growth in demand has fallen short of forecasts. Within Australia, there has been some controversy over the reasons behind these new market conditions. In particular, there has been significant media and political comment that major local iron ore producers may have manipulated the market to drive out competitors, or engaged in sub-optimal market behaviour requiring rectification through policy intervention. This paper investigates if there is any truth to this commentary.
∗ Business School, University of Western Australia, 35 Stirling Hwy, Crawley WA 6009, Australia. Tel: +618-6488-5634. Email: [email protected] ∗ Business School, University of Western Australia, 35 Stirling Hwy, Crawley WA 6009, Australia. Tel: +618-6488-8560. Email: [email protected]
1
Introduction
From 2003 to 2013 the iron ore industry went through a boom period defined by record high prices and a production growth rate not seen in over a century. From 2014, however, a more challenging operating environment has emerged. Prices have been on a steady decline and growth in demand has fallen short of forecasts. Within Western Australia, controversy has erupted over the reasons behind these new market conditions. In particular, there has been significant media and political comment that local major iron ore producers may have manipulated the market to drive out competitors or engaged in some other sub-optimal behaviour requiring rectifying policy intervention. Critics of the major producers have been vague about rationalising the alleged sub-optimal behaviour. The intent of this paper is to review the actions of the participants in the Western Australian iron ore industry during the recent boom and evaluate the extent to which they support the sub-optimal behaviour theory, or the alternate hypothesis that producer decisions were optimal given the information available at the time they were taken. An Industry Overview
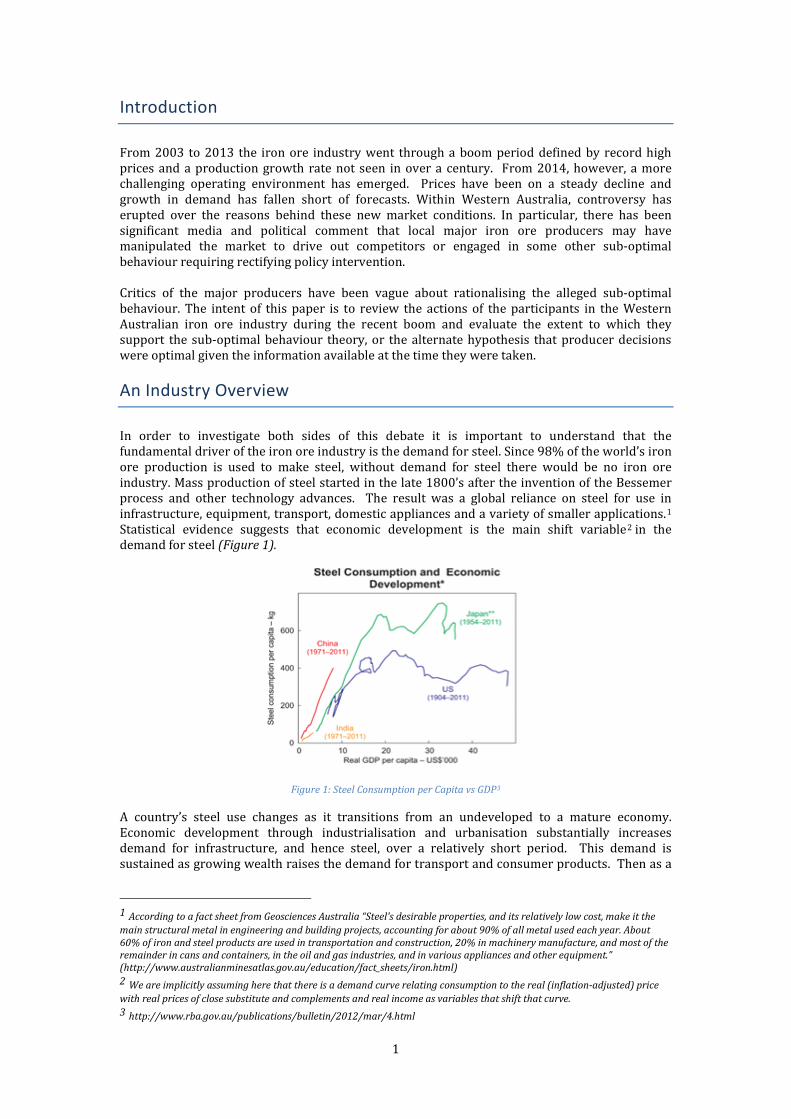
In order to investigate both sides of this debate it is important to understand that the fundamental driver of the iron ore industry is the demand for steel. Since 98% of the world’s iron ore production is used to make steel, without demand for steel there would be no iron ore industry. Mass production of steel started in the late 1800’s after the invention of the Bessemer process and other technology advances. The result was a global reliance on steel for use in infrastructure, equipment, transport, domestic appliances and a variety of smaller applications.1 Statistical evidence suggests that economic development is the main shift variable2 in the demand for steel (Figure 1).
Figure 1: Steel Consumption per Capita vs GDP3
A country’s steel use changes as it transitions from an undeveloped to a mature economy. Economic development through industrialisation and urbanisation substantially increases demand for infrastructure, and hence steel, over a relatively short period. This demand is sustained as growing wealth raises the demand for transport and consumer products. Then as a
1 According to a fact sheet from Geosciences Australia “Steel's desirable properties, and its relatively low cost, make it the main structural metal in engineering and building projects, accounting for about 90% of all metal used each year. About 60% of iron and steel products are used in transportation and construction, 20% in machinery manufacture, and most of the remainder in cans and containers, in the oil and gas industries, and in various appliances and other equipment.” (http://www.australianminesatlas.gov.au/education/fact_sheets/iron.html) 2 We are implicitly assuming here that there is a demand curve relating consumption to the real (inflation-adjusted) price with real prices of close substitute and complements and real income as variables that shift that curve. 3 http://www.rba.gov.au/publications/bulletin/2012/mar/4.html
2
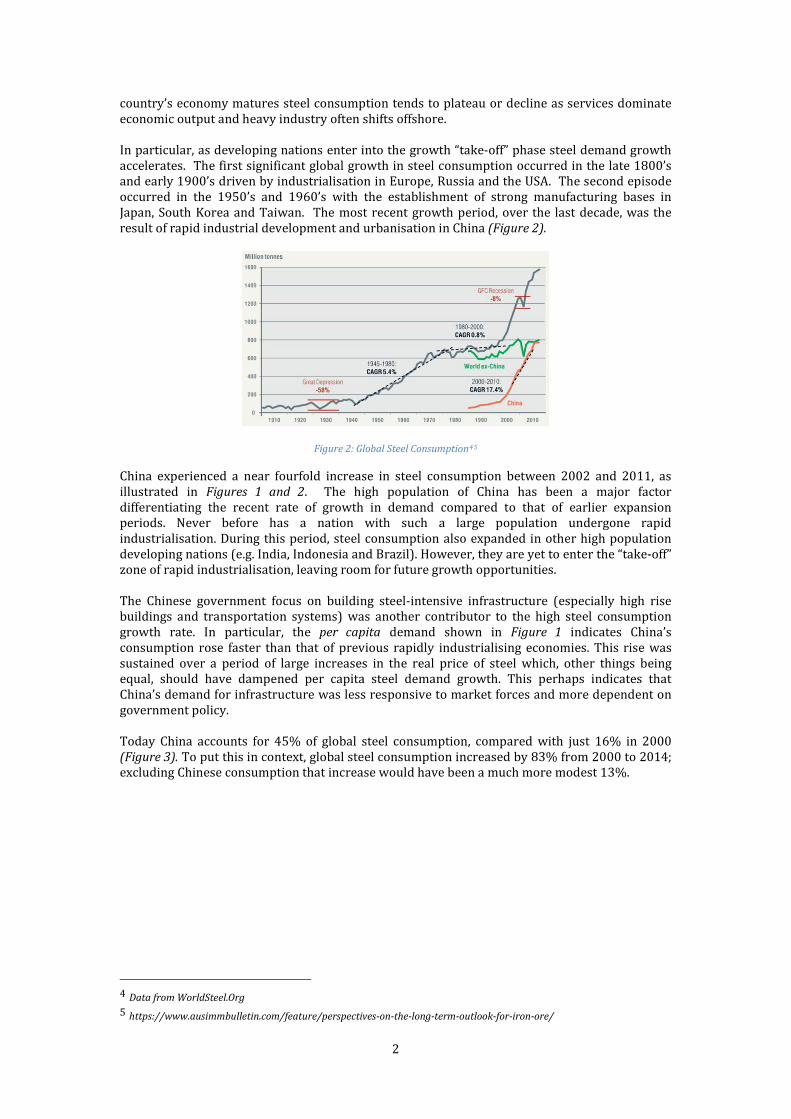
country’s economy matures steel consumption tends to plateau or decline as services dominate economic output and heavy industry often shifts offshore. In particular, as developing nations enter into the growth “take-off” phase steel demand growth accelerates. The first significant global growth in steel consumption occurred in the late 1800’s and early 1900’s driven by industrialisation in Europe, Russia and the USA. The second episode occurred in the 1950’s and 1960’s with the establishment of strong manufacturing bases in Japan, South Korea and Taiwan. The most recent growth period, over the last decade, was the result of rapid industrial development and urbanisation in China (Figure 2).
Figure 2: Global Steel Consumption4 5
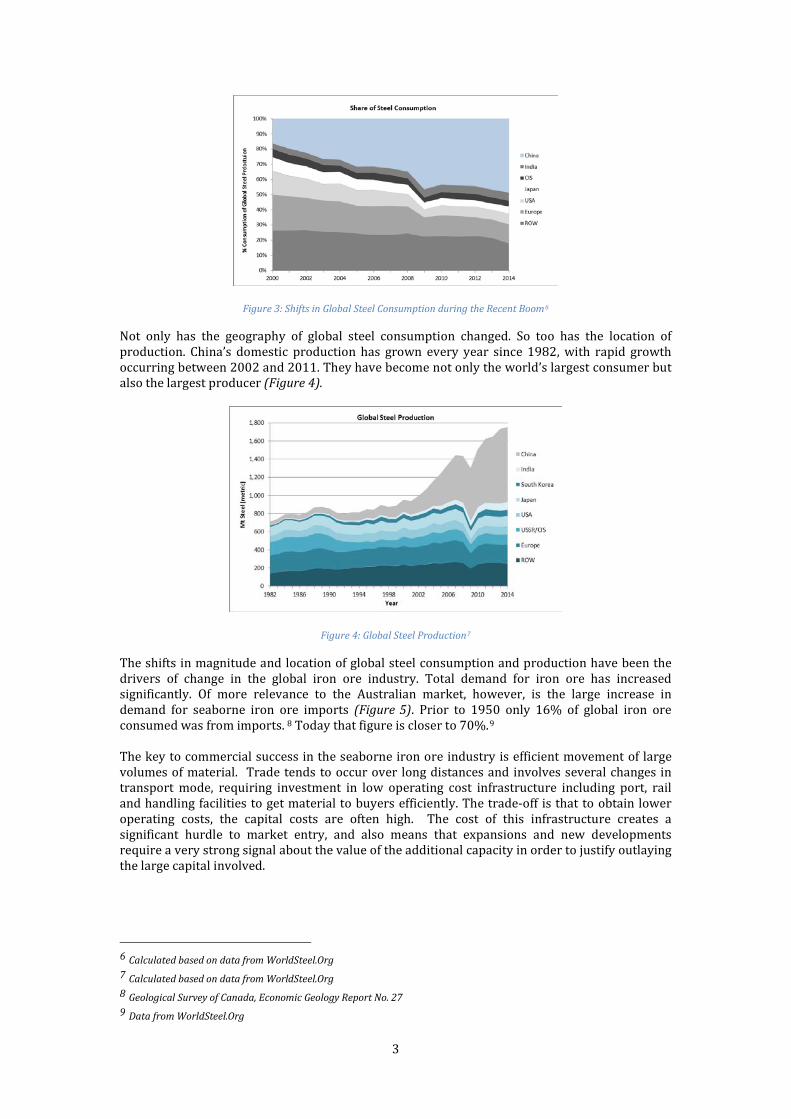
China experienced a near fourfold increase in steel consumption between 2002 and 2011, as illustrated in Figures 1 and 2. The high population of China has been a major factor differentiating the recent rate of growth in demand compared to that of earlier expansion periods. Never before has a nation with such a large population undergone rapid industrialisation. During this period, steel consumption also expanded in other high population developing nations (e.g. India, Indonesia and Brazil). However, they are yet to enter the “take-off” zone of rapid industrialisation, leaving room for future growth opportunities. The Chinese government focus on building steel-intensive infrastructure (especially high rise buildings and transportation systems) was another contributor to the high steel consumption growth rate. In particular, the per capita demand shown in Figure 1 indicates China’s consumption rose faster than that of previous rapidly industrialising economies. This rise was sustained over a period of large increases in the real price of steel which, other things being equal, should have dampened per capita steel demand growth. This perhaps indicates that China’s demand for infrastructure was less responsive to market forces and more dependent on government policy. Today China accounts for 45% of global steel consumption, compared with just 16% in 2000 (Figure 3). To put this in context, global steel consumption increased by 83% from 2000 to 2014; excluding Chinese consumption that increase would have been a much more modest 13%.
4 Data from WorldSteel.Org 5 https://www.ausimmbulletin.com/feature/perspectives-on-the-long-term-outlook-for-iron-ore/
3
Figure 3: Shifts in Global Steel Consumption during the Recent Boom6
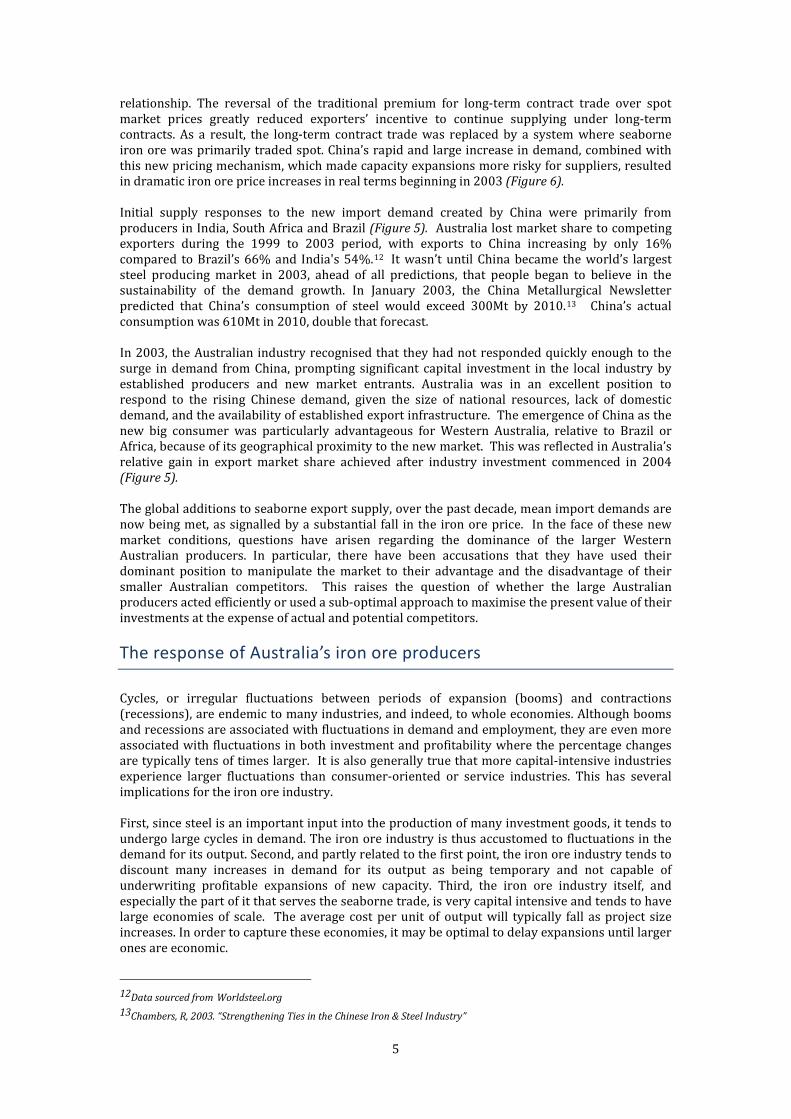
Not only has the geography of global steel consumption changed. So too has the location of production. China’s domestic production has grown every year since 1982, with rapid growth occurring between 2002 and 2011. They have become not only the world’s largest consumer but also the largest producer (Figure 4).
Figure 4: Global Steel Production7
The shifts in magnitude and location of global steel consumption and production have been the drivers of change in the global iron ore industry. Total demand for iron ore has increased significantly. Of more relevance to the Australian market, however, is the large increase in demand for seaborne iron ore imports (Figure 5). Prior to 1950 only 16% of global iron ore consumed was from imports. 8 Today that figure is closer to 70%.9 The key to commercial success in the seaborne iron ore industry is efficient movement of large volumes of material. Trade tends to occur over long distances and involves several changes in transport mode, requiring investment in low operating cost infrastructure including port, rail and handling facilities to get material to buyers efficiently. The trade-off is that to obtain lower operating costs, the capital costs are often high. The cost of this infrastructure creates a significant hurdle to market entry, and also means that expansions and new developments require a very strong signal about the value of the additional capacity in order to justify outlaying the large capital involved.
6 Calculated based on data from WorldSteel.Org 7 Calculated based on data from WorldSteel.Org 8 Geological Survey of Canada, Economic Geology Report No. 27 9 Data from WorldSteel.Org

4
Figure 5: Global Iron Ore Production and Exports
The first major shift toward seaborne iron ore imports occurred during the 1960’s with Japan’s rapid development and manufacturing boom. Japan’s lack of domestic iron ore supply forced them to make significant advances in transport technology to facilitate economic shipping of large volumes of iron ore from overseas. From 1960 to 1970 there was a fivefold increase in Japan’s iron ore imports (a similar increase was seen in China from 2003 to 2013), facilitated by rapid investment and expansions in the Australian and Brazilian iron ore mining industries. Long-term iron ore supply contracts offered by Japanese steel-makers in the 1960’s and 70’s provided the confidence investors needed to fund the development of large-scale mines and logistical infrastructure to access remote iron ore reserves in Australia and Brazil. This was supported by relatively high real-term prices during the same period (Figure 6).
Figure 6: Real-term Iron Ore Price History (62% FOB Hamersley fines)10
Japan’s post-war industrialisation was complete by the end of the 1970’s and global steel demand plateaued, leading to over 20 years of stagnation in the global iron ore mining industry, reflected by low real iron ore price. Then China emerged as a major new buyer, with insufficient domestic production,11 a new source of demand was created in the export market. By 2000 China had displaced Japan as the main importer of iron ore, bringing change to the structure and pricing mechanism of the seaborne iron ore market. The Japanese market was concentrated in the hands of a few steel mills that imported all their iron ore requirements. China had many mills, and many of these also had access to domestic supplies. Each Chinese mill thus took a much smaller share of seaborne iron ore exports, and any one of them had much less interest in supporting a system of long-term contract trade. In fact, while steel mills had traditionally paid a premium over spot prices for the insurance of guaranteed long-term contract supplies, Chinese demand for short-term cargoes flipped this
10 Source: AME 11 There is often confusion about the volume of domestic Chinese production. Comparing total production tonnage from China to other nations is misleading due to the poor grade of their ore. A more appropriate figure to compare is Chinese production adjusted by iron content to match typical world exporting grades.
5
relationship. The reversal of the traditional premium for long-term contract trade over spot market prices greatly reduced exporters’ incentive to continue supplying under long-term contracts. As a result, the long-term contract trade was replaced by a system where seaborne iron ore was primarily traded spot. China’s rapid and large increase in demand, combined with this new pricing mechanism, which made capacity expansions more risky for suppliers, resulted in dramatic iron ore price increases in real terms beginning in 2003 (Figure 6). Initial supply responses to the new import demand created by China were primarily from producers in India, South Africa and Brazil (Figure 5). Australia lost market share to competing exporters during the 1999 to 2003 period, with exports to China increasing by only 16% compared to Brazil’s 66% and India's 54%.12 It wasn’t until China became the world’s largest steel producing market in 2003, ahead of all predictions, that people began to believe in the sustainability of the demand growth. In January 2003, the China Metallurgical Newsletter predicted that China’s consumption of steel would exceed 300Mt by 2010.13 China’s actual consumption was 610Mt in 2010, double that forecast. In 2003, the Australian industry recognised that they had not responded quickly enough to the surge in demand from China, prompting significant capital investment in the local industry by established producers and new market entrants. Australia was in an excellent position to respond to the rising Chinese demand, given the size of national resources, lack of domestic demand, and the availability of established export infrastructure. The emergence of China as the new big consumer was particularly advantageous for Western Australia, relative to Brazil or Africa, because of its geographical proximity to the new market. This was reflected in Australia’s relative gain in export market share achieved after industry investment commenced in 2004 (Figure 5). The global additions to seaborne export supply, over the past decade, mean import demands are now being met, as signalled by a substantial fall in the iron ore price. In the face of these new market conditions, questions have arisen regarding the dominance of the larger Western Australian producers. In particular, there have been accusations that they have used their dominant position to manipulate the market to their advantage and the disadvantage of their smaller Australian competitors. This raises the question of whether the large Australian producers acted efficiently or used a sub-optimal approach to maximise the present value of their investments at the expense of actual and potential competitors. The response of Australia’s iron ore producers
Cycles, or irregular fluctuations between periods of expansion (booms) and contractions (recessions), are endemic to many industries, and indeed, to whole economies. Although booms and recessions are associated with fluctuations in demand and employment, they are even more associated with fluctuations in both investment and profitability where the percentage changes are typically tens of times larger. It is also generally true that more capital-intensive industries experience larger fluctuations than consumer-oriented or service industries. This has several implications for the iron ore industry. First, since steel is an important input into the production of many investment goods, it tends to undergo large cycles in demand. The iron ore industry is thus accustomed to fluctuations in the demand for its output. Second, and partly related to the first point, the iron ore industry tends to discount many increases in demand for its output as being temporary and not capable of underwriting profitable expansions of new capacity. Third, the iron ore industry itself, and especially the part of it that serves the seaborne trade, is very capital intensive and tends to have large economies of scale. The average cost per unit of output will typically fall as project size increases. In order to capture these economies, it may be optimal to delay expansions until larger ones are economic.
12Data sourced from Worldsteel.org 13Chambers, R, 2003. “Strengthening Ties in the Chinese Iron & Steel Industry”
6
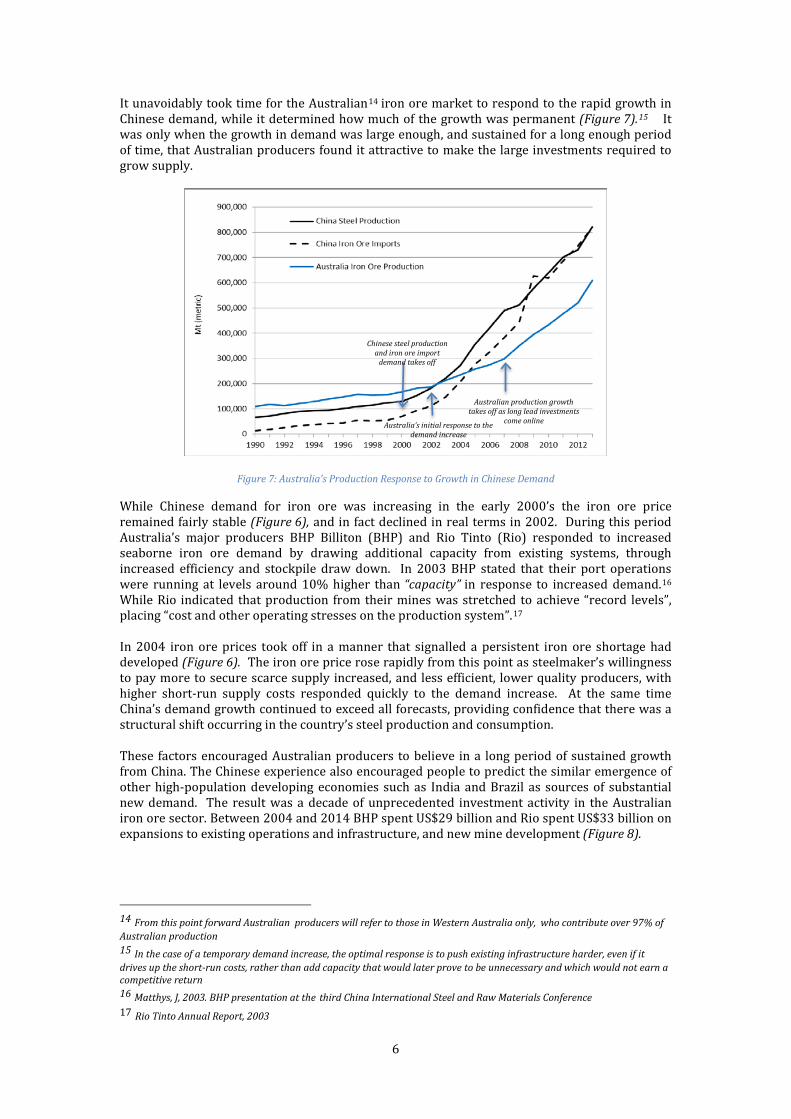
It unavoidably took time for the Australian14 iron ore market to respond to the rapid growth in Chinese demand, while it determined how much of the growth was permanent (Figure 7).15 It was only when the growth in demand was large enough, and sustained for a long enough period of time, that Australian producers found it attractive to make the large investments required to grow supply.
Figure 7: Australia's Production Response to Growth in Chinese Demand
While Chinese demand for iron ore was increasing in the early 2000’s the iron ore price remained fairly stable (Figure 6), and in fact declined in real terms in 2002. During this period Australia’s major producers BHP Billiton (BHP) and Rio Tinto (Rio) responded to increased seaborne iron ore demand by drawing additional capacity from existing systems, through increased efficiency and stockpile draw down. In 2003 BHP stated that their port operations were running at levels around 10% higher than “capacity” in response to increased demand.16 While Rio indicated that production from their mines was stretched to achieve “record levels”, placing “cost and other operating stresses on the production system”.17 In 2004 iron ore prices took off in a manner that signalled a persistent iron ore shortage had developed (Figure 6). The iron ore price rose rapidly from this point as steelmaker’s willingness to pay more to secure scarce supply increased, and less efficient, lower quality producers, with higher short-run supply costs responded quickly to the demand increase. At the same time China’s demand growth continued to exceed all forecasts, providing confidence that there was a structural shift occurring in the country’s steel production and consumption. These factors encouraged Australian producers to believe in a long period of sustained growth from China. The Chinese experience also encouraged people to predict the similar emergence of other high-population developing economies such as India and Brazil as sources of substantial new demand. The result was a decade of unprecedented investment activity in the Australian iron ore sector. Between 2004 and 2014 BHP spent US$29 billion and Rio spent US$33 billion on expansions to existing operations and infrastructure, and new mine development (Figure 8).
14 From this point forward Australian producers will refer to those in Western Australia only, who contribute over 97% of Australian production 15 In the case of a temporary demand increase, the optimal response is to push existing infrastructure harder, even if it drives up the short-run costs, rather than add capacity that would later prove to be unnecessary and which would not earn a competitive return 16 Matthys, J, 2003. BHP presentation at the third China International Steel and Raw Materials Conference 17 Rio Tinto Annual Report, 2003
Australian production growth takes off as long lead investments
come online
Chinese steel production and iron ore import
demand takes off
Australia’s initial response to the demand increase
7
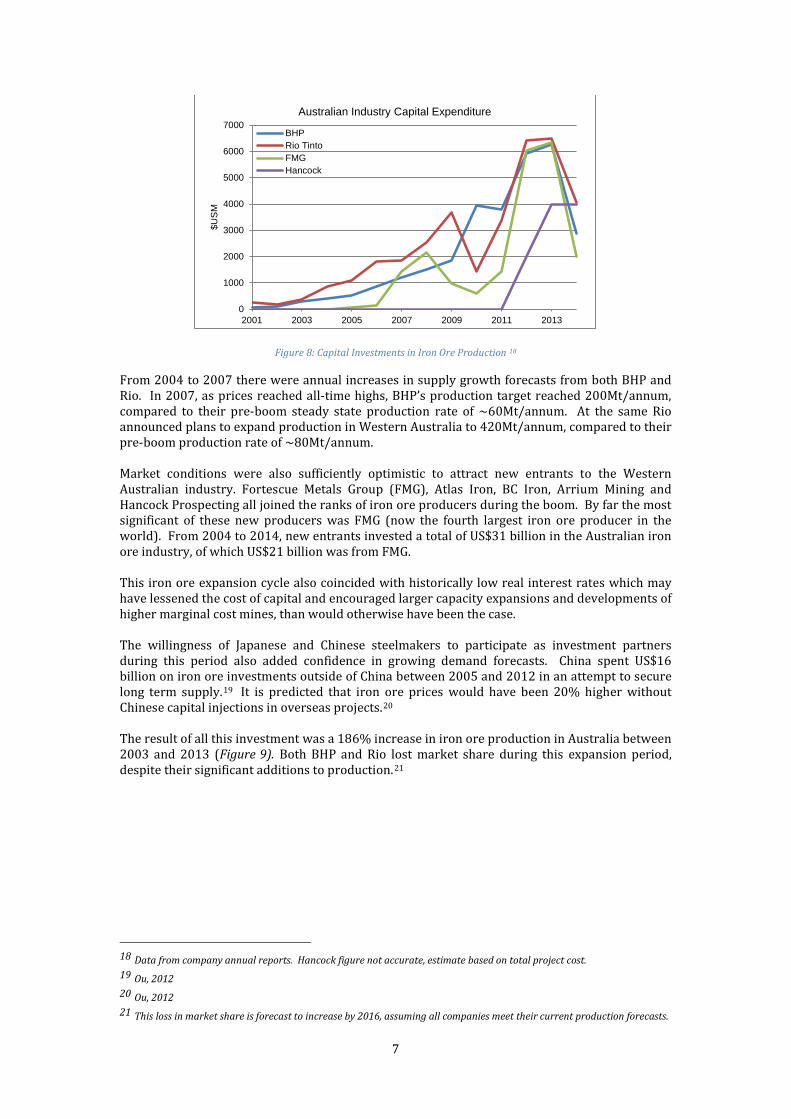
Figure 8: Capital Investments in Iron Ore Production 18
From 2004 to 2007 there were annual increases in supply growth forecasts from both BHP and Rio. In 2007, as prices reached all-time highs, BHP’s production target reached 200Mt/annum, compared to their pre-boom steady state production rate of ~60Mt/annum. At the same Rio announced plans to expand production in Western Australia to 420Mt/annum, compared to their pre-boom production rate of ~80Mt/annum. Market conditions were also sufficiently optimistic to attract new entrants to the Western Australian industry. Fortescue Metals Group (FMG), Atlas Iron, BC Iron, Arrium Mining and Hancock Prospecting all joined the ranks of iron ore producers during the boom. By far the most significant of these new producers was FMG (now the fourth largest iron ore producer in the world). From 2004 to 2014, new entrants invested a total of US$31 billion in the Australian iron ore industry, of which US$21 billion was from FMG. This iron ore expansion cycle also coincided with historically low real interest rates which may have lessened the cost of capital and encouraged larger capacity expansions and developments of higher marginal cost mines, than would otherwise have been the case. The willingness of Japanese and Chinese steelmakers to participate as investment partners during this period also added confidence in growing demand forecasts. China spent US$16 billion on iron ore investments outside of China between 2005 and 2012 in an attempt to secure long term supply.19 It is predicted that iron ore prices would have been 20% higher without Chinese capital injections in overseas projects.20 The result of all this investment was a 186% increase in iron ore production in Australia between 2003 and 2013 (Figure 9). Both BHP and Rio lost market share during this expansion period, despite their significant additions to production.21
18 Data from company annual reports. Hancock figure not accurate, estimate based on total project cost. 19 Ou, 2012 20 Ou, 2012 21 This loss in market share is forecast to increase by 2016, assuming all companies meet their current production forecasts.
0
1000
2000
3000
4000
5000
6000
7000
2001 2003 2005 2007 2009 2011 2013
$US
M
Australian Industry Capital Expenditure
BHPRio TintoFMGHancock
8
Company 2003 Share of Australian Production
2013 Share of Australian Production
Change in Share
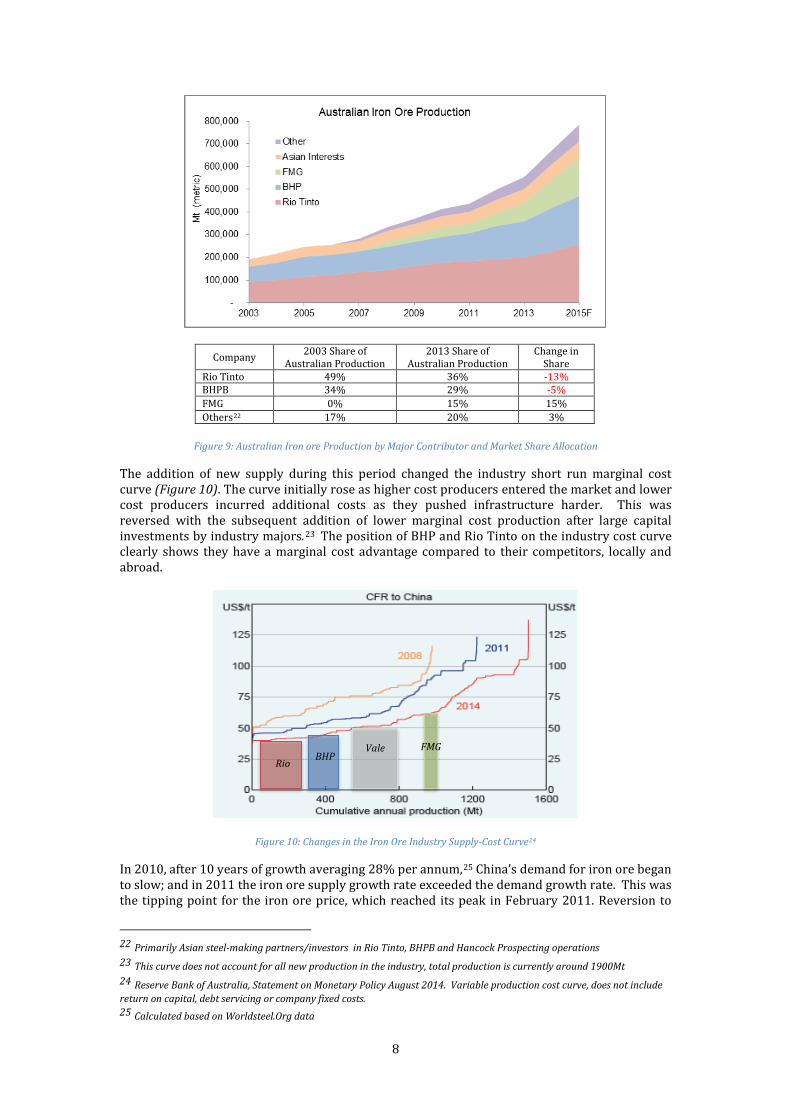
Rio Tinto 49% 36% -13% BHPB 34% 29% -5% FMG 0% 15% 15% Others22 17% 20% 3%
Figure 9: Australian Iron ore Production by Major Contributor and Market Share Allocation
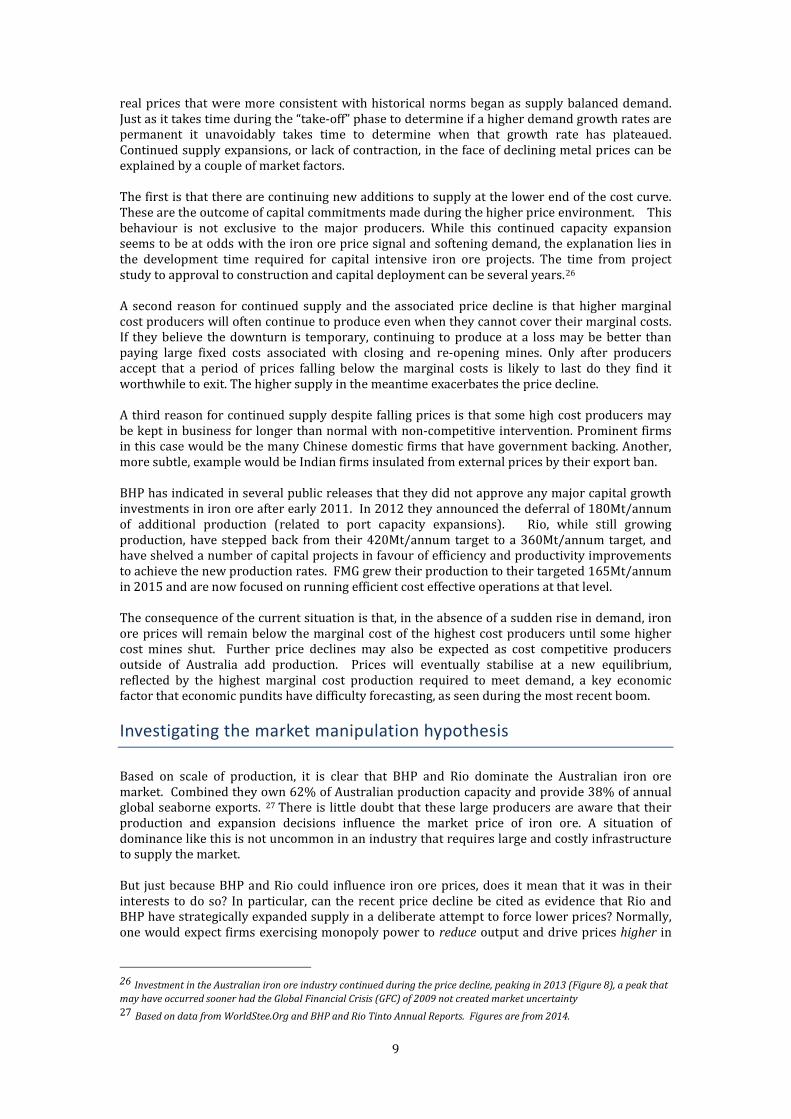
The addition of new supply during this period changed the industry short run marginal cost curve (Figure 10). The curve initially rose as higher cost producers entered the market and lower cost producers incurred additional costs as they pushed infrastructure harder. This was reversed with the subsequent addition of lower marginal cost production after large capital investments by industry majors.23 The position of BHP and Rio Tinto on the industry cost curve clearly shows they have a marginal cost advantage compared to their competitors, locally and abroad.
Figure 10: Changes in the Iron Ore Industry Supply-Cost Curve24
In 2010, after 10 years of growth averaging 28% per annum,25 China’s demand for iron ore began to slow; and in 2011 the iron ore supply growth rate exceeded the demand growth rate. This was the tipping point for the iron ore price, which reached its peak in February 2011. Reversion to
22 Primarily Asian steel-making partners/investors in Rio Tinto, BHPB and Hancock Prospecting operations 23 This curve does not account for all new production in the industry, total production is currently around 1900Mt 24 Reserve Bank of Australia, Statement on Monetary Policy August 2014. Variable production cost curve, does not include return on capital, debt servicing or company fixed costs. 25 Calculated based on Worldsteel.Org data
Rio BHP Vale FMG
9
real prices that were more consistent with historical norms began as supply balanced demand. Just as it takes time during the “take-off” phase to determine if a higher demand growth rates are permanent it unavoidably takes time to determine when that growth rate has plateaued. Continued supply expansions, or lack of contraction, in the face of declining metal prices can be explained by a couple of market factors. The first is that there are continuing new additions to supply at the lower end of the cost curve. These are the outcome of capital commitments made during the higher price environment. This behaviour is not exclusive to the major producers. While this continued capacity expansion seems to be at odds with the iron ore price signal and softening demand, the explanation lies in the development time required for capital intensive iron ore projects. The time from project study to approval to construction and capital deployment can be several years.26 A second reason for continued supply and the associated price decline is that higher marginal cost producers will often continue to produce even when they cannot cover their marginal costs. If they believe the downturn is temporary, continuing to produce at a loss may be better than paying large fixed costs associated with closing and re-opening mines. Only after producers accept that a period of prices falling below the marginal costs is likely to last do they find it worthwhile to exit. The higher supply in the meantime exacerbates the price decline. A third reason for continued supply despite falling prices is that some high cost producers may be kept in business for longer than normal with non-competitive intervention. Prominent firms in this case would be the many Chinese domestic firms that have government backing. Another, more subtle, example would be Indian firms insulated from external prices by their export ban. BHP has indicated in several public releases that they did not approve any major capital growth investments in iron ore after early 2011. In 2012 they announced the deferral of 180Mt/annum of additional production (related to port capacity expansions). Rio, while still growing production, have stepped back from their 420Mt/annum target to a 360Mt/annum target, and have shelved a number of capital projects in favour of efficiency and productivity improvements to achieve the new production rates. FMG grew their production to their targeted 165Mt/annum in 2015 and are now focused on running efficient cost effective operations at that level. The consequence of the current situation is that, in the absence of a sudden rise in demand, iron ore prices will remain below the marginal cost of the highest cost producers until some higher cost mines shut. Further price declines may also be expected as cost competitive producers outside of Australia add production. Prices will eventually stabilise at a new equilibrium, reflected by the highest marginal cost production required to meet demand, a key economic factor that economic pundits have difficulty forecasting, as seen during the most recent boom. Investigating the market manipulation hypothesis
Based on scale of production, it is clear that BHP and Rio dominate the Australian iron ore market. Combined they own 62% of Australian production capacity and provide 38% of annual global seaborne exports. 27 There is little doubt that these large producers are aware that their production and expansion decisions influence the market price of iron ore. A situation of dominance like this is not uncommon in an industry that requires large and costly infrastructure to supply the market. But just because BHP and Rio could influence iron ore prices, does it mean that it was in their interests to do so? In particular, can the recent price decline be cited as evidence that Rio and BHP have strategically expanded supply in a deliberate attempt to force lower prices? Normally, one would expect firms exercising monopoly power to reduce output and drive prices higher in
26 Investment in the Australian iron ore industry continued during the price decline, peaking in 2013 (Figure 8), a peak that may have occurred sooner had the Global Financial Crisis (GFC) of 2009 not created market uncertainty 27 Based on data from WorldStee.Org and BHP and Rio Tinto Annual Reports. Figures are from 2014.

10
order to maximise profits. In this instance, the claim is that the reduced industry competition resulted in prices below the efficient level. This would only be a successful strategy if the lower prices stifled competition by driving higher cost producers out of the market, and the reduced competition allowed the fewer number of remaining participants to achieve higher prices by then restricting supply. The subsequent higher prices would increase profitability and investment. Under this strategy, the low prices come now and the higher prices would come later. The higher prices would be devalued in present value terms, relative to the lower prices that would be received earlier. Thus, the subsequent price increase would need to be larger than the current price decline to overcome the timing of cash flow receipt (i.e. the opportunity cost). For this to be true it requires that Australian majors added more capacity than would be justified by costs and anticipated future prices, and that they demonstrate a willingness to accept lower prices or incur a loss to undercut competitors. It also requires that the Australian majors could restrict supply at some point in the future by enough to make the subsequent price increases sufficiently high to gain in present value terms. For this strategy to work a necessary condition is that it not be possible for competitors to easily re-enter the market. Given the size of their reserves and their access to capital, both BHP and Rio are in a position to increase supply to a level that could eliminate competitors from the market. But this is only half of a profit maximising strategy. The second half of the strategy requires them to have an influencing control over supply in the less competitive market after competitors exit. This presents a significant challenge. There are a number of reasons why it is unlikely to be a profit maximising strategy for the major Australian iron ore producers. The major Australian iron ore companies cannot effectively constrain market supply. BHP and Rio Tinto compete directly against each other for customers and market share. Neither of these producers has sufficient market share to independently control the market; collusion would be required. Collusion of private companies is an illegal practice in the operating country (Australia), their listing countries (Australia, UK, USA), and a number of their consumer countries (Japan, Korea, EU nations).
In 2009 BHP and Rio attempted to enter into a 50:50 iron ore production joint venture, combining the operations and management of their Western Australian iron ore assets. The merger was formally scrapped in 2010 after being met with enormous opposition from global regulators and steel makers, including the European Commission, the Australian Competition and Consumer Commission, Japan Fair Trade Commission, Korea Fair Trade Commission and the German Federal Cartel Office.
Even if collusion between BHP and Rio were legal, it is unlikely to be successful without also involving additional parties. BHP and Rio control just 38% of the seaborne iron ore export market. In combination with FMG that control would increase to 49%, or to an impressive 68% in collusion with Vale. But each company is only likely to participate if they believe they can extract more benefit from the cartel than a competitive free market environment. The fundamental challenge with this is that cartels require production to be reduced while creating a strong incentive for each participating members to expand output to benefit from the higher prices created. For this reason most cartels of private firms do not succeed. Cartels like the Organisation of Petroleum Exporting Countries (OPEC) have persisted because they involve sovereign countries controlling national resources. OPEC also has to contend with continual cheating on production quotas by its members. Competitors may not exit the market as predicted. This purported manipulation strategy relies on local and foreign competitors exiting the market efficiently when prices fall. However, for several reasons this outcome may not eventuate, or may take so long to eventuate that the strategy would not be profitable in net present value terms.
First, when prices drop so do the costs of many variable inputs, which means operating costs will decline. Firms with higher variable costs will benefit more from drops in input costs and may be
11
able to reposition themselves on the cost curve and maintain profitable operations. Second, if competitive producers believe that the low prices are only temporary, and prices will subsequently be raised to extract monopoly rents, they may accept short-run operating losses and not exit the market. This is of particular relevance in today’s market where there is still the possibility of demand from a take-off in growth in other emerging markets. Finally, government backing, through policy intervention or financial assistance, may allow otherwise unprofitable operations to continue producing.
In the absence of a quick exit of competitors, further pressure is created on the iron ore price, increasing the earnings BHP and Rio would need to realise when they are finally able to implement the required output restrictions and raise the price. Alternative iron ore supply sources and substitutes exist in the market. If supply restrictions established by major Australian producers subsequent to the exit of local competition were able to raise prices, the rise in iron ore price may stimulate expansion in supply by global competitors or the use of alternate products.
Supply restrictions have to be sufficient to drive prices high enough to offset not only the near-term losses suffered by majors during a low price period but also reduced sales volume in the future. Such high prices may stimulate the expansion of existing global competitors (eg Vale, Kumba) or the development of entirely new iron ore provinces (e.g. Guinea, Sierra Leone) where the high fixed start-up cost currently presents a barrier to entry. Any attempt to substantially raise prices may trigger Asian steel firms, who previously invested in the Australian iron ore industry, to invest in other locations to avoid the consequences of monopolistic behaviour. To some degree this already occurs in the market as China tries to diversify its supply options. Recently they committed US$4 billion loan to help finance Vale’s S11D expansion project. They are also committed to funding their share of the US$20 billion high grade Simandou project in Guinea.
Although Australia contains the largest iron ore resource, Brazil, Guinea and India combined have more than enough resources to supply future growth in iron ore demand. While Australia has a geographic advantage over Brazil and Guinea, these two producers have quality advantages. Brazil is also in the process of alleviating its geographic disadvantages with massive new low-cost ships and related port facilities.
Although steel has become a necessity for most industrialised nations, the amount of steel used can be varied within limits in response to input price differentials. High iron ore prices may stimulate the use of substitutes such as scrap steel in place of iron ore as an input; or the invention of new supply or demand technologies to get around the resulting higher prices for steel – for example the use of plastics and aluminium as steel substitutes in the developed world.
A recent McKinsey study28 predicted that by 2020 China will be in a position to make a serious shift towards the use of scrap metal, as infrastructure from the first building boom in the 1990’s reaches its end of life. This could see a shift in processing technology from raw steelmaking to steel recycling facilities if the former become more costly. While such alternatives may still take years to develop, sustained higher prices may force people to seek these alternatives faster. BHP and Rio have reserves equal to many year’s supply of iron ore that would decrease in value if suitable alternatives became available.
There is a complex relationship between iron ore producers and consumers. Many steelmakers jointly participate in iron ore mining ventures and are privy to information about the profitability and strategy of the mining operations. This greatly constrains the ability of iron ore producers to manipulate production to their advantage and to the disadvantage of their customers.
28 McKinsey&Company, Scarcity and Saturation. McKinsey on Metals & Mining Number 08, Spring 2013.

12
Both the BHP and Rio Tinto have shared ownership arrangements with the consumers of their product. In 2014, 15% of production from BHP’s Australian mines and 13% of production from Rio’s Australian mines was owned by Asian partners. These alliances would mean both majors would face significant long term damage to their reputations with partners were they seen to be manipulating supply/and or price to the detriment of their partners. There are structural changes occurring in China’s steel-making industry. In the mid-1990’s Chinese steel companies were gradually permitted to make their own arrangements to import their iron ore needs. Prior to this, the Ministry of Metallurgical Industry had been responsible for all imports and exports of iron and steel. This structural shift influenced the development of the spot market and meant iron ore producers were now trading with many steel makers, shifting the balance of power away from iron ore consumers towards the iron ore producers.
There is now a shift in the Chinese steel making industry away from lots of smaller steel companies towards the creation of mega producers able to compete more effectively in the international market. This shift in structure would empower the Chinese steel manufacturing industry, as it did the Japanese steel industry from the 1960’s to 1990’s. This would increase the likelihood of the potential adverse outcomes discussed above, including financing alternate suppliers or offering incentives for parties to break any cartel arrangements.
There is potential for profit erosion despite successful market manipulation. There is a risk that higher prices never eventuate, or are not sufficient to compensate for profit losses incurred during the low price environment. This is possible if the supply gap is filled by increased production from overseas competitors, or the re-start of local assets under the control of new owners with different operating or financial circumstances that allow for profitable operation of the mines at lower price points. Alternatively, higher operating costs may result from holding back output to maintain supply restrictions. In capital-intensive industries it is in the best interests of producers to operate near full capacity in order to minimise their unit operating costs, reducing output increases inefficiencies and contributes to cost increases. Depending on the level of supply restriction required in the future the additional costs may outweigh the price benefit. Getting the combination of supply level, price and timing correct would be a fine balancing act for any company, and difficult to achieve in the face of other sources of viable competition.
Conclusion
There is no denying that BHP and Rio have significant influence in the Australian and global iron ore markets and are likely to continue their dominance while China, Japan and South Korea remain large consumers. However, it is unlikely that there has been “strategic” oversupply of iron ore by either of the major Australian companies with the direct intention of removing local competition to benefit from higher prices in the future. The primary reason is this decision is very unlikely to be profitable. To succeed, it is almost sure to require illegal collusion between otherwise competing companies, and it would require future reactions by other producers and consumers that are implausible. The response of major Australian producers to the recent market boom was similar to the response of new local market entrants and to major overseas competitors during the boom. All added similar production tonnage, spent similar capital and grew reserves by similar amounts. It is hard to single out the major Australian producers as having behaved in a sub-optimal fashion given their response was the same as other market participants.
13
References
Barkas, J.P, 2015. Perspectives on the long-term outlook for iron ore. AusIMM Bulletin. https://www.ausimmbulletin.com/feature/perspectives-on-the-long-term-outlook-for-iron-ore/
Chambers, R. H, 2003. Strengthening Ties in the Chinese Iron & Steel Industry. Australia-China Metals & Minerals Conference. Sydney, Australia.
Connolly, E and Orsmond, D, 2011. The Mining Industry: From Bust to Boom. Reserve Bank of Australia, Economic Analysis Department. Research Discussion Paper RDP 2011-08. Fortescue Metals Group, 2015. 2015 Annual Report. http://fmgl.com.au/media/2590/fortescue-annual-report-fy15.pdf Geological Survey of Canada, Economic Geology Report No. 27, 1973.
Hartley, P. R, 2015. What makes the mining industry different? Breakfast by the Bay, The University of Western Australia.
Jones, A, 1986. Prospects for an iron ore cartel. Resources Policy, volume 12, pages 103-115. Elsevier Ltd.
Matthys J, 2003. BHP Billiton Carbon Steel Materials Group - A diversified resource base for China’s Steel Industry. Third China International Steel and Raw Materials Conference. http://www.bhpbilliton.com/~/media/bhp/documents/investors/reports/2003/juliusmatthypresentation.pdf Ou, L, 2012. China’s Influence on the World’s Iron Ore Market – A Supply-Side Perspective. Undergraduate Honors Thesis, Department of Economics, University of California, Berkeley.
Reserve Bank of Australia, 2014. Statement on Monetary Policy – August 2014. http://www.rba.gov.au/publications/smp/2014/aug/box-b.html Rio Tinto, 2003. Annual report and financial statements. SEC Washington DC 20549 Form 20-F. https://www.sec.gov/Archives/edgar/data/863064/000102123104000209/b743424-20f.htm#p37 Warell, L, 2014. The effect of a change in pricing regime on iron ore prices. Resources Policy, volume 41, page 16-22. Elsevier Ltd. World Steel Association, Committee on Economic Studies, 1983, 2004 2014 and 2015. Steel Statistical Yearbook.. http://www.worldsteel.org/statistics/statistics-archive/yearbook-archive.html Zeumer, B & Bekaert F, 2013. Steel and the challenges of volatile raw materials, flat margins, and overcapacities. McKinsey on Metals and Mining. Scarcity and Saturation, Number 08, Spring 2013.
14
Editor, UWA Economics Discussion Papers: Sam Hak Kan Tang University of Western Australia 35 Sterling Hwy Crawley WA 6009 Australia Email: [email protected] The Economics Discussion Papers are available at: 1980 – 2002: http://ecompapers.biz.uwa.edu.au/paper/PDF%20of%20Discussion%20Papers/ Since 2001: http://ideas.repec.org/s/uwa/wpaper1.html Since 2004: http://www.business.uwa.edu.au/school/disciplines/economics
ECONOMICS DISCUSSION PAPERS 2015
DP NUMBER
AUTHORS TITLE
15.01 Robertson, P.E. and Robitaille, M.C. THE GRAVITY OF RESOURCES AND THE TYRANNY OF DISTANCE
15.02 Tyers, R. FINANCIAL INTEGRATION AND CHINA’S GLOBAL IMPACT
15.03 Clements, K.W. and Si, J. MORE ON THE PRICE-RESPONSIVENESS OF FOOD CONSUMPTION
15.04 Tang, S.H.K. PARENTS, MIGRANT DOMESTIC WORKERS, AND CHILDREN’S SPEAKING OF A SECOND LANGUAGE: EVIDENCE FROM HONG KONG
15.05 Tyers, R. CHINA AND GLOBAL MACROECONOMIC INTERDEPENDENCE
15.06 Fan, J., Wu, Y., Guo, X., Zhao, D. and Marinova, D.
REGIONAL DISPARITY OF EMBEDDED CARBON FOOTPRINT AND ITS SOURCES IN CHINA: A CONSUMPTION PERSPECTIVE
15.07 Fan, J., Wang, S., Wu, Y., Li, J. and Zhao, D.
BUFFER EFFECT AND PRICE EFFECT OF A PERSONAL CARBON TRADING SCHEME
15.08 Neill, K. WESTERN AUSTRALIA’S DOMESTIC GAS RESERVATION POLICY THE ELEMENTAL ECONOMICS
15.09 Collins, J., Baer, B. and Weber, E.J. THE EVOLUTIONARY FOUNDATIONS OF ECONOMICS
15.10 Siddique, A., Selvanathan, E. A. and Selvanathan, S.
THE IMPACT OF EXTERNAL DEBT ON ECONOMIC GROWTH: EMPIRICAL EVIDENCE FROM HIGHLY INDEBTED POOR COUNTRIES
15.11 Wu, Y. LOCAL GOVERNMENT DEBT AND ECONOMIC GROWTH IN CHINA
15.12 Tyers, R. and Bain, I. THE GLOBAL ECONOMIC IMPLICATIONS OF FREER SKILLED MIGRATION
15.13 Chen, A. and Groenewold, N. AN INCREASE IN THE RETIREMENT AGE IN CHINA: THE REGIONAL ECONOMIC EFFECTS
15.14 Knight, K. PIGOU, A LOYAL MARSHALLIAN?
15
15.15 Kristoffersen, I. THE AGE-HAPPINESS PUZZLE: THE ROLE OF ECONOMIC CIRCUMSTANCES AND FINANCIAL SATISFACTION
15.16 Azwar, P. and Tyers, R. INDONESIAN MACRO POLICY THROUGH TWO CRISES
15.17 Asano, A. and Tyers, R. THIRD ARROW REFORMS AND JAPAN’S ECONOMIC PERFORMANCE
15.18 Arthmar, R. and McLure, M. ON BRITAIN’S RETURN TO THE GOLD STANDARD: WAS THERE A ‘PIGOU-MCKENNA SCHOOL’?
15.19 Fan, J., Li, Y., Wu, Y., Wang, S., and Zhao, D.
ALLOWANCE TRADING AND ENERGY CONSUMPTION UNDER A PERSONAL CARBON TRADING SCHEME: A DYNAMIC PROGRAMMING APPROACH
15.20 Shehabi, M. AN EXTRAORDINARY RECOVERY: KUWAIT FOLLOWING THE GULF WAR
15.21 Siddique, A., Sen, R., and Srivastava, S.
AUSTRALIA-THAILAND TRADE: AN ANALYSIS OF COMPETITIVENESS AND THE EFFECTS OF THE BILATERAL FTA
15.22 Tyers, R. SLOWER GROWTH AND VULNERABILITY TO RECESSION: UPDATING CHINA’S GLOBAL IMPACT
15.23 Arthmar, R. and McLure, M. PIGOU ON WAR FINANCE AND STATE ACTION
15.24 Wu, Y. CHINA'S CAPITAL STOCK SERIES BY REGION AND SECTOR
15.25 Clements, K. and Si, J. ENGEL'S LAW, DIET DIVERSITY AND THE QUALITY OF FOOD CONSUMPTION
15.26 Chen, S. SHIFTS OF DISTORTION AND CORRUPTION OVER LOCAL POLITICAL CYCLES IN CHINA
15.27 Chen, S. THE EFFECT OF A FISCAL SQUEEZE ON TAX NFORCEMENT: EVIDENCE FROM A NATURAL EXPERIMENT IN CHINA
15.28 Jetter, M. BLOWING THINGS UP: THE EFFECT OF MEDIA ATTENTION ON TERRORISM
15.29 Tang, S. MEDIUM-TERM MACROECONOMIC VOLATILITY AND ECONOMIC DEVELOPMENT: A NEW TECHNIQUE
15.30 Alim, A., Hartley, P. and Lan, Y. ASIAN SPOT PRICES FOR LNG OTHER ENERGY COMMODITIES
15.31 Gannon, B., Harris, D., Harris, M., Magnusson, L., Hollingsworth, B., lnder, B., Maitra, P, and Munford, L.
NEW APPROACHES TO ESTIMATING THE CHILD HEALTH-PARENTAL INCOME RELATIONSHIP
15.32 Czaika, M. and Parsons, C. THE GRAVITY OF HIGH SKILLED MIGRATION POLICIES
15.33 Parsons, C., Rojon, S., Samanani, F, and Wettach, L.
CONCEPTUALISING INTERNATIONAL HIGH-SKILLED MIGRATION
15.34 Chen, S. VAT RATE DISPERSION AND TFP LOSS IN CHINA’S MANUFACTURING SECTOR
15.35 Tait, L., Siddique, A. and Chatterjee, I. FOREIGN AID AND ECONOMIC GROWTH IN SUB-SAHARAN AFRICA
16
ECONOMICS DISCUSSION PAPERS 2016
DP NUMBER
AUTHORS TITLE
16.01 Xu, R., Wu, Y. and Luan, J. ANALYSIS OF FARMERS’ WILLINGNESS TO ADOPT GENETICALLY MODIFIED INSECT-RESISTANT RICE IN CHINA
16.02 Lia, Y., Fan, J., Zhao, D., Wu, Y. and Li, J.
TIERED GASOLINE PRICING: A PERSONAL CARBON TRADING PERSPECTIVE
16.03 Clements, K.W., Lan, Y. and Si, J. UNCERTAINTY IN CURRENCY MISPRICING
16.04 Parsons, C. and Vézina, P.L. MIGRANT NETWORKS AND TRADE:THE VIETNAMESE BOAT PEOPLE AS A NATURAL EXPERIMENT
16.05 Chang, S., Connelly, R. and Ma, P.
WHAT WILL YOU DO IF I SAY ‘I DO’?: THE EFFECT OF THE SEX RATIO ON TIME USE WITHIN TAIWANESE MARRIED COUPLES
16.06 Yu, F. and Wu, Y. BIASES IN PATENT EXAMINATION AND FIRMS’ RESPONSES: EVIDENCE FROM THE PHARMACEUTICAL INDUSTRY
16.07 Fan, J., Li, J., Wu, Y., Wang, S. and Zhao, D.
THE EFFECTS OF ALLOWANCE PRICE ON ENERGY DEMAND UNDER A PERSONAL CARBON TRADING SCHEME
16.08 Golley, J., Tyers, R. and Zhou, Y. CONTRACTIONS IN CHINESE FERTILITY AND SAVINGS: LONG RUN DOMESTIC AND GLOBAL IMPLICATIONS
16.09 McGrath, G. and Neill, K. FOREIGN AND DOMESTIC OWNERSHIP IN WESTERN AUSTRALIA’S GAS MARKET
16.10 Clements, K.W. and Si, J. SIMPLIFYING THE BIG MAC INDEX
16.11 Priyati, R.Y. and Tyers, R. PRICE RELATIONSHIPS IN VEGETABLE OIL AND ENERGY MARKETS
16.12 Wu, J., Wu, Y. and Wang, B. THE GREENNESS OF CHINESE CITIES: CARBON DIOXIDE EMISSION AND ITS DETERMINANTS
16.13 Arslan, C., Dumont, J.C., Kone, Z., Özden, Ç., Parsons, C. and Xenogiani, T.
INTERNATIONAL MIGRATION TO THE OECD IN THE TWENTY-FIRST CENTURY
16.14 Tomioka, K. and Tyers, R. HAS FOREIGN GROWTH CONTRIBUTED TO STAGNATION AND INEQUALITY IN JAPAN?
16.15 Donovan, J. and Hartley, P. RIDING THE IRON ORE CYCLE: ACTIONS OF AUSTRALIA’S MAJOR PRODUCERS