Embed Size (px)
Citation preview
Economies of scale vs societal interest in small autonomous systems
1
James McCalley Harpole Professor of
Electrical & Computer Engineering
Iowa State University Energy Systems Integration 102
National Renewable Energy Laboratory
Golden, Colorado, August 3-7, 2015
San Onofre Nuclear Power Plant,
Southern California A neighborhood in Sacramento, CA, 2014
Overview
2
1. Assignment
2. Vision diversity
3. Flex-fuel polygeneration power plants
4. Design objectives • Flexibility
• Reliability
• Resilience
• Adaptability
• Economics:
• Economies of scale
• Other influences
• What do investors think about technologies?
5. Paths forward
6. Concluding comment

• Form groups of three-four, meet from 10:00-10:45.
• Your group is charged with answering the following questions:
Assignment
3
1. What technologies should provide the
highest percentage of _____________
electrical energy production in 2035?
2. What is the main weakness of each option?
• The continent, country, interconnection, etc., chosen for this
exercise should be the same one chosen for the course project.
• To facilitate your group’s discussion, fill the chart on the next
page, giving each technology, for each attribute, one of the
following grades: • A: the technology performs “very well” in this attribute
• C: the technology performs “fair” in this attribute
• F: the technology performs “very poor” in this attribute
• You may add technologies & attributes as you deem appropriate
• Each group will provide a 10 min report from 10:45-12:00.
Insert name of continent, country, interconnection, region, state, city, or community.

4
Attribute Rftp Solar
utlity wind
Ntrl Gas CC
Ntrl Gas CT
CHP
Technology levelized cost
Fuel production – land use
Fuel production – water use
Fuel production – GHG emissions
Fuel transport – land use
Fuel transport – public resistance
Power plant – land use
Power plant – water use
Power plant – CO2 emissions
Power plant – other, e.g., wildlife effects
Electric transmission – land use
Electric transmission – public resistance
Requires operational flexibility
Provides operational flexibility
Reliability, i.e., service availability
Price resilience to med-term shocks
Cost of adapting to long-term change, e.g., climate, policy, technology
Future risks of heavy deployment
Fu
el
Po
wer
Pla
nt
Ele
ctr
ic
Tra
nsm
Ad
dit
ion
al
Att
rib
ute
s
Additional technologies
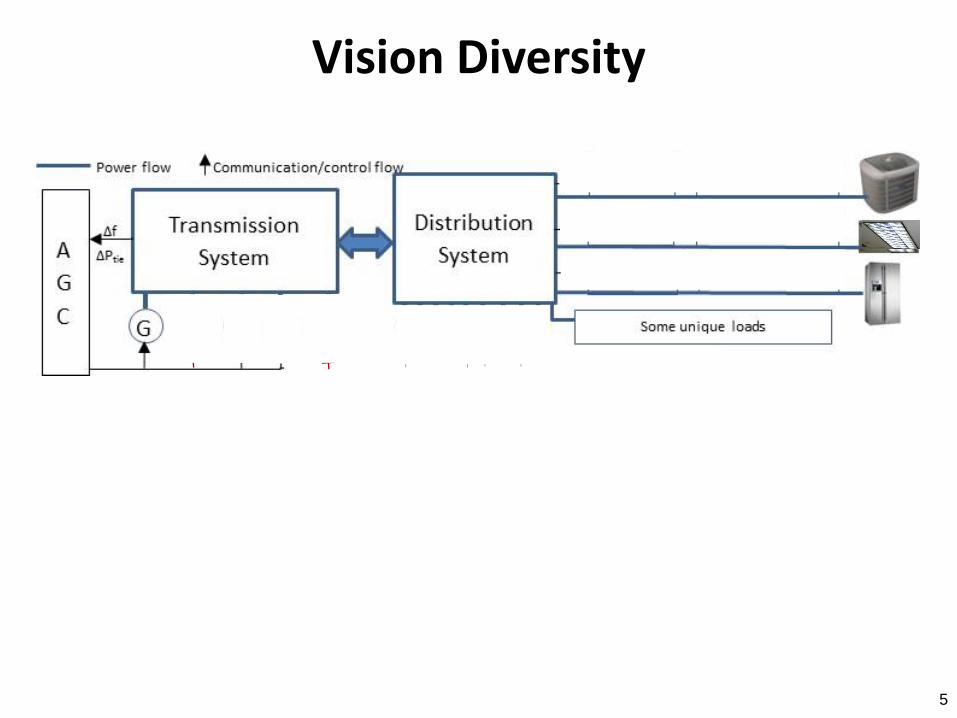
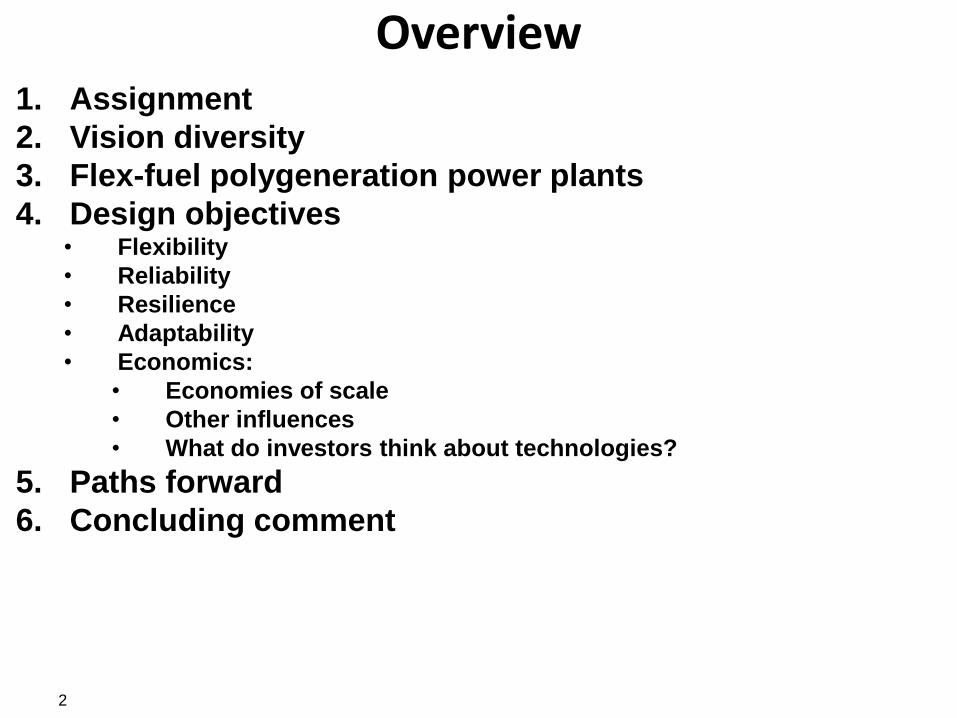
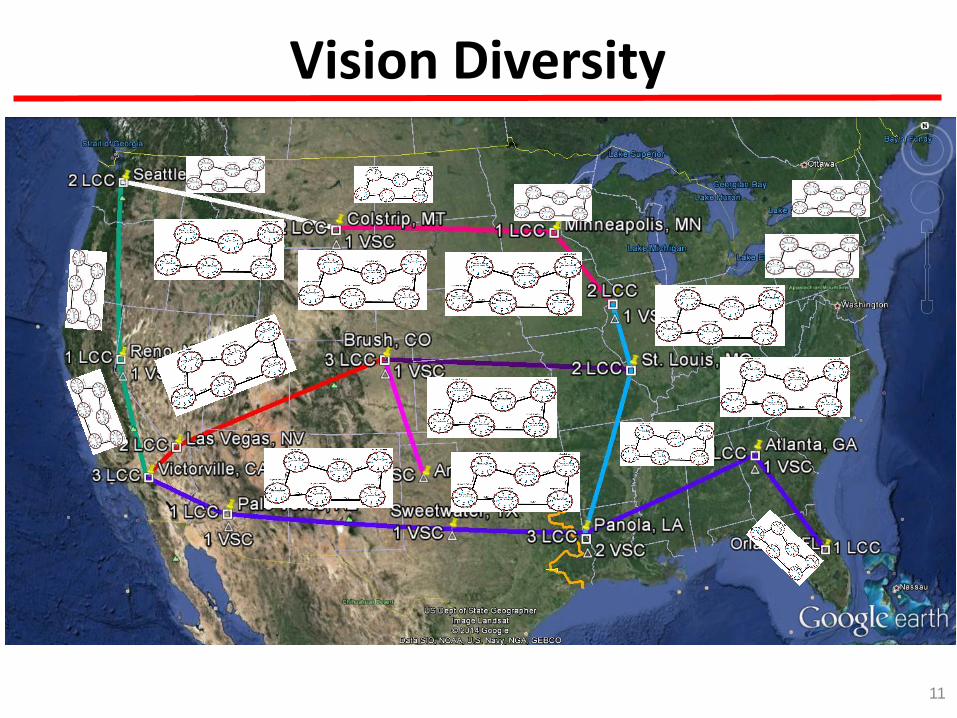
Vision Diversity
5

Vision Diversity
6
“…as DG becomes ubiquitous the
need for a classical power
transmission system disappears;
there is no need for long-distance
bulk-power transfer if power
sources are distributed within
close proximity.”
- S. Bush, “Distributed generation and transmission,”
in “Smart Grid: Communication-Enabled Intelligence
for the Electric Power Grid,” First Edition. 2014 John
Wiley & Sons, Ltd.
M. Reza, “Stability analysis of transmission systems with high
penetration of distributed generation,” Ph.D. dissertation, Delft
University of Technology, Delft, the Netherlands, 2006.
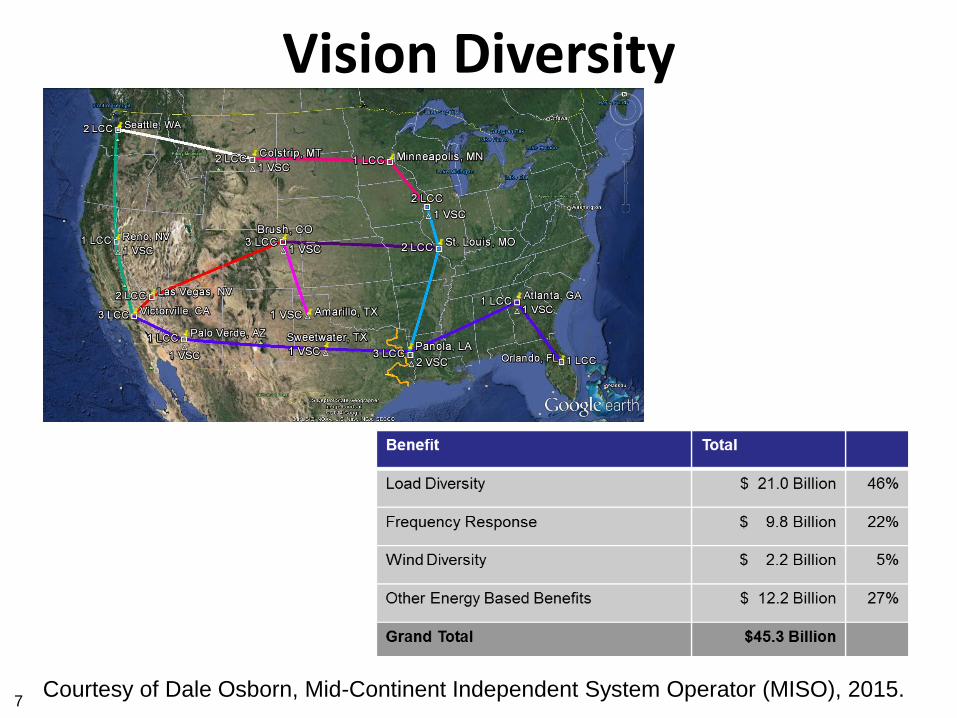
Vision Diversity
7 Courtesy of Dale Osborn, Mid-Continent Independent System Operator (MISO), 2015.
Vision Diversity
8
“Distributed Generation (DG) is generally considered as an
alternative to bulk power transport. The basic idea is that the
presence of electricity generation inside the distribution
systems leads to a reduction of the local electricity needs,
which consequently leads to a reduced need for power
transmission capacity and thus a deferral of investments in
transmission lines. However, due to the different operational
characteristics of the plethora of types of distributed
generation, this hypothesis may prove invalid. Controllable
distributed generation, defined as local generation of which
the power output can be regulated by the system operator
(e.g. stand-alone gas-fired combustion units) will certainly
have a positive impact on this direction.”
G. Papaefthymiou, M. Houwing, M.P.C. Weijnen and L. van der Sluis, “Distributed generation vs. bulk transmission,” First
International Conference on Infrastructure Systems and Services: Building Networks for a Brighter Future, 2008.
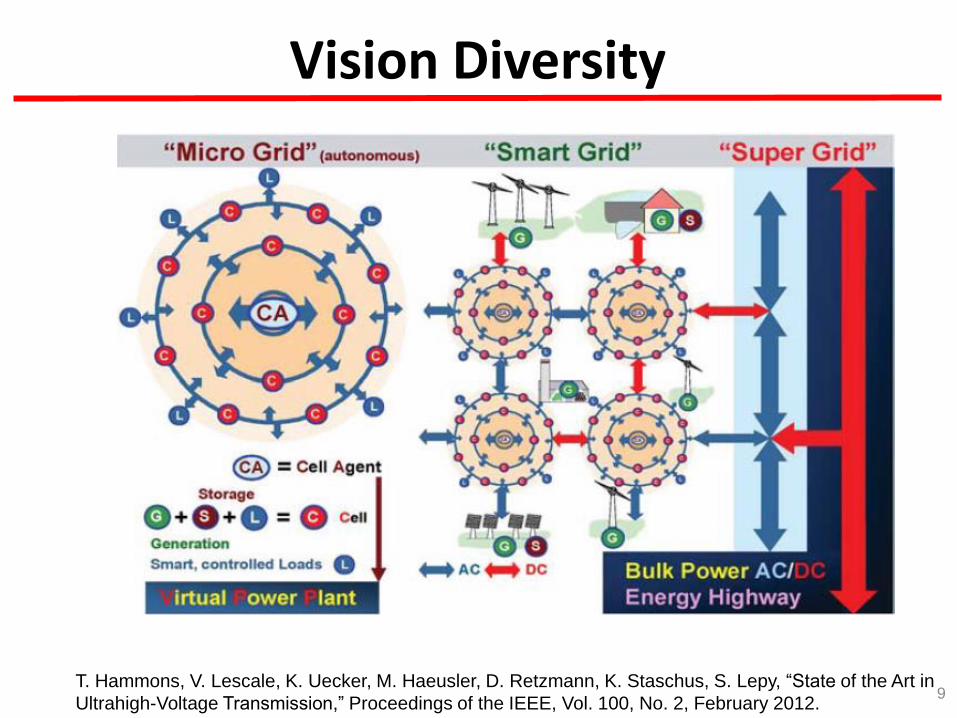
Vision Diversity
9 T. Hammons, V. Lescale, K. Uecker, M. Haeusler, D. Retzmann, K. Staschus, S. Lepy, “State of the Art in
Ultrahigh-Voltage Transmission,” Proceedings of the IEEE, Vol. 100, No. 2, February 2012.
Vision Diversity
10
Vision Diversity
11
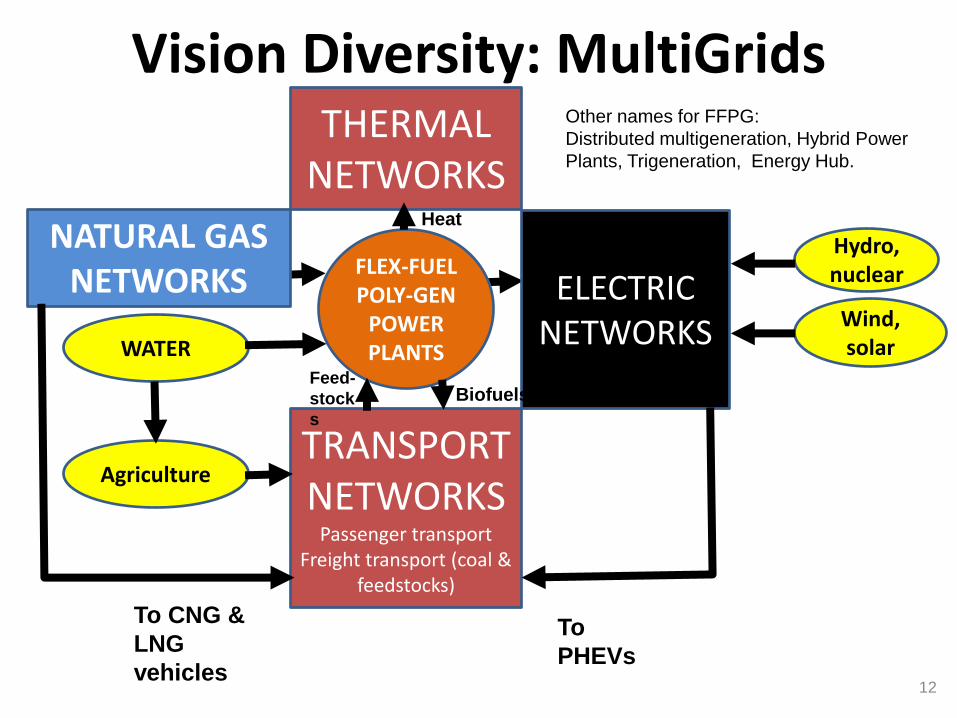
THERMAL NETWORKS
FLEX-FUEL POLY-GEN
POWER PLANTS
ELECTRIC NETWORKS
NATURAL GAS NETWORKS
Wind, solar
TRANSPORT NETWORKS
Passenger transport Freight transport (coal &
feedstocks)
To
PHEVs
To CNG &
LNG
vehicles
Biofuels Feed-
stock
s
Heat
Hydro, nuclear
Vision Diversity: MultiGrids
12
WATER
Agriculture
Other names for FFPG:
Distributed multigeneration, Hybrid Power
Plants, Trigeneration, Energy Hub.
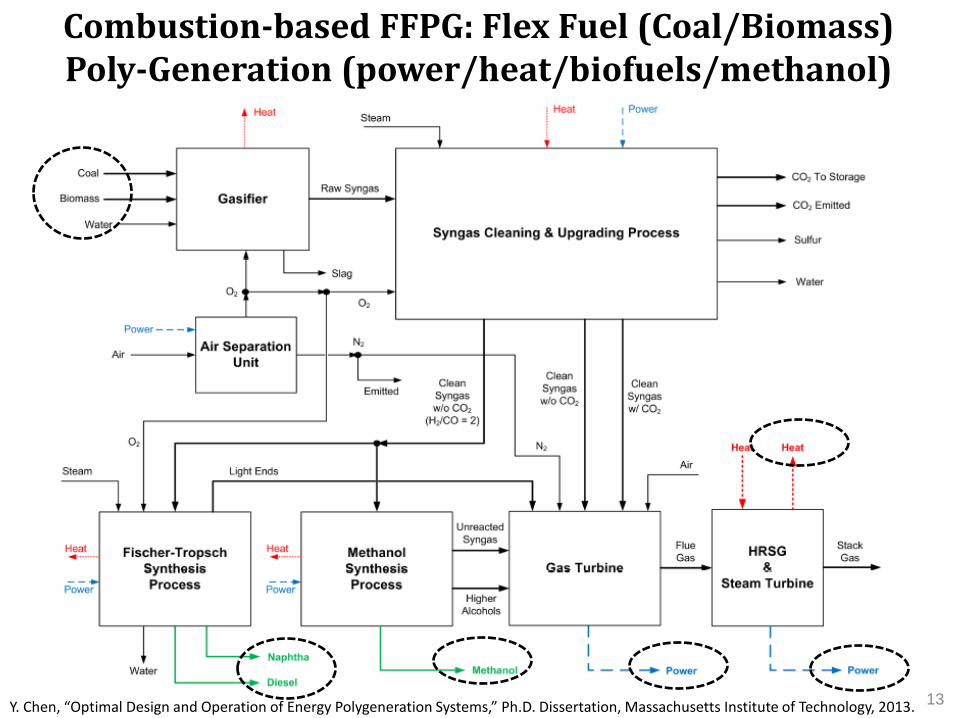
Combustion-based FFPG: Flex Fuel (Coal/Biomass) Poly-Generation (power/heat/biofuels/methanol)
13 Y. Chen, “Optimal Design and Operation of Energy Polygeneration Systems,” Ph.D. Dissertation, Massachusetts Institute of Technology, 2013.
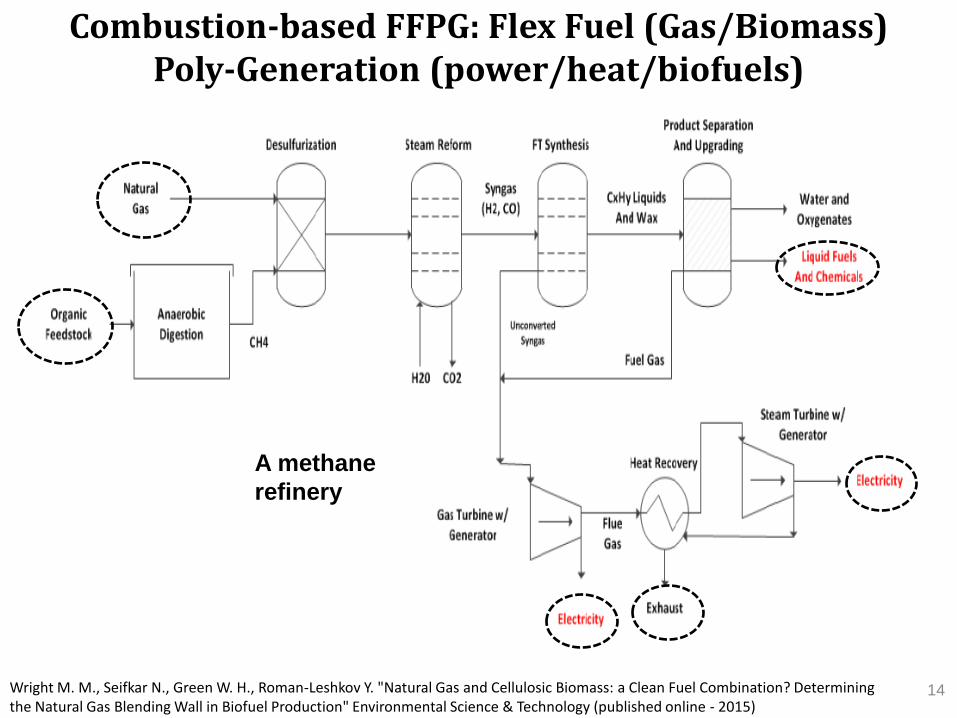
A methane
refinery
14 Wright M. M., Seifkar N., Green W. H., Roman-Leshkov Y. "Natural Gas and Cellulosic Biomass: a Clean Fuel Combination? Determining the Natural Gas Blending Wall in Biofuel Production" Environmental Science & Technology (published online - 2015)
Combustion-based FFPG: Flex Fuel (Gas/Biomass) Poly-Generation (power/heat/biofuels)
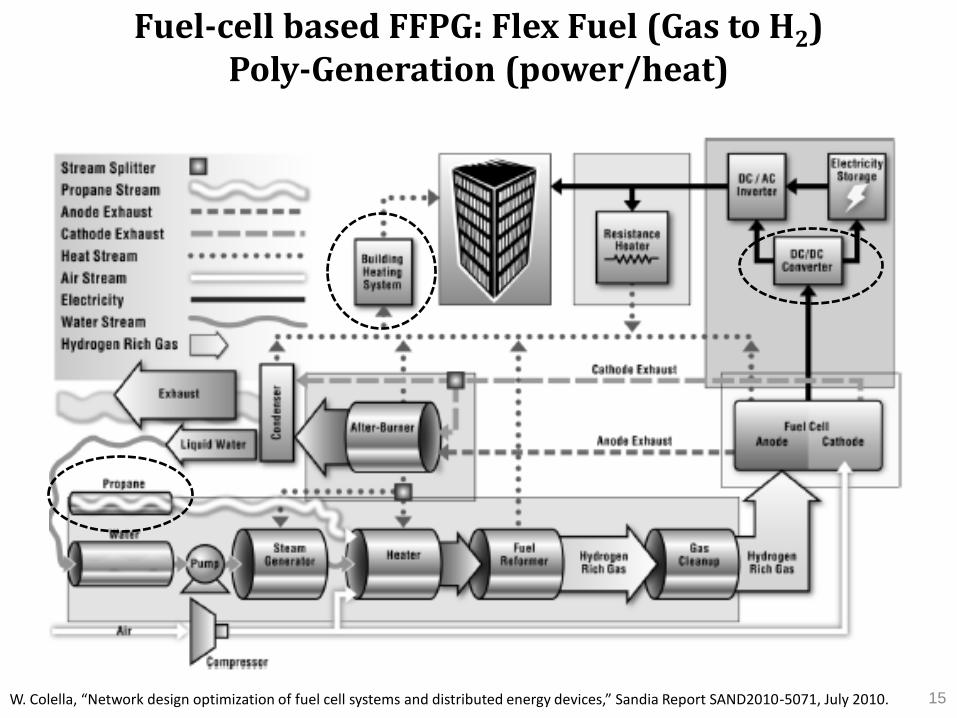
15 W. Colella, “Network design optimization of fuel cell systems and distributed energy devices,” Sandia Report SAND2010-5071, July 2010.
Fuel-cell based FFPG: Flex Fuel (Gas to H2) Poly-Generation (power/heat)
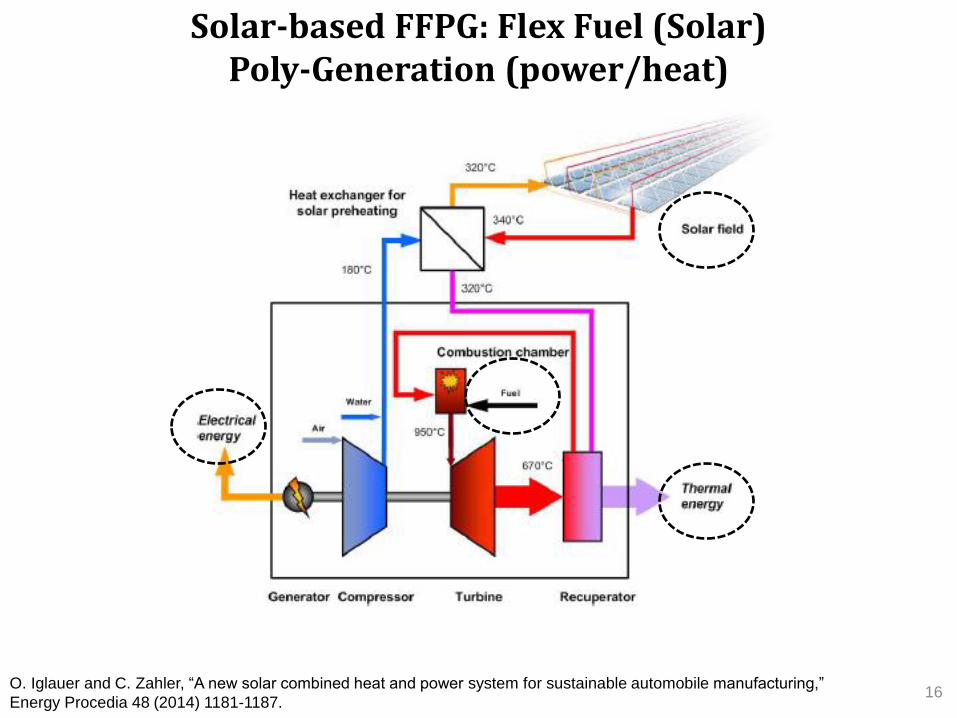
16 O. Iglauer and C. Zahler, “A new solar combined heat and power system for sustainable automobile manufacturing,”
Energy Procedia 48 (2014) 1181-1187.
Solar-based FFPG: Flex Fuel (Solar) Poly-Generation (power/heat)
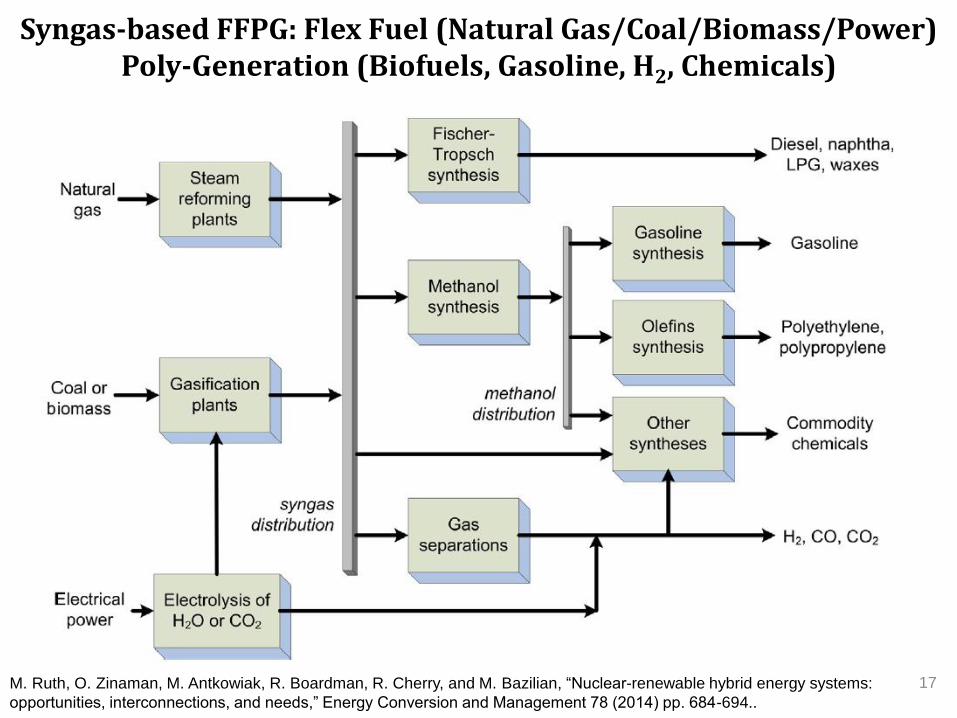
17 M. Ruth, O. Zinaman, M. Antkowiak, R. Boardman, R. Cherry, and M. Bazilian, “Nuclear-renewable hybrid energy systems:
opportunities, interconnections, and needs,” Energy Conversion and Management 78 (2014) pp. 684-694..
Syngas-based FFPG: Flex Fuel (Natural Gas/Coal/Biomass/Power) Poly-Generation (Biofuels, Gasoline, H2, Chemicals)
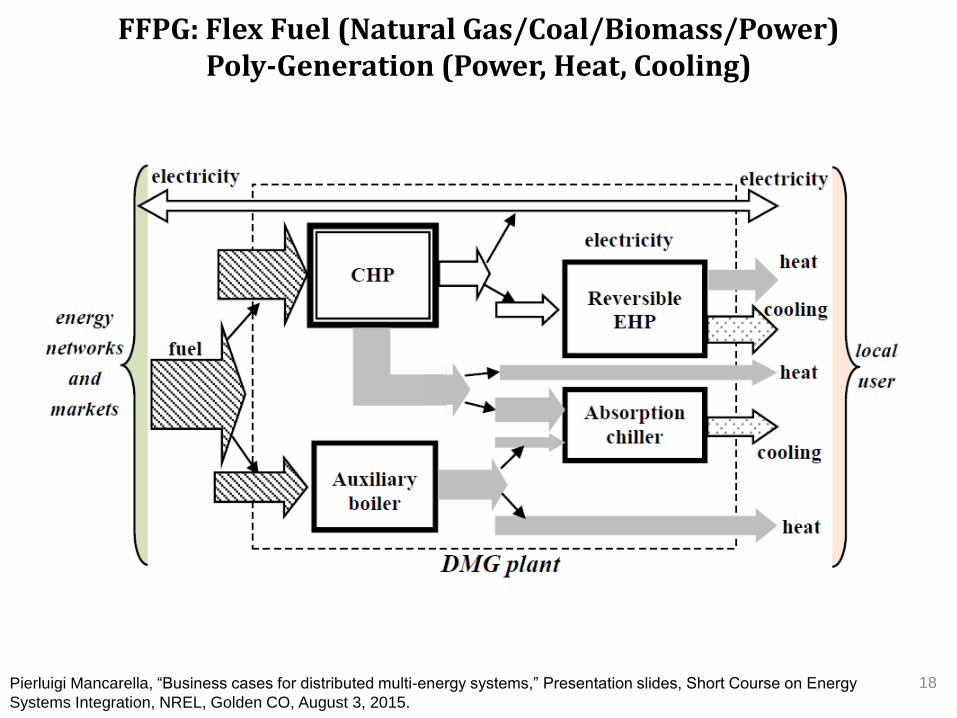
18 Pierluigi Mancarella, “Business cases for distributed multi-energy systems,” Presentation slides, Short Course on Energy
Systems Integration, NREL, Golden CO, August 3, 2015.
FFPG: Flex Fuel (Natural Gas/Coal/Biomass/Power) Poly-Generation (Power, Heat, Cooling)

19 C. Kang, “The coordination of combined heat and power to increase wind energy penetration in China,” presentation slides at the
Panel Session on Energy Systems Integration, IEEE PES General Meeting, Denver, July 28, 2015.
FFPG: Flex Fuel (Natural Gas/Coal/Biomass/Power) Poly-Generation (Power, Heat)

20 M. Ruth, “Industrial scale energy systems integration,” presentation slides at the Panel Session on Energy Systems Integration,
IEEE PES General Meeting, Denver, July 28, 2015.
FFPG: Flex Fuel (Nuclear thermal/Power) Poly-Generation (Power, Chemical)
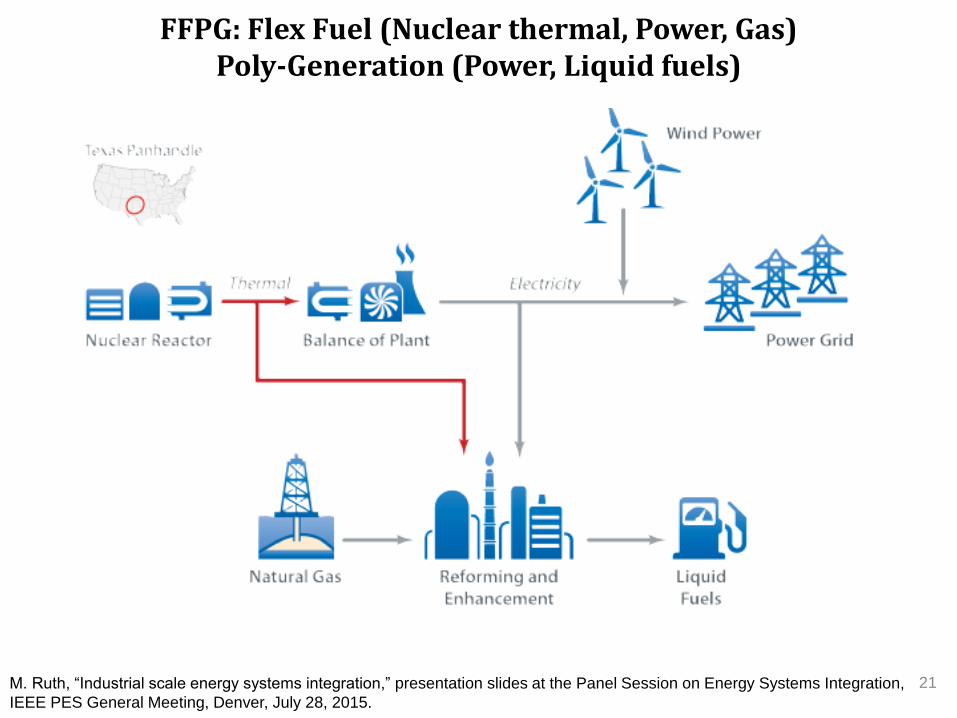
21 M. Ruth, “Industrial scale energy systems integration,” presentation slides at the Panel Session on Energy Systems Integration,
IEEE PES General Meeting, Denver, July 28, 2015.
FFPG: Flex Fuel (Nuclear thermal, Power, Gas) Poly-Generation (Power, Liquid fuels)
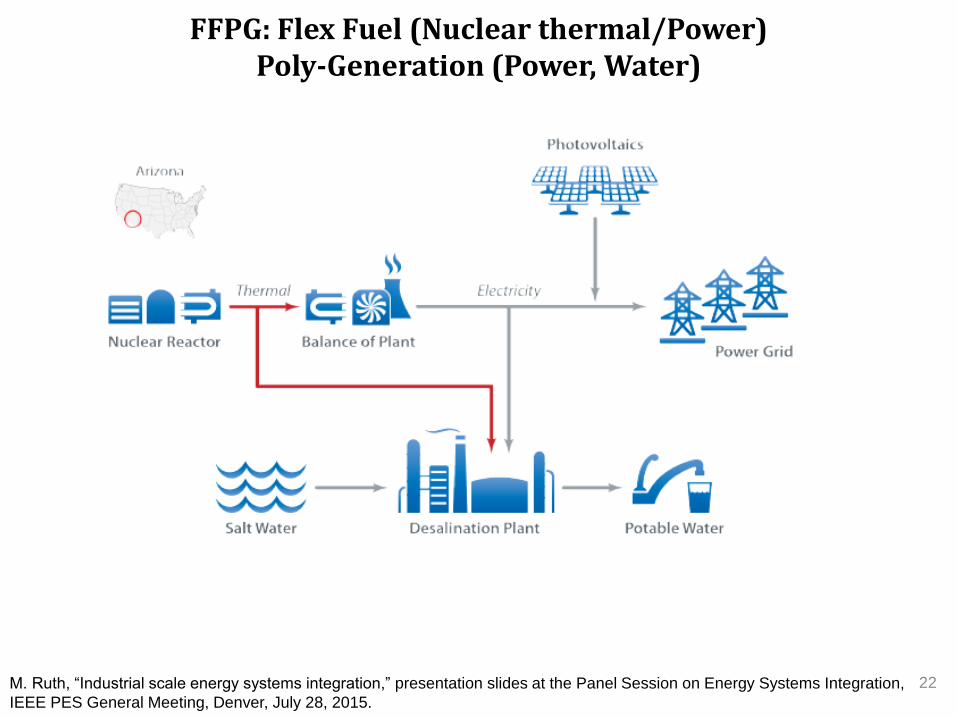
22 M. Ruth, “Industrial scale energy systems integration,” presentation slides at the Panel Session on Energy Systems Integration,
IEEE PES General Meeting, Denver, July 28, 2015.
FFPG: Flex Fuel (Nuclear thermal/Power) Poly-Generation (Power, Water)
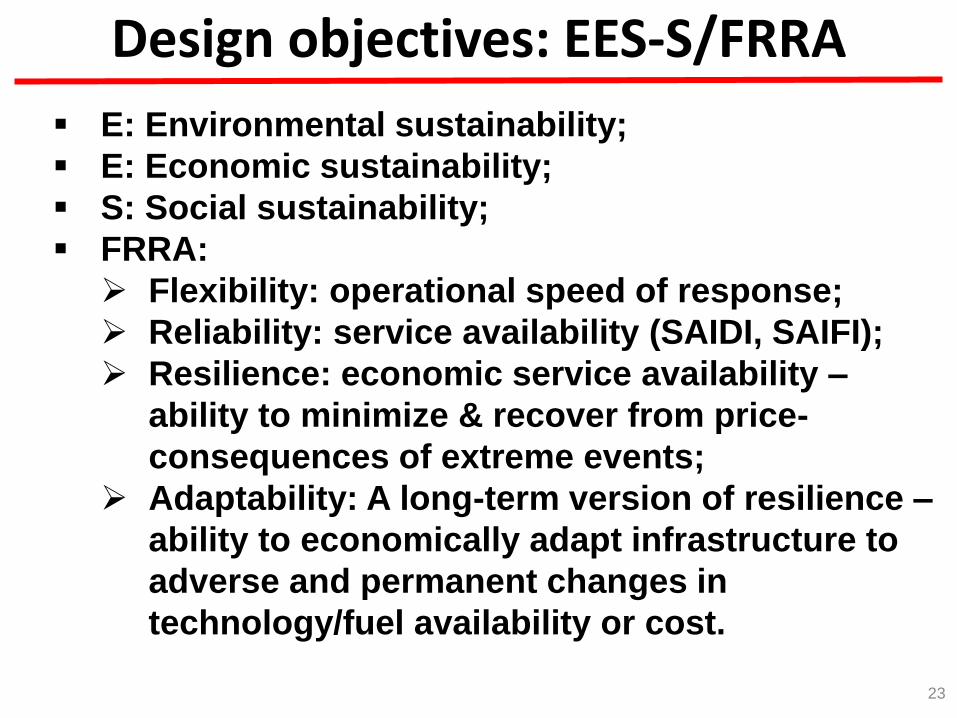
Design objectives: EES-S/FRRA
23
E: Environmental sustainability;
E: Economic sustainability;
S: Social sustainability;
FRRA:
Flexibility: operational speed of response;
Reliability: service availability (SAIDI, SAIFI);
Resilience: economic service availability –
ability to minimize & recover from price-
consequences of extreme events;
Adaptability: A long-term version of resilience –
ability to economically adapt infrastructure to
adverse and permanent changes in
technology/fuel availability or cost.
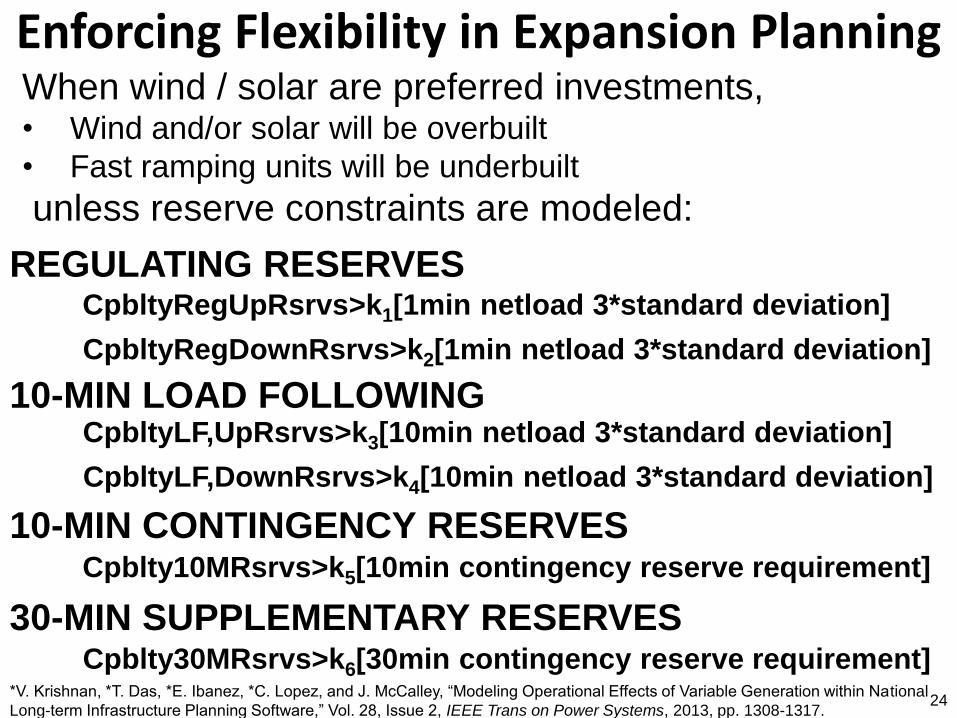
Enforcing Flexibility in Expansion Planning
24
When wind / solar are preferred investments, • Wind and/or solar will be overbuilt
• Fast ramping units will be underbuilt
unless reserve constraints are modeled:
CpbltyRegUpRsrvs>k1[1min netload 3*standard deviation]
CpbltyRegDownRsrvs>k2[1min netload 3*standard deviation]
REGULATING RESERVES
10-MIN CONTINGENCY RESERVES Cpblty10MRsrvs>k5[10min contingency reserve requirement]
30-MIN SUPPLEMENTARY RESERVES Cpblty30MRsrvs>k6[30min contingency reserve requirement]
10-MIN LOAD FOLLOWING CpbltyLF,UpRsrvs>k3[10min netload 3*standard deviation]
CpbltyLF,DownRsrvs>k4[10min netload 3*standard deviation]
*V. Krishnan, *T. Das, *E. Ibanez, *C. Lopez, and J. McCalley, “Modeling Operational Effects of Variable Generation within National
Long-term Infrastructure Planning Software,” Vol. 28, Issue 2, IEEE Trans on Power Systems, 2013, pp. 1308-1317.
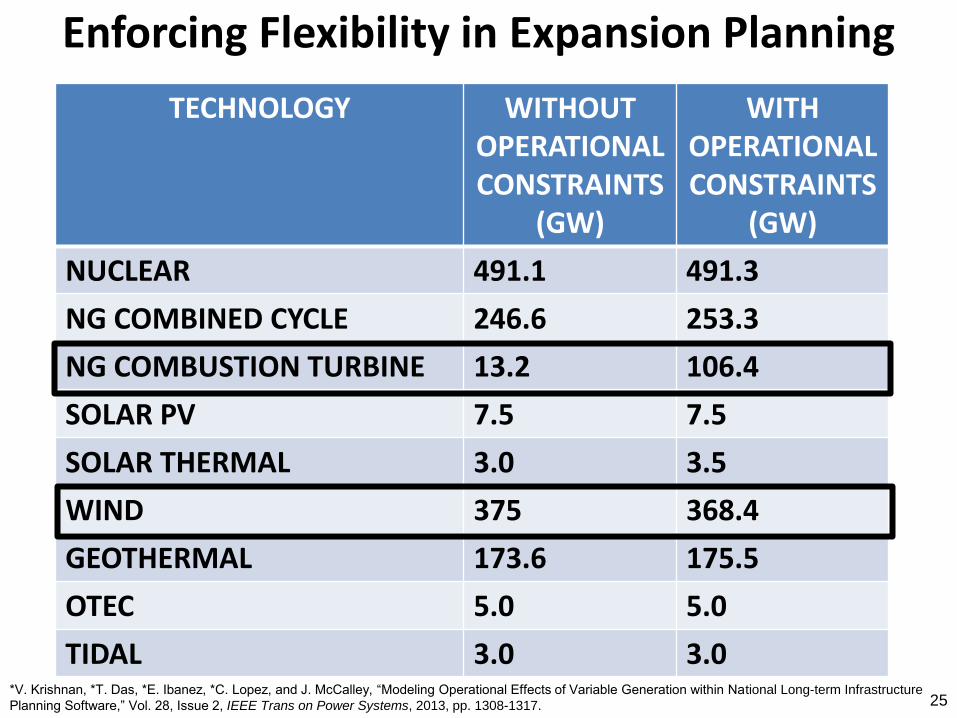
Enforcing Flexibility in Expansion Planning
25 *V. Krishnan, *T. Das, *E. Ibanez, *C. Lopez, and J. McCalley, “Modeling Operational Effects of Variable Generation within National Long-term Infrastructure
Planning Software,” Vol. 28, Issue 2, IEEE Trans on Power Systems, 2013, pp. 1308-1317.
TECHNOLOGY WITHOUT OPERATIONAL CONSTRAINTS
(GW)
WITH OPERATIONAL CONSTRAINTS
(GW)
NUCLEAR 491.1 491.3
NG COMBINED CYCLE 246.6 253.3
NG COMBUSTION TURBINE 13.2 106.4
SOLAR PV 7.5 7.5
SOLAR THERMAL 3.0 3.5
WIND 375 368.4
GEOTHERMAL 173.6 175.5
OTEC 5.0 5.0
TIDAL 3.0 3.0
Reliability is about avoiding interruptions.
Reliability
26
Reliability of a power system refers to the probability of its satisfactory operation
over the long run. It denotes the ability to supply adequate electric service on a
nearly continuous basis, with few interruptions over an extended time period.
- IEEE Paper on Terms & Definitions, 2004
“90% of customer outage minutes due to distribution
system, in small local events” 1.
Transmission is not a significant cause of interruptions.
1. Alison Silverstein, Transmission 101, National Association of Regulatory Utility Commissioners, April 20, 2011, p. 30,
www.naruc.org/grants/Documents/Silverstein%20NCEP%20T-101%200420111.pdf
It is commonly thought that DG helps reliability, but…
• Does DG become a common-mode failure? • The problem with Sandy was loss of D, not loss of G or T.
• What if NE had 20% rooftop solar during Sandy?
• What does DG do to maintenance requirements?
One centrally maintained 1000 MW plant or
a thousand individually maintained 1 MW plants?
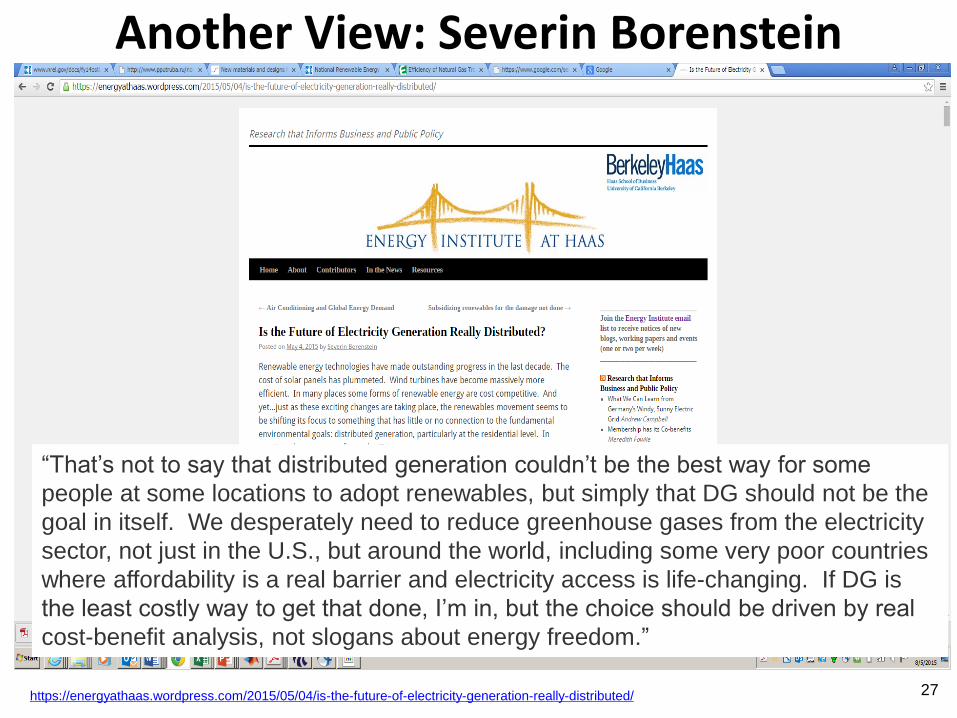
Another View: Severin Borenstein
27 https://energyathaas.wordpress.com/2015/05/04/is-the-future-of-electricity-generation-really-distributed/
“That’s not to say that distributed generation couldn’t be the best way for some
people at some locations to adopt renewables, but simply that DG should not be the
goal in itself. We desperately need to reduce greenhouse gases from the electricity
sector, not just in the U.S., but around the world, including some very poor countries
where affordability is a real barrier and electricity access is life-changing. If DG is
the least costly way to get that done, I’m in, but the choice should be driven by real
cost-benefit analysis, not slogans about energy freedom.”
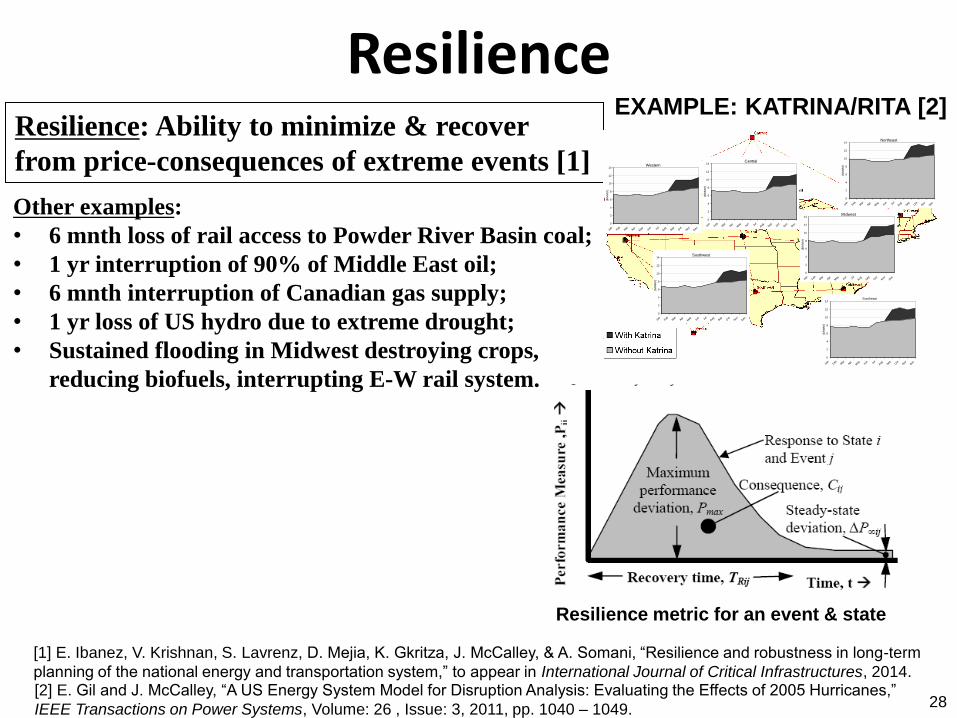
Resilience
28
Resilience: Ability to minimize & recover
from price-consequences of extreme events [1] Western
0
2
4
6
8
10
12
14
Jan
Feb Mar
AprM
ay Jun
Jul
Aug Sep Oct
Nov
Dec
($/M
Mcf)
Southeast
0
2
4
6
8
10
12
14
Jan
Feb Mar
AprM
ay Jun
Jul
Aug Sep Oct
Nov
Dec
($/M
Mcf)
Southwest
0
2
4
6
8
10
12
14
Jan
Feb Mar
AprM
ay Jun
Jul
Aug Sep Oct
Nov
Dec
($/M
Mcf)
Northeast
0
2
4
6
8
10
12
14
Jan
Feb Mar
AprM
ay Jun
Jul
Aug Sep Oct
Nov
Dec
($/M
Mcf)
Central
0
2
4
6
8
10
12
14
Jan
Feb Mar
AprM
ay Jun
Jul
Aug Sep Oct
Nov
Dec
($/M
Mcf)
Midwest
0
2
4
6
8
10
12
14
Jan
Feb Mar
AprM
ay Jun
Jul
Aug Sep Oct
Nov
Dec
($/M
Mcf)
EXAMPLE: KATRINA/RITA [2]
Other examples:
• 6 mnth loss of rail access to Powder River Basin coal;
• 1 yr interruption of 90% of Middle East oil;
• 6 mnth interruption of Canadian gas supply;
• 1 yr loss of US hydro due to extreme drought;
• Sustained flooding in Midwest destroying crops,
reducing biofuels, interrupting E-W rail system.
[2] E. Gil and J. McCalley, “A US Energy System Model for Disruption Analysis: Evaluating the Effects of 2005 Hurricanes,”
IEEE Transactions on Power Systems, Volume: 26 , Issue: 3, 2011, pp. 1040 – 1049.
[1] E. Ibanez, V. Krishnan, S. Lavrenz, D. Mejia, K. Gkritza, J. McCalley, & A. Somani, “Resilience and robustness in long-term
planning of the national energy and transportation system,” to appear in International Journal of Critical Infrastructures, 2014.
Resilience metric for an event & state
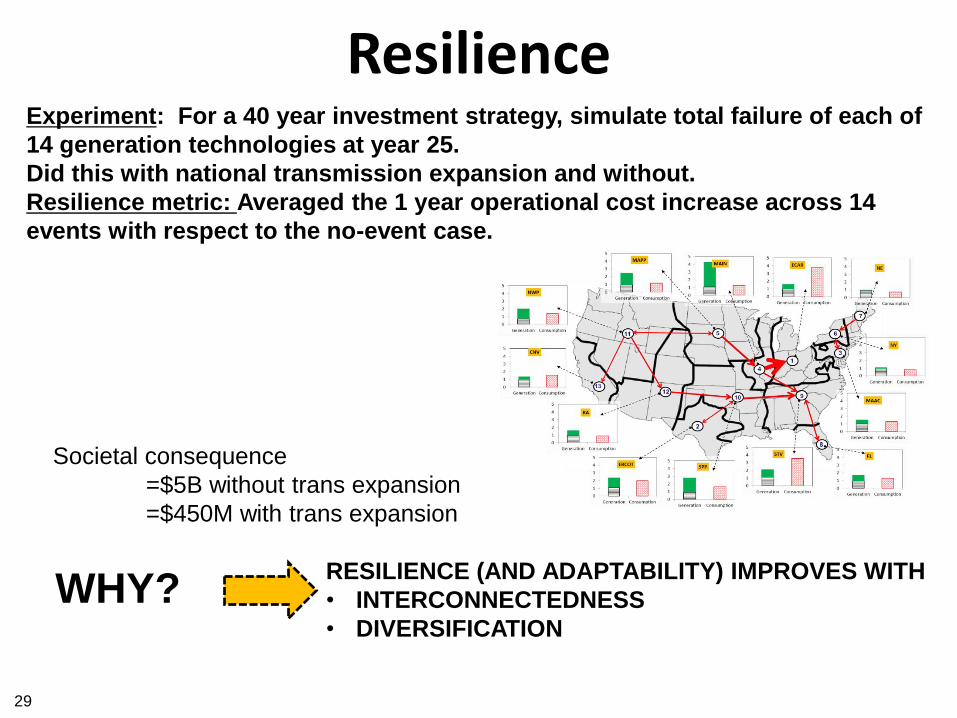
Resilience
29
RESILIENCE (AND ADAPTABILITY) IMPROVES WITH
• INTERCONNECTEDNESS
• DIVERSIFICATION
Experiment: For a 40 year investment strategy, simulate total failure of each of
14 generation technologies at year 25.
Did this with national transmission expansion and without.
Resilience metric: Averaged the 1 year operational cost increase across 14
events with respect to the no-event case.
Societal consequence
=$5B without trans expansion
=$450M with trans expansion
WHY?
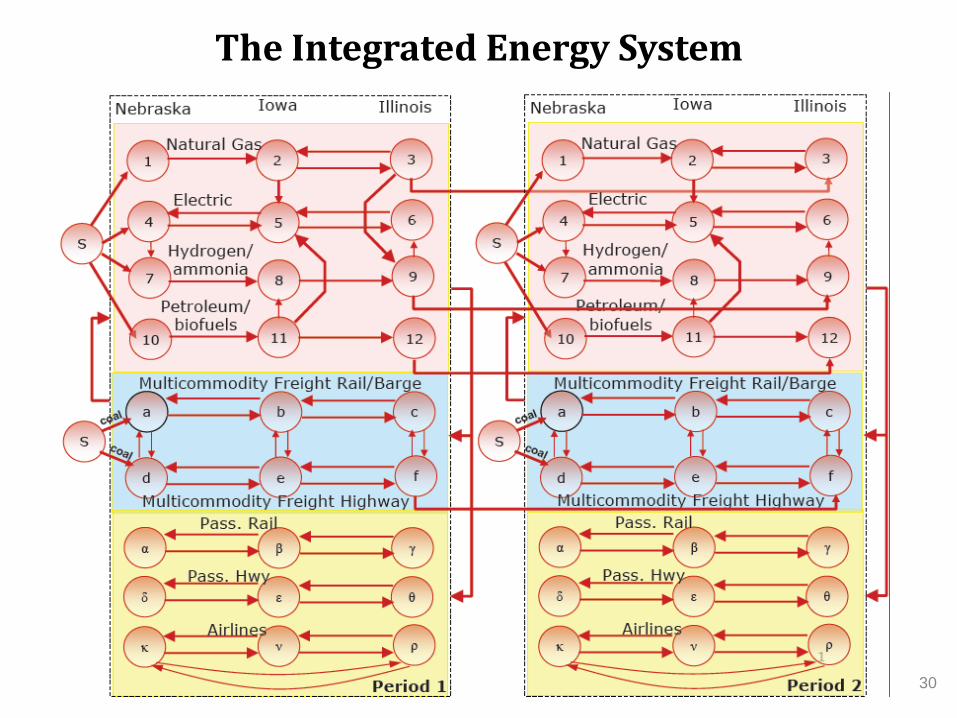
The Integrated Energy System
30
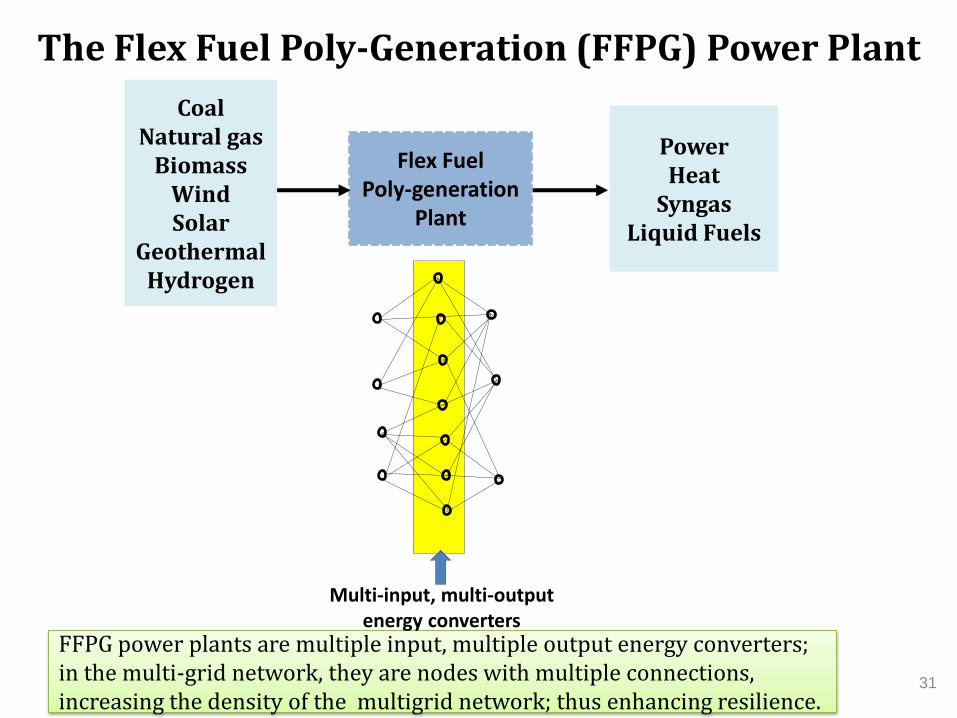
The Flex Fuel Poly-Generation (FFPG) Power Plant
Flex Fuel Poly-generation
Plant
Coal Natural gas
Biomass Wind Solar
Geothermal Hydrogen
Power Heat
Syngas Liquid Fuels
FFPG power plants are multiple input, multiple output energy converters; in the multi-grid network, they are nodes with multiple connections, increasing the density of the multigrid network; thus enhancing resilience.
Multi-input, multi-output energy converters
31
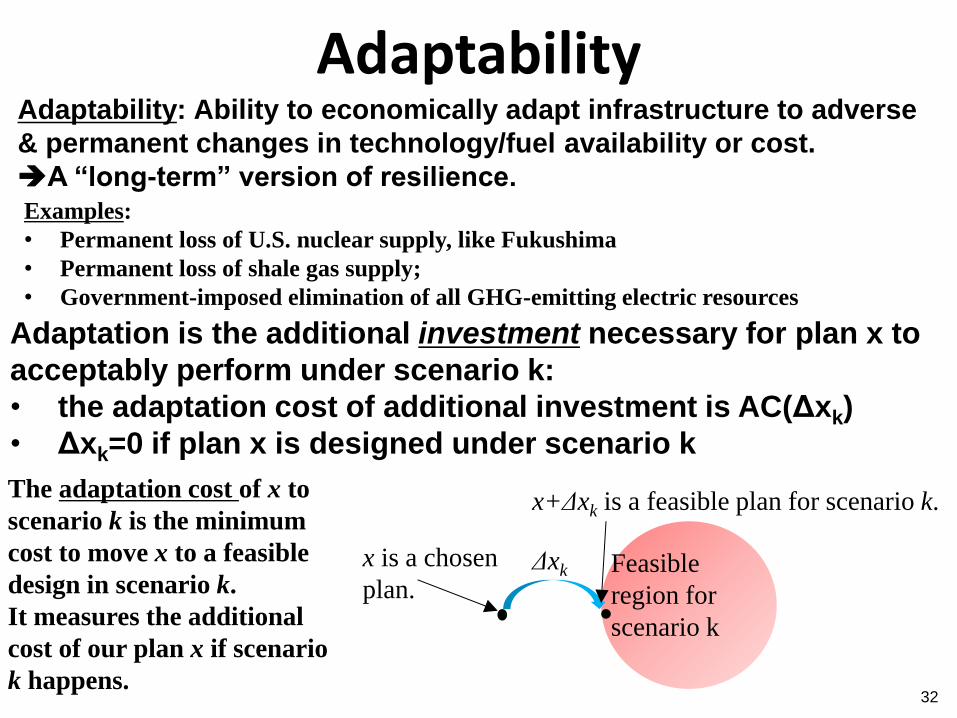
Adaptability
32
Adaptability: Ability to economically adapt infrastructure to adverse
& permanent changes in technology/fuel availability or cost.
A “long-term” version of resilience. Examples:
• Permanent loss of U.S. nuclear supply, like Fukushima
• Permanent loss of shale gas supply;
• Government-imposed elimination of all GHG-emitting electric resources
Adaptation is the additional investment necessary for plan x to
acceptably perform under scenario k:
• the adaptation cost of additional investment is AC(Δxk)
• Δxk=0 if plan x is designed under scenario k
Feasible
region for
scenario k
x is a chosen
plan.
x+Δxk is a feasible plan for scenario k. The adaptation cost of x to
scenario k is the minimum
cost to move x to a feasible
design in scenario k.
It measures the additional
cost of our plan x if scenario
k happens.
Δxk
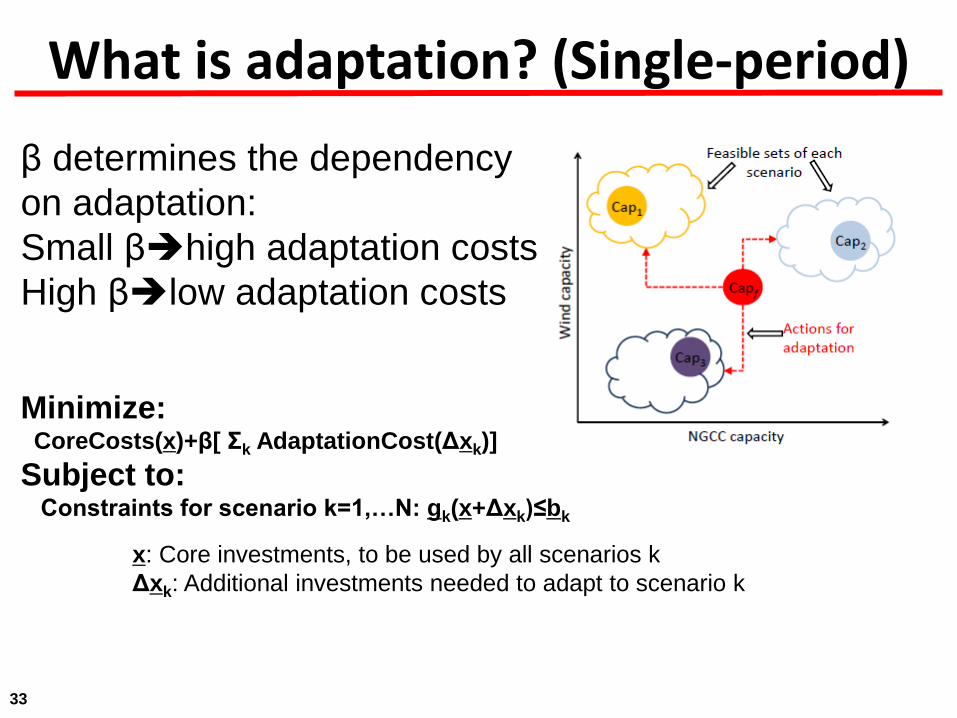
What is adaptation? (Single-period)
33
Minimize: CoreCosts(x)+β[ Σk AdaptationCost(Δxk)]
Subject to: Constraints for scenario k=1,…N: gk(x+Δxk)≤bk
x: Core investments, to be used by all scenarios k
Δxk: Additional investments needed to adapt to scenario k
β determines the dependency
on adaptation:
Small βhigh adaptation costs
High βlow adaptation costs
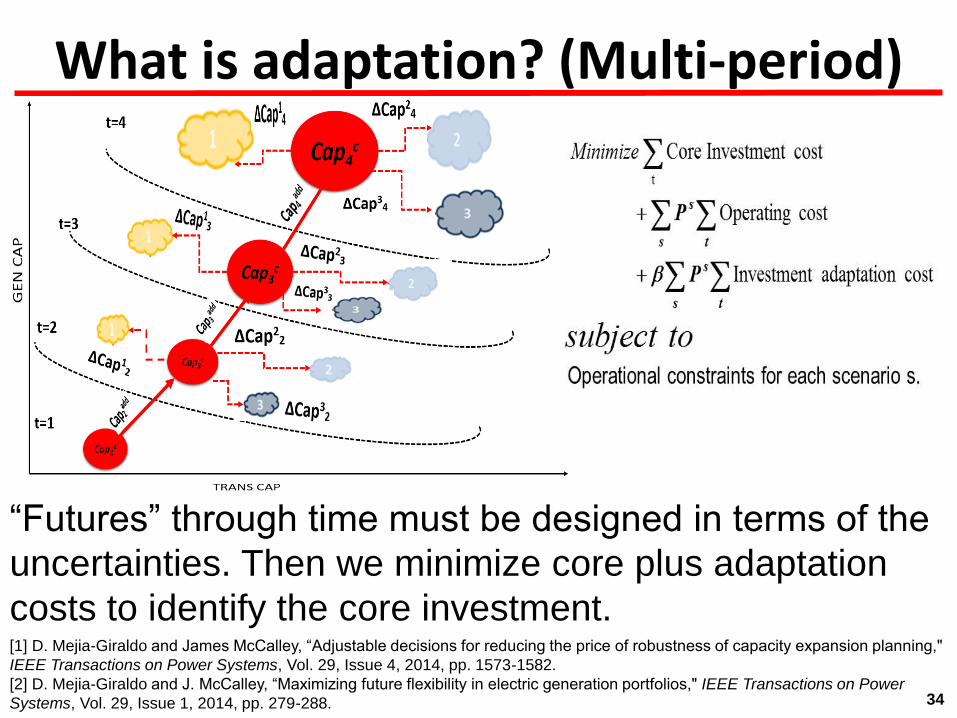
What is adaptation? (Multi-period)
34
“Futures” through time must be designed in terms of the
uncertainties. Then we minimize core plus adaptation
costs to identify the core investment. [1] D. Mejia-Giraldo and James McCalley, “Adjustable decisions for reducing the price of robustness of capacity expansion planning,"
IEEE Transactions on Power Systems, Vol. 29, Issue 4, 2014, pp. 1573-1582.
[2] D. Mejia-Giraldo and J. McCalley, “Maximizing future flexibility in electric generation portfolios," IEEE Transactions on Power
Systems, Vol. 29, Issue 1, 2014, pp. 279-288.
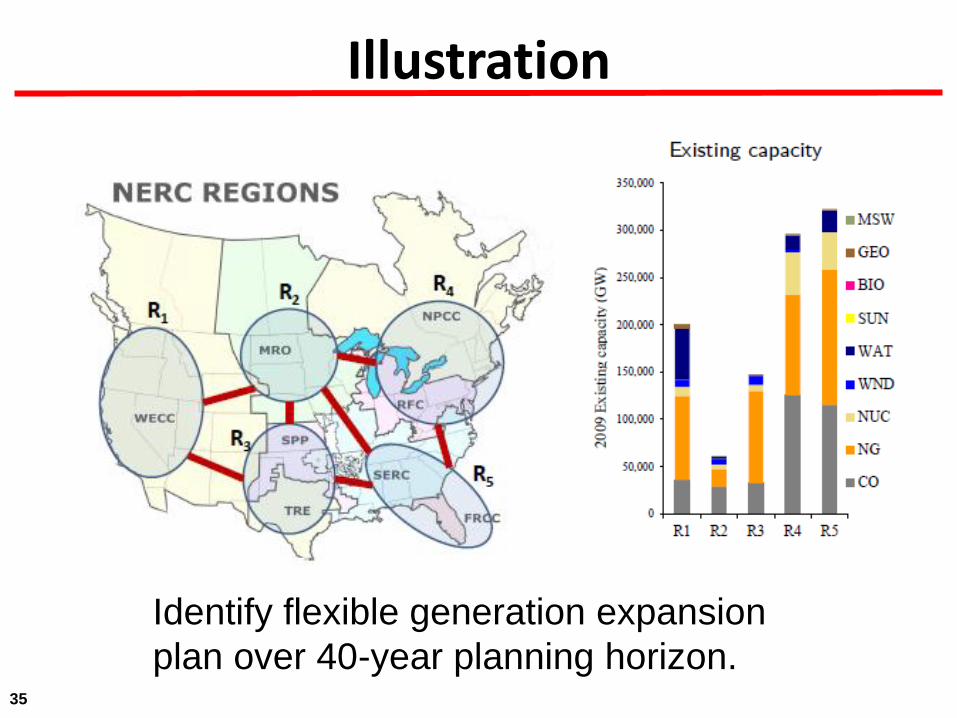
Illustration
35
Identify flexible generation expansion
plan over 40-year planning horizon.
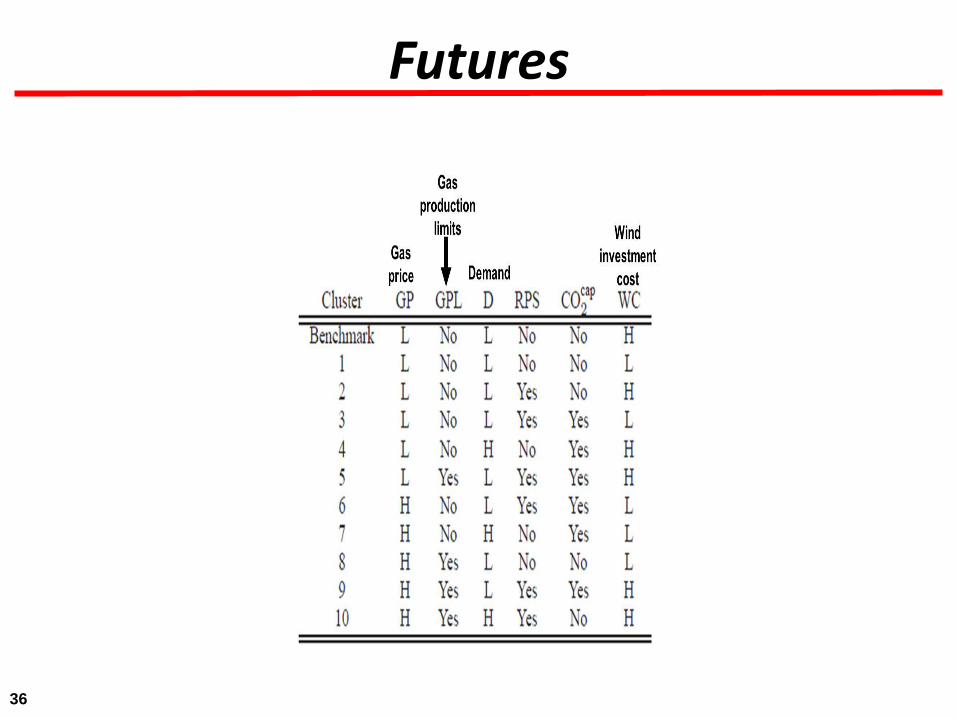
Futures
36
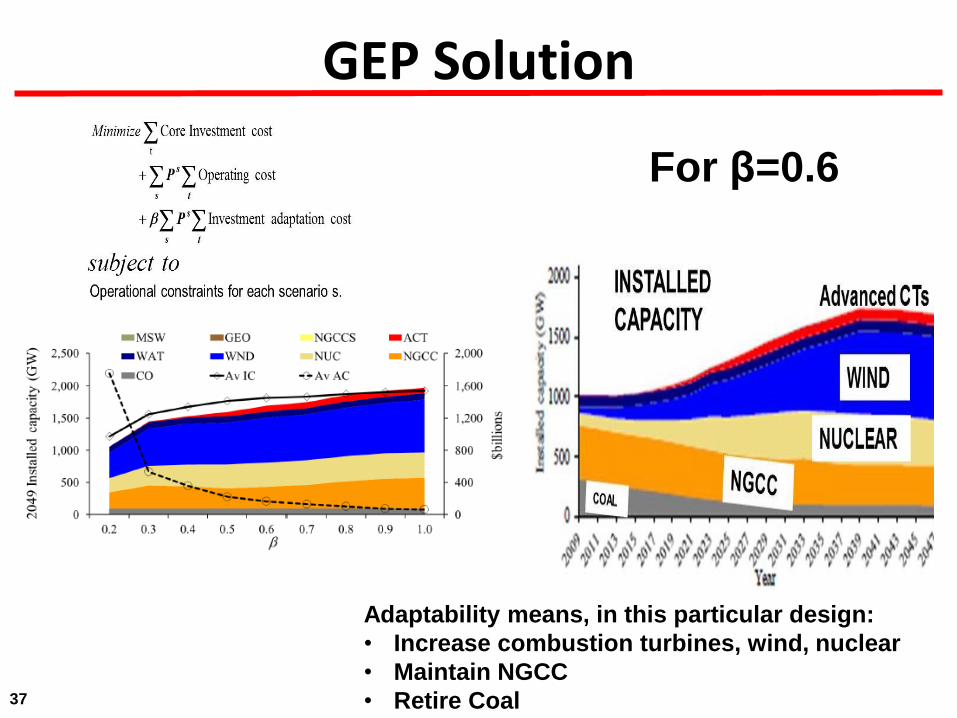
GEP Solution
37
Adaptability means, in this particular design:
• Increase combustion turbines, wind, nuclear
• Maintain NGCC
• Retire Coal
For β=0.6
Adaptability
38
• Highly robust: Performs well under all of the
different scenarios (but not very economic );
• Highly economic: Very good for a single “most
likely” future (but not very robust );
• Adaptable: Something in between, economic,
while using adaptability to achieve robustness .
Electric system expansion plans can be:
Economies of Scale
39
1903 Samuel Insull understanding economies of scale (generators when scaled up
produce power at a lower average $/kWhr) installs 5 MW generator in Chicago
and manages load to increase his load factor (avg load/max load) to increase
profits.
1907 Insull realizes that profitability from managing economies of scale and load
factor grows with corporate size, and so forms Commonwealth Edison, Chicago,
by buying all of his competitors.
Economies of scale are economic efficiencies that result from carrying out a process
(such as power generation) on an increasingly larger scale. They arise when an
increase in output reduces average costs. For power plants, they can occur from
• Decreasing average fixed O&M cost with size (labor cost per MW for maintenance
is lower for a 100 MW wind plant than for a 10 MW wind plant).
• Decreasing average investment cost with size (installation cost per MW is lower
for a 100 MW wind plant than for a 10 MW wind plant).
• Decreasing average fuel cost with size (see next slide)
Economies of Scale
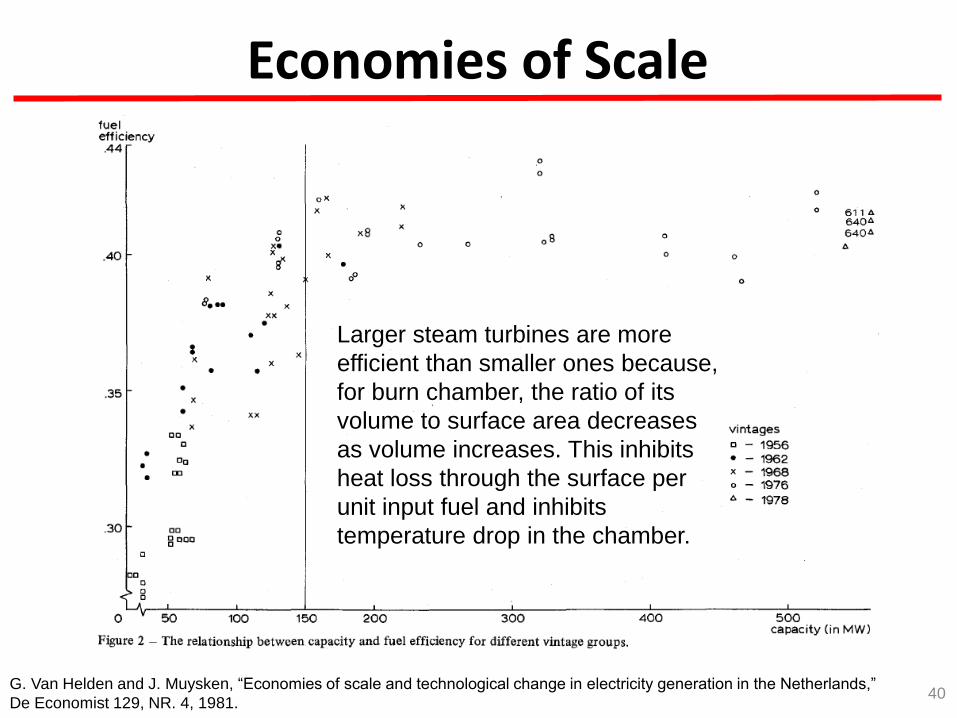
40 G. Van Helden and J. Muysken, “Economies of scale and technological change in electricity generation in the Netherlands,”
De Economist 129, NR. 4, 1981.
Larger steam turbines are more
efficient than smaller ones because,
for burn chamber, the ratio of its
volume to surface area decreases
as volume increases. This inhibits
heat loss through the surface per
unit input fuel and inhibits
temperature drop in the chamber.
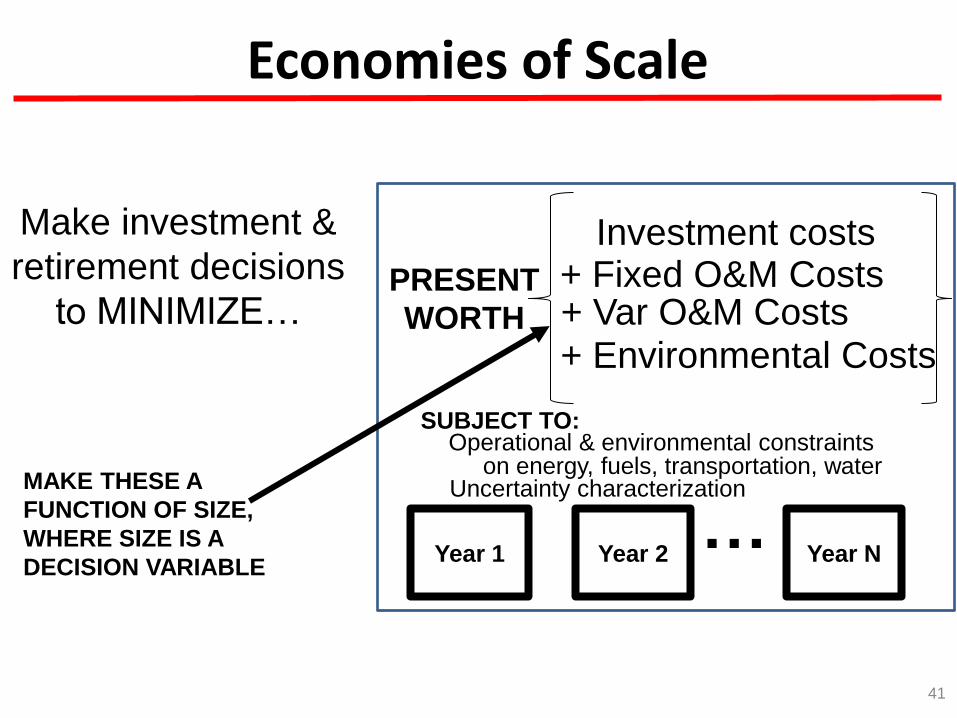
Economies of Scale
41
Make investment &
retirement decisions
to MINIMIZE… PRESENT
WORTH
+ Fixed O&M Costs + Var O&M Costs
Year 1 Year 2 Year N …
SUBJECT TO: Operational & environmental constraints
on energy, fuels, transportation, water
Investment costs
+ Environmental Costs
Uncertainty characterization MAKE THESE A
FUNCTION OF SIZE,
WHERE SIZE IS A
DECISION VARIABLE
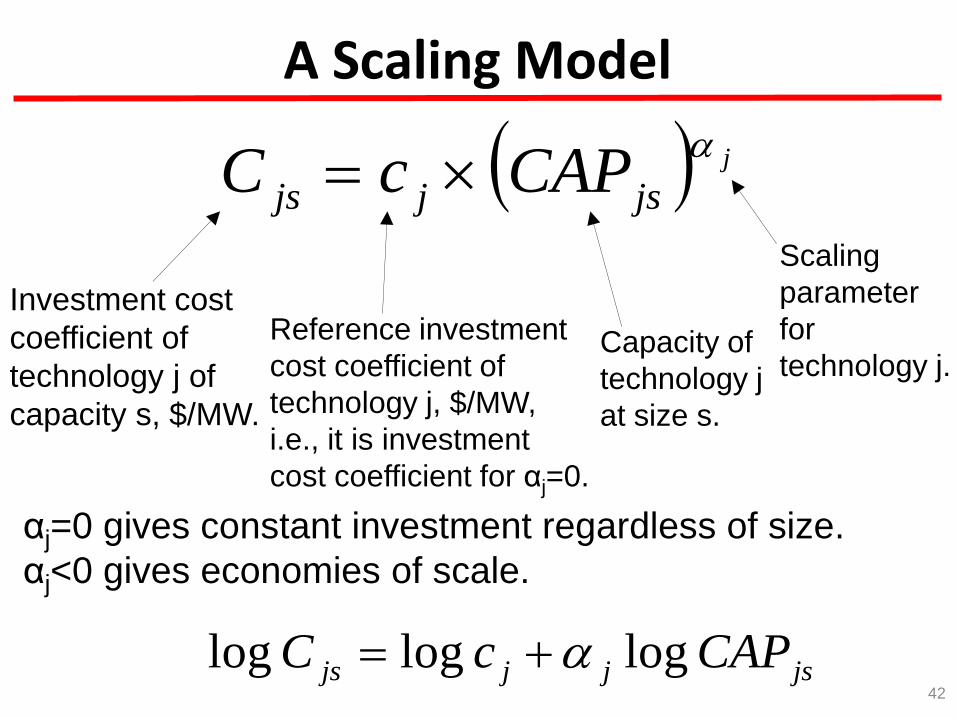
A Scaling Model
42
j
jsjjs CAPcC
Investment cost
coefficient of
technology j of
capacity s, $/MW.
Reference investment
cost coefficient of
technology j, $/MW,
i.e., it is investment
cost coefficient for αj=0.
Capacity of
technology j
at size s.
Scaling
parameter
for
technology j.
αj=0 gives constant investment regardless of size.
αj<0 gives economies of scale.
jsjjjs CAPcC logloglog
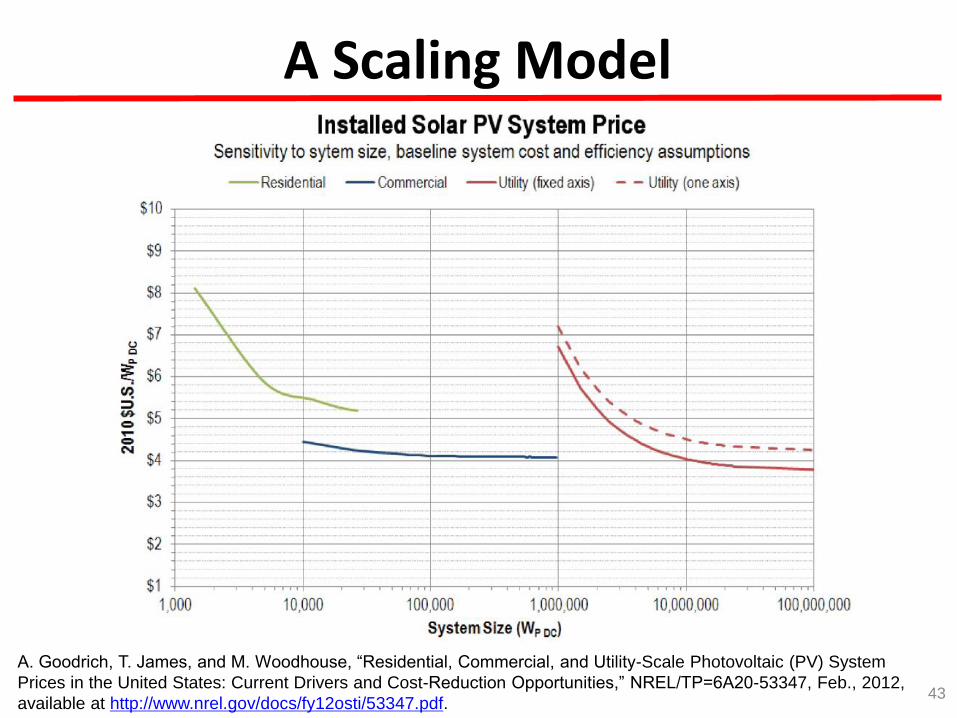
A Scaling Model
43
A. Goodrich, T. James, and M. Woodhouse, “Residential, Commercial, and Utility-Scale Photovoltaic (PV) System
Prices in the United States: Current Drivers and Cost-Reduction Opportunities,” NREL/TP=6A20-53347, Feb., 2012,
available at http://www.nrel.gov/docs/fy12osti/53347.pdf.
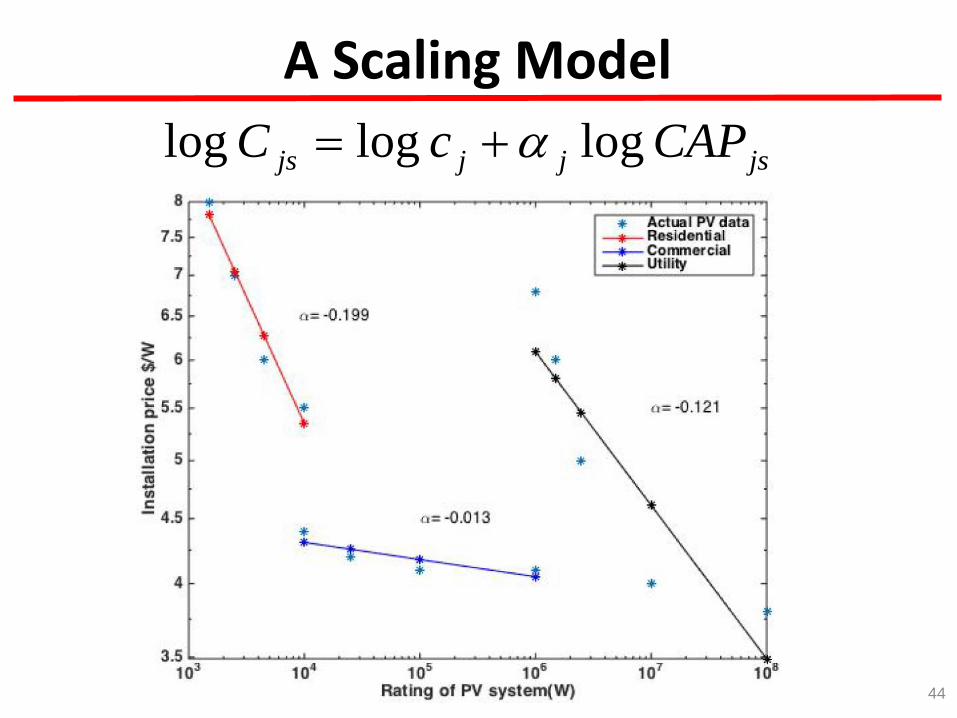
A Scaling Model
44
jsjjjs CAPcC logloglog
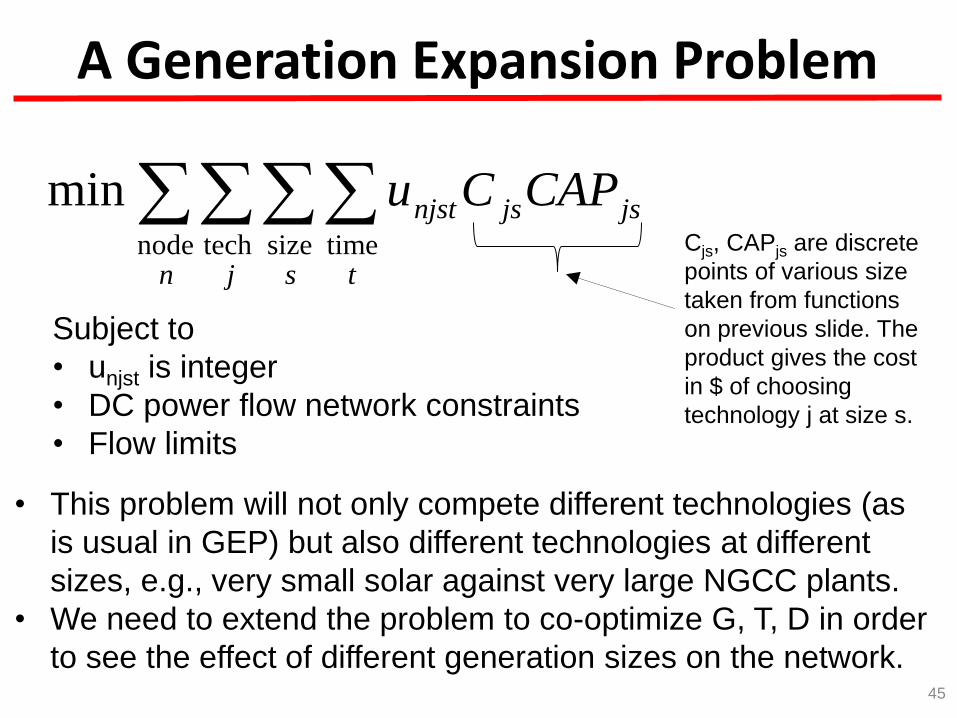
A Generation Expansion Problem
45
n j s t
jsjsnjst CAPCunode tech size time
min
Subject to
• unjst is integer
• DC power flow network constraints
• Flow limits
Cjs, CAPjs are discrete
points of various size
taken from functions
on previous slide. The
product gives the cost
in $ of choosing
technology j at size s.
• This problem will not only compete different technologies (as
is usual in GEP) but also different technologies at different
sizes, e.g., very small solar against very large NGCC plants.
• We need to extend the problem to co-optimize G, T, D in order
to see the effect of different generation sizes on the network.
Other influences
46
1. Economies of number: DG may increase innovation because of the need for
producers and operators to specialize, the necessity to find solutions tailored to
local contexts and the opportunity of mutual learning, and cost reductions gained
via the ability to enhance manufacturing processes based on high volume
production (economies of number).
2. Influence on technology maturation: The cost of any technology can be driven
down by investing in that technology through (a) research and (b) usage
subsidies, but such cost reductions in some technologies may be more readily
achieved than others.
3. Consumer preferences: Is there preference for being “small”? Is there
preference for autonomy? How to account for this in our designs.
4. Market-based? Can we “do” de-carbonization in the market? Is it a public good?
Can cap and trade work?
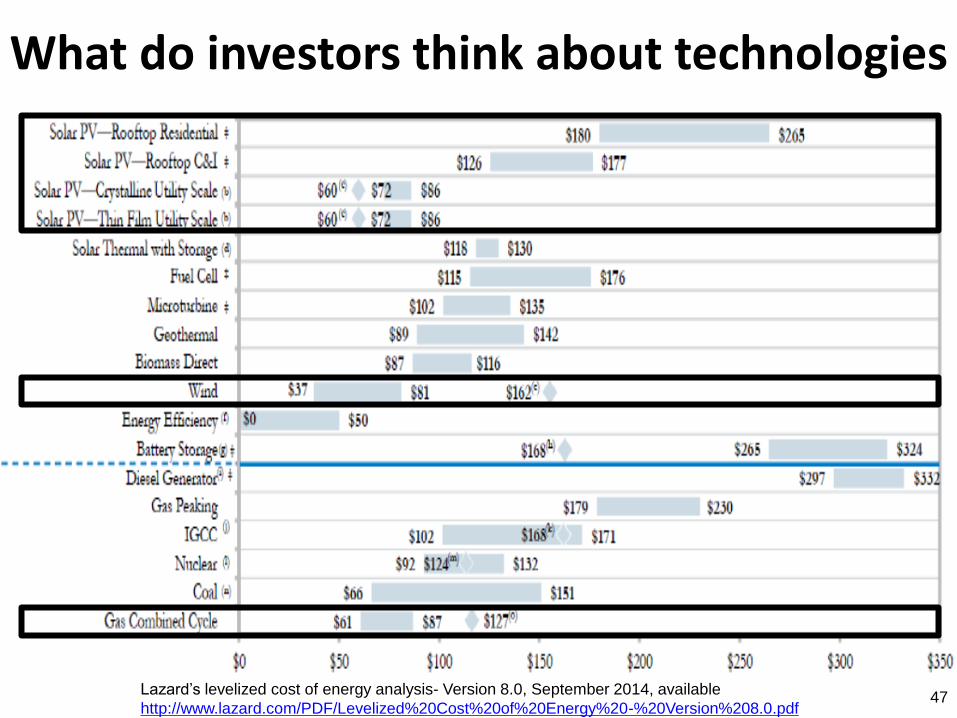
What do investors think about technologies
47 Lazard’s levelized cost of energy analysis- Version 8.0, September 2014, available
http://www.lazard.com/PDF/Levelized%20Cost%20of%20Energy%20-%20Version%208.0.pdf
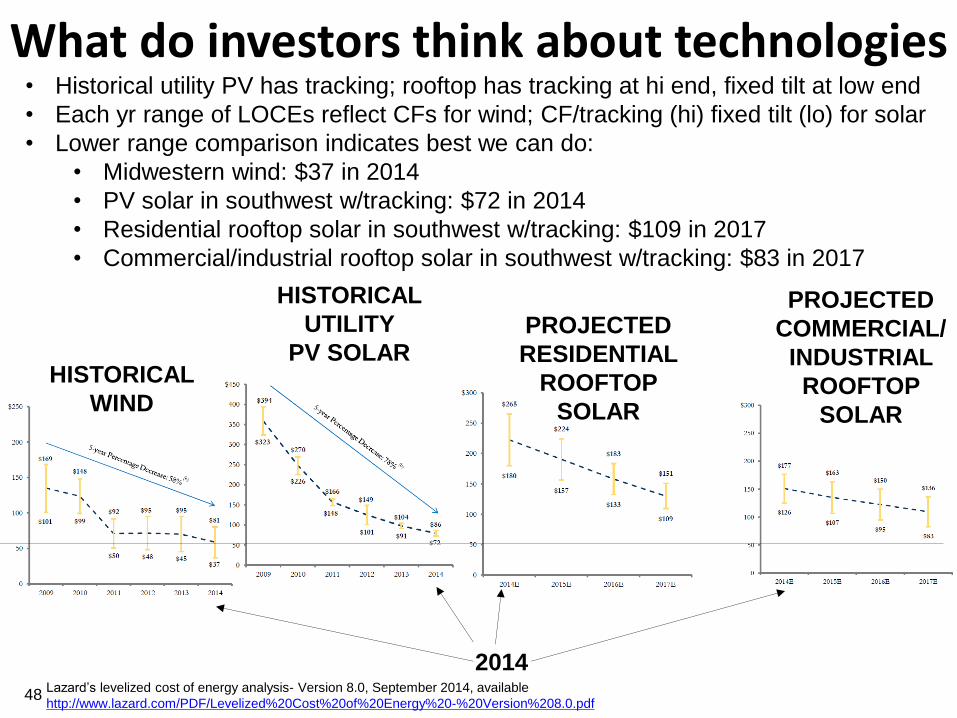
What do investors think about technologies
48
HISTORICAL
WIND
HISTORICAL
UTILITY
PV SOLAR PROJECTED
RESIDENTIAL
ROOFTOP
SOLAR
PROJECTED
COMMERCIAL/
INDUSTRIAL
ROOFTOP
SOLAR
2014
• Historical utility PV has tracking; rooftop has tracking at hi end, fixed tilt at low end
• Each yr range of LOCEs reflect CFs for wind; CF/tracking (hi) fixed tilt (lo) for solar
• Lower range comparison indicates best we can do:
• Midwestern wind: $37 in 2014
• PV solar in southwest w/tracking: $72 in 2014
• Residential rooftop solar in southwest w/tracking: $109 in 2017
• Commercial/industrial rooftop solar in southwest w/tracking: $83 in 2017
Lazard’s levelized cost of energy analysis- Version 8.0, September 2014, available
http://www.lazard.com/PDF/Levelized%20Cost%20of%20Energy%20-%20Version%208.0.pdf
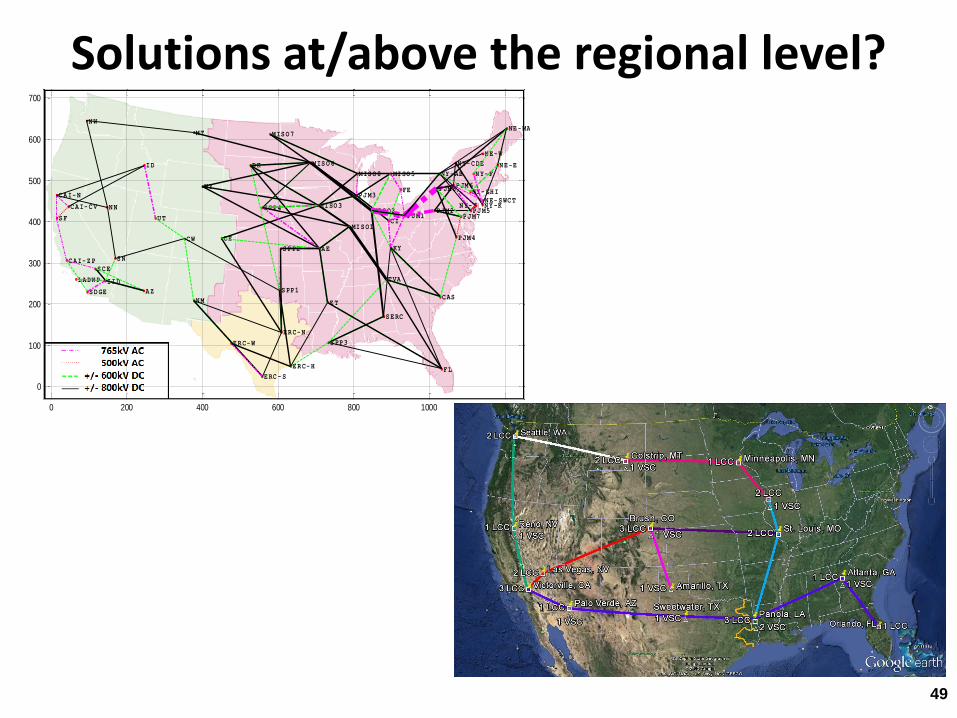
49
Solutions at/above the regional level? NW
CAI-N
SF
CAI-CV
CAI-ZP
LADWP
SDGE
SCE
IID
AZ
SN
NN
ID
UT
MT
WY
CW
NM
CE
DK
SPP4
SPP2
SPP1
ERC-N
ERC-W
ERC-S
ERC-H
SPP3
ET
SERC
FL
MISO7
MISO6
MISO3
MISO8
AE
MISO1
PJM3
MISO2
MISO5
FE
PJM1 CI
KY
TVA
CAS
PJM2
PJM4
PJM7
PJM8
PJM5
PJM6
NY-J NY-K NE-SWCT
NY-GHI
NY-AB
NY-CDE
NY-F
NE-W
NE-E
NE-MA
0 200 400 600 800 1000 1200
0
100
200
300
400
500
600
700

50
Paths forward: frameworks
D. Hybrid
approach
A. Market-driven
investment
C. Multiregional
coordination
B. Federal
initiative
1. Market (merchant)-driven investment:
no rate-base recovery, costs recovered
through “negotiated rates.”
2. Size of the groups to form for overlay
projects may need to be very large and
difficult to develop/manage.
1. Similar to interstate highway system, where Feds
paid 90% via gasoline tax, states 10%. States
managed program for location, design, ROW
acquisition, construction, O&M.
2. Differences: (a) Transmission “pass-through”
feature is not shared with interstate highway
system; (b) Economic development more at
sending end.
1. Establish permanent multiregional
stakeholder group consisting of industry,
state governments, advocacy groups to
address:
2. States need to see benefit for taking
multiregional view.
3. The above is evolving.
51
Paths forward: Frameworks
D. Hybrid approach 1. Design it using multiregional collaborative stakeholder
group of industry, states, advocacy, DOE, supported by
Governors Associations. Impasses addressed by
federally-appointed arbiters. Compensate losers.
2. Incentivize merchant transmission developers to build
consistent with design A “transmission market”?
3. Federalize what merchant developers will not or cannot
build, but with careful Fed-State coordination and
cooperation.

52
Resource Parochialism?
“One problem,” he said, is “resource nationalism,”
in which individual states want to use local
resources, whether they are coal or yet-to-be-built
offshore wind, rather than importing from neighbors
in a way that could be more economical. James Hoecker,
FERC Commissioner 1993-2001,
FERC Chair 1997-2001
in Matthew L. Wald, “Ideas to Bolster Power Grid Run Up Against the System’s Many
Owners,” NY Times, July 12, 2013, www.nytimes.com/2013/07/13/us/ideas-to-bolster-
power-grid-run-up-against-the-systems-many-owners.html?emc=eta1&_r=1&
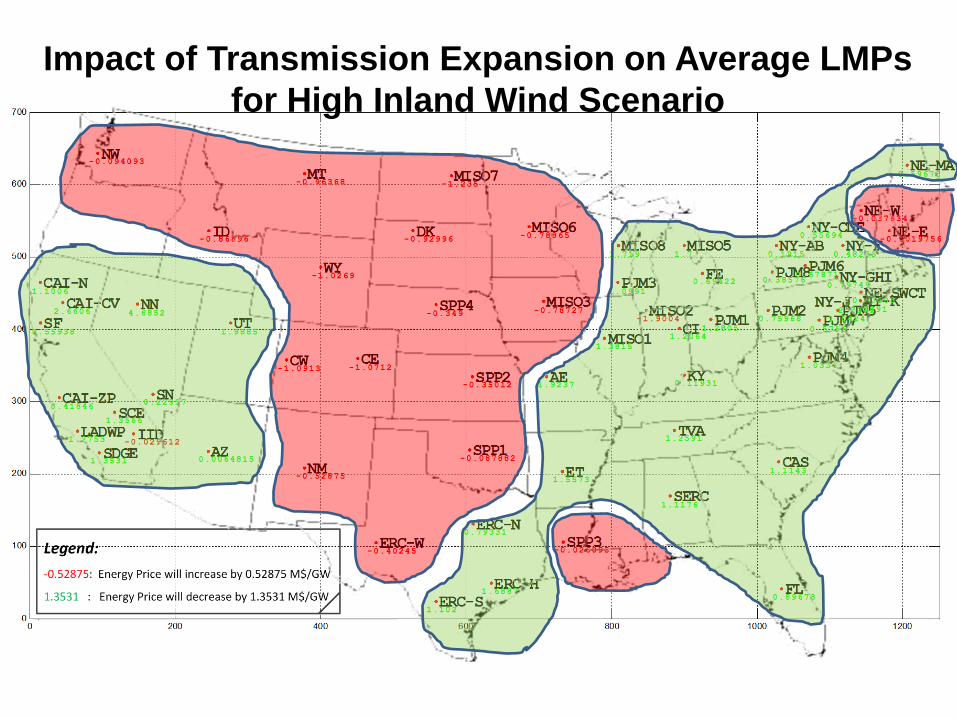
Impact of Transmission Expansion on Average LMPs
for High Inland Wind Scenario
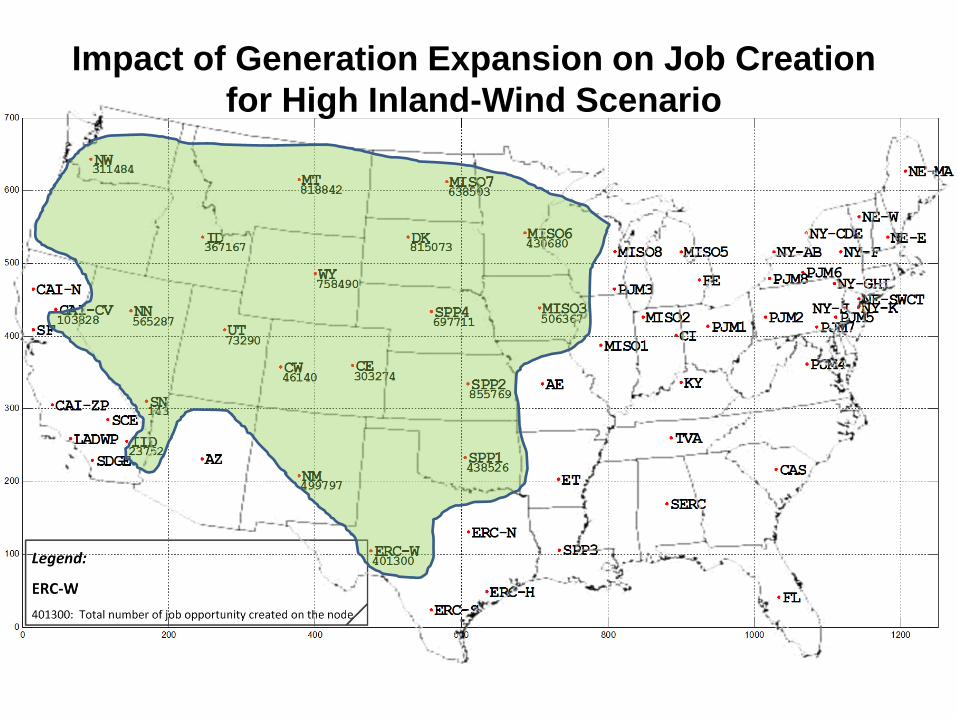
Impact of Generation Expansion on Job Creation
for High Inland-Wind Scenario
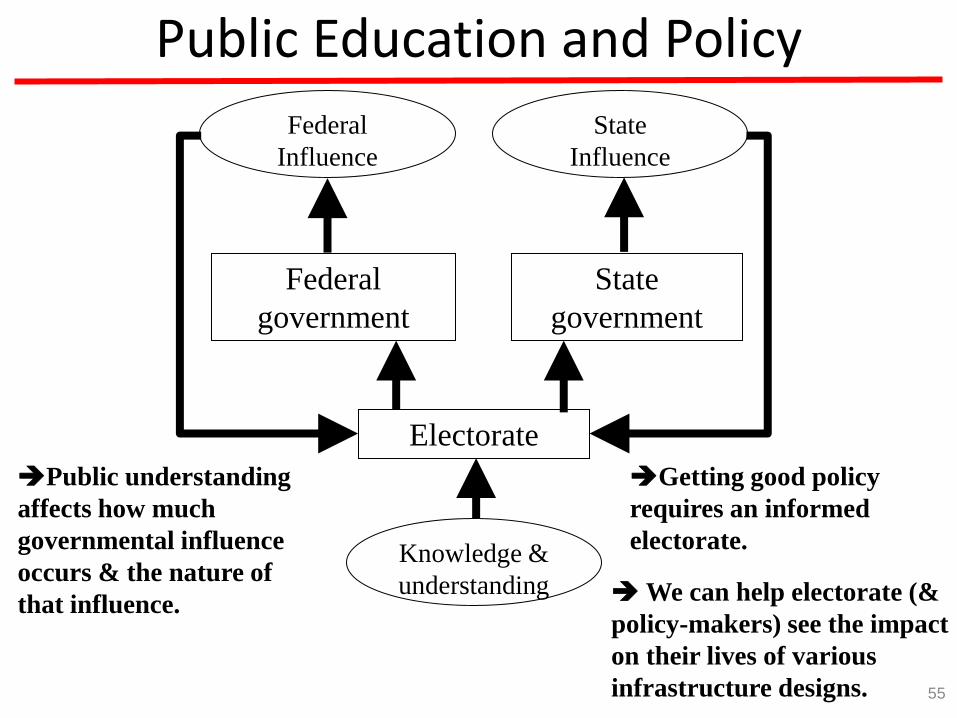
Public Education and Policy
55
Federal
government
State
government
Electorate
Knowledge &
understanding
Federal
Influence
State
Influence
Public understanding
affects how much
governmental influence
occurs & the nature of
that influence.
Getting good policy
requires an informed
electorate.
We can help electorate (&
policy-makers) see the impact
on their lives of various
infrastructure designs.
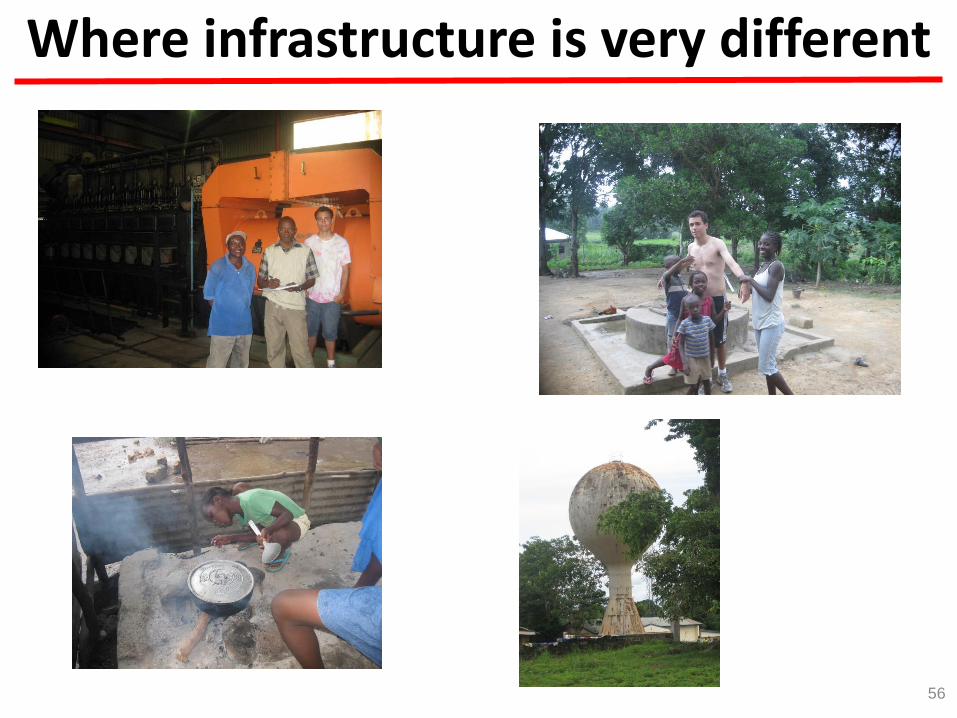
Where infrastructure is very different
56