Embed Size (px)
Citation preview

Floating European football clubs in the stock market
Université de Paris Ouest Nanterre La Défense (bâtiments T et G)
200, Avenue de la République92001 NANTERRE CEDEX
Tél et Fax : 33.(0)1.40.97.59.07Email : [email protected]
Document de Travail Working Paper
2010-24
Michel Aglietta Wladimir Andreff
Bastien Drut
EconomiXhttp://economix.u-paris10.fr/
FRE 3257

1
Floating European football clubs in the stock market
Michel Aglietta1, Wladimir Andreff2, Bastien Drut1,3
1) University of Paris West Nanterre La Défense, EconomiX-CNRS 200 Avenue de la République, Nanterre, 92001, France
2) Université de Paris 1, Centre d’Economie de la Sorbonne (UMR 8174 CNRS), 106-112, bd
de l’Hôpital, 75647 Paris Cedex 13.
3) Centre Emile Bernheim, Solvay Brussels School of Economics and Management, Université Libre de Bruxelles, Av. F.D. Roosevelt, 50, CP 145/1, 1050, Brussels, Belgium
Abstract
Since the first initial public offering of a European football (soccer) club in 1983,
more than forty other clubs have experienced a venture in the stock market. In this paper, it is
investigated how much relevant and successful these experiences of listing and floating
football clubs at the stock exchange have been. First, by showing that investing in the Dow
Jones StoXX Football index is of little attractiveness in the perspective of an investor’s
efficient overall asset allocation. Then in examining the determinants of a football club’s fair
value and the relationship between stock performances and sporting results. Finally, an
approach (alternative to the Anglo-American model of capitalism) of corporate governance,
based on the concept of a soft budget constraint, is applied to European football clubs taking
stake of their lasting financial deficits and debts. This alternative theoretical approach paves
the way for an empirical testing of a vicious circle between negotiating higher TV rights
revenues and player wage inflation.
JEL: G12, G30, G34, Z19 [email protected] ; [email protected] ; [email protected]

2
1) Introduction
In 1983 Tottenham Hotspurs became the first football club in Europe to be floated in
the stock market. Since then, dozens of European clubs, mostly English, also have
experienced floating their shares. However, since the primary objective of a football club is
sporting performance (win maximization) and not profit maximization, and since a number of
floatation experiences appeared to be negative, the purpose of this paper is to investigate the
relevance and interest of these initial public offerings (IPOs).
At first sight, the IPO advantages with regards to football clubs are unclear. Baur and
McKeating (2009) have highlighted that sporting performances are not improved after an IPO.
From a financial viewpoint, if the IPO aims at reinforcing a club’s balance sheet, private
equity by far seems to fit better in a sports industry suffering of poor corporate governance.
Indeed, private equity funds target underperforming companies in order to restructure them
and sell them with making a profit.1
Since a company’s financial performance is linked to its business model, the latter is
examined here for professional football clubs. If the business performance relies too much on
sporting results, there should be a high uncertainty about the fair value of a club’s stock. A
body of literature focuses on the efficiency of football clubs on the stock market. Renneboog
and Van Brabant (2000), Palomino et al. (2009), Bell et al. (2009) namely find that football
In such case, IPOs of restructured companies could be
necessary to materialize capital gains and the question of the stock fair value matters.
Another advantage of being publicly traded for an entertainment activity is to draw the
attention of institutional investors. From the demand side point of view, flotation enlarges
diversification possibilities, mainly if the financial return of diversification is uncorrelated
with traditional stock markets. Whether such hypothesis is relevant or not has to be verified
by studying the returns on clubs’ stocks in the secondary stock market. This is why we study
how much an investment in the DJ StoXX Football Index is interesting in a standard process
of portfolio allocation.
1 Besides, Manchester United which was the most performing club in terms of finance had been delisted from the stock market after it was taken over by Mr. Glazer.
3
clubs’ stocks are strongly affected by sporting outcomes. Palomino et al. (2009) even show
that investors in British football should use information from the betting market to implement
short-term stock strategies because the bookmakers’ odds are particularly accurate to predict
the games’ outcomes. Thus, our paper investigates whether the business model and the
balance sheet of a European football club have an impact on the fair value of its stock.
Hall et al. (2003) strikingly notice that a listed club’s wage bill is significantly higher
in European football despite IPOs should have improved clubs’ transparency and governance
by transferring control to the shareholders. Thus, the football industry seems unable to curb
wage inflation. Consequently, we attempt to determine how efficient the governance of
European football clubs is.
The purpose of our paper is to investigate whether it is actually relevant to float
football clubs’ shares in the stock market. First, it shows that there is little interest for
institutional investors to invest their money in football stocks because of a relatively weak
risk-return profile and low diversification possibilities. Then it exhibits that the financial value
of a football club is highly related to its sporting results. The resulting instability of a club’s
value added to the high share of intangible assets in clubs’ balance sheet generates a strong
uncertainty on the club assets’ fair value and, by the same token, on their stocks’ fair value.
Finally, the paper demonstrates that a major cause of IPOs’ failures is the lack of an effective
corporate governance at the club’s level.
The paper is organized as follows. Section 2 reminds some stylized facts regarding publicly
traded football clubs while Section 3 examines whether clubs may be attractive to
professional or institutional investors. Section 4 investigates the roots for the uncertainty of
football clubs’ fair value. Section 5 studies the quality of clubs’ governance. Section 6
concludes.

4
2) Football clubs in the stock market: an overview
A bit more than forty football clubs around Europe had ventured in the stock market
since 1983. Some of them were de-listed since then. In Figure 1, the number of football clubs
publicly traded over time is displayed (the full list of clubs is available in Appendix 1). It is
striking that the majority of these IPOs occurred by the end of the 1990s, in times of financial
euphoria. The peak in the number of publicly traded clubs was witnessed between 1999 and
2003. Then, a strong wave of de-listing took place, mainly in England (see Appendix 2).
Figure 1 Number of publicly traded football clubs in Europe
(January 1983-September 2009)
The best known index for publicly traded football clubs is the DJ StoXX Football
Index2
2 The Bloomberg Football Club Index focuses on English and Scottish football clubs.
which composition is exhibited in Table 1. As of September 1st, 2010, the index was
encompassing 23 football clubs. Contrary to a publicized myth, only still 4 clubs out of 23 are
based in the United Kingdom. Other clubs are well scattered throughout Europe: 5 are Danish,
4 Turkish, 3 Italian, 3 Portuguese, 1 Dutch, 1 French, 1 German, and 1 Swedish. Notice that
market capitalization is negligible: with a €72 million market capitalization, Galatasaray is the
most important club in the index. This may explain a low attractiveness of the football stock
market for institutional investors. The financial size of football clubs in the stock market is
extremely small when compared to global capital markets. Indeed, as of September 1st, 2010,
0
5
10
15
20
25
30
35
40
January-83
January-85
January-87
January-89
January-91
January-93
January-95
January-97
January-99
January-01
January-03
January-05
January-07
January-09N
b. o
f Clu
bs

5
the market value of the DJ StoXX Football Index represented only 0.035% of the DJ
EurostoXX 50 market value. Since the creation of this DJ StoXX Football Index in 2002, this
ratio never exceeded 0.06%.
Table 1 Composition of DJ StoXX Football (1st September 2010)
Source : StoXX Ltd. Note: “CL” means qualification for the round robin stage of the Champions League and “Europa” means qualification for the round robin stage of the Europa League.
Moreover, the sporting value of publicly traded clubs is heterogeneous. Even though
almost all the floated teams are in a first national league, only 6 clubs have qualified for the
round robin stage of the Champions League and 5 for the Europa League. Given that sporting
success in European football contests is a precondition for financial success, this is not a good
omen for the financial performances of most floated clubs. With regards to English clubs, 2
out of 3 clubs are strikingly not in the elite division. Here we observe the outcome of delisting
trend among the best English teams during the 2000s (see also Appendix 2).
Country Company Weight (%)
Mcap (€million)
Float (%)
Division in2010/2011
Involved inEuropean League
Turkey GALATASARAY 11.55 72.0 37.1 1stItaly JUVENTUS 9.45 58.9 32.5 1st EuropaTurkey FENERBAHCE SPORTIF HIZMET 9.38 58.5 13.0 1stGermany BORUSSIA DORTMUND 9.24 57.7 85.4 1st EuropaDenmark PARKEN SPORT & ENTERTAINMENT 8.80 54.9 84.4 1st CLTurkey BESIKTAS 8.40 52.4 30.0 1st EuropaFrance OLYMPIQUE LYONNAIS 6.88 42.9 41.9 1st CLItaly AS ROMA 6.50 40.5 32.9 1st CLTurkey TRABZONSPOR SPORTIF YATIR 6.47 40.4 25.0 1stUnited Kingdom TOTTENHAM HOTSPUR 4.10 25.6 23.5 1st CLUnited Kingdom CELTIC 3.58 22.3 46.2 1stNetherlands AFC AJAX 3.49 21.8 17.1 1st CLDenmark BRONDBY IF B 2.89 18.1 100.0 1stPortugal SPORT LISBOA E BENFICA 2.37 14.8 27.8 1st CLDenmark ARHUS ELITE 2.00 12.5 59.7 1stItaly LAZIO 1.13 7.1 33.3 1stUnited Kingdom MILLWALL HLDG 1.03 6.4 46.5 2ndDenmark SILKEBORG 0.88 5.5 56.4 1stDenmark AALBORG BOLDSPILKLUB 0.53 3.3 74.9 1stPortugal FUTEBOL CLUBE DO PORTO 0.51 3.2 20.9 1st EuropaPortugal SPORTING 0.30 1.8 8.4 1st EuropaUnited Kingdom WATFORD 0.28 1.7 54.1 2ndSweden AIK FOOTBALL 0.27 1.7 59.0 1st

6
3) Assessment of football stocks from an institutional investors’ point of view
For institutional investors, the DJ StoXX Football Index may be attractive only if
financial returns are good enough compared to their volatility or if the index brings with it
some diversification compared with traditional asset classes. Let us consider the typical case
of an investor in stocks and bonds in Euros. Here we take into consideration the DJ Euro
StoXX 50 as a common European stock index and the Merrill Lynch EMU Government index
as a European government bond index. Data are respectively from Datastream and
Bloomberg. Descriptive statistics3
Source : Bloomberg, Datastream, authors’ calculation.
Table 3 Correlation between returns, January 1991-September 2009
from January 1991 to September 2009 are available in
Table 2 and the correlation matrix in Table 3.
Table 2 Descriptive Statistics of returns, January 1991-September 2009
Source : Bloomberg, Datastream, authors’ calculations.
First, one witness pretty bad returns with the DJ StoXX Football Index. The Sharpe ratio is
even negative (-0.01) whereas it is positive for the common stock index (0.20) and the bond
index (0.83). On the other hand, the average Football Index return is lower than the average
return on other asset classes and the standard deviation is higher with the former than the
latter. Returns on football shares look unstable: extreme risks as measured by the skewness,
kurtosis and maximum monthly loss are markedly higher with the football index than with the
other two asset classes. Besides, even though the football index is uncorrelated with the bond
3 Even if the index was created in 2002, StoXX proposes historical daily data starting from 31/12/91.
Stock Index Bond Index Football IndexAnn. Mean 7.80% 6.95% 3.66%Ann Std. Dev. 19.09% 3.47% 23.89%Skewness -0.50 -0.13 0.59Kurtosis 3.95 2.86 6.30Maximum 14.69% 3.83% 32.85%Minimum -18.64% -1.99% -25.14%Sharpe Ratio 0.20 0.86 -0.01
Stock Index Bond Index Football IndexStock Index 100.00%Bond Index -2.14% 100.00%
Football Index 27.55% -7.12% 100.00%

7
index, it is not very much uncorrelated with the stock index. Overall returns of the three
indices are available in Figure 2 and the one-year rolling performance is shown in Figure 3.
Figure 2 Overall returns, comparison between the three indexes, January 1991-September 2009
Source : Bloomberg, Datastream.
Figure 3 One year rolling performance: comparing the three indexes, January 1991-September 2009
Source : Bloomberg, Datastream.
0
100
200
300
400
500
600
Decem
ber-91
January-93
January-94
January-95
January-96
January-97
January-98
January-99
January-00
January-01
January-02
January-03
January-04
January-05
January-06
January-07
January-08
January-09
Stock Index
Football Index
Bond Index
-100%
-50%
0%
50%
100%
150%
200%
250%
300%
Decem
ber-92
January-94
January-95
January-96
January-97
January-98
January-99
January-00
January-01
January-02
January-03
January-04
January-05
January-06
January-07
January-08
January-09
Stock Index
Football Index
Bond Index

8
The football index systematically underperformed the common stock index between
1997 and 2005. It performed better in 2007 and 2008 and stepped back to underperforming in
2009. The main message delivered by Figure 3 is a strong correlation between the football
index and the stock index since the beginning of the 2000s. One can notice a surge in the
volatility of the football index - sometimes between two flat episodes -, as if the football
clubs’ fundamental value was not clear. To sum up, with regards to institutional investors, our
findings can explain why they do not favour investing in publicly traded football clubs.
Football stocks are not attractive when an 8% return per year is required from a number of
other financial investments.
The erratic behaviour of the DJ StoXX Football Index may be rooted in various
causes. Indeed, the overall turnover of football shares is very low and some stocks are not
even traded during several weeks in a row. A low turnover can trigger dramatic consequences,
positive or negative, on stock prices. Andreff et al. (2008) have shown that the share of free
float stocks has diminished over time in England during the 2000s, which is all the more
surprising that an opposite tendency is usually observed in any new industry. It must be
stressed that an erratic behaviour of the football index can also derive from the uncertainty
about what the fair value of football clubs actually is.
In the stock market, rational speculators should detect if a stock is under- or over-
valued and their action should create those financial flows that would stabilize the stock price
around its mean value. However, the club’s value heavily depends on valuation criteria as
much uncertain as the club’s sporting results and/or possible gains and losses on the very
irrational market for players’ transfers (Kuper and Szymanski, 2009). Such dependence may
introduce a radical uncertainty about the club’s fair value and fundamentalist investors may
not be able to stabilize the stock price. Instead of taking positions on the basis of the
difference between the current and the fundamental value, investors will then take a position
according to their perception of recent market behaviour. A model by Gennotte and Leland
(1990) shows that multiple equilibriums can take place in this case and the stock price can be
stuck in a lasting low equilibrium. This is why the drivers of a football club’s fair value must
be investigated now.
9
4) What about the fair value of a football club?
A/ The club’s business model
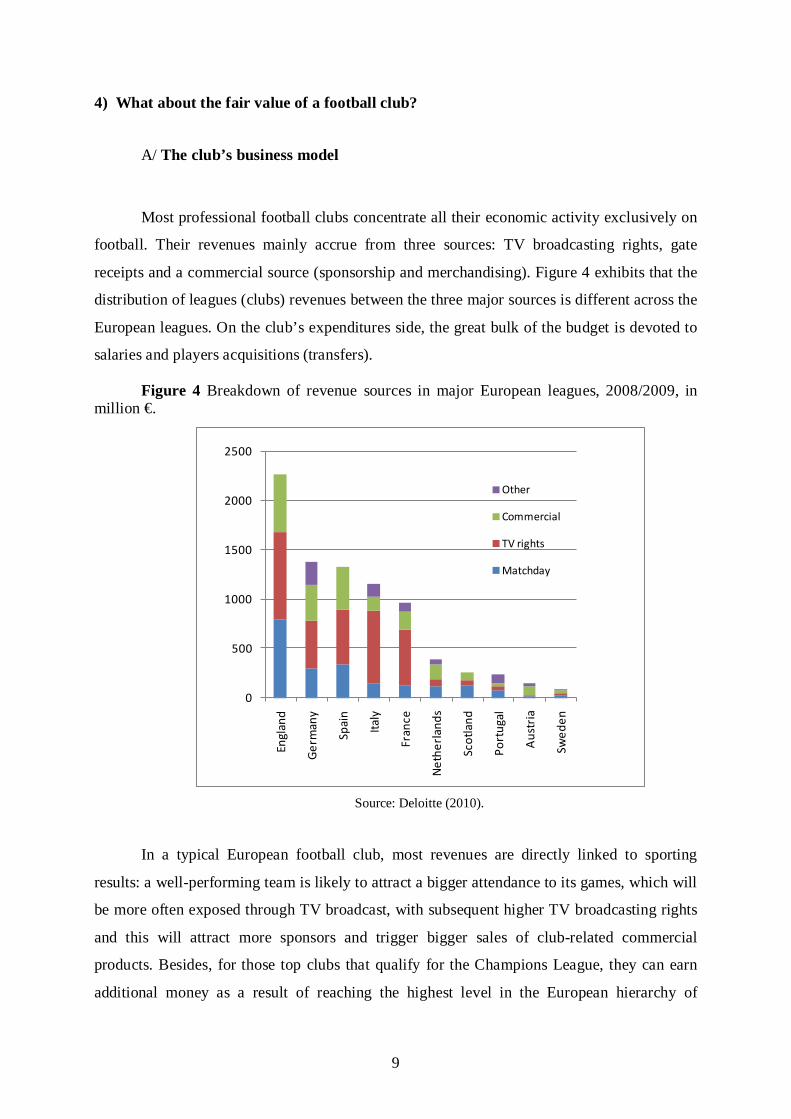
Most professional football clubs concentrate all their economic activity exclusively on
football. Their revenues mainly accrue from three sources: TV broadcasting rights, gate
receipts and a commercial source (sponsorship and merchandising). Figure 4 exhibits that the
distribution of leagues (clubs) revenues between the three major sources is different across the
European leagues. On the club’s expenditures side, the great bulk of the budget is devoted to
salaries and players acquisitions (transfers).
Figure 4 Breakdown of revenue sources in major European leagues, 2008/2009, in million €.
Source: Deloitte (2010).
In a typical European football club, most revenues are directly linked to sporting
results: a well-performing team is likely to attract a bigger attendance to its games, which will
be more often exposed through TV broadcast, with subsequent higher TV broadcasting rights
and this will attract more sponsors and trigger bigger sales of club-related commercial
products. Besides, for those top clubs that qualify for the Champions League, they can earn
additional money as a result of reaching the highest level in the European hierarchy of
0
500
1000
1500
2000
2500
Engl
and
Ger
man
y
Spai
n
Italy
Fran
ce
Net
herl
ands
Scot
land
Port
ugal
Aus
tria
Swed
en
Other
Commercial
TV rights
Matchday

10
football contests. Negotiating TV rights revenues in the deals with TV channels is also crucial
for European football clubs, in particular in France and Italy where they account for around
60% of clubs’ revenues. If, for any reason (injuries, bad tactics on the pitch, administrative
sanctions, etc.), sporting results are to decline, it is very likely that the financial outcome will
be declining as well while salaries are unlikely to drop that suddenly. Thus, both virtuous and
vicious circles have a self-reinforcing character. Good (resp. bad) sporting results imply good
(resp. bad) financial outcome with its consequences, that is an improvement (resp. a
deterioration) of the players staff due to hiring (resp. selling) valuable players and rising (resp.
lowering) players’ salaries. The virtuous circle raises the probability of good sporting
performances, then a good financial outcome and so on and so forth. It is exactly the opposite
with the vicious circle. To sum up, for traditional football clubs, financial results are highly
dependent on sporting results. Since a stock price is the sum of future discounted cash-flows,
the stock of publicly traded clubs must also heavily depend on sporting results.
Some football clubs have decided to diversify their activities in order to diminish the
sporting uncertainty which makes financial performances so much uncertain. The best
example is the Danish club FC Copenhagen. This club was created in 1992 out of the merger
between Kjøbenhavns Boldklub, the oldest non-English football club, and Boldklubben 1903.
The merger was decided at the time of building a modern stadium named Parken4
4 The Danish national team plays its games in this stadium.
with 38,000
seats aiming at attracting a bigger fan attendance. The newly created club was listed on the
Copenhagen Stock Exchange in 1997. Since the IPO, the club’s strategy has been to diversify
its economic activities so that financial results will less and less rely on football performances.
Acquiring the Parken stadium was a major tool for such strategy. In 1999, the company’s
name has changed from Football Club Copenhagen A/S to Parken Sport & Entertainment
A/S. In 2001, the club has expanded its business by acquiring Rockshow, the promoter of an
annual Danish outdoor concert tour, and 15% of Euro Media A/S, a production company. In
2002, Parken Sport & Entertainment A/S has taken a 51% stake in e-billeter A/S, a company
selling tickets for sporting and entertainment events throughout Denmark, and has taken over
a professional handball team. In 2006, it has also bought Fitnessdk, a company involved in the
fitness centers industry. Now football represents only a small share of the total Parken Sport
& Entertainment A/S turnover (see the evolution of Parken Sport & Entertainment overall
sales in Figure 5). A major consequence has been to stabilize the company’s income.

11
Figure 5 Parken Sport & Entertainment overall sales, in € millions.
Source : Datastream.
One has to mention that Parken’s diversification has not been detrimental to sporting
results since FC Copenhagen has made it to win the Danish Superliga championship in the
1992/1993, 2000/2001, 2002/2003, 2003/2004, 2005/2006, 2006/2007 and 2008/2009
seasons.
B/ The significance of sporting results
A train of literature highlights the significance of sporting outcomes as a determinant
of football clubs’ share price fluctuations. While a majority of contributors focuses on English
clubs listed in the stock market (Andreff et al., 2008; Bell et al., 2009; Palomino et al., 2009;
Renneboog and Vanbrabant, 2000), Duque and Ferreira (2005) have studied Portuguese clubs,
Berument et al. (2009) Turkish clubs, Stadtmann (2006) Borussia Dortmund and Bernile and
Lyandres (2009) different European clubs in general. All these studies tend to converge
toward the conclusion that winning on the pitch triggers a significant rise of the club’s stock
value whereas draws and losses incur a significant drop.
Thus, no one would deny that sporting outcomes significantly impact the share price
of football clubs: since their business model usually is exclusively focused on football,
sporting outcomes determine upcoming financial results; since the stock’s fair value is the
sum of future discounted cash-flows, financial results in turn should theoretically impact the
stock price. Gannon et al. (2006), studying the impact of announcing the winner of
0
50
100
150
200
250
1998 1999 2000 2001 2002 2003 2004 2005 2006 2007 2008
Total sales
12
broadcasting rights auction bids in England, have found a mixed reaction of clubs’ stocks
which is positive in 1996 but not in 2000, thus opening avenues for further research. Edmans
et al. (2007) show that international football games impact national stock indexes through
their effect on investors’ mood. Bernile and Lyandres (2009) exhibit an impact on clubs’
stocks due to return on assets significantly depending on sporting performances in European
clubs. Moreover, Bell et al. (2009) and Palomino et al. (2009) underline that end-of-season
games have a markedly higher impact than other games because the former are determinant of
the final standing in national championships and cups, unveiling either each club’s status next
year (promotion, relegation, qualification for the Champions League, etc.) and the probable
amount of its financial gains (gains from the Champions League for example).
Such findings are particularly useful for active investment strategies through which an
investor can use information provided by the bookmakers and take short-term positions,
whatever short or long positions. However, it is a matter of fact that bookmakers produce
fairly accurate betting odds that traders surprisingly do not use to build up their strategies in
the stock market (Palomino et al. (2009).
C/ A high share of intangible assets
Since sporting results have a significant impact on the share price of publicly traded
football clubs, this creates an uncertainty about the fair value of the stock. Another source of
uncertainty derives from the balance sheet of football clubs. Indeed, intangible assets
represent an important share of their total capital assets. Most of these intangible assets
correspond to transfer fees paid by the club to recruit players. In other words, such assets
roughly express the value of the club’s human capital in accounting standards. Some other
intangible assets matter to the club’s fundamental evaluation, for instance the goodwill
associated to the value of contracts with sponsors and other contracts using the club’s image
and brand. The problem is that the value of intangible assets is strongly endogeneous to
sporting results. Repeated wins in the championship tend to raise players’ value and the value
of the contracts that the club can pretend to negotiate with sponsors and the media. To the
contrary, bad sporting results such as being relegated to a lower division will depreciate the
value of players’ capital and future sponsoring contracts. Looking for instance at those French
football clubs for which financial data are available, one notices that the share of intangible

13
assets in overall assets is regularly over two thirds in Ligue 1 with a peak at 90 % in
2000/2001 (Figure 6).
Figure 6 Share of intangible assets in overall assets in French Ligue 1 and Ligue 2 (all clubs
aggregated)
Source : Ligue Professionnelle de Football, authors’ calculation.
The capacity of a football player to play at his highest level is fragile because an injury
or a lower sporting efficiency is never definitely avoidable so that there is a high risk of
depreciation of the club’s intangible assets and consequently there is some uncertainty about
the club’s fundamental value. The biggest clubs intend to stabilise the fundamental value of
their assets by assuring a regular qualification to the European football contests – such was
the aim of an aborted project of a European closed league, parallel to the UEFA contests,
launched in 1999. Another strategy for stabilising the fundamental value of a club’s assets
consists in activity diversification outside the football industry (like the aforementioned FC
Copenhagen experiment) or in buying physical assets such as a stadium and/or a commercial
centre. Few European clubs enjoy the ownership of their own stadium even though they are
encouraged to do it. For example, a French law passed in 2006 has allowed football clubs to
achieve an IPO5
5« Loi pour le développement de la participation et de l’actionnariat salarié» voted the 11th October 2006
. The law explicitly recommends (or even preconditions) that an IPO should
take place only if there is a project to use the proceeds to acquire real assets such as the
0%
10%
20%
30%
40%
50%
60%
70%
80%
90%
100%
1998-99
1999-00
2000-01
2001-02
2002-03
2003-04
2004-05
2005-06
2006-07
2007-08
2008-09
Ligue 1
Ligue 2

14
property rights over the sport facility or infrastructure used by the club. Such statement
obviously aims at reinforcing the stability and durability of the clubs’ capital endowment and
reducing the share of intangible assets. On the other hand, the law provides an incentive to
back the introduction of a club’s shares in the stock market with the purchase of real assets, in
particular the stadium in which the club plays its games. For instance, Olympique Lyonnais
has designed the construction plan of a sporting and commercial infrastructure named OL
Land which encompasses a new 60,000 seat stadium coupled with an important commercial
center.
5) Initial public offering and governance in football clubs
In the Anglo-Saxon model of capitalism, IPOs are assumed to be virtuous because the
managers of publicly traded companies should be submitted to market discipline. In case of
poor management, managers are exposed to be fired by the current shareholders or after a take
over. Financial markets discipline is regarded as the most powerful tool for promoting a good
governance structure according to this model’s supporters (Barros, 2006). Good governance
must be a way to avoid a financial crisis in the football industry. However, arguing that
football clubs governance can be improved by means of a stock market pressure is not
verified in practice. In England, where the majority of floated football clubs were located,
IPOs had been followed with better sporting results but also with deeper financial losses or
lower profits (Hall et al., 2003). The main reason is - even though the usual excuse for IPOs
had been a stadium or a commercial centre building - that English clubs are used to spend the
money raised at the stock exchange to recruit more or better players which derails into an
increased wage inflation pressure. Hall et al. (2003) have shown that the wage bill is always
significantly higher after an IPO. In the case of football, an IPO does not seem to improve the
club’s governance and management. Improving shareholders’ control over club managers is
still a remote dream in European football. Several clubs have been delisted after catastrophic
stock performances (Nottingham Forest, Queens Park Rangers, Leicester City) while a few
others have been delisted after a takeover by an investment funds or by an oligarchic
billionaire (Manchester United by Malcom Glazer, Chelsea FC by Roman Abramovitch).

15
A/ A soft budget constraint
An alternative view is to consider that good governance is a precondition to successful IPOs.
Good governance usually comes along with good management indicators, positive or
balanced financial results but never with lasting deficits. The latter would entail the IPO
failure and the stock price collapse. The problem is to create the conditions for good
governance, attested by positive financial results, before the IPO. A decisive solution to this
problem consists in strengthening the company’s budget constraint. A soft budget constraint
refers to a situation in which a firm can continuously spend more than its revenue for years (or
for ever) without going bankrupt, as illustrated by Janos Kornaï with regards to former
communist centrally-planned economies (Kornaï, 1980) where a failing firm was always
bailed out and rescued with state finance. Kornaï et al. (2003) have extended the same
theoretical analysis to a number of situations in capitalist market economies. It is precisely to
a soft budget constraint that Lago et al. (2006) refer: “In some countries, local government
stands ready to bail out failing clubs. The contribution by Ascari and Gagnepain makes clear
that there is no chance that Real Madrid or FC Barcelona would ever be allowed to go
bankrupt, whatever the financial problems of these big-spending clubs” (p. 8). Ascari and
Gagnepain (2006) state that: “Clubs’ owners know that Catalonian or Castillian banks will
always cover important losses in FC Barcelona or Real Madrid, because these clubs are
national institutions. In these cases, bankruptcy is simply not an option” (p. 77). Regarding
the Italian case, Baroncelli and Lago (2006) state: “the popularity of the game may even lie
behind possible slippage between authorities’ tolerance of financial misconduct on the part of
football clubs and ‘ordinary’ firms operating in other fields and businesses” (note 1, p. 27).
Thus, the budget constraint of a football club can be softened by a local government, a (not
too demanding) bank, authorities in charge of football and, sometimes, patrons and
shareholders.
It is not surprising that the majority of national football leagues in Europe are
considered to be in financial crisis6
6 See special issues of Journal of Sports Economics, vol 7(1), 2006 and vol 8(6), 2007.
. For example, the Italian Calcio had a €982 million
operating deficit accounting in 2001-2002 while its revenues amounted to €1148 million the
same year. Seria A’s debt reached €1742 million in 2002. Even though this debt was
diminished by a rescue plan from the Italian government, the deficit still accounted for € 414
million in 2003, and 13 clubs out of 18 were in the red, 3 had a balanced budget and 2 had a

16
little excess balance7
The Spanish Liga usually exhibits a slight operating surplus each year thanks to the
help of silent partners. Real Madrid succeeded in moping up a €300 million debt by
persuading the municipal council and the autonomous community of Madrid to evaluate its
Ciudad Deportivo ground upwards so that it could be sold for €480 million (Garcia and
Rodriguez, 2006). The overall debt of Spanish football clubs accounted for €1,625 million in
2002 (compared to €1,257 million overall revenues) and grew continuously. However, the
clubs have compensated for it with including more intangible assets, i.e. the value of their
players’ contracts, in their accounting (Garcia and Rodriguez, 2003). Not one Spanish football
club is listed in the stock market which is a sign of caution or a managerial willingness to
keep control over the clubs in a way that maintains a soft budget constraint with the help of
banks and public authorities. In various other football leagues, in England, in Belgium, in
Scotland, in Portugal, the financial crisis hits more small clubs
. The deficit reached a top of € 313 million for Lazio Roma, € 247
million for AC Milan and € 224 million for AS Roma. No surprise that the stock price of
Lazio Roma and AS Roma fell sharply. Although low sporting performances imply a stock
price fall (section 4 above), lasting clubs’ deficit and debts due to weak governance issues are
aggravating factors as well. Lazio Roma and AS Roma had certainly been publicly traded too
early or, at least, not in accordance with their financial results. Once publicly traded, their
weak governance has been sanctioned in the financial market but, contrary to the Anglo-
American capitalism paradigm, without improving the club management discipline. The
Calcio is an extreme case of financial crisis which ended up in so serious financial and
sporting distortions (misdoings, referees bribery, corruption, etc., see Andreff, 2007a) that the
beginning of the 2004/2005 season was postponed and several football clubs had to bear
sporting sanctions such as the demotion of Juventus to Seria B in 2006.
8 than big ones (Lago et al.,
2006), even though it does not definitely spare the latter9. The debt of English football leagues
(four professional divisions) reached €1 billion in 2003 and 22 clubs went into administration
between 1999 and 2004 (Buraimo et al., 2006). With 5 clubs out of 18 being in the red in
2003 and an overall debt amounting to €550 million10
7 Empoli’s excess was € 9 million and Juventus FC’s €2 million. 8 Liquidation of KV Mechelen and SK Lommel. Financial rescue of the SC Charleroi by the Premier of Wallonie in Belgium. 9 Leeds United, Celtic Glasgow, Glasgow Rangers, Benfica, FC Porto to quote a few. 10 42% of the debt was coming from only two clubs: Borussia Dortmund and Schalke 04. These two clubs securitised their debt in 2004.
, the German Bundesliga is regarded as
less affected by the crisis (Frick and Prinz, 2006). However, the Kirch group bankruptcy in

17
2002 increased the financial troubles of German clubs since Kirch was the main funds
supplier to the Bundesliga through its TV rights purchases (Frick, 2006). On the other hand, a
quite strict control over clubs’ expenditures in Germany restricted players’ recruitment with a
negative impact on sporting performances of German clubs, namely in European-level
football contests.
More recently some of the biggest European clubs struggled to repay their debt. Table 4
displays Forbes financial data for 2009 that rank the 25 most valuable European clubs.

18
Table 4 Financial data for the 25 most valuable European clubs in the Forbes ranking 2009
Source: Forbes.com
However, some of the most important European clubs remain highly indebted, in particular
the English Big Four clubs (Arsenal, Chelsea, Liverpool, and Manchester United) which debt
ratios have skyrocketed. Chelsea’s situation is somewhat different from the other ones
because the money that the club owed to Roman Abramovich was converted into equity at the
end of 2009, making it debt-free: this case is typical of an oligarchic billionaire’s patronage.
The surge of the global financial crisis initiated with Lehman Brothers bankruptcy raised
Rank Club Country Current Value (€mil)
Debt/ValueRatio
(%)
One yearvalue
change (%)
Total Revenue
(€mil)
Operating Income (€mil)
1 Manchester United
England 1191 54 4 326 102
2 Real Madrid Spain 862 23 5 367 523 Arsenal England 764 107 0 222 514 Bayern
MunichGermany 707 0 21 296 38
5 Liverpool England 643 59 -4 211 326 AC Milan Italy 631 0 24 210 377 Barcelona Spain 611 7 22 310 698 Chelsea England 510 92 5 270 -89 Juventus Italy 382 5 18 168 29
10 Schalke 04 Germany 325 38 9 149 2611 Tottenham
HotspurEngland 283 29 8 145 45
12 Olympique Lyonnais
France 269 18 4 156 60
13 AS Roma Italy 243 9 -12 176 4414 Internazional
e MilanItaly 236 77 -8 173 17
15 Hamburg SV Germany 210 0 13 129 28
16 Borussia Dortmund
Germany 207 33 1 117 6
17 Manchester City
England 197 0 62 104 -10
18 Werder Bremen
Germany 186 0 12 113 17
19 Newcastle United
England 182 96 -5 126 -8
20 VfB Stuttgart Germany 168 0 NA 112 11
21 Aston Villa England 153 10 26 96 121 Olympique
MarseilleFrance 153 0 28 127 13
23 Celtic Scotland 139 14 -4 92 724 Everton England 132 49 5 96 925 Glasgow
RangersScotland 124 86 NA 82 10

19
doubts about the sustainability of the football clubs’ debt: the credit risk premiums have
become higher and the uncertainty on future cash-flows has increased.
B/ A vicious circle between wages and TV rights revenues
All studies on European football show a strong correlation between wages and TV
broadcasting rights revenues (Andreff, 2005; Bolotny, 2005). Such correlation is reinforced
for those big clubs which regularly qualify for the Champions League (Andreff and Bourg,
2006). TV broadcasting rights strongly impact on clubs’ overall revenues. An optimistic
interpretation of the empirical evidence (Baroncelli and Lago, 2006) is to consider the
following virtuous circle: with important revenues derived from TV rights, clubs are able to
pay high players’ wages in order to gather an efficient team which is the way to winning
many games and getting higher revenues from these wins and resulting higher TV rights in
the future. With this paradigm, expensive player transfers are justified because the TV
industry is supposedly ready to pay (and the league and clubs budget constraints are soft). The
problem is that, in many countries, TV channels do not agree any more to pay the same or
higher amount for broadcasting rights than in the previous years. Moreover, Baroncelli and
Lago (2006) find little evidence of this virtuous circle in their observation of Italian Calcio.
It is more likely that in softening the clubs’ budget constraint, a big TV rights godsend
provides an incentive to lax club management. Therefore a vicious rather than a virtuous
circle would appear in which the professional league (in a monopolistic position on the
market for TV rights) would negotiate the highest TV rights in order to finance a substantial
wage inflation and the recruitment of superstar players. But such expenditures engaged by all
clubs in the league cannot come out with the best sporting performance for all of them. Some
qualify for the Champions League and the Europa League and benefit from the induced
significant financial gains. On the other hand, most clubs cannot recoup their wage and
recruitment expenditures with the revenues simply obtained from their national
championship; therefore they end up the season in the red. Thus, at both the league and club
levels such deficits call for a much needed negotiation of higher TV rights and so on and so
forth.

20
In the following, we would like to statistically verify whether such vicious circle is
relevant with testing whether “the higher the TV rights negotiated by the league, then the
more lax wage policy in the clubs” in European football. If in econometric testing the strength
and significance of the crucial relationship between wages and TV rights revenues is confirmed,
then this.would provide solid grounds to our guess of a weak governance linked to a soft
budget constraint in professional football clubs. Due to the paucity of data for other European
football leagues we retain the French Ligue 1 for which detailed accounting statistics are
available. We dispose of 213 observations for Ligue 1 and Ligue 2 clubs from the 2002/2003
season to the 2007/2008 season.
Thus the assumption to be tested is that the more a club is capable of obtaining increased TV
rights revenues, the more lax it will be in its payroll management, which generates a major
governance issue. More precisely, we would like to test the econometric relationships between
gross wages and TV rights revenues, but TV, the ‘TV rights revenues’ variable, is endogenous.
Thus, our methodology is to use instrumental variables and two-stage least squares. First, we
explain TV rights revenues using the following three variables:
. POP1999 which stands for the club’s market size as approximated by the population of
the town where the club is based (1999 is the last available updated data);
. DIST, which stands for the distance that TV channels must cover in order to reach the
club’s stadium for broadcasting and which is approximated by transportation costs in the club’s
expenditures; and
. NOT, which stands for a notoriety variable and for which we use the ranking used by the
French league to redistribute 20% of TV rights revenues according to media performance11
.
The following model is tested using our 213 observation sample:
TVit = k + a.POPi + b.DISTi + c.NOTit + uit
We control for the possible influence of each season, the division level (taking Ligue 1 as the
reference category) and the different seasons in three other specifications. Results are available
in Table 5.
11 We intended to carry out a causality test to determine whether TV rights revenues determine wages (our assumed vicious circle) or whether the causality runs the other way round. Unfortunately, rather long time series are required for causality testing.

21
Table 5 OLS regression of TV rights revenues on instrumental variables
TV rights revenues (I) (II) (III) (IV) Coefficient P > |t| Coefficient P > |t| Coefficient P > |t| Coefficient P > |t| POP 2005 0.003 0.03** 0.002 0.06* 0.003 0.03** 0.002 0.05** DIST 9.73 0.00*** 7.11 0.00*** 9.34 0.00*** 6.30 0.00*** NOT -26.53 0.71 -138.45 0.03** -73.29 0.31 -217.86 0.00*** LEAGUE -7137.80 0.00*** -7816.28 0.00*** Year 2003-04 -1067.83 0.44 -703.34 0.54 Year 2004-05 -422.42 0.75 -118.31 0.92 Year 2005-06 2009.61 0.14 2832.70 0.01*** Year 2006-07 2527.31 0.07* 3751.95 0.00*** Year 2007-08 1684.71 0.23 3139.85 0.01*** Constant -1323.90 0.23 7243.41 0.00*** -1235.42 0.35 7855.52 0.00*** R2 0.76 0.82 0.77 0.84 F-stat 220.26 236.64 87.41 122.29 *** Significant at a 1% threshold; ** at a 5% threshold; * at a 10% threshold.
We then study the relationship between gross wages W and the endogenous regressor TV
where the latter has been predicted according to the models above. An instrument variable is weak
when it is weakly correlated with the endogenous regressors. Staiger and Stock (1997) have
shown that when instruments are weakly correlated with the endogenous regressors, conventional
asymptotic results fail even if the sample is large. If the F-Statistic is below 10 when there is a
single endogenous regressor, one potentially faces a weak instrument problem. Thus, we require F
> 10 for our test to be relevant. In each of the four models, the relationship between the TV
variable and the instrumental variables appears significant with F > 10 and p values (Prob > F) =
0.000 (Table 6).

22
Table 6 OLS regression of payroll on predicted TV rights revenues
Payroll (I) (II) (III) (IV) Coefficient P > |t| Coefficient P > |t| Coefficient P > |t| Coefficient P > |t| Predicted TV 1.047 0.00*** 1.101 0.00*** 1.086 0.00*** 1.175 0.00*** LEAGUE 1419.37 0.22 2415.21 0.04** Year 2003-04 709.14 0.62 773.27 0.53 Year 2004-05 695.07 0.61 793.43 0.51 Year 2005-06 -1455.02 0.30 -1728.96 0.16 Year 2006-07 -4539.37 0.00*** -4934.97 0.00*** Year 2007-08 -2827.49 0.05** -3220.82 0.01*** Constant 848.51 0.15 -566.08 0.66 1729.91 0.11 -470.50 0.75 R2 0.77 0.82 0.78 0.83 F-stat 692.88 484.64 118.90 144.09 *** Significant at a 1% threshold; ** at a 5% threshold; * at a 10% threshold.
.
In all specifications, the link between TV rights revenues and payroll is significant. This
confirms that TV rights revenues are determined by the three exogenous instruments and the
league dummy variable. The major governance issue in European football is not only one of
curbing wage inflation in order to maintain overall expenditures within the budget constraint fixed
by overall revenues but also to avoid using TV rights revenues as a means for softening the budget
constraint, an option that will not always be available insofar as TV channels will not permit TV
rights to skyrocket for ever12
12 A first warning emerged in 2008 when the French professional football league (LFP) had to organize a second auction round in negotiation with TV channels because the reserve price was not reached in a first auction round.
. This is probably what Ascari and Gagnepain (2006, p. 79) mean
when they contend that television is the possible source of new and larger deficits in Spanish
football clubs accounts. This reference to the Spanish league is likely to apply to French football
as well. Behind the financial godsend of TV is the monopolistic strategy of French football
league: however, any possible decrease in league monopoly power would undermine the major
pillar of French football finance. Without an improvement in football club governance, it seems
highly unlikely that further football clubs’ IPOs could succeed.

23
6) Conclusion
This paper has studied how much relevant the IPO drive has been for European
football clubs. It appears, on the demand side, that there is little attractiveness for long-only
institutional investors to invest in football clubs with a traditional bond/stock allocation
approach. The analysis of the football stock index exhibits an erratic behavior, likely to be
related to high uncertainty about the club’s fair value, hence a weak risk-return profile and a
low diversification potential. The club’s business model and balance sheet are too much
closely linked to sporting results in which the uncertainty about the club’s fair value is deeply
rooted. In addition, most clubs’ assets are intangible in nature and volatile as regards to their
value. A last and major hindrance to successful initial public offerings in football is the club’s
weak corporate governance derailing into bad management which is due, in theoretical terms,
to a soft budget constraint. The latter is increasingly fuelled, as we have empirically tested it,
by a vicious circle between negotiating always higher TV rights revenues with TV channels
and player wage inflation.
REFERENCES
Aglietta M. and Rebérioux A . [2005], Dérives du capitalisme financier, Paris : Albin Michel, 2005
Andreff W. [2005], “Financial Crisis in French Soccer: About a French Senate Report”, 7th Annual Conference,
International Association of Sport Economists, University of Ottawa, mimeo.
Andreff W. [2007a], «Dérives financières : une remise en cause de l’organisation du sport », Finance et Bien
Commun (Genève), n° 26, hiver 2006-2007, 27-35.
Andreff W. [2007b], “French Football: A Financial Crisis Rooted in Weak Governance”, Journal of Sports
Economics, 8 (6), 652-661.
Andreff W. and J.-F. Bourg [2006], “Broadcasting Rights and Competition in European Football’, dans C.
Jeanrenaud & S. Késenne, eds., The Economics of Sport and the Media, Cheltenham: Edward Elgar, 37-70.
Andreff W. and P. Staudohar [2000], “The Evolving European Model of Professional Sports Finance”, Journal
of Sports Economics, 1 (3), 257-76.
Ascari G. and P. Gagnepain [2006], “Spanish Football”, Journal of Sports Economics, 7 (1), 76-89.
Baroncelli A. and U. Lago [2006], “Italian Football”, Journal of Sports Economics, 7 (1), 13-28.
Barros C.P. [2006], “Portuguese Football”, Journal of Sports Economics, 7 (1), 96-104.
Baur D. and C. McKeating [2009], “The Benefits of Financial Markets: a Case Study of European Football
Clubs”, Institute for International Integration Studies Discussion Paper n°283.
Bell A., C. Brooks, D. Matthews and C. Sutcliffe [2009], “Over the Moon or Sick as a Parrot? The Effects of
Football Results on a Club’s Share Price”, ICMA Centre Discussion Papers in Finance.

24
Bernile G. and E. Lyandres [2009], “Understanding Investor Sentiment: the Case of Soccer”, Boston U. School
of Management Research Paper N°2009-13.
Berument H., N. Ceylan and E. Gozpinar [2009], “Soccer, stock returns and fanatism: evidence from Turkey”,
Social Science Journal, vol. 46(3), 594-600.
Bolotny F. [2005], “La nouvelle télé-dépendance du football français”, Revue Juridique et Economique du Sport,
n° 75, 113-29.
Bolotny F. [2006], “Football in France”, in W. Andreff & S. Szymanski, eds., Handbook on the Economics of
Sport, Cheltenham: Edward Elgar, 497-513.
Buraimo B., R. Simmons and S. Szymanski [2006], “English Football”, Journal of Sports Economics, 7 (1), 29-
46.
Duque J. and N. Ferreira [2005], “Explaining share price performance of football clubs listed on the Euronext
Lisbon”
Edmans A., D. Garcia and O. Norli [2007], “Sports Sentiment and Stock Returns”, Journal of Finance, 62, 1967-
1998.
Frick B. [2006], “Football in Germany”, in W. Andreff & S. Szymanski, eds., Handbook on the Economics of
Sport, Cheltenham: Edward Elgar, 486-96.
Frick B. and J. Prinz [2006], “Crisis? What Crisis? Football in Germany”, Journal of Sports Economics, 7 (1),
60-75.
Gannon J., K. Evans and J. Goddard [2006], “The stock market Effects of the sale of live broadcasting rights for
English premiership football: an event study”, vol. 7(2), 168-186.
Garcia J. and P. Rodriguez [2003], “From Sport Clubs to Stock Companies: The Financial Structure of Football
in Spain, 1992-2001”, European Sport Management Quarterly, 3 (4), 253-69.
Garcia J. and P. Rodriguez [2006], “The Economics of Soccer in Spain”, in W. Andreff & S. Szymanski, eds.,
Handbook on the Economics of Sport, Cheltenham: Edward Elgar, 474-85.
Gennotte G. and Leland H., “Market liquidity, hedging and crashes”, American Economic Review, 80 (5), 1990,
99-102
Gouguet J.-J. and D. Primault [2006], “The French Exception”, Journal of Sports Economics, 7 (1), 47-59.
Hall S., S. Leach and S. Szymanski [2003], “Making Money out of Football”, The Business School, Imperial
College, London, mimeo.
Kornaï J. [1980], The Economics of Shortage, Amsterdam: North Holland.
Kornaï J., E. Maskin and G. Roland [2003], “Understanding the Soft Budget Constraint”, Journal Of Economic
Literature, 61, 1095-1136.
Kuper S. and S. Szymanski [2009], Why England lose: and other curious phenomena explained, London:
HarperCollins.
Lago U., R. Simmons and S. Szymanski [2006], “The Financial Crisis in European Football: An Introduction”,
Journal of Sports Economics, 7 (1), 3-12.
Palomino F., L. Renneboog and C. Zhang [2009], “Information Salience, Investor Sentiment, and Stock Returns:
the Case of British Soccer Betting”, Journal of Corporate Finance, 15(3), 368-387.

25
Renneboog L. and P. Van Brabant (2000), “Share Price Reactions to Sporty Performances of Soccer Clubs Listed on the London Stock Exchange and the AIM”, CentER DP 2000-19, University of Tilburg.
Stadtmann G. (2006) “Frequent news and pure signals: the case of a publicly traded football club”, Paper
presented at the Joint Annual Meeting of the International German-Speaking Associations of Sports Economists.
Staiger D. and J.H. Stock [1997], “Instrumental Variables Regression with Weak Instruments”, Econometrica,
65, 557-86.

26
Appendix 1 All the European football clubs ever publicly traded
Club League
Aalborg Boldspilklub DenmarkAberdeen ScotlandAGF Kontraktfodbold DenmarkAIK Football SwedenAjax NetherlandsAkademisk Boldklub DenmarkArsenal EnglandAS roma ItalyAston Villa EnglandBesiktas TurkeyBirmingham City EnglandBolton Wanderers EnglandBorussia Dortmund GermanyBradford City EnglandBrondby DenmarkCharlton Athletic EnglandChelsea Village EnglandFC Istres FranceFC Kopenhagen DenmarkFC Porto PortugalFenerbahce TurkeyGalatasaray TurkeyGlasgow Celtics ScotlandGlasgow Rangers ScotlandGrasshoppers Zurich SwitzerlandHearts of Midlothian ScotlandJuventus ItalyLazio Roma ItalyLeeds United EnglandLeicester City EnglandManchester City EnglandManchester United EnglandMillwall EnglandNewcastle United EnglandNottingham Forrest EnglandOlympique Lyonnais FrancePreston North End EnglandQueen Parks Rangers EnglandSheffield United EnglandSilkeborg DenmarkSouthampton EnglandSporting PortugalSporting Lisboa PortugalSunderland EnglandSwansea City EnglandTottenham Hotspurs EnglandTrabzonspor TurkeyWatford EnglandWest Bromwich England

27
Appendix 2 Number of publicly traded football clubs in the United Kingdom
(January 1983-September 2009)
0
5
10
15
20
25
30
January-83
January-85
January-87
January-89
January-91
January-93
January-95
January-97
January-99
January-01
January-03
January-05
January-07
January-09
Nb.
of C
lub