Embed Size (px)
Citation preview

a
January 2017
Economy Watch Monitoring India’s macro-fiscal
performance

Economy Watch January 2017
2
Contents
Foreword: Union Budget FY18 provides cautious support to growth ....................................... 3
Highlights of January .......................................................................................................... 3
1 Growth: significant upward revision to FY16 GDP growth as investment growth accelerates 4
2 Inflation: declining food prices push CPI inflation to a 25-month low ................................. 6
3 Fiscal performance: cumulated fiscal deficit at 94% of annual revised target by December 2016 ................................................................................................................................. 7
4 In focus: Union Budget takes a cautious approach to supporting growth ............................ 9
5 Money and finance: growth in bank credit fell to 5.1% in December 2016 ........................ 11
6 External sector: growth in exports remain positive but imports slow down ....................... 13
7 Global economy: Fed kept the policy rate steady in January 2017 .................................. 14
8 Index of aggregate demand: contracts in November 2016 .............................................. 15
9 Appendix: capturing macro-fiscal trends........................................................................ 16
List of abbreviations:
Sr. no Indicator Description
1 CAB Current account balance 2 CPI Consumer Price Index 3 CSO Central Statistical Organization 4 EMDEs Emerging market and developing economies 5 FII Foreign investment inflows 6 FPI Foreign portfolio investment 7 FY Fiscal year (April—March) 8 GFCE Government final consumption expenditure 9 GFCF Gross fixed capital formation
10 GST Goods and Services Tax 11 GVA Gross value added 12 IDS Income Declaration Scheme 13 IAD Index of aggregate demand 14 IIP Index of industrial production 15 IMF International Monetary Fund 16 MCLR Marginal cost of funds based lending rate 17 MPC Monetary Policy Committee 18 NDU Non Departmental Undertaking 19 NEXP Net exports (exports minus imports of goods and services) 20 NPA Non-performing asset 21 OPEC Organization of Petroleum Exporting Countries 22 PFCE Private final consumption expenditure 23 PMI Purchasing Managers’ Index (reference value = 50) 24 PSU Public sector undertaking 25 WPI Wholesale Price Index 26 y-o-y Year on year 27 m-o-m Month-on-month
Prepared by Policy Group, EY India
D. K. Srivastava, Chief Policy Advisor, EY: [email protected] Muralikrishna Bharadwaj, Manager, EY: [email protected] Tarrung Kapur, Senior Consultant, EY: [email protected] Ragini Trehan, Consultant, EY: [email protected]

Economy Watch January 2017
3
Foreword: Union Budget FY18 provides cautious support to growth
Highlights of January
GDP growth in India has fallen well below its potential level, estimated to be in the range of 8%—10% by the Economic Survey 2016—17 (Survey), because of a continuing investment slowdown, accentuated by a demonetization-linked consumption slowdown. Given the weak export demand and global policy uncertainties, India will have to largely rely on domestic policy initiatives to uplift growth to its potential level.
Ground for a strong fiscal stimulus was prepared by the FRBM Review Committee, which submitted its report immediately preceding the Budget presentation. This Committee recommended relaxation of the fiscal deficit target up to a margin of 0.5% points of GDP in the presence of “far-reaching structural reforms with unanticipated fiscal implications.” Demonetization clearly constitutes such a structural reform. The Survey berated the rating agencies (Refer to Box 1, page 4, Economic Survey 2016-17,’ Poor Standards? The Rating Agencies, China & India’) and argued that the comparators used for assessing India are not appropriate. India has a strong growth trajectory and has shown commitment to fiscal discipline. In fact, India might be able to carry much more debt than other countries. Thus, the Finance Minister could have taken the benefit of larger borrowing to stimulate the economy by retaining the fiscal deficit target of 3.5% of GDP for FY18.
However, the Finance Minister chose to remain cautious by limiting the revision in the fiscal deficit target from its earlier announced path to only 3.2%. This does not provide an adequate push to capital expenditure in FY18 which is budgeted to fall from 1.9% to 1.8% of GDP. We also note that the monetary policy stimulus would not be effective until inventories are exhausted by a strong fiscal stimulus. Additional borrowing by the public sector to finance the fiscal stimulus at the present juncture would not crowd out private investment because of an increase in financial savings linked to the surge in bank deposits as a result of demonetization.
The global situation does not warrant much optimism, as the policies of economies such as the US and other advanced countries are becoming more inward-oriented. The global growth slowdown, fall in the growth rate of the global population as also fall in overall productivity imply that high export growth phases may be few and far between from now on. The global crude prices and the prices of primary articles are also firming up. Under these circumstances, in order to take the maximum advantage of India’s unfolding demographic dividend, reliance has to be placed largely on domestic policy initiatives. This is why India needs to provide a stronger fiscal stimulus than what is proposed in the Budget. We consider the following options to be useful: first, the Center’s fiscal deficit may be kept at 3.5% of GDP in FY18; second, states should also be allowed to go up to 3.5% of GDP as far as their consolidated fiscal deficit is concerned; and, third, departmental and non-departmental public sector enterprises should be induced to undertake their expansion plans by investing to the extent of at least 0.75% points of GDP. These initiatives may be supplemented by a progressive increase in the tax-GDP ratio, which should become feasible with the implementation of GST and demonetization-linked digitization.
D.K. Srivastava, Chief Policy Advisor, EY India
1. Budget FY18 and the Survey recognize the demonetization-linked growth slowdown. This could be in the range of 1.15%—1.4% points of GDP.
2. As per the CSO’s latest GDP advance estimates for FY17, growth in PFCE has slowed down to 5.5% and investment growth, as measured by GFCF, has become stagnant at 0%. On the output side, GVA growth in FY17 has fallen to 6.5%.
3. Annual CPI inflation declined to a 25-
month low of 3.4% in December 2016 because of a sharp fall in food prices. CPI inflation has fallen sharply from its previous peak of 6.1% (y-o-y) in July 2016.
4. WPI inflation marginally increased to
3.4% in December 2016 to converge with CPI inflation after a long gap.
5. Cumulated fiscal deficit stood at 94% of
the annual revised estimate up till December 2016. According to Budget FY18, the target of 3.5% of GDP for FY17 is expected to be met. However, a small moderation in the FY18 fiscal deficit target at 3.2% of GDP has been budgeted.
6. The FRBM Review Committee, which
submitted its report immediately preceding the Budget presentation, recommended anchoring fiscal discipline to debt rather than fiscal deficit relative to GDP and suggested flexibility in the fiscal deficit target to the extent of 0.5% points of GDP in case of “far-reaching structural reform in the economy with unanticipated fiscal implications.”
7. Growth in bank credit fell to 5.1% in
December 2016, reflecting demonetization-linked contraction.
8. The IMF projected global growth at 3.1%
in 2016 and an increase to 3.4% in 2017 due to improved growth outlook for both advanced and emerging economies, particularly China. However, a major challenge relates to the uncertainty regarding US policies and their global ramifications

Economy Watch January 2017
4
A. GDP growth
► As per the CSO’s First Revised Estimates of National Income Accounts, India’s real GDP is estimated to have
grown by 7.9% in FY16 as compared to the earlier provisional estimate of 7.6% released in May 2016.
► GFCF was estimated to have grown by 6.1% in FY16 relative to the earlier estimate of just 3.9%. A significant
upward revision in the growth of GFCF (by 2.2% points) was largely responsible for driving the overall growth
upward in FY16. In addition, growth in GCE was also revised upward to 2.9% as compared to 2.2%.
► Both exports and imports contracted in FY16. However, growth in imports at (-) 5.9% contracted at a faster
rate. As a result, the contribution of net exports (exports less imports) was marginally positive at 0.2%
points.
► On the production side, growth in industrial and services sector for FY16 was revised upward. Accordingly,
the GVA growth in the industrial and services sectors are 8.2% and 9.8%, respectively, in FY16 (Table A6).
The overall GVA growth has been revised upward to 7.8%.
► As per the RBI’s February 2017 monetary policy statement, GVA growth for FY17 is projected at 6.9% and
at 7.4% for FY18.
► Using the latest revised GDP and GVA estimates for FY16 as given by the CSO release on 31 January 2017,
in conjunction with the advanced estimates for FY17 released earlier, which did not account for the impact
of demonetization, GDP and GVA growth rates for FY17 have been re-estimated at 7.0% and 6.5%,
respectively (Tale 1).
► Growth in PFCE has slowed to 5.5% in FY17 and investment growth, as measured by GFCF, has become
stagnant at 0%. GCE is expected to be the second-largest driver of domestic demand in FY17, with estimated
growth of 26.5%.
► A number of key sectors account for the growth slowdown. These include manufacturing (5.0%), transport
and communication services (6.5%), financial services (6.8%) and mining ((–) 9.4%). The main driver of
growth in FY17 is public administration, which is estimated to grow by 15.6%, largely due to the upward
revision in the salaries for government employees.
1 Growth: significant upward revision to FY16 GDP growth as investment growth accelerates
Table 1: real GDP growth (%) AD component
FY13 FY14 FY15 FY16 FY17
PFCE 5.3 7.4 6.8 7.3 5.5 GCE 0.7 0.6 9.4 2.9 26.5 GFCF 4.8 1.8 4.1 6.1 0.0
EXP 6.8 7.8 1.7 -5.4 2.2 IMP 6.0 -8.1 0.8 -5.9 -0.8
GDP 5.5 6.5 7.2 7.9 7.0 Of which % contribution of discrepancies 1.0 -1.1 -0.5 1.3 1.7
Table 2: sectoral real GVA growth (%)
Sector FY13 FY14 FY15 FY16 FY17
Agr 1.5 5.6 -0.3 0.8 3.3 Ming. -0.6 3.1 14.7 12.3 -9.4 Mfg. 5.9 5.1 7.5 10.6 5.0 Elec. 2.5 4.0 7.2 5.1 9.7 Cons. 0.6 3.0 3.0 2.8 7.2 Trans. 9.7 6.8 8.6 10.7 6.5 Fin. 9.7 11.0 11.1 10.8 6.8 Publ. 4.3 3.8 8.1 6.9 15.6 GVA 5.4 6.2 6.9 7.8 6.5
Source: (Basic data) MOSPI Source: (Basic data) MOSPI

Economy Watch January 2017
5
B. Industrial growth: core sector output shows signs of recovery in December
► Growth in IIP turned positive in November 2016 (Chart 1) as it recovered to 5.7% (y-o-y) from (-) 1.8% in
October 2016, driven by a favorable base effect. However, the m-o-m growth numbers indicate that IIP
contracted for two successive months in October ((-) 0.7%) and November ((-) 1.3%).
► On an m-o-m basis, the manufacturing sector continued to contract at (-) 1.3% in November 2016. In
October it had contracted by (-) 2.6%. The electricity sector also contracted by (-) 6.2% in November 2016
as compared to a growth of 1.7% in October 2016.
► As per use-based industrial classification, the capital goods industry grew by 15.0% (y-o-y) in November
2016, reversing its contractionary trend since November 2015, partly owing to a favorable base effect.
The consumer goods industry grew by 5.6% in November as compared to a decline of (-) 1.6% (y-o-y) in
October 2016.
► Growth in the output of eight core infrastructure industries recovered to 5.6% (y-o-y) in December 2016
from 4.9% in November 2016. This improvement was driven by higher growth in the output of steel (14.9%)
and petroleum refinery (6.4%). However, growth in the output of crude oil ((-) 0.8%) and cement ((-8.7%)
contracted in December.
Chart 1: IIP and core IIP growth (% y-o-y)
Source: Office of the Economic Adviser, Ministry of Commerce and Industry
Chart 2: NIKKEI PMI
Source: NIKKEI PMI, Markit Economics
C. PMI: signals a recovery in manufacturing and easing contraction in services in January 2017
► After contracting in December for the first time in the year, the headline manufacturing PMI (sa)
recovered from 49.6 to 50.4 in January 2017 (Chart 2). There was a modest growth in both new orders
and output as compared to the steep contraction observed during the last month.
► Headline services PMI (sa) remained in the contraction territory at 48.7 in January 2017 (46.8 in
December 2016) as new orders and activity fell for the third straight month. However, the rate of
contraction was the slowest in the current three months sequence of reduction.
► Composite PMI Output Index (sa) increased from December’s 38-month low of 47.6 to 49.4 in January
2017, pointing to a weaker contraction in private sector activity. The easing pace of contraction was
supported by a rebound in factory production.
-6
-3
0
3
6
9
12
De
c 1
4
Fe
b 1
5
Ap
r 1
5
Ju
n 1
5
Au
g 1
5
Oct
15
De
c 1
5
Fe
b 1
6
Ap
r 1
6
Ju
n 1
6
Au
g 1
6
Oct
16
De
c 1
6IIP (core) IIP (overall)
42
44
46
48
50
52
54
56
58
60
Ja
n 1
3
Ap
r 1
3
Ju
l 1
3
Oct
13
Ja
n 1
4
Ap
r 1
4
Ju
l 1
4
Oct
14
Ja
n 1
5
Ap
r 1
5
Ju
l 1
5
Oct
15
Ja
n 1
6
Ap
r 1
6
Ju
l 1
6
Oct
16
Ja
n 1
7
PMI (mfg.) PMI (ser.) Benchmark
PMI signals marginal recovery in the manufacturing sector in January 2017, while the services sector continued to contract.
Growth in core sector output improved to 5.6% in December. In November 2016, the IIP growth had turned positive at 5.7% owing to a favorable base effect.

Economy Watch January 2017
6
Annual CPI inflation declined to a 25-month low of 3.4% in December 2016 due to a sharp fall in food prices. CPI inflation has fallen from its previous peak of 6.1% (y-o-y) in July 2016.
► CPI-based inflation (Chart 3) declined to 3.4% in December 2016 as compared to 3.6% in November 2016.
► Core CPI inflation (excluding food and fuel) declined marginally to 4.9% after rising to 5.0% in November
2016 (y-o-y).
► CPI-based consumer food inflation has been declining since July 2016 when it had reached a 23-month
peak of 8.4%. It declined to 1.4% in December 2016.
► Fuel and lighting inflation reached a 10-month high of 3.8% as compared to 2.8% in the previous month.
► According to the RBI, the contraction in demand as a result of demonetization was partly responsible for
the decline in the prices of vegetables.
Chart 3: inflation (y-o-y; %)
Source: Ministry Of Statistics and Programme Implementation (MOSPI)
WPI inflation increased for the first time in six months, rising marginally to 3.4% in December 2016 from 3.2% (y-o-y) in November 2016 because of a decline in the prices of primary articles.
► WPI inflation for primary articles reached a 14-month low of 0.3% in December 2016 from 1.2% in
November 2016. Within primary articles, WPI inflation in food articles turned negative for the first time in
16 months, reaching (-) 0.7% in December. The persistent decline in the inflation in non-food articles was
marginally arrested as it increased to 0.6% in December 2016 from (-) 0.1% in the previous month.
► Inflation in fuel and power climbed to a 29-month high of 8.7% in December 2016 as compared to 7.1% in
November 2016. Inflation in diesel prices reached a 40-month high of 20.3% in December 2016.
► After contracting for 16 successive months till June 2016, WPI core inflation turned positive and
increased for the fifth successive month at 2.2% in December as compared to 1.6% in November 2016.
► Inflation in minerals and basic metals and alloys was at four-year high levels of 12.9% and 5.4%,
respectively.
► WPI and CPI based inflation rates started to diverge after February 2012. This divergence reached a peak
of 9% points in September 2015, after which the rates started to converge gradually. In December 2016,
they again converged after a gap of four years.
-6
-4
-2
0
2
4
6
8
10
12
14
De
c 1
3
Fe
b 1
4
Ap
r 1
4
Ju
n 1
4
Au
g 1
4
Oct
14
De
c 1
4
Fe
b 1
5
Ap
r 1
5
Ju
n 1
5
Au
g 1
5
Oct
15
De
c 1
5
Fe
b 1
6
Ap
r 1
6
Ju
n 1
6
Au
g 1
6
Oct
16
De
c 1
6
New CPI inflation WPI inflation
Inflation target: upper end Inflation target: lower end
2 Inflation: declining food prices push CPI inflation to a 25-month low
According to the Monetary Policy Review in February 2017, headline CPI inflation in 4QFY17 is likely to be below 5%. The RBI estimates CPI inflation to be in the range of 4%—4.5% in 1HFY18 and 4.5%—5% in 2HFY18.

Economy Watch January 2017
7
A. Tax and non-tax revenues
► The Center’s revenue receipts during April—December FY17 were 65.6% of the annual revised target as
compared to 66.6% during the same period of FY16.
► Growth in cumulated gross tax revenues was lower at 18.3% during April—December FY17, compared to
21.1% during the corresponding period of FY16 (Chart 4). This was led by a higher growth in indirect
taxes at 25.5%. Growth in direct taxes was at 10.7% during April—December FY17.
► Within direct taxes, income tax revenues grew by 20.5% during April—December FY17 (Chart5) as
compared to 11.7% during the same period of FY16. This included the effect of IDS1 and IDS2 linked to
the income disclosures under the Pradhan Mantri Garib Kalyan Yojana (PMGKY) Deposit Scheme. On the
other hand, growth in corporation tax revenues remained sluggish at 4.8% during April—December FY17
as compared to the corresponding value of 10.1% in FY16.
► Among indirect taxes, Union excise duties witnessed a strong growth of 43.7% during April—December
FY17 due to the additional duties levied on petroleum products which contributed almost 70% to the total
excise collections in 1HFY17. Growth in service tax revenues was also high at 25% during April—December
FY17.
► Growth in customs duties remained subdued at 4.9% during April—December FY17 because of contraction
in imports, particularly gold imports.
► Growth in non-tax revenues was at 0.5% during April—December FY17 as compared to 22.6% in the
corresponding period of FY16. This implies that for realizing the revised estimates for non-tax revenue
growth for FY17 given in Budget FY18, non-tax revenues are required to grow by 118.5% (y-o-y) in the
last quarter of FY17.
► Disinvestment receipts stood at INR31, 014 crore during April—January FY17, which is 68.2% of the
annual revised estimate for FY17. For realizing the revised estimates of FY17 as given in Budget FY18
additional disinvestment amounting to INR14, 486 crores would be required.
B. Expenditures: revenue and capital
► Total expenditure grew by 11.9% during April—December FY17 as compared to the corresponding value of
6.3% in FY16.
3 Fiscal performance: cumulated fiscal deficit at 94% of annual revised target by December 2016
Chart 4: growth in cumulated gross tax revenues up to December 2016
Chart 5: growth in cumulated tax revenues up to December 2016
12.215.0
9.27.0
21.1
18.3
0
5
10
15
20
25
FY12 FY13 FY14 FY15 FY16 FY17
-20
0
20
40
60
80
FY12 FY13 FY14 FY15 FY16 FY17
Corporate Tax Income Tax Custom Duty
Excise Duty Service Tax
Source: Monthly Accounts, Controller General of Accounts, Government of India
The Center’s gross tax revenues grew by 18.3% during April—December FY17, driven by robust growth in revenues from income tax, union excise duties and service tax. Growth in non-tax revenues during this period was negligible at 0.5%.
Economy Watch January 2017
8
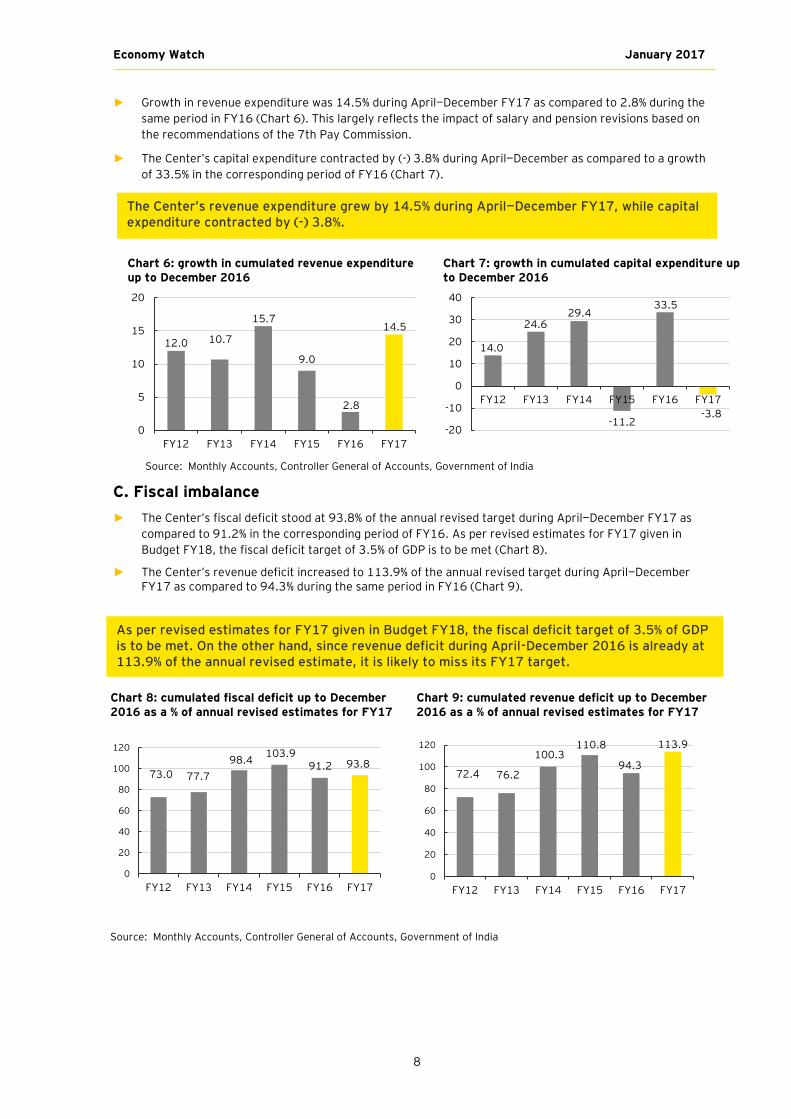
► Growth in revenue expenditure was 14.5% during April—December FY17 as compared to 2.8% during the
same period in FY16 (Chart 6). This largely reflects the impact of salary and pension revisions based on
the recommendations of the 7th Pay Commission.
► The Center’s capital expenditure contracted by (-) 3.8% during April—December as compared to a growth
of 33.5% in the corresponding period of FY16 (Chart 7).
C. Fiscal imbalance
► The Center’s fiscal deficit stood at 93.8% of the annual revised target during April—December FY17 as
compared to 91.2% in the corresponding period of FY16. As per revised estimates for FY17 given in
Budget FY18, the fiscal deficit target of 3.5% of GDP is to be met (Chart 8).
► The Center’s revenue deficit increased to 113.9% of the annual revised target during April—December FY17 as compared to 94.3% during the same period in FY16 (Chart 9).
Chart 8: cumulated fiscal deficit up to December 2016 as a % of annual revised estimates for FY17
Chart 9: cumulated revenue deficit up to December 2016 as a % of annual revised estimates for FY17
73.0 77.7
98.4103.9
91.2 93.8
0
20
40
60
80
100
120
FY12 FY13 FY14 FY15 FY16 FY17
72.4 76.2
100.3110.8
94.3
113.9
0
20
40
60
80
100
120
FY12 FY13 FY14 FY15 FY16 FY17
Chart 6: growth in cumulated revenue expenditure up to December 2016
Chart 7: growth in cumulated capital expenditure up to December 2016
12.0 10.7
15.7
9.0
2.8
14.5
0
5
10
15
20
FY12 FY13 FY14 FY15 FY16 FY17
14.0
24.629.4
-11.2
33.5
-3.8
-20
-10
0
10
20
30
40
FY12 FY13 FY14 FY15 FY16 FY17
Source: Monthly Accounts, Controller General of Accounts, Government of India
As per revised estimates for FY17 given in Budget FY18, the fiscal deficit target of 3.5% of GDP is to be met. On the other hand, since revenue deficit during April-December 2016 is already at 113.9% of the annual revised estimate, it is likely to miss its FY17 target.
Source: Monthly Accounts, Controller General of Accounts, Government of India
The Center’s revenue expenditure grew by 14.5% during April—December FY17, while capital expenditure contracted by (-) 3.8%.

Economy Watch January 2017
9
India’s November 8 demonetization of high-denomination currency amounting to INR15.44 trillion, i.e., 86.1% of the currency in circulation at that time, was by all accounts a disruptive economic move. The Survey estimates the extent of demonetization-linked erosion in GDP growth in FY17 to be in the range of 0.25%—0.50% points. This implies that the real GDP growth in FY17 would be in the range of 6.50%—6.75%, given the growth rate of 7% for FY17 as estimated by the CSO without taking into account the effect of demonetization. Taken together, these imply a reduction in FY17 GDP growth in the range of 1.15%-1.40% points as compared to the growth of 7.9% achieved in FY16 as per the latest CSO release (31 January 2017). This “demonetization dip” in the growth rate, as shown in Chart 10 can clearly qualify as a “far-reaching structural reform in the economy with unanticipated fiscal implications.” The FRBM Review Committee has recommended that in the presence of such a structural reform, there would be a case for deviating from the fiscal deficit target of 3% of GDP. The Committee recommended a flexibility of up to 0.5% points. This flexibility should be invoked if recommended by a “fiscal council.” It also suggested that fiscal discipline be anchored to debt rather than the fiscal deficit relative to GDP. For the medium term, it suggested that the desired target should be a consolidated debt-GDP ratio of 60%, of which 40% could be central debt and 20% could be consolidated state debt. Both these provisions provided enough justification for taking up a strong fiscal stimulus in Budget FY18 for uplifting India’s economic growth closer to its potential, which the Survey quantifies to be in the range of 8%—10%.
Constraints to India’s growth
Apart from demonetization, which would have a short-term impact, there are longer-term constraints emanating from a slowing down of investment demand and a weakening of global demand for India’s exports. With the changed political situation in the US as also Brexit, the world economy is entering into an era of “de-globalization,” which could adversely affect India’s growth prospects. First, there might be a possibility of eruption of trade tensions among major countries, impacting India’s exports. Second, there could be competition among major players in lowering corporate tax rates to attract capital. Third, with the US incrementally uplifting the Fed rate, there would be steady pressure on the Indian rupee.
As Table 3 shows, gross fixed capital formation had started to contract in the last quarter of FY16. The magnitude of this contraction increased in the first and second quarters of FY17. Furthermore, the CSO’s latest release shows that even private final consumption expenditure slowed down considerably with an annual growth of 5.5% in FY17 compared to 7.3% in FY16. There were other indicators of the post-demonetization slowdown in terms of a sharp fall in bank credit growth and PMI for manufacturing and services, which fell below the threshold of 50 in December 2016, indicating contraction.
Financing fiscal stimulus
The Survey also berated the rating agencies (Refer to Box 1, page 4, Economic Survey 2016-17,’ Poor Standards? The Rating Agencies, China & India’). The Survey argues that India is very different from the comparators used by the rating agencies. India has a strong growth trajectory and has shown commitment to fiscal discipline. In fact, India might be able to carry much more debt than other countries. In other words, both the FRBM Review Committee and the observations of the Survey on the rating agencies created ground for the Finance Minister to retain fiscal deficit at 3.5% of GDP in FY18, the same as in FY17, to support demand. However, he chose to allow for a minor increase by retaining fiscal deficit at 3.2% of GDP, which could enable a growth of 10.7% in capital expenditure in FY18 (Table 4). Demand can also be additionally supported through various other channels. First, the Government can access a one-time fiscal windfall linked to currency extinguishment, which has not been factored in Budget FY18. The extent of this gain could be as much as 0.5% of GDP. Second, many states that are asking for a relaxation of their borrowing norms due to revenue erosion as
4 In focus: Union Budget takes a cautious approach to supporting growth
Table 3: Real GDP growth (%)
AD component
2Q FY16
3Q FY16
4Q FY16
1Q FY17
2Q FY17
FY16 FY17
PFCE 6.3 8.2 8.3 6.7 7.6 7.3 5.5 GCE 3.3 3 2.9 18.8 15.2 2.9 26.5 GFCF 9.7 1.2 -1.9 -3.1 -5.6 6.1 0 EXP -4.3 -8.9 -1.9 3.2 0.3 -5.4 2.2 IMP -0.6 -6.4 -1.6 -5.8 -9 -5.9 -0.8 GDP 7.6 7.2 7.9 7.1 7.3 7.9 7 Of which % contribution of disc.
1.2 2.1 4.1 0.9 1.5 1.3 1.7
Source (Basic Data): MOSPI, Annual data has been taken from the CSO Release dated 31 January 2017
Chart 10: Annual GDP growth (%) up till FY22
Source (Basic Data): IMF
6.6
7.2
5.0
5.5
6.0
6.5
7.0
7.5
8.0
8.5
FY13 FY14 FY15 FY16 FY17 FY18 FY19 FY20 FY21 FY22
Demonetization dip
Economy Watch January 2017
10
a result of the slowdown can together be allowed an additional borrowing up to 0.5% of GDP. Borrowing 0.5% points above the FY18 target of 3% of GDP would be justifiable noting that the consolidated Government’s debt-GDP ratio fell to 69% in 2015 from its peak of 84% in 2003. However, the Survey recognizes that state finances are under stress with their consolidated fiscal deficit going up from 2.5% of GDP in 2014—15 to 3.6% of GDP in 2015—16, partly because of the UDAY scheme.
Third, departmental enterprises such as Posts and Railways and non-departmental public enterprises can be persuaded to take up their expansion plans given the prevailing low prices of investment goods. Their borrowing, largely off budget, can add another 0.5% of GDP to the fiscal stimulus. Together, these channels could provide a stimulus amounting to 2.0% of GDP. Most of this stimulus should be directed toward augmenting infrastructure. Qualitatively, some push to construction, housing and manufacturing, particularly the automobile sector, through sector-specific incentives should help these demonetization-afflicted sectors.
Sequencing fiscal and monetary policy
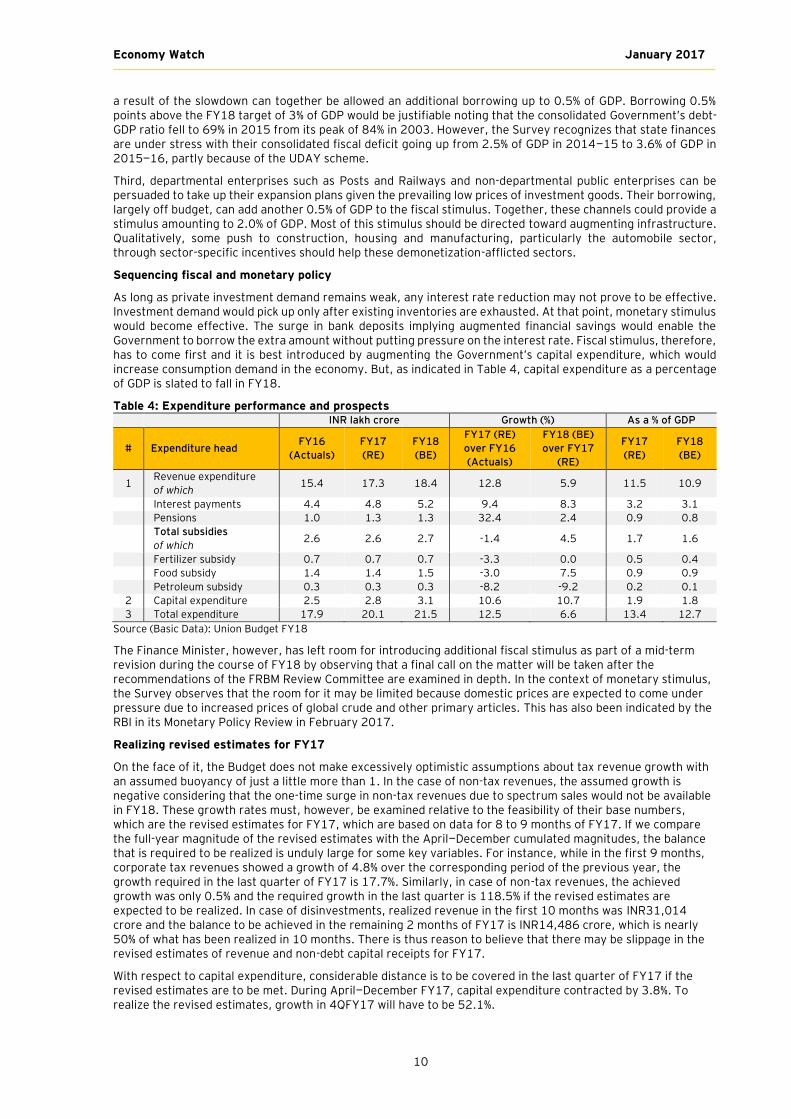
As long as private investment demand remains weak, any interest rate reduction may not prove to be effective. Investment demand would pick up only after existing inventories are exhausted. At that point, monetary stimulus would become effective. The surge in bank deposits implying augmented financial savings would enable the Government to borrow the extra amount without putting pressure on the interest rate. Fiscal stimulus, therefore, has to come first and it is best introduced by augmenting the Government’s capital expenditure, which would increase consumption demand in the economy. But, as indicated in Table 4, capital expenditure as a percentage of GDP is slated to fall in FY18.
Table 4: Expenditure performance and prospects INR lakh crore Growth (%) As a % of GDP
# Expenditure head FY16
(Actuals)
FY17
(RE)
FY18
(BE)
FY17 (RE)
over FY16
(Actuals)
FY18 (BE)
over FY17
(RE)
FY17
(RE)
FY18
(BE)
1 Revenue expenditure
of which 15.4 17.3 18.4 12.8 5.9 11.5 10.9
Interest payments 4.4 4.8 5.2 9.4 8.3 3.2 3.1 Pensions 1.0 1.3 1.3 32.4 2.4 0.9 0.8
Total subsidies
of which 2.6 2.6 2.7 -1.4 4.5 1.7 1.6
Fertilizer subsidy 0.7 0.7 0.7 -3.3 0.0 0.5 0.4 Food subsidy 1.4 1.4 1.5 -3.0 7.5 0.9 0.9 Petroleum subsidy 0.3 0.3 0.3 -8.2 -9.2 0.2 0.1
2 Capital expenditure 2.5 2.8 3.1 10.6 10.7 1.9 1.8
3 Total expenditure 17.9 20.1 21.5 12.5 6.6 13.4 12.7
Source (Basic Data): Union Budget FY18
The Finance Minister, however, has left room for introducing additional fiscal stimulus as part of a mid-term revision during the course of FY18 by observing that a final call on the matter will be taken after the recommendations of the FRBM Review Committee are examined in depth. In the context of monetary stimulus, the Survey observes that the room for it may be limited because domestic prices are expected to come under pressure due to increased prices of global crude and other primary articles. This has also been indicated by the RBI in its Monetary Policy Review in February 2017.
Realizing revised estimates for FY17
On the face of it, the Budget does not make excessively optimistic assumptions about tax revenue growth with an assumed buoyancy of just a little more than 1. In the case of non-tax revenues, the assumed growth is negative considering that the one-time surge in non-tax revenues due to spectrum sales would not be available in FY18. These growth rates must, however, be examined relative to the feasibility of their base numbers, which are the revised estimates for FY17, which are based on data for 8 to 9 months of FY17. If we compare the full-year magnitude of the revised estimates with the April—December cumulated magnitudes, the balance that is required to be realized is unduly large for some key variables. For instance, while in the first 9 months, corporate tax revenues showed a growth of 4.8% over the corresponding period of the previous year, the growth required in the last quarter of FY17 is 17.7%. Similarly, in case of non-tax revenues, the achieved growth was only 0.5% and the required growth in the last quarter is 118.5% if the revised estimates are expected to be realized. In case of disinvestments, realized revenue in the first 10 months was INR31,014 crore and the balance to be achieved in the remaining 2 months of FY17 is INR14,486 crore, which is nearly 50% of what has been realized in 10 months. There is thus reason to believe that there may be slippage in the revised estimates of revenue and non-debt capital receipts for FY17.
With respect to capital expenditure, considerable distance is to be covered in the last quarter of FY17 if the revised estimates are to be met. During April—December FY17, capital expenditure contracted by 3.8%. To realize the revised estimates, growth in 4QFY17 will have to be 52.1%.

Economy Watch January 2017
11
A. Monetary sector
i. Monetary policy
► All members of the RBI’s Monetary Policy Committee unanimously voted in favor of retaining the policy
repo rate at 6.25% (Chart 11) in its Monetary Policy Review held on 8 February 2017 as underlying risks to
inflation persisted. The policy statement indicated that core CPI inflation, which excludes food and fuel
components, has been sticky at 4.9% since September 2016.
► The RBI assesses upward risks to inflation as arising from (a) hardening of international crude prices, (b)
increased volatility in exchange rate and (c) fuller effects of the house rent allowance on CPI inflation.
ii. Money stock
► Growth in broad money (M3) plummeted further to 6.6% (y-o-y) in December 2016 from 8.5% (y-o-y) in
November 2016 (Table A4). Growth in time deposits, accounting for over 76% of the broad money stock,
slowed to 13.6% from its 31-month peak of 14.3% in November 2016.
► Narrow money (M1) contracted further to (-) 18.6% in December 2016 as compared to (-) 12.3% in
November 2016 (Chart 12). Growth in currency in circulation declined further to (-) 39.9% in December
2016 from (-) 23.6% in November 2016. Cash withdrawal limits imposed by the RBI coupled with a slow re-
monetization process were responsible for this contraction.
iii. Aggregate credit and deposits
► Growth in bank credit fell to a historic low of 5.1% (y-o-y) in December 2016 from 6.2% (revised) in
November 2016 (Chart 13). Growth in non-food credit fell to 5.3% in December 2016 from 6.5% (revised)
in November 2016, while food credit contracted at a slower pace of (-) 5.4% during the month. Even
though the lending rates are lowered, continued weakness in demand is likely to constrain the growth of
credit.
► The y-o-y growth of personal loans, a key driver of non-food credit growth, fell to a 27-month low of
13.5% in December 2016 (Chart 14) as compared to 15.2% in November. Credit to industries contracted
at an increasing magnitude of (-) 4.3% in December 2016 as compared to (-) 3.4% in November. The
Survey observed that growth in credit offtake has been constrained as the corporate and banking sector
balance sheets remained under stress during this year.
► Growth in aggregate bank deposits marginally slowed to 15.2% (y-o-y) in December 2016 as compared to
15.6% (revised) in November 2016. With the re-monetization process expected to be completed early in
the next fiscal year, the trend of increasing bank deposits is likely to be reversed.
5 Money and finance: growth in bank credit fell to 5.1% in December 2016
Chart 11: movements in repo rate
Chart 12: growth in narrow and broad money
6.25
4
5
6
7
8
9
10
Fe
b 1
0
Au
g 1
0
Fe
b 1
1
Au
g 1
1
Fe
b 1
2
Au
g 1
2
Fe
b 1
3
Au
g 1
3
Fe
b 1
4
Au
g 1
4
Fe
b 1
5
Au
g 1
5
Fe
b 1
6
Au
g 1
6
Fe
b 1
7
Repo rate
-25
-15
-5
5
15
25
De
c 0
9
Ju
n 1
0
De
c 1
0
Ju
n 1
1
De
c 1
1
Ju
n 1
2
De
c 1
2
Ju
n 1
3
De
c 1
3
Ju
n 1
4
De
c 1
4
Ju
n 1
5
De
c 1
5
Ju
n 1
6
De
c 1
6
Narrow money (M1) Broad money (M3)
Source: Data Base on Indian Economy, RBI
The RBI kept the policy repo rate unchanged at 6.25% in February 2017. The decision was based on the premise that risks to inflation are on the rise and the underlying core CPI inflation had remained at 4.9% since September 2016 despite a fall in the headline CPI
inflation.

Economy Watch January 2017
12
Chart 13: growth in credit and deposits
Chart 14: growth in industrial and personal loans
B. Financial sector
i. Interest rates
► The MCLR was maintained at 8.65% in December 2016. Since its introduction in April 2016, the MCLR rate
has been cut down by a total of 30 basis points.
► Banks lowered the interest rates on term deposits (>1 year) to 6.79% in December 2016 from 6.88% (mid-
point) in November 2016.
► The average yield on 10-year Government bonds fell further to 6.53% in December 2016 from 6.61% in
November 2016. Demonetization of high-denominated currency has led to huge buildup of liquidity in the
banking system, pushing down the bond yields.
ii. FPI and stock market
► The benchmark S&P NIFTY index fell
further to 8,114 points in December
2016 (average) losing nearly 137
points as compared to the average
index value of 8251 points in November
2016 (Chart 15). Markets responded
negatively to the RBI’s decision to
withhold its policy rate leading to an
increased outflow of foreign portfolio
investments.
► As per provisional data, overall FIIs
continued to remain negative for the
second consecutive month, registering
a net outflow of US$1.0 billion in
December 2016 similar to the level of
outflows seen in November 2016. Net FPI outflows moderated to US$ 4.0 billion in December 2016 from
US$5.5 billion in November 2016. Sustained outflows of FPIs dented the stock market performance during
December 2016. Moreover, net FDI inflows slowed to US$3.1 billion in December as compared to US$4.5
billion November 2016.
0
5
10
15
20
25
30D
ec
07
Ju
n 0
8
De
c 0
8
Ju
n 0
9
De
c 0
9
Ju
n 1
0
De
c 1
0
Ju
n 1
1
De
c 1
1
Ju
n 1
2
De
c 1
2
Ju
n 1
3
De
c 1
3
Ju
n 1
4
De
c 1
4
Ju
n 1
5
De
c 1
5
Ju
n 1
6
De
c 1
6
Aggregate deposits (% ann)Bank credit (% ann)
Source: Data Base on Indian Economy, RBI
-10
0
10
20
30
40
No
v 0
8
Ma
y 0
9
No
v 0
9
Ma
y 1
0
No
v 1
0
Ma
y 1
1
No
v 1
1
Ma
y 1
2
No
v 1
2
Ma
y 1
3
No
v 1
3
Ma
y 1
4
No
v 1
4
Ma
y 1
5
No
v 1
5
Ma
y 1
6
No
v 1
6
Credit to industry (% ann)Personal loans (% ann)
Source: Data Base on Indian Economy, RBI
Chart 15: Stock market movement
010002000300040005000600070008000900010000
-10000-8000-6000-4000-2000
02000400060008000
1000012000
De
c-2
01
2
Ap
r-2
01
3
Au
g-2
01
3
De
c-2
01
3
Ap
r-2
01
4
Au
g-2
01
4
De
c-2
01
4
Ap
r-2
01
5
Au
g-2
01
5
De
c-2
01
5
Ap
r-2
01
6
Au
g-2
01
6
De
c-2
01
6
Net FPI US$ million (LHS) S&P CNX NIFTY Index (RHS)

Economy Watch January 2017
13
6 External sector: growth in exports remain positive but imports slow down
A. Current account balance
The CAB as a percentage of GDP deteriorated to (-) 0.6% in 2QFY17 (Table 5, Chart 17) from (-) 0.1% in the
previous quarter. Merchandise trade balance deteriorated to (-) US$25.6 billion in 2QFY17 from a seven-year
low of (-) US$23.8 billion in 1QFY17.
Table 5: current account balance (US$ billion)
CAB (- deficit/+surplus)
(US$ billion)
CAB as a % of
nominal GDP
Goods account net
(US$ billion)
Services account net (US$ billion)
Income account
net (US$ billion)
Transfers net
(US$ billion)
FY13 -88.2 -4.8 -195.7 64.9 -21.5 64.0
FY14 -32.4 -1.7 -147.6 73.0 -23.0 65.3
FY15 -26.8 -1.3 -144.9 76.6 -24.1 65.7
FY16 -22.0 -1.1 -130.1 53.7 -17.8 47.7
3QFY16 -7.1 -1.3 -34.0 18.0 -6.4 15.3
4QFY16 -0.3 -0.1 -24.8 16.1 -6.6 15.1
1QFY17 -0.3 -0.1 -23.8 15.8 -6.2 14.2
2QFY17 -3.4 -0.6 -25.6 16.3 -7.9 14.0
Source: Database on Indian Economy, RBI
B. Merchandise trade and exchange rate
► Growth in merchandise exports increased to 5.7% in December 2016 from 2.3% in November 2016. (Chart
16).
► There was a sharp increase in the growth of exports of gems and jewelry, which was at 27.9% in December
2016, as compared to a contraction of 12.8% in November 2016. Growth in exports of Drugs and
pharmaceuticals increased to 12.5%, the highest clocked in this fiscal so far.
► Growth in oil exports reached a 30-month peak of 8.2% in December 2016 from 3.4% in November 2016.
► Growth in overall imports declined to 0.5% in December 2016 from 3.5% in November, when it turned
positive for the first time after 22 successive months of contraction.
► Growth in oil imports reached a 33-month peak of 14.6% in December 2016 as compared to 5.9% in the
previous month.
► India’s merchandise trade deficit declined to US$10.4 billion in December 2016 as compared to US$13.0
billion in November 2016.
► The Indian rupee weakened to INR68.1 per US dollar in January 2017 from INR67.9 per US dollar in
December 2016 as a result of lower demand for Indian rupee in the aftermath of demonetization.
Chart 16: developments in merchandise trade
Chart 17: CAD
-60
-40
-20
0
20
40
60
-30
-20
-10
0
10
20
30
De
c 1
2
Ma
r 1
3
Ju
n 1
3
Se
p 1
3
De
c 1
3
Ma
r 1
4
Ju
n 1
4
Se
p 1
4
De
c 1
4
Ma
r 1
5
Ju
n 1
5
Se
p 1
5
De
c 1
5
Ma
r 1
6
Ju
n 1
6
Se
p 1
6
De
c 1
6
Trade balance (US$ billion, LHS)Exports (% ann, RHS)Imports (% ann, RHS)
Source: Ministry of Commerce and Industry
-8
-6
-4
-2
0
2
-40
-30
-20
-10
0
2Q
FY
11
4Q
FY
11
2Q
FY
12
4Q
FY
12
2Q
FY
13
4Q
FY
13
2Q
FY
14
4Q
FY
14
2Q
FY
15
4Q
FY
15
2Q
FY
16
4Q
FY
16
2Q
FY
17
CAD (US$ billion, LHS) CAD (% of GDP, RHS)
Source: Data Base on Indian Economy, RBI

Economy Watch January 2017
14
A. Global growth outlook
► The IMF, in its January update of World Economic Outlook, projected global growth at 3.1% in 2016. It is
expected to pick up pace to 3.4% in 2017 and 3.6% in 2018 (Chart 18).
► Growth projections for advanced economies have been
revised up to 1.9% for 2017 and 2% in 2018 due to stronger
activity in the second half of 2016 and a projected fiscal
stimulus in the US.
► The growth projections for the US have been revised
significantly upward to 2.3% in 2017 and 2.5% in 2018. The
US Fed, in its January 2017 Policy Meet, left the benchmark
interest rate in the range of 0.5%—0.75% unaltered,
although there was an improvement in the employment and inflation outlook.
► Growth in the Euro area is projected at 1.7% in 2016 and 1.6% in 2017. In the UK, GDP is projected to
grow by 2% in 2016 due to better-than expected growth in 3Q of 2016. The IMF has revised up its growth
forecast for the UK by 0.4% points to 1.5% in 2017. There has been an upward revision in the growth
forecast for Japan as well for 2017.
► The IMF has projected a substantial improvement in the growth outlook of EMDEs, which are projected to
grow by 4.1% in 2016 and 4.5% in 2017, reflecting a gradual normalization of conditions in a number of
large economies that are currently experiencing macroeconomic strains.
► Notably, growth in China has been revised up by 0.3% points to 6.5% in 2017 on expectations of continued
policy support. Growth forecasts for 2017 have been revised downward for Brazil and Mexico following
weaker-than-expected growth outcomes in the second half of 2016 and US-related uncertainty in Mexico.
Chart 18: Global growth projections
Chart 19: Global crude and coal prices
B. Global energy prices ► Global crude prices marginally increased to US$ 53.6/bbl in January 2017 from US$52.6/bbl in
December 2016 (Chart 19) as the production cuts commenced, but market participants awaited
conformation on reductions in output. The World Bank has projected crude prices to average $55/bbl in
2017, an increase of 26% over 2016, reflecting expected rising oil demand and tightening supply under
the assumption of partial compliance to the OPEC/ non-OPEC agreement. Prices are expected to average
US$60/bbl in 2018.
► After peaking at US$92/mt in November 2016, average global coal prices declined to US$ 84.2/mt in
January 2017 from US$86.0/mt in December 2016 as the Chinese Government relaxed rules to allow for
higher production. Coal prices are expected to average US$70/mt in 2017 because of supply additions
and weakening import demand. China’s coal policy will be a key determinant of global coal prices.
3.4
0.2
1.1
0.8
1.6
1.5
2.3
6.5
7.2
3.1
-3.5
-0.6
0.9
1.7
2.0
1.6
6.7
6.6
-5.0 0.0 5.0 10.0
Global growth
Brazil
Russia
Japan
Euro area
The UK
The US
China
India
2016
2017-100
-50
0
50
100
150
200
Ja
n 0
9
Ju
l 0
9
Ja
n 1
0
Ju
l 1
0
Ja
n 1
1
Ju
l 1
1
Ja
n 1
2
Ju
l 1
2
Ja
n 1
3
Ju
l 1
3
Ja
n 1
4
Ju
l 1
4
Ja
n 1
5
Ju
l 1
5
Ja
n 1
6
Ju
l 1
6
Ja
n 1
7
Coal average price (US$/mt)Coal inflation rate (% ann)Crude Oil (US$/brl)
Souce: World Bank, Pinksheet
7 Global economy: Fed kept the policy rate steady in January 2017
Source: World Economic Outlook Update, IMF (January 2017)
The IMF projected global growth at 3.1% in 2016 and an increase to 3.4% in 2017 due to an improved growth outlook for both advanced and emerging economies, particularly China. However, a major challenge relates to the uncertainty regarding US policies and their global ramifications.

Economy Watch January 2017
15
► An Index of Aggregate Demand (IAD) has been developed to reflect demand conditions in the agriculture,
manufacturing and services sectors on a monthly basis. It takes into account movements in PMI for
manufacturing and services, which traces the demand conditions in these sectors. Demand conditions in
the agricultural sector have been captured by movements in monthly agricultural credit off-take.
► The sectoral weights in constructing the IAD are based on their respective shares in nominal GVA in the
base year (2011—12): agriculture (18.4), industry (33.1) and services (48.5).
► The IAD contracted by (-) 1.8% in November 2016 from 8.8% in October 2016. (Chart 20). Growth in
credit to the agricultural sector, a proxy for demand conditions in the farm sector, fell to a 26-month low
of 15.6% in November 2016. Cash crunch due to demonetization took a toll on demand in the industrial
and services sectors, too, during November, leading to a contraction in overall demand.
Chart 20: growth in IAD (y-o-y)
Table 6: IAD
-1.8
-40
-30
-20
-10
0
10
20
30
40
No
v 0
8
Ma
r 0
9
Ju
l 0
9
No
v 0
9
Ma
r 1
0
Ju
l 1
0
No
v 1
0
Ma
r 1
1
Ju
l 1
1
No
v 1
1
Ma
r 1
2
Ju
l 1
2
No
v 1
2
Ma
r 1
3
Ju
l 1
3
No
v 1
3
Ma
r 1
4
Ju
l 1
4
No
v 1
4
Ma
r 1
5
Ju
l 1
5
No
v 1
5
Ma
r 1
6
Ju
l 1
6
No
v 1
6
8 Index of aggregate demand: contracts in November 2016
Month Mar-16 Apr-16 May-16 Jun-16 July-16 Aug-16 Sep-16 Oct-16 Nov-16
IAD 123.4 122.8 121.0 120.2 121.7 125.5 124.8 129.7 114.6
Growth
(% y-o-y) 8.0 5.5 4.2 6.4 5.5 8.6 7.2 8.8 -1.8
The demonetization-linked demand contraction is reflected in the IAD as it contracted by (-) 1.8% in November 2016 after having posted a robust growth of 8.8% in October 2016.
Source (Basic data): NIKKEI PMI - Markit Economics, RBI and EY estimates

Economy Watch January 2017
16
Table A1: industrial growth indicators (annual, quarterly and monthly growth rates, y-o-y)
Fiscal year/quarter/month
IIP Mining Manufacturing Electricity Core sector IIP
Fiscal year/quarter/month
PMI mfg. PMI ser.
% change y-o-y
FY13 1.1 -2.3 1.3 4.0 6.5 FY13 53.7 54.3
FY14 -0.1 -0.6 -0.8 6.1 4.2 FY14 50.5 48.5
FY15 2.8 1.5 2.3 8.4 4.5 FY15 52.2 51.7
FY16 2.4 2.2 2.0 5.7 3.0 FY16 51.3 51.7
3QFY16 1.7 3.2 1.1 4.4 1.7 4QFY16 51.5 53.3
4QFY16 0.2 2.2 -1.1 9.3 5.0 1QFY17 51.0 51.7
1QFY17 0.7 2.5 -0.6 9.0 5.4 2QFY17 52.2 52.9
2QFY17 -0.8 -2.7 -0.9 1.4 3.7 3QFY17 52.1 49.3
Aug-16 -0.7 -5.9 -0.3 0.1 3.2 Oct-16 54.4 54.5
Sep-16 0.7 -3.2 0.9 2.4 5.0 Nov-16 52.3 46.7
Oct-16 -1.8 -0.7 -2.4 1.1 6.6 Dec-16 49.6 46.8
Nov-16 5.7 3.9 5.5 8.9 4.9 Jan-17 50.4 48.7
Source: Office of the Economic Adviser- Ministry of Commerce and Industry and NIKKEI PMI-Markit Economics
Table A2: inflation indicators (annual, quarterly and monthly growth rates, y-o-y)
Source: Office of the Economic Adviser, Ministry of Commerce and Industry and MOSPI
Table A3: fiscal indicators (annual growth rates, cumulated monthly growth rates, y-o-y)
Source: Monthly Accounts, Controller General of Accounts-Government of India, Union Budget Documents
9 Appendix: capturing macro-fiscal trends
Fiscal year/quarter/month
CPI Food & beverage
Fuel & lighting
WPI Food articles Mfg. products
Fuel & power
% change y-o-y % change y-o-y
FY13 9.9 11.2 9.7 7.4 9.9 5.4 10.3
FY14 9.4 11.9 7.7 6.0 12.8 3.0 10.2
FY15 5.9 6.5 4.2 2.0 6.1 2.4 -0.9
FY16 4.9 5.1 5.3 -2.5 3.3 -1.1 -11.6
4QFY16 5.3 5.8 4.4 -0.8 4.8 -0.5 -8.4
1QFY17 5.7 7.0 2.9 1.1 6.9 1.0 -4.9
2QFY17 5.1 6.0 2.8 3.8 9.3 2.3 2.0
3QFY17 3.7 2.8 3.1 3.5 2.8 3.2 6.7
Sep-16 4.3 4.1 3.1 3.6 5.7 2.5 5.6
Oct-16 4.2 3.7 2.8 3.4 4.3 2.7 6.2
Nov-16 3.6 2.6 2.8 3.2 1.5 3.2 7.1
Dec-16 3.4 2.4 3.8 3.4 -0.7 3.7 8.7
Fiscal year/month
Gross tax revenue
Corporate tax
Income tax
Custom duty
Excise duty
Service tax
Fiscal deficit Revenue deficit
% change y-o-y % of GDP % of GDP
FY15 9.3 8.7 8.7 9.2 11.6 8.6 4.0 2.9
FY16 17.0 6.0 8.5 11.9 51.9 25.8 3.9 2.5
FY17 (RE) 17.0 9.0 22.8 3.2 34.5 17.1 3.5 2.1
FY18 (BE) 12.2 9.1 24.9 12.9 5.0 11.1 3.2 1.9
Cumulated growth (% y-o-y) % of budget target
May-16 38.3 -165.4 42.8 22.5 94.6 30.1 42.9 56.2
Jun-16 30.6 3.9 53.4 17.8 60.5 28.5 61.1 79.7
Jul-16 26.7 1.1 48.2 8.7 55.6 26.1 73.7 93.1
Aug-16 21.9 -1.4 31.9 6.5 50.8 24.4 76.4 91.8
Sep-16 16.6 2.3 17.8 5.3 47.9 22.8 83.9 92.1
Oct-16 18.0 4.5 19.3 4.9 46.4 24.5 79.3 92.6
Nov-16 21.5 9.0 20.9 6.8 46.0 27.1 85.8 98.4
Dec-16 18.3 4.8 20.5 4.9 43.7 25.0 93.8 (RE) 113.9 (RE)

Economy Watch January 2017
17
Table A4: monetary and financial indicators (annual, quarterly and monthly growth rates, y-o-y) Fiscal year/month
Repo rate
(end of period)
Fiscal year/quarter/month
M1 M3 Bank credit
Agg. deposits
10 yr. Govt. B
Yield
Net FDI Net FPI FX reserves
% % change y-o-y % US$ billion US$ billion US$ billion
FY13 7.50 FY13 9.2 13.6 16.6 13.7 8.2 19.8 26.9 292.0
FY14 8.00 FY14 8.5 13.4 14.9 14.2 8.4 21.6 4.8 304.2
FY15 7.50 FY15 11.3 10.9 11.0 12.1 8.3 31.3 42.2 341.6
FY16 6.75 FY16 13.5 10.1 9.7 10.5 7.7 36.0 -4.1 355.6
Jul-16 6.50 4Q FY16 13.5 10.1 11.0 10.1 7.6 8.8 -1.5 355.6
Aug-16 6.50 1Q FY17 13.7 10.3 9.5 9.3 7.5 4.1 2.1 360.8
Sep-16 6.50 2Q FY17 21.0 14.6 10.4 10.7 7.0 17.2 6.1 372.0
Oct-16 6.25 3Q FY17 -18.6 6.6 6.7 13.3 6.6 9.9 -11.3 360.3
Nov-16 6.25 Sep-16 21.0 14.6 12.1 13.3 6.9 6.3 2.7 372.0
Dec-16 6.25 Oct-16 15.2 10.9 8.7 9.2 6.8 2.3 -1.8 367.2
Jan-17 6.25 Nov-16 -12.3 8.5 6.2 15.6 6.6 4.5 -5.5 365.3
Feb-17 6.25 Dec-16 -18.6 6.6 5.1 15.2 6.5 3.1 -4.0 360.3
Source: Database on Indian Economy-RBI
Table A5: external trade and global growth
Source: Database on Indian Economy- RBI, Pink Sheet-World Bank and IMF World Economic Outlook October 2016; * Indicates forecasted data (IMF-WEO Update January 2017)
Table A6: macroeconomic aggregates (annual and quarterly growth rates, % change y-o-y)
Expenditure components Output: aggregate and selected sectors
Fiscal year/quarter GDP (Real) PCE GCE GFCF EX IM GVA Agri. Ind. Serv.
FY14 (3rd RE) 6.5 7.4 0.6 1.8 7.8 -8.1 6.2 5.6 4.2 7.7
FY15 (2nd RE) 7.2 6.8 9.4 4.1 1.7 0.8 6.9 -0.3 6.9 9.5
FY16 (1st RE) 7.9 7.3 2.9 6.1 -5.4 -5.9 7.8 0.8 8.2 9.8
FY17 (AE) 7.0 5.5 26.5 0.0 2.2 -0.8 6.5 3.3 4.4 8.7
2QFY15 8.3 9.2 15.4 2.2 1.1 4.6 8.1 2.8 5.9 10.7
3QFY15 6.6 1.5 33.2 3.7 2.0 5.7 6.7 -2.4 3.8 12.9
4QFY15 6.7 6.6 -3.3 5.4 -6.3 -6.1 6.2 -1.7 5.7 9.3
1QFY16 7.5 6.9 -0.2 7.1 -5.7 -2.4 7.2 2.5 6.7 8.8
2QFY16 7.6 6.3 3.3 9.7 -4.3 -0.6 7.3 2.0 6.3 9.0
3QFY16 7.2 8.2 3.0 1.2 -8.9 -6.4 6.9 -1.0 8.6 9.1
4QFY16 7.9 8.3 2.9 -1.9 -1.9 -1.6 7.4 2.3 7.9 8.7
1QFY17 7.1 6.7 18.8 -3.1 3.2 -5.8 7.3 1.8 6.0 9.6
2QFY17 7.3 7.6 15.2 -5.6 0.3 -9.0 7.1 3.3 5.2 8.9
Source: National Accounts Statistics, MOSPI
External trade indicators (annual, quarterly and monthly growth rates) Global growth (annual)
Fiscal year/quarter/month
Exports Imports Trade balance
Ex. rate (avg.)
Crude prices (avg.)
Coal prices (avg.)
Calendar year
World GDP
Adv. econ.
Emer. econ.
% change y-o-y US$ billion INR/US$ US$/brl US$/mt % change y-o-y
FY13 -1.8 0.3 -190.3 54.5 103.2 86.6 2008 3.0 0.1 5.8
FY14 4.7 -8.3 -135.8 60.9 103.7 76.1 2009 -0.1 -3.4 2.9
FY15 -1.3 -0.5 -137.7 61.2 83.2 65.9 2010 5.4 3.1 7.5
FY16 -15.8 -15.4 -117.7 65.5 46.0 52.7 2011 4.2 1.7 6.3
4QFY16 -7.8 -13.3 -19.2 66.9 32.7 48.4 2012 3.5 1.2 5.3
1QFY17 -1.4 -14.7 -19.1 67.0 44.8 50.4 2013 3.3 1.2 5.0
2QFY17 -0.9 -12.2 -23.7 67.5 44.7 63.5 2014 3.4 1.9 4.6
3QFY17 1.0 -1.4 -33.5 68.1 49.1 87.8 2015 3.2 2.1 4.0
Sep-16 4.8 -2.5 -8.3 66.7 45.0 67.1 2016* 3.1 1.6 4.1
Oct-16 9.6 8.1 -10.2 66.7 49.3 85.2 2017* 3.4 1.9 4.5
Nov-16 2.3 10.4 -13.0 67.6 45.3 92.0 2018* 3.6 2.0 4.8
Dec-16 5.7 0.5 -10.4 67.9 52.6 86.2 2019* - - -

Ernst & Young LLP
EY | Assurance | Tax | Transactions | Advisory
About EY
EY is a global leader in assurance, tax, transaction and advisory services. The insights and quality services we deliver help build trust and confidence in the capital markets and in economies the world over. We develop outstanding leaders who team to deliver on our promises to all of our stakeholders. In so doing, we play a critical role in building a better working world for our people, for our clients and for our communities.
EY refers to the global organization, and may refer to one or more, of the member firms of Ernst & Young Global Limited, each of which is a separate legal entity. Ernst & Young Global Limited, a UK company limited by guarantee, does not provide services to clients. For more information about our organization, please visit ey.com.
Ernst & Young LLP is one of the Indian client serving member
firms of EYGM Limited. For more information about our
organization, please visit www.ey.com/in.
Ernst & Young LLP is a Limited Liability Partnership, registered
under the Limited Liability Partnership Act, 2008 in India, having
its registered office at 22 Camac Street, 3rd Floor, Block C,
Kolkata - 700016
© 2015 Ernst & Young LLP.Published in India.
All Rights Reserved.
ED None
This publication contains information in summary form and is therefore intended for general guidance only. It is not intended to be a substitute for detailed research or the exercise of professional judgment. Neither Ernst & Young LLP nor any other member of the global Ernst & Young organization can accept any responsibility for loss occasioned to any person acting or refraining from action as a result of any material in this publication. On any specific matter, reference should be made to the appropriate advisor.
EY refers to global organization, and/or one or more of the independent member firms of Ernst & Young Global Limited