Embed Size (px)
Citation preview
Ecosystems: What Are They and How Do They Work?
Chapter 3
WHAT KEEPS US AND OTHER ORGANISMS ALIVE?
Section 3-1
Earth’s life-support system has four major components
• The hydrosphere consists of earth’s water, found in liquid water, ice, and water vapor.
• The geosphere is the hot core, a thick mantle, and thin crust.
• The biosphere includes parts of the atmosphere, hydrosphere, and geosphere.
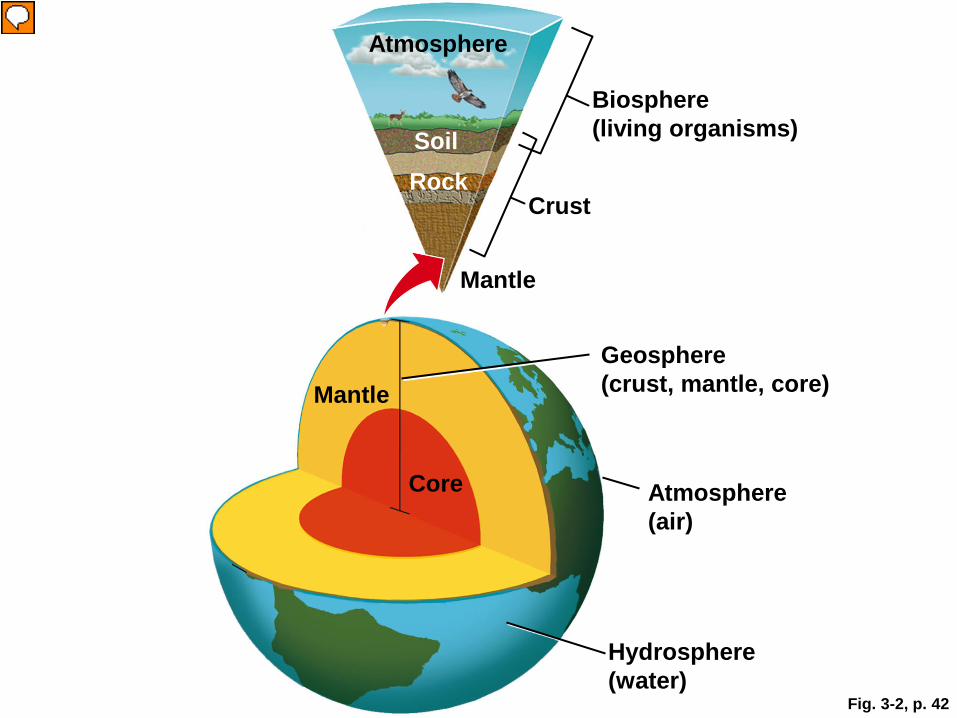
Fig. 3-2, p. 42
Soil Biosphere (living organisms)
Atmosphere
Rock Crust
Mantle
Geosphere (crust, mantle, core) Mantle
Core Atmosphere (air)
Hydrosphere (water)
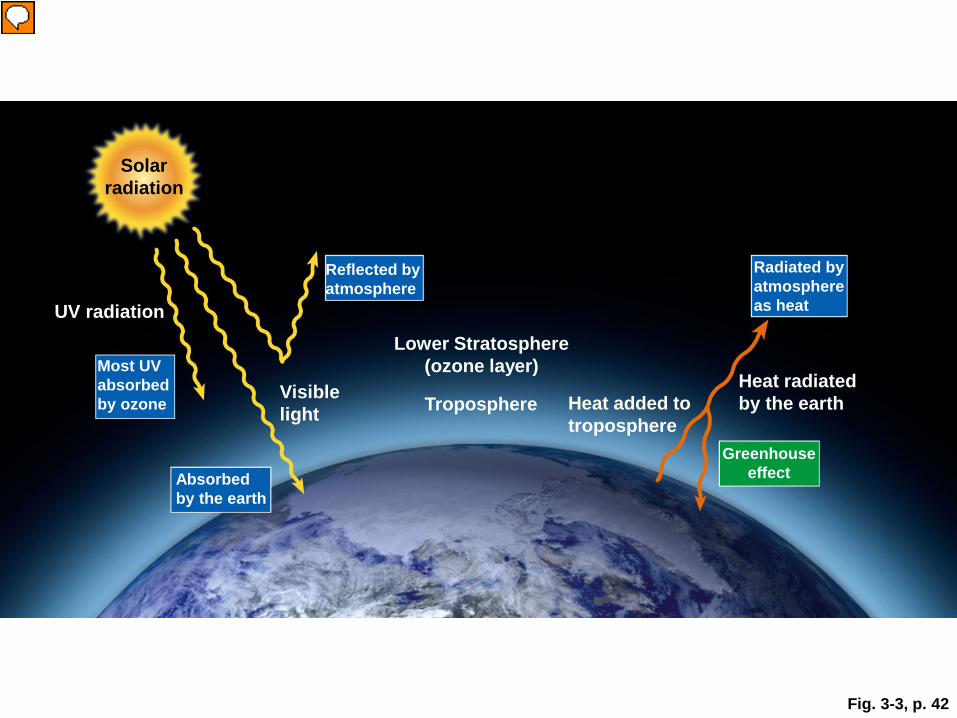
Fig. 3-3, p. 42
Solar radiation
Reflected by atmosphere
Radiated by atmosphere as heat UV radiation
Lower Stratosphere (ozone layer) Most UV
absorbed by ozone
Visible light Heat added to
troposphere Troposphere
Heat radiated by the earth
Greenhouse effect Absorbed
by the earth

Earth’s life-support system has four major components
• The atmosphere is the thin membrane of air around the planet. – The troposphere is the air layer about 4–11 miles above sea
level. It contains greenhouse gases that absorb and release energy which warms the inner layer of the atmosphere.
– The stratosphere lies above the troposphere between 11–31 miles; It contains ozone and it filters out the sun’s harmful radiation.
WHAT ARE THE MAJOR COMPONENTS OF AN ECOSYSTEM?
Section 3-2

Smallest unit of a chemical element that exhibits its chemical properties
Atom
Molecule Chemical combination of two or more atoms of the same or different elements
Cell The fundamental structural and functional unit of life
Organism An individual living being
Population A group of individuals of the same species living in a particular place
Community Populations of different species living in a particular place, and potentially interacting with each other
Stepped Art
Ecosystem A community of different species interacting with one another and with their nonliving environment of matter and energy
Biosphere Parts of the earth's air,water, and soil where life is found
Oxygen Hydrogen
Water
Fig. 3-4, p. 43
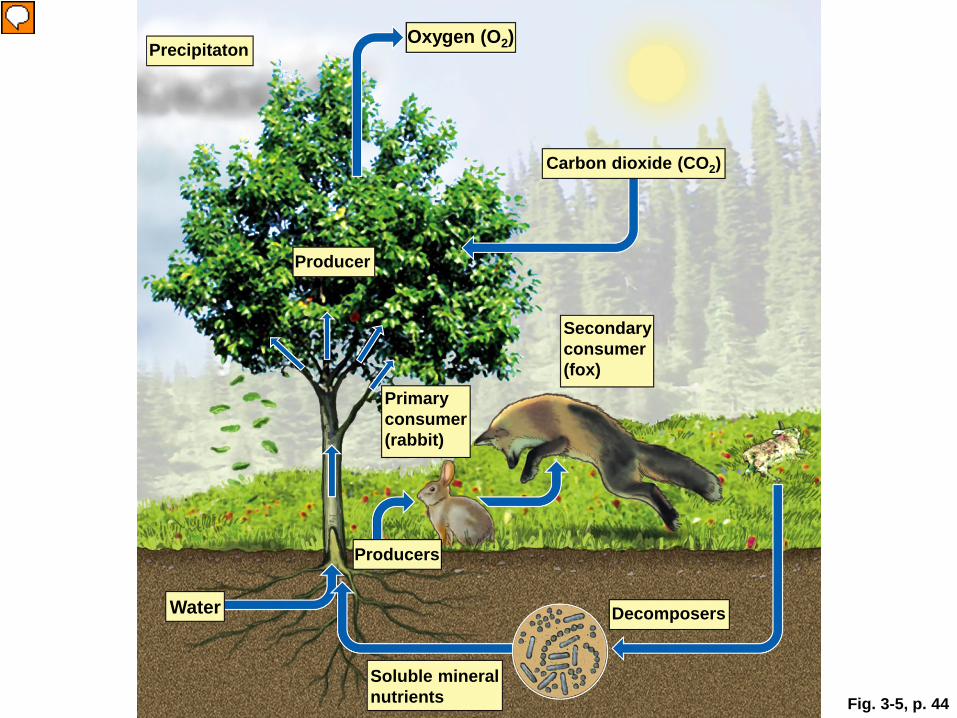
Fig. 3-5, p. 44
Precipitaton Oxygen (O2)
Carbon dioxide (CO2)
Producer
Secondary consumer (fox)
Primary consumer (rabbit)
Producers
Water Decomposers
Soluble mineral nutrients
Ecosystems have several important components
• Every organism belongs to a particular trophic level depending on its source of nutrients.
• Producers, or autotrophs, use photosynthesis to make nutrients from components in the environment.
• Consumers, or heterotrophs, get their nutrients by feeding on other organisms or their remains.
• Consumers can be herbivores (feed on plants), carnivores (feed on animals) or omnivores (feed on both plants and animals).
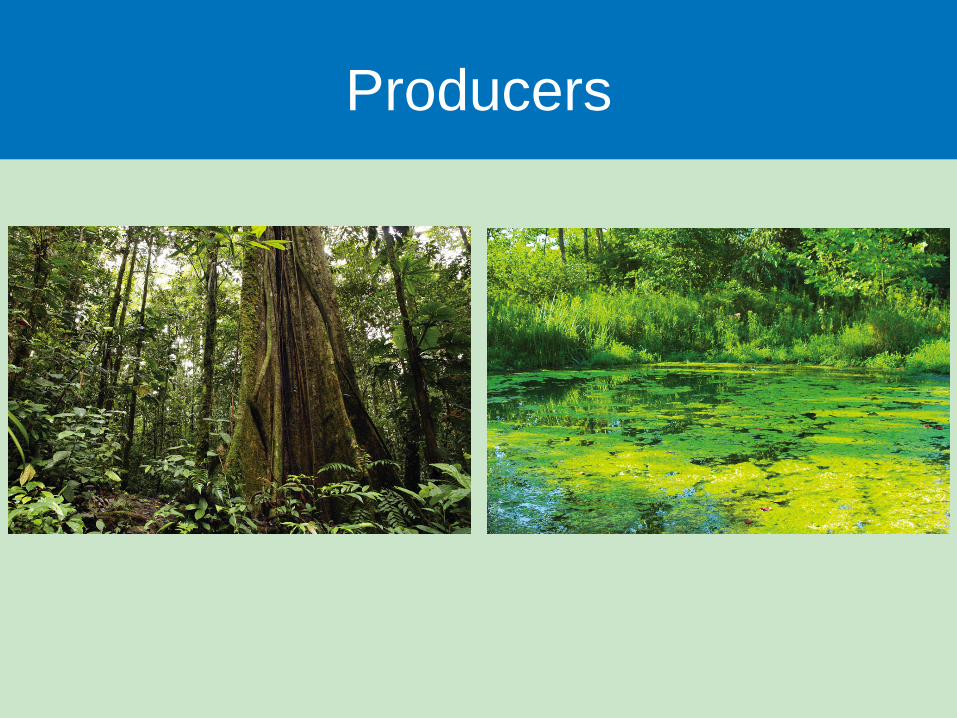
Producers

Consumers
Ecosystems have several important components
• Consumers can be primary, secondary or tertiary consumers, depending upon their trophic level.
• Decomposers (bacteria/fungi) break down organic detritus into simpler inorganic compounds.
• Detritivores (detritus feeders) feed on waste or dead bodies.
• Producers, consumers and decomposers utilize chemical energy stored in organic molecules. In most cells, this energy is released by aerobic respiration.
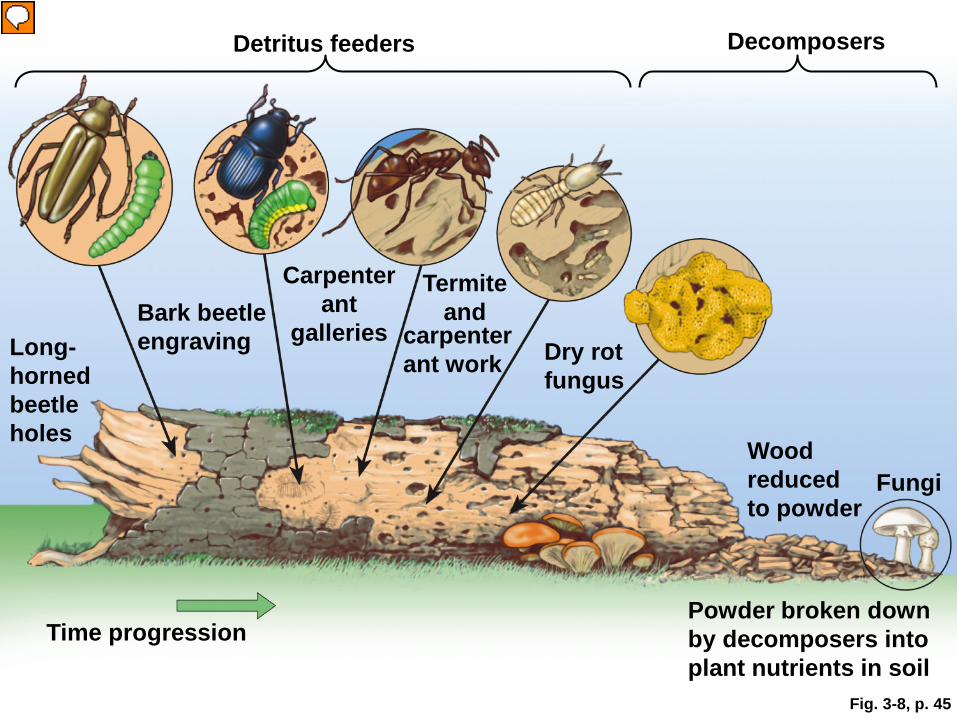
Fig. 3-8, p. 45
Detritus feeders Decomposers
Carpenter ant
galleries Bark beetle engraving
Termite and
Dry rot fungus
Long-horned beetle holes
Wood reduced to powder
Fungi
Time progression Powder broken down by decomposers into plant nutrients in soil
carpenter ant work
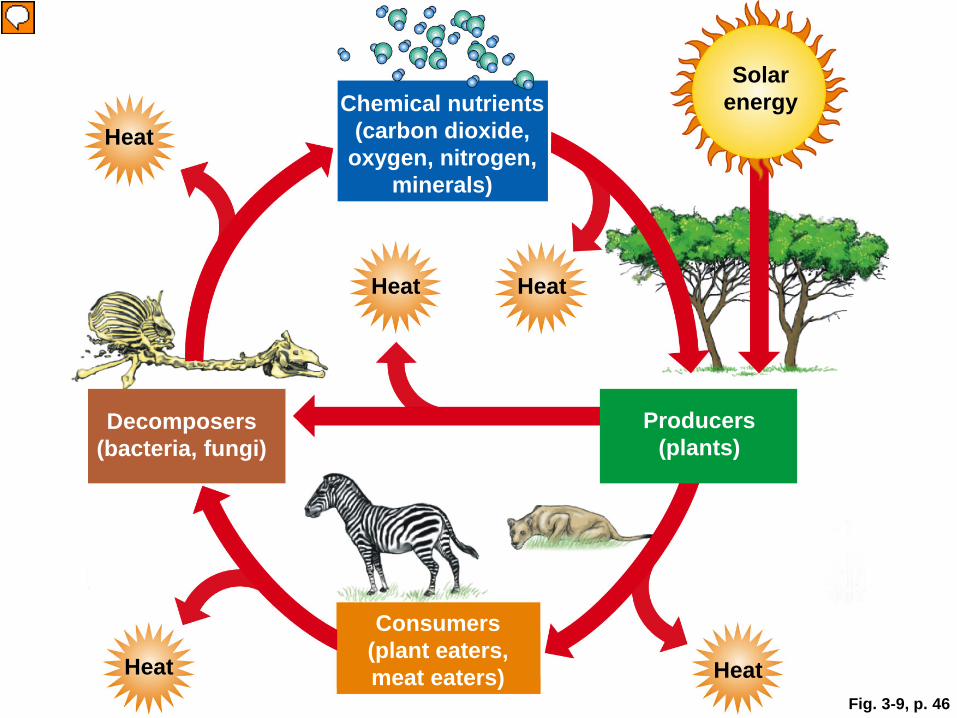
Fig. 3-9, p. 46
Solar energy Chemical nutrients
(carbon dioxide, oxygen, nitrogen,
minerals)
Heat
Heat Heat
Decomposers (bacteria, fungi)
Producers (plants)
Consumers (plant eaters, meat eaters) Heat Heat
WHAT HAPPENS TO ENERGY IN AN ECOSYSTEM?
Section 3-3
Energy flows through ecosystems in food chains and food webs
What is a food chain?
Give me an example.
Energy flows through ecosystems in food chains and food webs
• A food chain is a sequence of organisms, each of which serves as a source of nutrients and energy for the next organisms. Organisms are assigned to trophic levels in a food chain.

Fig. 3-10, p. 47
First Trophic Level
Producers (plants)
Heat
Solar energy
Third Trophic Level
Secondary consumers (carnivores)
Heat
Heat
Fourth Trophic Level
Tertiary consumers
(top carnivores)
Heat
Heat
Second Trophic Level
Primary consumers (herbivores)
Heat
Heat
Decomposers and detritus feeders
Stepped Art
Energy flows through ecosystems in food chains and food webs
• A food web is a series of interconnected food chains.
• Food webs occur in most ecosystems. Organisms are also assigned to trophic levels in food webs. – Producers are the first level. – Primary consumers are the second. – Secondary consumers belong to the third. – Tertiary consumers are the fourth level. – Detritivores and decomposers process detritus from
all trophic levels.

Fig. 3-11, p. 48
Humans
Blue whale Sperm whale
Elephant seal Crabeater seal Killer
whale
Leopard seal Adelie
penguin Emperor penguin
Squid Petrel
Fish
Carnivorous zooplankton
Krill Herbivorous zooplankton
Phytoplankton
Usable energy decreases with each link in a food chain or web • There is less high-quality energy available
to organisms at each succeeding feeding level because when chemical energy is transferred from one trophic level to the next, about 90% of the energy is lost as heat

Fig. 3-12, p. 49
Usable energy available at each trophic level
(in kilocalories) Heat
Tertiary consumers (human)
10 Heat
Secondary consumers (perch) Heat Decomposers Heat
100
Primary consumers (zooplankton) Heat
1,000
10,000 Producers (phytoplankton)
Some ecosystems produce plant matter faster than others do
• The rate of an ecosystem’s producers converting energy into biomass is the gross primary productivity (GPP).
• Net primary productivity (NPP) is the rate that producers use photosynthesis to store biomass minus the rate at which they use energy for aerobic respiration.
• Ecosystems and aquatic life zones differ in their NPP. The three most productive systems are …
• The three least productive are …
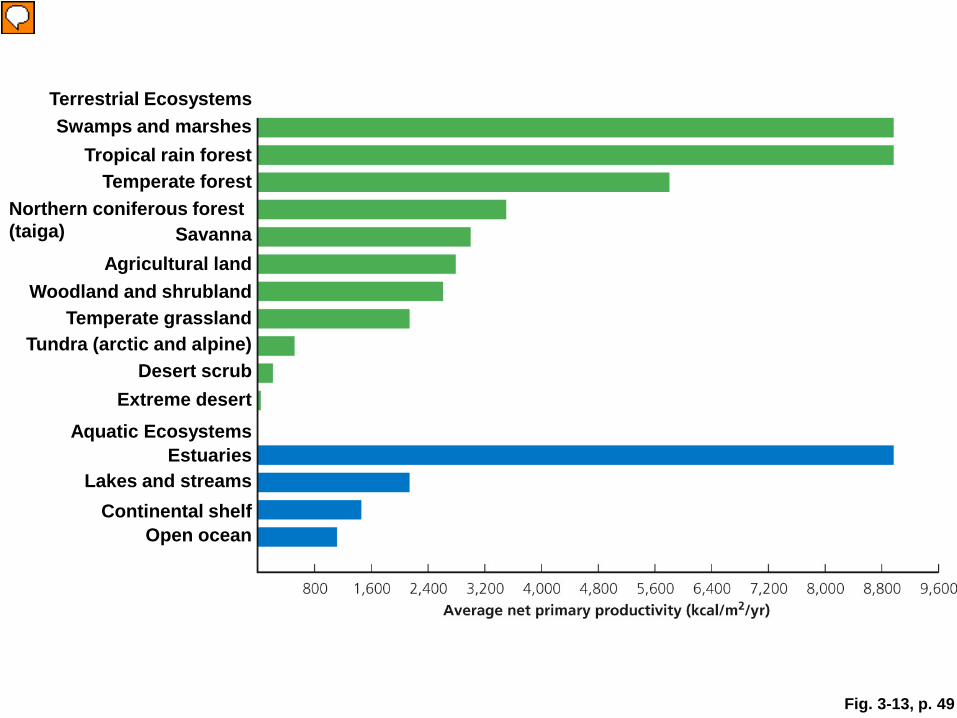
Fig. 3-13, p. 49
Terrestrial Ecosystems Swamps and marshes
Tropical rain forest Temperate forest
Northern coniferous forest (taiga) Savanna
Agricultural land Woodland and shrubland
Temperate grassland Tundra (arctic and alpine)
Desert scrub Extreme desert
Aquatic Ecosystems Estuaries
Lakes and streams Continental shelf
Open ocean

WHAT HAPPENS TO MATTER IN AN ECOSYSTEM?
Section 3-4

Nutrients cycle within and among ecosystems
• Elements and compounds move through air, water, soil, rock and living organisms in biogeochemical, or nutrient, cycles.
The water cycle
http://www.youtube.com/watch?v=0gleTEA8eHY
The water cycle
• Solar energy evaporates water; the water returns as precipitation (rain or snow), goes through organisms, goes into bodies of water, and evaporates again.
• Water is filtered and partly purified as it moves through the hydrological cycle.
• Water can be stored as ice in glaciers or in underground aquifers.

The water cycle
• Unique properties of water include…
The water cycle
• Humans alter the water cycle in 3 ways: – Withdrawing freshwater at faster rates than
nature can replenish it.
– Clearing vegetation which increases runoff and decreases replenishment of groundwater supplies.
– Draining wetlands which interferes with flood control (we’ve lost ~50% of our wetlands).
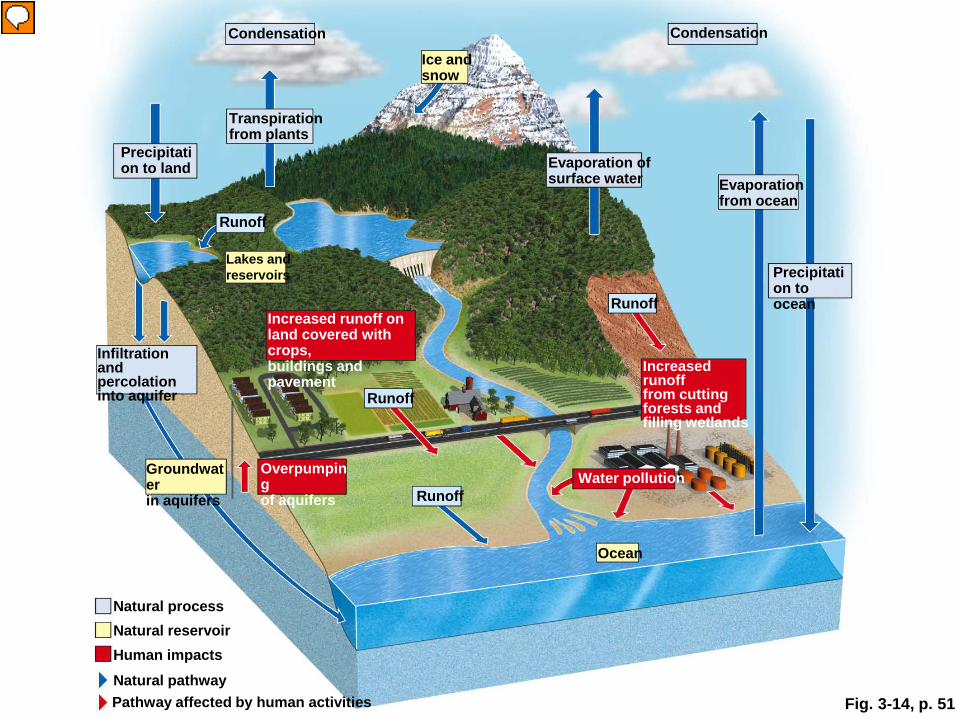
Fig. 3-14, p. 51
Condensation Condensation
Ice and snow
Transpiration from plants
Precipitation to land Evaporation of
surface water Evaporation from ocean
Runoff
Lakes and reservoirs Precipitati
on to ocean Runoff
Increased runoff on land covered with crops, buildings and pavement
Infiltration and percolation into aquifer
Increased runoff from cutting forests and filling wetlands
Runoff
Groundwater in aquifers
Overpumping of aquifers Runoff
Water pollution
Ocean
Natural process Natural reservoir Human impacts Natural pathway Pathway affected by human activities
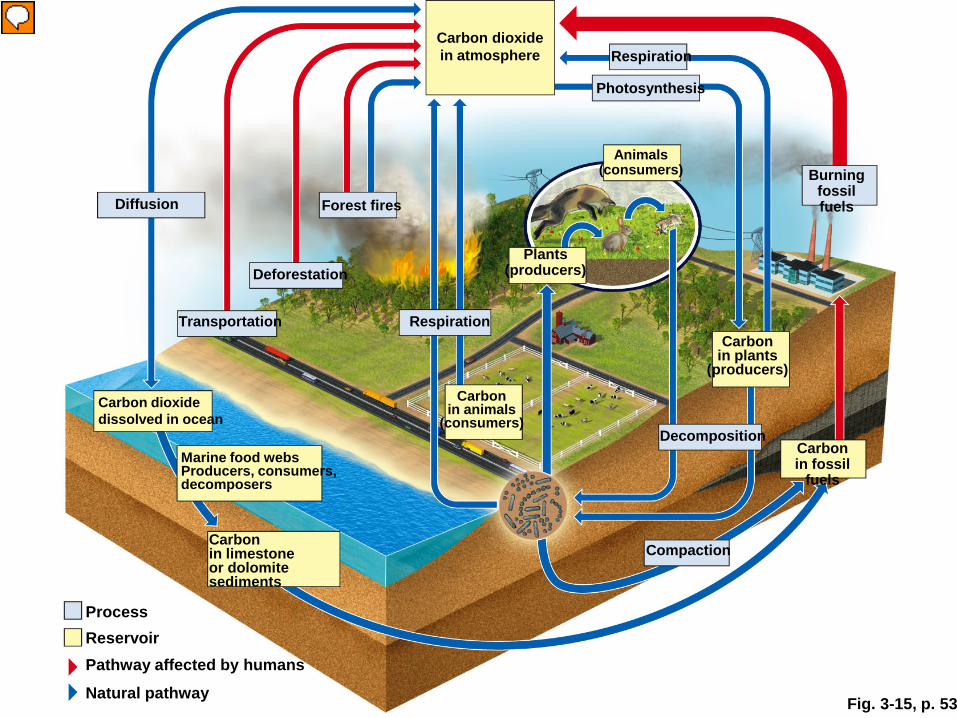
Fig. 3-15, p. 53
Carbon dioxide in atmosphere Respiration
Photosynthesis
Animals (consumers) Burning
fossil fuels Diffusion Forest fires
Plants (producers) Deforestation
Transportation Respiration Carbon
in plants (producers)
Carbon dioxide dissolved in ocean
Carbon in animals
(consumers) Decomposition
Marine food webs Producers, consumers, decomposers
Carbon in fossil
fuels
Carbon in limestone or dolomite sediments
Compaction
Process Reservoir Pathway affected by humans
Natural pathway
The carbon cycle
• Carbon is the basic building block of carbohydrates, fats, proteins, DNA, and other compounds.
• Carbon circulates through the biosphere, hydrosphere, and atmosphere.
• Producers, consumers and decomposers circulate carbon in the biosphere.
• Fossil fuels contain carbon. • Humans are altering atmospheric carbon dioxide
mostly by our use of fossil fuels and our destruction of the carbon-absorbing vegetation.
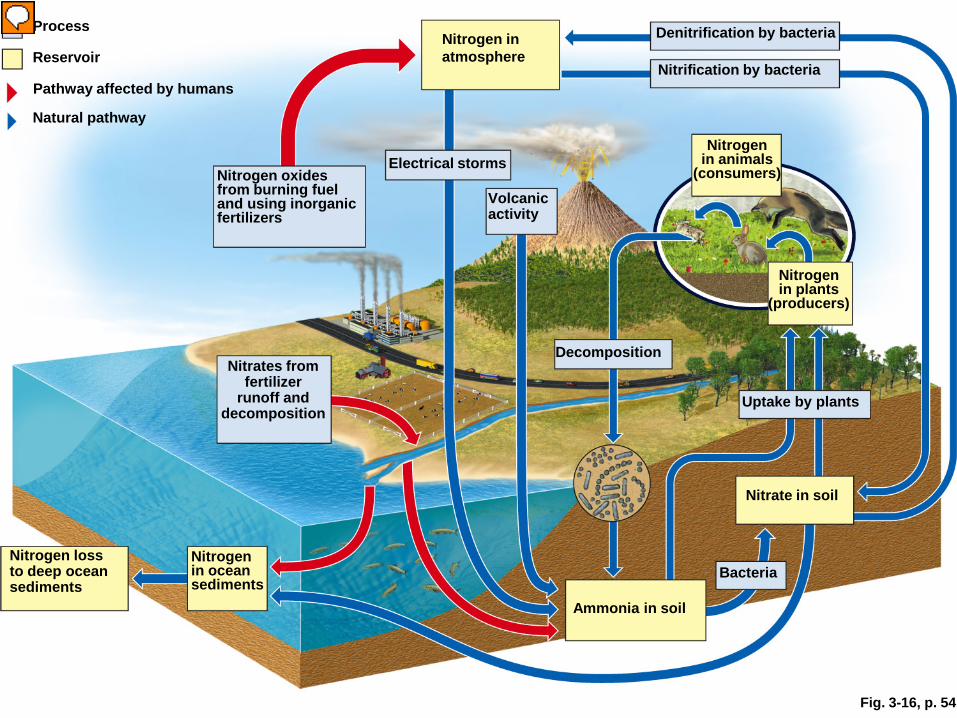
Fig. 3-16, p. 54
Process Nitrogen in atmosphere
Denitrification by bacteria Reservoir
Nitrification by bacteria Pathway affected by humans
Natural pathway
Nitrogen in animals
(consumers) Nitrogen oxides from burning fuel and using inorganic fertilizers
Volcanic activity
Electrical storms
Nitrogen in plants
(producers)
Decomposition Nitrates from
fertilizer runoff and
decomposition Uptake by plants
Nitrate in soil
Nitrogen loss to deep ocean sediments
Nitrogen in ocean sediments
Bacteria
Ammonia in soil

The nitrogen cycle: bacteria in action
• Nitrogen gas (N2), which makes up 78% of the atmosphere, cannot be used directly by most living organisms.
• Nitrogen-fixing bacteria convert N2 into compounds that are useful nutrients for plants and animals.

The nitrogen cycle: bacteria in action
• The nitrogen cycle includes the following steps: – Specialized bacteria convert gaseous nitrogen to
ammonia in nitrogen fixation. – Specialized bacteria convert ammonia in the soil to
nitrite ions and nitrate ions; the latter is used by plants as a nutrient. This process is nitrification.
– Decomposer bacteria convert detritus into ammonia and water-soluble salts in ammonification.
– In denitrification, anaerobic bacteria in soggy soil and bottom sediments of water areas convert NH3 and NH4
+ back into nitrite and nitrate ions, then into nitrogen gas and nitrous oxide gas, which are released into the atmosphere.
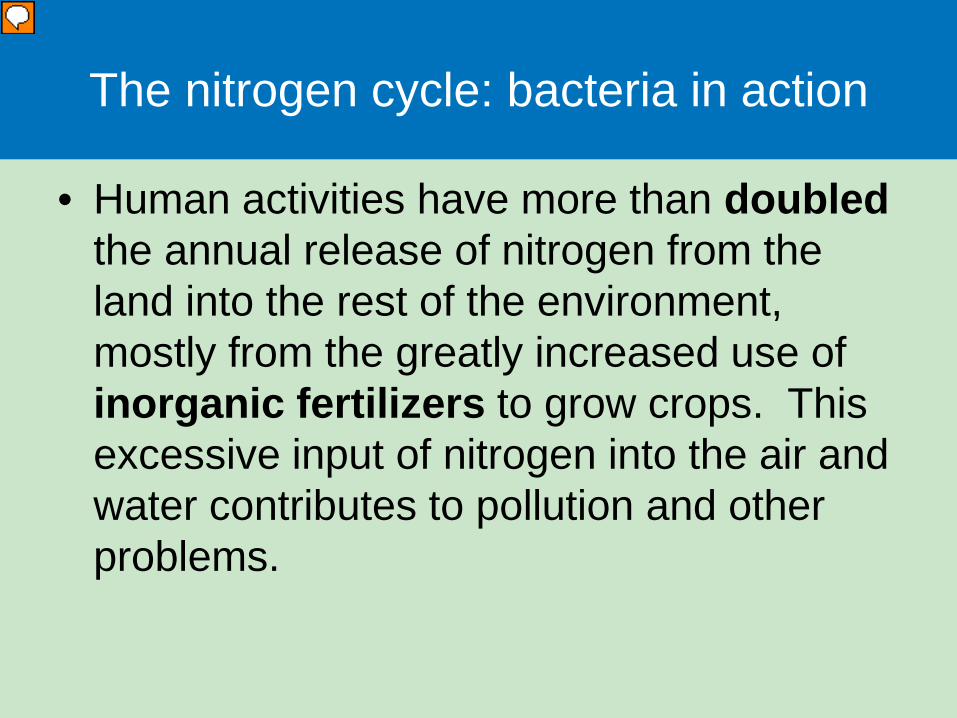
The nitrogen cycle: bacteria in action
• Human activities have more than doubled the annual release of nitrogen from the land into the rest of the environment, mostly from the greatly increased use of inorganic fertilizers to grow crops. This excessive input of nitrogen into the air and water contributes to pollution and other problems.
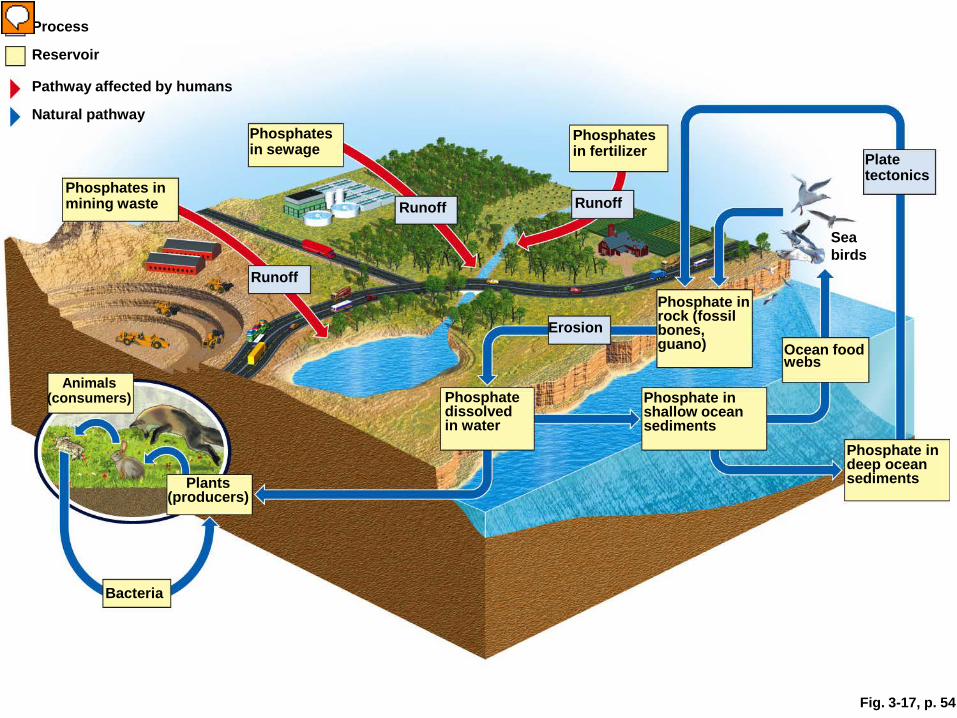
Fig. 3-17, p. 54
Process
Reservoir
Pathway affected by humans
Natural pathway Phosphates in sewage
Phosphates in fertilizer Plate
tectonics Phosphates in mining waste Runoff Runoff
Sea birds
Runoff Phosphate in rock (fossil bones, guano)
Erosion Ocean food webs
Animals (consumers) Phosphate
dissolved in water
Phosphate in shallow ocean sediments
Phosphate in deep ocean sediments Plants
(producers)
Bacteria

The phosphorus cycle • Phosphorus circulates through water, Earth’s crust, and
living organisms in the phosphorus cycle. Phosphorus does not cycle through the atmosphere.
• The major reservoirs of phosphorus on Earth are rock formations and ocean bottom sediments.
• Phosphorus is transferred by food webs and is an important component of many biological molecules.
• Phosphorus is often the limiting factor for plant growth. • Human activity removes phosphate from the earth to
make fertilizer and reduces phosphate levels in tropical soils by clearing forests. Phosphate-rich runoff from the land can produce huge populations of algae, which can upset chemical cycling and other processes.

Fig. 3-18, p.56
Sulfur dioxide in atmosphere
Sulfuric acid and Sulfate
deposited as acid rain
Smelting Burning coal
Refining fossil fuels
Dimethyl Sulfide
a bacteria byproduct
Sulfur in animals
(consumers)
Sulfur in plants
(producers) Mining and extraction Uptake
by plants Sulfur in ocean sediments Decay
Decay
Process Sulfur in soil, rock
and fossil fuels Reservoir
Pathway affected by humans
Natural pathway
Smelting Burning coal
Refining fossil fuels
The sulfur cycle
• Much of the earth’s sulfur is stored underground in rocks and minerals.
• Hydrogen sulfide (H2S) is released from volcanoes and anaerobic decomposition of organic matter in bogs and swamps.
• Humans have been increasing atmospheric sulfur dioxide by burning sulfur-containing fuels, refining sulfur-containing fuels, and converting sulfur containing metallic mineral ores into free metals.
HOW DO SCIENTISTS STUDY ECOSYSTEMS?
Section 3-5

Some scientists study nature directly
• Field research (“muddy-boots biology”) involves making direct measurements and observations of ecosystems in natural settings.
• Remote sensing devices can gather data on the earth’s surface that can be converted into usable forms by geographic information systems (GIS), such as computerized maps of an area that are used to examine forest cover, water resources, air pollution emissions, coastal changes, and changes in global sea temperatures.

Some scientists study ecosystems in the laboratory
• Ecologists use tanks, greenhouses, and controlled indoor and outdoor chambers to study ecosystems in laboratory research. This allows control of light, temperature, CO2, humidity, and other variables.
We need to learn more about the health of the world’s ecosystems
• Mathematical models and computer simulations can help scientists understand large and very complex systems.
• Simulations are no better than the data and assumptions used to develop models.
• We need more baseline data about components and physical and chemical conditions in order to determine how well the ecosystem is functioning and anticipate how best to prevent harmful environmental changes.
Three Big Ideas
• Life is sustained by the flow of energy from the sun through the biosphere, the cycling of nutrients within the biosphere, and gravity.
• Some organisms produce the nutrients they need, some survive by consuming other organisms, and others recycle nutrients back to producers.
• Human activities are altering the flow of energy through food chains and webs, and the cycling of nutrients within ecosystems and the biosphere.