Embed Size (px)
Citation preview
ECS 289A PresentationJimin Ding
• Problem & Motivation• Two-component Model• Estimation for Parameters in above model• Define low and high level gene expression• Comparing expression levels• Limitations of the model and method• Other possible solutions• References
A Model for Measurement Error for Gene Expression Arrays
David Rocke & Blythe DurbinJournal of Computational Biology Nov.2001
Problem & Motivation • Statistical inference for data need assumption of normality
with constant variance
--- So hypothesis testing for the difference between control and treatment need equal variance (not depending on the mean of the data);
• Measurement error for gene expression rises proportionately to the expression level
--- So linear regression fails and log transformation has been tried;
• However, for genes whose expression level is low or entirely unexpressed, the measurement error doesn’t go down proportionately Example
--- So log transformation fails by inflating the variance of observations near background, and two component model is introduced.

Example: MiceFrom: Barosiewics etatl, 2000
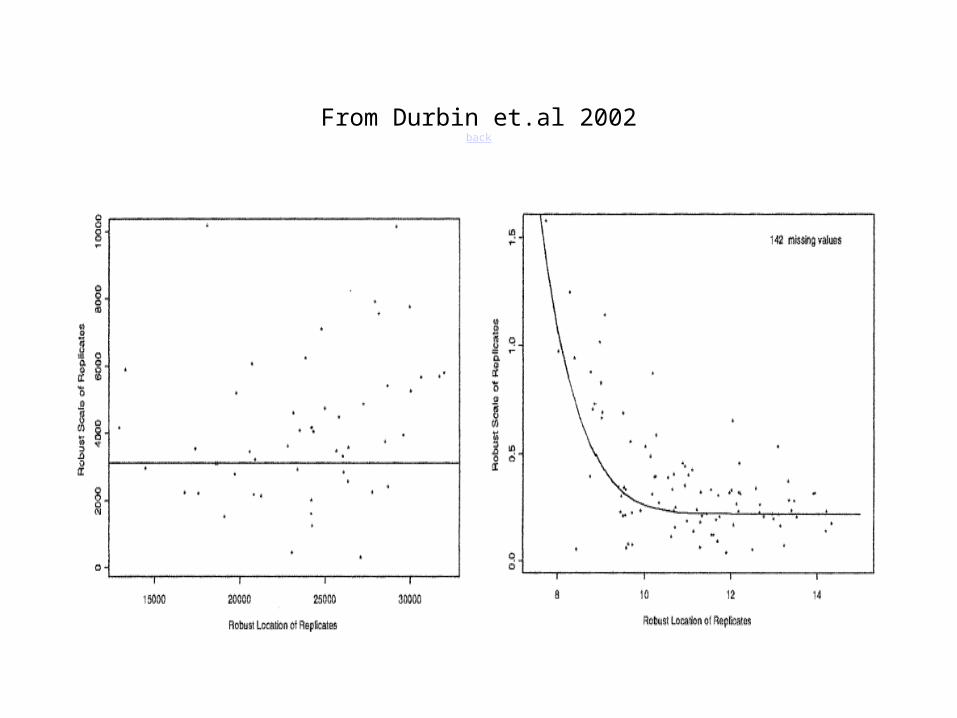
From Durbin et.al 2002back
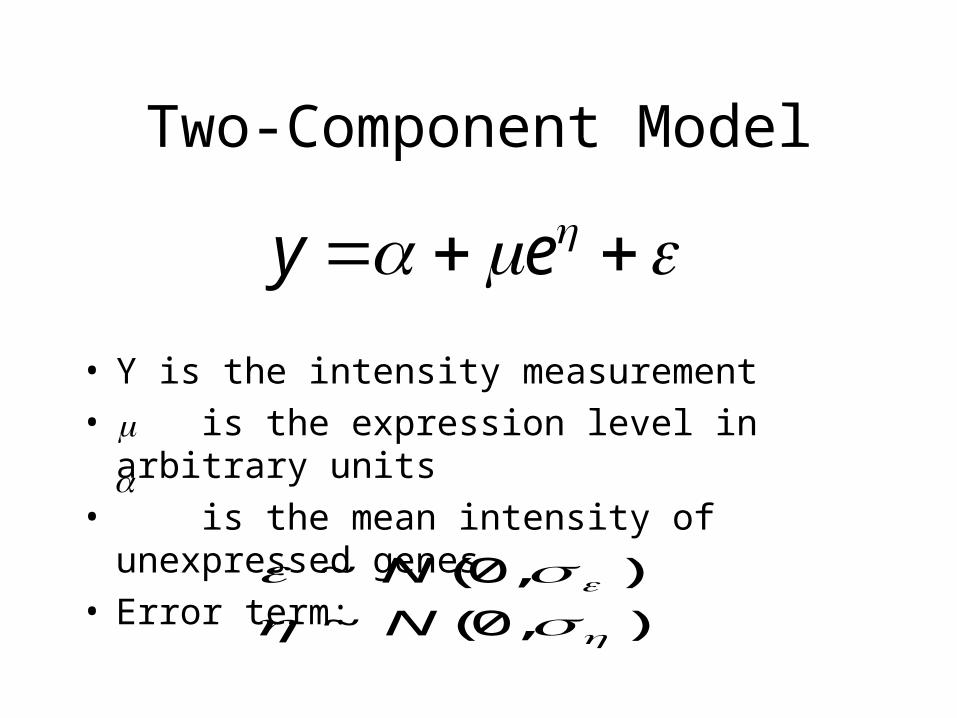
Two-Component Model
ey
• Y is the intensity measurement• is the expression level in arbitrary units• is the mean intensity of unexpressed genes• Error term:
),0(~
),0(~
N
N
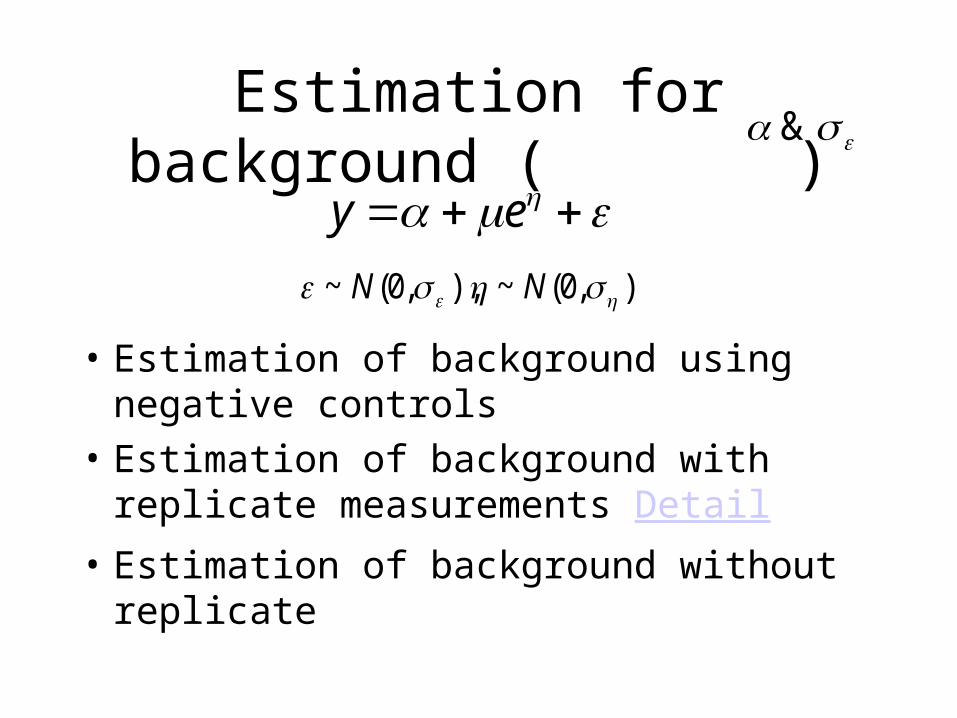
Estimation for background ( )
• Estimation of background using negative controls
• Estimation of background with replicate measurements Detail
• Estimation of background without replicate
&
ey
),0(~),,0(~ NN
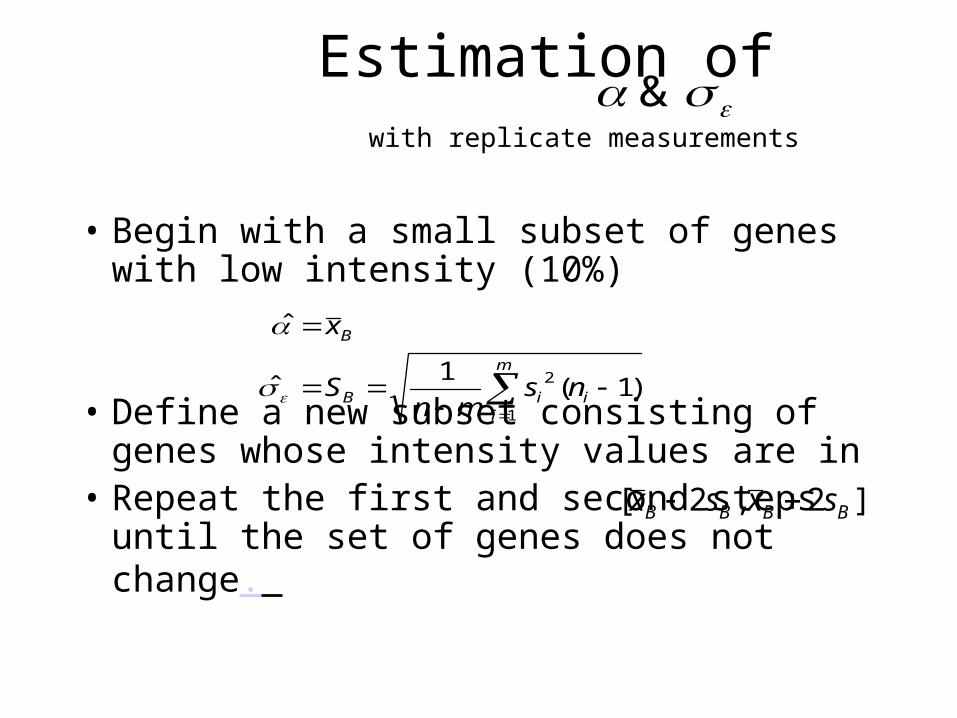
Estimation of with replicate measurements
• Begin with a small subset of genes with low intensity (10%)
• Define a new subset consisting of genes whose intensity values are in
• Repeat the first and second steps until the set of genes does not change.
&
m
iiiB
B
nsmn
S
x
1
2 )1(1
ˆ
ˆ
]2,2[ BBBB sxsx
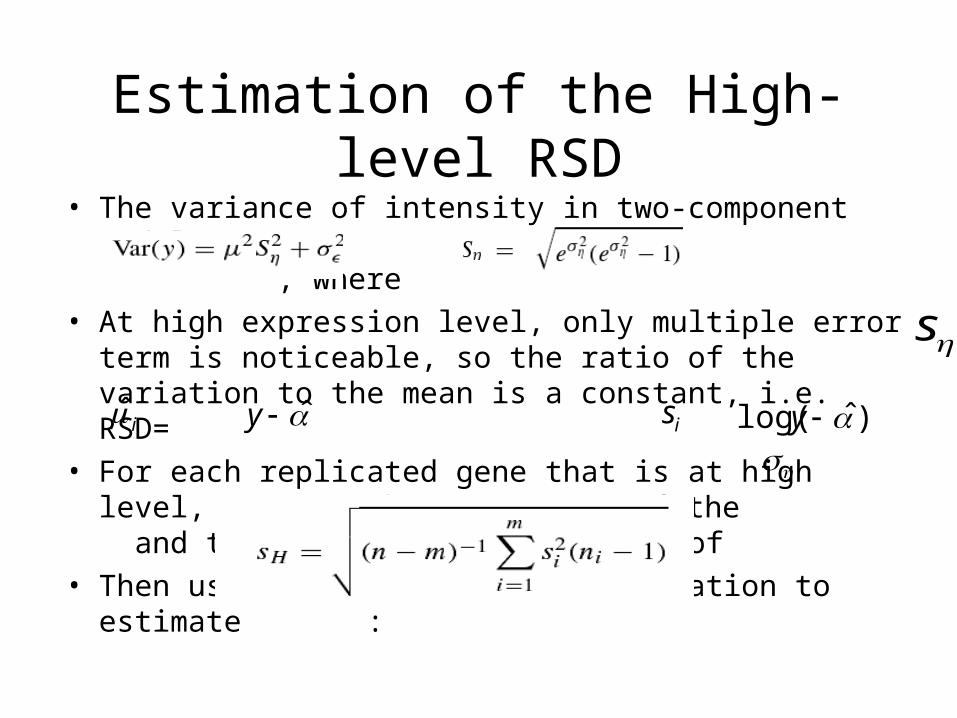
Estimation of the High-level RSD• The variance of intensity in two-component model:
, where
• At high expression level, only multiple error term is noticeable, so the ratio of the variation to the mean is a constant, i.e. RSD=
• For each replicated gene that is at high level, compute the mean of the and the standard deviation of
• Then use the pooled standard deviation to estimate :
s
is )ˆlog( y
i y
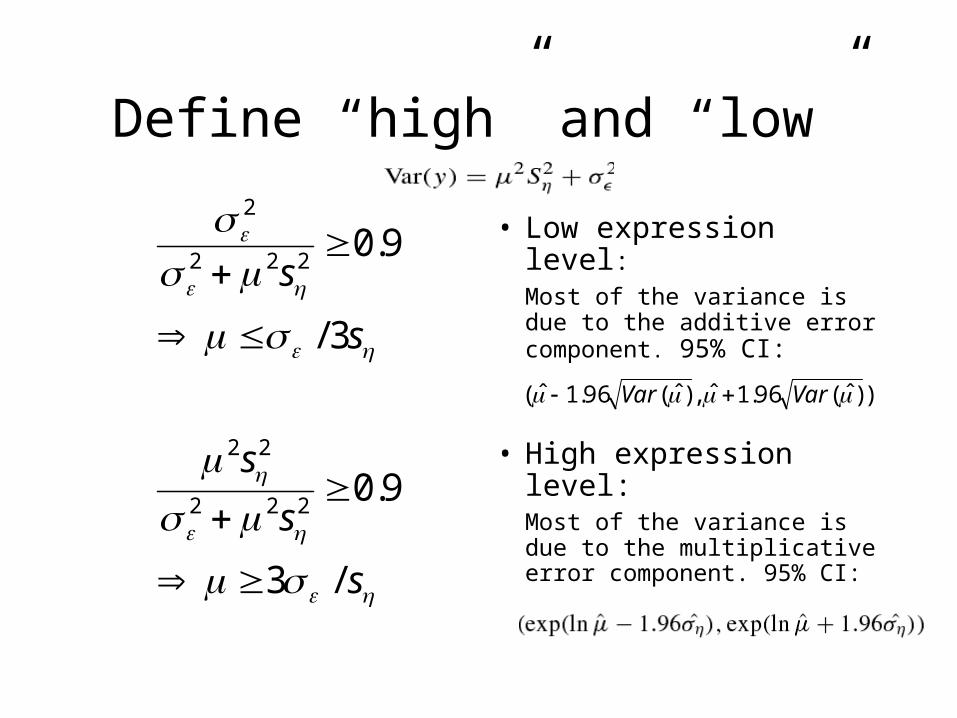
Define “high” and “low”
s
s
3/
9.0222
2
• Low expression level:Most of the variance is due to the additive error component. 95% CI:
• High expression level:Most of the variance is due to the multiplicative error component. 95% CI:
s
s
s
/3
9.0222
22
))ˆ(96.1ˆ,)ˆ(96.1ˆ( VarVar
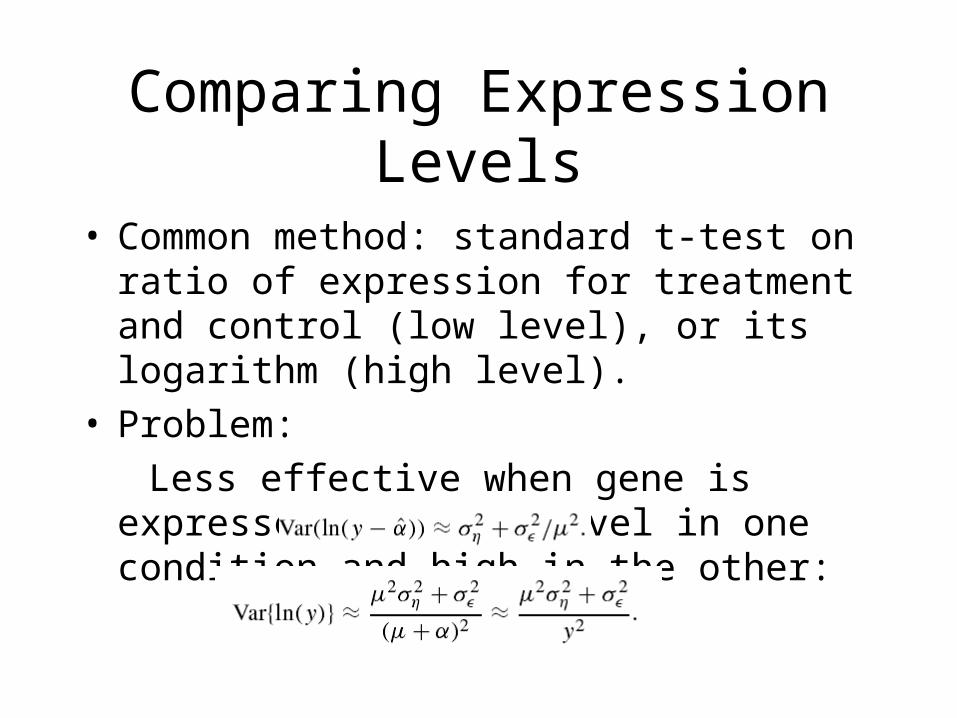
Comparing Expression Levels
• Common method: standard t-test on ratio of expression for treatment and control (low level), or its logarithm (high level).
• Problem:
Less effective when gene is expressed at a low level in one condition and high in the other:
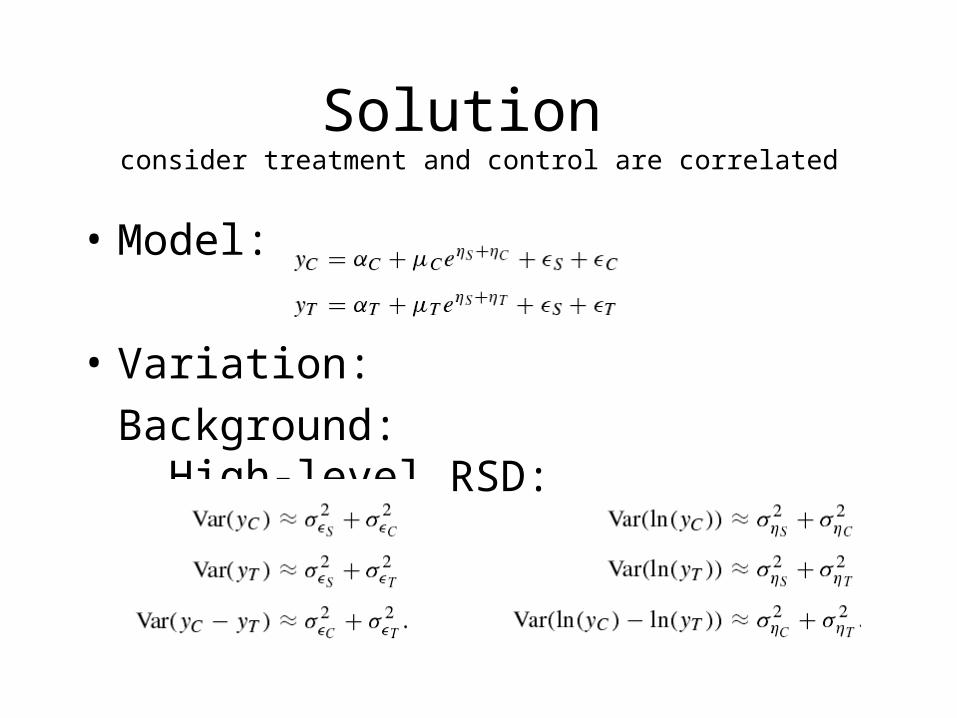
Solution consider treatment and control are correlated
• Model:
• Variation:
Background: High-level RSD:
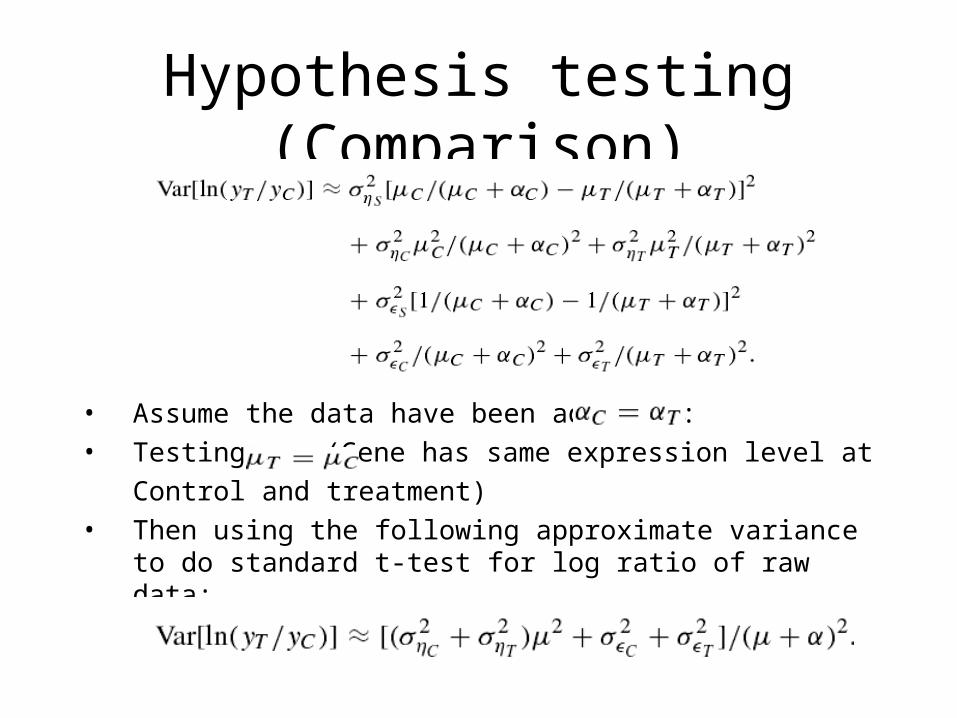
Hypothesis testing (Comparison)
• Assume the data have been adjusted:
• Testing: (Gene has same expression level at
Control and treatment)
• Then using the following approximate variance to do standard t-test for log ratio of raw data:
Limitations
• No theoretical result for above estimations. (Consistency and asymptotical distribution)
• Cutoff point of high level and low level is fairly artificial
• The convergence of estimation of background information is heavily dependent on data and initial selection
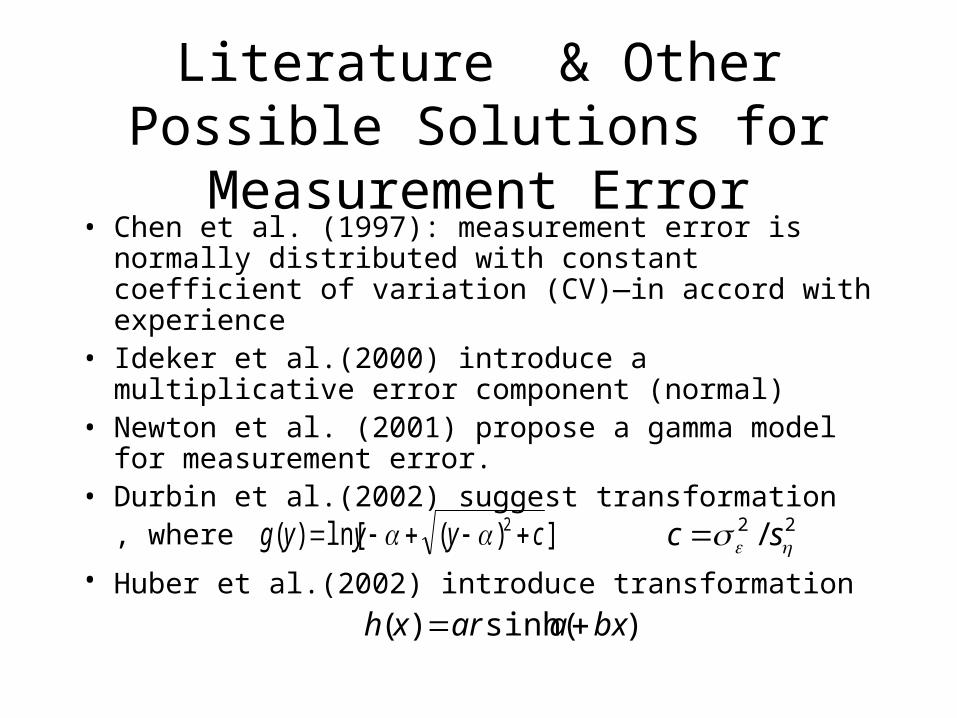
Literature & Other Possible Solutions for Measurement Error
• Chen et al. (1997): measurement error is normally distributed with constant coefficient of variation (CV)—in accord with experience
• Ideker et al.(2000) introduce a multiplicative error component (normal)
• Newton et al. (2001) propose a gamma model for measurement error.
• Durbin et al.(2002) suggest transformation, where
• Huber et al.(2002) introduce transformation ])(ln[)( 2 cyyyg
)sinh()( bxaarxh
22 / sc
References
• Blythe Durbin, Johanna Hardin, Douglas Hawkins, and David Rocke. “A variancestabilizing transformation from gene-expression microarray data”, Bioinformatics, ISMB, 2002.
• Chen. Y., Dougherty, E.R. and Bittner, M.L.(1997) “Ratio-based decisions and the quantitative analysis of cDNA microarray images”, J.Biomed. Opt.,2,364-374
• Wolfgang Huber, Anja von Heydebreck,Martin Vingron (Dec.2002) “Analysis of microarray gene expression data”, Preprint
• Wolfgang Huber, Anja von Heydebreck, Holger S¨ultmann, Annemarie Poustka, and Martin Vingron. “Variance stablization applied to microarray data calibration and to the quantification of differential expression”, Bioinformatics, 18 Suppl. 1:S96–S104, 2002. ISMB 2002.


![Printed from Grundfos Product Centre [2018.06.003] Exploded view ( TM057026 for MGE model H/I ) 251d 251b 290 287 277a 286 277 273a 273 268 268a 289a 289 288b 288 288a 251a 252b](https://img.pdfslide.net/doc/110x75/5ea6377b5d710a471b17081d/-printed-from-grundfos-product-centre-201806003-exploded-view-tm057026.jpg)