Embed Size (px)
Citation preview

ED 327 112
AUTHORTITLE
INSTITUTION
REPORT NOPUB DATE
DOCUMENT RESUME
HE 024 142
Adelman, CliffordLight and Shadows on College Athletes: CollegeTranscripts and Labor Market History.Office of Educational Research and Improvement (ED),Washington, DC.OR-91-504Dec 90
NOTE 47p.
AVAILABLE FROM Superintendent of Documents, U.S. Government PrintingOffice, Washington, DC 20402.Reports - Research/Technical (143) --PUB TYPE
EDRS PRICEDESCRIPTORS
MF01/PCO2 Plus Postage.*Academic Achievement; Academic Records; *Athletes;Basketball; Black Students; *College Athletics;Colleges; College Students; Comparative Analysis;Course Selection (Students); Economic Opportunities;*Educational Status Comparison; Education WorkRelationship; Employment Opportunities; Football;Higher Education; Intramural Athletics; Labor Market;Noncredit Courses; Physical Education; Scholarships;*Socioeconomic Status; *Student Characteristics;Theater Arts
IDENTIFIERS *National Longitudinal Study High School Class1972
ABSTRACTData from the National Longitudinal Study of the High
School Class of 1972 were used to evaluate the contention thatbig-time college sports exploit athletes, denying them an educationthat will help them succeed after college. The sample (N=8,101)consisted of six comparison groups of students who attended four yearcolleges: varsity football and basktball players; varsity athletesin other sports; intramural sports participants; performing artsstudents; nonathletes; and a residual group who claimed to be activein athletics, identified by transcript entries for "varsity" or"intercollegiate" sports, whether the entries carried credits or not.Major findings of the study include the following: (1) varsityathletes, including football and basketball players complete thebachelcr's degree at a reasonable rate, but it takes them longer todo so than other groups, their grades are lower, and their curriculaare less demanding; (2) ex-varsity football and basketball players dovery well economically in the first decade of their worklives,whether or not they earned college degrees; and (3) at age 32, theyhad the highest rate of home ownership, the lowest rate ofunemployment, but were the most likely to have lower statusoccupations than other groups. Results suggest that colleges do notexploit athletes but that the near term educational promises collegesmake to students are not being kept. Includes 19 references and 17tables. (LPT)

yightSliadowsallegeAthletesCollege Transcripts
andLabor Market History
Clifford AdelmanSenior Associate, Office of Research
U.S. Department of Education
For sale by the Superintendent of Documents, U S Government Printing Office, Washington, DC. 20402

U.S. Department of EducationLauro F. CavazosSecretary
Office of Educational Research and ImprovementChristopher T. CrossAssistant Secretary
Office of ResearchMilton GoldbergDirector
information ServicesSharon K. HornDirector
December 1990
4

Contents
Acknowledgments
Executive Summary
Identifying Varsity Athletes
Six Comparison Groups
Performing Arts and Varsity Athletics
Demography of the Sample
High School Backgrounds
College Performance: Some Positive Findings for Athletes
The College Record of Varsity Athletes: A Shadow Falls
Varsity Athletes at Age 32: An Economic Success
Varsity Athletes at Age 32: Another Shadow Falls
What Is This Chapter Really About?
References
5
iv
3
4
5
8
8
9
12
16
18
19
24
Acknowledgments
Everyone who uses the data bases of the National Longitudinal Study of the High SchoolClass of 1972 is indebted to the National Center for Education Statistics and its Commis-sioner, Emerson Elliott, for developing what is unquestionably the richest archive everassembled on a generation of Americans. For all my studies based on the NLS 72, I owemore than this space can accommodate to Paula Knepper and Nabeel Alsalam of NCES.
For the study of varsity athletes, my particular thanks for reviews, criticisms, andprobing questions on the various drafts and earlier presentations go to my former colleague,John Taylor, Kit Morriss of the Knight Foundation's Commission on Intercollegiate Athletics,Ken Cooper of The Washington Post, Doug Lederman of The Chronicle of Higher Education,Lauress Wise of AIR, and a chorus of colleagues including Dennis Carroll, Carl Schmitt, SalCorral lo, and Joe Conaty.
iv 6
- -

Light and Shadows on College Athletes
Clifford AdelmanSenior Associate, Office of Research, U.S.E.D.
Executive Summary
[This paper will be a chapter in Archives of a Generation, to bepublished in the winter of 1990-91, and refers to another chapterin that volume.]
This paper examines the long-term educational and labor market careers of collegevarsity athletes in the National Longitudinal Study of the High School Class of 1972(NLS 72). The NLS 72 data include high school records and test scores, 12 years of collegetranscripts, and 14 years of labor market history, along with massive amounts of informationcollected from participants in 1972, 1973, 1974, 1976, 1979, and 1986.
The advantages of this data base are that it provides unequivocally accurate long-termcollege graduation rates, detailed data on college courses taken, and data on labor marketparticipation (occupation, earnings, etc.) on a generation through age 32. Also, this data baseis "naturalistic"; that is, because it starts with a sample of all high school seniors, whateversubsequently happens to them is not distorted by decisions to study specific groups ofstudents.
Six groups of students who attended 4-year colleges were compared: varsity footballand basketball players, varsity athletes in other sports, performing arts students, intramuralsports participants, nonathletes, and a residual group (i.e., everyone else). The athletes wereidentified from transcript entries for "varsity" or "intercollegiate" sports, whether the entriescarried credit or not. Because not all colleges enter such information on transcripts, thesample for this group is understated, but there is no doubt that the people identified in thismanner were in fact varsity athletes.
The major findings, some unexpected, were as follows:
Compared with the other roups, varsity football and basketball players enter collegewith relatively poor high school records and test scores an:: the highest ratio efvocational to academic subjects in high school, yet graduate from college at only aslightly lower rate.
The principal reasons for this outcome are that varsity football and basketball players(a) are more likely than students in the other groups to receive scholarships and(b) they are more likely to enter college directly from high school. Other evidence
7
strongly suggests that these athletes have access to a "safety net" that is not availableto other students.
On the negative side, those varsity football and basketball players who graduate takelonger to do so than nonathletes, earn lower grades, and pursue less demandingcurricula.
Varsity football and basketball players earned one out of every seven credits in a defacto sports curriculum. Compared with the other groups, these students were morelikely to have taken remedial and introductory courses, personal service ad develop-ment courses, and vocational courses in trades and office support.
Nonetheless, at age 32, ex-varsity football and basketball players had the highest rateof home ownership and the lowest rate of unemployment of all groups, along withearnings 10 percent above the mean for all former 4-year college students. Given thefact that a relatively high percentage of these athletes came from low socioeconomicstatus (SES) backgrounds, these data suggest that a high degree of economic mobilitycorrelates with participation in varsity sports.
/ Former varsity football and basketball players were the least likely of any group toclaim that their higher education was relevant to their work, were the least likely towork with ideas "a great deal," and were the most likely to have lower status occupa-tions at age 32 than they had aspired to at age 19. Although job stability and wagesin these occupations may compare favorably at age 32, they are less likely to offerlong-term mobility.
The percentage of respondents listing their occupation at age 32 as "artit, athlete, orentertainer" was lower among ex-varsity football and basketball players than amongany of the other groups.
Most of these findings about all varsity football and basketball players are also truefor black varsity football and basketball players.
Observers have charged that varsity college athietes, particularly those in football andbasketball, are "exploited." With reference to credentials and intermediate-term economicconsequences, the data strongly suggest that this charge is false, although the data imply thatthe near-term educational promises colleges make to students are not being kept.
vi

Light and Shadows on College Athletes
by Clifford AdelnianSenior Associate, Office of Research, U.S.E.D.
The fall season of 1989 came on us early. Dogged by a decade of scandals and sus-pensions, squabbles over admissions standards, and sloganeering over racism, college athleticsmoved from the sports pages to the legislative chambers. While college presidents foughtwith the National Collegiate Athletic Association (NCAA) over voluntary disclosure of thestatus of athletes as students, bills on required disclosure of graduation rates slouched theirway toward law in both House and Senate.'
It is a sign of our cultural values that the question of whether college athletes (particu-larly football and basketball players) actually graduate is of greater concern in national policythan whether college students study any college-level math after high school (only half do),whether business administration majors study any international affairs or foreign larguages(not much), or whether engineering majors have demonstrated proficiency in English suffi-cient to communicate :at clients (they have not). These groups outnumber varsity athletesin the offending sports by 50 to 1 and have a far greater impact on the quality of life in ourNation.
It is also sadly obvious that no research grant ever brought to a university the nationalvisibility that a Final Four or Bowl appearance does, though how much such appearanceshave to do with the fundamental reasons colleges and universities were established in thiscountry (or anywhere else, for that matter), or the reasons that state and federal taxpayerscontinue to support them to the tune of $100 billion annually, is a mystery.
Nonetheless. we argue over graduation rates of athletes. And the arguments that fill thenewspaper columns and the legislative chambers too often refer to either anecdotal informa-tion, single-institution studies, NCAA conference studies, or outright popular inythology (e.g.,Axthelm 1980; American College Testing Service 1981; NCAA 1989; Purdy, Eitzen, andHufnagel 1982; Weistart 1987). :n most cases, the data are gathered and reported by or forinterested parties.
The following two statements from highly regarded sources illustrate the poles of suchreferences:
. . .for football players to earn degrees in many of the mostathletically successful programs is appallingly rare. Graduationrates for football (and basketball) players are often less than halfthose for the student body as a whole.
--Donald Kennedy, president, Stanford University(New York Times, January 28, 1990)
0Li

Student-athletes, in general, have very high graduation rates,usually higher than non-athletes. Based on data from theNCAA, the student-athletes from all sports combined who wereenrolled as freshmen in 1980-1981 posted a median graduationrate of 66.6% compared with 59% for all students at thoseparticular schools.
--Richard Lapchick, director, Center for the Studyof Sport and Society, Northeastern University
(Lapchick 1990)
Where the president of Stanford gets his figures no one asks--and he is not telling. Andwhen the NCAA reports such figures, one has to take a very deep breath, particularly giventhe highly ambiguous way in which the data are reportedand for 291 Division I colleges anduniversities only.' Lapchick unwittingly confirms this skepticism when he refers to gradua-tion rates "at those particular schools."
The purpose of this chapter is to demonstrate how the National Longitudinal Study ofthe High School Class of 1972 (NLS 72) Archive (and, we hope, the High School andBeyond Sophomore Archive in the future) can be used to contribute responsible informationto such policy debates. The subjects here are college athletes, but the focus could be anyother subgroup of students identifiable within such an archive.
Unlike other surveys, the NLS 72 data base was not designed with a study of collegeathletes in mind. The NLS 72 is an unobtrusive, "naturalistic" data base and, as such, hasboth advantages and limitations compared with targeted, intrusive studies.
The principal virtue of a naturalistic data base when dealing with a particular subgroupof students who attended college can be expressed simply: "that is the way it was." Thoseare the fish that were in the sea. We did not sort the fish first, letting some in and some out.We let the sloppy course of history determine who the subjects would be.
The disadvantage of this approach is lack of statistical power. That is, in a naturalsample of all students who were in the same high school class and went to any kind ofcollege at any time over a 12-year period, varsity athletes will make up a small percentage ofthe whole, no matter what sport is at issue. As the 1984 survey of undergraduates by theCarnegie Foundation for the Advancement of Teaching demonstrated, a maximum of 7 per-cent of 4-year college students participated in "intercollegiate athletics" (Boyer 1987).3 Ifthe national visibility, television-contract college sports (men's football and basketball) are atissue, then varsity athletes make up an even smaller percentage of the whole. Whatever wemay say about these persons, we run the risk of large standard errors of measurement.
2
10

Identifying Varsity Athletes
The first task was to drag a number of nets through the sea of NLS 72 data to identifyand describe distinct groups of athletes. The history of this task is itself instructive, princi-pally because of the formidable obstacle that in none of the five NLS 72 surveys conductedafter high school graduation were subjects asked, "Were you a varsity athlete in college?" and"If so, in what sport(s)?"
In my first attempt, I focused on (a) students' responses in 1972, 1974, and 1976 tosurvey questions on degree of involvement in athletics; (b) the number of earned credits insports or sports-related courses (some institutions do give credit for varsity football andvirtually all institutions give credit for courses with titles such as "Care and Prevention ofAthletic Injuries," "Recreation Internship," and "Conditioning and Body-Building"); and(c) kind of college attended (4-year institutions, because athletes at community colleges arenot the concern of Congress and the newspapers).
Four mutually exclusive groupings of students emerged: likely varsity athletes, physicaleducation schoolteachers, intramural athletes, and nonathletes. While providing some primafacie support for the analytical categories in terms of high school backgrounds and collegecourse-taking, the demographic characteristics and college graduation rates of these fourgroups were not very persuasive. More critically, the groupings themselves were speculativeat best.
Next, I turned to the NLS 72 Postsecondary Transcript Sample (NLS/PETS), and flaggedall course titles that were coded under "Physical Education: Activities"' and that used any ofthe following words (verbatim or in abbreviated form): "varsity," "intercollegiate," or "teampractice." These titles were recoded as varsity athletics. There were two such codes: onecovering football and basketball (i.e., the "major" sports), where named, and one coveringeverything else.
This recoding effort indicated who had received a transcript entry (credit-bearing or not)for participation in varsity athletics. Not all colleges enter such information on transcripts,but at least I could be absolutely sure that the students who carried one or both of the twonew course codes were, in fact, varsity athletes.
Following this methodology strictly meant that some students who were clearly varsityathletes were not identified as such, including three basketball players and one each in foot-ball, track, tennis, and skiing. These students had earned between 5 and 16 credits each inthose sports. Two dozen additional students had six or more transcript entries each under the"Physical Education: Activities" code, entries with generalized, ambiguous titles like"Advanced Sports," "Independent Study," "Team Activities," and "Competitive Athletics,"but because they were not physical education majors and because the keywords ("varsity,""intercollegiate," or "team practice") were missing, I did not identify these students as varsityathletes.
11
An interesting illustration of transcript discrepancies and the rigor with which thedecision rule was applied involves the military service academies. The Air Force Academyentered course titles on transcripts in such a way that varsity athletes are identifiable, butneither the Naval Academy nor the Military Academy did. All three schools expect cadets tobe active in athletics; all three require physical education courses in each year of attendance,and all three enter those courses on transcripts.
I include women's basketball under major varsity sports because, of all women's sports,basketball receives the most media attention. The critics will argue that because there is noprofessional league for women's basketball, colleges do not serve as the minor leagues asthey do for the National Football League and National Basketball Association, so the potentialfor exploitation and scandal is minimal and women should not be included among "varsityathletes: major sports." I regard such criticism as a sad commentary, even though thepremise is honest.
Six Comparison Groups
A cascading logic was used to sort students into six groups (i.e., students in group #1could not be part of any other groups even if they met the conditions for membership). Thefirst condition for all these groups was college attendance confined principally to 4-yearcolleges. The variable for college attendance pattern used in chapter II of this volume has10 values, and in 6 of them, the 4-year college experience dominates.' Of the 12,599 studentsin the NLS 72 transcript sample (NLS/PETS), 8,101 fell in these ix patterns; these studentsconstitute the basic universe for this study. Of this group, just under 3 percent were varsityathletes in any sport in college.
4
The six groups identified are the following:
Varsity Athletes: Major Sports (Football and Basketball). Each student :n thiscategory had at least one transcript entry (credit-bearing or not) tinder the new codefor "Physical Education: Major Varsity Sports." Students who participated in bothmajor and other varsity sports were included in this category only. There were 134students in this group.
Varsity Athletes: All Other Sports. Each student in this category had at least onetranscript entry under the new code for "Physical Education: Other Varsity Sports."There were 93 students in this group. Baseball and track were the most frequentlyindicated sports in this group, followed by tennis, golf, swimming, and soccer.
Performing Arts Students. This key control group is discussed at some length in thenext section. Students in this category indicated in the base year (1972) survey thatthey had been very active in one or more performing arts in high school; on theircollege transcripts, they earned more than six credits in performing arts courses
2

involving actual performance (not music theory or stagecraft, e.g.). There were 310students in this group.
Int:amural Sports Participants. Students in this category claimed to be very active inathletics on all three occasions when they were asked in the surveys (1972, 1974, and1976). Yet their transcripts showed three or fewer "sportscredits," even in basiccourses. (I chose three credits as the cutoff because it was the mean number of"sportscredits" earned by all 8,101 students in the sample for this analysis.) I amassuming t:tat these people were active in either intramural or personal athletic en-deavors. If other varsity athletes exist in the NLS/PETS, some are probably includedamong the 629 students in this cWegory. The number and weighted percentage (7.8percent) of this group is probably low: the Carnegie Foundation survey of undergrLd-uates claimed 14 percent engaged in intramural sports for more than 2 hours per week(Boyer 1987, 181).
Nonathletes. Students in this category never claimed to be active in athletics. Inadditic.., their college transcripts show no "sportscredits." This large group numbers2,400.
Everybody Else. Some people in this group claimed on only one or two sut veys tobe active in athletics. Some earned "sportscredits." But none of them met any of themembership criteria of the other five groups except college attendance pattern. Thisresidual group is the largest of the six: 4,535.
From this point on, however, I refer to weighted percentages of students, not numbers.Depending on the variable under discussion, I use one of three NLS 72 panel weights.' TheNat' )nal Center for Education Statistics constructed these weights to account fo- sample de-sign and to provide population estimates. The reader should not interpret t. y table as repre-senting the entire NLS/PETS sample of 12,599. Because all data in this chapter refer only tothe 8,101 students who met the basic criterion of college attendance in which the 4-year col-lege experience is dominant (see footnote #5), some of the data do not match data in otherchapters.
Nearly all comparative percentages discussed ii . the text are statistically significant at the.05 level. Standard errors are provided, as appropriate, both in the text and in the tables fol-lowing the text.
Performing Arts and Varsity Athletics
The primary reason for identifying performing arts students as a subgroup in thisanalysis is that they are an important component of mother, very prominent, project, namely,the National Study of Intercollegiate Athletes, carried out by the American Institutes forResearch (AIR) for the Presidents' Commission of the NCAA. The AIR undertaking is alarge, complex study that looks into the lives, backgrounds, social and psychological
1 3

development, college experiences, finances, perceptions, and feelings of current collegeathletes in 42 Division I NCAA schools. The project also includes a transcript sample of'2,077 students at 20 of these schools.' The study delves deeply on a narrow playing field, soto speak, and in this respect, it is valuable. In other respects, its value is limited: none of thestudents in the study had graduated from college, the sampling was designed to producequotas in various categories, the ratio of varsity athletes to other students was 3:1, and thestudy covers only Division I NCAA schools--291 institutions out of 1,800 4-year colleges inthe United States.
A critical feature in the conceptual framework of the AIR studies is a control group ofstudents with which college athletes are compared. Loosely defined, this control groupconsisted of "other students who devote a great deal of time to a particular extracurricularactivity [other than athletics]" (AIR 1988b, 17). The 42 institutions themselves identifiedextracurricular activities based on the following criteria:
They require 15 or tnore hours ner week;
They involve competition;
Successful performance involves physical and emotional pressures;
These activities are related to possible careers;
The special talents necessary for these activities can be identified in individuals at a"relatively young age"; and
These activities offer such extraordinary personal (social, psychologiccil) benefits foparticipants that stopping participati,n may have severe consequences ("real costs").
What extracurricular activities were identified in this mariner? The following, with thepercentage of the AIR extracurricular student sample in each (AIR 1988a, 83):
Performing arts 37%Student services, government 14
Work-study 12
Fratennty, sorority 10
Club sports, intratnurals 8
Clubs 8
Newspaper, magazine, radio station 8
Other 3
Only one of these categories of extracurricular activities really meets the six criteria,however, and it is the same category that would qualify on other, more valid criteria relatedto athleticsnamely, performing arts.
6
1 4

What are those other more valid criteria? There are four. First, performing artsactivities and the groups that execute them--orchestras, drama troupes, bands, dance com-panies--are necessary to the maintenance of ;-,stitutional culture in any college and, in someinstitutions, contribute to the distint t identity of that culture. The performing arts are verymuch like varsity athletics in this regard: both can provide the insti'ution with identity, aswell as a distinct coloring to student life that, for example, college newspapers, radio stations,and fraternities and sororities do not. Because the display of student talent in both athleticsand performing arts is organized around discrete, nonroutine events, these activities are alsodisti%ct from the daily, often routine activities associated with clubs, newspapers, radiostations, student services, and social organizations like fraternities.
Second, in the case of both performing arts and varsity athletics (unlike most of theotl er categories in the AIR control universe), the extracurricular is co-curricular. There arederees in performing arts, and there are de facto degrees in varsity athletics. There are no(11:zrees in clubs, student services, work-study, intramural sports, or Greek life. Along thesesf me lines, the other extracurricular activities on the AIR list can function without faculty.Not so ,he performing arts. They require expert coaching, directing, instruction, and critique--ju3t ar, varsity athletics do. And, in general, colleges maintain expert staff to perform thesefunctions. It is also true that both performing arts and athletics, unlike the other extra-curricular activities in the AIR universe, are continuous curricula tied to organized instructionin educational institutions from the elementary grades through college. Prospective schoolteachers and college faculty are trained in and can be certified or credentialed in both areas.
Third, as industries, both performing arts and athletics possess high visibility, highglamour, and mythological power. Our media have canonized the secular dreams of thou-.sands of young people to become stars of the playing field, stage, or screen. And college canserve as an incubator of these dreams. Even though the odds against success are overwhelm-ing, the -ireams do not die easily.
Fourth, collegiate-level performing arts are informed by normative values, and collegesare normative institutions. College newspapers and work-study programs, for example, arenot normative organizations. Amateur athletics should be normative, but what puts collegeathletics on the front pages of the newspapers today derives from the fact that they are not(Cullen, Latessa, and Byrne 1990; Sperber 1987).
Indeed, the differences bem,:en performing arts and varsity athletics stem from this fact.There are no $1 billion television contracts associated with college-based performing artsgroups and no audiences of 30 million on New Year's Day. Piano or ballet competitions inLeningrad aside, there is no international Olympics of amateur dance, drama, or music.
Other differences should be obvious. There is but one U.S. sports academy that grantsbaccalaureate degrees, but dozens of American academies of music, theater, and film do so.And the professionalism in the curricula of these academies has been assumed by manycolleges and universities under the rubric of "the conservatory degree." We do not giveconservatory degrees in athletics--at least we do not admit that we give them; but we are
1 5

forthright about degrees such as the B.F.A. in theater or the B.Mus. and do not pretend thatthese degrees do anything more than prepare individuals for professional roles in the per-forming arts. The B.A. in music and the B.A. in drama are, however, fundamentally differentfrom a conservatory degree: they do not require as much specialized work and allow farmore room for taking courses across the broad fields of knowledge, a breadth characteristic ofthe generic Bachelor of Arts degree.
Despite the analogies between the performing arts and athletics, performing arts studentsand varsity athletes are, as this study demonstrates, very different groups of people. In ad-dition, the labor market experience of the NLS 72 cohort demonstrates that performing artsactivities are far more significant than varsity athletics to participants' careers.
Demography of the Sample
Table 1 provides basic demographic information on the six groups. It is not surprisingto find that the percentage of blacks among varsity football and basketball players is morethan double the figure for all blacks in the sample (18.0 percent vs. 8.7 percent). Even so,the percentage seems low. (But remember that this data base covers students in all 4-yearcolleges, not merely Division I NCAA schools.) The lowest percentage of blacks is foundamong intramural sports participants, indicating that blacks active in sports, who come fromlower socioeconomic status (SES) backgrounds to begin with, are naturally more likely toparticipate in intercollegiate sports--where the scholarships lie.
Indeed, varsity football and basketball players (of all races) are least likely of all sixgroups to come from high-SES housellds and are most likely to receive scholarships (asdiscussed below). Students from high-SES backgrounds participate disproportionately inminor varsity sports (which arL dominated by baseball and track, but also include skiing,tennis, and golf, i.e., the leisure sports of the upper middle class) and performing arts (thetalents for which require early development through private lessons and hence are generallyinaccessible to the poor).
The demographic differences between nonathletes and the residual category are negligi-ble for all variables with the exception of sex. Here, the composition of all six groups,though, helps greatly in explaining their comparative academic performance (see the follow-ing section).
High School Backgrounds
The conventional wisdom, which says that varsity athletes, particularly those in majorsports such as football and basketball, have comparatively weak academic backgrounds, iscorrect. As table 2 indicates, college varsity athletes took far fewer foreign language coursesin high school than anyone else and studied less math and science than anyone except the
8
16

performing arts students. Intramural sports participants, in contrast, had thL strongest back-grounds in math and science.
At the same time, the future varsity football and basketball players took more semestersof trade and business courses in high school than any of the other groups.
Athletes in major varsity sports had the lowest mean high school class rank of all sixgroups and were least likely to come from the top quintile of their high school classes(table 3). This combination of limited study in college preparatory subjects and loweracademic performance may explain, in part, this group's significantly lower scores on theScholastic Aptitude Test (SAT) and American College Testing Program (ACT) (table 4).Under NCAA's Propositions 48 and 42, students whose combined SAT scores are below 700are precluded from playing varsity spot.: in their freshman year. One out of four varsityathletes in the NLS/PETS would have been excluded had this rule been in effect in the 1970s.In fact, roughly two out of three varsity athletes scored below the mean for the comparableNLS/PETS sample on the SAT (and ACT converted to SAT scales).
What about the other comparison groups? Varsity athletes in minor sports had thehighest SAT scores, rcflecting both better academic performance in high school and moreclasses in foreign languages and science. Performing arts students were distinguished by thepaucity of their high school work in math and science and the significant amount of time theyspent in formal fine and performing arts courses. But neither fact seems to have affectedtheir high school class rank or SAT and ACT scores as much as poor preparation affectedvarsity football and basketball players. One reason is that more than 60 percent of the per-forming arts students are women, and women consistently have higher high school class rankthan men, no matter what set of curricular controls are applied.
A second reason, and one that also applies to varsity athletes in minor sports, is that afar higher percentage of performing arts students than varsity athletes (51.7 percent vs.32.6 percent) come from the top quarter of tne SES range (see table 1), and SES is one of thestrongest correlates of both high school performance and SAT and ACT scores.'
College Perfo,-.nance: Some Positive Findings for Athletes
One of the major findings of this study is that varsity athletes, including football andbasketball players, complete the bachelor's degree at only a slight:y lower rate than anyoneelse, and that black varsity athletes complete the bachelor's at a higher rate (50.2 percent)than do all blacks in the sample (44.9 percent), and black nonathletes in particular (26.2 per-cent). The importance of this finding should not be understated, as the NLS 72 is the onlyextant data base that accounts for eventual degree completion (within 12 years) and that basesits account on college transcripts and not testimony of football coaches or college presidents.
Table 5 summarizes the data on the highest degree earned. Most of the differences indegree attainment rates among the six groups are statistically significant. The one exception
1 7

is the comparison between varsity athletes in major sports and the residual group ("everybodyelse"). But in this case, the difference in graduation rates is slight to begin with.
As for blacks (who are of particular concern in connection with varsity football andbasketball), the numbers in some categories are too small and the standard errws too high, butthe differences in the percentage of blacks earning B.A.s suggest that participation in majorvarsity sports was not a drag on the degree-completion rate in this NLS 72 generation--atleast among the students identified with certainty as varsity athletes. It is also worth notingthat a far higher percentage of black varsity football and basketball players who completedthe B.A. also completed a graduate degree than did both white athletes (28.7 percent vs.11.8 percent) and all other categories of blacks except those in the intramural group.9
Varsity athletes start college at a disadvantage: less adequate high school preparation,lower high school performance, lower SAT and ACT scores. Yet, over the 12-year periodcovered by the NLS1PETS, they do no worse than other groups in terms of college comple-tion. Why?
Scholarship Support
First, they receive scholarships in excess proportion to their numbers (table 6). Scme55.9 percent of the NLS 72 varsity football and basketball players received scholarshipsduring the first 2 years after high school, versus 49.6 percent of performing arts students and31.6 percent of nonathletes. In contrast, the AIR study of 1987-88 (AIR 1988a) reported that60.1 percent of football and basketball players at Division I NCAA schools were on fullscholarships, and that nearly three out of four had received athletic scholarships (AIR 1988a).It may well be that we passed out more athletic scholarships in the 1980s than we did in the1970s, but the differences are more likely due to the broader representation of institutions inthe NLS 72 sample. Whatever the case, a student getting a scholarship is less likely to dropout of college for financial reasons and less likely to interrupt or attenuate study by taking ona job compared with other students.
Indeed 68.7 percent of all students who attended 4-year colleges and received scholar-ships in the first 2 years following high school graduation completed bachelor's degrees,compared with .52.4 percent of those who received no scholarship support at any time.
The AIR study provides an additional note on the finances of varsity football and basket-ball players. Some 52.2 percent of those athletes reported that it was easier to get a summerjob, versus 28 percent of varsity athletes in other sports and 32.1 percent of the extracurricu-lar group. (AIR 1988a, 11). This is another piece of the safety net that has been woven bycoaches and boosters to ensure the continuing quality of their teams.
Performing arts students are just as likely as varsity football and basketball players toreceive scholarships at some time during their college careers (defined here as within 7 yearsfollowing high school graduation). However, the difference between these two groups and allother groups in this analysis is substantial and significant. This story is not new: colleges
10
1 V

recruit with scholarships (regardless of need--and remember that performing arts students tendto come from higher SES backgrounds than students in the other groups) students who canmaintain institutional culture and nonacademL life.
No Delayed Entry
Second, varsity football and basketball players are more likely to enter college immedi-ately after graduation from high school than most other comparison groups, and the differ-ences are statistically significant (table 7). Immediate entrance to postsecondary education isa very strong correlate of B.A. completion:
Percentage of students earning B.A.within 12 years of high school graduation
Delay (standard errors in_parentheses)
None 66.3 (.216)6-15 months 51.3 (.939)16-27 months 42.6 (1.23)28-51 months 45.2 (1.19)52 + months 19.2 (.724)
Why do varsity athletes in major sports enter college with no delay? One can onlyhypothesize: coaches recruit them and want them on campus in August to start practice,which means they register for courses in September.
Varsity athletes in other sports and performing arts students are even less likely to delayentry to college. The reasons in this case are more traditional: these two groups have higherhigh school class ranks (table 3), higher SAT and ACT scores (table 4), and higher SES pro-files (table 1). This background is more likely to lead to direct entry and completion of thebachelor's degree than any other.
Safety Net
The evidence of the AIR studies leaves no doubt that varsity football and basketballplayers have t their disposal a much broader safety net of supportive services than otherundergraduate students. (The NSL 72 archive does not include this kind of information.) Itis much easier for these athletes to receive help from tutors, academic counselors, teachingassistants, and profi ssors than for other groups of students (AIR 1988a, 44). And amongblack varsity foottall and basketbal' players, whether at predominantly white or predomi-nantly black colleges, the perceived ease of access to this supportive service network is evengreater (AIR 1989a, 34-35).
Although one might question the motivation for this safety net, it certainly contributes toa higher graduation rate than would otherwise be the case given the academic backgrounds of
11

varsity football and basketball players. As the following section demonstrates, the safety netsteers these athletes along comparatively easy paths to degrees.
The College Record of Varsity Athletes: A Shadow Falls
The degree completion rate of college varsity athletes in major sports is only part of thestory. When we begin to examine other factors in these students college careers, the funda-mental paradox of that completion rate--namely, that the athletes finish despite significantlyless adequate secondary school preparation--is unmasked.
The second major set of findings of this study may be stated as follows: college varsityathletes, particularly football and basketball players, may complete bachelor's degrees at arespectable rate, but it takes them longer to do so than other groups, their grades are lower,and their curricula are, to put it mildly, less demanding along t'le way.
Time to Degree
Table 8 shows the time-to-degree data. It is immediately--and strikingly--obvious thatamong students who earn bachelor's degrees, a far lower percentage of varsity athletes (nomatter what sport is at issue) than other groups complete the degree in 4 1/2 years followinghigh school graduation. It is also obvious that varsity athletes catch up to most of the othergroups by 5 1/2 years.
Given these differences, it is not surprising to find that varsity football and basketballplayers are the group most likely to earn more than 132 undergraduate credits (table 9),although I cannot explain the lower figure for varsity athletes in other sports. Credits areproxy measures for time, and students receive credits for passing courses. If a student'scumulative grade point average (GPA) within his or her major does not meet minimumstandards, the student either stops or drops out of college or continues taking courses at a re-duced load (and earning credits) until the standards are met. Varsity football and basketballplayers tend to have lower GPAs than do other students (see below), hence the chances aregreater that they will earn more credits along the way to the bachelor's degree. Even slightlylighter credit loads (e.g., 13 credits per semester as opposed to the 15-credit norm) will pro-duce the same result. While coaches may have found ways ("red-shirting" being the mostcommon) to stretch out eligibility to 5 years,'° the more critical factor influencing what hap-pens to varsity athletes after they leave college is what they study along the way.
What Did They Study?
Whitner and Myers's (1986) portrait of a college athlete provides typical anecdotalguidance: "Because Mike was an entering freshman and an athlete, the difficulty of his courseload was somewhat below that of most entering freshmen," with Mike himself expecting thatcollege would be "just like high school. If you were good in your sport--they would passyou" (pp. 665, 662).
12
2 ()

There are a number of ways to describe the college curricula of varsity football andbasketball players. One way relates to their comparatively weak high school preparation,which indicates that they might need remedial courses in English and math in college. Thehigh percentage of these athletes who took remedial courses should surprise no one:
Percentage taking Percentage takingGroup remedial English remedial math
Varsity: major 32.9 (2.137) 35.6 (1.992)Varsity: other 17.3 (1.378) 29.9 (1.489)Performing arts 18.2 (.763) 25.9 (1.227)Intramurals 14.6 (.624) 20.4 (.776)Nonathletes 13.5 (.341) 19.2 (.339)Everybody else 24.7 (.278) 32.2 (.363)All 20.3 (.203) 27.1 (.249)
NOTE: Standard errors are in parentheses.
A second way to describe the curricula of varsity athletes is in terms of the specificcourses that account for the largest proportion of the students' total earned credits. How doathletes--compared with other groups of students--use their academic time? The data for thisanalysis are presented in table 10, which lists all course categories that accounted for at least0.5 percent of the total credits earned by any group of students in the NLS 72 college sample.
The 43 course categories (out of 1,037 possible) listed in table 10 accounted for 37.6 to56.3 percent of the total curricular time of each of the six groups.
In general, these figures show a very high degree of common curricular concentration.But other than performing arts students (particularly music majors), varsity basketball andfootball players had the most concentrated common curriculum. That is, they did more oftheir undergraduate work within the boundaries of a relatively small number of courses thanstudents in four of the five other groups under examination.
On the other hand, performing arts students took more of their undergraduate workwithin a small number of fields than any other group of this analysis. Indeed, it is apparentthat, compared with varsity athletics of any kind, performing arts are far more co-curricularthan an extracurricular activity. After all, one can major in performing arts, whereas it's hardto "major" in football--even though, as some will argue, it can be done.
The analysis of curriculum for any subgroup of students must take undergraduate majorinto account. In comparing the curricula of varsity football and basketball players with thecurricula of performing arts or intramural sports participants, for example, major tells much ofthe story.
13
21
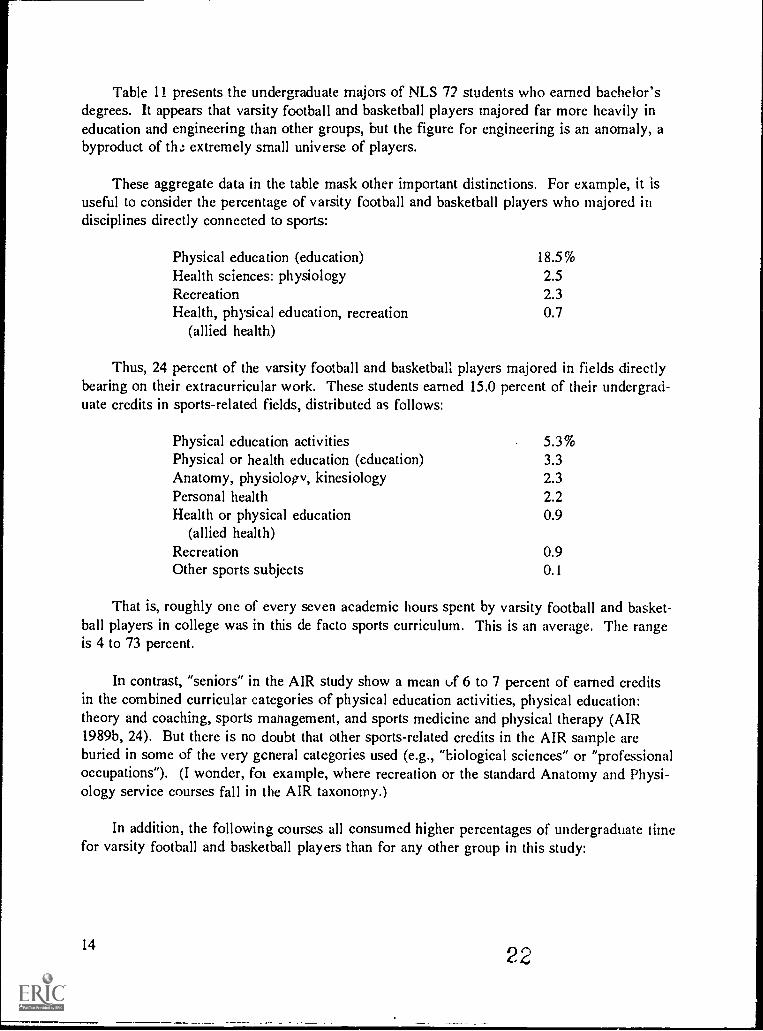
Table 11 presents the undergraduate majors of NLS 72 students who earned bachelor'sdegrees. It appears that varsity football and basketball players majored far more heavily ineducation and engineering than other groups, but the figure for engineering is an anomaly, abyproduct of th." extremely small universe of players.
These aggregate data in the table mask other important distinctions. For example, it isuseful to consider the percentage of varsity football and basketball players who majored indisciplines directly connected to sports:
Physical education (education) 18.5%Health sciences: physiology 2.5Recreation 2.3Health, physical education, recreation 0.7
(allied health)
Thus, 24 percent of the varsity football and basketball players majored in fields directlybearing on their extracurricular work. These students earned 15.0 percent of their undergrad-uate credits in sports-related fields, distributed as follows:
Physical education activities 5.3%Physical or health education (education) 3.3Anatomy, physiology, kinesiology 2.3Personal health 2.2Health or physical education
(allied health)0.9
Recreation 0.9Other sports subjects 0.1
That is, roughly one of every seven academic hours spent by varsity football and basket-ball players in college was in this de facto sports curriculum. This is an average. The rangeis 4 to 73 percent.
In contrast, "seniors" in the AIR study show a mean uf 6 to 7 percent of earned creditsin the combined curricular categories of physical education activities, physical education:theory and coaching, sports management, and sports medicine and physical therapy (AIR1989b, 24). But there is no doubt that other sports-related credits in the AIR sample areburied in some of the very general categories used (e.g., "biological sciences" or "professionaloccupations"). (I wonder, for example, where recreation or the standard Anatomy and Physi-ology service courses fall in the AIR taxonomy.)
In addition, the following courses all consumed higher percentages of undergraduate timefor varsity football and basketball players than for any other group in this study:
1422

Varsitymajor
Performingarts Intramurals
Total 11.7% 6.8% 7.6%Remedial English 1.0 0.6 0.4Basic communication and speech 1.9 1.1 1.0
Regular English composition 3.4 2.9 3.1
Remedial math 1.7 0.9 0.6Personal development 0.9 0.3 0.4Vocational: trades, office 2.8 1.0 2.1
In other words, varsity football and basketball players spent, on average, 4 percent moreof their undergraduate time on basic _kills and the kind of vocational courses usually not as-sociated with baccalaureate degrees than students in either of two key control groups.
The functional-vocational and sports curriculum courses add up to 26.7 percent of theundergraduate credits of all varsity football and basketball players, whether or not they earnedany degrees. Ir. addition, this group earned a higher percentage of credits (15.2 percent) inintroductory courses in humanities and social sciences than q.ny other group. The curriculumof these athletes is not demanding, although it is more diversified than that of performing artsstudents.
Some 54 percent of performing arts students majored in fields directly related to theirartistic activities:
Music education 16.4%Music 16.2Drama 9.8Music performance (conservatory) 5.7Religious music 2.7
,Speech 2.0Dance 0.6Music theory 0.6
It is thus not surprising that performing arts students, as a group, spent much more oftheir undergraduate time in a very bounded set of fields than do varsity athletes. Performin,arts students earned 29.4 percent of their total undergraduate credits in music (includingmusic education, musicianship, theory, literature, and history), drama (including stagecraft,history, and criticism), public speaking, and dance (including dance ?.ducation and history ofdance). In addition, they earned 5.8 percent of their credits in other education courses (ahigher percentage than varsity athletes in major sports, though the two groups have similarratios of education majors).
15
2 0

1
Academic Performance
If we use GPA as a proxy, the varsity football and basketball players as a whole per-formed less well in college than they did in high school (despite their relatively undemandingcurriculum), though among students who earned a bachelor's degree, the GPA of varsity foot-ball and basketball players compares somewhat more favorably. The following table showsthe data for GPAs:
M1S.D.
B.A. recipientsMean Mean S.D.
Varsity: major 2.65 .57 2.87 .44Varsity: other 2.89 .51 2.99 .46Performing arts 3.07 .44 3.14 .43Intramurals 2.69 .70 2.87 .46Nonathletes 2.74 .76 3.07 .47Everybody else 2.80 .55 2.96 .45All 2.79 .63 2.99 .46
In the sample as a whole, varsity athletes (and performing arts students, in particular)evidence less variance (i.e., smaller standard deviations) in undergraduate performance thanthe intramural group and nonathletes. Among students earning bachelor's degrees, however,all groups show similar variability.
The intramural group does not perform as well as one might expect given its relativeSAT and ACT scores and high school class rank. Two factors account for this mediocreshowing. First, the proportion of women in this group is lower (15 percent) even than amongvarsity athletes in major sports (17 percent). Women have higher college GPAs than menacross the board (i.e., no matter what they study). The lower the representation of women inany group, the lower the mean GPA (women are overrepresented among performing arts stu-dents and in the nonathletes category). Second, students in the intramural group study morescience and math (23.8 percent of their total credits) than any other group, and grades in col-lege science and math tend to be lower than those in other fields.
Varsity Athletes at Age 32: An Economic Success
The most frequent criticism of big-time college sports is that they exploit athletes, usingthem to entertain everyone else without providing them with an education that will help themsucceed after college. The popular image of the former college athlete is someone barelyable to read and barely existing on skid row.
The NLS 72 archive allows us to evaluate this contention and image with fairly harddata. If we look at basic economic outcomesvariables such as unemployment, home owner-ship, and earnings--it is obvious that varsity football and basketball players of the NLS 72
16
2 4

data base were rewarded handsomely for the time they spent in higher education, whatever
they did with that time.
This major finding bears repeating: at least in the first decade of their worklives,ex-varsity football and basketball players do very well economically, whether or not they
earned college degrees. As table 12 demonstrates, this group experienced less unemploymentbetween the ages of 25 and 32 than virtually all their peers, and table 13 indicates that theaverage annual earnings of these athletes were comfortably above the mean for students whoattended 4-year colleges. Data on the percentage of former students who owned homes at age32 also indicate that tx-varsity football and basketball players do well financially:
All
Varsity: major 77.1% (1.71)
Varsity: other 77.0 (2.04)
Performing arts 60.9 (1.19)
Intramurals 68.7 (.637)
Nonathletes 59.1 (1.01)
Everybody else 66.4 (.421)
All 64.6 (.387)
NOTE: Standard errors are in parentheses.
Given the fact that the football and basketball players were most likely of all the groupsto come from families in the lowest SES quartile, these data suggest a positive relationshipbetween participation in varsity sports and economic mobility. Other analyses indicate,however, that, for the entire universe of this study, parents' SES, gender, and SAT scores donot correlate with home ownership rates at age 32, whereas race, high school class rank, andcollege varsity status do.
In contrast to this economic success story for athletes, performing arts stu&nts experi-enced the highest incidence of unemployment, the lowest earnings, and the second lowest rateof home ownership of all student groups in this study. Given the fact that they tended tocome from high-SES brackets, they experienced downward economic mobility. This outcomeshould noi be surprising in light of the nature of the labor market for performing arts tal_ Ats.Would-be professional athletes are sorted out of the market at a comparatively young age, butwould-be professional actors and musicians can maintain their dreams and efforts for decades.Can it be said that performing arts students, and not varsity athletes, are the truly exploited?
"Exploitation" is a very strong judgment that can be interpreted in various ways. Is thereference point current status or future status? Is it economic, social, or spiritual? Does thejudgment take informed individual preference, choice, and consent into account? Whatpromises or expectations play a role in the judgment?
17
25

If we promise varsity football players that if they will spent 30 to 60 hours a week inseason entertaining us for 4 to 5 years of their lives, they will get degrees, not have to worryabout finances along the way, and learn how to use their status as varsity athletes to leveragestable jobs and decent salaries, have we exploited them--particularly if they could not getthose jobs and salaries any other way? Have we exploited even those students who aspired tobe professional athletes? I, for one, do not think so. And if stable jobs and decent salariesare all these people sincerely v,:nt, then the trade-off may be fair (I am leaving aside theequally serious question of whether universities ought to be involved in such trades).
Varsity Athletes at Age 32: Another Shadow Falls
Usually, howevet, peo;)le want more than basic economic benefits from life and reasonthat an investment of 4 or 5 years at a college or university should provide that somethingmore. And in this respect, our judgments of the success of varsity athletes in the Class of '72must be muted.
For example, they are the least likely of any group to claim that their higher educationwas relevant to their work:
Varsity: major 22.4% (1.63)Varsity: other 33.5 (2.57)Performing arts 27.6 (1.25)Intramurals 23.8 (.895)Non athletes 25.4 (1,31)Everybody else 28.3 (.618)All 27.0 (.553)
NOTE: Standard errors are in parentheses.
They are also the only group (table 14) that claimed to work less with ideas than withboth people and paper at age 32. Given that the future economy will ren on ideas and infor-mation, this factor nmy put ex-varsity athletes at a disadvantage. In view of their academicrecords, however, it is not surprising that they work less with ideas.
Indeed, job stability and early career earnings may mask future difficulties. Table 15compares occupational expectations at age 19 and eventual occupations at age 32. The datashow that ex-varsity football and basketball players were more likely than at least threecomparison groups to assume lower SES positions (clerical worker, crafts worker, operative,laborer) than they had planned. Although job stability and wages in thcse occupations maycompare favorably at age 32, there is less mobility, and economic comparisons with othergroups would probably be less favorable at age '0.
A degree of realism may have set in among varsity athletes in recent years. The AIRstudy (AIR 1988a) found that football and basketball players in the late 1980s expected to
18
26

have lower SES jobs at age 40 than other groups of students in the study sample. The NLS72 data suggest that these lower expectations are in line with reality.
Tables 16 and 17 provide more detail on the occupations and industries in which the
groups worked at age 32. Along with data previously cited, these tables reveal the fundamen-tal paradox of seemingly benign economic outcomes for varsity athletes, particularly those in
major sports.
Note, in particular, that ex-varsity football and basketball players were the least likelyof all the groups to have jobs in the occupational category "artist, athlete, or entertainer"
(table 16).
Occupations do not match industries very neatly. Why is it, for example, that although13.3 percent of the varsity football and basketball players claimed to be schoolteachers, only9.2 percent worked in educational and cultural services? "Schoolteachers," as an aggregate
category, covers a broad spectrum of occupations in schools, and it is highly possible that athird of the ex-varsity athletes worked as school administrators, hence listed their industry as
"public administration."
Former varsity football and basketball players were more likely than any other group to
describe themselves as "craftsmen": roughly one out of eight. The crafts they worked at
were likely in the construction trades, in which the varsity football and basketball players alsoconcentrated more than the other groups. Overall, these data do not imply that ex-footballplayers tmid to be highly paid hod-carriers at age 32, but they certainly should encourage usto think carefully before we pass judgment on the full extent of their economic success.
What Is This Chapter Really About?
This stor; is ultimately about the promises we make to all students in higher education,
and even beyond that, about the integrity of the enterprise. It is also about the benchmarksby which we measure the fulfilltri,mt of those promises.
A great deal happens to individuals after they leave college (with or without degrees)
that is beyond the control of the institutions they attended. But essential to the basic promiseof higher education is a human capital ideology: higher education leads to high payoffs--economic, social, cultural, and spiritual--and the more education, the greater the payoffs. The
correlate of this promise is that it doesn't happen by osmosis: it requires student effort incollege-level academic work and involvement in the life of a college community. In addition,
there is a more proxin ,e promise concerning the credentialing function of colleges, therelationship between academic work and degree.
The promises, whether implicit in popular conception or explicit in college catalogues,are a matter of trust. And when they are publicly promulgated, they become a matter ofpublic trust.
19
27

It is for this reason, in part, that national legislation is pending. National legislation isnot about 291 institutions out of 1,800 4-year colleges and universities in the United States.National legislation is not about the, relatively small number of college students who playvarsity football or basketball. National legislation is about everybody; and whatever form thatlegislation takes, it is sincerely motivated to remind colleges of their normative function inour society and their ethical responsibility to keep the promises they make to students.
20 28

Notes
1. S. 580 (1989), the Student Athlete Right-to-Know Act, was predicated on theassumption that a prospective varsity athlete will select a college on the basis of the prospectsfor graduation, as indicated by the graduation rates of varsity athletes who previously passedthrough the institution. The law would require the colleges to report these rates. The finalversion of this bill, which is in conference as of this writing, is called the "Student-Right-to-Know and Campus Security Act," and adds reporting requirements for graduation rates foreveryone at a college, campus crime statistics, and campus security policies. Sponsorsdescribe this bill as a consumer information act.
2. The NCAA data define "graduation rate" as a ratio of students who graduated in agiven year (regardless of precisely when they graduated during that year) to those whoentered 5 calendar years earlier (regardless of precisely when they entered during that year).It is thus possible for the period of attendance to range from 4.1 to 6 full years. Also, theonly athletes for whom this graduation rate is reported are "recruited student-athletes" [italicsmine], and it is not clear at all what percentage of students who wind up on varsity teams are"recruited." The graduation rates for recruited student-athletes are compared with the gradua-tion rates for all students--which is not the right comparison (nor is it clear whether "allstudents" includes the recruited student-athletes). Ca ly when graduation rates are presentedby sport is the denominator of the basic equation expanded to include transfer students ex-plicitly. It is thus not clear whether the basic graduation rate applies to athletes who attendedone and only one college. One could go on. The virtues of the NCAA data, however, arethat they differentiate by geographical region, institutional control, and institutional size. In
this respect, they are a significant improvement on previous NCAA-sponsored studies (sc ,
e.g., Chelimsky 1985).
3. It is difficult to interpret the Carnegie data because the random sample of studentswas designed to represent different institutional types according to the 1976 Carnegie Clas-sification, and it appears that specialized institutions were excluded. For example, neitherWest Point nor Rensselaer Polytechnic nor the Rhode Island School of Design is in theCarnegie sample. Nonetheless, the data are a decent benchmark, even though the sample isnot as naturalistic as that of tile NLS 72. At the same titne, both the Carnegie and the NLS72 data render suspicious the claim of a 30.6 percent participation rate in intercollegiateathletics in the Cooperative Institutional Research Project's 1982 followup survey of 1978freshmen Greet ... al. 1983). The senior author of that study admitted that students who hadparticIpated in any kind of organized college sports, including intramural, might well beincluded in this figure because of the way the question was grouped with others.
4. Originally, there were 26,000 titles under the code Physical Education: Activities. Ofthese, 1,100 were sorted into new Recreational Activities categories such as Fishing and FlyCasting, Horsemanship, Yoga, and Self-Defense (judo, karate, etc.). Another 2,100 weresorted into a new category we created for Aerobics, Jogging, Bodybuilding under Health-Related Activities. Another 1,300 that did not belong in either Recreational Activities orHealth-Related Activities ranged from abbreviations for courses in physics to physical therapy
21

(which should be under Allied Health) to physical education for schoolteachers (which shouldbe under Education) to the history of sport (classified in a new interdisciplinary code, Sportsand Leisure Studies) to English literature and agriculture (stranger things happened in theoriginal coding of the NLS 72 transcripts).
5. The six attendance patterns in wh4ch the 4-year college experience dominates (andthe percentage of all NLS/PETS students in these categories) are as follows.
(1) Attended community college and earned associate's;transferred to 4-year college and earned bachelor's. 3.4 percent
(2) Attended community college and earned more than10 credits, but did not earn associates; alsoattended 4-year college and earned bachelor's.
(3) Attended community college and earned associate's;also attended 4-year college and earned at least30 credits but did not earn bachelor's.
(4) Attended both community college and 4-year collegeand earned more than 10 credits from each type ofinstitution, but did not earn any degree.
(5)
(C)
3.3 percent
1.7 percent
2.7 percent
Attended only 4-year college, whether or not degreewas earned. 49.3 percent
Other patterns, such as associate's degree earnedafter bachelor's and associate's degree earned from4-year college (these two account for 70 percentof the cases in this category). 4.1 percent
6. The choice of weight depends on (a) the source of the variable(s) under discussionand (b) whether standard errors were generated. In general, Weight 1 is used for variablesderived from the PETS Sample (e.g., college grade point average or percentage of creditsearned in a particular course) and in most cases (except those involving the fifth followup)requiring standard errors. Weight 3 is used for variables derived from any of the NLS 72surveys up to and including the fourth (1979) followup (e.g., scholarships, career plans atage 19). The FU5 weight is used in the analysis of variables included in or constructed onthe basis of the fifth (1986) followup (e.g., occupation, industry, earnings). These weightswere constructed by the contractors for the various NLS 72 databases. They are describcd inJones, Baker, and Borchers (1986).
7. The differences between the AIR transcript sample and the students in the NLS 72transcript sample are considerable. The numbers of students in various categories in thesesamples are as follows:
22
30

4 II IN III111
NLS 72 AIR
Total 8,101 2,077Varsity: major 134 921Varsity: other 93 608Performing arts 310 [131]Extracurricular 0 382Other black students 809 166
Other Hispanic students 249 0Others 6,506 0
I am indebted to Robert Rossi, director of the AIR study, for the AIR figures. The subset ofperforming arts students in the AIR sample is imputed at 37 percent of the 382 extracurricularstudents. It is obvious that the NLS 72 cohort had far fewer athletes and far more of every-body else--but that's the way it is in any generation of college students.
8. The following relationships between SES and the two academic performance vari-ables, for all students in the sample, need little comment other t'oan to remind the reader thatwe converted ACT scores to the SAT scale:
Mean Score onSAT/ACT (S.E.)
Mean class rank(S.E.)
Highest SES quartile 1,005 (3.58) 63.6% (.422)Middle two SES quartiles 922 (3.28) 58.9 (.365)Lowest SES quartile 853 (6.01) 56.2 (.590)
9. In fact, one of the most significant revelations of the NLS/PETS is that among B.A.recipients, the graduate school entry rate is highest for Hispanics, and the graduate degreecompletion rate is highest for blacks. The problem is that a much lower percentage ofHispanics and blacks complete the B.A. than whites. I have argued elsewhere (Adelman1990) that if we are concerned with black and Hispanic participation in graduate education,the critical task is to increase the br.:alaureate completion rate: do that, and w,.t will witnessa geometric increase in the proportion of black and Hispanic graduate students. There areother issues involved, of course, such as gender and field distributions.
10. Red-shirts (freshmen who practice but do not play with a team) are still eligible for4 years once they begin playing. It is thus possible for graduate students to be members ofvarsity teams, and, indeed, there were a few such cases in both the NLS 72 group and theAIR study. Red-shirting is a risk-free nurturing strategy, a common practice whereby anathlete's skills and strength are improved without losing a year of playing time.
23
31

References/
Adelman, C. 1990. "Minorities in the Graduate Education Pipeline: Plugging the Leaks andIncreasing the Flow." Unpublished background paper for the U.S. Department of Edu-cadon's Task Force on Reauthorization of the Higher Education Act.
American College Testing Service. 1981. National Collegiate Athletic Association Survey ofGraduation Rates After Five Years for Males First Entering College in Fall 1975. IowaCity, Iowa.
American Institutes for Research. 1988a. Report No. 1: Summary Results From the 1987-88National Study of Intercollegiate Athletes. Palo Alto, Calif.
. 1988b. Report No. 2: Methodology of the 1987-88 National Study ofIntercollegiate Athletes. Palo Alto, Calif.
. 1989a. Report No. 3: The Experiences of Black Intercollegiate Athletes atNCAA Division I Institutions. Palo Alto, Calif.
. 1989b. Report No. 5: Analysis of the Academic Transcripts of IntercollegiateAthletes at NCAA Division I Institutions. Palo Alto, Calif.
Axthelm, P. Sept. 22, 1980. "The Shame of College Sports." Newsweek, 54-59.
Boyer, E.L. 1987. College. New York: Harper and Row.
Chelimsky, E. Sept. 12, 1985. "Review of Two Studies on College Athlete GraduationRates." Memo to the Hon. James. J. Howard. GAO Report #B-220175.
Cullen, F.T., Latessa, E.J., Byrne, J.P. 1990. "Scandal and Reform in Collegiate Athletics."Journal of Higher Education 61(1):50-64.
Green, K.C., Astin, A.W., Korn, W.S., McNamara, P.P. 1983. The American College Student,1982. Los Angeles: Higher Education Research Institute/University of California, LosAngeles.
Jones, C., Baker, R., and Borchers, R. 1986. National Longitudinal Study of the High SchoolClass of 1972: Postsecondary Education Transcript Study: Data File User's Manual.Washington, D.C.: National Center for Education Statistics.
Kennedy, D. 1990. New York Times.
Lapchick, R. Feb. 1990. "Interview with T. Marchese." AAHE Bulletin 42(6).
24

National Collegiate Athletic Association. 1989. 1988 Division 1 Academic Reporting Compi-lation. Ivlission, Kans.
Purdy, D.A., Eitzen, S.D., Hufnagel, R. 1982. "Are Athletes Also Students? The EducationalAttainment of College Athletes." Social Problems 29:439-48.
Sperber, M.A. 1987. "The College Coach as Entrepreneur." Academe 73(4):30-33.
Weistart, J.C. 1987. "College Sports Reform: Where Are the Faculty?" Academe 73(4):12-17.
Whitner, P.A., Myers, R.C. 1986. "Academics and an Athlete: A Case Study." Journal ofHigher Education 57(6):659-72.
25
33

Table 1.--The demographics of the six groups
Demographicvariable
Varsity:major
Varsity:other
Performingarts Intramurals Nonathletes
Everybodyelse
Race andethnicityWhite/Asian
Black
Hispanic*/NativeAmerican
79.0% 89.4% 91.9% 93 3%(1.89) (1.54) (.818) (.478)
18 0 6.5 6.4 4.5(1.59) (1.59) (.825) (.313)
3 0 4.1 1 7 2.3(1.33) (.151) (.038; (.295)
90.2% 88.7%(.256) (.24c)
7 1 8.7(.205) (.228)
2.7 2.6
(.158) (.085)
SESLow 17.7 5 9 7.6 11.5 13.0 13.4
(1.39) (.725) (.541) (.533) (.377) (.236)
Mod
High
SexMale
Female
49.6 37.1 40.4 40.9(1.76) (1.62) (1.21) (.985)
32.6 57.0 51.7 47.7(1.76) (1.73) (1.28) (1.24)
82.7 78.8 38.3 85.2(1.41) (2.28) (1.22) (.821)
17.3 21.2 61.7 14.8
42.5 43.8(.587) (.320)
43.1 42.1(.569) (.347)
45 0 51.0( 602) ( 422)
55.0 49.0
* Hispanics may be of any race.
VOTE. The universe is all students who met the college attendance criteria described in foot-note #5. V = 8,101. Standard errors are in -arentheses. Because of rounding, percentages maynot add to 100.
SOURCE: VLS 72 Special Analysis Files,
26

Table 2.--High school curricula
Time and areaof study
< 3 semestersof tc-reignlanguage
< 5 semestersof mathematics
< 5 semestersof science
> 2 semestersof trades
> 2 semestersof business
> 4 semestersof fine andperformingarts
NOTE The universe#5 and whose NLS 72
SOURCE: NLS 72 Special Analysis Files
Varsity:major
Varsity: Performingother arts Intramurals Nonathletes
Everybodyelse All
68.3% 39.9% 42.8% 47.9% 46 6% 52.6% 50.1%
54.3 56.3 62 1 39.2 54.5 53.6 52.9
70.5 55.9 80.6 55.2 65 1 64 8 64.7
15.3 10.5 3.3 9 9 7.5 6.9 7.4
19.5 10.2 12.3 13.1 16.5 19.1 17.4
3.1 12.9 63.1 10 5 16.9 15.6 17.2
is all students who met the college attendance criteria described in footnoterecords include a high school transcript. N - 8,101.
Table 3.--High school class rank
GroupMean In highestrank S.E. quintile S.E. 2
In lowestquintiles S.E.
Total 67.2% .328 38.7% 249 16.6% 192
Varsity: major 62.8 .023 29.6 1 74 19 6 1.60
Varsity: other 68.2 .026 47.5 1 90 13 0 1.38
Performing arts 73.8 .013 50.5 .997 12.0 .488
Intramurals 65.9 .010 35.6 .700 16 1 .773
Nonathletes 67.6 005 40.4 452 18.3 .356
Everybody else 66.7 .004 37.5 .32Z 16.2 .250
NOTE: The universenote #5 and for whom
is all students who met the college attendancehigh school cl'Ass rank was known. N = 7,245.
criteria described in foot-
SOURCE: NLS 72 Special Analysis Files.
27

Table 4.--SAT and ACT scores
SAT or ACT (converted) rangesMean
StandarddeviationGroup 400-700 701-975 976-1148 1149+
Varsity: major 24.2% 42.6% 16.1% 17.1% 93 217(2.42) (2.27) (1.44) (1.60) (22.2)
Varsity: other 9.3 29.5 25 5 35.8 1032 216(2.51) (1.67) (1.74) (2.18) (25.6)
Performing arts 6.3 41 9 32.5 19.2 1007 187
(.089) (1 03) (.90) (1.00) (11.6)
Intramurals 5.5 37 8 33.8 22.9 1026 188(.469) (1 13) (.933) (.873) (8 5)
Nonathletes 10.1 38.1 28.1 23.8 1006 215(.328) ( 469) (.463) (.437) (5.12)
Everybody else 11.6 45.6 28.4 14.4 958 195(.228) (.376) (.329) (.196) (3.32)
NOTE' The universe Is all students who met the college attendance criteria described in foot-note #5 and whose records include either SAT or ACT scores. N - 6,133. Standard errors are Inparentheses. Because of rounding, percentages may not add to 100.
SOURCE: NLS 72 Special Analysis Files.
28
3 6'

Table 5.--Highest degree earned
Group No degree Certificate Associates Bachelor's*
All 32.7% 1.0% 4.3% 62.0%(.224) (.054) (.099) (.223)
Blacks 50.2 1.0 3.9 44.9(.836) ( 270) (.334) (.885)
Varsity: majorAll 31.6 0.7 3.4 64.3
(1.70) (.028 (.054) (1.74)Blacks 47.8 0 2.0 50.2
(4.50) 0 (.187) (4.64)
Varsity: otherAll 26.9 0 2.7 70.4
(.1711 0 (.099) (1.70):necks 48.3 0 0 51.7
. 0
Performing arts'All 20.3 .2 3.2 76 3
(.916) (.005) (.110) ( 926)Blac.:s 38.2 0 2.4 59.4
(2.55) 0 ( 144) (2 64)
IntramuralsAll 29.1 9 2 7 67 3
(.814) (.075) ( 195) ( 825)Blacks 49 7 3.7 0 46.6
(3 56) (.291) 0 (3.70)
NonathletesAll 45.6 1.0 3.7 49.7
(.455) (.08$) (.153) (.428)Blacks 71.1 .5 2.2 26.3
(1.07) (.017) (.445) (1.22)
Everybody elseAll 27.2 1.1 5.1 66.6
(.252) (.070) (.147) (.276)Blacks 41.7 1.1 5.2 52.0
(1.06) (.445) (.497) (1 10)
* This category refers to all students who earned at least the bachelor's
. Ns too small for standard error.
NOTE. The universe is all students who met the college attendance criteria described in footnote #5. N - 8,101. Standard errors are in parentheses. Because of rounding, percentages maynot add to 100.
SOURCE: NLS 72 Special Analysis Files.
3 729

Group
Varsity: major
Varsity: other
Performing arts
Intramurals
Nonathletes
Everybody else
Table 6.--Sc1iol...rship5, 1972-79
Periods during which scholarships were received19721974 1974 gaup-1979 Never received(summer) only scholarship
55.9%(1.67)
47.1(1.84)
49.6(1. 58)
39 2(.646)
31.4(.454)
35.6(.372)
12.8%(1.25)
14 2
(.649)
18.1(1.17)
16.1(.527)
17.0(.409)
17.1(.250)
31.3%(1.27)
38.7(1.90)
32.3(1.20)
44.7( 706)
51.3(.545)
47.3(.407)
These students may also have received scholarships in 1974-1979.
NOTE. The universe is all students who met the college attendance criteria described in foot-note #5. N - 8,101. Standard errors are in parentheses
SOURCE. NLS 72 Special Analysis File.
Table 7.--Time of entry to college
Length of delayGroup No delay 6-15 months 16-27 months 28-51 months 52+ montns
Total 82.0% 7.3% 3.7% 3 6% 3.2%(.178) ( 125) (.091) (.080) ( 071)
Varsity: maj. 89 9 6.5 1 2 2.4 0
(.626) ( 599) (.044) ( 093) 0
Varsity: other 91 4 6.6 1.5 0 0 5(1.45) (1.40) (.056) 0 (.453)
Performing arts 90.4 4.8 1.1 2.1 1 6
(.648) (.109) ( 521) (.i14) ( 422)
Intramurals 84.1 6.3 3.1 2 8 2.9(.657) (.587) (.172) (.106) ( 244)
Nonatbletes 72 1 8.8 6 5 5.4 7 1
(.399) (.277) (.197) ( 180) ( 183)
Everybody else 86.1 6.9 2.5 2 9 1 4
(.207) ( 160) (.096) ( 114) ( 055)
NOTE The universe is all ctudents who met college attendance criteria as described in foot-note #5 and whose transcripts were not missing information on dates of terms in which the studentwas registered. N 8,087. Standard errors are in parentheses. Because of rounding, rows maynot add to 100
SOURCE: NLS 72 Special Analysis Files
30
3 8

Table 8.--Time to degree: High school class of 1972
GroupYear of bachelor's degree
1975-76 1977 1978 197980 1980-84
All
Varsity: major
Varsity: other
Performing arts
Intramurals
Ncnathletes
Everybody else
60.2%(.228)
44.3(2.30)
43.2(2.28)
66.5(1.24)
63.5(1.01)
61 6(.725)
59.3( 372)
19.8%(.213)
34 5
(2.30)
35.9(1.97)
19.2(.586)
20.4(.964)
16.8(.412)
20.2(.318)
7.8%(.147)
9.3( 626)
6.7(.308)
6.0(.623)
6 9(.406)
7 0(418)
8.4(.199)
7.3%(.163)
7.7(.952)
11.2(2.03)
4.2( 608)
5.7( 426)
8.1(.344)
7 4( 209)
5.0%(.131)
4.2(.481)
3.0(1.88)
4.1(.964)
3.5(A05)
6.6(.422)
4.7(.161)
NOTE The universe is all students who earned a B.A. and met the college attendance criteriadescribed in footnote #5. N - 4,897. Standard errors are ii parentheses. Because of rounding,rows may not add to 100.
SOURCE: NLS 72 Special Analysis Files.
Table 9.--T,tal undergraduate credits
Group 0-10 11-29 30-59 60-89 90-132 113.
Varsity: ma)or 1.4% 2.5% 14.2% 11.8% 35.8% 34.8%(.052) (.097) (.542) (1.44) (1.96) (1.77)
Varsity: other 0 5.8 8.0 11.5 52.7 22.10 (1.13) (.846) (1.32) (1.85) (1.44)
Performing arts 0 1 6 5 7 11.4 49 1 32.30 (.301) (.521) ( 729) (1.29) (1 19)
Intramurals 5 5 4 9 8 1 11.3 55.1 14 9( 276) ( 184) ( 616) ( 421) ( 953) , 480)
Nonathletes 11.5 13 6 14 3 11 6 39.1 9 9(.268) ( 284) (.309) ( 207) (.451) (.255)
Everybody else 2.2 5 7 8.4 11 1 52.5 20.0(.101) (.131) (.I80) ( :,4", (.321) ( 227)
NOTE: The universe is all students who met the college attendance criteria described in foot-note #5. N 8,101 Standard errors are in parentheses. Because of rounding, rows may not addto 100.
SOURCE: NLS 72 Special Analysis Files
3931

Table 10.--Distribution of college credits earned, by course category
Coursecategory
Total*Phys. ed. activitiesEnglish comp: reg.Phys ed (education)U.S. hist. surveysGeneral biologyIntro. economicsGeneral psychologyU.S. governmentIntro. communicat.Intro. sociologyVarsity athleticsGeneral chemistryCalculusIntro. accountingWorld or western civIntro. physicsSpe h: elem or int.I* literatureHea.-a practicesBible studiesIntro. geographyAdvanced accountingFrench: elem or intBusiness lawCollege algebraArt historyKinesiologyAnatomy and physiol.Music performanceOrganic chemistryStaListics (math)Intro. managementMusic theoryDrama: acting,directing, etc.
Music history: gen.MusicianshipStagecraftGerman: elem or int.General geologyGeneral zoologyHumanities: generalElectr. engineer.American lit.
Varsity:major
Varsity:other
Performingarts Intramurals Nonathletes
Everybodyelse
45.2% 42.8% 56.3% 40.6% 37.6% 39 7%3.5 3.3 1.1 .7 0 2 03.4 2 9 2 9 3.1 3.4 3 6
2.9 1.1 .1 3 0 6
2.6 1.4 1.3 1.7 1.4 1 9
2.0 2.2 1.4 1.8 1 9 2 2
1.7 1.9 .5 2.6 1.9 1 6
1.6 2.1 1 7 2.0 2.2 2 1
1 6 1 0 .8 1.2 1.0 1.2
1.4 1.2 .9 .9 .8 1 1
1 4 1.2 .9 1.3 1.5 1.51.4 1.0 0 0 0
1 4 2.3 .6 2.4 2.2 1 9
i.3 2 0 .7 2.7 2 6 1 6
1.2 1 4 .3 1.6 1.3 1 1
1.1 1.0 1.1 1.1 1.2 1 4
1 0 1.8 .4 2.1 1 8 1 3
1.0 1.4 1.0 1 0 1 0 1 1
1.0 1,4 1.1 .9 1 0 1 1
.9 .4 .3 1 0 5
9 .7 1 0 4 4 6
.8 .7 .6 7 7 6
8 1.6 2 1 5 1 1 q
7 .2 1 1 , 1 0
.7 .9 .2 1.0 7
.7 .4 3 .6 7
.7 3 .6 .6 1.0 8
.7 .6 ( 1 0 0 2
.7 .5 <.1 .2 4 4
.2 1.2 18.0 .1 .s 4
.4 1.0 o 1.0 .a 7
.5 .8 0 .9 .6
.6 .7 0 1.0 7 6
.2 C 6.0 .1 2 1
.5 0 4.0 .2 3 2
.4 .2 2 1 3 3 4
.3 .4 1.1 3 2 4
3 3 1 0 < 1 ... k 1
2 7 1.0 4 ,., 4
6 5 .7 9 6 6
6 .4 2 6 4 5
.3 .2 .4 .5 4
5 .1 < 1 5 6 3
5 .5 6 6 8 7
For the 43 course categories listed.
NOTE. The universe Is all students who met the college attendance criteria described in footnote #5. N - 8,101.
SOURCE. NLS 72 Special Analysis Files
324 0

Table h.-Distribution of bachelor's degree majors
MajorVarsity:major
Varsity: Performingother arts 1ntramurals Nonathletes
Everybodyelse
Business 16.0% 21.6% 3.5% 26.9% 16.3% 15.4%
Education 29.3 15.6 26.6 3.0 5.7 21.8
Engin. or compsci. 11 7 2.5 .2 7.5 7.2 3.9
Phys. sci. or math 3.9 0 2.9 4.6 4.8 4.1
Humanities 5.3 9.6 8.7 2.9 9.0 5.1
Arts 4.5 1.0 36.7 2 2 5.4 2.1
Social science 11.9 20.8 7.1 26.6 19.5 16.5
Biological science 3.7 13.1 1.4 7.3 9.0 5 6
Applied science andscience-basedservices'
6.9 5.8 3.1 8.4 11.6 11.8
Other ,ipplied and 5.4 8.4 5.6 6.6 8,8 10.3:..ervice fields'
Other 1.5 1 5 4.3 4.1 2.9 3.4
'Includes agriculture,science technologies.
natural resources, nursing, allied health, clinic.: health sciences, and
'Includes communications, home economics, library science, recreation, protective services,social work, and public administration.
NOTE: The universe is all students who met the college attendance criteria described in foot-note #5 and who earned a bachelor's degree at any time between 1972 and 1984. N - 4,897.Because of rounding, columns may not add to 100.
SOURCE: NLS 72 Special Analysis Files.
4133

Table 12.--Unemployment, 1979-1986
GroupMonths neither working nor in school
None <6 6-12 13-24 25-36 36.
Universe A'
All 51.9% 12.8% 9.3% 8.2% 6 3% 11.4%(.380) (.380) (.159) (.138) (.121) (.203)
Varsity: major 61.1 13.4 11.8 1.6 2.0 10.1(2.37) ( 658) (2.22) (.251) (.646) (2.18)
Varsity: other 53.7 21 7 10.0 7.6 4.1 2.8(2.42) (1.17) (2.03) (2.00) (2.13) (1.39)
Performing arts 43.2 14.4 8.3 9.6 15.9 8.6(1.26) (1.01) (.438) (.329) (.885) (.498)
Intramurals 63.8 15.5 8.6 6.2 2.1 3.9(.638) (.513) (.445) (.433) (.208) (.485)
Nondthletes 49.0 12.6 9.1 9.3 7.0 13.0(.944) (1.30) (.324) ( 235) (.264) ( 415)
Everybody else 51.9 12 2 9.5 8 : 6.1 12.2(.380) (.231) (.228) (.178) (.162) ( 227)
Univerfe Bf
All 53 5 13.9 9.2 7.7 6.1 9.5(.496) (.600) (.213) (.176) (.141) ( 229)
Varsity: major 66.3 12.5 12.4 1.7 2 8 4.3(2.46) (.691) (1.70) (.352) (.903) (2.26)
Varsity: other 46.0 23.0 13.0 10.5 5.6 1.9(2.72) (1.57) (2.72) (3.00) (2.89) (.112)
Performing arts 42.5 15.2 8.0 9.6 16.8 7.9(1.41) (.982) (.520) (.373) (.792) (.660)
Intrarurals 64.4 17.3 8.3 4.6 2.6 2.8(.791) (.611) (.582) (.490) ( 314) (.699)
Nonathletes 54.4 15.0 8.9 7 9 5.0 8.7(1.70) (2.48) (.510) ( 367) (.335) (.393)
Everybody else 52.3 12.8 9.4 8.1 6.2 11.2(.486) (.304) (.284) (.234) ( 188) ( 253)
'All students who met the college attendance criteria described in footnote #5 and whoparticipated in the fifth (1986) followup Wirt/WI. N . 5,841.
'Universe A minus students without B.A.s. N - 4,057.
NOTE: Because of rounding, rows may not add to 100. Standaid errors are in parentheses.
SOURCE: NLS 72 Special Analysis Files.
34
4 2
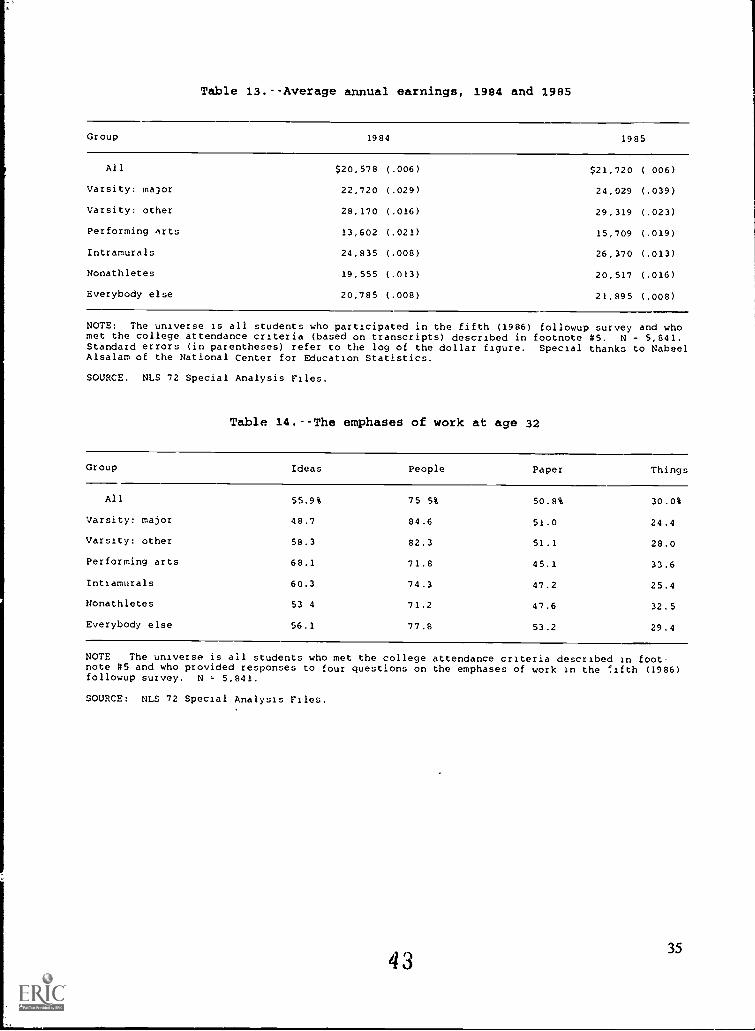
Table 13.--Average annual earnings: 1984 and 1985
Group 1984 1985
All $20,578 (.006) $21,720 ( 006)
Varsity: major 22,720 (.029) 24,029 (.039)
Varsity: other 28,170 (.016) 29,319 (.023)
Performing Arts 13,602 (.021) 15,709 (.019)
Intramurals 24,835 (.008) 26,370 (.013)
Nonathletes 19,555 (.013) 20.517 (.016)
Everybody else 20,785 (.008) 21,895 (.008)
NOTE: The universe is all students who participated in the fifth (1986) followup survey and whomet the college attendance criteria (based on transcripts) described in footnote #5. N - 5,841.Standard errors (in parentheses) refer to the log of the dollar figure. Special thanks to NabeelAlsalam of the National Center for Education Statistics.
SOURCE. NLS 72 Special Analysis Piles.
Table 14.--The emphases of work at age 32
Group Ideas People Paper Things
All 55.9% 75 5% 50.8% 30.0%
Varsity: major 48.7 84.6 51.0 24.4
Varsity: other 58.3 82.3 51.1 28.0
Performing arts 68.1 71.8 45.1 33.6
Intiamurals 60.3 74.3 47.2 25.4
Nonathletes 53 4 71.2 47.6 32.5
Everybody else 56.1 77.8 53.2 29.4
NOTE The universe is all students who met the college attendance criteria described in foot-note #5 and who provided responses to four questions on the emphases of work in the 'ifth (1986)followup survey. N , 5.841.
SOURCE: NLS 72 Special Analysis Piles.
4 335

Table 15.--Occupationa1 expectations at age 19 versus realities at age 32
Occupational Varsity: major Performing arts Intramurals Nonathletescategory Expected Actuar Expected Actual Expected Actual Expected Actual
Clerical 2.8% 12.1% 1.0% 14.0% 1.4% 7.3% 4.6% 15.3%
Craftworker 4.7 12.4 1.1 2.1 3.6 8.7 2 6 5.5
Operative 0 1.8 0 3.4 0 2.5 0.3 3.0
Laborer 0 3.0 0 0.9 0.5 2.2 0.1 0.9
"Manager," 15.4propriet.
14.2 5.7 13.3 14.3 23.6 8.8 16.2
Professional 1* 23.7 18.0 42.1 28.0 32.6 27.1 34.4 30.5
Professional 2* 27.3 8.1 19.1 8.2 29.1 12.6 24.6 9.2
"Buy/sell" 0 11.8 0.2 5.1 1.0 6.8 1.4 6.6
Sch. teach. 14.6 11.2 25.9 18.2 6.4 2.9 9.5 5.1
Other 11.5 7.4 4.9 6 8 11.1 8.3 13.7 7.7
* In 1973, Professional 1 included accountants, artists, nurses, engineers, librarians, writers,social workero, actors, and athletes. Professional 2 included clergy, physicians, lawyers,scient-sts, and college professors. In 1986, scientists were in the Professional 1 category andlibrarians in Professional 2. A more elaborate occupational codlng scheme was used in 1986.
NOTE: The universe is all students who met the college attendance criteria described in foot-note #5, answered the question on expected "kind of work . . . when you are 30" in the first(1973) followup survey, participated in the fifth (1986) followup, and provided information ontheir occupation in 1985. N = 5,312. The occupational categories for the 1973 survey do notmatch those of 1986 perfectly. For example, the 1973 category "Sales" covered insurance agents.The 1986 category covers both sides of commercial ttansactions, but does not include insuranceagents. Instead, they are in a category with accountants and stockbrokers that are included herein "Professional 1."
SOURCE: NU> 72 Special Analysis Files.
36
44

Table 16.--Occupation at age 32
OccupationVarsity:major
Varsity:other
Perfc.xmingarts
EverybodyIntramurals Nonathletes else
"Manager" 16.1% 25.3% 13.6% 21.7% 16.7% 17.8%(17.7%)
Sch.teacher 13.3 5.5 16.8 2.8 5.1 12 7(9.8%)
Engin. tech.or sci. 8.7 .5 4.7 9.9 10.0 6.5
(7.7%)
Nurse orhlth. tech. 0 3.4 1.7 3.4 7.2 6.8
(6.2%)
"Buy/Sell" 12.5 10.6 4.3 7.5 5.5 5.8(5.9%)
Craftworker 12.2 4.0 2.2 9.3 5.3 4.9(5.4%)
Office support 2.6 9.7 7.7 1.1 8.2 4.0(5.1%)
Account orinsur. 2.2 6.7 1.3 4.7 5.1 5.1
(4.9%)
Other clerical 3.5 1.0 3.7 3.7 3.4 4.4(3.9%)
Med. or healthpract. 4.5 10.7 .2 5.0 4.4 2.9
(3.5%)
Coll.teach. etc. 2.4 3.5 8.4 3.5 2.5 3.0(3.1%)
Other profess. 4.9 2.0 2.7 1.5 3.0 3.4(3.1%)
Fin. serv. supp. 5.1 0 1.9 2.1 2.9 2.7(2.7%)
Computer related 1.9 1.2 1.3 3.8 3 0 2.3(2.6%)
Operatives 1.9 1.6 3.5 2.4 2.8 2.0(2.3%)
Art., athlet.,or enter. .6 3.1 8.0 .7 1.8 2.4
(2.3%)
Personal serv. 1.3 3.4 10.9 2.1 1.6 1.8(2.2%)
Lawyer orJudge 1.2 1.3 .7 4.3 2.0 1.5
(1.8%)
All others 3.1 6.5 6.4 8.8 9.5 10.7(9.8%)
NOTE: The universe is all students who met the college attendance criteria described in foot-note #5, and in the fifth (1986) followup survey indicated an occupation in 1985. N . 5,312.Occupations are lis,ed in order of greatest frequency in the universe (percentages shovn inbold) . Because of rounding, columns may not add to 100.
SOURCE: NLS 72 Special Analysis Files.
4 5
37

Table 17.--Industry of employment at age 32
IndustryVarsity:major
Varsit,:other
Performingarts Intramurals Nonathletes
Everybodyelse
Construction
Manufacturing:durables
Manufacturing:nondurables
Naturalresources'
Communication
Retail andwholesale
Financialservices'
8.6% 4.4% 2.0% 4.9% 2.3% 3.0%
6.8 4.1 4.9 9.3 9.0 7.3
7.1 1.4 2 4 6.2 4.5 3 8
5.2 0 .8 2 8 4.0 3.3
4.1 5.4 6.7 2.9 8.1 4.5
12.8 6.7 19.2 15.0 9.9 10.6
5.7 14.4 2.1 7.0 6.8 7.0
Entertainment 2 0 3.0 7.9 1.3 1.4 3.0and recreation
3 8 15.3 4 1 9.8 13 2 10.4Professionalhealthservices
Other 2.7 5.9 6.7 3.9 3 5 5.0professionalservices'
Education and 9.2 5.8 22.9 4.4 8.1 12 3,ulturalservices
Public admin-istration
Legal servoces
Other
14.7 11.9 6.4 11.7 7.7 9.9
1.2 1.3 .3 4.0 2.5 1.6
16.1 18 4 13.6 16.9 19.0 18.3
'Combines agriculture, forestry, mining, and extraction.'Includes real estate, banking, insurance, brokerage, etc.'Includes Research and Development, consulting, welfare services, religious organizations, etc.
NOTE. The universe is all students who met the college attendance criteria described in foot-note #5 and provided information concerning the industry in which they worked in che fifth (1986)followup survey. N = 5,312. Because of rounding, columns may not add to 100.
SOURCE: NLS 72 Special Analysis Files.
38
4 6


![Ccna2 Final 47p[1]](https://img.pdfslide.net/doc/110x75/5571f1fd49795947648bed22/ccna2-final-47p1.jpg)