Embed Size (px)
Citation preview

ED 379 808
AUTHORTITLE
INSTITUTION
PUB DATENOTEAVAILABLE FROM
PUB TYPE
EDRS PRICEDESCRIPTORS
IDENTIFIERS
ABSTRACT
DOCUMENT RESUME
EA 026 566 .
Galvin, Patrick F.Evaluating the Performance of Utah's Schools. PolicyStudies in Education.Utah Univ., Salt Lake City. Utah Education PolicyCenter.9257p.
Utah Education Policy Center, School of Education,University of Utah, Salt Lake City, UT 84112 ($5;contact publisher for quantity discounts).Reports Evaluative/Feasibility (142)
MF01/PC03 Plus Postage.*Academic Achievement; Elementary SecondaryEducation; *Evaluation Criteria; MeasurementObjectives; Performance; Regression (Statistics);Socioeconomic Influences; *Standardized Tests; StateLegislation; *State Norms; Test Bias; *TestInterpretation; Test Reliability*Utah
Statewide testing programs, such as Utah's, provide arich source of performance data. This paper builds on the work ofKlitgaard (1974) and identifies educational objectives andcorresponding measures by which educators can more fully describe theperformance of their school system, utilizing statewide testing data.Methodology involved regression analysis of Utah's Stanford 8Achievement Test scores for 1990-91 and 1991-92. Three sectionsreport on conceptually distinct indicators of performance--threshold,uncontrolled, and controlled indicators. Comparative and trend dataamong Utah school districts are analyzed. Nine educational objectivesthat underlie the measurement and description of the performanceassessment are described. Problems in the validity and utility ofstandardized achievement tests are addressed. The performancemeasures provide preliminary evidence that Utah's schools areimproving over time. Accurate and useful performance assessmentrequires multiple indicators, for which trend analysis is useful. Ingeneral, the findings suggest that efforts to improve the achievementof Utah's schools did not affect any single educational goal, but hadimplications for several educational goals. Concerns about theaverage level of achievement within a school, district, or stateshould not be at the expense of concerns about how those scores aredistributed or how the very exceptional schools fare. Eleven tablesare included. Contains 13 references. (LMI)
***********************************************************************
Reproductions supplied by EDRS are the best that can be made* from the original document.***********************************************************************

67.aluatingt thePerformance .of
tah's Schools
Dr. Patrick F. Galvin
Published' by the
U.S. DEPARTMENT OF EDUCATIONOffice 01 Eduul,onal Research and improvement
EDUCATIONAL RESOURCES INFORMATIONCENTER (ERIC.)
This document has been reproduced asreceived from the pers.°n or organizationOriginating it
O Minor changes have been made to improvereproduction Quality
Points of view or opinions stated in thisdocu.ment do not necessaily represent officialOEM position or policy
"PERMISSION TO REPRODUCE THISMATERIAL HAS BEEN GRANTED BY
TO THE EDUCATIONAL RESOURCESINFORMATION CENTER (ERIC)."
UTAH EDUCATION POLICY CENTERThe Graduate School of Education
nwersity of Utah .
Salt Lake City, Utah
2BEST COPY AVAIIABLE

EVALUATING THE PERFORMANC.E OF
UTAH'S SCHOOLS
Prepared By:
Dr. Patrick F. GalvinDepartment of Educational Administration
Distributed by:The Utah Education Policy Center
School Of EducationUniversity of Utah
Salt Lake City, Utah 84112
j

THE UTAH EDUCATION POLICY CENTER
SCHOOL OF EDUCATION
UNIVERSITY OF UTAH
The Utah Education Policy Center is a not-for-profit
organization, operating independently within the Graduate
School of Education, University of Utah. The policy center has
been in existence since the Fall of 1990, and since that time has
published and distributed a number of policy papers. Additional
copies of the enclosed paper or any of the previously published
papers sponsored by the Policy Center are available at a
nominal cost. Please contact Dr. Patrick Galvin, Center Director,
for further information.
The opinions expressed in this and other papers sponsored
by the Utah Education Policy Center are those of the author(s)
and do not necessarily reflect the positions or opinions of the
Utah Education Policy Center, Graduate School of Education, or
the University of Utah.
The author of this paper:
Dr. Patrick Galvin, Assistant ProfessorDepartment of Educational AdministrationUniversity of Utah
1992
4

TABLE OF CONTENTS
Highlightsi
Introduction 1
4
16
19
26
Indicators Of Performance Controlling For Socio-
Economic Background Variables 32
Measuring School Performance: Some Concerns
The Data And Methods Used For This Analysis
Uncontrolled Indicators Of Performance
Threshold Indicators Of Performance
Comparison Of Achievement For Districts For Selected
Educational Objectives 37
Concluding Remarks And Recommendations 42
Bibliography 46
5

LIST OF TABLES
Table 1: Uncontrolled Indicators of EducationalPerformance 11
Table 2: Threshold Indicators of EducationalPerformance 13
Table 3: Controlled Indicators of EducationalPerformance 16
Table 4: Descriptive Statistics of Test-TakingSample: Utah's Statewide Testing Program,1990-91 and 1991-92 18
Table 5: Statistics Describing the UncontrolledIndicators of School Performance 20
Table 6: Utah's Statewide Testing Data:Comparisons of Achievement DifferencesBy Content Testing Areas, 1990-91 and1991-92 24
Table 7: Utah Statewide Testing Data:Threshold Indicators Performance UsingPercentile Ranks, 1990-91 and 1991-92 27
Table 8: Utah Statewide Testing Data:Threshold Indicators Assuring Schools DoNot Underachieve, 1990-91 and 1991-92 28
Table 9: Utah Statewide Testing Data:Threshold Indicators Using Mean Scores bySES Rank, 1990-91 and 1991-92 30
Table 10: Utah's Statewide Testing Data:Performance Indicators Controlling forBackground Variables, 1990-91 and 199192 35
Table 11: District Level Performance Indicators 38
6
Studies In Education Policy
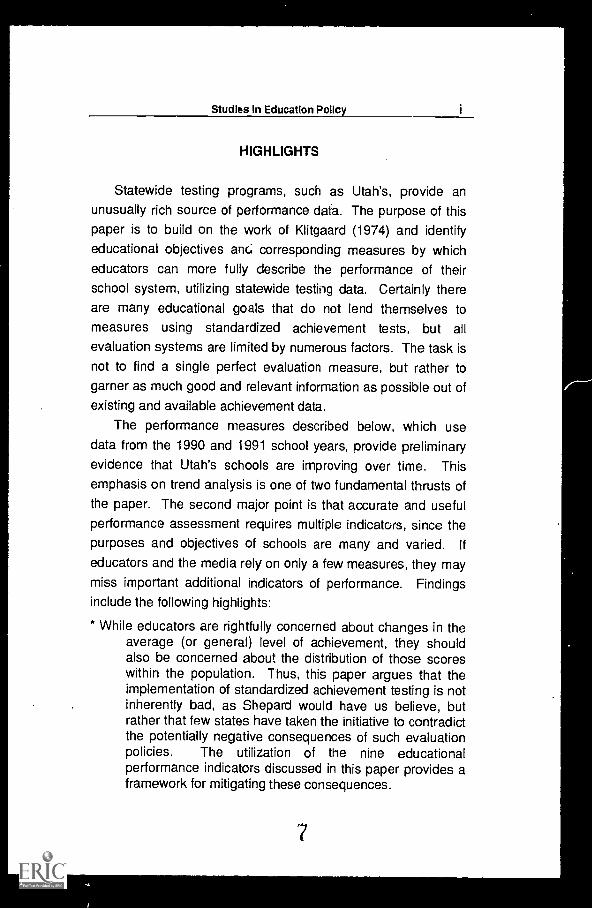
HIGHLIGHTS
Statewide testing programs, such as Utah's, provide anunusually rich source of performance data. The purpose of thispaper is to build on the work of Klitgaard (1974) and identifyeducational objectives anc; corresponding measures by whicheducators can more fully describe the performance of theirschool system, utilizing statewide testing data. Certainly thereare many educational goals that do not lend themselves tomeasures using standardized achievement tests, but all
evaluation systems are limited by numerous factors. The task is
not to find a single perfect evaluation measure, but rather togarner as much good and relevant information as possible out of
existing and available achievement data.
The performance measures described below, which usedata from the 1990 and 1991 school years, provide preliminaryevidence that Utah's schools are improving over time. This
emphasis on trend analysis is one of two fundamental thrusts of
the paper. The second major point is that accurate and usefulperformance assessment requires multiple indicators, since the
purposes and objectives of schools are many and varied. If
educators and the media rely on only a few measures, they may
miss important additional indicators of performance. Findingsinclude the following highlights:
* While educators are rightfully concerned about changes in theaverage (or general) level of achievement, they shouldalso be concerned about the distribution of those scoreswithin the population. Thus, this paper argues that theimplementation of standardized achievement testing is notinherently bad, as Shepard would have us believe, butrather that few states have taken the initiative to contradictthe potentially negative consequences of such evaluationpolicies. The utilization of the nine educationalperformance indicators discussed in this paper provides aframework for mitigating these consequences.
7

EVALUATING THE PERFORMANCE OF UTAH'S SCHOOLS
* The goals and purposes of education are many; where someeducators may be primarily concerned with equalizingeducational performance relative to the student's socio-economic background, the goals of other educators maybe directed toward increasing average scores amongst allstudents.
If increases in the average level of achiL-ement wereachieved by improving the scores of some students (orschools) at the expense of achievement levels for others,then some might argue that such progress is unfair.
* The average raw achievement score for all of Utah's schoolsincreased slightly, but significantly (statistically), from229.8 in 1990 to 232 in 1991.
* A more detailed examination of the changes in achievementscores reveals that the 5th grade scores account for mostof the increase. The achievement level of Utah's 8th and11th grade schools did not change significantly.
* In 1990, 21.1% of the schools scored below the 40th percentilerank (aggregated median scores on the Stanford 8Achievement Test). In 1991, that figure dropped by 3.1%to include just 18.0% of Utah's schools. Moreover, thepercentage of schools scoring above the 60th percentilerank increased by 2.2%, from 26.1% in 1990 to 28.3% in1991.
* The number of schools scoring below expected levels(controlling for socio-economic factors) decreased in 1991to 23.4%, from 23.7% in 1990. The number of schoolsscoring above expected levels (controlling for socio-economic factors) increased by 1% in 1991, up from29.0% in 1990.
* Of all the schools identified as underachieving in. 1990(achievement levels were below levels expected given thesocio-economic characteristics of the school), only 51.4%were underachieving in 1991. In fact, 9.5% of theunderachieving tools identified in 1990 were identifiedas overachievers in 1991.
* The average incidence of low income families per school withinUtah was 21.4% in 1991. For the same year, the average
8

Studies In Education Policy iii
achievement level for the 170 schools with the highestincidence of low income families was 40.3 (percentilerank). The average achievement level for the 170 schoolswith the lowest incidence of low income families was 58.3(percentile rank).
* Examining the achievement data while controlling for theinfluence of socio-economic variables suggests that the11th grades made the most progress in equalizingachievement levels. There was almost no change for thisvariable among 5th grade schools. Among 8th gradeschools, there was a notable statistical decline, suggestingthat achievement disparities were exacerbated betweenthe wealthy and poor schools.
* With regard to Utah's exceptionally under and over-achievingschools, there was relatively little change in performanceamongst the 5th and 8th grades. At the 11th grade level,however, there was a noteworthy decline in overachievingschools (a fact consistent with the note above indicatingincreases in the equalization score for 11th gradeschools).
* If an educational goal in Utah is the support of its very bestschools, there is little evidence in these data to suggestmuch achievement or progress. Rather the data show anincreasingly negatively skewed distribution, suggestingthat improvement efforts are directed more towardsschools at the middle of the distribution than at the tails.The exception to this observation is the 11th grade, wherethere may be greater emphasis on promoting highachievement over equalization efforts.
* There was a strong negative correlation between the increasein the average level of achievement for schools and thenumber of students taking the test, leading to a suspicionthat some students may be systematically culled from thestudent pool. In general, there was a decrease in thenumbers of students participating in Utah's statewideassessment program by about 9 students per school. Ifthere is a sampling bias associated with thesecircumstances and it continues over the years, then onemust reconsider the validity of Utah's SAT results.
9

Iv EVALUATING THE PERFORMANCE OF UTAH'S SCHOOLS
* A summary of aggregated district level performance indicatorsreveals some noteworthy changes. The importantcomparison for these findings is not between districts butrather individual district performance over time. Threeindicators of performance were calculated: the general(average) level of performance, the distribution of scoreswithin a district (standard deviation), and change of scoresfor each district's exceptional) schools (skewnessstatistic). Each of these indicators of performance identifypotentially different performance policies. The results ofthe analysis suggest that where some districtsemphasized increasing average levels of achievement,this happened at the expense of equalizing scores withinthe district. In other cases, where there was littleimprovement in a district's average level of performancethere was evidence of considerable equalization of scoreswithin the district. In yet other cases, the changes ofscores within a district had a significant impact on itsexceptional schools.
In general these findings suggest that etforts to improve the
achievement of Utah's schools did not affect any single
educational goal but rather had implications for several
educational goals. Certainly educators should be and areconcerned about the average level of achievement within theirschool, district or state, but such concerns should not be at the
expense of concerns about how those scores are distributed orhow the very exceptional schools fare. The use of the multiple
indicators of performance, both with districts and with schools,
provides a descriptive network by which to make more accurate
judgments about the progress of schooling in Utah. The use of
trend analysis appears to be particularly useful towards this end.
1 Exceptional schools refer to those very high and low achieving
schools. These are atypical schools that are performing in someexceptional way, although the reasons are not implied in the label.
.1 0
Studies In Education Policy 1
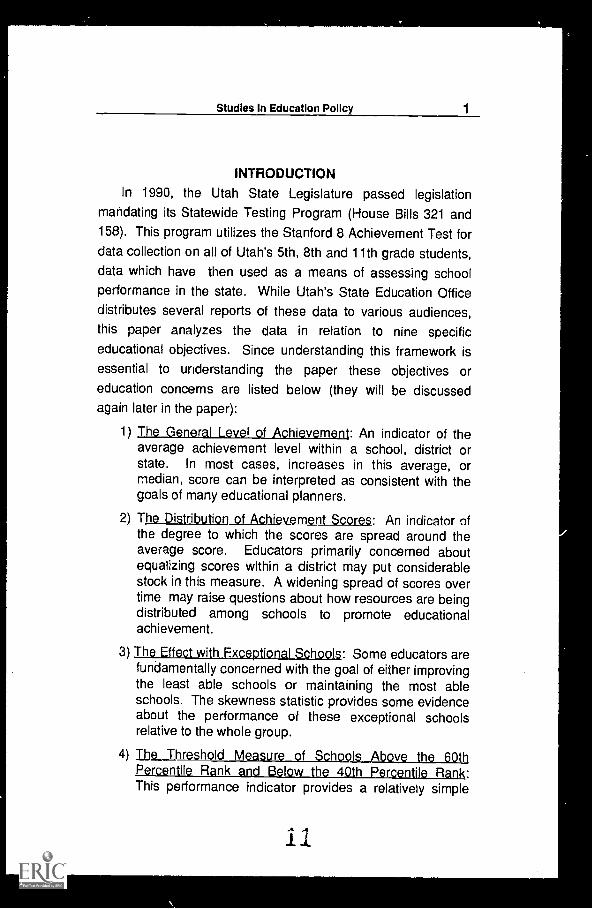
INTRODUCTIONIn 1990, the Utah State Legislature passed legislation
mandating its Statewide Testing Program (House Bills 321 and158). This program utilizes the Stanford 8 Achievement Test for
data collection on all of Utah's 5th, 8th and 11th grade students,
data which have then used as a means of assessing schoolperformance in the state. While Utah's State Education Office
distributes several reports of these data to various audiences,this paper analyzes the data in relation to nine specificeducational objectives. Since understanding this framework isessential to understanding the paper these objectives or
education concerns are listed below (they will be discussedagain later in the paper):
1) The General Level of Achievement: An indicator of theaverage achievement level within a school, district orstate. In most cases, increases in this average, ormedian, score can be interpreted as consistent with thegoals of many educational planners.
2) The Distribution of Achievement Scores: An indicator ofthe degree to which the scores are spread around theaverage score. Educators primarily concerned aboutequallzing scores within a district may put considerablestock in this measure. A widening spread of scores overtime may raise questions about how resources are beingdistributed among schools to promote educationalachievement.
3) The Effect with Exceptional Schools: Some educators arefundamentally concerned with the goal of either improvingthe least able schools or maintaining the most ableschools. The skewness statistic provides some evidenceabout the performance of these exceptional schoolsrelative to the whole group.
4) The Threshold Measure of Schools Abov_e the 60thPercentile Rank and Below the 40th Percentile Rank:This performance indicator provides a relatively simple
ii

2 EVALUATING THE PERFORMANCE OF UTAH'S SCHOOLS
assessment of the proportion of schools above and belowspecified break points.
5) The Threshold Measure Below A Specified Level
Controlling For Socio-Economic Factors: Thisperformance indicator provides evidence of how manyschools are performing below their expected level,controlling for socio-economic factors.
6) The Average Level Of Achievement Of Schools RankedInto Quartile Ranks By The Incidence Of Students OnFree Lunch: Another indicator of achievement relative tosocio-econornic background.
7) The Average Achievement Re ative To The Socio-Eggngmk31atua 1QLJjeaghggl: This measureexamines the average level of achievement when socio-economic factors are controlled for in the performanceindicator. In other words are the schools performingabove or below expected levels of performance, giventheir socio-economic status.
8) The Egualizing_Effect Of Qcflopl AchievementRelative ToTheir Socio-Economic Status: This performance indicatorexamines the spread of scores relative to the socio-economic status of the districts. In other words, is thespread of scores greater or less than expected whenconsidering the socio-economic status of the schools.
9) The Performance Of The Over And Under-AchievingSchools Relative To Their Socio-Economic Status: Thisperformance indicator provides evidence of theperformance of those schools identified as either under orover achieving relative to their socio-economic status.
The report serves two purposes: 1) to emphasize that
education serves many goals to which it should be heldaccountable; and 2) to emphasize the significant role of trendanalysis as a fundamental means by which to judge schoolperformance. Underlying these purposes is a concern thatevaluation policies, such as Utah's Statewide AssessmentProgram, are perceived by many educators and most of the
12
Studies In Education Policy 3
public as "value-free," when in fact such evaluations createsignificant incentives that can powerfully influence curricular and
instructional decisions by teachers and administrators.
In other words, one of the arguments underlying this paper is
that accurate assessment of school performance requiresmultiple indicators because the concept of performance
embodies numerous purposes (goals or objectives). Educators
and policy makers are rightfully concerned about improving the
general level of achievement among students or schools, butthey are also concerned about the spread of achievementscores among students and schools. No single measure ofachievement will accurately capture the complexity of schoolperformance. While multiple performance indicators are more
difficult to interpret they provide a more accurate description of
achievement across many educational concerns (goals andobjectives).
A second point underlying this paper is the argument thatstatewide assessment programs like Utah's, provide a great deal
of potentially useful information about school performance.Where ambiguity exists about the purposes and means bywhich schools produce education outcomes, more performance
indicators of achievement are better than less.
The body of the paper, divided into three sections, reports
the findings of the data analyses. Each of these three sections
reports on conceptually distinct indicators of performance: 1)
threshold indicators, 2) uncontrolled indicators, and 3) controlled
indicators of achievement. The paper concludes with a
summary of comparative and trend data among Utah's fortydistricts. Before discussing the nine educational objectives thatunderlie the measurement and description of the performance
assessment in this paper (two years of Utah Performance data
are used as a case study), current challenges to the validity and
utility of standardized achievement tests are discussed.
13
4 EVALUATING THE PERFORMANCE OF UTAH'S SCHOOLS
MEASURING SCHOOL PERFORMANCE:SOME CONCERNS
Numerous factors have contributed to the current rash of
state implemented assessment programs. Perhaps the most
obvious of these is the call to arms put forth by the authors of A
Nation at Risk (1983). In this document, the authors linked the
evidence of declining SAT scores to our declining
competitiveness as a nation. Poor performance in schools was
not simply a matter of individual failure or under-achievement:was analogized to be the proverbial Achilles tendon undermining
the strength of an empire.
Evidence of declining SAT scores in contrast with significant
increases in per pupil expenditures have led some authors, such
as Brimelow (1986), to argue that we are spending too much on
education. Such accusations raise questions about the social
efficiency of current investments in education. Brimelow, for
example, asked rhetorically, "Why is it that people who complain
about $600 toilet seats for the military become indignant when
someone points out equally flagrant examples of waste inschools?" (Forbes, p 72). But such concerns were notexclusively the domain of economists. Former Secretary ofEducation William Bennett also accused the educational system
of operating wastefully (recall his comments about the
Administrative Blob), and gave credence to the role of testing as
a way of promoting greater fiscal as well as achievementaccountability.
Underlying these positions regarding the efficiency andeffectiveness of education is a strong utilitarian philosophy.
Bennett, Brimelow and the authors of A Nation at Risk seemed
to care less about who benefited from policies aimed atimproving educational performance in the country, than they did
about improving average scores. Such a philosophy runs insharp contrast to the typical equity goals that have guided much
of educational policy for the last 50 years. Educators held
1 4

Studies In Education Policy 5
accountable for increasing average measures of achievement,with little regard to who benefits from such interventions, canpursue numerous strategies, such as curricular selections,instructional strategies, and selection of students, to achievesuch results. Policies promoting efficiency in the utilization ofeducational resource need not be blind to the distribution ofresources and opportunities. This point is discussed in moredepth at the conclusion of the paper. For now, however, thediscussion turns to evidence that current test programs relyingon standardized achievement tests are associated with selective
practices aimed at promoting general levels of achievementwithout regard for the negative effects of such policies.
Evidence Of The Negative Effects Of Statewide TestsOne of the main purposes for implementing standardized
testing programs has been to promote a greater degree ofaccountability among educators. While accountability is
supposed to ensure the high quality instruction necessary forgreater student learning, not all educators are so sure of theeffect. Lorrie Shepard (1991) challenges the premise that suchtesting, at the state or national level, will lead to increasedstudent learning. She notes that previous "test-driven" reform
initiatives, such as the minimum competency testing of the1970's, failed to achieve the promised results of school
improvement. There is little reason, Shepard argues, to believe
that the current initiatives, grounded in the same technical andphilosophical traditions, can produce significantly different
results.
Shepard further argues that the effect of externally
mandated tests is largely negative. She notes that existingresearch about the effects of mandated standardized
achievement tests suggests that it tends to narrow curriculardevelopment, emphasizing basic skills over higher order thinking
15

6 EVALUATING THE PERFORMANCE OF UTAH'S SCHOOLS
(Darling-Hammond & Wise, 1985; Smith, 1989). Shepard
argues:
Test content tends to be taught to theexclusion of nontested content. Although criticsmay have originally feared that testing would takeinstructional time away from 'frills,' such as artand citizenship, the evidence now shows thatsocial studies and science are neglectedbecause of the importance of raising test scoresin basic skills. (p. 233)
Another negative consequence of externally mandated tests
is that they tend to promote an emphasis on test-taking skills that
can inflate measures of achievement. The problem is not thatteachers teach only to the test, but rather that classroominstruction and testing tends to replicate the format of
standardized achievement tests. This familiarity seems to inflate
indicators of achievement, according to researchers whoretested students using a different format (on the same content)
and compared the results with those from standardized
achievement tests (Koretz, Linn, Dunbar & Shepard, 1991).
Another way of phrasing these points is to suggest thatexternally mandated tests create constraints and incentives that
effect tradeoffs in choices about curricular materials andinstructional strategies. "Basic skills" advocates might arguewith Shepard about whether the effect of national or state testing
is negative, but neither side could argue that testing is a totallyneutral, value-free policy initiative. And this raises perhaps amore disturbing criticism that Shepard levels against national
and statewide standardized achievement tests, when she argues
that these instructional choices, in response to incentives toimprove average scores, are related to the socio-economicstatus of the community in which the school is situated. Thus, in
poor neighborhoods students can expect drill and practice as away of promoting scores on achievement scores. In wealthy
16
Studies In Education Policy 7
neighborhoods, where students enter the system advantaged,they can expect more "higher-order thinking" instruction
(Shepard, 1991).
This concern about the pernicious effects of standardizedstatewide testing is not new. Numerous other authors havepointed out that the incentive structure associated with
evaluations using standardized achievement tests can lead toexclusion of the hard-to-teach students (Klitgaard,1974;
Murnane, 1976, & Monk, 1990). The logic is straightforward.Where teachers and school administrators are held accountable
to the average level of achievement, an incentive exists todistribute resources (including teacher attention and time) tothose students who are most readily able to transform theseeducation inputs into standardized educational outcomes, orimprove scores and therefore improve group averages.
Such a view of teachers and school administrators oftenruns contrary to their own vision of what they are doing.Teachers and administrators will often talk about their
responsibility to meet the needs of each and every child. The
above point does not challenge this sense of responsibility, but
rather emphasizes the extent to which available resources limit
student growth. In addition, the above point recognizes theobvious fact that not all children learn at the same rate. Whereresources are limited and accountability is evaluated byaggregated average scores of achievement, an incentive exists
to invest in those students most able to affect the average score.
The effects of this incentive may not lead to overt discrimination,
but Shepard's points regarding how instructional and curricular
practices are selected to promote indicators of educationalachievement provide much material for thought.
17

8 EVALUATING THE PERFORMANCE OF UTAH'S SCHOOLS
The Justification For Using Standardized AchievementTests
Considering the substantive criticisms leveled against the
use of standardized achievement tests (and the above
discussion only references a few), the question remains as towhether there is any justification for their use as a way ofassessing school performance. The position taken in this paper
is a conditional "yes."
In the face of such uncertainty over the theory andtechnology of educational production, it seems reasonable toprovide more rather then less information about educationalachievement. The problem with standardized achievement tests
is not that they provide totally useless information, but rather that
the incentive structure associated with such reports runs
contrary to educational purposes. Certainly educators areconcerned about higher-order thinking, but they also need to be
concerned about the acquisition of basic skills. Moreover, while
educators are rightfully concerned about changes in the average
(or general) level of achievement, they should also be concerned
about the distribution of those scores within the population.Thus, this paper argues that the implementation of standardized
achievement testing is not inherently bad, as Shepard wouldhave us believe. but rather that few states have taken theinitiative to contradi,-_, the potentially negative consequences of
such evaluation policies. The utilization of the nine educational
performance indicators discussed in this paper provides aframework for mitigating these consequences.
A second point questions whether any single perfect
measure of educational achievement exists. The currentemphasis on authentic assessment takes on a "holier-than-thou"
tone which seems suspect. The complexities of educationalassessment are not likely to be captured by any single measure
or assessment strategy, regardless of what one calls it. The
assessment goal is not to find one perfect measure of
i3

Studies in Education Policy 9
educational achievement, but rather to recognize how
conclusions derived from any single measure are limited.Multiple indicators of achievement seem like a step in the rightdirection (e.g. threshold indicators, uncontrolled indicators andcontrolled indicators of achievement).
On a more practical note, standardized achievement testscores are frequently the only comparable data readily available
by which to assess schooling within a state. Ignoring the results
of these tests would then deprive students, parents, educatorsand legislators of some of the few data sources that can informthem about the performance of schools. Inclusion of
standardized achievement data does not preclude alternativeevaluation strategies. Using multiple indicators of achievementmay require evaluators to substitute a more complex reporting
format for simpler existing ones, but such may be the price ofproviding a realistic report rather than a potentially misleadingone.
In the next section, educational goals to which educators are
held accountable are identified and indicators by which toassess the performance are defined.
The Goals Of Educatioa
The goals and purposes of education are many; where some
educators may be primarily concerned with equalizingeducational performance relative to the student's socio-
economic background, the goals of other educators may bedirected toward increasing average scores amongst all students.
A single or limited number of achievement indicators may missthese important distinctions between goals, and thereforeprovide an incomplete assessment of school performance. In
the following sections, three categories related to educationalgoals are discussed: 1) uncontrolled indicators of achievement,2) threshold indicators of achievement, and 3) controlledindicators of achievement.
1 3
ti

10 EVALUATING THE PERFORMANCE OF UTAH'S SCHOOLS
The educational goals discussed in this paper and theindicators used to assess school performance relative to thesegoals draw on the work of Klitgaard (1974). The adaptation ofKiltgaard's work is intended to provide multiple reference points
by which school performance can be compared over time. Such
a framework enables one to evaluate the effects of policyinitiatives across numerous performance indicators. The
evaluation of comparative school performance data over timeserves as the foundation for this paper,.
Uncontrolled Indicators Of Achievement
Uncontrolled indicators of achievement refer to performance
scores that do not statistically account for the socio-economicbackground of the students within a school. These are statistics
that describe the raw data. Three indicators of performance are
typically reported. The first is simply the average score, which is
intended to provide evidence about the general level of
achievement or performance. Depending upon the type of data
reported (raw scores or data transformed into percentile ranks),
the general level of achievement is reported as either the mean
or median score.
While educators are rightfully concerned about the average
(or median) level of achievement, their concerns about theperformance of schools is not limited to such a measure. If
increases in the average level of achievement were achieved by
improving the scores of some students (or schools) at theexpense of achievement levels for others, then some mightargue that such progress is unfair. A second indicator ofperformance thus assesses changes in the spread of scoresover time (the standard deviation), providing evidence aboutwhether or not increases or decreases in scores were spreadacross all participants. Increases in the average level of
achievement evenly spread across all participants suggests a
2 0

Studies in Education Po Hay 11
very different performanc.. than average increases resulting from
significant improvements among a few schools.
The third measure in this category addresses the effect ofeducational policies on special populations, such as the gifted ordisadvantaged students, or more appropriately to this study,schools of very high or low performance levels. Educators
concerned about the performance of Utah's school systemspecifically with regards to both high and low achieving schoolswill find the skewness measure to be a useful indicator.Educators who believe that a well-functioning state educational
system allows its most able students (schools) to achieve at their
highest level and the least able students (schools) to achieve at
some minimum, would expect to find a distribution of scores that
were positively skewed (Cuba, 1967). In such a distribution, the
low achieving schools are all "stacked up" at some minimal level
of achievement, while the scores of the more able schools arespread out. A negatively skewed distribution looks just theopposite; the high achieving schools are stacked up, while thelow achieving schools are trailing off to lower and lower levels of
achievement. Thus the sign of the skewness statistic, whether it
is negative or positive, and the change of the statistic over time,
says something about the performance of the school systemrelative to these exceptional (high and low achieving) schools.
Table 1Uncontrolled Indicators of Educational Performance
Educational Concern Measure
General Achievement Level Mean/Median score
Distribution Of Achievement Scores Spread (standard deviation)
Effect With Exceptional Schools Distortion of distribution
(skewness)

12 EVALUATING THE PERFORMANCE OF UTAH'S SCHOOLS
Threshold Goals of AchievementOne goal of educators is to assure that students perform
above some minimum level of achievement. There areimportant conceptual debates, even amongst those who ascribe
to this same goal, about how to pursue this goal. For example,
the premise of the minimum competency movement of the 1970s
is that resources should be allocated to students until eachindividual is able to perform at a predetermined minimum level of
achievement. Such a definition of accountability raises
questions about what to do with students who are either unable
or unwilling to achieve at a specified level. It is perhaps not
surprising that other educators define accountability in terms ofproviding educational opportunities rather than some minimum
level of educational achievement. In this perspective, student
outcomes (achievement scores) are recognized as importantgoals but not held as measures of accountability.
These important conceptual issues aside, threshold
indicators that describe performance relative to some specified
level provide important information on how schools are
performing. Three indicators are reported in this paper. The first
of these describes the proportion of schools achieving above or
below some specified performance level. The selection of abreak point is arbitrary, but for many educators, achievementbelow the 40th percentile and above the 60th percentile rank
. appears to distinguish acceptable and unacceptable
performance. Whatever the threshold point, a simple yearlycalculation provides important information about this frequently
cited educational goal.
The above measure fails, however, to include any
consideration of the powerful influence of socio-economicbackground on school achievement. Without controlling for this
influence educators and parents may attribute to schools,achievement levels that are better explained by socio-economic
22

Studies In Education Policy 13
influences. A second threshold measure uses regressionanalysis to estimate the proportion of schools achieving at levels
below or above expected levels given their socio-economicstatus.
Table 2Threshold Indicators of Educational Performance
Educational Concerns Measures
Assuring that the proportion ofschools achieving below aspecified level does notincrease and identifying theextent to which schools areachieving at a high level
Proportion of schools below the40th and above 60thpercentile rank
Assuring that schools do notunderachieve and identifyingthe extent to which schools areoverachieving
Proportion of regression residualsbelow and above a specifiedmeasure.
Assuring that the achievement ofschools above and belowspecified SES levels does notdeteriorate
Mean achievement scores forschools ranked by SES level
The final threshold measure compares mean achievement
scores for schools ranked into quartile groups. The variable by
which schools are ranked is the percentage of families identified
at or below low-income status. A fundamental goal of all stateeducational systems is to break the systematic link between the
wealth of a school district and the level of achievement.Comparisons of mean achievement scores for schools provides
evidence about progress towards such a goal.
Controlled Indicators of Achievement
Interpretation of average achievement scores is often
perceived as being straightforward, particularly where the scores
are standardized by the use of percentile ranks: schools scoring
23
14 EVALUATING THE PERFORMANCE OF UTAH'S SCHOOLS
in the 60th percentile are believed to be performing better than
schools scoring in the 40th percentile rank. Normalizing these
scores against a national sample enables one to say that aschool scoring in the 60th percentile is doing better than 60percent of the schools in the country. But is this a reasonable
interpretation of the results?
Family influences powerfully affect the performance ofstudents at school (Hanushek, 1989). Furthermore, the
capability of families to positively affect school achievementstrongly correlates with their socio-economic status (SES).Thus, when one compares the average achievement of a school
that scored in the 40th percentile rank with another school thatscored in the 60th percentile rank, the question is whether the
difference is due to school practices or SES and homeinfluences. The implicit assumption is that the school thatscored at the 60th percentile is doing much better than theschool that scored in the 40th percentile. If one controlled for
differences in socio-economic status, however, it is conceivable
that the school that scored at the 60th percentile is simplyperforming adequately considering the SES of its students, while
the school at the 40th percentile is performing very wellconsidering the corresponding SES of its students.
The average achievement of students, relative to their socio-
economic background, provides a very different picture of
performance than the uncontrolled measure of achievement.Use of the controlled indicators of achievement would ensurethat one did not misinterpret increases in the uncontroI:Jd
indicators that were due primarily to changes in the socio-economic background of the students.
A second measure examines the spread of scores relative to
the socio-economic background of students (and hence
aggregated scores for schools). Among the many concerns of
educators is one for schools whose performance is below
24

Studies In Education Policy 15
expected levels considering the socio-economic status of the
students. School improvement policies implemented to assist
these schools might go undetected without indicators sensitive
to performance achievements relative to the socio-economic
background of the students. Similarly, efforts to maintain the
achievement levels of schools performing abf)ve expected levels
(given the socio-economic status of the school) might also be
missed without indicators sensitive to such phenomena. More
specifically, the difference between the predicted spread of
scores with the spread for the actual scores provides a
framework for comparing changes over time relative to theabove concern.
The final measure in this section focuses more specifically
on the extreme over and underachieving schools. The indicators
discussed above say little about the performance of schools or
students achieving well above (or below) their expected level of
performance, and yet frequently these are the schools
specifically targeted for support (or as the case may be, loss of
support). The appropriate statistic to capture changes over time
with these schools is the skewness of the regression residuals.
All things equal, the more positively skewed these distortion
measures are the better the school system is supporting over
and under-achieving schools. Negatively skewed distributions
suggest that the school system is less sensitive to the needs of
these schools. Of course, it is not obvious how much skewness,
one direction or the other, constitutes success or failure. Over
time, however, such a statistic would inform educators about
achievement with these exceptional schools (controlling for their
socio-economic background).
25
16 EVALUATING THE PERFORMANCE OF UTAH'S SCHOOLS
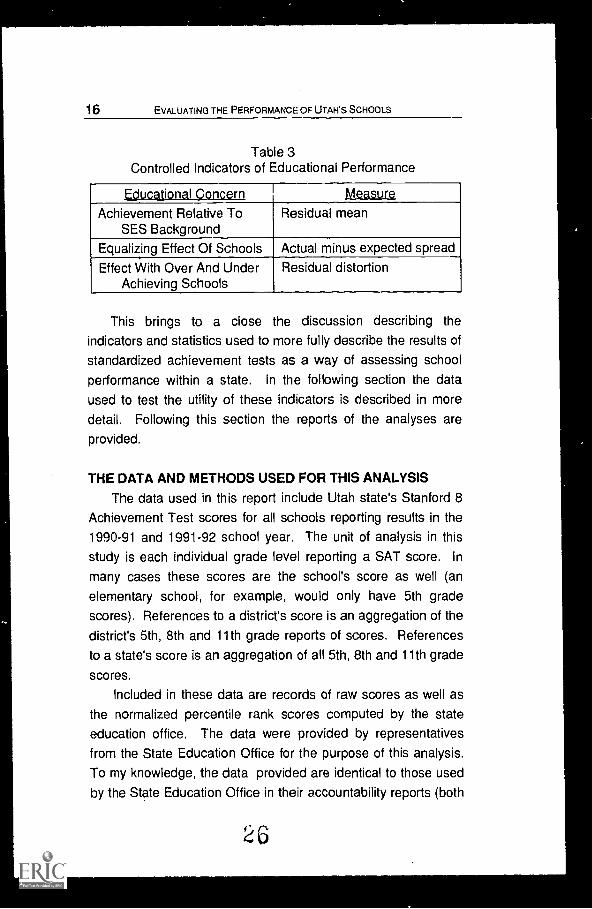
Table 3Controlled Indicators of Educational Performance
Educational Concern Measure
Achievement Relative ToSES Background
Residual mean
Equalizing Effect Of Schools Actual minus expected spread
Effect With Over And UnderAchieving Schools
Residual distortion
This brings to a close the discussion describing the
indicators and statistics used to more fully describe the results of
standardized achievement tests as a way of assessing school
performance within a state. In the following section the dataused to test the utility of these indicators is described in more
detail. Following this section the reports of the analyses areprovided.
THE DATA AND METHODS USED FOR THIS ANALYSIS
The data used in this report include Utah state's Stanford 8
Achievement Test scores for all schools reporting results in the
1990-91 and 1991-92 school year. The unit of analysis in thisstudy is each individual grade level reporting a SAT score. In
many cases these scores are the school's score as well (anelementary school, for example, would only have 5th gradescores). References to a district's score is an aggregation of the
district's 5th, 8th and 11th grade reports of scores. Referencesto a state's score is an aggregation of all 5th, 8th and 11th grade
scores.
Included in these data are records of raw scores as well asthe normalized percentile rank scores computed by the state
education office. The data were provided by representativesfrom the State Education Office for the purpose of this analysis.
To my knowledge, the data provided are identical to those used
by the State Education Office in their accountability reports (both
26

Studies in Education Policy 17
the 1990 and 1992 Accountability_Reports for all Districts andSc [tools' The Utah Statewide Testing Program. Utah StateOffice of Education).
Virtually all of Utah's schools reported scores for the twoconsecutive years. This is a significant point since it reveals aconsistent effort to include all schools in the Statewide Testing
Program, as mandated by Utah's Legislature in House Bills 321and 158. In both school years, 693 reports of scores wereentered for the combined grade levels: of these 431 were 5thgrade scores, 141 reported 8th grade scores and 121 reported11th grade scores.
Table 4, below, illustrates the tabulation of schools andstudents participating in the assessment program. The tableincludes descriptive statistics for 4 variables: 1) Number ofschools, 2) possible # of test-takers, 3) number of studentsabsent from the test, 4) state's estimated number of test takers.
Adding the number of possible test takers for the 5th, 8th and11th grades for 1990-91 equaled 98,610 students. The figure in
1991-92 represented only 91,141 students: an average declineof about 9 students per school reporting test scores. Suchdiscrepancies have various causes and distinctive
consequences for this analysis: one important predictor ofimproved school achievement is the number of students absentfrom the test.
Consistent with this finding, the average number of students
absent during the 1991-92 school year was greater than theprevious year for each grade level. Finally, the state's
calculation of the number of students taking the SAT test alsoshows a decline between the two years: from 96,522 to 94,892student test takers.
i;*

18 EVALUATING THE PERFORMANCE OF UTAH'S SCHOOLS
Table 4Descriptive Statistics of Test-Taking Sample
Utah's Statewide Testing Program1990-91 and 1991-92
Grade Level 5th
1990-91
8th 11th 5th
1991.92
8th 11th
No. Schools 431 141 121 431 141 121
Possible # Test-Takers 37,433 34,467 26,710 35,280 30,763 25,098
Students Absent 347 598 1374 1339 1385 2208
State's Est. Number 36,698 33,923 25,901 35,795 32,237 26.860
Later in the paper, the significance of these declines isdiscussed in more detail, but in general it appears that theseenrollment declines are positively correlated with increases inschool SAT scores. Such a correlation raises questions about
the possibility that school administrators are selectively
identifying the least able students as part of their "absent"population.
The Analytic MethodsThe next set of points discussed in this section addresses
the analytic methods used to determine the measures. In
general, the analyses are divided into two categories; thoseinvolving simple descriptive statistic, and those involving
regression statistics. For the uncontrolled indicators of school
performance, which involve no regression statistics, indicators of
school performance simply describe both the raw and thepercentile rank data. The regression analyses use only the raw
data to estimate the performance of schools while controlling for
socio-economic background (SES). The regression model used
for each of the 3 grade levels (5th, 8th and 11th) includes thesame control variables for each of the analyses. Threshold
measures use both descriptive and regression statistics. More
will be said about these models as the discussion of resultsaddresses specific analyses.
28

Studies in Education Policy 19
The results of the statistical analyses presented in thefollowing sections provide a systematic evaluation of the
educational objectives described above. None of the scores orthe descriptive statistics was weighted, and hence the averageor median score for a very small class weighed the same as for
a very large class. This is not a major problem for this studybecause the performance comparisons are for the same schools
over time.
With regard to the specification of the regression models,two sets of variables were applied for all 3 grade levels. Onemight argue that such specifications do not capitalize on the best
fit, but applying identical controls between the two years as well
as between different grade levels provides a systematicframework for making judgments and comparisons. In the next
section, indicators of school performance that do not attempt to
control for socio-economic differences are discussed first: later 3
indicators that attempt to take account of the influence of SES on
school performance are discussed..
UNCONTROLLED INDICATORS OF PERFORMANCE
In this section, two years of Utah's Statewide Testing dataare used to examine a variety of achievement measures ascriteria for making judgments about the performance of Utah'sschools. Performance on three educational concerns areexamined: 1) general level of achievement, 2) changes in thespread of achievement scores, and 3)changes in the
performance of exceptional schools.
General Achievement Level: Has The Average AchievementLevel of Utah Schools Improved?
Average measures of academic achievement (an average of
all the reported school SAT test scores) indicates that Utah'seducational system improved in 1991-92 over its performance in

20 EVALUATING THE PERFORMANCE OF UTAH'S SCHOOLS
the 1990.91 school year. Table 5 reports the aggregated Total
Test Battery: score for all of the 679 reporting classes and by the
3 grade levels participating in the evaluation. The Total TestBattery includes the composite scores for the 5 content areas:Math, Reading, English, Science and Social Studies. The Total
Test Battery is a summative measure of achievement for Utah's
schools.
In the first year of testing (199)-91), the average raw score
for all the 678 classes reporting was 229.8; these scores ranged
from a minimum of 47 to a maximum of 350 points. The average
for the 1991-92 school year increased to 232; scores ranged this
year from a minimum of 54 to a maximum of 358. A paired T-test confirmed that the increase in the test scores was significant
at the 0.05 level. In other words, it appears that the differences
in the raw scores are not due to chance, but rather to thesystematic efforts of students, teachers and school
administrators.
Table 5Statistics Describing the Uncontrolled
Indicators of School Performance
All Schoo 511 clack ma Grade 11th Grade
1990 1991 1990 1991 1990 1991 1990 1991
N=678 N=679 N=428 N=429 N=135 N=137 N=115 N=113
Mean Raw Scores 229.8 232.0 259.2 261.5 255.3 255.3 91.0 91.8
Spread (Stdev.) 68.5 68.0 29.4 28.1 29.6 28.4 13.3 13.3
Median Raw Score 255.0 258 0 263.0 266.0 260.0 260.0 93.0 94.0
Median Percentiles 51.0 53 53 54 50 50 48 50
Spread (Stdev.) 14.7 14.2 14.9 14.2 13.9 12.8 14.3 14.5
Distortion (Skewness) -1.26 -1.33 -0.65 -1.02 -1.36 -1.61 -1.10 -1.04
The median percentile rank score for the state also
increased from 51 in 1990 to 53 in the 1991 school year.However, there were some dramatic changes among schoolsthat are not revealed by examining indicators of central
30

Studies In Education Policy 21
tendency. For example, subtracting each school's 1990-91 from
1991-92 scores revealed that one school's score increased by89 percentiles, while another school's score plummeted by 87percentile points. In other words, focusing only on the medianscores creates an illusory picture of stability when in fact there
were significant changes occurring.
Examining the Total Test Battery scores for each grade level
suggests that changes in the elementary schools (grade 5)account for most of the improvement in the average level ofachievement among Utah's schools. Table 5 shows the average
raw and median percentile rank scores for each of thesesubgroups. A T-test analysis reveals statistically significantdifferences in raw scores for both the 5th and 11th grade groups
(at the .05 level). The differences for the 8th grade, as onemight guess by looking at the scores, were not statisticallysignificant.
Educators primarily concerned about the average level ofachievement can be encouraged by the findings in this report;
Utah made significant improvements in the average level ofachievement between the two years. However, these average
scores say little to educators more concerned about equalizingthe effects of the changes.
The Spread of Achievement Scores: Has the Distribution ofScores Changed?
Although all educators are presumably interested in
increasing the average level of achievement among students,many are also concerned with narrowing the distribution ofscores among schools. These educators may express theconcern that a singular focus on increasing average scorescould lead to allocation decisions that benefit those students(and schools) most able to transform resources into educational
outcomes (Monk, 1991; Murnane, 1976; Klitgaard, 1974). While
such a strategy could lead to increased average scores, it could
31
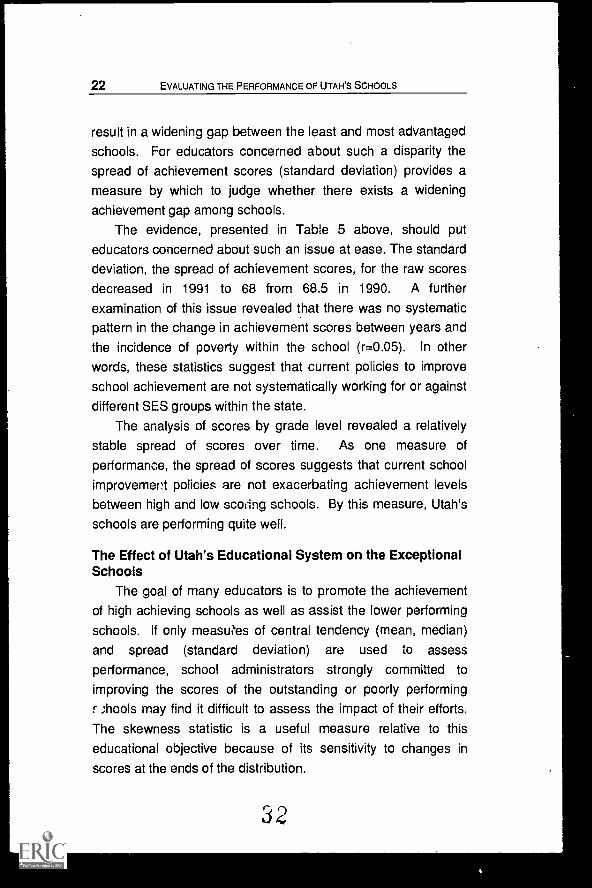
22 EVALUATING THE PERFORMANCE OF UTAH'S SCHOOLS
result in a widening gap between the least and most advantaged
schools. For educators concerned about such a disparity thespread of achievement scores (standard deviation) provides ameasure by which to judge whether there exists a wideningachievement gap among schools.
The evidence, presented in Table 5 above, should puteducators concerned about such an issue at ease. The standard
deviation, the spread of achievement scores, for the raw scores
decreased in 1991 to 68 from 68.5 in 1990. A furtherexamination of this issue revealed that there was no systematic
pattern in the change in achievement scores between years and
the incidence of poverty within the school (r=0.05). In other
words, these statistics suggest that current policies to improve
school achievement are not systematically working for or against
different SES groups within the state.
The analysis of scores by grade level revealed a relatively
stable spread of scores over time. As one measure ofperformance, the spread of scores suggests that current school
improvement policies are not exacerbating achievement levelsbetween high and low sawing schools. By this measure, Utah's
schools are performing quite well.
The Effect of Utah's Educational System on the ExceptionalSchools
The goal of many educators is to promote the achievement
of high achieving schools as well as assist the lower performing
schools. If only measues of central tendency (mean, median)
and spread (standard deviation) are used to assess
performance, school administrators strongly committed to
improving the scores of the outstanding or poorly performing
r ;hoots may find it difficult to assess the impact of their efforts.
The skewness statistic is a useful measure relative to thiseducational objective because of its sensitivity to changes inscores at the ends of the distribution.
32

Studies In Education Policy 23
Table 5, above, shows a negatively skewed distribution ofscores among Utah's schools for both the 1990-91 and 1991-92
school years: 1.26 and -1.33 respectively. In 1991-92 this
negatively skewed distribution increased for both the 5th and 8th
grades. The distribution of the high schools (11th grade), whilenegatively skewed, decreased slightly from -1.10 in 1991-92, to
1.04 in the 1991-92 school year. The greatest increase in these
skewness measures was for the elementary schools (grade 5),
which almost doubled (-0.65 to -1.02).
If an educational goal in U'lh is the support of its very best
schools, there is little evidence in these data to suggest much
achievement or progress. Rather the data show an increasingly
negatively skewed distribution, suggesting that improvementefforts are directed more towards schools at the middle of thedistribution than at the tails. The exception to this observation is
the 11th grade, where there may be greater emphasis onpromoting high achievement than on equalization efforts.
Achievement Differences By Content Area:5th, 8th and 11th Grades
In this section, the difference in the raw scores for eachtesting area (subject or content area) is described by gradelevel. A paired T-test assessed whether the differences between
the 1990-91 and 1991-92 test scores were significant. Table 6 is
divided into three panels representing 5th, 8th and 11th grades.
Within each of these panels, the specific content areas tested by
the Stanford 8 Achievement Test are identified. The number ofreported scores and the raw scores for both the 1990-91 and1991-92 school years are displayed for each of these categories.
The last three statistics reported (on the right hand side of thetable) are those for the T-test. The mean difference (Mean Diff)
simply reports the difference in the scores between the twoyears. The T-value reports the magnitude of the t-statistic. The

24 EVALUATING THE PERFORMANCE OF UTAH'S SCHOOLS
last column reports the probability of obtaining the reported t-value for the sample size and thus its statistical significance.
Table 6Utah's Statewide Testing Data:
Comparisons of Achievement DifferencesBy Content Testing Areas
1990-91 and 1991-92
5th Grade Number 1990 1991 Mean Diff T-Value Proo
Math 427 79.45 80.63 1.18 2.75 0.006*Reading 427 65.23 65.79 0.56 1.82 0.07English 427 40.88 41.22 0.34 1.98 0,04TScience 427 29.87 30.09 0.22 1.67 0.096Social Studies 427 31.79 31.89 0.1 0.58 0.56Total Test 427 259.22 261.61 2.39 2.16 0.031'
8th Grade Number 1990 1991 Mean Diff T-Value Prob
Math 132 73.24 74.14 0.9 0.93 0.354Reading 132 65.52 65.44 -0.08 -0.15 0.877English 132 35.92 36.18 0.26 0.71 0.477Science 132 30.93 30.79 -0.14 -0.46 0.644Social Studies 132 31.24 31.58 0.34 1.06 0.29Total Test 132 256.06 256.87 0.81 0.35 0.729
11th Grade Number 1990 1991 Mean Diff T-Value Prob
Math 105 13.28 13.52 1.25 1.25 0.216Reading 105 31.00 31.15 0.15 0.61 0.541English 105 14.51 14.72 0.21 1.28 0.202Science 105 13.99 17.01 3.02 0.17 0.864Social Studies 105 15.75 15.63 -0.12 -0.81 0.418Total Test 105 91.93 92.29 0.36 0.45 0.653
Significant at the 0.05 level
In general, the analysis indicates that the only significantdifferences are those for the elementary students. None of the
difference scores was significant for either the 8th or 11thgrades. This table reinforces an earlier observation suggestingthat most of the increased level in achievement scores wasaccounted for by changes in the elementary scores.
3

Studies In Education Policy 25
Summary Comments For This SectionEvidence provided by uncontrolled indicators of school
performance suggest that Utah's schools are performing well.
Perhaps some educators primarily concerned with the
performance of Utah's exceptional schools would argue that the
distribution of scores is not optimal, but such an argument lacks
a definitive measure by which to qualify optimal. If, over theyears, the skewness variable continues to tail off in a negative
direction, then the argument seems better grounded. For the
time being, however, the indicators used here to determine thegeneral level of achievement, educational equity and the effecton exceptional schools suggest a pattern of performance that is
praiseworthy, with a couple of qualifiers.
Table 6 clearly indicates that most of the significant change
in scores took place in the elementary grades. The achievement
of Utah's middle and high school students did not changesignificantly. Certainly, educators want the achievement ofelementary students to improve, but average indicators ofperformance ought not to obscure needs among other importantgroups. Hence, the evidence in Table 5 tempers judgmentsabout the overall performance of the system.
The evidence that gains and losses in average Total TestBattery (raw scores) were related to changes in the number ofstudents absent from the test highlights a second source ofcaution about interpreting the above results. Of the 660 classes
reports, 331 showed a score that was lower in 1991-92 than in
the first year of testing (1990-91); the mean number of absences
for this group was 6.3. For the 342 classes that reported anincrease in their scores, the mean number of absences was 8.5.
The probability of these differences being due to chance is very
slight (0.031). Furthermore, the number of absences was theonly variable among the list of socio-economic and test takingvariables that was significantly different from one year to the
3 5

26 EVALUATING THE PERFORMANCE OF UTAH'S SCHOOLS
next. This pattern of results was most obvious in the highschools, where the number of absences for schools increasingtheir scores was triple that of elementary schools. In otherwords, the pattern of results appears suspicious, and calls into
question whether the increases in test scores, at least in the high
schools, were due to instructional interventions or samplingstrategies.
With these conditional statements about the overall
performance of Utah's school system using uncontrolled
indicators of performance, the analysis now turns to indicators of
performance that control for differences in the socio-economicbackground of the school population.
THRESHOLD INDICATORS OF PERFORMANCE
In this section, two years of Utah's Statewide Assessmentdata are analyzed in terms of the three threshold indicators ofachievement, each of which as described earlier in this paper.The first measure calculates the percentage of schools
achieving below the 40th and above the 60th percentile rank.The second measure uses regression statistics to identify theproportion of schools under or overachieving relative to theirsocio-economic background. The final measure draws attention
to changes in the means scores of schools ranked by incidence
of socio-economic status measures.
The Proportion Of Schools Below The 40thAnd Above The 60th Percentile Rank
Table 7 below displays the percentage of schools scoringabove two specified levels of achievement. The results describe
these statistics for the state as a whole as well as for theparticipating grade levels.
In 1990, 21.1% of the schools scored below the 40thpercentile rank (aggregated median scores on the Stanford 8Achievement Test). In 1991, that figure dropped by 3.1% to
36

Studies In Education Policy 27
include just 18.0% of Utah's schools. Moreover, the percentage
of schools scoring above the 60th percentile rank increased by2.2%, from 26.1% in 1990 to 28.3% in 1991.
Disaggregating the data by grade level reveals that thepercentage of schools scoring below the 40th percentile rankdropped, between 1990 and 1991, for each grade level. The
percentage of schools scoring above the 60th percentile
increased for both the 5th and 11th grade but not the 8th grade.
Table 7Utah Statewide Testing Data:
Threshold Indicators Performance Using Percentile Ranks1990-91 and 1991-92
611 choolg at Grade alb Grade nth Grade1990 1991 1990 1991 1990 1991 1990 1991
N=678 N=679 N=428 N=429 N=135 N=137 N=115 N=113
Below 40th % Rank 21.1% 18.0% 20.1% 16.8% 20.7% 19.0% 25.2% 21.2%
Above 60th % Rank 26.1% 28.3% 32.5% 34.3% 19.3% 18.2% 14.8% 17.7%
This evidence suggests that current achievement trends are
leading toward improved performance among Utah's schools.These indicators say little, however, about achievement relativeto the socio-economic background of the schools. In the nextsection the proportions of schools achieving below expectedlevels is described. If these figures have not increased then the
above figures would look stronger as indices of improved school
performance. If the percentage of schools scoring below theirexpected level increases then the claim of improved
performance seems less obvious.
Assuring That Utah's Schools Are Not Underachieving AndIdentifying The Extent To Which Schools Are Overachieving
Regression analysis provides a statistical means of
controlling for differences in socio-economic background andestimating the extent to which a school is above or below

28 EVALUATING THE PERFORMANCE OF UTAH'S SCHOOLS
comparably structured schools. Standardized regression
residuals above 0.5 or below -0.5 were used as break points to
identify districts above or below expected levels of achievement
(regression models were calculated for the 5th, 8th and 11thgrades independently because of differences in the structureand testing instruments among these subgroups). Selecting a
break-off point one half a standard deviation below theregression mean provides some assurance that these schools
are actually performing below their expected mean and hence
can be labeled underachievers.
Table 8Utah Statewide Testing Data:
Threshold Indicators Assuring Schools Do Not Underachieve1990-91 And 1991-92
All Schoota ath Grade fah Grade nth Grade
1990 1991 199C 1991 1990 1991 1990 1991
N=676 N=679 N=428 N=429 N=.135 N=137 N=115 N=113
Below Residual Break 23.7% 23.4% 25.8% 24.4% 23.4% 19.1% 16.5% 24.8%
Above Residual Break 29.0% 30.0% 30.2% 32.9% 27.0% 24.8% 27.3% 25.6%
Table 8 displays the results for the analysis. Two sets ofresults are reported for all schools within the state, and then for
each of the grade levels. Further, the percentage of schoolsunderachieving and overachieving are compared for the firstyear of testing (1990) and then for the second year.
For all schools the results of the analysis indicate a slightdecrease in the percentage of schools underachieving (from23.7% of the schools in 1990 to 23.4% in 1991) and a slightincrease in the number of schools overachieving (from 29.0% of
the schools in 1990 to 30.0% in 1991). These results, in
conjunction with the results displayed in Table 7, suggest thatcurrent performance trends are not systematically depriving the
poorer schools in Utah.
33

:Audios In Education Policy 29
Breaking the data down by grade level is more revealing.Achievement gains for the 5th grades show a reduction in thenumber of underachieving schools and an increase in
overachievers. Junior High schools showed a comparativelylarge reduction in underachievers but also a reduction in
overachievers. The performance of high schools showed a largeincrease in the number of underachieving schools and areduction in the number of overachievers.
As one might expect the relationship of under andoverachievers is strongly correlated with low and high achievingscores (r=0.734). Perhaps less obvious, however, is the factthat only 51.4% of the schools identified as underachievers in1990 were underachievers in 1991. In fact, 9.5% of theunderachieving schools identified in 1990 were identified asoverachievers in 1991.
Interpreting these data will require further research. To theextent that educational leaders and Utah's public are concerned
about the increases in underachievers among high schools thenthese data are significant. It seems reasonable to suggest,however, that effective policy interventions will require clarityabout the underlying causes. In other words, it may be that thedifferences in organizational structure between elementary andsecondary schools help account for different patterns of
performance. Or, it may be that these two types of schools are
pursuing very different performance goals. These data do notprovide many clues to these important questions.
Success Of Schools Above And Below Specified SESLevels
This index compares the mean achievement level of schools
ranked into quartile groups according to the incidence of families
identified as low income. The incidence of poverty (defined as
eligibility for Federal free lunch program) within the schools
33

30 EVALUATING THE PERFORMANCE OF UTAH'S SCHOOLS
ranged from zero to 100 percent. That is, in at least one school
there were no families identified as low income, while in at least
one school every family with children attending the school was
identified as low income. The state average was 21.4 percent of
the total school population.
The quartile groups resulting from the ranking are identified
as follows: The schools with a smaller incidence of low income
families were identified as "Q1 Low," schools with a larger
incidence of low income families were identified as "04 High."
The intermediate groups were identified as "Q2" and "Q3." For
each of these groups the mean SAT percentile rank was then
calculated. The results are presented in Table 9 below.
There are several trends evident from this table. First, the
smaller the incidence of low income families the higher the
average achievement of schools: in 1990 the average
achievement level of the "Q1 Low" group of schools was 58.3,
while the average achievement level for the "04 High" group
was 40.3. It would be a mistake to assume that this was due to
the lack of influence of schools or to the character of families.
The wealth of families has long been recognized as profoundly
influencing school achievement. The reasons are obvious:
school is only one among many educational opportunities from
which children learn. Where families are wealthy, access to
these opportunities is less costly compared to access for poorer
families. Thus, the achievement levels for schools can hardly be
attributed only to the skills, ingenuity or effort of educators.
40
Studies In Education Policy 31
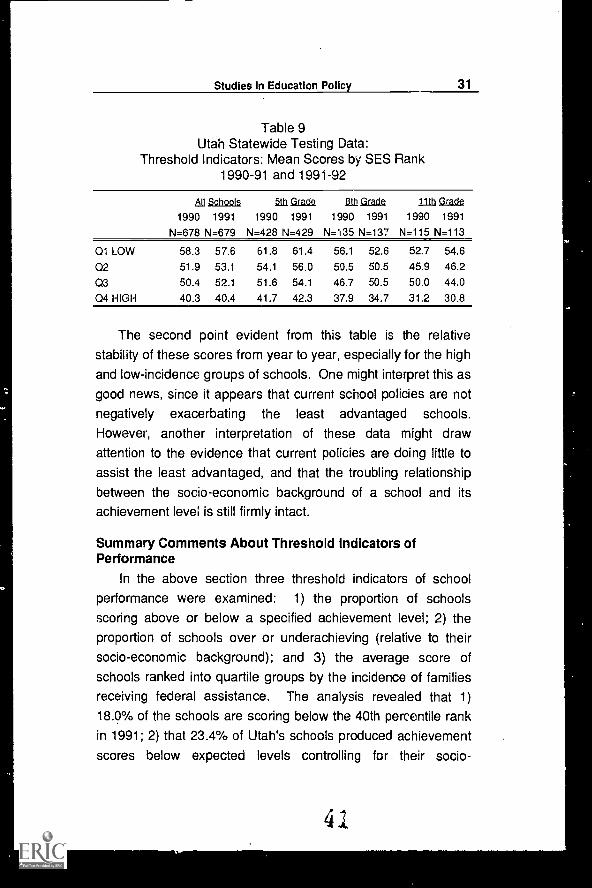
Table 9Utah Statewide Testing Data:
Threshold Indicators: Mean Scores by SES Rank1990-91 and 1991-92
All Schoo $112 Grade filt Grade 1111101ade
1990 1991 1990 1991 1990 1991 1990 1991
N=678 N=679 N=428 N=429 N=135 N=137 N=115 N=113
Q1 LOW 58.3 57.6 61.8 61.4 56.1 52.6 52.7 54.6
Q2 51.9 53.1 54.1 56.0 50.5 50.5 45.9 46.2
Q3 50.4 52.1 51.6 54.1 46.7 50.5 50.0 44.0
Q4 HIGH 40.3 40.4 41.7 42.3 37.9 34.7 31.2 30.8
The second point evident from this table is the relativestability of these scores from year to year, especially for the high
and low-incidence groups of schools. One might interpret this as
good news, since it appears that current school policies are not
negatively exacerbating the least advantaged schools.
However, another interpretation of these data might drawattention to the evidence that current policies are doing little toassist the least advantaged, and that the troubling relationship
between the socio-economic background of a school and itsachievement level is still firmly intact.
Summary Comments About Threshold Indicators ofPerformance
In the above section three threshold indicators of schoolperformance were examined: 1) the proportion of schoolsscoring above or below a specified achievement level; 2) theproportion of schools over or underachieving (relative to theirsocio-economic background); and 3) the average score ofschools ranked into quartile groups by the incidence of familiesreceiving federal assistance. The analysis revealed that 1)18.0% of the schools are scoring below the 40th percentile rank
in 1991; 2) that 23.4% of Utah's schools produced achievement
scores below expected levels controlling for their socio-
4

32 EVALUATING THE PERFORMANCE OF UTAH'S SCHOOLS
economic background; 3) that the mean achievement level forthe quartile group of schools with the highest incidence of lowincome families was a percentile score of 40.4 , which was 17.2
percentile ranks below the group of schools with the leastincidence of low income families in their schools.
The comparison of these scores between the two yearsindicates some changes: fewer elementary schools are scoring
below the threshold minimums but more high schools arescoring below these established minimums. The achievementpattern for the schools ranked into percentile ranks did not,however, change much over the two year period.
In general, these analyses provide little guidance for judging
the performance of Utah's schools in absolute terms, but thecomparison over time provides a useful framework for assessing
current trends and predicting future issues.
INDICATORS OF PERFORMANCE CONTROLLING FORSOCIO-ECONOMIC BACKGROUND VARIABLES
In this section indicators of school performance are
described controlling for two sets of variables: 1) socio-economicbackground variables and, 2) test-taking sample. socio-
economic variables have long been associated with student and
school achievement levels. One might interpret a score ranked
at the 50th percentile as above average for students comingfrom relatively disadvantaged backgrounds, and conversely one
might interpret the same score as below average for studentsfrom a relatively advantaged background. Regression analysis
provides the means by which to predict each school's expectedscore while controlling for Socio-economic backgroundvariables.
A second set of influences that can powerfully affect aschool's performance level involves the sample of studentstaking the test (Murnane, 1976; Klitgaard, 1974). Using step-
42

Studies In Education Policy 33
wise regression, three indicators of test taking numbers wereidentified as being significant: 1) the number of students absent
from the test, 2) the percentage of students taking the test, and3) the number of students (other than the severely disabled or
for whom English is a second language) taking the test. The
reason for including all three of these variables in the regressionmodel, despite the correlation .between them, is that theinfluence of each depends upon whether the analysis is
examining 5th, 8th or 11th grade. Since the purpose of theregression is not to explain behavior but to establish somecontrols for predicted scores, this model seems defensible: theimportant point is that some control for these variables is betterthan none, even if the controls are not perfect.
Controlling ror SES: Are Utah's Grade Levels performingabove or below expected levels of achievement?
There is very little difference between the aggregatedaverage scores of the 5th, 8th and 11th grade and the predicted
mean scores (these scores use raw achievement scores notpercentile rank scores). These findings do not mean that allschools or districts are performing at expected levels. To thecontrary, at the extremes one 5th grade school scored 108points below its expected level, while another 5th grade school
scored 63 points above its expected score. The same range ofscores is evident for both the 8th and 11th grade, although to aslightly lesser degree.
The Equalizing Effect of the School System whenControlling for Background Characteristics
Comparing the expected standard deviation of scores for the5th, 8th and 11th grades with their actual standard deviation of
scores provides some evidence of the degree to which schoolsare equalizing educational outcomes. To further explain thepoint, if the actual spread of scores for the 5th graders was
3

34 EVALUATING THE PERFORMANCE OF UTAH'S SCHOOLS
larger than the expected spread of scores, then the disparitysuggests that the school system is not performing as well as it
might in terms of the equalizing goal. This concern would seem
all the more convincing if with each successive year of testingthe difference between the actual spread of scores and thepredicted spread of scores widened. Conversely, if these
differences closed over the years then, in terms of the equalizing
goal, one could say that the school system was improving. Thedata shown in Table 10 provides such a comparison.
The predicted mean raw scores for the 5th, 8th and 11thgrade are almost identical to their actual means: for example, the
predicted mean scores for the 5th grade was 259.2 and theactual mean was 259.2. There are notable differences,
however, between the expected spread of scores and the actual
spread of scores. The standard deviation for the actual scoresof the 5th grade, for example, decreased in 1991 by 1.3 pointsfrom 29.4 in 1990 to 28.1 in 1991, while the predicted spread of
scores was reduced by 1.4 from 15.4 to 14.0 during the same
time period In other words, the equalization of scores evident in
the raw scores is best explained by changes in the socio-economic state and test-taking sample of the schools.
The spread of actual scores for the 8th grade decreased in
1991 from 1990 by 1.2 points (29.6 - 28.4 = 1.2). The predicted
spread, however, decreased by 5.4 points (12.6 7.2 = 5.6). In
other words, holding background variables constant, it appears
that there was an increase in the equalizing effect of scores by4.2 points. Again, the equalization of scores evident in the rawscores is best explained by changes in the socio-economicstatus and test-taking sample of the schools than in policyinitiatives. While this statistic provides an important insight into
the performance of schooling in Utah, it will become moresignificant as the results are analyzed over time. If this trend
4 4

Studies In Education Policy 35
continues year after year then the implications could be verytroubling.
Table 10Utah's Statewide Testing Data:
Performance Indicators Controlling for Background Variables1990-91 and 1991-92
All Schools atja grads Egb. Grade III la Grade
1990 1991 1990 1991 1990 1991 1990 1991
N=678 N=679 N=428 N=429 N=135 N=137 N=115 N=113
Mean Raw Scores 229.8 232.0 259.2 261.5 255.3 255.3 91.0 91.8
Spread (Stdev. of Mean) 68.5 68.0 29.4 28.1 29.6 28.4 13.3 13.3
Predicted Mean Scores NA NA 259.2 261.4 256.4 255.6 92.5 92.8
Predicted Spread (STDEV) NA NA 15.4 14.0 12.6 7.2 5.4 7.5
Equalizing effect of School NA NA 14.0 14.1 17.0 21.2 7.9 5.8
Effective with Over- and underachievers
Residual distortion NA NA -0.01 -0.52 -0.06 -0.15 2.3 0.92
The analysis applied to the 11th grade provides a verydifferent picture. The spread of actual scores did not change at
all between 1990 and 1991. However, the predicted spread of
scores increased during this time from 5.4 to 7.5, 1990 and 1991
respectively, an increase of 2.1 points. Thus, there appears tobe an equalization of scores among the 11th grade schools.This is good news for educators concerned about thiseducational objective. Time will tell whether this is simply acircumstantial artifact or a significant and noteworthy trend.
Controlling for Socio-Economic Influences: Effectivenesswith Over and Underachieving schools
This measure is the distortion of residual regression scores
for all the schools. The predicted scores of some schools, aspreviously noted, are much higher or lower than their actualscores. If over time the general trend of these predicted scores
was such that fewer and fewer schools were achieving higherthan their predicted score, and more and more districts were
45

36 EVALUATING THE PERFORMANCE OF UTAH'S SCHOOLS
achieving well below their predicted score, then policy-makersand educators would have reason for concern. The residual
scores provide indices to assess such a situation.
In 1990 the residual distortion of scores for the 5th gradewas -0.01. In other words, there were almost as many overachievers as there were underachievers. In 1991, however, this
pattern changed, the residual distortion increased to -0.523, and
there were more underachievers than overachievers. The
magnitude and significance of this specific number is difficult to
assess. If, however, the residual distortion continues to show an
increasing number of underachievers, over time, relative tooverachievers then one can infer the school system is failing to
support its underachievers
The residual scores for the 8th grade show a similar pattern
to that of the 5th grade, although the magnitude appears to beless. In other words, the residual distortion suggasts that there
were more underachievers relative to overachievers in 1991-92
than in 1990-91.
The pattern of results for the 11th grade was different thanthat for the 8th and 5th grades. First, in 1990-91 the residual
distortion was positive, 2.31. Again it is difficult to say muchabout the magnitude of this number by itself, but compared tothe negative number of the 5th and 8th grades this positivenumber appears large. What it means is that for the 11th grade
the distribution of overachievers and underachievers wasskewed in favor of the overachievers. In 1991-92, this
distribution was still positively in favor of overachievers but not
nearly as strong as in 1990-91. In other words, for what ever
reasons, the distribution of over and underachievers was morenearly equal in 1991-92 than in 1990-91. A continued shift inthis distribution over time should alert educators concernedabout this educational objective to the possible effects of policies
affecting this performance aspect of schools.
46

Studies In Education Policy 37
This section concludes the analysis of grade level (school)
data. The focus on grade levels, while important, often is pre-empted by a comparison of aggregated district level scores.These scores are often ranked and comparisons made as if
these ranks were significant. In the following section, scores for
some of the same objectives analyzed above are used tocompare performance by school district rather than by gradelevel.
COMPARISON OF ACHIEVEMENT FOR DISTRICTSFOR SELECTED EDUCATIONAL OBJECTIVES.
In the above discussion, attention has been directed only to
state averages. No focus has been given to school districtcomparisons. In this section, comparison of district achievement
relative to selected educational objectives is addressed.
Scores comparing district level achievement were computed
by aggregating all the grade level scores (5th, 8th and 11th)within each district. Since the number of grades reportingscores varied from district to district and the tests for each grade
level included difference numbers of items (especially for the11th grade). it was necessary to compute Z-scores (score -
mean / stdev) in order to aggregate the scores for each district.
The standardized scores were then used to rank the districts
into centile groups (5 equal groups of 4 districts each). Thus,
two districts could differ slightly on their measure of achievement
for a particular objective and end up in the same centile group.However, comparatively large differences between scores are
distinguished by the ranking scheme.
There are several reasons for ranking the districts by centile
groups rather than by a simple rank order. The most important
is that relatively small differences between district scores are not
likely to be significant from a policy point of view. Identifying
districts by whether their order was 17th or 18th in a particular
47

38 EVALUATING THE PERFORMANCE OF UTAH'S SCHOOLS
range of scores makes fine-grain distinctions that seem
unwarranted considering the indicators being used to evaluate
the objectives. Centile rankings more clearly distinguish districts
by their performance relative to the whole population.
Table 11District Level Performance Indicators
gistID#
# Sch/ Gen Ach
Diff
Equalization Exceptional
Dist 90 91 90 91 Diff 90 91 Diff41 0 2 0
2 8 0 2 03 25 0 4 -1
4 13 0 2 05 11 0 3 1
6 4 0 1 37 70 0 3 28 14 -1 3 09 11 0 2 1
10 11 -2 5 011 3 0 1 012 91 1 5 -1
13 12 -1 3 -214 66 1 3 015 4 2 2 1
16 12 -1 4 017 6 1 1 1
18 3 1 1 219 23 1 2 020 7 -1 2 221 3 -1 1 022 3 0 1 0
23 4 0 4 -1
24 4 0 2 3
25 16 0 5 026 12 1 -427 7 -1 1
28 3 1 1 0
29 6 2 5 030 20 0 3 231 12 1 5 -1
32 6 0 4 -333 24 -1 4 -234 4 -3 4 035 36 0 3 -1
36 38 0 5 0
37 23 0 5 -238 17 -1 4 039 0 3 -240 12 1 4 1
4 8 BEST COPY AVAILABLE
Studies In Education Policy 39
While comparisons between districts can be made, the value
of the data is comparison for each district across time. Such a
comparison ensures that one is comparing similar populations,
number of schools, curriculum, etc. If, for example, a district
slips from a first centile ranking to a third centile ranking, that
change would seem significant.
The results of the analysis are displayed in Table 11, above.
The first column of numbers simply identifies each district with a
code number. The second column identifies the number ofschools (elementary, junior and senior high) within the district.
Next, each district's centile rank order for the three educationalobjectives is displayed: 1) general level of achievement, 2)educational equity and 3) effect on the very high and lowachieving schools. Statistics controlling for socio-economicbackground variables can be computed for the districts, but the
computation becomes very cumbersome and difficult to justify.
Further, the additional data complicate the report of the findings
and make reading the table very difficult. For these reasons,only the uncontrolled indicators of achievement are reportedhere.
General Level of AchievementA little more than half of the districts (21 to be exact)
changed their general level of achievement ranking between1990 and 1991. Ten districts lost ground relative to the centile
ranking scheme used in Table 9; only 2 districts lost 2 or moreranking levels. Eleven districts gained on their ranking, with only2 of these gaining 2 or more ranking levels. One might expectthat the districts with the fewest schools would be mostsusceptible to change, but a correlation between change ofrankings and number of schools within the district does not bear
out such a hypothesis (r=0.124).
49

40 EVALUATING THE PERFORMANCE OF UTAH'S SCHOOLS
Contrasting the changes for equity indicators reveals thatspread of scores increased for 10 districts; 6 of which gained 2
or more rankings. Twelve districts actually closed the spread of
scores, enhancing the goal of greater equity in educationaloutcomes, 6 of which gained 2 or more rankings. Again, therewas no relationship between these changes and the number ofschools within a district (r=0.081).
Indicators assessing the effectiveness with which districtsdeal with their high and low achieving schools show that more
than 70% of the districts changed ranking. Thirteen districtsshowed an increasingly negatively skewed distribution of scores,
suggesting that the achievement levels of the least able schools
were losing ground relative to the average level of achievement
within the districts. Fifteen districts, however, significantlyincreased their ranking in this measure of performance,
suggesting a shift in the distribution of scores that favored themore able schools within the districts. Where educators areconcerned about the effects of policies on the most and leastable schools, these results provide very mixed signals.
Educators and the public might be anxious to comparestanding with other districts, but the emphasis in this discussion
has focused on changes within a district over time. In this light
there is as much a need to explain why districts perform atdifferent levels as there is to explain why some districts are able
to improve their scores while other districts lose ground.
Examining the general level of achievement and change in
scores over time has a long history both in the input-outputliterature (Murnane, 1976) as well as the effective schoolsliterature (Rowan, 1982 Madaus, 1980). In most of thesestudies, the unit of analysis has been the general level ofachievement, but schools operate with many objectives andgoals. Making inferences about the performance of schools and
districts solely on the basis of their general level of achievement
50

Studies In Education Policy 41
may lead to erroneous conclusions. For example, consider thedata from district 6 in Table 9. This district's general level ofachievement ranked in the lowest centile group and remainedunchanged between 1990-91 and 1991-92. Without additionalinformation one might conclude that little was happening in thisdistrict. An examination of the district's performance on theeducation equity goal, however, reveals substantial progress; in
1990-91 the scores in this district were widely divergent (asevidenced by the fact that this measure was in the 4th centile), in
1991-92 those scores were much narrower (the district was intho first centile group). Moreover, those changes did not appear
to be at the expense of the very high and very low achievingschools within the district (the ranking for exceptional schools isin the fourth panel). One might argue Oat these figures aresimply explained by the fact that the district has only 4 schools,
but notice that district 7 has 70 schools and reveals a similarpattern. It is beyond the scope of this paper to test thehypothesis that these districts are pursuing equity goals overincreasing the average level of achievement, but without these
additional indicators by which to judge the districts it would be all
too easy to conclude that few significant changes had occurredover the year.
Summary Comments: District Level IndicatorsThe analysis of the district's level of achievement was limited
to 3 objectives: general level of achievement, educational equityand effect with exceptional schools. The additional indicatorsdiscussed in the first part of the paper (those that controlled for
socio-economic background and described threshold indicators)were not included in this section. There were several reasons,not the least of which is simply the complexity of reporting somany analyses. More importantly, however, is that the state'sreport of the SAT data was already aggregated by grade level for
participating schools. In other words, individual student reports
5

42 EVALUATING THE PERFORMANCE OF UTAH'S SCHOOLS
were not available. It is difficult to report a threshold measure for
a district with only 3 or 4 schools. More appropriate would be adescription of the number of students falling below somethreshold point, or the average score of some group of students
from a specified socio-economic status. Similarly, regression
analysis, for purposes of controlling for socio-economic
influences, becomes difficult to justify when a district has so few
participating grade levels (although there are some innovativeways around this problem).
Nonetheless, the limited report included in this paper
provides a more comprehensive and useful presentation of data
for the purposes of judging the performance of school districtsthan a simple listing of median school or grade level scores.Ranking the scores into centile groups further simplifies
comparisons among districts and helps avoid making finegrained distinctions that are probably unwarranted.
CONCLUDING REMARKS AND RECOMMENDATIONS
The data collected as part of Utah's Statewide TestingProgram provide a rich source of information about schoolperformance. In this paper, considerable effort has been made
to go beyond median test scores as the criteria by whichperformance of a state's school system is assessed. Utah's
State Education Office does not limit its discussion of schoolperformance to this measure,2 but frequently educators and the
public do, and hence this paper serves as an effort to expandthe discussion beyond such a simplistic and limited view ofschool performance.
Building upon the work of Klitgaard (1974), this paperidentified nine educational objectives and corresponding
2 In fact, the State Education Office include variations of some ofthe measures discussed in this paper as part of their full report sharedwith district and school personnel.
52

Studies In Education Policy 43
performance indicators. In general, two sets of performanceindicators were described: 1) uncontrolled indicators of
achievement, and 2) indicators that control for socio-economicinfluences. Within each of these categories, three basicindicators were described: 1) those that assessed the generallevel of achievement, 2) those that assessed the distribution ofscores among schools and, 3) those that assessed the support
of exceptional schools (both high and low achieving schools).Additionally, three threshold indicators of performance werediscussed in the paper (this set of indicators is conceptuallyrelated to uncontrolled indicators of achievement).
These indicators, in and of themselves, do not providesufficient information by which to judge the performance ofschools. However, comparisons of achievement data over time,
(trend analysis) do provide a useful framework for making suchjudgments. Because the utility of such a framework dependsupon maintenance of records and analysis over time educators
need information on how to keep such records, and on how tomake productive use of these concepts and measures.
Recent national discussion about declining achievementscores, increased costs, and the need for greater accountability
in education has brought measurement and testing to the fore.In 1991, the National Council on Education Standards andTesting called for the establishment of a national system ofstandards and assessments as part of a comprehensive reformstrategy for America's schools. Underlying this call was theassumption that testing could act as a powerful influence onschool improvement.
Congressional testimony by Daniel Koretz, George Madaus,
Edward Haertell and Albert Beaton challenged the premise thathigh stakes tests would promote higher levels of achievement.
Among the many interests of these noted scholars was aconcern that such tests would have a narrowing effect on

44 EVALUATING THE PERFORMANCE OF UTAH'S SCHOOLS
instruction that would lead to inflated test scores which would
overstate the "real" level of learning students achieve.
Moreover, these scholars argued that such tests may "..havepernicious effects on instruction, such as substitution of
cramming for teaching. Evidence also indicates that it
[standardized performance tests] can adversely affect students
already at risk for cramming for the tests in schools with large
minority enrollments" (p 2).
Their point is consistent with the argument made in thispaper that using accountability tests, such as Utah's StatewideAssessment Program, holds potentially negative incentives that
can produce undesirable outcomes. Where educators are held
accountable for the average level of achievement, there is anincentive to distribute resources (instructional time and
strategies) in such a way as to exacerbate achievementdifferences between groups of students or schools within the
state. This is a fundamental equity concern, expressed in the
work of Koretz, Madaus, Haertell and Beaton, and underscores
the need for the use of the multiple indicators of performancepresented in this paper.
Holding teachers and schools accountable to outcomemeasures carries the potential for improving school
performance. But accountability plans that fail to recognize the
number of goals and concerns to which educators must respond
may confound school improvement plans. Inclusion of
numerous performance indicators provides an accountabilityframework for educators that recognizes multiple purposes,including equalization of achievement scores as well as
increasing average levels of achievement.
The examination of two years of Utah's Statewide Testing
data provides a case study by which to judge the utility of these
multiple indicators of performance. The analysis of the datareveals the utility of the statistical indicators as a framework for
54
Studies In Education Policy 45
continued monitoring of school performance within the state.The presentation of these performance indicators provides amuch broader evaluation framework than is typically provided by
most states. The inclusion of these additional indicators makesthe presentation more complex, but it also adds fullness and
accuracy to the description of school performance.
Interpretation of these data and the performance trends will be
better assessed as data accumulates over time.

46 EVALUATING THE PERFORMANCE OF UTAH'S SCHOOLS
BIBLIOGRAPHY
Congressional Report (1987). Educational achievement:explanations and implications Congress of the U.S.,Washington, D.C. Congressional Budget Office. ERICED 285954
Darling-Hammond, L. & Wise, A. E. (1985). "Beyondstandardization: State standards and schoolimprovement." Elementary School Journal 15. pp. 315-336.
Education Week, (1992, June 17). By all measures: The debateover standards and assessment. 11(39), pp. S1-S20.
Guba, E. G. (1967). Development, diffusion, and evaluation. InEidell & Kitchel (Eds.) Knowledge production andutilization in educational administration, ERIC ED024,112.
Hanushek, E. A. (1989 May). The impact of differentialexpenditures on school performance. EducationalResearcher. la,(4) 45-51.
Klitgaard, R. E. (1974, January). Achievement scores andeducational objectives. Santa Monico, CA: Rand.
Koretz, D. M., Madaus, G. F., Haertel, E., & Beaton, A. E.(1992). National educational standards and testing: Aresppnse to the recommendations o the NationalCouncil on Education Standards and Testing.Congressional Testimony, Rand: Institute on Educationand Training.
Karatz, D. M., Linn, R. L, Dunbar, S. B. & Shepard, L. A. (1991)The effecta of high stakes testing on achievement:Preliminary findings about generalization across tests. Apaper presented at the Annual meeting of theEducational Research Association, Chicago.
Madaus, G. F., Airasian W. P., & Kellaghan T. (1980). AreassessmentNew York: McGraw-Hill Book Company.
Murnane, R. J. (1983) Quantitative studies of effective schools:What have we learned? In Allan Odden & L. DeanWebb (Eds.) School Finance and School Improvement:

Studies In Education Policy 47
Linkages for the '80s. Cambridge, MA: Ballinger, pp.193-209
Rowan, B. & Charles E. D. (1982 November). Modeling theacademic performance of schools using longitudinaldata: an analysis of school effectiveness measures andschool and principal effects on school-levetachievement. Far West Laboratory, San Francisco, CA.
Shepard, L. A. (1991, November). "Will national tests improvestudent learning?" Phi Delta Kappan. pp. 232-238.
Smith, M. L. (1989). The role of external testing in elementaryschools. Los Angels: Center for research on evaluation,standards and student testing, UCLA.
57