Embed Size (px)
Citation preview
DOCUMENT RESUME
ED 380 158 JC 950 144
TITLE Articulation Accountability Measures Report, 1994.INSTITUTION Florida State Dept. of Education, Tallahassee. Office
of Postsecondary Education Coordination.PUB DATE 94
NOTE 110p.
PUB TYPE Statistical Data (110) Reports Descriptive (141)
EDRS PRICE MF01/PC05 Plus Postage.DESCRIPTORS *Accountability; *Articulation (Education); Community
Colleges; *Evaluation Criteria; Higher Education;*State Standards; State Universities; *StatewidePlanning; Tables (Data); Two Year Colleges
IDENTIFIERS Articulation Accountability Measures
ABSTRACTThis report by the Florida Articulation Coordinating
Committee defines seven objectives or goals of articulation andmeasures that indicate how well the objectives are being met. Thereport includes the most recent data available, identified byobjective and measure. Objective 1 is to adequately prepare secondarystudents so they can smoothly articulate to a postsecondaryinstitution; to provide for basic skills and knowledge levelassessment; and to determine the relationship between the CollegeLevel Academic Skills Test (CLAST) and articulation. Data presentedthat relate to this objective include the number of 1991-92 highschool graduates, the number of graduates entering postsecondaryeducation, student readiness for college, CLAST results, and degreeattainment. Objective 2 is to provide articulated accelerationmechanisms that allow secondary students to proceed through theeducational system as rapidly as their circumstances permit. Relateddata include the number and percent of secondary studentsparticipating in advanced placement and international baccalaureateprograms. Objective 3 is to facilitate the smooth transfer ofcommunity college associate in arts degree graduates to a stateuniversity. Related data include the number of degree-holdingtransfer students, and data on the academic performance of transferstudents. Objective 4 is to provide access to programs to allstudents meeting course prerequisites and earning a satisfactorygrade point average. Related measures focus on limited accessprograms and program enrollments. Objective 5 is to provide qualityeducation that prepares students for their chosen career within theparameters of 60 credit hours for an associate degree and 120 hoursfor a baccalaureate degree. Data on credit hours to degree areincluded. Objective 6 is to provide a logical progression andsequencing of courses for vocational certificate students. Whilemeasures for this objective were identified, none are available.Objective 7 is to determine the relationship between articulationaccountability measures and systematic efforts, processes, andservices; articulation activities are listed. (RP)
***********************************************************************
Reproductions supplied by EDRS are the best that can be madefrom the original document.
***********************************************************************
U.S. DEPARTMENT OF EDUCATIONOffice at Educat.onai Research and Improvement
E CATIONAL RESOURCES INFORMATIONCENTER (ERIC)
Th:s document has been reproduced asreceived from the person or organizationoriginating it
0 Minor changes have been made toimprove reproduction quality
"PERMISSION TO REPRODUCE THISMATERIAL HAS BEEN GRANTED BY
Points of view or opinions stated in thisdocument do not necessarily representofficial OERI position or policy
L. Owens
TO THE EDUCATIONAL RESOURCES;--1k,INFORMATION CENTER (ERIC)"
1994
ARTICULATION ACCOUNTABILITY MEASURES REPORT
The Articulation Coordinating Committee
3
OBJECTIVES AND ARTICULATION ACCOUNTABILITY MEASURES
The 1991 Task Force defined articulation as " ... systematic efforts, processes, or services
intended to ensure educational continuity to facilitate orderly, unobstructed progress between
levels or segments of institutions on a state-wide, regional, or institution-to-institution basis."
Based on this definition, the Task Force developed seven objectives or goals of articulation with
ensuing measures for all but Objective 6 that indicate how well the objectives are being met.
Following are the most recent data displays available that are identified by objective and
measure. It should be noted that this Report provides updated data only and does not include
an analysis of the data on ways to improve articulation among systems. Data analysis with
resulting recommendations and/or goals for improvements will be addressed in the January 1995
Articulation Accountability Measures Report.
1
4
ARTICULATION COORDINATING COMMITTEE MEMBERSHIP
Member
Dr. Laurey T. Stryker (Chair)Assistant CommissionerDepartment of Education
Dr. Patricia J. HansenActing Vice Chancellor forAcademic ProgramsDivision of Universities
Dr. James MauProvost & Vice President forAcademic AffairsFlorida International University
Dr. Andrew A. SorensenProvost & Vice President forAcademic AffairsUniversity of Florida
Ms. Connie GraunkeDirector, Articulation & StudentServicesDivision of Community Colleges
Dr. Edwin R. MasseyPresidentIndian River Community College
Dr. Lanny LarsonDirectorDivision of Vocational, Adult, &Community Education
Mr. Robert ConnorsDeputy Director of InstructionalProgramsDivision of Public Schools
Dr. Joan KowalSuperintendentVolusia County School District
Representing
Commissioner's Office
Term Ending
June 30, 1995
State University System Interim(Division Office)
State University System June 30, 1996(Universities)
State University System June 30, 1994(Universities)
Community College System June 30, 1996(Division Office)
Community College System August 31, 1996(Community Colleges)
Vocational Education(Division Office)
Public Schools(Division Office)
Public Schools(School Districts)
ii
5
June 30, 1994
June 30, 1995
March 31, 1996
Mr. Valene Croskey, Jr.Director, Student ServicesDepartmentBrevard County Schools
Dr. Louis BenderProfessor EmeritusFlorida State University
Ms. Tracy Newman
DOE Contacts:
Dr. Linda H. OwensDirector, Office of PostsecondaryEducation Coordination
Public Schools(School Districts)
Member-at-Large
Students
Ms. Bertha D. EastonEducation Policy AnalystOffice of PostsecondaryEducation Coordination
iii
C
March 31, 1996
June 30, 1996
September 30,1994
SUMMARY AND OVERVIEW
The Articulation Coordinating Committee established a Task Force in Fall of 1991 todevelop systemwide articulation accountability measures upon which future goals and objectivescould be based and assessed. The Task Force identified seven objectives of articulation andmeasures that would assess how well the objectives were being met. The objectives, measuresand data reports were compiled in the "Articulation Accountability Measures Report" presentedto and approved by the Articulation Coordinating Committee in March 1993. The document wassubsequently approved by the State Board of Education.
Following the adoption of the Report, the Legislature enacted Section 240.1162, whichdirects the State Board of Education to establish articulation accountability measures to assessthe effectiveness of statewide public education articulation processes. The legislation closelyresembled the objectives established by the Task Force. The law mandates an articulationaccountability process which at a minimum shall address the following:
(1) the impact of articulation processes on ensuring educational continuity and the orderlyand unobstructed transition of students between public secondary and postsecondaryeducation systems;
(2) the adequacy of preparation of public secondary students to smoothly articulate to apublic postsecondary institution;
(3) the effectiveness of articulated acceleration mechanisms available to secondarystudents;
(4) the smooth transfer of community college associate in arts degree graduates to a stateuniversity;
(5) an examination of degree requirements which exceed the parameters of 60 credithours for an associate degree and 120 hours for a baccalaureate degree in publicpostsecondary programs; and
(6) the relationship between the College Level Academic Skills Test Program andarticulation to the upper division in public postsecondary institutions.
At the December, 1993 Articulation Coordinating Committee meeting, an amendment toRule 6A-10.024, FAC, which implements Section 240.1162, Florida Statutes, was recommendedfor approval by the State Board of Education. The recommended amendment to Rule 6A-10.024(b) states:
...The Committee shall...establish articulation accountability measures. Further, theCommittee shall annually collect, analyze, and make recommendations to theCommissioner of Education on the accountability measures. Such report, at a minimum,shall address the provisions set forth in Section 240.1162, Florida Statutes. The
1
7
articulation accountability report shall be included in the Commissioner's annual reporton the status of education to the State Board of Education and the Legisiature.
In addition to the above amendment, the Articulation Coordinating Committee adoptedprocedures for implementing the proposed Articulation Accountability Rule as stated above byfirst establishing a Standing Committee on Articulation Accountability. This StandingCommittee on Articulation Accountability will be responsible for future activities related toarticulation accountability, including:
(1) developing articulation accountability measures;(2) collecting and analyzing data;(3) producing an annual Articulation Accountability Report on accountability measures;and(4) making recommendations based on an analysis of data on ways to improvearticulation among the systems through an Articulation Accountability Report to theArticulation Coordinating Committee.
The procedures recommended the 1991-92 Articulation Accountability Report as thebaseline report from which to work. The measures contained within the report that relatedirectly to the provisions in Section 240.1162, F.S., should be the starting point for the nextArticulation Accountability Measures Report.
The Standing Committee on Articulation Accountability will consist of representativesfrom all sectors of education, including:
Division of Public SchoolsDivision of Adult, Vocational, and Community EducationDivision of UniversitiesDivision of Community Colleges
The Standing Committee on Articulation Accountability has been charged with producingthe Articulation Accountability Measures Report by collecting the data necessary to meet therequirements of the measures and the provisions in Section 240.1162, F.S., using existing datacollection efforts and reports. Beginning in 1995, the report will be due in January of each yearand should contain the most recent data available. In addition to displaying the data, the Reportshould contain recommendations or goals based on an analysis of the data on ways to improvearticulation among the systems.
28
ARTICULATION ACCOUNTABILITY
OBJECTIVES AND 'MEASURES
9
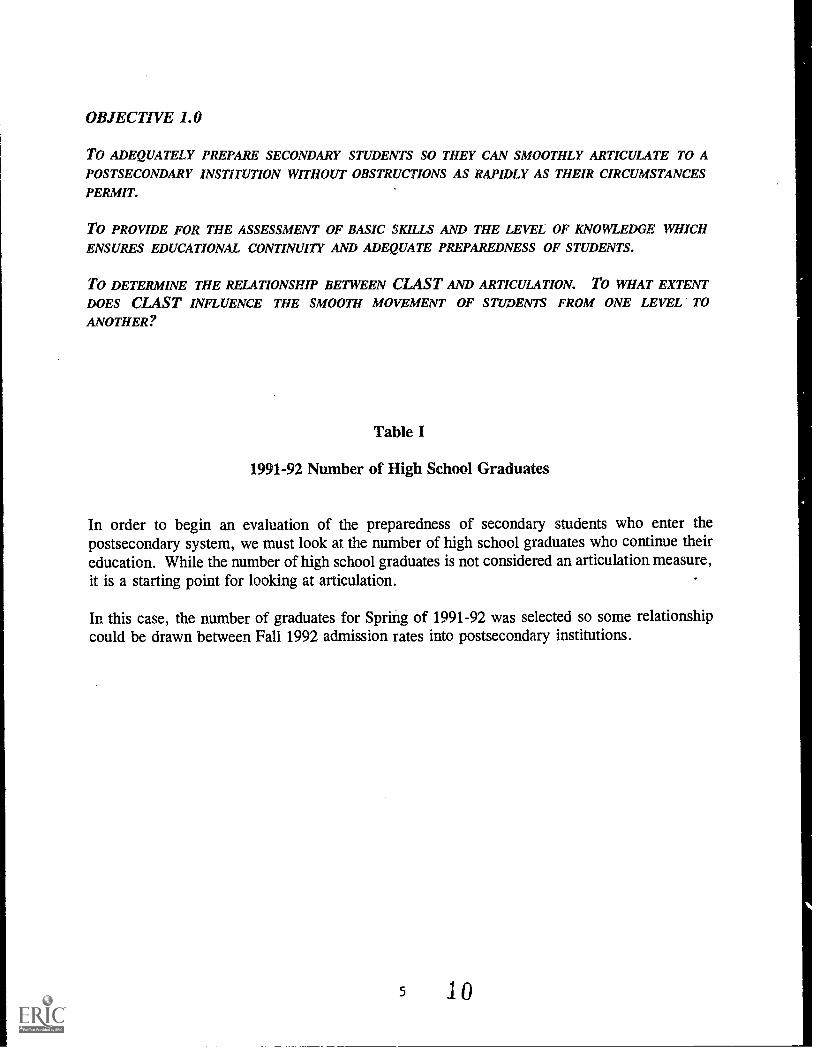
OBJECTIVE 1.0
To ADEQUATELY PREPARE SECONDARY STUDENTS SO THEY CAN SMOOTHLY ARTICULATE TO APOSTSECONDARY INSTITUTION WITHOUT OBSTRUCTIONS AS RAPIDLY AS THEIR CIRCUMSTANCES
PERMIT.
TO PROVIDE FOR THE ASSESSMENT OF BASIC SKILLS AND THE LEVEL OF KNOWLEDGE WHICHENSURES EDUCATIONAL CONTINUITY AND ADEQUATE PREPAREDNESS OF STUDENTS.
To DETERMINE THE RELATIONSHIP BETWEEN CLAST AND ARTICULATION. To WHAT EXTENTDOES CLAST INFLUENCE THE SMOOTH MOVEMENT OF STUDENTS FROM ONE LEVEL TOANOTHER?
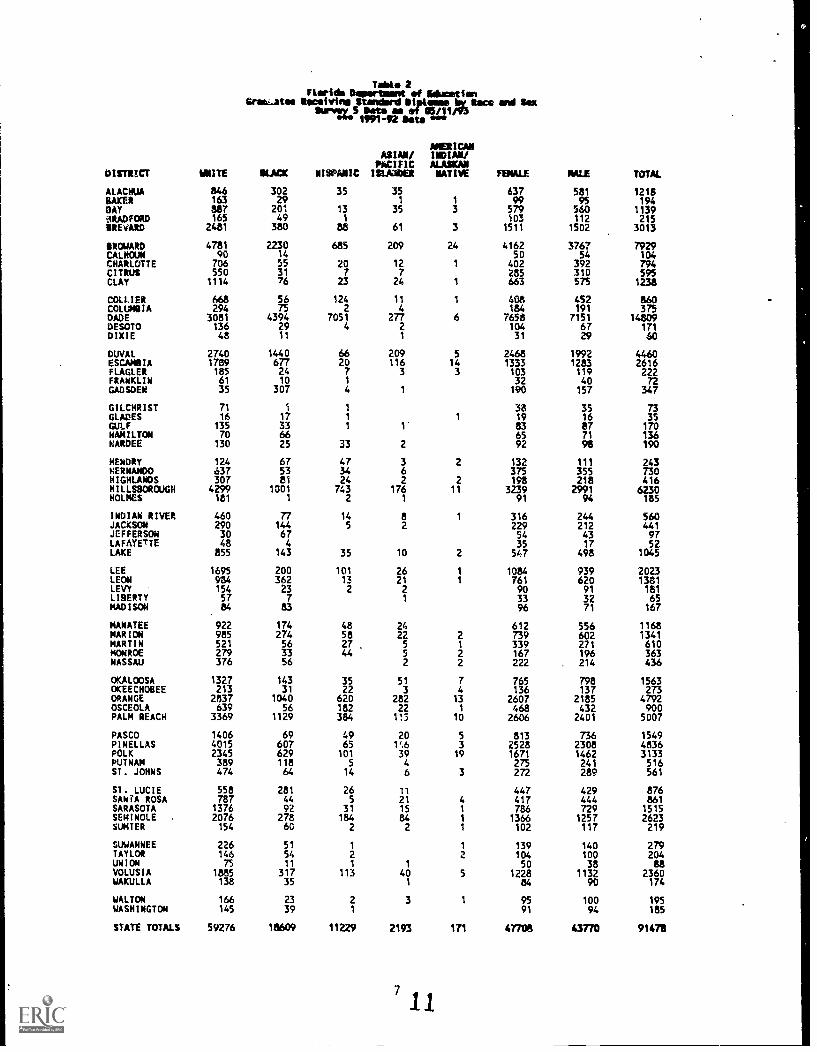
Table I
1991-92 Number of High School Graduates
In order to begin an evaluation of the preparedness of secondary students who enter thepostsecondary system, we must look at the number of high school graduates who continue theireducation. While the number of high school graduates is not considered an articulation measure,it is a starting point for looking at articulation.
In this case, the number of graduates for Spring of 1991-92 was selected so some relationshipcould be drawn between Fall 1992 admission rates into postsecondary institutions.
5 10
UAW 2Florida Deportment of Solmaetion
GraeLatee RoceiMInm Standard DIA400se WItace and SemSurvja.5 Dote as of 05/11/73
1191 -11' Iota ,""
DISTRICT WRITE SLACK HISPANIC
ASIAN/PACIFICMAUDE*
AMERICANINDIAN/ALASKANNATIVE FEMALE MALE TOTAL
ALACNUA 846 302 35 35 637 581 1218BAKER 163 29 1 1 99 95 194DAY 887 201 13 35 3 579 560 1139MONAD 165 49 1 103 112 215BREVARD 2481 380 88 61 3 1511 1502 3013
IROWARD 4781 2230 685 209 24 4162 3767 7929CALHOUN 90 14 50 54 104CHARLOTTE 706 55 20 12 1 402 392 794CITRUS 550 31 7 7 785 310 595CLAY 1114 76 23 24 1 663 575 1238
COLLIER 668 56 124 11 1 408 452 860COLUMBIA 294 75 2 4 184 191 375DADE 3081 4394 7051 277 6 7658 7151 14809DESOTO 136 29 4 2 104 67 171DIXIE 48 11 1 31 29 60
DUVAL 2740 1440 66 209 5 2468 1992 4460ESCAMIIA 1789 677 20 116 14 1333 1283 2616FLAGLER 185 24 7 3 3 103 119 222FRANKLIN 61 10 1 32 40 72GADSDEN 35 307 4 1 190 157 347
GILCHRIST 71 1 1 38 35 73GLADES 16 17 1 1 19 16 35GULF 135 33 1 1' 83 87 170HAMILTON 70 66 65 71 136HARDEE 130 25 33 2 92 98 190
HENDRY 124 67 47 3 2 132 111 243HERNANDO 637 53 34 6 375 355 730HIGHLANDS 307 81 24 2 2 198 218 416HILLSBOROUGH 4299 1001 743 176 11 3239 2991 6230HOLMES 181 1 2 1 91 94 185
INDIAN RIVER 460 77 14 8 1 316 244 560JACKSON 290 144 5 2 229 212 441JEFFERSON 30 67 54 43 97LAFAYETTE 48 4 35 17 52LAKE 855 143 35 10 2 547 498 1045
LEE 1695 200 101 26 1 1084 939 2023LEON 984 362 13 21 1 761 620 1381LEVY 154 23 2 2 90 91 181LIBERTY 57 7 1 33 32 65MADISON 84 83 96 71 167
MANATEE 922 174 48 24 612 556 1168MARION 985 274 58 22 2 739 602 1341MARTIN 521 56 27 . 5 1 339 271 610MONROE 279 33 44 5 2 167 196 363NASSAU 376 56 2 2 222 . 214 436
OKALOOSA 1327 143 35 51 7 765 798 1563OKEECHOBEE 213 31 22 3 4 136 137 273ORANGE 2837 1040 620 282 13 2607 2185 4792OSCEOLA 639 56 182 22 1 468 432 900PALM BEACH 3369 1129 384 115 10 2606 2401 5007
PASCO 1406 69 49 20 5 813 736 1549PINELLAS 4015 607 65 1',6 3 2528 2308 4836POLK 2345 629 101 39 19 1671 1462 3133PUTNAM 389 118 5 4 275 241 516ST. JOHNS 474 64 14 6 3 272 289 561
Si. LUCIE 558 281 26 11 447 429 876SANTA ROSA 787 44 5 21 4 417 444 861SARASOTA 1376 92 31 15 1 786 729 1515SEMINOLE . 2076 278 184 84 1 1366 1257 2623SUMTER 154 60 2 2 1 102 117 219
SUWANNEE 226 51 1 1 139 140 279TAYLOR 146 54 2 2 104 100 204UNION 75 11 1 1 50 38 88VOLUSIA 1885 317 113 40 5 1228 1132 2360WAKULLA 138 35 1 84 90 174
WALTON 166 23 2 3 1 95 100 195WASHINGTON 145 39 1 91 94 185
STATE TOTALS 59276 18609 11229 2193 171 47708 43770 91478
ARTICULATION ACCOUNTABILITY MEASURE 1.1
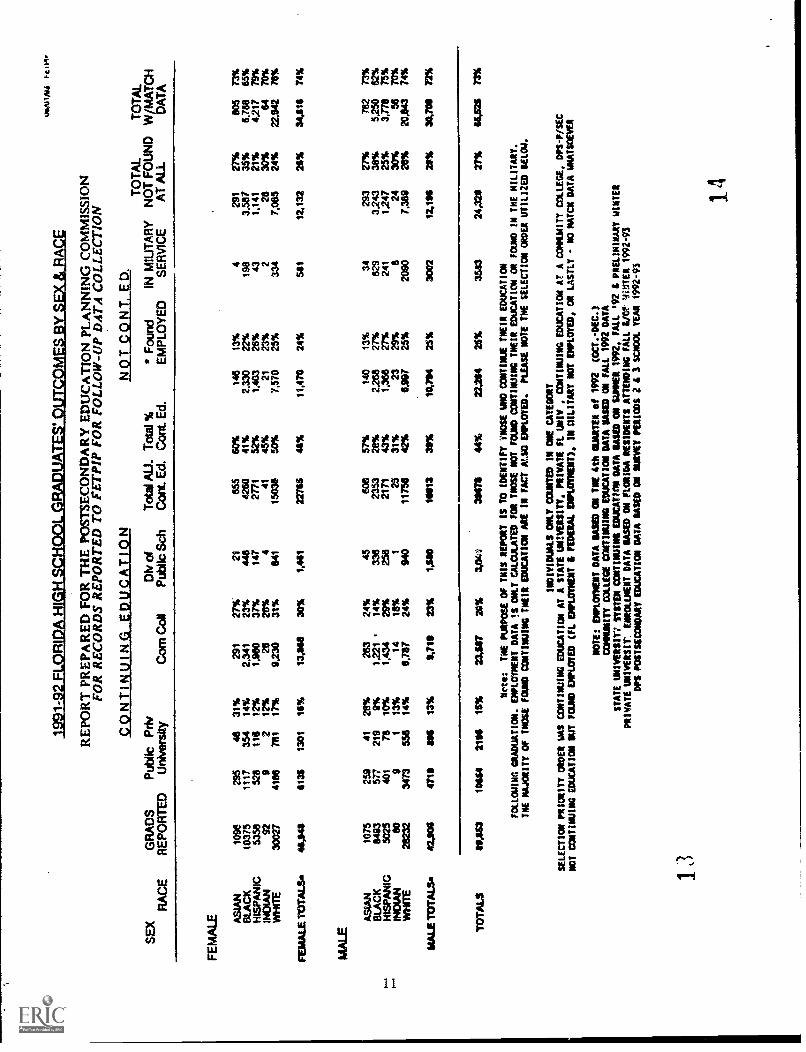
The number and percent of high school graduates, reported by gender and by racial/ethniccategories, who enter an area vocational center, a public community college, or the StateUniversity System.
/NEL
The following table is data compiled by the Florida Education Training and PlacementInformation Program (FETPIP). The Board of Regents and the Division of Community Collegeshave first-time-in-college (FTIC) data displays, but they include all FTIC and do not differentiatebetween Florida high school graduates from the preceding year and other. FTIC. Differencesin numbers may occur because students have gone out of state or they did not have a socialsecurity number.
The original measure and all of the other measures in the 1.0 series, asked for information tobe broken down by students who had taken the following:
o a college preparatory track;o a high school tech prep track;o courses designated as Advanced Placement, Dual Enrollment, or International
Baccalaureate;o three or more credits in higher level mathematics and science; and,o the requirements for designation as a Florida Academic Scholar and the Gold Seal
Scholarship.
The identification of students by the above categories is not available and has, therefor seendeleted from all of the measures. It is recommended that each of the categories al) beevaluated as separate reports rather than subsections within another measure. Separate reportswould make analysis of the program(s) easier.
9
U6A
1160
4F
C. I
lit
1991
-92
FLO
RID
A H
IGH
SC
HO
OL
GR
AD
UA
TE
S' O
UT
CO
ME
S B
Y S
EX
& R
AC
E
RE
PO
RT
PR
EP
AR
ED
FO
R T
HE
PO
ST
SE
CO
ND
AR
Y E
DU
CA
TIO
N P
LAN
NIN
G C
OM
MIS
SIO
NFO
R R
EC
OR
DS
RE
POR
TE
D T
O F
ET
PIP
FOR
FO
LL
OW
-UP
DA
TA
CO
LL
EC
TIO
N
ceQ
U1'
WIa
tra1
121a
ding
alN
OT
_S
S)
N T
. ED
.T
OT
AL
TO
TA
LS
EX
GR
AD
SP
ublic
Priv
Div
of
Tot
al A
LLT
otal
%*
Fou
ndIN
MIU
TA
RY
NO
T F
OU
ND
W/M
AT
CH
RA
CE
RE
PO
RT
ED
Uni
vers
ityC
orn
CoN
Pub
lic S
diC
ott E
d. C
ont.
Ed.
EM
PLO
YE
DS
ER
VIC
EA
T A
LLD
AT
A
FE
MA
LE AS
IAN
BLA
CK
HIS
PA
NIC
IND
IAN
WH
ITE
FE
MA
LE T
OT
ALS
MA
LE
AS
IAN
BLA
CK
HIS
PA
NIC
IND
IAN
WH
ITE
MA
LE T
OT
ALS
.
TOTALS
1098
1037
553
58 9230
027
44,9
4*
1075
8493
5025 80
2823
2
42.1
66
295
1117
526 9
4186
6131 25
957
740
1 934
73
4719
48 354
118 2
781
1301 41
219
75 1
556
896
31%
14%
12%
12%
17%
16%
28% 9% 10%
13%
14%
13%
291
2.34
11,
980 26
9,23
0
13,6
68
263
1.22
1'
1,43
4 148.
787
1.719
27%
23%
37%
28%
31%
30%
24%
14%
29%
18%
24%
23%
21 446
147 4
841
1,46
1 45
336
258 1
940
1,610
655
4260
2771
4115
036
2276
6
806
2353
2171 25
1175
8
14613
60%
41%
52%
45%
50%
49%
57%
28%
43%
31%
42%
31%
146
2.33
01.
403
217,
570
11,4
79 140
2.26
61,
366 23
6.99
7
10,714
13%
22%
26%
23%
25%
24%
13%
27%
27%
29%
25%
2S%
419
8 432
334
541 34
629
241 8
2090
3002
291
3.58
71.
141 28
7,08
5
12,1
32 293
3243
1247 24
7.38
9
12,1
96
27%
35%
21%
30%
24%
26%
27%
38%
25%
30%
28%
21%
605
6.76
84,
217 64
22.9
42
34,2
16
782
5250
3,77
856
20.8
43
30.7
09
73%
65%
79%
70%
78%
74%
73%
62%
75%
70%
74%
72%
11,163
10614
2116
15%
23,1
1726
%3,
041
31676
44%
22,214
2S%
3583
24,321
27%
66,621
73%
Note:
THE PURPOSE OF TNIS REPORT IS TO IDENTIFY 'MOSE 1103 CONTINUE TNEIR EDUCATION
FOLLOWING GRADUATION. EMPLOYMENT DATA !S ONLY CALCULATED FOR ?NOSE NOT FOUND CONTINUING THEIR EDUCATION OR FOUND IN THE MILITARY.
THE MAJORITY OF THOSE FOUND CONTINUING THEIR EDUCATION ARE IN FACT At10 EMPLOYED.
PLEASE NOTE THE SELECTION ORDER UTILIZED 61104.
INDIVIDUALS ONLY COUNTED IN ONE CATEOCOY
SELECTION PRIORITY ORDER WAS CONTINUING EDUCATION AT A STATE UNIVERSITY, PRIVATE FL UNIV , CONTINUING EDUCATION AT A COMMUWITY COLLEGE, DPS-P/SEC
NOT CONTINUING EDUCATION SOT FOUND EMPLOYED (FL IDIPLOYNENT I FEDERAL EMPLOYMENT), IN WILITART NOT EMPLOYED, CD LASTLY - NO 1441C11 DATA
WHATSOEVER
13
NOTE: EMPLOYMENT DATA BASED ON THE 4th QUARTER et 1992
(OCT.-DEC.)
COMMUNITY COLLEGE CONTINUING EDUCATION DATA BASED ON FALL 1992 DATA
STATE UNIVERSIT7 SYSTEM CONTINUINS I:DUCAT/0N DATA RASED CO SUMMER 1992, FALL ,92 i PRELIMINARY WINTER
PRIVATE UNIVERSIT. ENROLLMENT DATA BASED ON FLORIDA RESIDENTS ATTENDING FALL Eat VinTER 1992-93
DPS POSTSECONDARY EDUCATION DATA BASED ON SURVEY PERIODS 2 1 3 SCNOOL YEAR 1992-93
14
ARTICULATION ACCOUNTABILITYABILITY MEASURE 1.2
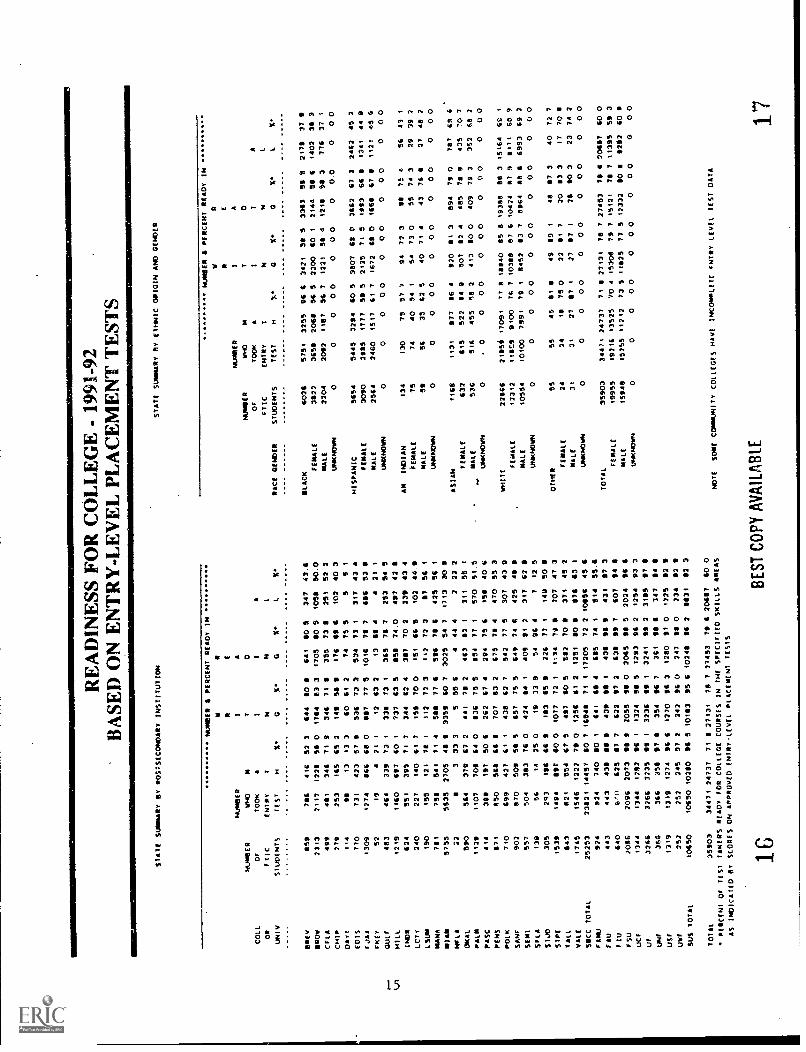
The number and percent of first-time-in-college students by gender and racial/ethniccategories who graduated from a Florida public high school in the preceding year, whoscore above or below the cutoff scores on the entry level placement tests.
The Readiness for College Report generated by the Department of Education shows the resultsof the entry level placement exam taken by first-time-in-college students who graduated froma Florida high school the previous year. It does not, however, currently contain information onthe status of vocational students sitting for the entry level placement test. That information isintended to be included in the future.
A longitudinal study of FTIC students who take the entry level placement test would be theultimate articulation accountability measure of student preparedness. Currently, the Board ofRegents publishes a College Preparatory Report which shows the number of students who fallbelow a cutoff score on entry level placement tests and are sent for remediation in math,English, and/or writing. The BOR also publishes a retention study which differentiates betweenregular admits who have met minimum admissions standards and alternative admits who did notmeet all of the requirements. At this time, the community colleges are not able to provide alongitudinal report on students who do not pass the entry level placement test. However, such
a report is expected to be available in 1995.
13
RE
AD
INE
SS F
OR
CO
LL
EG
E -
199
1-92
BA
SED
ON
EN
TR
Y-L
EV
EL
PL
AC
EM
EN
T T
EST
S
STATE SUUMMIty 97 POSTSECONDARY INSTITUTION
STATE SUMMARY IV ETHNIC ORIGIN AND GENDER
H.
Ln
NUMBER
COLL
OF
OK
FtIC
uNlv
51000479
......
WV
859
$901
2313
CFLA
499
CHIP
279
DAFT
114
EDIS
770
F.244
'309
FAO.
52
GULF
483
HILL
1219
IND*
424
LC17
240
LSUM
190
MAMA
761
MIRY
5755
NFLA
22
OKAL
550
PALM
1179
PASC
414
PENS
871
POIM
7+0
SANE
902
SEMI
557
SFLA
139
51,10
305
SITE
1539
TALL
843
VALE
1749
SOCC TOTAL
'Amu
25253
924
F4U
443
FLU
640
*512
2096
UCF
044
OF
3266
UNF
366
USF
1319
uwF
257
SUS TOTAL
10650
TOTAL
35903
PESCENt OF TEST 1AKERS
AS 114111CAtf0 87 SCORES
NUMBER 6 PERCENT READY IN
IR
RE
NUMER
/A
WHO
27
0100K
A1
1A
ENTRY
7N
NL
TEST
H1
GS.
G9
LV
746
416
52 3
244
SO 11
641
10 S
347
43.6
2117
1229
58 0
1714
83 3
1705
SO 9
1058
9 0.0
481
342
71 9
342
71
II
255
73 8
251
52 2
253
125
65 2
142
58 0
176
61 6
102
40 3
119
13
13 3
10
61 2
74
73 5
55
t
731
473
57 9
536
72 3
534
73
1317
43
1774
866
68 0
297
77 5
1016
72 7
226
53 8
11
4at
i12
63 2
13
92 4
21
t
464
339
73
1339
73
1325
76 7
253
54 5
1140
697
20 1
737
63 5
851
74.0
497
42 6
551
395
71 7
344
22 4
327
70 2
239
43
227
140
61 7
192
70 0
151
62 5
102
44.9
155
121
7!
1112
77 3
112
72 2
97
52
1
758
541
71 4
588
77 6
551
76 2
475
Si t
5535
2705
48 11
33511
60 7
3025
54 7
1713
30 9
93
32 3
444 4
222 2
555 6
514
37g
27 2
441
79 2
463
82
1311
55
I
1107
701
64 0
832
75 5
054
77
1170
51.9
392
197
SO 6
222
67 4
294
75 2
156
40 6
950
568
62 8
707
83 2
675
71I 4
410
55 3
199
427
61
1428
62 7
542
77 5
307
43 2
970
509
59 5
657
15 9
249
74 6
425
48 11
504
383
76 0
424
24
1401
91 2
317
62 II
Si
14
2S 0
19
33 9
54
96 4
712 5
253
196
22 11
123
25 $
226
77
I142
50 9
t494
897
20 0
1077
72
1094
74 II
707
47 3
921
554
67 5
27 60 5
582
70 111
371
45 2
+541
1222
79 0
1254
61 2
1251
80 11
972
43
1
23121 14451
20 7 12942
71
117209
72 2 10452
45 2
924
740
90 f
641
211 4
225
74
1514
S5.6
443
430
OS 9
439
02 1
420
98 10
431
97 3
9,0
225
117
7222
07 2
638
99 7
607
24 8
2096
2073
28 II
2055
90 0
2065
98 5
2024
Si 6
1344
1292
96
I1324
OM 5
1293
96 2
1254
93 3
3266
3235
99
13236
89
13241
OS 2
3195
97 8
366
398
97 S
354
96 7
361
98 6
347
94 8
1319
*774
26 6
1270
96 3
1280
91 0
1225
112
II
292
245
97 2
242
96 0
247
98 0
234
112 9
10650 10280
Ss 5 10113
95 6 102411
94 2
9831
92 9
34411 24737
11 8 27131
79 7 27452
79 2 20287
40 0
READY FOR COLLEGE COURSES IN THE SPECIFIED SKILLS AREAS
ON APPROVED ENTRY-LEVEL PLACEMENT TESTS
NUMBER S.
2 IT
WAWA
I
NUMBER
',HO
M7
OF
TOOK
AI
FTIC
ENTRY
IN
RACE GENDER
STUDENTS
TEST
H7
G
/LACK
5751
3255
92 4
3421
FEMALE
6022
3822
365$
20168
56 5
2200
MALE
2204
2092
1121
56 7
1221
UNKNOWN
00
00 0
0
HISPANIC
5654
FEMALE
MALE
5445
3294
60 5
3507
3030
21129
1777
St 5
2135
2460
1517
61 7
1672
uNKNOWN
00
00 0
0
25::
AM
INDIAN
130
75
57 V
94
FEMALE
74
40
54
154
MALE
52
56
35
67 S
40
UNKNOWN
0
1168
00
0 0
0
ASIAN
1131
1177
86 4
920
FEMALE
632
615
522
84 9
507
...
526
514
455
65 2
413
UNKNOWN
0.
00
0 0
0
FEMALE
MILE
22626
211159 17091
77 9 18140
12312
11169
9100
76 7 10318
10554
10100
7991
79
f8452
UNKNOWN
00
00 0
0
OTHER
55
59
45
SI I
49
24
24
18
75 0
22
MALE
31
31
27
07 1
27
UNKNOWN
00
00 0
0
TOTAL
35902
34471 74777
71 9 27131
FEMALE
19955
19216 13529
10 4 15306
MALE
15949
13755 11712
73 s 11625
uNKNOwN
00
00 0
0
MOTE
SOME COMmuN177 COLLEGES HAVE INCOMPLETE ENTRY
PERCENT READY IN
a E A 0 N1
0IV
Oft 5
3393
OS 9
20 1
2144
58 6
99 4
1212
98.3
0 0
00.0
22 0
3662
27 3
71 S
1423
66 8
68 0
1669
67 11
0 0
00 0
72 3
92
75 4
73 0
55
74 3
71 4
43
76 8
0 0
00 0
81 3
894
71 0
82
1495
75 9
20 0
409
79 3
0 0
00 0
85 El
19388
88 3
57 6 10424
57 9
83 7
8064
88 2
0 0
00 0
09
I48
87 3
II 7
70
63 3
87
129
90 3
0 0
00 0
78 7 27453
79 6
79 7
15171
78 7
77 5 12332
60 I
0 0
00 0
LEVEL TEST DATA
L L
2170
1402
776 0
2462
1341
1121 0
52
25
27 0
787
435
352 0
15164
6171
6992 0 4017
23 0
20487
11395
2222 0
1 37 9
38 2
37
1
0 0
45 2
44 9
45 G
0 0
43 1
99 2
45 2
0 0
69 6
70 7
69 2
0 0
69
I
69 9
69 2
0 0
72 7
70 O
74 2
0 0
20 0
59 3
60 2
0 0
16B
ES
T C
OP
Y A
VA
ILA
BLE
ARTICULATION ACCOUNTABILITY MEASURE 1.3
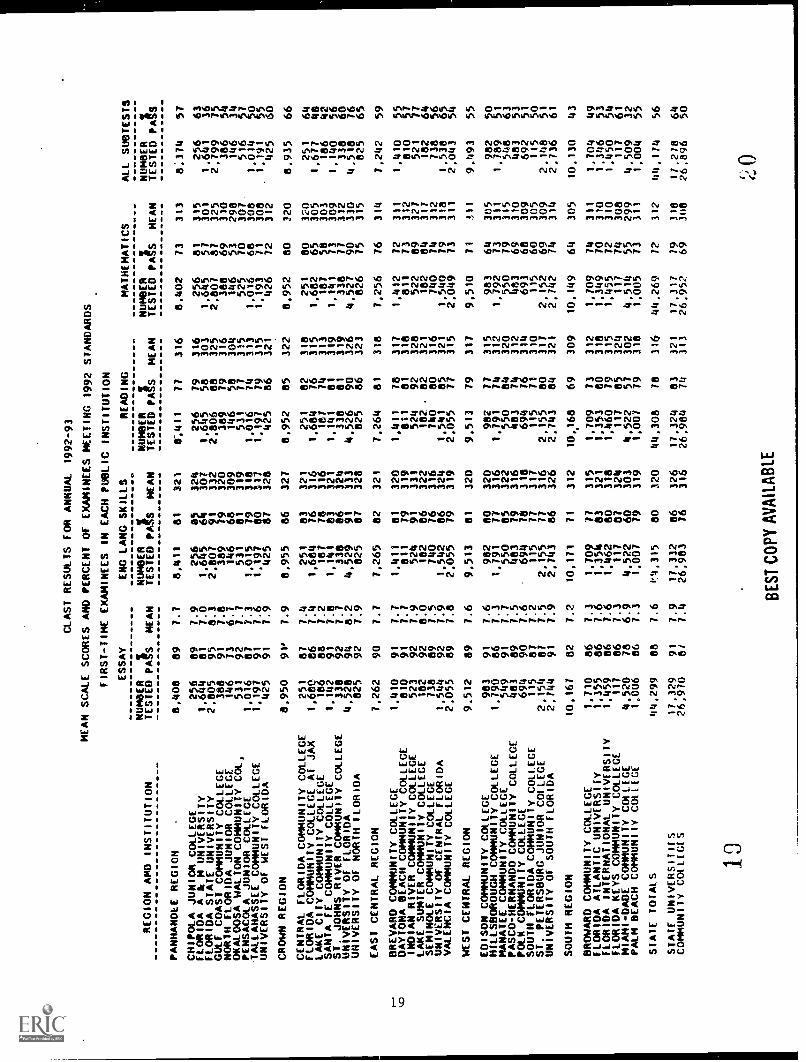
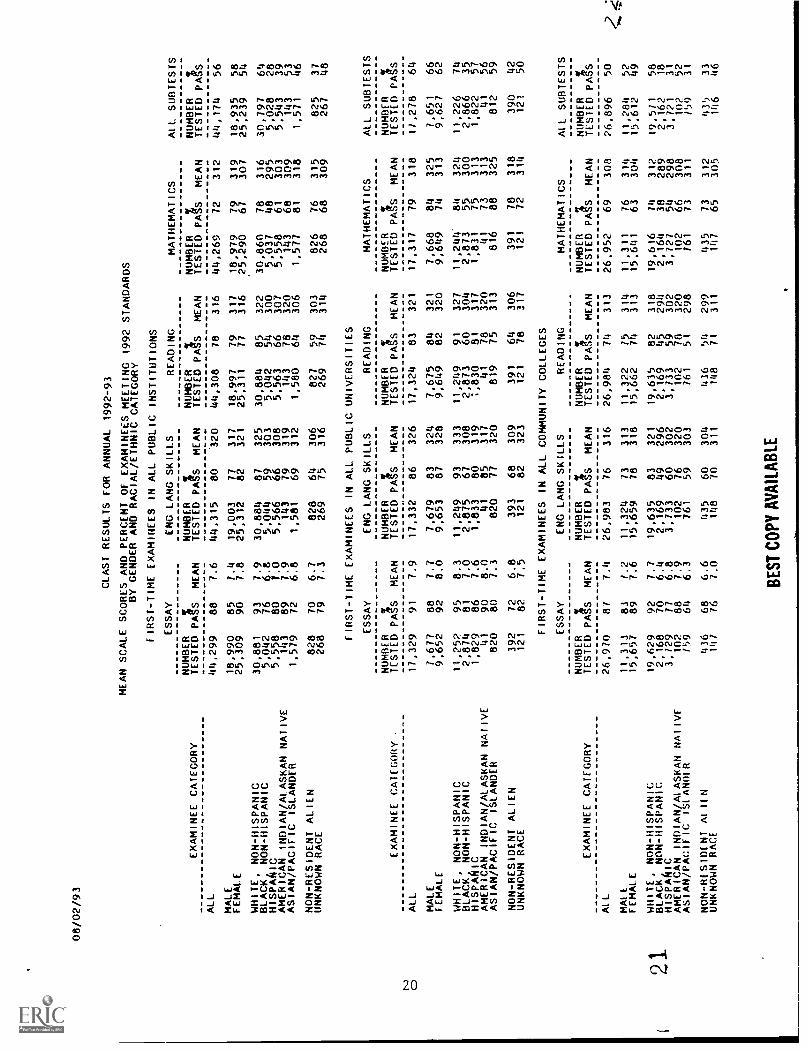
The number and percent of community college and native university students by gender,race and institution, who took the CLAST exam and met current standards on any of thefour sub-tests on the most recent administration of the CLAST exam.
AMMMIiNIMIV
The following display the number and percent of students who have passed or failed the CLASTexam in two ways. The first table is the information by institution for the last administrationof the exam. The second table is a longitudinal study of students who first sat for the exam inOctober 1986 and how many subsequent attempts resulted in suc:ess or failure.
1817
D
REGION AHD INSTITUTION
CLAST RESULTS FOR ANNUAL 1992-93
MEAN SCALE SCORES AND PERCENT OF EXAMINEES MEETING 1992 STANDARDS
FIRST-TIME EXAMINEES IN EACH PUBLIC INSTITUTION
ESSAY
ENG LANG SKILLS
READING
NUMBER
%NUMBER
%TESTED PASS
MEAN
TESTED PASS
PANHANDLE REGION
CHIPOLA JUNIOR COLLEGE
FLORIDA A & m UNIVERSITY
FLORIDA STATE UNIVERSITY
GULF COAST COMMUNITY COLLEGE
NORTH FLORIDA JUNIOR COLLEGE
OKALOOSA WALTON COMMUNITY COL,
PENSACOLA JUNIOR COLLEGE
TALLAHASSEE COMMUNITY COLLEGE
UNIVERSITY of WEST FLORIDA
CROWN REGION
CENTRAL FLORIDA COMMUNITY COLLEGE
FLORIDA COMMUNITY COLLEGE AT JAX
LAKE CITY COMMUNITY COLLEGE
SANTA FE COMMUNITY COLLEGE
ST. JOHNS RIVER COMMUNITY COLLEGE
UNIVERSITY OF FLORIDA
UNIVERSITY OF NORTH FLORIDA
EAST CENTRAL REGION
BREVARD
MMUNITY
DAYTONA
BECOACHCOMMUNITY
COLLEGE COLLEGE
INDIAN RIVER COMMUNITY COLLEGE
LAKE SUMTER COMMUNITY COLLEGE
SEMINOLE COMMUNITY COLLEGE
UNIVERSITY of CENTRAL FLORIDA
VALENCIA COMMUNITY COLLEGE
WEST CENTRAL REGION
EDISON COMMUNITY COLLEGE
HILLSBOROUGH COMMUNITY COLLEGE
MANATEE COMMUNITY COLLEGE
PASCO-HERNAND0 COMMUNITY COLLEGE
POLK COMMUNITY COLLEGE
SOUTH FLORIDA COMMUNITY COLLEGE
ST. PETERSBURG JUNIOR UNLACE
UNIVERSITY OF SOUTH FLORIDA
SOUTH REGION
BROWARD COMMUNITY COLLEGE
FLORIDA ATLANTIC UNIVERSITY
FLORIDA INTERNATIONAL UNIVERSITY
FLORIDA KEYS COMMUNITY COLLEGE
MIAMI-DADE COMMUNITY COLLEGE
PALM BEACH COMMUNITY COLLEGE
STATE TOTALS
STATE UNIVERSITIES
COMMUNITY COLLEGES
8,408
256
1,644
2.805
388
146
531
1,016
1.197
425
8,950
251
1,680
166
1,142
338
4,528
825
7,262
1,410
810
523
162
733
1,544
2.055
9.512 83
1,9790
549
694
483
115
2, 2,144
154
10,167
1,710
1,355
1,459
11/
4,520
1,006
44,299
17,329
26,970
89
8981
95
91
7392
87
9191
91'
67
888
9192 9492
90 919192
9289 92
8 92 89
86
91
918990
87
61
91
62 6686
06
66 86
78
88
916/
7.7
7.9
7.0
8.3
7.8
6.7
7.7
7.3
7.6
7.9
7.9
7.4
7.4
7.2
7.8
7.7
8.2
7.9
7.7
7.7
7.7
7.9
8.0
7.5
7.9
7.8
7.6
7.6
7.3
7.7
7.5
/.6
7.2
7.5
7.9
7.2
7.3
7.6
7.6
1.3
6.9
7.3
7.6
7.9
7.4
8,411
256
1.645
2,807
389
146
531
1,015
1,197
425
8,955
251
1,684
187
1,141
338
4,529
825
7,265
1,411
811
524
162
71,54240
2.055
9,513
982
1,791
550
483
694
115
2,155
2,743
10,171
1.709
1,354
1.462
117
4,522
1,007
1.:4,315
17,332
26,983
10
81 a 94
7 68
81 79
Q0
87
86 83
76
83
78
86
87
91
82
61
91
79
86
7686
79
81
60
7785
79 78
77
86
77 71
77
83
8780
60 79
80 86
76
MATHEMATICS
MEAN
321
324
307
332
320
309
319
16
317
328
327
321
331
3166
3212
3334
328
321
320
319
331
322
316
324
319
320
320
316
316
322
31 3178
326
316
312
315
321
318
324
303
319
320
326
316
NUMBER
%TESTED PASS
8",411
77
256
79
1,645
58
2,806
88
389
79
146
58
531
77
1,016
74
1.197
79
425
86
8,952
85
251
1,684
76
82
187
1,141
8174
338
81
4,526
90
825
86
7,264
81
1,411
76
811
81
524
92
162
82
74
80
1.5410
85
2,055
77
9,513
79
82
1,9791
7477
550
84
483
694
/6
74
115
71
2,155
ao
2,143
84
10,168
69
1,709
73
1,353
80
1,460
79
117
85
4,522
57
1,007
79
44,306
78
17,324
83
26,984
74
MEAN
316
316
303
325
316
304
315
313
315
321
322
318
315
313
319
319
326
323
318
317
318
328
321
316
315
321
317
315
312
320
312
3104
1
3 317
321
309
312
318
315
324
302
316
316
321
313
NUMBER
%TESTED PASS
8.402
73
256
81
1,645
57
2,807
87
388
69
146
53
525
70
1,016
68
1,193
71
426
72
8,952
80
251
80
1,682
65
187
1,141
38
73
338
77
4,527
90
826
75
7,256
76
1,412
72
811
73
522
89
182
84
774
1,540
40
2,049
7379
9,510
71
83
64
1,9792
73
550
79
463
69
693
68
11
60
2,152
64
2,742
10,149
64
1,709
74
1,349
70
1,455
72
117
74
4.514
55
1,005
73
44,269
12
17,317
79
26,952
69
MEAN
313
315
301
325
310
298
307
308
308
312
320
320
305
303
309
312
330
315
314
311
312
327
317
312
318
311
411
305
311
315
310
309
305
309
314
305
311
310
310
308
299
311
312
318
308
BE
ST C
OPY
AV
AIL
AB
LE
ALL SUBTESTS
NUMBER
%TESTED PASS
8.374
57
256
61
1,641
32,799
4386
146
34
516
1,014
il
1.191
5425
60
8.935
66
251
1,677
1.140
186
338
4,518
825
7,242
1,410
810
521
182
738
1,538
2,043
9,493
644642
56
60 7665
59 55
64
656 5
54
55
982
50
1,789
51
548
63
483
53
692
51
115
50
2.148
51
2,736
61
10,130
43
1,704
49
1,346
53
1,450
54
117
61
4.509
32
1,004
55
44,174
56
17.278
64
26,896
50
08/02/93
CLAST RESULTS FOR ANNUAL 1992-93
MEAN SCALE SCORES AND PERCENT OF EXAMINEES MEETING
1992 STANDARDS
BY GENDER AND RACIAL/ETHNIC CATEGORY
FIRST-TIME EXAMINEES IN ALL PUBLIC INSTITUTIONS
READING
MATHEMATICS
ALL SuBTESTS
EXAMINEE CATEGORY
ESSAY
NUMBER
%TESTED PASS
MEAN
ENG LANG SKILLS
NUMBER
PASS
TESTED PASS
MEAN
ALL
44,299
88
7.6
44,315
80
120
MALE
18,990
85
7.4
19,003
77
317
FEMALE
25.309
90
7.8
25,312
82
321
WHITE, NON-HISPANIC
30,881
93
7.9
30,884
87
325
BLACK, NON-HISPANIC
5,042
76
6.g
5,044
59
303
HISPANIC
5,558
80
T.
5,566
66
308
AMERICAN INDIAN/ALASKAN NATIVE
143
89
7.9
143
79
319
ASIAN/PACIFIC ISLANDER
1,579
72
6.8
1,581
69
312
NON-RESIDENT ALIEN
828
70
6.7
828
64
306
UNKNOWN RACE
268
79
7.3
269
75
316
%NUMBER
PASS
%TESTED PASS
MEAN
TESTED PASS
MEAN
TESTED PASS
44,308
78
316
44,269
72
312
44,174
56
18,997
79
317
18,979
79
319
18,935
58
25,311
77
316
25,290
67
307
25,239
54
30,884
85
322
30,860
78
316
30,797
64
5,042
54
300
5,037
48
295
5,028
28
5,563
66
307
5,558
61
303
5,543
39
143
78
320
143
68
309
143
V1,580
64
306
1,577
81
318
1,571
6
827
59
303
826
76
315
825
37
269
74
314
268
68
309
267
48
FIRST-TIME EXAMINEES IN ALL PUBLIC UNIVERSITIES
ENG LANG SKILLS
READING
EXAMINEE CATEGORY
ESSAY
NUMBER
%TESTED PASS
MEAN
ALL
17,329
91
7.9
MALE
7,677
88
7.7
FEMALE
9,652
92
8.0
WHITE, NON-HISPANIC
11,252
95
8.3
BLACK, NON-HISPANIC
2,874
81
7.0
HISPANIC
1,829
86
7.6
AMERICAN INDIAN/ALASKAN NATIVE
41
90
8.0
ASIAN/PACIFIC ISLANDER
820
80
7.3
NON-RESIDENT ALIEN
392
72
6.8
UNKNOWN RACE
121
82
7.5
EXAMINEE CATEGORY
FIRST-TIME
ESSAY
NUMBER
%TESTED PASS
MEAN
Al L
26,910
87
7.4
11,313
83
1.2
FEMALE
15,657
89
7.6
WHITE, NON - HISPANIC
19,629
92
7.7
BLACK, NON-HISPANIC
2,168
70
6.4
HISPANIC
3,129
77
6.8
AMERICAN INDIAN / ALASKAN NATIVE
102
88
7.9
ASIAN/PACIFIC 1SIANDIR
159
64
6.3
NON - RESIDENT Al 11F1
436
68
6.6
UNKNOWN RACE
147
76
7.0
NUMBER
TESTED PASS
MEAN
NUMBER
TESTED PASS
MEAN
MATHEMATICS
ALL SUBIESTS
NUMBER
%TESTED PASS
MEAN
NUMBER
%TESTED PASS
17,332
86
326
17,324
83
321
17,317
79
318
11,278
64
7,679
83
324
7,675
84
321
7,668
84
325
7,651
66
9,653
87
328
9,649
82
320
9,649
74
313
9,627
62
11,249
93
333
11,249
91
327
11,244
84
324
11,226
74
2,875
67
308
2,873
60
304
2,873
55
300
2,866
35
1,833
80
319
81
317
1,831
75
313
1,822
57
41
85
317
41
78
320
41
73
313
41
56
820
77
320
819
75
313
816
88
325
812
59
393
68
309
391
64
306
391
78
318
390
42
121
82
323
121
78
317
121
72
314
121
50
EXAMINEES IN ALL COMMUNITY COLLEGES
ENG LANG SKILLS
READING
MATHEMATICS
AIL SUBTESTS
NUMBER
%TESTED PASS
MEAN
NUMBER
%TESTED PASS
MEAN
NUMBER
%TESTED PASS
MEAN
NUMBER
TESTED PAIS
26,983
76
316
26,984
74
313
26,952
69
308
26,896
50
11,324
73
313
11,322
f4
314
11,311
76
314
11,284
15,659
78
318
15,662
313
15,641
63
304
15,612
19,635
83
321
19,635
82
318
19,616
74
312
19,511
58
2,169
49
296
2,169
45
294
2,164
38
289
2,162
18
3,733
60
302
3,133
59
302
3,727
54
298
3,721
31
102
76
320
102
78
320
102
66
308
102
52
761
59
303
761
51
298
761
73
311
159
31
435
60
304
1118
70
311
BE
ST
CO
PY
AV
AIL
AB
LE
436
54
299
148
71
311
435
73
312
147
65
305
435
33
146
46
ARTICULATION ACCOUNTABILITY MEASURE 1.4
r".The number and percent of an identified cohort group who took the CLAST exam andthe results on each of the four sub-tests for the first administration and any subsequentadministrations.
The following represents the pass rate of a cohort group of students who first took the CLASTin October 1992 and the subsequent pass rate of those in the original cohort who continued totake the exam through the October 1993 administration. This new cohort analysis shows thecumulative passing rate of the group of examinees who first took the examination in 1992.
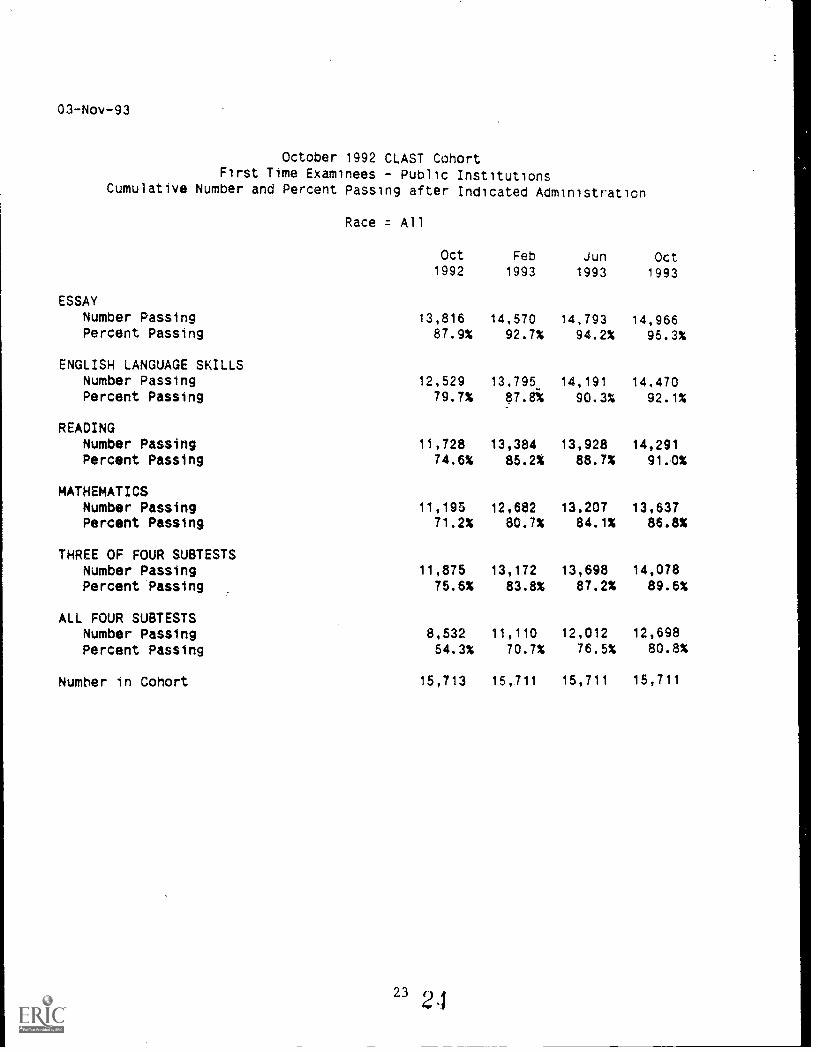
03-Nov-93
October 1992 CLAST CohortFirst Time Examinees - Public Institutions
Cumulative Number and Percent Passing after Indicated Administration
Race = All
Oct Feb Jun Oct1992 1993 1993 1993
ESSAYNumber Passing 13,816 14,570 14,793 14,966Percent Passing 87.9% 92.7% 94.2% 95.3%
ENGLISH LANGUAGE SKILLSNumber PassingPercent Passing
READINGNumber PassingPercent Passing
MATHEMATICSNumber PassingPercent Passing
THREE OF FOUR SUBTESTSNumber PassingPercent Passing
ALL FOUR SUBTESTSNumber PassingPercent Passing
Number in Cohort
12,529 13.795 14,191 14.47079.7% $7.8% 90.3% 92.1%
11,728 13,384 13,928 14,29174.6% 85.2% 88.7% 91.0%
11,195 12,682 13,207 13,63771.2% 80.7% 84.1% 86.8%
11,875 13,172 13,698 14,07875.6% 83.8% 87.2% 89.6%
8,532 11,110 12,012 12,69854.3% 70.7% 76.5% 80.8%
15,713 15,711 15,711 15,711
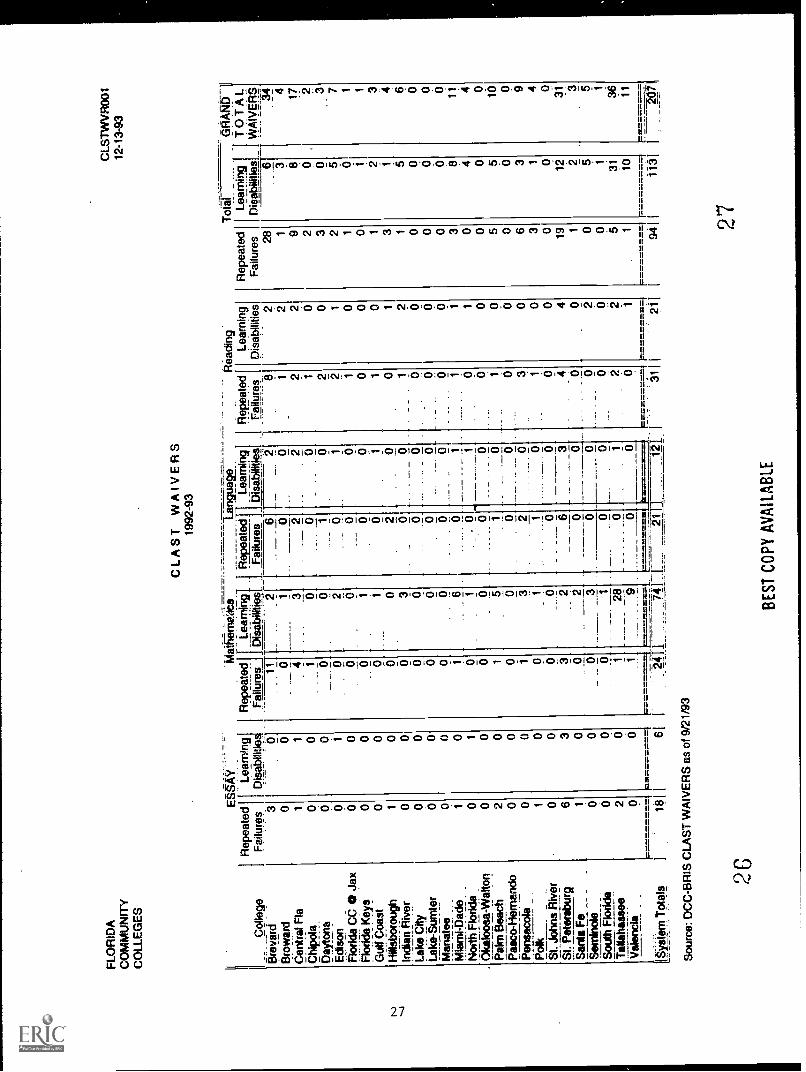
ARTICULATION ACCOUNTABILITY MEASURE 1.5
The number of CLAST waivers given by college and university.
Section / 40.107(6), Florida Statutes, requires each community college and university presidentto repo-t annually the number and percentage of students granted CLAST waivers, the 3ubtestswaived, and the reasons for granting the waivers. This statute makes provision for CLASTwaivers and describes the process at the institutional level for determining st dent eligibility fora waiver.
25 25
FLO
RID
AC
OM
MU
NIT
YC
OLL
EG
ES
Col
lege
Bre
vard
Bro
war
dC
entr
e, F
laC
hipe
t!.P
fY.!9
_1.4
1E
diso
nF
lorid
a C
C 0
Jax
Flo
rida
Key
s.G
ulf C
oast
Hou
ghIn
dian
!Riv
erLa
ke C
ityLa
ke-S
umte
rM
.!!n5
1.1?
!!M
iam
i-Dad
e
!"49
±11
:11/
2fic
0_
Pic
1129
5#:W
alto
n.e
kfT
I Bea
ch_
Pas
co-I
tern
endo
Pen
saco
laP
olk
St.
Johr
is R
iver
St.
Pet
ersb
urg
San
ta F
eS
emin
ole
Sou
th F
lorid
a11
010,
f410
Val
enci
a
[Sys
tem
Tot
als
Rep
eate
dLe
amll
.
Fai
lure
sD
isat
Alit
le3
00 0 0 o
0O
0O
01
0O
0
o00 0
0 10
o1
O0
20
o0
00
10
O0
63
10
o0
20
1 0 0
186
CLA
ST
WA
IVE
RS
1992
-93
Mat
hiar
ieic
i----
----
----
LanA
u---
awil
fieal
ad]]
Lear
ning
Rep
eate
d]Le
arni
ng-1
failu
res
Dis
abili
ties[
Fai
lure
s J
Dis
abili
ties
11
0 4 0 0 0 0 0 0 0 0 0 0 0 0 1 0 1 0 3 0 0 0 1
Sou
rce:
DC
C-B
RIS
CLA
ST
WA
IVE
RS
as
of 9
/21/
93
26
2 1 3 0 0 2 0 1 1 0 3 0 0 0 6 0 5 0 3 1
_._ 2 2 1
__28
__
62 0
22
66
..._
_..
_-
.-
bI 1
_..
6 I
0
0 00
0 =
f_
7421
i1
CLS
TW
VR
001
12-1
3-93
Rea
ding
Tot
!_G
RA
ND
._ ..
..
Ref
ieat
edLe
arni
ngR
epea
ted
Lear
-nin
g-T
b T
A I
Fai
lure
sD
isab
ilitie
sF
ailu
res
Dis
abili
ties
WA
IVE
RS
-8..
.-
228
654
12
13
42
29
817
10
20
20
30
21
25
01
01
00
00
i1
01
2
01
1
12
5
90
00
00
11
01
00
31
0 0 0 0 0 4 0 2 0 2
0 3 1 0 4 0 0 0 2 01
21
3 1 0 0 0 3 0 0 5 0 6 3 0 19 1 0 0 5 1
94
0 0 0 8 4 0 5 0 3 1 0 12 2 5
31 10
1 1 3 6 0 011
4 0 10 0 4 0 91 3 5 36 11
1i 3
207
BE
ST
CO
PY
AV
AIL
AB
LE
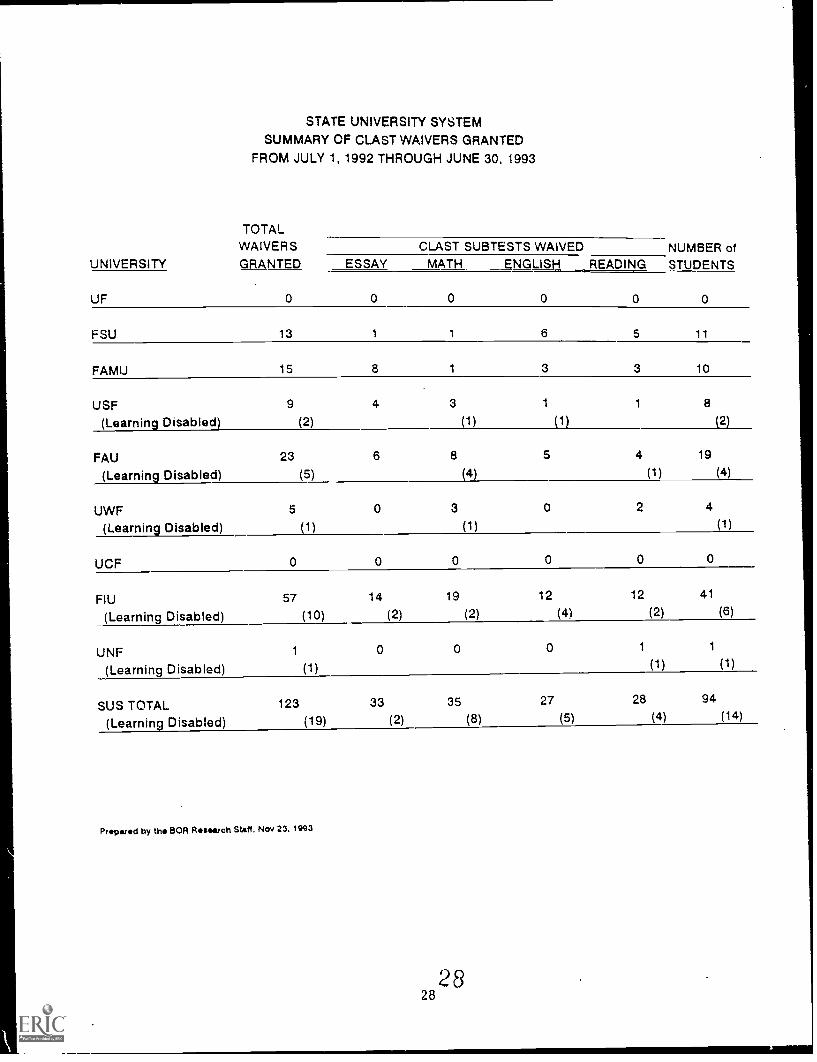
STATE UNIVERSITY SYSTEMSUMMARY CF CLAST WAIVERS GRANTED
FROM JULY 1, 1992 THROUGH JUNE 30, 1993
UNIVERSITY
TOTALWAIVERSGRANTED
NUMBER ofSTUDENTS
CLAST SUBTESTS WAIVEDESSAY MATH ENGLISH READING
OF 0 0 0 0 0 0
FSU 13 1 1 6 5 11
FAMU 15 8 1 3 3 10
USF
(Learning Disabled)9
(2)
4 3
(1)
1
(1)
1 8
2
FAU
(Learning Disabled)23
(5)
6
0
8
3
(4)
(1)
5
0
4
2
(1)
19
4
(4)
(1)UWF
(Learning Disabled)5
(1)
UCF 0 0 0 0 0 0
FIU
(Learning Disabled)57
(10)
14
(2)
19
(2)
12
(4)
12
(2)
41
(6)
UNF(Learning Disabled)
1
(1)
0 0 0 1
(1)
1
(1)
SUS TOTAL(Learning Disabled)
123(19)
33(2)
35
(8)
27
(5)
28(4)
94(14)
Prepared by the BOR Research Staff, Nov 23. 1993
ARTICULATION ACCOUNTABILITY MEASURE 1.6
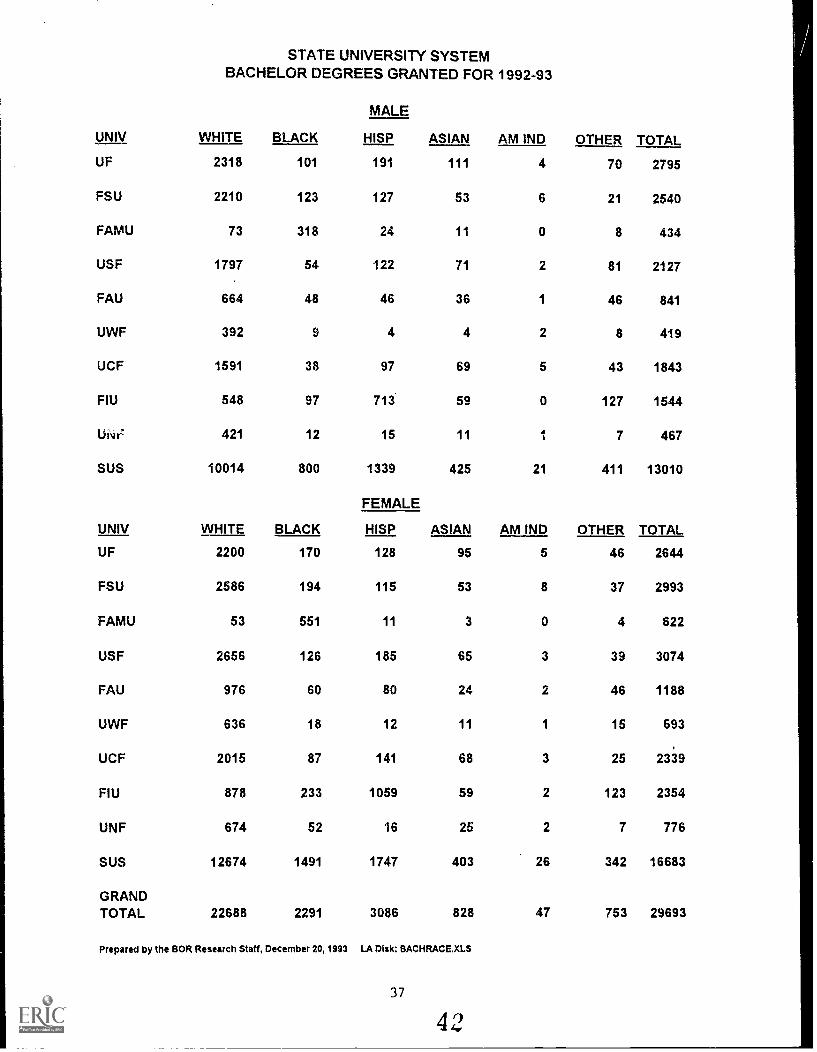
The number and percent of students by gender and racial/ethnic categories who receivedan associate in arts, associate in science, vocational certificate or baccalaureate degree.
\
2929
12/21/93
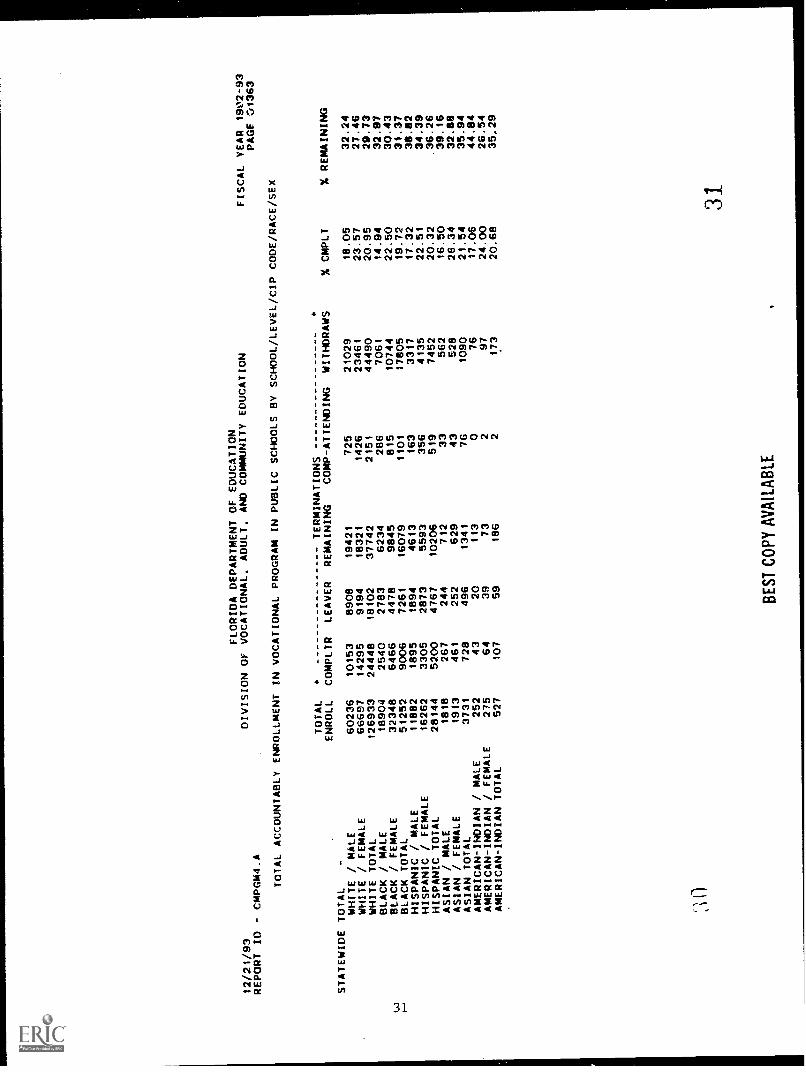
REPORT ID - CMPGM4.A
FLORIDA DEPARTMENT OF EDUCATION
DIVISION OF VOCATIONAL, ADULT, AND COMMUNITY EDUCATION
FISCAL YEAR 19'2-93
PAGE :51363
TOTAL ACCOUNTABLY ENROLLMENT IN VOCATIONAL PROGRAM IN PUBLIC SCHOOLS BY
SCHOOL/LEVEL/CIP CODE/RACE/SEX
STATEWIDE
TOTAL
-
TOTAL
ENROLL
COMPLTR
LEAVER
TERMINATIONS
REMAINING
COMP-ATTENDING
WITHDRAWS
% CMPLT
% REMAINING
WHITE / MALE
60236
10153
8908
19421
725
21029
18.05
32.24
WHITE / FEMALE
66697
14295
9194
18321
1426
23461
23.57
27.46
WHITE TOTAL
126933
24448
18102
37742
2151
44490
20.95
29.73
BLACK / MALE
18904
2540
2783
6234
286
7061
14.94
32.97
La
BLACK / FEMALE
32348
6466
4478
9845
815
10744
22.50
30.43
1-.
BLACK TOTAL
51252
9006
7261
16079
1101
17805
19.72
31.37
HISPANIC / MALE
11882
1895
1894
4613
163
3317
17.32
38.82
HISPANIC / FEMALE
16262
3305
2873
5593
356
4135
22.51
34.39
HISPANIC TOTAL
28144
5200
4767
10206
519
7452
20.32
36.26
ASIAN / MALE
1818
267
244
712
33
562
16.50
39.16
ASIAN / FEMALE
1913
461
252
629
43
528
26.34
32.88
ASIAN TOTAL
3731
728
496
1341
76
1090
21.54
35.94
AMERICAN-INDIAN / MALE
252
43
20
113
076
17.06
44.84
AMERICAN - INDIAN / FEMALE
275
64
39
73
297
24.00
26.54
AMERICAN - INDIAN TOTAL
527
107
59
186
2173
20.68
35..29.
31
BE
ST
CO
PY
AV
AIL
AB
LE
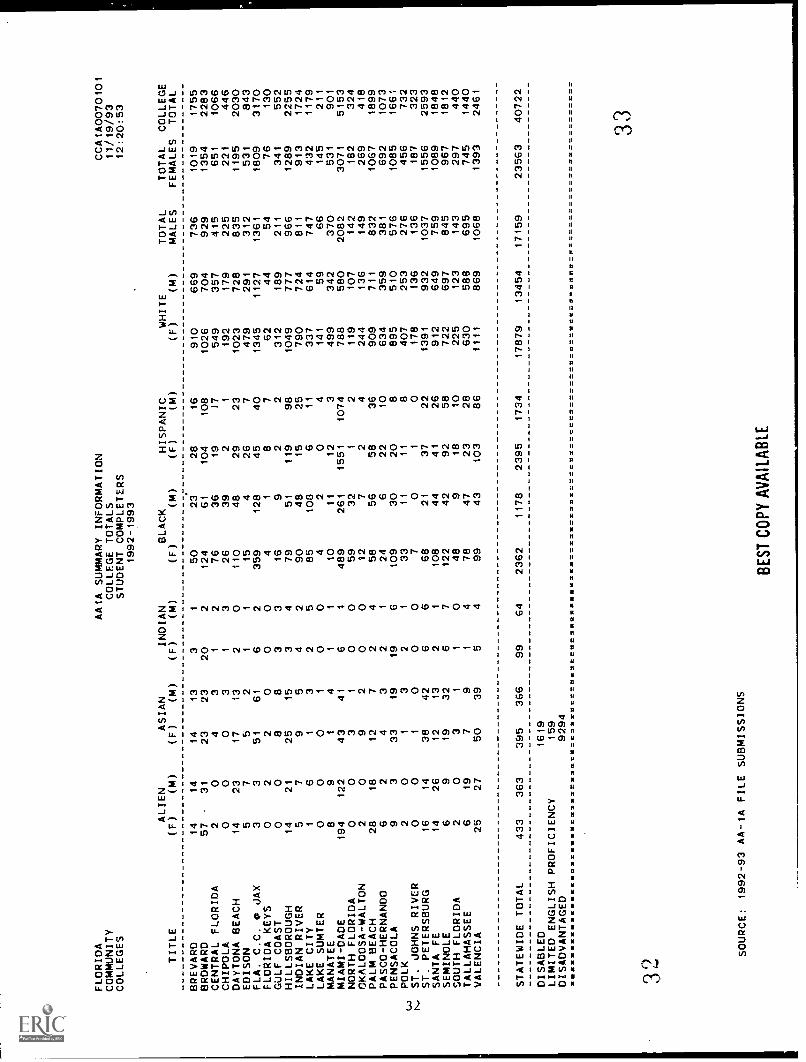
FLORIDA
COMMUNITY
COLLEGES
AAIA SUMMARY INFORMATION
COLLEGE TOTALS
STUDENT COMPLETERS
1992-1993
CCA1A0070101
11/19/93
12:20:53
TITLE
ALIEN
(F)
(M)
ASIAN
(F)
(M)
INDIAN
(F)
(M)
(F)BLACK(M)
HISPANIC
(F)
(M)
WHITE
(F)
(M)
TOTAL
MALES
TOTAL
COLLEGE
FEMALES
TOTAL
BREVARD
14
14
14
13
31
50
23
28
16
910
669
736
1019
1755
BROWARD
57
31
23
23
20
2124
61
104
108
1026
704
929
1354
2283
CENTRAL FLORIDA
20
43
12
76
36
19
17
549
357
415
651
1066
CHIPOLA
00
03
13
26
39
21
192
179
225
221
446
DAYTONA BEACH
14
23
17
13
20
110
48
29
23
1023
728
835
1195
2030
EDISON
57
52
11
15
426
7479
291
312
531
843
FLA. C.C. 0 JAX
33
51
61
62
359
128
45
40
1345
1127
1361
1809
3170
FLORIDA KEYS
02
20
00
41
87
62
44
54
76
130
GULF COAST
00
88
33
16
92
2312
189
211
341
552
HILLSBOROUGH
14
21
25
15
34
79
51
119
98
1049
777
966
1289
2255
INDIAN RIVER
57
95
42
90
48
15
25
790
724
811
913
1724
LAKE CITY
16
13
25
85
108
611
337
614
747
432
1179
LAKE SUMTER
00
01
00
42
04
141
59
66
145
211
MANATEE
89
14
11
10
11
12
3499
342
370
531
901
MIAMI-DADE
194
122
43
41
61
489
261
1551
1074
788
580
2082
3071
5153
NORTH FLORIDA
00
31
00
59
32
12
119
107
142
182
324
OKALOOSA-WALTON
20
92
00
12
72
4244
136
149
269
418
PALM BEACH
28
18
12
72
458
56
58
36
909
711
832
1067
1899
PASCO-HERNANDO
62
43
21
24
622
10
634
359
381
692
1073
PENSACOLA
93
33
19
19
6109
30
20
8895
510
576
1085
1661
(...)POLK
20
13
21
33
11
11
8407
253
276
456
732
N.
ST. JOHNS RIVER
00
10
00
70
10
178
136
136
187
323
ST. PETERSBURG
16
14
38
42
66
68
21
37
22
1391
932
1037
1556
2593
SANTA FE
14
26
12
13
21
108
44
41
26
912
649
759
1089
1848
SEMINOLE
69
19
32
67
122
42
92
58
722
697
845
967
1812
SOUTH FLORIDA
20
31
10
48
918
10
225
123
143
297
440
TALLAHASSEE
619
79
14
78
47
23
28
630
588
695
745
1440
VALENCIA
25
27
50
39
54
99
43
103
86
1111
869
1068
1393
2461
STATEWIDE TOTAL
433
363
395
366
99
64
2362
1178
2395
1734
17879
13454
17159
23563
40722
DISABLED
1619
LIMITED ENGLISH PROFICIENCY
159
DISADVANTAGED
9294
WWWWWWWWWWWWWWWW LIMUVMMX=1221M33 MMMMM 3M3M=21335121X73321333==if3333733331,3373333.3=====3333
3ry
SOURCE: 1992-93 AA-1A FILE SUBMISSIONS
BE
ST
CO
PY
AV
AIL
AB
LE
33
FLORIDA
COMMUNITY
COLLEGES
AAIA SUMMARY INFORMATION
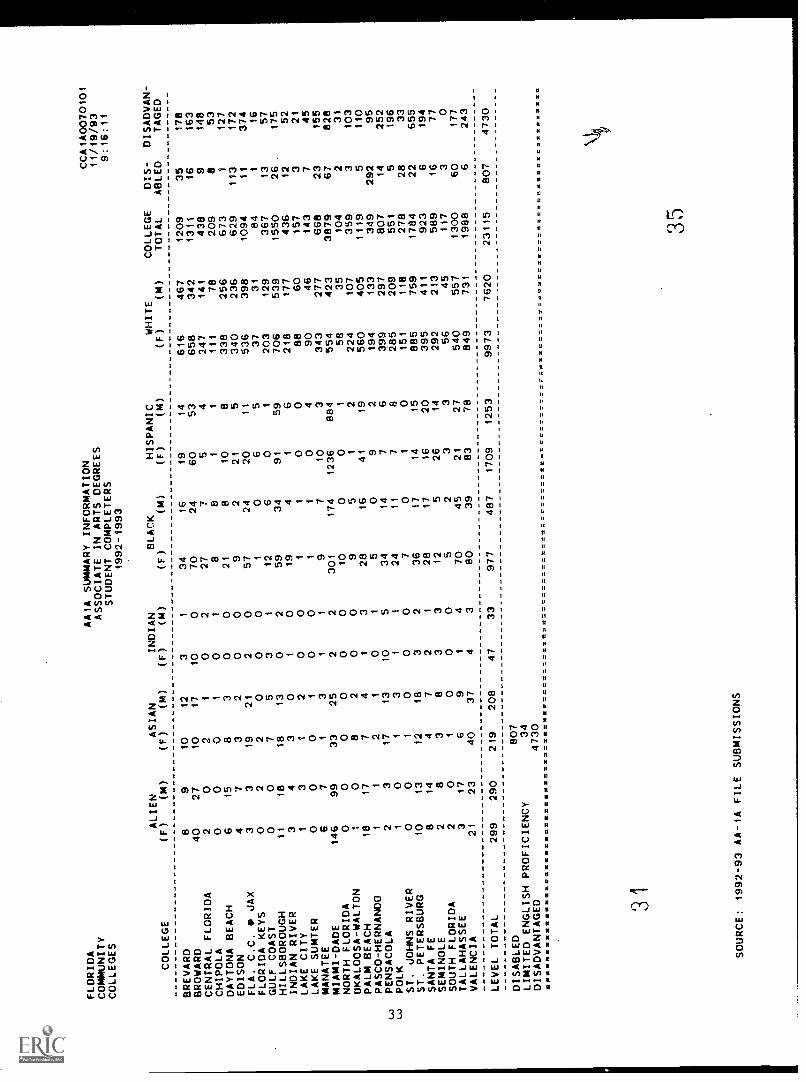
ASSOCIATE IN ARTS DEGREES
STUDENT COMPLETERS
1992-9993
CCA1A0070101
11/19/93
9:16:11
COLLEGE
ALIEN
(F)
(M)
ASIAN
(F)
(M)
INDIAN
(F)
(M)
(F)BLACK(M)
HISPANIC
(F)
(M)
WHITE
(F)
(M)
COLLEGE
TOTAL
DIS-
ABLED
DISADVAN-
TAGED
BREVARD
89
10
12
31
34
16
19
14
616
467
1209
35
178
BROWARD
40
27
10
17
10
070
24
60
53
658
342
1311
16
163
CENTRAL FLORIDA
20
21
02
27
75
4247
141
438
9148
CHIPOLA
00
01
01
88
11
111
78
209
853
DAYTONA BEACH
615
83
00
21
810
8338
256
673
1127
EDISON
47
32
00
92
21
5340
236
629
113
172
FLA. C.C.
JAX
33
19
21
20
57
24
20
11
536
398
1094
II
374
FLORIDA KEYS
02
20
00
1o
65
37
31
84
116
GULF COAST
00
75
31
12
60
1203
129
367
13
57
HILLSBOROUGH
11
18
18
13
02
59
34
91
59
706
539
1550
26
175
INDIAN RIVER
34
30
10
19
41
6218
177
436
12
52
LAKE CITY
13
12
00
11
00
88
60
157
321
LAKE SUMTER
00
01
00
11
04
90
46
143
745
MANATEE
67
13
11
97
10
3343
277
668
23
155
MIAMI-DADE
146
99
33
25
22
301
174
1236
884
554
423
3879
67
828
NORTH FLORIDA
00
00
00
10
00
158
35
104
231
OKALOOSA-WALTON
10
82
00
95
12
224
107
359
3103
PALM BEACH
18
17
74
13
28
16
41
19
560
405
1119
5110
PASCO-HERNAN00
11
21
01
50
92
194
133
349
292
95
i...)
PENSACOLA
23
17
13
10
534
14
76
399
297
807
14
252
Lk)
POLK
10
13
11
24
11
78
285
209
551
5196
ST. JOHNS RIVER
00
10
00
70
10
151
118
278
28
33
ST. PETERSBURG
10
13
12
18
32
36
17
14
15
885
759
1784
22
655
SANTA FE
814
47
2i
2817
16
20
395
411
923
6194
SEMINOLE
28
3a
33
12
526
14
292
213
589
16
77
SOUTH FLORIDA
20
10
00
52
33
56
45
117
30
TALLAHASSEE
317
69
14
70
45
21
27
540
557
1300
60
177
VALENCIA
21
23
40
37
43
80
39
83
78
849
731
1988
6243
LEVEL TOTAL
299
290
219
208
47
33
977
487
1709
1253
9973
7620
23115
807
4730
DISABLED
807
LIMITED ENGLISH PROFICIENCY
34
DISADVANTAGED
4730
31
-2S222212--22-2M-222
LS
22
2222222
222222222 ZZZZZZZZZ
35
SOURCE: 1992-93 AA-1A FILE SUBMISSIONS
FLORIDA
COMMUNITY
COLLEGES
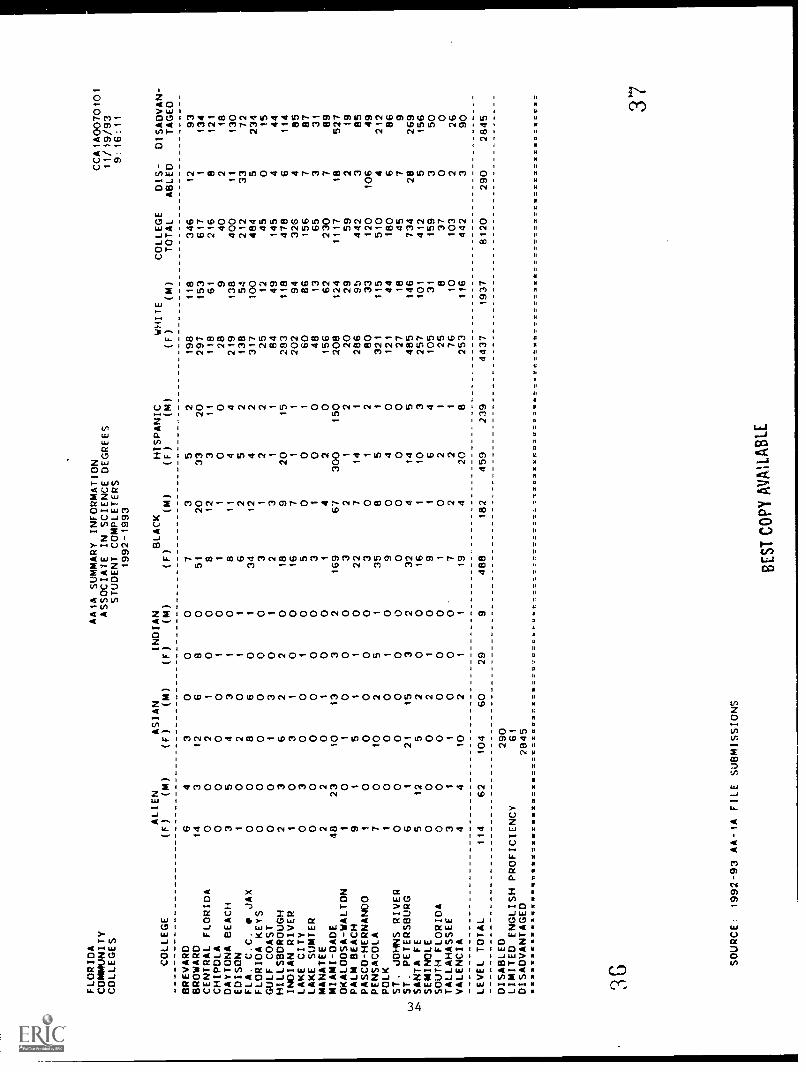
AA1A SUMMARY INFORMATION
ASSOCIATE IN SCIENCE DEGREES
STUDENT COMPLETERS
1992-1993
CCA140070101
11/19/93
9:16:11
COLLEGE
ALIEN
(F)
(M)
ASIAN
(F)
(M)
INDIAN
(F)
(M)
(F)BLACK(M)
HISPANIC
(F)
(M)
WHITE
(F)
(M)
COLLEGE
TOTAL
DIS-
ABLED
DISADVAN-
TAGED
BREVARD
64
30
00
73
52
198
118
346
12
93
BROWARD
14
312
68
051
20
33
20
297
153
617
1134
CENTRAL FLORIDA
00
21
00
812
311
118
61
216
8121
CHIPOLA
00
00
10
11
00
28
940
218
DAYTONA BEACH
35
43
i0
B11
44
219
138
400
11
130
EDISON
10
20
11
62
52
138
54
212
33
72
FLA. C.C.
4) JAX
00
86
01
34
12
42
317
100
484
5234
FLORIDA KEYS
00
00
00
31
22
25
12
45
015
GULF COAST
00
13
0i
23
11
84
49
145
444
HILLSBOROUGH
23
62
20
18
920
15
283
118
478
6114
INDIAN RIVER
10
31
00
16
71
1202
94
326
485
LAKE CITY
03
00
10
50
01
60
86
156
787
LAKE SUMTER
00
00
00
31
00
48
13
65
331
MANATEE
22
01
00
14
20
156
62
230
789
MIAMI-DADE
48
23
10
13
32
169
67
300
150
208
124
1117
18
527
OKALOOSA-WALTON
i0
10
00
32
12
20
29
59
219
PALM BEACH
91
51
10
22
714
1286
95
442
385
PASCO-HERNANDO
10
00
00
30
12
80
33
120
106
49
PENSACOLA
70
10
25
I35
85
1321
115
510
4212
POLK
10
00
10
90
40
121
44
180
686
ST. JOHNS RIVER
00
00
00
00
00
27
18
45
79
Lo ST. PETERSBURG
61
21
15
32
32
414
5485
146
734
28
269
.s.. SANTA FE
512
52
00
16
110
3257
101
412
5156
SEMINOLE
00
02
10
91
64
105
31
159
350
SOUTH FLORIDA
00
00
00
10
21
25
837
00
TALLAHASSEE
31
10
00
72
21
76
10
103
226
VALENCIA
44
10
21
119
420
8253
116
442
390
LEVEL TOTAL
114
62
104
60
29
9488
182
459
239
4437
1937
8120
290
2845
DISABLED
290
LIMITED ENGLISH
PROFICIENCY
61
DISADVANTAGED
2845
XX
XX
XX
XX
XX
XX
XX
XX
VU
UU
.MW
V11
.17.
12.2
M.=
==
=..0
,71,
X=
11(
36
SOURCE: 1992-93 AA-1A FILE SUBMISSIONS
BE
S1 C
OPY
AV
AIL
AB
LE
37
FLORIDA
COMMUNITY
COLLEGES
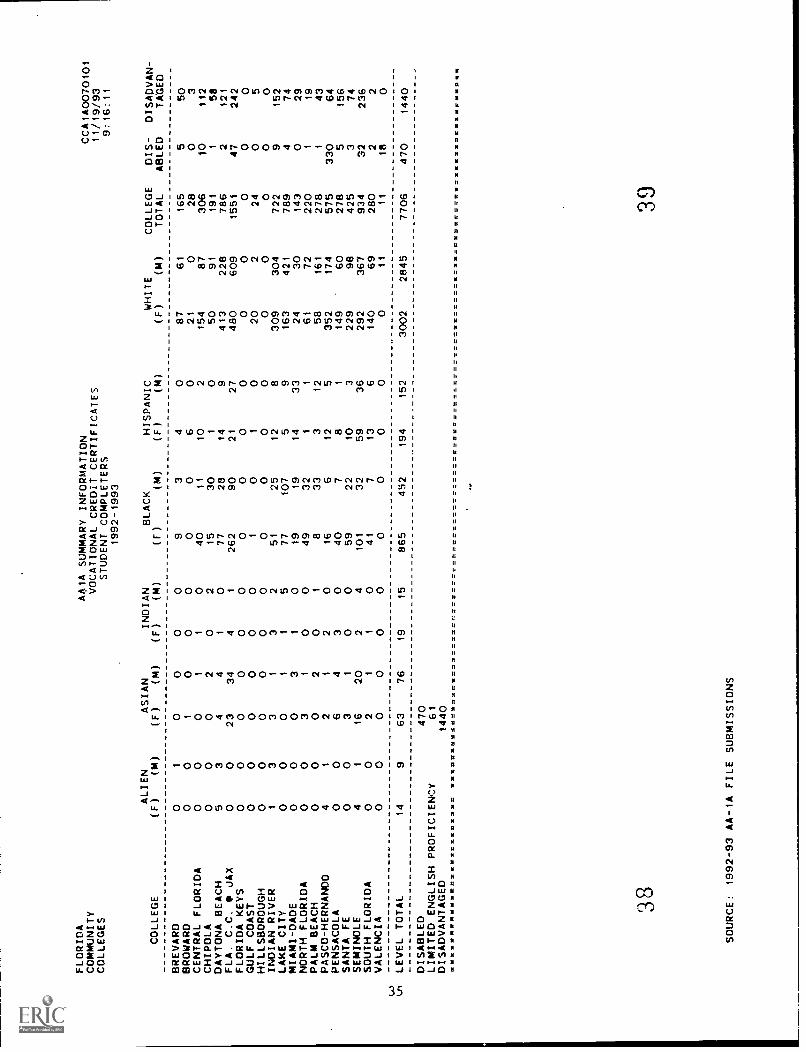
AA1A SUMMARY INFORMATION
VOCATIONAL CREDIT CERTIFICATES
STUDENT COMPLETERS
1992-1993
CCA1A0070101
11/19/93
9:16:11
COLLEGE
ALIEN
(F)
(M)
ASIAN
(F)
(M)
INDIAN
(F)
(M)
(F)
(M)
HISPANIC
(F)
(M)
WHITE
(F)
(M)
COLLEGE
TOTAL
DIS-
ABLED
DISADVAN-
TAGED
BREVARD
01
00
00
93
40
87
61
165
550
BROWARD
00
10
00
00
60
21
028
03
CENTRAL FLORIDA
00
01
10
40
11
10
2154
87
306
10
112
CHIPOLA
00
02
02
15
30
10
50
91
191
158
DAYTONA BEACH
53
44
10
77
28
14
9413
228
786
2121
FLA. C.C. P UAX
00
23
34
41
262
90
21
27
480
609
1551
47
242
FLORIDA KEYS
00
00
00
00
00
00
00
0GULF COAST
00
00
00
10
10
20
224
05
HILLSBOROUGH
00
00
00
00
00
00
00
0INDIAN RIVER
13
31
32
51
25
12
8309
304
722
9152
LAKE CITY
00
01
15
77
107
59
163
421
789
474
MIAMI-DADE
00
03
10
19
19
14
33
24
30
143
029
NORTH FLORIDA
00
31
00
49
32
1I
61
72
220
119
PALM BEACH
00
02
01
833
312
58
161
278
143
PASCO-HERNANDO
41
21
20
16
612
5352
174
575
330
64
PENSACOLA
00
64
30
40
78
1149
60
278
5156
SANTA FE
00
31
00
59
22
10
3229
98
425
374
SEMINOLE
4I
16
20
24
101
32
59
36
292
367
934
32
236
SOUTH FLORIDA
00
2i
I0
41
713
6140
69
280
22
VALENCIA
00
00
00
00
00
011
11
18
041
In
LEVEL TOTAL
14
963
76
19
15
865
452
194
152
3002
2845
7706
470
1440
DISABLED
470
LIMITED ENGLISH PROFICIENCY
61
DISADVANTAGED
1440
UUUUUUUUUUUU U
3839
SOURCE: 1992-93 AA-1,4 FILE SUBMISSIONS
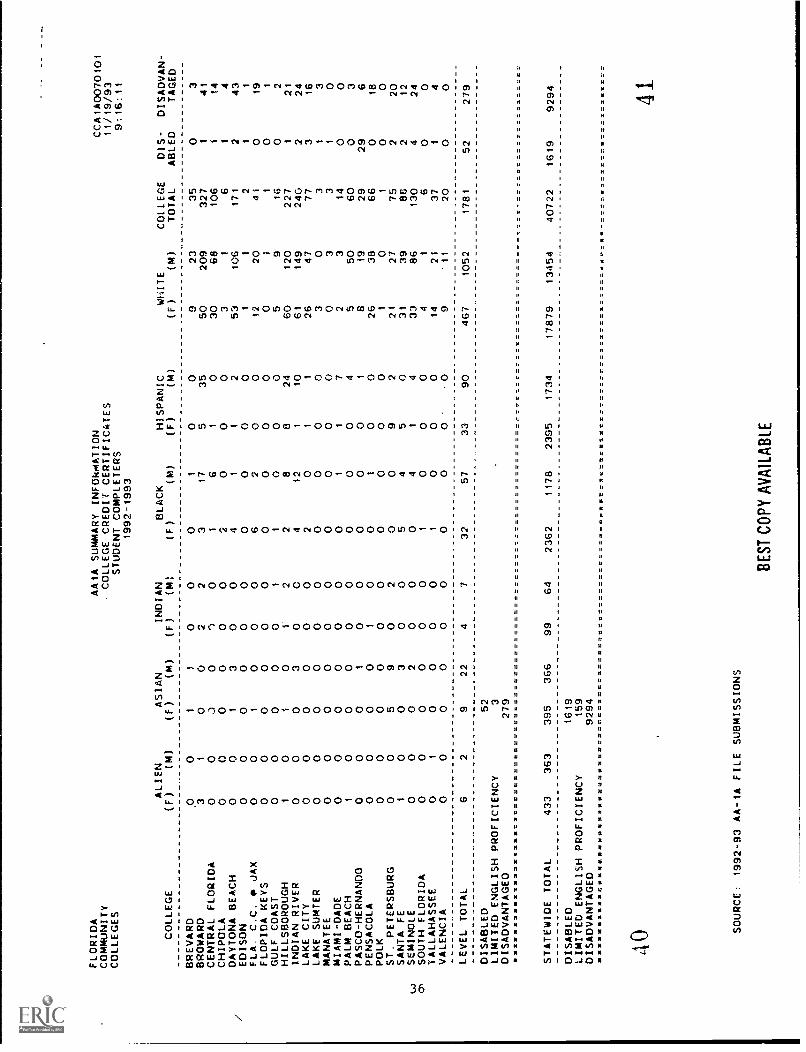
FLORIDA
COMMUNITY
COLLEGES
COLLEGE
ALIEN
(F)
(M)
ASIAN
(F)
(M)
(F)
AAIA SUMMARY INFOkMATION
COLLEGE CREDIT CERTIFICATES
STUDENT COMPLETERS
1992-1993
INDIAN
BLACK
HISPANIC
(M)
(F)
(M)
(F)
(M)
WHITE
(F)
(M)
COLLEGE
TOTAL
BREVARD
00
11
0o
01
00
923
35
BROWARO
31
00
22
317
535
50
209
327
CENTRAL FLORIDA
00
J0
00
16
10
30
68
106
CHIPOLA
00
00
00
20
00
31
6DAYTONA BEACH
00
13
00
41
12
53
106
171
EDISON
00
00
00
00
00
11
2FLA. C.C. 0 JAX
00
10
00
62
00
12
20
41
FLOPIDA KEYS
00
00
00
00
00
01
1
GULF COAST
00
00
01
10
00
59
16
HILLSBOROUGH
10
10
12
28
824
60
120
227
INDIAN RIVER
00
03
0C
412
110
61
149
240
LAKE CITY
00
00
00
20
11
26
47
77
LAKE SUMTER
00
00
00
00
00
30
3MANATEE
00
00
00
00
00
03
3MIAMI-DADE
00
00
00
01
17
23
14
PALM BEACH
10
00
00
00
04
550
60
PASCO-HERNANDO
00
01
00
00
01
819
29
PENSACOLA
00
00
10
01
00
26
38
66
POLK
00
00
00
00
00
10
1
ST. PETERSBURG
00
59
02
00
92
21
27
75
SANTA FE
10
03
00
54
50
31
39
88
0.)
SEMINOLE
00
02
00
04
14
33
86
130
oSOUTH FLORIDA
00
00
00
10
00
41
6TALLAHASSEE
01
00
00
10
00
14
21
37
VALENCIA
00
00
00
00
00
9'11
20
LEVEL TOTAL
62
922
47
32
57
33
90
467
1052
1781
DISABLED
52
LIMITED ENGLISH PROFICIENCY
3DISADVANTAGED
279
...
STATEWIDE TOTAL
433
363
395
366
99
64
2362
1178
2395
1734
17879
13454
40722
DISABLED
1619
LIMITED ENGLISH PROFICIENCY
159
DISADVANTAGED
9294
CCA1A0070101
11/19/93
9:16:11
DIS-
DISADVAN-
ABLED
TAGED
O3
141
114
14
243
11
O19
O1
O2
121
224
316
13
10
O0
O3
29
6O
18
O0
220
212
424
O0
14
a0
52
279
1619
9294
222
22 22
2e 21=22
z222 222
:_v1
22 22
x2222222
SOURCE: 1992-93 AA-1A FILE SUBMISSIONS
BE
ST C
OPY
AV
AIL
AB
LE
41
UNIV
UF
FSU
FAMU
USF
FAU
UWF
UCF
FIU
wart
SUS
UNIV
UF
FSU
FAMU
USF
FAU
UWF
UCF
FIU
UNF
SUS
GRANDTOTAL
Prepared by the BOR Research Staff, December 20, 1993 LA Disk: BACHRACE.XLS
STATE UNIVERSITY SYSTEMBACHELOR DEGREES GRANTED FOR 1992-93
MALE
WHITE BLACK HISP ASIAN AM IND OTHER TOTAL
2318 101 191 111 4 70 2795
2210 123 127 53 6 21 2540
73 318 24 11 0 8 434
1797 54 122 71 2 81 2127
664 48 46 36 1 46 841
392 9 4 4 2 8 419
1591 38 97 69 5 43 1843
548 97 713 59 0 127 1544
421 12 15 11 1 7 467
10014 800 1339 425 21 411 13010
FEMALE
WHITE BLACK HISP ASIAN AM IND OTHER TOTAL
2200 170 128 95 5 46 2644
2586 194 115 53 8 37 2993
53 551 11 3 0 4 622
2656 126 185 65 3 39 3074
976 60 80 24 2 46 1188
636 18 12 11 1 15 693
2015 87 141 68 3 25 2339
878 233 1059 59 2 123 2354
674 52 16 25 2 7 776
12674 1491 1747 403 26 342 16683
22688 2291 3086 828 47 753 29693
37
OBJECTIVE 2.0
TO PROVIDE ARTICULATED ACCELERATION MECHANISMS THAT ALLOW SECONDARY STUDENTS TO
PROCEED THROUGH THE EDUCATIONAL SYSTEM AS RAPIDLY AS THEIR CIRCUMSTANCES PERMIT.
ARTICULATION ACCOUNTABILITY MEASURE 2.1
The number and percent of secondary students participating in each of the followingarticulated acceleration programs:
o Advanced Placemento International Baccalaureate
The original Articulation Accountability Measure on Articulated Acceleration Programs askedfor data on Advanced Placement, International Baccalaureate, Dual Enrollment and Credit byExam. Data do not exist for Dual Enrollment and Credit by Exam, therefore, the measure hasbeen changed to reflect the data available.
The Student Acceleration in Florida Report was last generated in 1987. The report includedinformation on all articulated acceleration mechanisms. However, due to funding constraintsthe collection of the data and publication of the report have been discontinued. The Divisionof Community Colleges also has discontinued a report on acceleration mechanisms, effectivewith the 1989-90 year (last publication date). Therefore, there is no current data collection orreporting in place for accelerated mechanisms except for Advanced Placement, u hich iscompiled by the College Board and the International Baccalaureate program. The data are stillbeing collected and reports could be generated, provided resources were available. The numberand percent of secondary students participating in each of the two programs for which there aredata are included in the following tables.
39
4 3
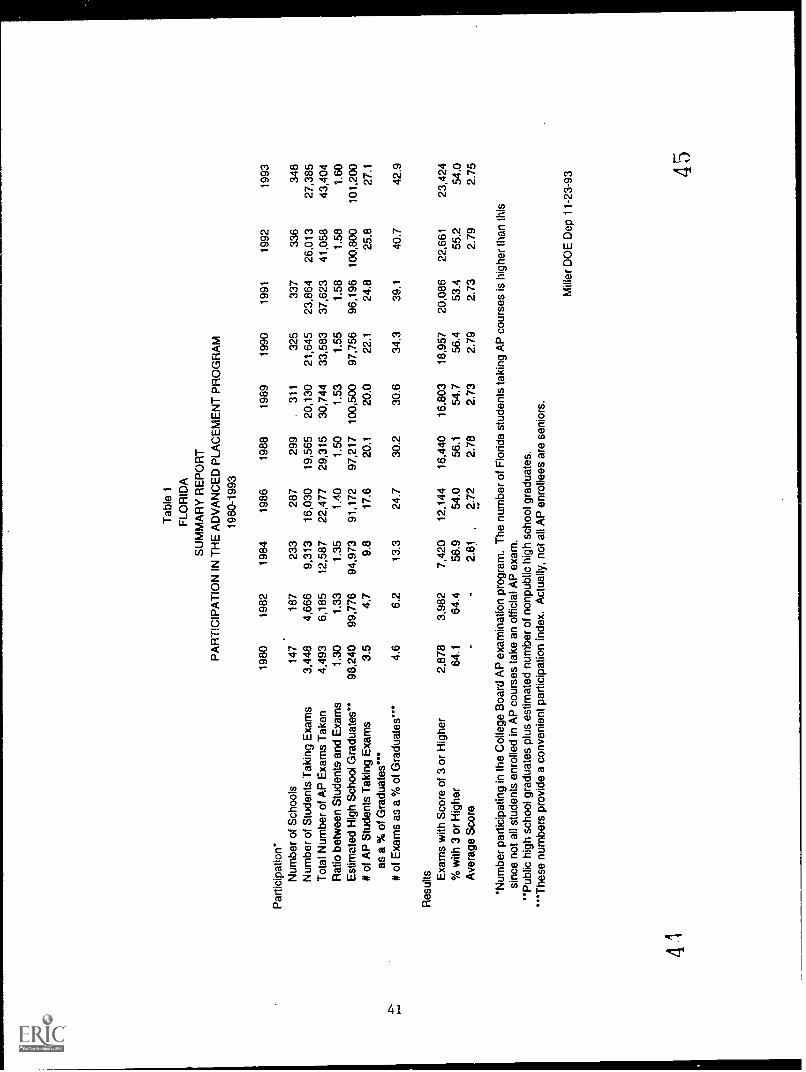
Tab
le 1
FLO
RID
A
SU
MM
AR
Y R
EP
OR
TP
AR
TIC
IPA
TIO
N IN
TH
E A
DV
AN
CE
D P
LAC
EM
EN
T P
RO
GR
AM
1980
-199
3
1980
1982
1984
1986
1988
1989
1990
1991
1992
1993
Par
ticip
atio
n*N
umbe
r of
Sch
ools
147
187
233
287
299
.31
132
533
733
634
8N
umbe
r of
Stu
dent
s T
akin
g E
xam
s3,
448
4,66
69,
313
16,0
3019
,565
20,1
3021
,645
23,8
6426
,013
27,3
85T
otal
Num
ber
of A
P E
xam
s T
aken
4,49
36,
185
12,5
8722
,477
29,3
1530
,744
33,5
8337
,623
41,0
5843
,404
Rat
io b
etw
een
Stu
dent
s, a
nd E
xam
s1.
301.
331.
351.
401.
501.
531.
551.
581.
581.
60E
stim
ated
Hig
h S
choo
l Gra
duat
es"
98,2
4099
,776
94,9
7391
,172
97,2
1710
0,50
097
,756
96,1
9610
0,80
010
1,20
0#
of A
P S
tude
nts
Tak
ing
Exa
ms
as a
% o
f Gra
duat
es""
3.5
4.7
9.8
17.6
20.1
20.0
22.1
24.8
25.8
27.1
# of
Exa
ms
as a
% o
f Gra
duat
es"'
4.6
6.2
13.3
24.7
30.2
30.6
34.3
39.1
40.7
42.9
Res
ults E
xam
s w
ith S
core
of 3
or
Hig
her
2.87
83,
982
7,42
012
,144
16,4
4016
,803
18,9
5720
,086
22,6
6123
,424
% w
ith 3
or
Hig
her
64.1
64.4
58.9
54.0
56.1
54.7
56.4
53.4
55.2
54.0
Ave
rage
Sco
re2.
812.
722.
782.
732.
792.
732.
792.
75
'Num
ber
part
icip
atin
g in
the
Col
lege
Boa
rd A
P e
xam
inat
ion
prog
ram
. The
num
ber
of F
lorid
a st
uden
ts ta
king
AP
cou
rses
is h
ighe
r th
an th
issi
nce
not a
ll st
uden
ts e
nrol
led
in A
P c
ours
es ta
ke a
n of
ficia
l AP
exa
m.
"Pub
lic h
igh
scho
ol g
radu
ates
plu
s es
timat
ed n
umbe
r of
non
publ
ic h
igh
scho
ol g
radu
ates
.-T
hese
num
bers
pro
vide
a c
onve
nien
t par
ticip
atio
n in
dex.
Act
ually
, not
all
AP
enr
olle
es a
re s
enio
rs.
Mill
er D
OE
Dee
11-
23-9
3 45
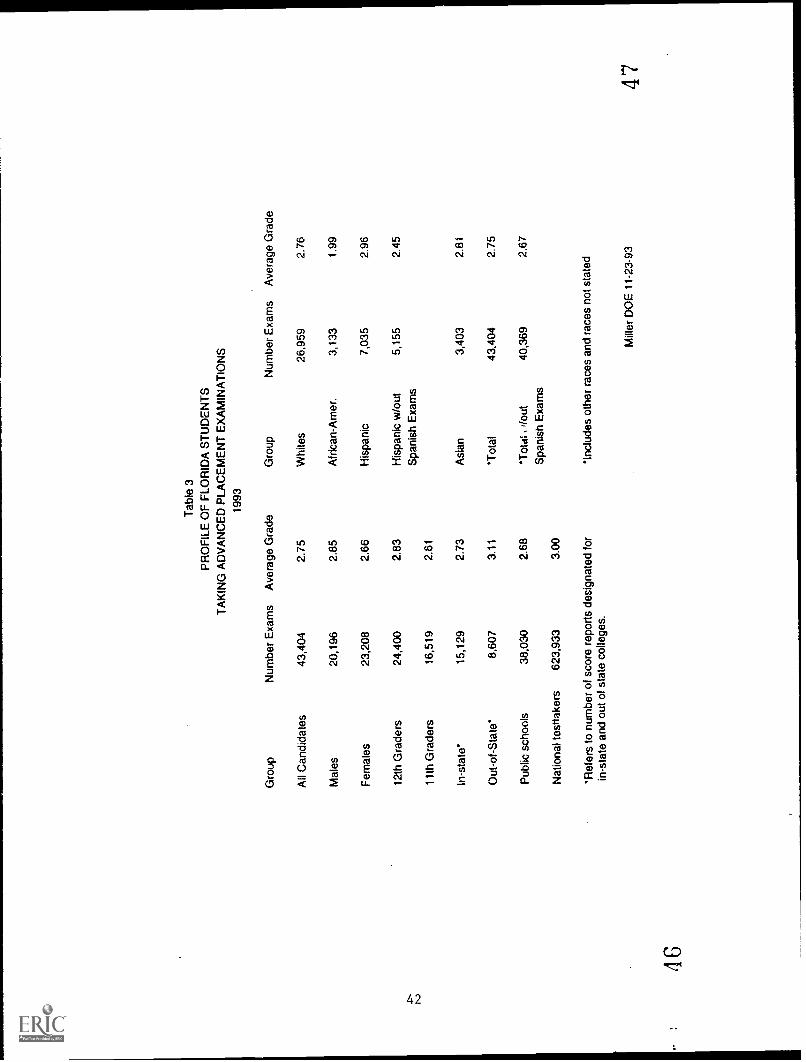
Gro
up
Tab
le 3
PR
OF
ILE
OF
FLO
RID
A S
TU
DE
NT
S
TA
KIN
G A
DV
AN
CE
D P
LAC
EM
EN
T E
XA
MIN
AT
ION
S19
93
Num
ber
Exa
ms
Ave
rage
Gra
deG
roup
Num
ber
Exa
ms
Ave
rage
Gra
de
All
Can
dida
tes
43,4
042.
75W
hite
s26
,959
2.76
Mal
es20
,196
2.85
Afr
ican
-Am
er.
3,13
31.
99
Fem
ales
23,2
082.
66H
ispa
nic
7,03
52.
96
12th
Gra
ders
24,4
002.
83H
ispa
nic
w/o
ut5,
155
2.45
.p--
NJ
Spa
nish
Exa
ms
11th
Gra
ders
16,5
192.
61
In-
stat
e'15
,129
2.73
Asi
an3,
403
2.81
Out
-of-
Sta
te'
8,60
73.
11*T
otal
43,4
042.
75
Pub
lic s
choo
ls38
,030
2.68
*Tot
al s
flou
t40
,369
2.67
Spa
nish
Exa
ms
Nat
iona
l tes
rtak
ers
623,
933
3.00
*Ref
ers
to n
umbe
r of
sco
re r
epor
ts d
esig
nate
d fo
r'In
clud
es o
ther
rac
es a
nd r
aces
not
sta
ted
in-s
tate
and
out
of s
tate
col
lege
s.
Mill
er D
OE
11-
23-9
3
46
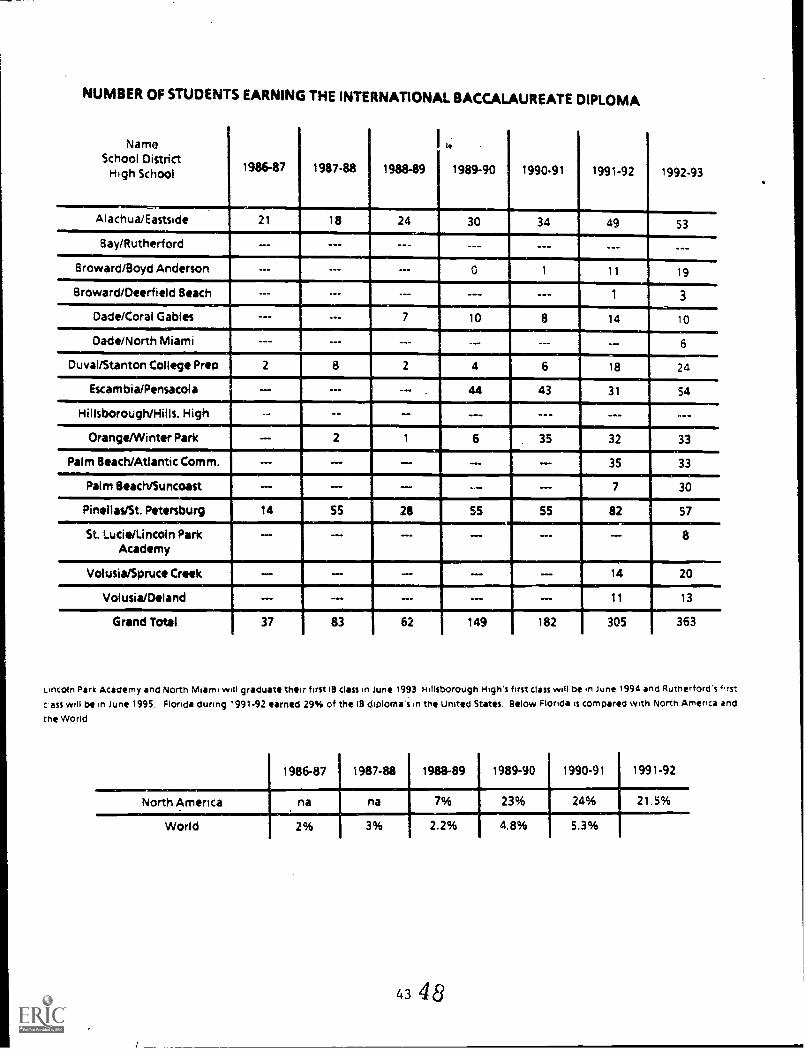
NUMBER OF STUDENTS EARNING THE INTERNATIONAL BACCALAUREATE DIPLOMA
NameSchool District
High School 1986-87 1987-88
I
1988-89
14
1989-90 1990-91 1991-92 1992-93
Alachua/Eastside 21 18 24 30 34 49 53
Bay/Rutherford ---,
--- --- --- _ --- _Broward/Boyd Anderson --- --- --- 0 1 11
.19
Broward/Deerfield Beach --- --- --- --- 1 3
Dade/Coral Gables --- 7 10 8 14 10
Dade/North Miami --- --- --- -- --- --- 6
Duval/Stanton College Prep 2 8 2..
4 6...
18 24
Escambia/Pensacola -- -- . 44 43 31 54
Hillsborough/Hills. High -- -- --- --- - --
Orange/Winter Park -- 2 1 6 35 32 33
Palm Beach/Atlantic Comm. 35 33
Palm Beach/Suncoast -- -- 7 30
Pinellas/St. Petersburg 14 55 28 SS 55 82 57
St. Lucie/Lincoln ParkAcademy
-- -- 8
Volusia/Spruce Creek . 14 20
Volusia/Deland _ _ - -- 11 13
Grand Total 37 83 62 149 182 305 363
Lincoln Park Academy and North Miami will graduate their firstie class in June 1993. Hillsborough High's first class will be in June 1994 and Rutherford's first
can will be in June 1995. Florida during '991-92 earned 29% of the IS diploma's in the United States. Below Florida is compared with North America and
the World
1986-87 1987-88 1988-89 1989-90 1990-91 1991.92
North America na na 7% 23% 24% 21.5%
World 2% 3% 2.2% 4.8% 5.3%
4348
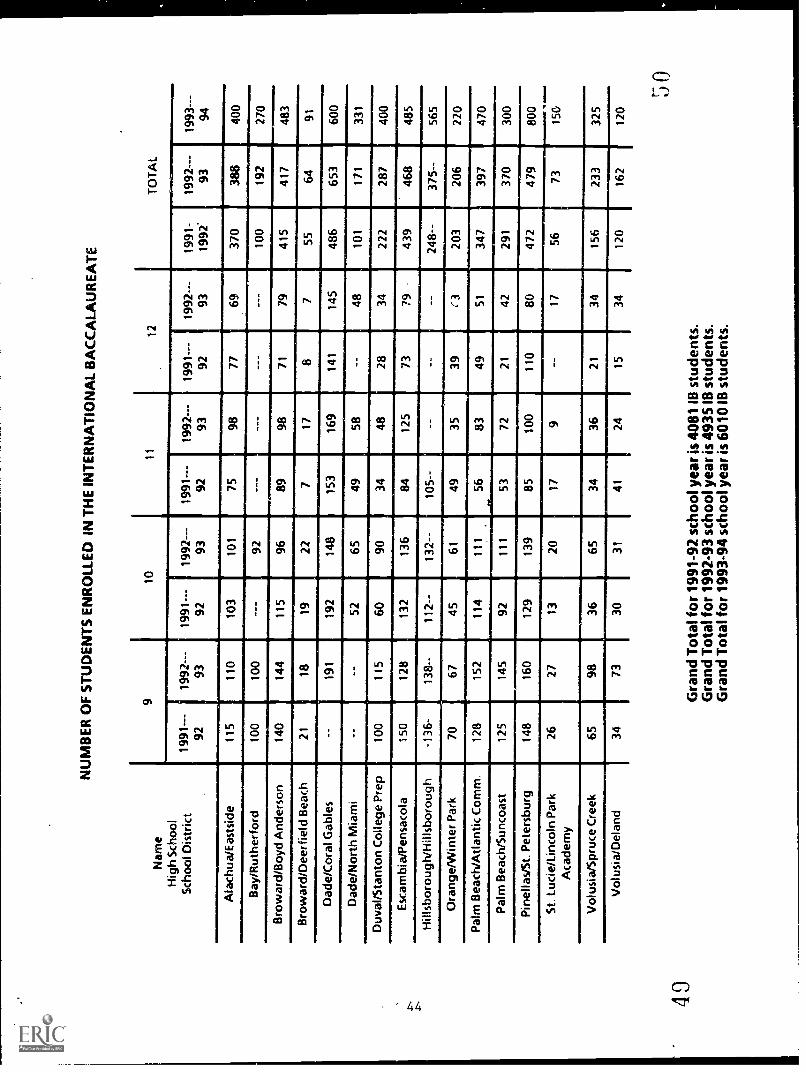
NU
MB
ER
OF
ST
UD
EN
TS
EN
RO
LLE
D IN
TH
E IN
TE
RN
AT
ION
AL
BA
CC
ALA
UR
EA
TE
Nam
e9
1011
12T
OT
AL
Hig
h S
choo
lS
choo
l Dis
tric
t19
91--
-92
1992
---
9319
91--
-92
1992
---
9319
9192
1992
9319
91--
-92
1992
9319
91-
1992
'19
92--
-93
1993
- -
-
94
Ala
chua
/Eas
tsid
e11
511
010
310
175
9877
6937
038
840
0
Bay
/Rut
herf
ord
100
100
---
92--
---
---
---
-10
019
227
0
Bro
war
d/B
oyd
And
erso
n14
014
411
596
8998
7179
415
417
483
Bro
war
d/D
eerf
ield
Bea
ch21
1819
227
178
755
6491
Dad
e/C
oral
Gab
les
--19
119
214
815
316
914
114
548
665
360
0
Dad
e/N
orth
Mia
mi
----
5265
4958
--48
101
171
331
Duv
al/S
tant
on C
olle
ge P
rep
100
115
6090
3448
2834
222
287
400
Esc
ambi
a/P
ensa
cola
150
128
132
136
8412
573
7943
946
848
5
Hill
sbor
ough
/Hill
sbor
ough
-136
-13
8--
112-
-13
2--
105-
---
----
248-
-37
5--
565
Ora
nge/
Win
ter
Par
k70
6745
6149
359
39(3
203
'
206
220
Pal
m B
each
/Atla
ntic
Com
m12
815
211
411
156
8349
5134
739
747
0
Pal
m B
each
/Sun
coas
t12
514
592
111
5372
2142
291
370
300
Pin
ella
s/S
t. P
eter
sbur
g14
816
012
913
985
100
110
8047
247
980
0
St.
Luci
e/Li
ncol
n P
ark
Aca
dem
y26
2713
2017
9--
1756
7315
0
Vol
usia
/Spr
uce
Cre
ek65
9836
6534
3621
3415
623
332
5
Vol
usia
/Del
and
3473
3031
4124
1534
120
162
120
)0G
rand
Tot
al fo
r 19
91-9
2 sc
hool
year
is 4
081
IB s
tude
nts.
Gra
nd T
otal
for
1992
-93
scho
olye
ar is
493
5 IB
stu
dent
s.G
rand
Tot
al fo
r 19
93-9
4 sc
hool
yea
r is
601
0 IB
stu
dent
s.
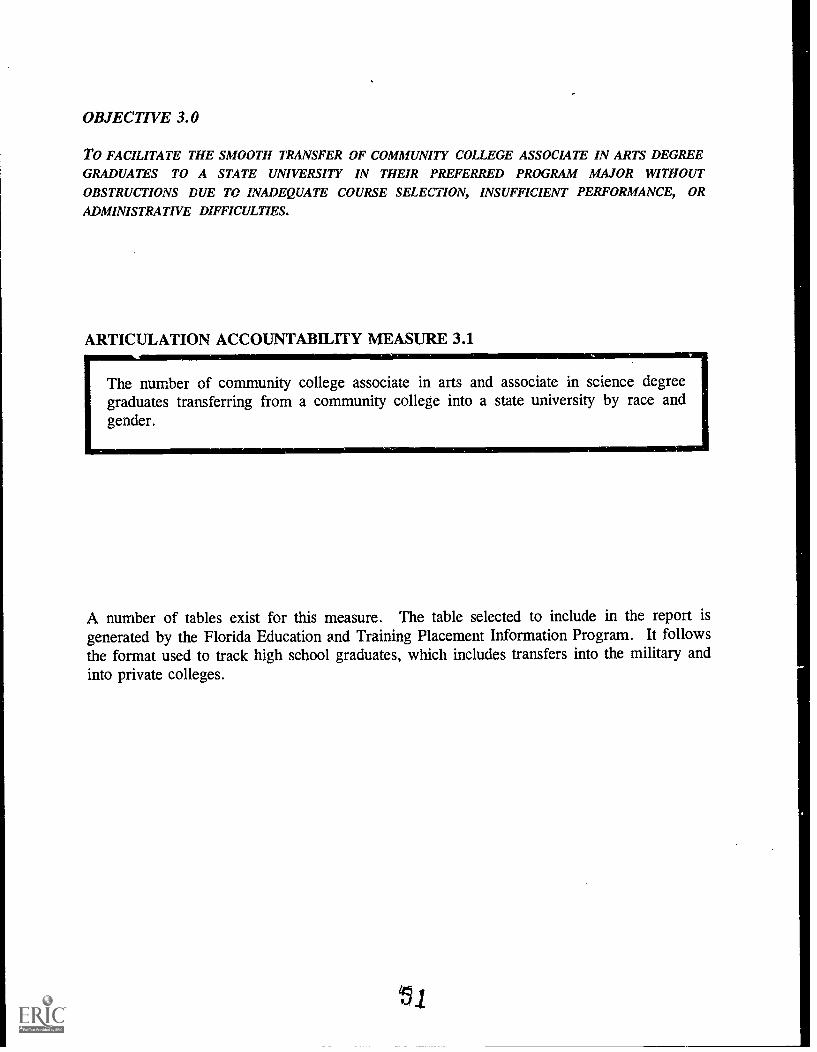
OBJECTIVE 3.0
To FACILITATE THE SMOOTH TRANSFER OF COMMUNITY COLLEGE ASSOCIATE IN ARTS DEGREEGRADUATES TO A STATE UNIVERSITY IN THEIR PREFERRED PROGRAM MAJOR WITHOUTOBSTRUCTIONS DUE TO INADEQUATE COURSE SELECTION, INSUFFICIENT PERFORMANCE, ORADMINISTRATIVE DIFFICULTIES.
ARTICULATION ACCOUNTABILITY MEASURE 3.1
The number of community college associate in arts and associate in science degreegraduates transferring from a community college into a state university by race andgender.
A number of tables exist for this measure. The table selected to include in the report isgenerated by the Florida Education and Training Placement Information Program. It followsthe format used to track high school graduates, which includes transfers into the military andinto private colleges.
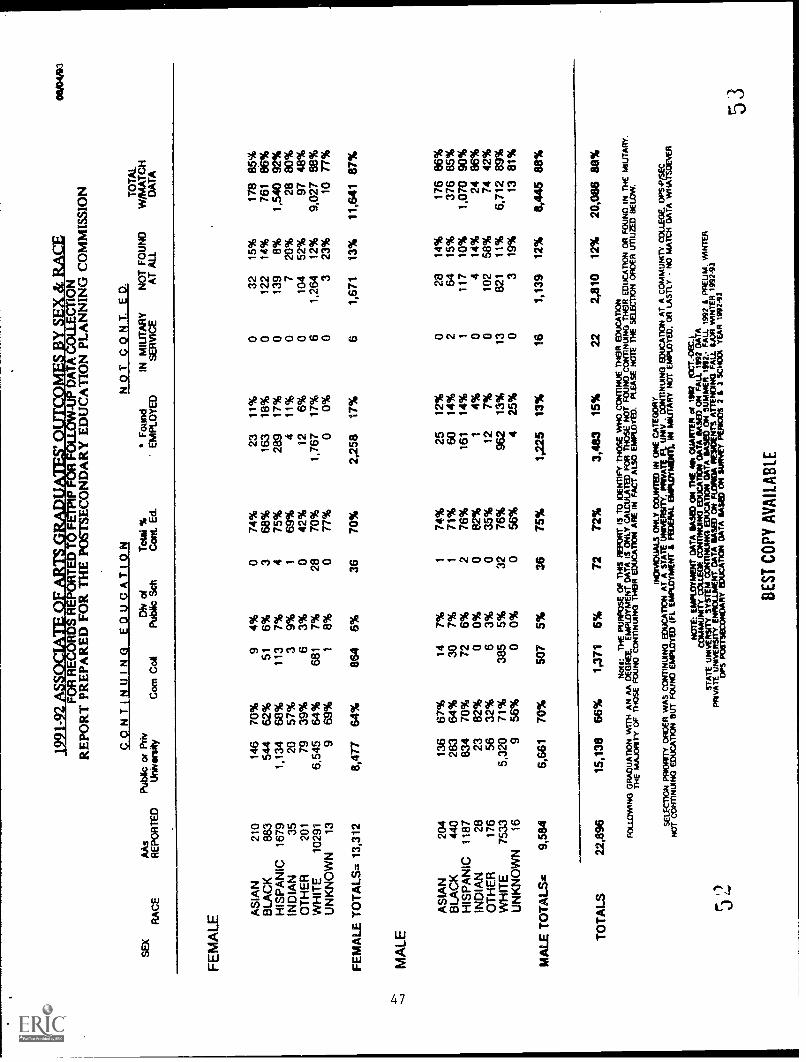
s.a!
1.1
OA
IA:;:
it:O
.ke
uF
OR
RE
ITS
R 1
RE
'1
P -
7--U
P D
AT
AM
ON
RE
PO
RT
PR
EP
AR
ED
FO
R T
HE
PO
ST
SE
CO
ND
AR
Y E
DU
CA
TIO
N P
LAN
NIN
G C
OM
MIS
SIO
N
CO
NT
INU
ING
ED
UC
AT
ION
NO
T C
ON
T. E
D.
TO
TA
LS
EX
Ms
Pub
lic o
r P
rivD
iv o
fT
otal
%F
ound
IN M
ILIT
AR
YN
OT
FO
UN
DW
IMA
TC
HR
AC
ER
EP
OR
TE
DU
nive
rsity
Com
Co*
Pub
lic S
chC
opt E
d' E
MP
LOY
ED
SE
RV
ICE
AT
ALL
DA
TA
FE
MA
LE
AS
IAN
210
146
70%
94%
074
%23
11%
032
15%
178
85%
BLA
CK
883
544
62%
516%
368
%16
318
%0
122
14%
761
86%
HIS
PA
NIC
1679
1,13
468
%11
37%
475
%28
917
%0
139
8%1,
540
92%
IND
IAN
3520
57%
39%
169
%4
11%
07
20%
2880
%O
TH
ER
201
7939
%6
3%0
42%
126%
010
452
%97
48%
WH
ITE
1029
16,
545
64%
681
7%28
70%
1,76
717
%6
1,26
412
%9,
027
88%
UN
KN
OW
N13
969
%1
8%0
77%
00%
03
23%
1077
%
FE
MA
LE T
OT
ALS
= 1
3,31
28,
477
64%
864
6%36
70%
2,25
817
%6
1,67
113
%11
,641
87%
MA
LE
AS
IAN
204
136
67%
147%
174
%25
12%
028
14%
176
86%
BLA
CK
440
283
64%
307%
171
%60
14%
264
15%
376
85%
HIS
PA
NIC
1187
834
70%
726%
276
%16
114
%1
117
10%
1,07
090
%
IND
IAN
2823
82%
00%
082
%1
4%0
414
%24
86%
OT
HE
R17
656
32%
63%
035
%12
7%0
102
58%
7442
%
WH
ITE
7533
5,32
071
%38
55%
3276
%96
213
%13
821
11%
6,71
289
%
UN
KN
OW
N16
956
%0
0%0
56%
425
%0
319
%13
81%
MA
LE T
OT
ALS
,:9,
584
6,66
170
%50
75%
3675
%1,
225
13%
161,
139
12%
8,44
588
%
TO
TA
LS22
,896
15,1
3866
%1,
371
6%72
72%
3,48
315
%22
2,81
012
%20
,086
88%
J'-
Nom
TH
E P
UR
PO
SE
OF
TH
IS R
EP
OR
T IS
TO
IDE
NT
IFY
TH
OS
E W
HO
CO
NT
INU
E T
HE
IR E
DU
CA
TIO
NF
OtiO
wIN
G G
RA
DU
AT
ION
WIT
H A
N A
A D
EG
RE
E E
MP
LOY
ME
NT
DA
TA
IS O
NLY
CA
LCU
LAT
ED
FO
R T
HO
SE
NO
T F
OU
ND
CO
NT
INU
ING
TH
EIR
ED
UC
AT
ION
OR
FO
UN
D IN
TH
E M
ILIT
AR
Y.
TH
E m
Axm
cry
OF
TH
OS
E F
OU
ND
CO
NT
INU
ING
TH
EIR
ED
UC
AT
ION
AR
E IN
FA
CT
ALS
O E
MP
LOY
ED
. PLE
AS
E N
OT
E T
HE
SE
LEC
TIO
NO
RD
ER
VO
WE
D B
ELO
W.
IND
IVID
UA
LS O
NLY
CO
UN
TE
ID IN
ON
E C
AT
EG
OR
YS
ELE
CT
ION
PR
IOR
ITY
OR
DE
R W
AS
CO
NT
INU
ING
ED
UC
AT
ION
AT
A S
TA
TE
UN
NE
RS
ITY
, 1/9
91/A
FL
UN
w .
CO
NT
INU
ING
ED
UC
AT
ION
AT
A C
OM
MU
NIT
Y 0
3tLE
GE
OP
S -
PN
OT
CO
NT
INU
ING
ED
UC
AT
ION
BU
T F
OU
ND
EM
PLO
YE
D (
FL
EM
PLO
YM
EN
TF
WE
AA
LIN
MIL
ITA
RY
NO
T E
MP
LOY
ED
. on
LAS
TLY
NO
MA
TC
H D
AT
A w
HA
MB
ER
NO
TE
: EM
PLO
YM
EN
T D
AT
A R
AS
ED
ON
TH
E 4
0 Q
UA
RT
ER
of 1
992
(OC
T.-
OE
C.L
CO
MM
UN
ITY
CO
LLE
GE
CO
NT
INU
UM
ED
UC
AT
ION
DA
TA
EA
SE
D O
N F
ALL
199
2 D
AT
AS
TA
TE
way
ER
SIT
y S
YS
TE
M C
ON
TIN
UIN
G E
DU
CA
TIO
N D
AT
A E
AS
ED
ON
SU
MM
ER
191
2: F
ALL
199
2 1
PR
ELI
M. W
INT
ER
pRw
AT
E U
NIV
ER
SIT
Y E
NR
OLL
ME
NT
DA
TA
EA
SE
D O
N M
AM
A R
ES
IDE
NT
S A
TT
EN
DIN
G F
ALL
Von
WIN
TE
R 1
992-
93oP
s P
OS
TS
EC
ON
DA
RY
ED
UC
AT
ION
DA
TA
SA
M O
N S
UR
VE
Y P
F.1
1100
S 2
t 3
SC
HO
OL
YE
AR
199
243
BE
ST C
OPY
AV
AIL
AB
LE
z
Ago
Mt16611tilifgligiglititt
plueminagrquingliRp
ggeggAgggAgt44M4gegXgge4g
tEPISSF-PFSt.13EIVrfiRSUMMVASSI
w-000 CO 0 CON.-NON0001.50...
eghegegggegge4WWW2We
EPESMSEIMRIAGtign2pUERS
,f-WIAggP.PASAggSflilt$APAg$
...CMCNO00400000,.0.....0001CON
gAit4t4g4ggAgfeet4CMCW44
8gt4SVMSVITV41°,2VXRIMer-in
61556106616111f11661M6161
XVSX.I.V.2.1qW3VVIWW't;
ViiMMEEsvgisgfiRREURM4
z
0g
1 p gixifei§ 0141011dadathgthgLigiLd
48
O
1:-)
Lo
I991
-92
CO
MM
UN
ITY
CO
LLE
GE
A.S
. GR
AD
UA
TE
S' O
UT
CO
ME
S B
Y S
EX
Sc.
RA
CE
11/2
1919
3
ONLY REPRESENTATIVE OF RECORDS REPORTED TO FETPIP FOR FOLLOW-UP DATA COLLECTION
PO
NT
INU
INO
ED
UC
AT
ION
NO
T C
ON
T, E
D.
TO
TA
LT
OT
AL
SE
XA
.S.'s
Pub
licP
rivD
iv o
4T
otal
ALL
Tot
al %
Fou
ndIN
MIL
ITA
RY
NO
T F
OU
ND
W/M
AT
CH
RA
CE
RE
PO
RT
ED
Uni
vers
ityC
am C
olP
ubic
Sch
Con
t. E
d.C
ont.
Ed,
EM
PLO
YE
DS
ER
VIC
EA
T A
LLD
AT
A
FE
MA
LE AS
IAN
814
05%
22%
06
7%58
69%
019
23%
8277
%
BLA
CK
447
151
4%69
15%
386
20%
287
64%
072
16%
375
84%
HIS
PA
NIC
401
4310
13%
6917
%4
126
31%
215
54%
061
15%
340
35%
IND
IAN
251
04%
26%
03
12%
1768
%0
520
%20
80%
OT
HE
R10
16
06%
86%
012
12%
1616
%0
7372
%26
2es
WH
ITE
3985
120
133%
558
14%
780
618
%2,
549
64%
173
718
%3,
248
82%
FE
MA
LE T
OT
ALS
&0,
040
1119
234%
7041
14%
1403
211
1%3,
140
V%
114
719
%4,
073
01%
MA
LE
AS
IAN
455
011
%7
16%
012
27%
2453
%0
920
%36
anB
LAC
K14
821
115
%30
20%
153
MS
6443
%0
3121
%11
779
%
HIS
PA
NIC
222
171
8%50
23%
472
32%
110
50%
040
18%
182
62%
IND
IAN
140
00%
214
%0
214
%10
71%
02
14%
12O
VA
OT
HE
R44
10
2%4
9%0
511
%I
18%
031
70%
1330
%
WH
ITE
1608
116
37%
308
18%
2545
227
%91
;153
%2
331
20%
1,35
580
%
MA
LE T
OT
ALS
.2,
1941
1110
00%
401
111%
36se
s-al
s%1,
117
US
244
421
%1,
716
70%
NR
A.N
ON
-RE
SID
EN
TA
LIE
N
TO
TA
LS7,
190
349
200%
1,10
716
%44
1131
121
%4,
207
MI%
31,
411
20%
11,1
0411
0%
Nol
a: T
HE
PU
RP
OS
E O
F T
HIS
RE
PO
RT
IS T
O ID
EN
TIF
Y T
HO
SE
WH
O C
ON
TIN
UE
TH
EM
MA
/CA
TIO
NF
OLL
OW
ING
GR
AD
UA
TIO
N W
ITH
AN
AS
DE
GR
EE
. EM
PLO
YM
EN
T D
AT
A IS
ON
LY C
ALC
ULA
TE
DF
OR
TH
OS
E N
OT
PO
UN
D C
ON
TIN
UIN
G T
HE
M E
DU
CA
TIO
N O
R F
OU
ND
M T
HE
MIL
ITA
RY
.71
1E M
AJO
RIT
Y O
F T
HO
SE
FO
UN
D C
ON
TIN
UIN
G IT
EM
ED
UC
AT
ION
AR
E IN
MT
ALS
O E
MP
LOY
ED
.P
LEA
SE
NO
TE
TH
E S
ELE
CT
ION
OR
DE
R U
TIL
IZE
D M
OW
.
IND
IVID
UA
LS O
NLY
CO
UN
TE
D IN
ON
E C
AT
EG
OR
YS
ELE
CT
ION
PR
IOR
ITY
OR
DE
R W
AS
CO
NT
INU
ING
ED
UC
AT
ION
AT
A S
TA
TE
UN
IVE
RS
ITY
, PR
IVA
TE
FL
UN
IV ,
CO
NT
INU
ING
ED
UC
AT
ION
AT
A C
OM
MU
NIT
Y C
OLL
EG
E, D
PS
-P
/SE
C
NO
T C
ON
TIN
UIN
G E
DU
CA
TIO
N B
UT
FO
UN
D E
MP
LOY
ED
(F
L E
MP
LOY
ME
NT
AF
ED
ER
AL
EM
PLO
YM
EN
T),
IN M
ILIT
AR
Y N
OT
EM
PLO
YE
D, O
R L
AS
TLY
- N
O M
AT
CH
DA
TA
WH
AT
SO
EV
ER
NO
TE
: EM
PLO
YM
EN
T D
AT
A B
ASE
D O
N T
HE
4th
QU
AR
TE
R o
f 19
92 (
OC
T.-
DE
C.'
CO
MM
UN
ITY
CO
LL
EG
E C
ON
TIN
UIN
G E
DU
CA
TIO
N D
AT
A B
ASE
D O
N F
AL
L 1
992
DA
TA
STA
TE
UN
IVE
RSI
TY
SY
STE
M C
ON
TIN
UIN
G E
DU
CA
TIO
N D
AT
A B
ASE
D O
N S
umm
er 1
992
SPR
ING
199
3 T
ER
Ms
PRIV
AT
E U
NIV
ER
SIT
Y E
NR
OL
LM
EN
T D
AT
A B
ASE
D O
N F
LO
RID
A R
ESI
DE
NT
S A
TT
EN
DIN
G F
AL
L C
OR
WIN
TE
R 1
992
93D
PS P
OST
SEC
ON
DA
RY
ED
UC
AT
ION
DA
TA
BA
SED
ON
SU
RV
EY
PE
RIO
DS
2 l 3
SC
HO
OL
YE
AR
199
2-93
J6
FETPIP
1991-92 LISTING OF REPORTED A.S. DEGREE COMPLETERSREPORTED FOR FOLLOW-UP
BREVARD 258BROWARD 423CENTRAL FLORIDA 189CHIPOLA 30DAYTONA 397EDISON 202FCCJ 478FLORIDA KEYS 46GULF COAST 111HILLSBOROUGH 440INDIAN RIVER 242LAKE CITY 120LAKE-SUMTER 65MANATEE 256MIAMI-DADE 1001OKALOOSA-WALTON 67PALM BEACH 374PASCO-HERNANDO 148PENSACOLA 509POLK 160SANTE FE 391SEMINOLE 158SOUTH FLORIDA 44ST. JOHN'S 47ST. PETERSBURG 692TALLAHASSEE 81VALENCIA 270
TOTAL 7,199
SE
X
"a"
'Ik
eu
*Au'
ilkeu
,
ONLY REPRESENTATIVE OF RECORDS REPORTED TO FETPIP FOR FOLLOW-UP DATA COLLECTION
CO
NT
INU
LNa
ED
UC
AT
ION
NO
T C
O 4
T. E
D,
TO
TA
LT
OT
AL
Pub
licP
en.
ON
of
Tot
al A
LLT
otal
%F
ound
IN M
ILIT
AR
YN
OT
FO
UN
DW
/MA
TC
HR
AC
ER
EP
OR
TE
DU
nive
rsity
Com
Col
Pub
ic S
cit
Con
t. E
d.C
ont.
Ed.
EM
PLO
YE
DS
ER
VIC
EA
T A
LLD
AT
A
12/1
5
FEMALE
AS
IAN
135
40
3%19
14%
124
18%
7959
%0
3224
%10
376
%B
LAC
K11
7717
52%
237
20%
r26
623
%65
856
%4
249
21%
926
79%
HIS
PA
NIC
540
4310
11%
106
20%
816
731
%27
451
%0
100
19%
440
61%
IND
IAN
461
62%
613
%0
715
%28
61%
011
24%
3576
%O
TH
ER
112
60
5%7
6%0
1312
%19
17%
080
71%
3229
%W
HIT
E70
0615
114
2%1,
233
18%
4714
4521
%4,
074
58%
31,
486
21%
5,52
279
%U
NK
NO
WN
I0
00%
00%
00
0%1
100%
00
0%1
100%
FE
MA
LE T
OT
ALS
.0,
019
222
263%
1,60
411
%63
1221
21%
5,13
357
%7
1,96
622
%7,
061
71%
MALE
AS
IAN
926
07%
1718
%0
2325
%50
54%
118
20%
7460
%B
LAC
K49
725
15%
116
23%
614
830
%26
754
%0
8216
%41
564
%H
ISP
AN
IC3r
a20
16%
7921
%13
113
30%
193
52%
067
18%
306
82%
IND
IAN
430
00%
619
%0
619
%27
63%
08
19%
3581
%O
TH
ER
501
02%
510
%0
612
%6
16%
036
72%
1421
%W
HIT
E50
5615
47
3%1,
064
21%
9013
3526
%2,
746
54%
1296
119
%4,
095
61%
UN
KN
OW
N2
00
0%0
0%0
00%
210
0%0
00%
2 10
0%
MA
LE T
OT
ALS
.1,
113
204
94%
1,30
621
%10
611
3327
%3,
215
54%
131,
172
11%
4,44
111
%
NR
AN
ON
-RE
SIO
EN
TA
LIE
N
TO
TA
LS15
,132
429
373%
2,91
719
%17
236
6423
%6,
426
11%
203,
130
21%
12,0
1271
%
NoN
: TH
E P
UR
PO
SE
OF
TH
IS R
EP
OR
T IS
TO
IDE
NT
IFY
TH
OS
E W
HO
CO
NT
INU
E T
HE
IR E
DU
CA
TIO
NF
OU
.OW
ING
GR
AD
UA
TIO
N .
EM
PLO
YM
EN
T D
AT
A IS
ON
LY C
ALC
ULA
TE
D F
OR
TH
OS
E N
OT
FO
UN
D C
ON
TIN
UIN
G m
en E
DU
CA
TIO
N O
R F
OU
ND
101
TH
E M
IUT
AR
Y.
TH
E M
AJO
RIT
Y O
F T
HO
SE
FO
UN
D C
ON
TIN
UIN
G T
HE
IR E
DU
CA
TIO
N A
RE
IN F
AC
T A
LSO
EM
PLO
YE
D. P
LEA
SE
NO
TE
TH
E S
ELE
CT
ION
OR
DE
R U
TIL
IZE
D B
ELO
W.
IND
IVID
UA
LS O
NLY
CO
UN
TE
D IN
ON
E C
AT
EG
OR
YS
ELE
CT
ION
PR
IOR
ITY
OR
DE
R W
AS
CO
NT
INU
ING
ED
UC
AT
ION
AT
A S
TA
TE
UN
IVE
RS
ITY
, PR
IVA
TE
FL
UN
A(
, CO
NT
INU
ING
ED
UC
AT
ION
AT
A C
OM
MU
NIT
Y C
OLL
EG
E, D
PS
-P/S
EC
NO
T C
ON
TIN
UIN
G E
DU
CA
TIO
N B
UT
FO
UN
D E
MP
LOY
ED
(F
L E
MP
LOY
ME
NT
& F
ED
ER
AL
EM
PLO
YM
EN
T),
IN M
ILIT
AR
Y N
OT
EM
PLO
YE
D, O
R L
AS
TLY
- N
O M
AT
CH
DA
TA
WH
AT
SO
EV
ER
NO
TE
: EM
PLO
YM
EN
T D
AT
A R
AS
ED
ON
TH
E M
b Q
UA
RT
ER
d 1
902
(OC
T.-
CIE
-C.)
CO
MM
UN
ITY
CO
LLE
GE
CO
NT
INU
ING
ED
UC
AT
ION
TA
111
138)
ON
FA
LL 1
1/12
DA
TA
ST
AT
E U
NIV
ER
SIT
Y S
YS
TE
M O
DN
IINU
ING
ED
UC
AT
ION
DA
TA
$41(
11Ift
f IR
V S
PR
ING
119
3 T
ER
M.
PR
IVA
TE
UN
IVE
RS
ITY
EN
RO
LLM
EN
T D
AT
A S
AS
E)
ON
FLO
RID
A;;
AT
TE
ND
ING
FA
LL W
OR
WIN
TE
R 1
902.
93O
PS
PO
ST
SE
CO
ND
AR
Y E
DU
CA
TIO
N D
AT
A R
AS
ED
ON
2 &
3 S
CH
OO
L Y
EA
R 1
942-
93
BE
ST
CO
PY
AV
AIL
AB
LE
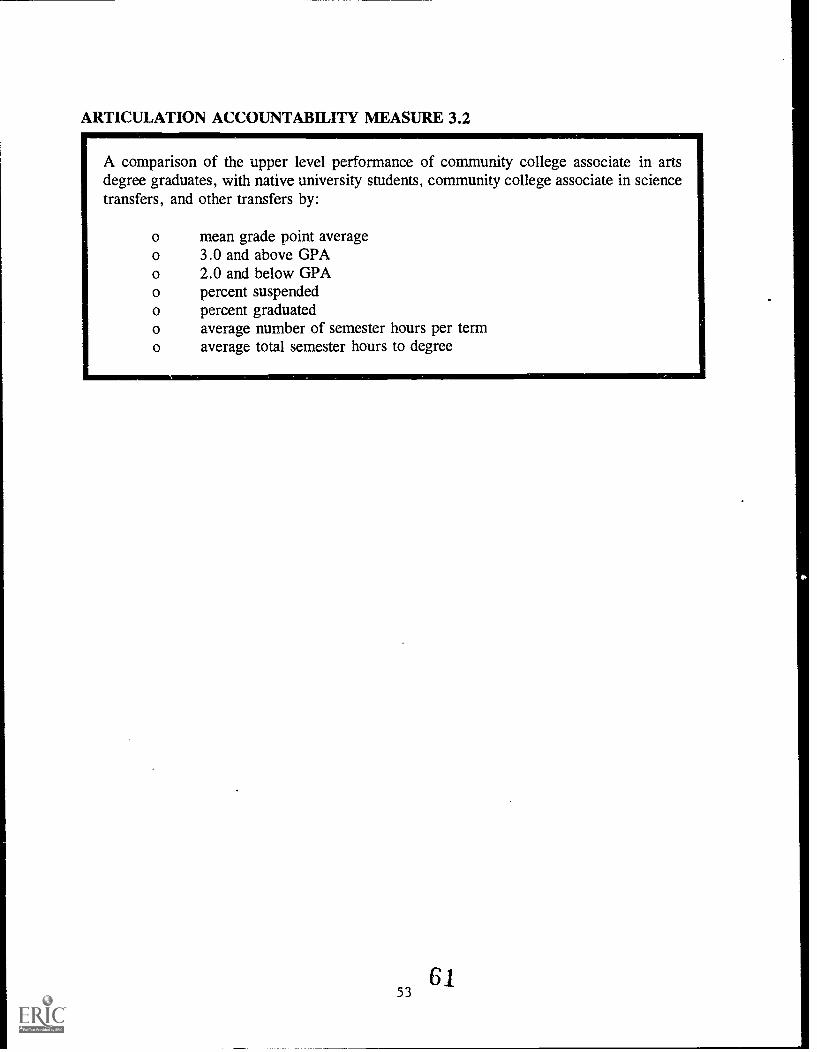
ARTICULATION ACCOUNTABILITY MEASURE 3.2
A comparison of the upper level performance of community college associate in artsdegree graduates, with native university students, community college associate in sciencetransfers, and other transfers by:
o mean grade point averageo 3.0 and above GPAo 2.0 and below GPAo percent suspendedo percent graduatedo average number of semester hours per termo average total semester hours to degree
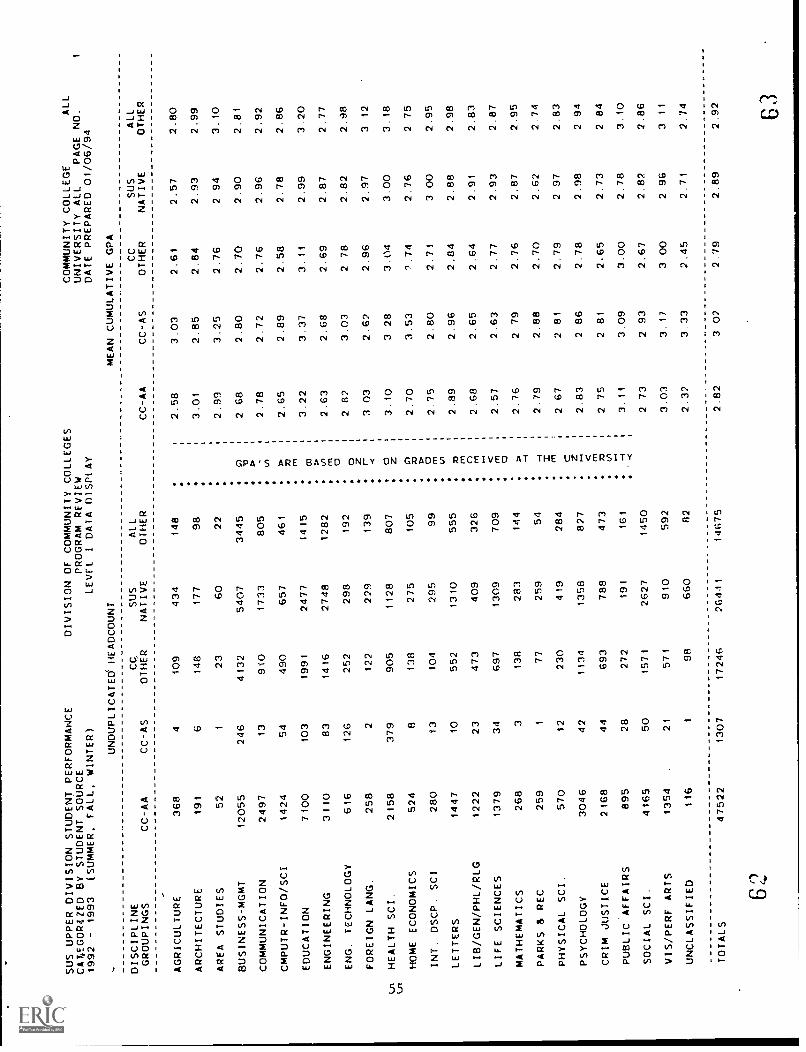
SUS UPPER DIVISION STUDENT PERFORMANCE
CAUGOR4ZED BY STUDENT SOURCE
1992
-1993
(SUMMER, FALL, WINTER)
DIVISION OF COMMUNITY COLLEGES
PROGRAM REVIEW
LEVEL
I DATA DISPLAY
DISCIPLINE
GROUPINGS
CC-AA
UNDUPLICATEd HEADCOUNT
CC.
SUS
CC-AS
OIHER
NATIVE
ALL
OTHER
AGRICULTURE
368
4109
434
148
ARCHITECTURE
191
6148
177
98
AREA STUDIES
52
123
60
22
BUSINESS-MGMT
12055
246
4132
5407
3445
COMMUNICATION
2497
13
9i0
1733
805
CMPUTR-INFO/SCI
1424
54
490
657
461
EDUCATION
7100
103
1991
2477
1415
ENGINEERING
3110
83
1416
2748
1282
ENG. TECHNOLOGY
616
126
252
298
192
FOREIGN LANG.
258
2122
229
139
In
HEALTH SCI.
2158
379
905
1128
807
U'
HOME ECONOMICS
524
8138
275
105
INT. DSCP. SCI
280
13
104
295
99
LETTERS
1447
10
552
1310
555
LIB/GEN/PHL/RLG
1222
23
473
409
326
LIFE SCIENCES
1379
34
697
1309
709
MATHEMATICS
268
3138
283
144
PARKS 8 REC
259
177
259
54
PHYSICAL SCI.
570
12
230
419
284
PSYCHOLOGY
3046
42
1134
1358
827
CRIM JUSTICE
2168
44
693
788
473
PUBLIC AFFAIRS
895
28
272
191
161
SOCIAL SCI.
4165
50
1571
2627
1450
VIS/PERF ARTS
1354
21
571
910
592
UNCLASSIFIED
116
198
660
82
TOTALS
47522
1307
17246
26441
14675
COMMUNITY COLLEGE
ALL
UNIVERSITY ALL
PAGE NO.
DATE PREPARED 01/06/94
MEAN CUMULATIVE GPA
CC-AA
CC
SUS
ALL
CC-AS
OTHER
NATIVE
OTHER
-I M C Z < m M (p
2.58
3.01
2.99
2 68
2.78
2.65
3.22
2.63
2 82
3 03
3.10
2.70
2.75
2.89
2.68
2.57
2.76
2.79
2 67
2.83
2 75
3.11
2 73
3.03
2.32
2.82
3.03
2.85
3.25
2.80
2.72
2.89
3.37
2.68
3.03
2.62
3 28
3.53
2.80
2.96
2.65
2.63
2.79
2.88
2 81
2 86
2 81
3.09
2 93
3.11
3.33
2.61
2.84
2.76
2.70
2.76
2.58
3.11
2.69
2 78
2.96
3.04
?.74
2.71
2.84
2.64
2.77
2.76
2.70
2.79
2.78
2.65
3.00
2.67
2.57
2.93
2 94
2.90
2.96
2.78
2.99
2.87
2.82
2.97
3.00
2.76
3 00
2.88
2.91
2.93
2.87
2.62
2 97
2.98
2.73
2.78
2.82
3 00
2 96
2.45
2.71
3 02
2.79
2.80
2.99
3.10
2.81
2.92
2.86
3.20
2.77
2.98
3 12
3.18
2 75
2.95
2.98
2.83
2.87
2.95
2.74
2.83
2 94
2 84
3.10
2.86
311
2.74
2.89
2.92 63
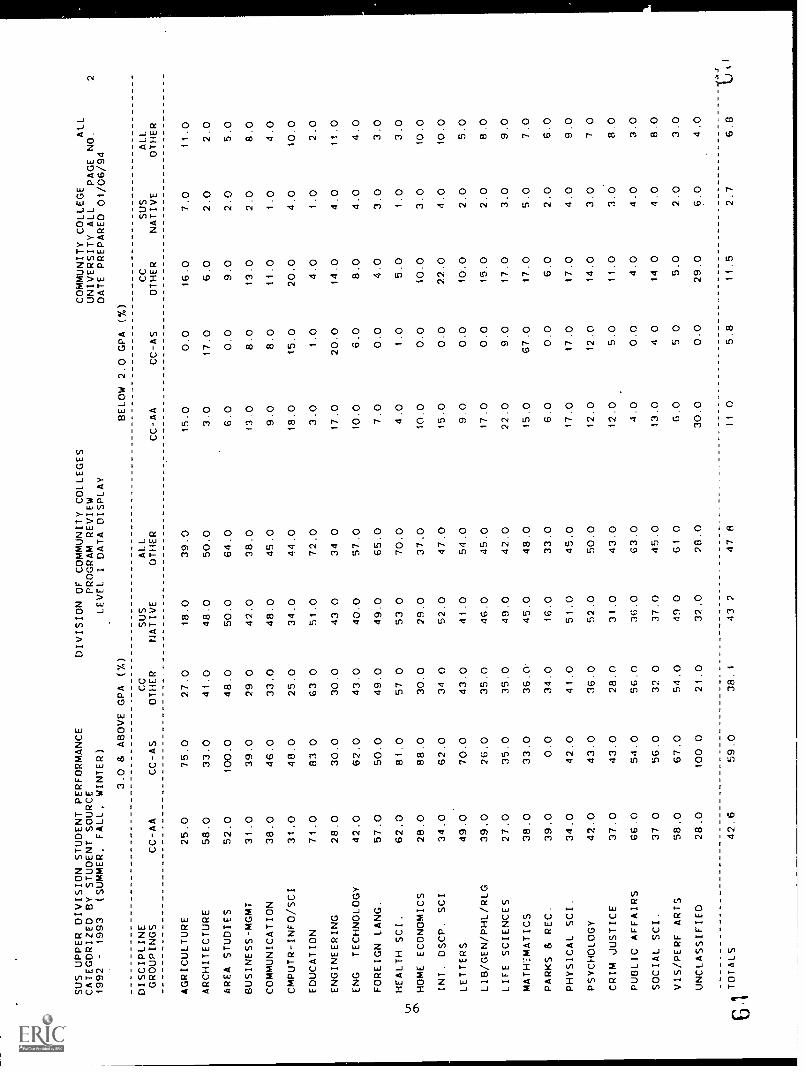
1,11 rn
SUS UPPER DIVISION STUDENT PERFORMANCE
CATEGORIZED BY STUDENT SOURCE
1992
-1993
(SUMMER, FALL, WINTER)
DIVISION OF COMMUNITY COLLEGES
PROGRAM REVIEW
LEVEL
IDATA DISPLAY
3.0 & ABOVE GPA (%)
BELOW 2.0 GPA (%)
DISCIPLINE
GROUPINGS
COMMUNITY COLLEGE
ALL
UNIVERSITY ALL
PAGE NO.
DATE PREPARED 01/06/94
2
CC
SUS
ALL
CC
SUS
ALL
CC-AA
CC-AS
OTHER
NATIVE
OTHER
CC-AA
CC-AS
OTHER
NATIVE
OTHER
AGRICULTURE
ARCHITECTURE
AREA STUDIES
BUSINESS-MGMT
COMMUNICATION
CMPUTR-INFO/SCI
EDUCATION
ENGINEERING
ENG
TECHNOLOGY
FOREIGN LANG.
HEALTH SCI.
HOME ECONOMICS
INT. DSCP. SCI
LETTERS
LIB/GEN/PHL/RLG
LIFE SCIENCES
MATKiMATICS
PARKS & REC.
PHYSICAL SCI.
PSYCHOLOGY
CRIM JUSTICE
PUBLIC AFFAIRS
SOCIAL SCI.
VIS/PERF ARTS
UNCLASSIFIED
(3 1
TOTALS
25.0
75.0
27.0
18.0
39.0
15.0
0.0
16.0
7.0
11.0
58.0
33.0
41.0
48.0
50.0
3.0
17.0
6.0
2.0
2.0
52.0
100.0
48.0
50.0
64.0
6.0
0.0
9.0
2.0
5.0
31.0
39.0
29 0
42.0
38.0
13.0
8.0
13.0
2.0
8.0
38.0
46.0
33.0
48.0
45.0
9.0
8.0
11.0
1.0
4.0
31.0
48.0
25.0
34.0
44.0
18.0
15.0
20.0
4.0
10.0
71.0
83 0
63.0
51.0
72.0
3.0
1.0
4.0
1.0
2.0
28.0
30.0
30.0
43 0
34 0
17.0
20.0
14.0
4.0
11.0
42.0
62.0
43.0
40.0
57.0
10.0
6.0
8.0
4.0
4.0
57.0
50.0
49.0
49.0
65.0
7.0
0.0
4.0
3.0
3.0
62.0
81.0
57 0
53 0
70.0
4.0
1.0
5.0
1.0
3.0
28.0
88.0
30.0
29.0
37.0
10.0
0.0
10.0
3.0
10.0
34.0
62.0
34 0
52.0
47.0
15.0
0.0
22.0
4.0
10.0
49.0
70.0
43.0
41.0
54.0
9.0
0.0
10.0
2.0
5.0
39.0
26.0
35.0
46.0
45.0
17.0
0.0
15.0
2.0
8.0
27.0
35.0
35.0
49.0
42.0
22.0
9.0
17.0
3.0
9.0
38.0
33.0
36.0
45.0
48.0
15.0
67.0
17.0
5.0
7.0
39.0
0.0
34.0
16.0
33.0
6.0
0.0
6.0
2.0
6.0
34.0
42.0
41.0
51.0
45.0
17.0
17.0
17.0
4.0
9.0
42.0
43.0
36.0
52.0
50.0
12.0
12.0
14.0
3.0
7 0
37.0
43.0
28.0
31.0
43.0
12.0
5.0
11.0
3.0
8.0
66.0
54.0
56.0
36.0
63.0
4.0
0.0
4.0
4.0
3.0
37 0
56.0
32 0
37.0
45.0
13.0
4 0
14 0
4.0
8.0
58.0
67.0
54.0
49 0
G1 0
G.0
5 0
5.0
2.0
3.0
28.0
100 0
21.0
32.0
28.0
30.0
0.0
29.0
6.0
4.0
42.6
59.0
38.1
43 2
47 8
11 0
5.8
11.5
2.7
6.8
I
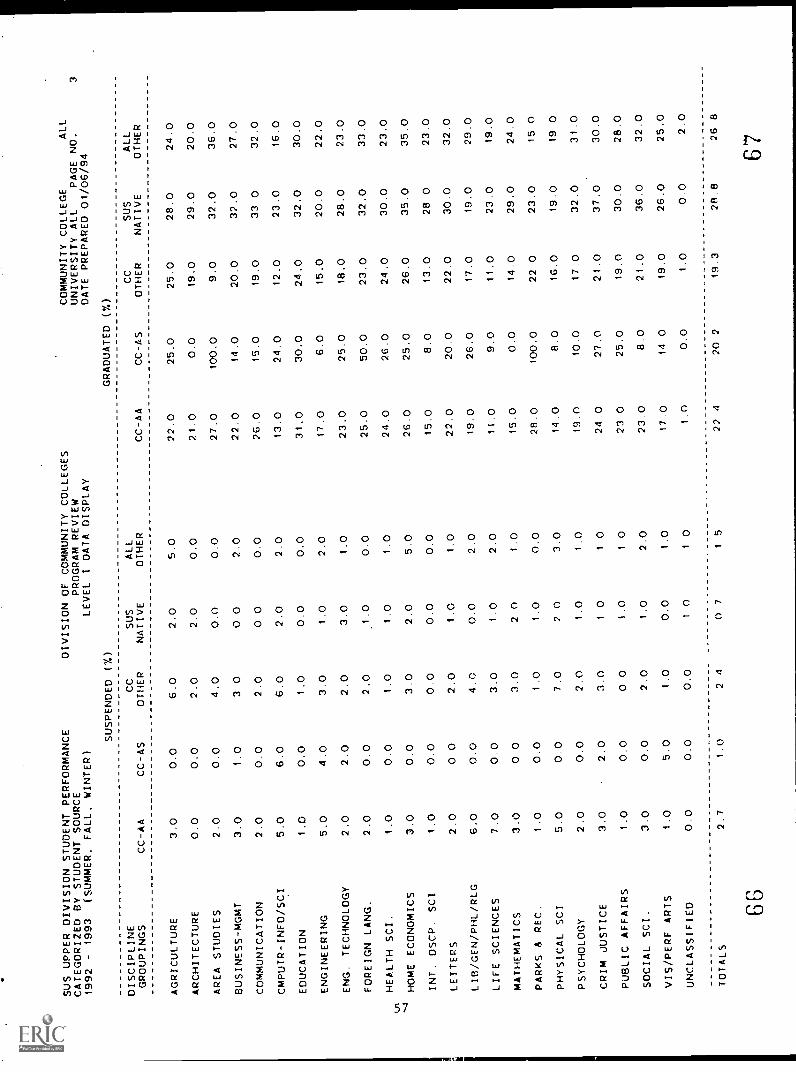
SUS UPPER DIVISION STUDENT PERFORMANCE
CATEGORIZED BY STUDENT SOURCE
1992 -
1993
(SUMMER. FALL. WINTER)
SUSPENDED
DISCIPLINE
CC
GROUPINGS
CC-AA
CC-AS
OTHER
DIVISION OF COMMUNITY COLLEGES
PROGRAM REVIEW
LEVEL
I DATA DISPLAY
(%)
SUS
ALL
NATIVE
OTHER
CC-AA
GRADUATED
CC-AS
COMMUNITY COLLEGE
ALL
UNIVERSITY ALL
PAGE NO.
DATE PREPARED 01/06/94
(%)
CC
SUS
ALL
OTHER
NATIVE
OTHER
AGRICULTURE
3.0
0.0
6.0
2.0
5.0
22.0
25.0
25.0
28.0
24.0
ARCHITECTURE
0.0
0.0
2.0
2.0
0.0
21.0
0.0
19.0
29.0
20.0
AREA STUDIES
2.0
0.0
4.0
0.0
0.0
27.0
100.0
9.0
32.0
36.0
BUSINESS-MGMT
3.0
1.0
3.0
0 0
2.0
22.0
14.0
20.0
32.0
27.0
COMMUNICATION
2.0
0.0
2.0
0 0
0.0
26.0
15.0
19.0
33 0
32.0
CMPUTR-INFO/SCI
5.0
6.0
6.0
2.0
2.0
13.0
24.0
12.0
23.0
16.0
EDUCATION
1.0
0.0
1.0
0.0
0.0
31.0
30.0
24.0
32.0
30.0
ENGINEERING
5.0
4.0
3.0
1.0
2.0
17.0
6.0
15.0
20.0
22.0
ENG. TECHNOLOGY
2.0
2.0
2.0
3.0
1.0
23.0
25.0
18.0
28.0
23.0
FOREIGN LANG.
2.0
0.0
2.0
1.0
0.0
25.0
50.0
23.0
32.0
33.0
HEALTH SCI.
1.0
0.0
1.0
1.0
1.0
24.0
26.0
24.0
30.0
23.0
In --4
HOME ECONOMICS
3.0
0.0
3.0
2.0
5.0
26.0
25.0
26.0
35.0
35.0
INT. DSCP. SC1
1.0
0.0
0.0
0.0
0.0
15.0
8.0
13.0
28.0
23.0
LETTERS
2.0
0 0
2 0
1.0
1.0
22.0
20.0
22.0
30.0
32.0
LIB/GEN/PHL/RLG
6.0
0.0
4.0
0.0
2.0
19.0
26.0
17.0
19.0
29.0
LIFE SCIENCES
7.0
0.0
3.0
1.0
2.0
11.0
9.0
11.0
23.0
19.0
MATHEMATICS
3.0
0 0
3.0
2 0
1.0
15.0
0.0
14.0
29.0
24.0
PARKS & REC.
1.0
0.0
1.0
1.0
0.0
28.0
100.0
22 0
23.0
15 0
PHYSICAL SCI
5.0
0.0
7.0
2 0
3.0
14.0
8.0
16.0
19.0
19 0
PSYCHOLOGY
2.0
0.0
2.0
1.0
1.0
19.0
10.0
17.0
32.0
31.0
CRIM JUSTICE
3.0
2.0
3.0
10
10
24.0
27.0
21.0
37.0
30.0
PUBLIC AFFAIRS
1.0
0.0
0 0
1.0
10
23 0
25.0
19.0
30.0
28.0
SOCIAL SCI.
3.0
0.0
2.0
1.0
2.0
23.0
8.0
21.0
36.0
32.0
VIS /PERF ARTS
1.0
5.0
1.0
0.0
1.0
17.0
14 0
19.0
26.0
25.0
UNCLASSIFIED
0.0
0.0
0.0
10
10
1.0
0.0
1.0
0.0
2.0
TOTALS
2.7
1.0
2 4
0 7
15
22 4
20 7
19.3
28.8
26 8
GE
367
3
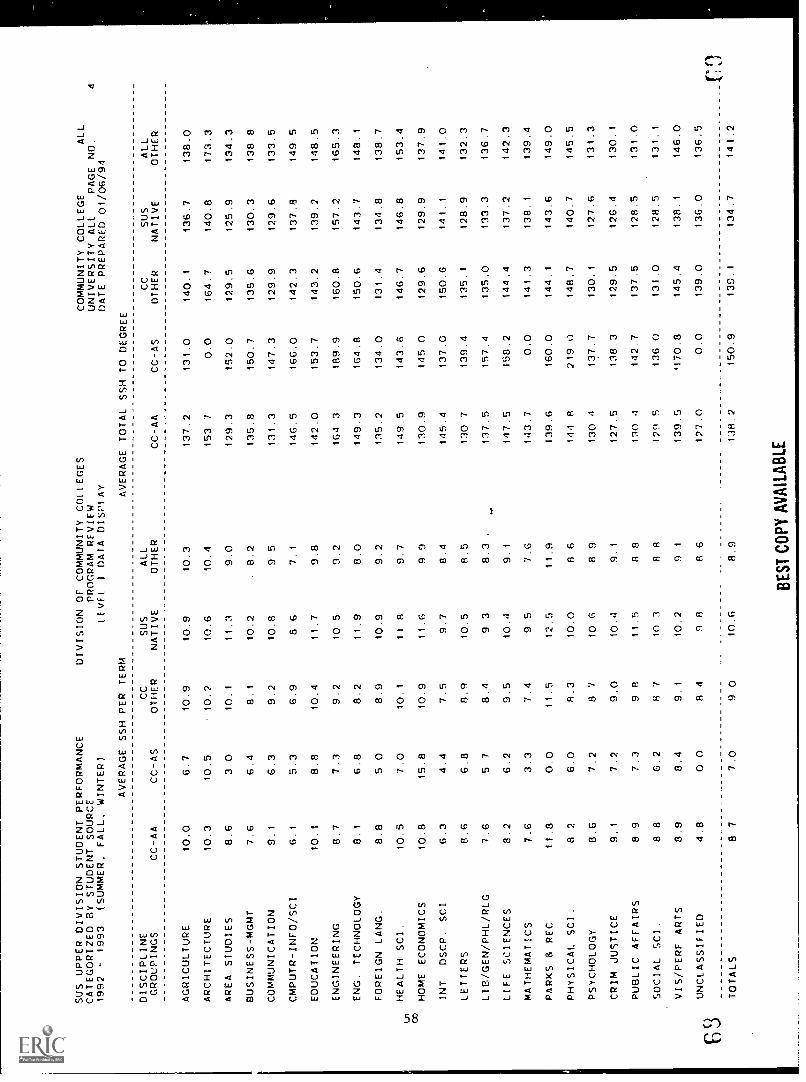
SUS UPPER DIVISION STUDENT PERFORMANCE
DIVISION OF COMMUNITY COLLEGES
CATEGORIZED BY STUDENT SOURCE
PROGRAM REVIEW
1992
-1993
(SUMMER, FALL, WINTER)
LEVEL
IDATA DISPLAY
AVERAGE SSH PER TERM
AVERAGE
DISCIPLINE
CC
SUS
ALL
GROUPINGS
CC-AA
CC-AS
OTHER
NATIVE
OTHER
TOTAL SSH
CC-AA
TO DEGREE
CC-AS
COMMUNITY COLLEGE
ALL
UNIVERSITY ALI
PAGE NO.
4DATE PREPARED 01/06/94
CC
SUS
ALL
OTHER
NATIVE
OTHER
AGRICULTURE
10.0
6.7
10.9
10.9
10.3
137.2
131.0
140.1
136.7
138.0
ARCHITECTURE
10.3
10.5
10.2
10.6
10.4
153 7
0.0
164.7
140.8
173.3
AREA STUDIES
8.6
3 0
10.1
11.3
9.0
129.3
152.0
129.5
125.9
134.3
BUSINESS-MGMT
7.6
6.4
8.1
10.2
.8.2
135.8
150.7
135.6
130.3
138.8
COMMUNICATION
9.1
6.3
9.2
10.8
9 5
131.3
147.3
129.9
129.6
133.5
CMPUTR-INFO/SCI
6.1
5.3
6.9
8.6
7.1
146.5
166.0
142.3
137.8
149 5
EDUCATION
10.1
8.8
10.4
11.7
9.8
142.0
153.7
143.2
139.2
148.5
ENGINEERING
8.7
7.3
9.2
10 5
9.2
164.3
189.9
160.8
157.2
165.3
ENG. TECHNOLOGY
8.1
6.8
8.2
11.9
8.0
149.3
164.8
150.6
143.7
148.1
FOREIGN LANG.
8.8
5 0
8.9
10.9
9.2
135.2
134.0
131.4
134.8
138.7
HEALTH SCI.
10.5
7.0
10.1
11 8
9.7
149.5
143.6
146.7
146.8
153.4
1-11
co
HOME ECONOMICS
10.8
15.8
10.9
11.6
9 9
130.9
145 0
129.6
129.9
137.9
INT
DSCP. SCI
6.3
4.4
7.5
9.7
8.4
145.4
137.0
150.6
141.1
141.0
LETTERS
8.6
6.8
8.9
10.5
8.5
130 7
139.4
135.1
128.9
132.3
LIB/GEN/PHL/RLG
7.6
5 7
8.4
9.3
8.3
137.5
157.4
135.0
133.3
136.7
LIFE SCIENCES
8.2
6.2
9.5
10.4
9.1
147.5
158.2
144.4
137.2
142.3
MATHEMATICS
7.6
3.3
7.4
9 5
7.6
143.7
0.0
141.3
138.1
139.4
PARKS 8 REC
11.8
0.0
11.5
12.9
11.9
139.6
160.0
144.1
143.6
149.0
PHYSICAL SCI.
8 2
6.0
8.3
10.0
8 6
144 8
219 0
148.7
140.7
145.5
PSYCHOLOGY
8.6
7.2
8.7
10 G
8 9
130 4
137.7
130.1
127.6
131.3
CRIM JUSTICE
9.1
7.2
9.0
10.4
9.1
127.5
138.3
129.5
126.4
130.1
PUBLIC AFFAIRS
8.9
7.3
9 8
11.5
8 8
130 4
142.7
137.5
128.5
131.0
SOCIAL SCI.
8 8
6.2
8 7
10 3
8 8
129 5
136 0
131.0
128.5
131.1
VIS/PERF ARTS
8.9
8.4
9.1
10.2
91
139.5
'170.8
145.4
138.1
146.0
UNCLASSIFIED
4.8
0 0
8 4
9 8
8 6
127.0
0.0
139.0
136.0
136.5
TOTALS
8 7
7.0
9 0
10.6
8.9
138.2
150.9
139.1
134.7
141.2
BE
ST C
OPY
AV
AIL
AB
LE
{7
OBJECTIVE 4.0
To PROVIDE ACCESS TO PROGRAMS TO ALL STUDENTS WHO HAVE MET THE PROGRAMPREREQUISITE COURSE REQUIREMENTS AND WHO HAVE EARNED A SATISFACTORY GRADE POINT
AVERAGE. To ONLY LIMIT ACCESS TO PROGRAMS BECAUSE THE MARKETPLACE CANNOTACCOMMODATE THE NUMBERS OF STUDENTS INTERESTED IN ENTERING THE PROGRAM.
ARTICULATION ACCOUNTABILITY MEASURE 4.1
F
The number and names of limited access programs in the State University System, byuniversity.
5 70
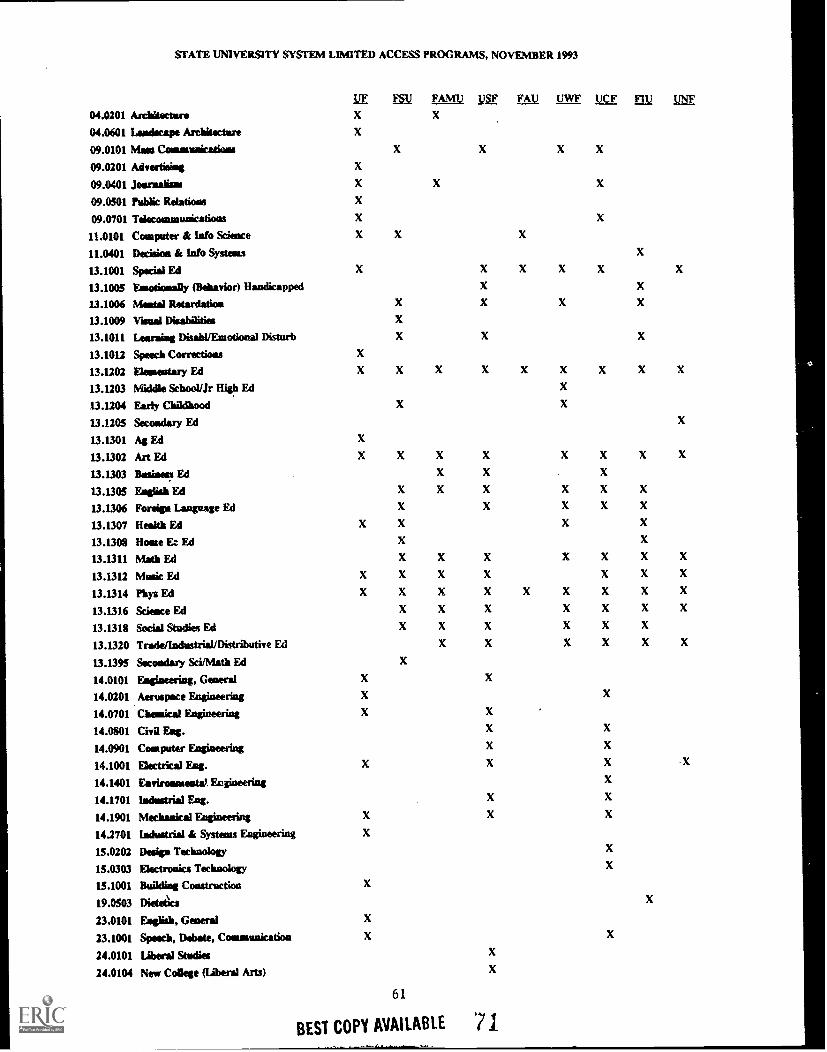
STATE UNIVERSITY SYS1 EM LIMITED ACCESS PROGRAMS, NOVEMBER 1993
04.0201 ArchitectsroIFX
1.1k FAMU Q ?AU UWF UCF f_l_V UNF
x04.0601 landscape Architecture X
09.0101 Maas Commaisicatium
09.0201 Advertising xX X X X
09.0401 harm liar X X X
09.0501 Public Relations
09.0701 Tekconunnaications
11.0101 Computer & Info Science
11.0401 Dailies & Info Systems
X
xX X x
x
x13.1001 Spacial Ed X X X X X X
13.1005 Emotionally (Behavior) Handicapped
13.1006 Mamma Retardation X
X
x X
XX
13.1009 Visual Disabilities X
13.1011 Leering' g nimbi/Emotional Disturb X X X
13.1012 Speech Corrections X
13.1202 Elementary Ed X X X X X X X X X
13.1203 Middle School/Jr High Ed
13.1204 Early Cbildhood xXX
13.1205 Secondary Ed X
13.1301 Ag Ed X
13.1302 Art Ed X X X X X X X X
13.1303 Rosiness Ed X X X
13.1305 Faglish Ed X X X X X X
13.1306 Foreign Language Ed X X X X X
13.1307 Health Ed X X X X
13.1308 Home EL` Ed X X
13.1311 Math Ed X X X X X X X
13.1312 Music Ed X X X X X X X
13.1314 Pbys Ed X X X X X X X X X
13.1316 Science Ed X X X X X X X
13.1318 Social Studies Ed X X X X X X
13.1320 Tradeflodustrial/Distrlutive Ed X X X X X X
13.1395 Secondary Sci/Meth Ed X
14.0101 Engineering, General X X
14.0201 Aerospace Engineering X X
14.0701 Chemical Engineering X X
14.0801 Civil Eng. X X
14.0901 Computer Eagineering X X
14.1001 Electrical Eag. X X X X
14.1401 Environmental Engineering X
14.1701 Industrial Fag. X X
14.1901 Mechanical &emitting X X X
14.2701 Industrial & Systems Engineering X
15.0202 Design Terbnoiogy X
15.0303 Electronics Technology X
15.1001 Building Construction X
19.0503 Dietetics
23.0101 Eaglish, General xX
23.1001 Speech, Debate, Communication X X
24.0101 Liberal Studies X
24.0104 New College (Users) Arts) X
61
BEST COPY AVAILABLE 7.1
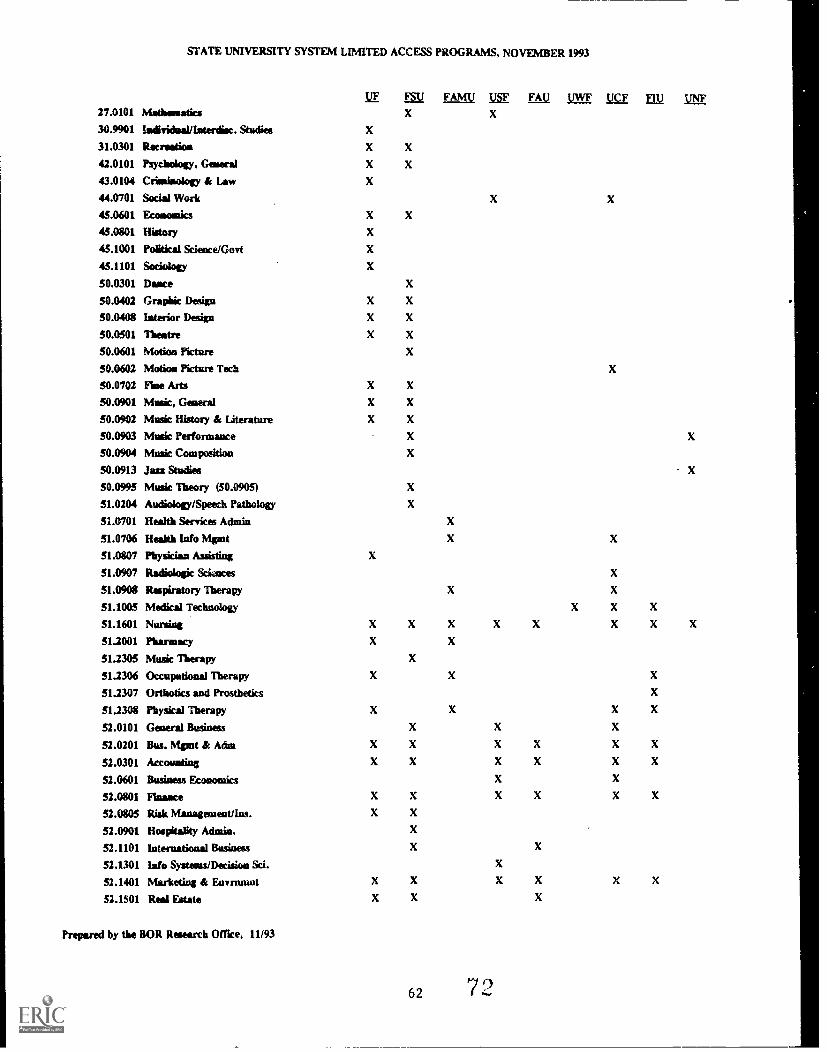
STATE UNIVERSITY SYSTEM LIMITED ACCESS PROGRAMS, NOVEMBER 1993
27.0101 MadmaraticsFAMU FAU UWF UCF ELV UNF
X X
30.9901 ladividual/Interdim. Studies X
31.0301 1Recreadas X X
42.0101 Psychakiiy. Gerald X X
43.0104 Criminology & Law X
44.0701 Social Work X X
45.0601 Economics X X
45.0801 History X
45.1001 Political Science/Govt X
45.1101 Sociology X
50.0301 Dance X
50.0402 Graphic Design X X
50.0408 Interior Design X X
50.0501 Theatre X X
50.0601 Motion Picture X
50.0602 Motioa Picture Tech X
50.0702 Pine Arts X X
50.0901 Music, General X X
50.0902 Musk History & Literature X X
50.0903 Music Performance X X
50.0904 Musk Composition X
50.0913 Jan Studies X
50.0995 Musk Theory (50.0905) X
51.0204 Audiology/Speech Pathology X
51.0701 Health Services Admin X
51.0706 Health Info Mgmt X X
51.0807 Physician Assisting X
51.0907 Radiologic Sci aces X
51.0908 Respiratory Therapy X X
51.1005 Medical Technology X X X
51.1601 Nursing X X X X X X X X
51.2001 Pharmacy X X
51.2305 Music Therapy X
51.2306 Occupational Therapy X X X
51.2307 Ortholics and Prosthetics X
51.2308 Physical Therapy X X X X
52.0101 General Business X X X
52.0201 Bus. Mgmt & Adns X X X X X X
52.0301 Accovating X X X X X X
52.0601 Business Economics X X
52.0801 Elmore X X X X X X
52.0805 Risk Managerneat/Ins. X X
52.0901 Hospitality Admin. X
52.1101 International Business X X
52.1301 Lao Systems/Decision Sci. X
52.1401 Marketing & Euvnuunt X X X X X X
52.1501 Real Estate X X X
Prepared by the BOR Research Office, 11193
62 72
ARTICULATION ACCOUNTABILITY MEASURE 4.2
The number and names of limited access programs in the Community College System,by college.
673
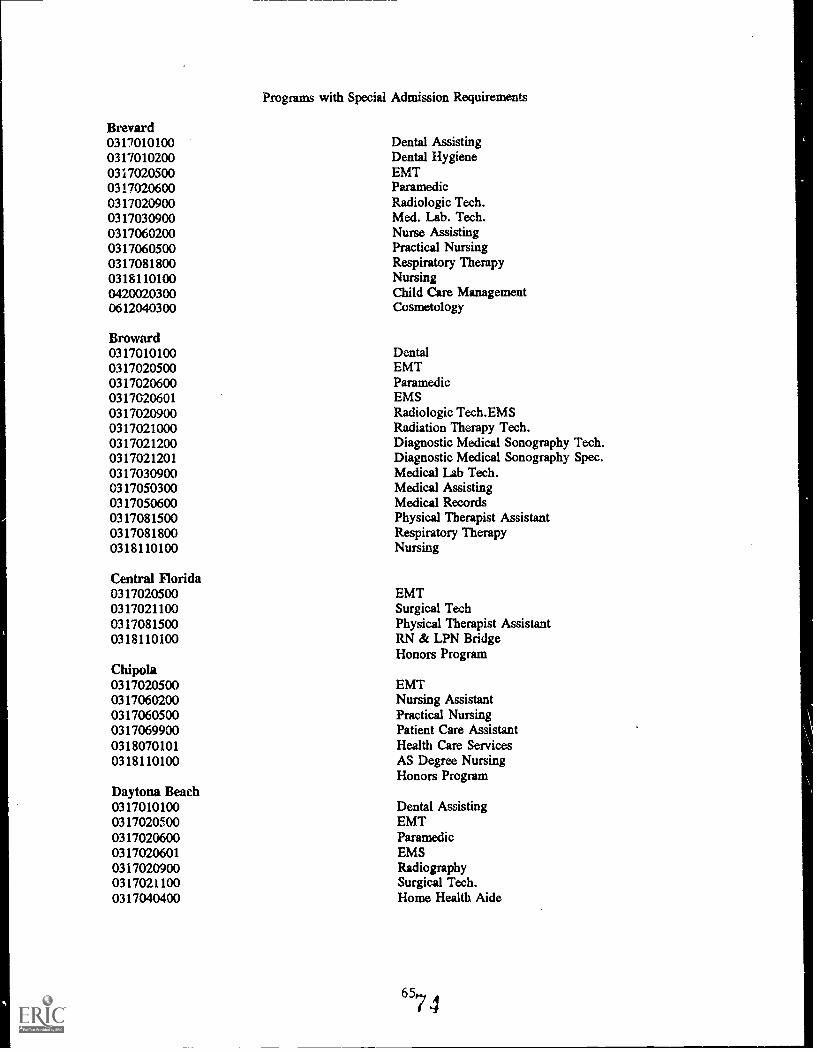
Programs with Special Admission Requirements
Brevard0317010100 Dental Assisting0317010200 Dental Hygiene0317020500 EMT0317020600 Paramedic0317020900 Radio logic Tech.0317030900 Med. Lab. Tech.0317060200 Nurse Assisting0317060500 Practical Nursing0317081800 Respiratory Therapy0318110100 Nursing0420020300 Child Care Management0612040300 Cosmetology
Broward0317010100 Dental0317020500 EMT0317020600 Paramedic0317020601 EMS0317020900 Radio logic Tech.EMS0317021000 Radiation Therapy Tech.0317021200 Diagnostic Medical Sonography Tech.0317021201 Diagnostic Medical Sonography Spec.0317030900 Medical Lab Tech.0317050300 Medical Assisting0317050600 Medical Records0317081500 Physical Therapist Assistant0317081800 Respiratory Therapy0318110100 Nursing
Central Florida0317020500 EMT0317021100 Surgical Tech0317081500 Physical Therapist Assistant0318110100 RN & LPN Bridge
Honors ProgramChipola0317020500 EMT0317060200 Nursing Assistant0317060500 Practical Nursing0317069900 Patient Care Assistant0318070101 Health Care Services0318110100 AS Degree Nursing
Honors ProgramDaytona Beach0317010100 Dental Assisting0317020500 EMT0317020600 Paramedic0317020601 EMS0317020900 Radiography0317021100 Surgical Tech.0317040400 Home Health Aide
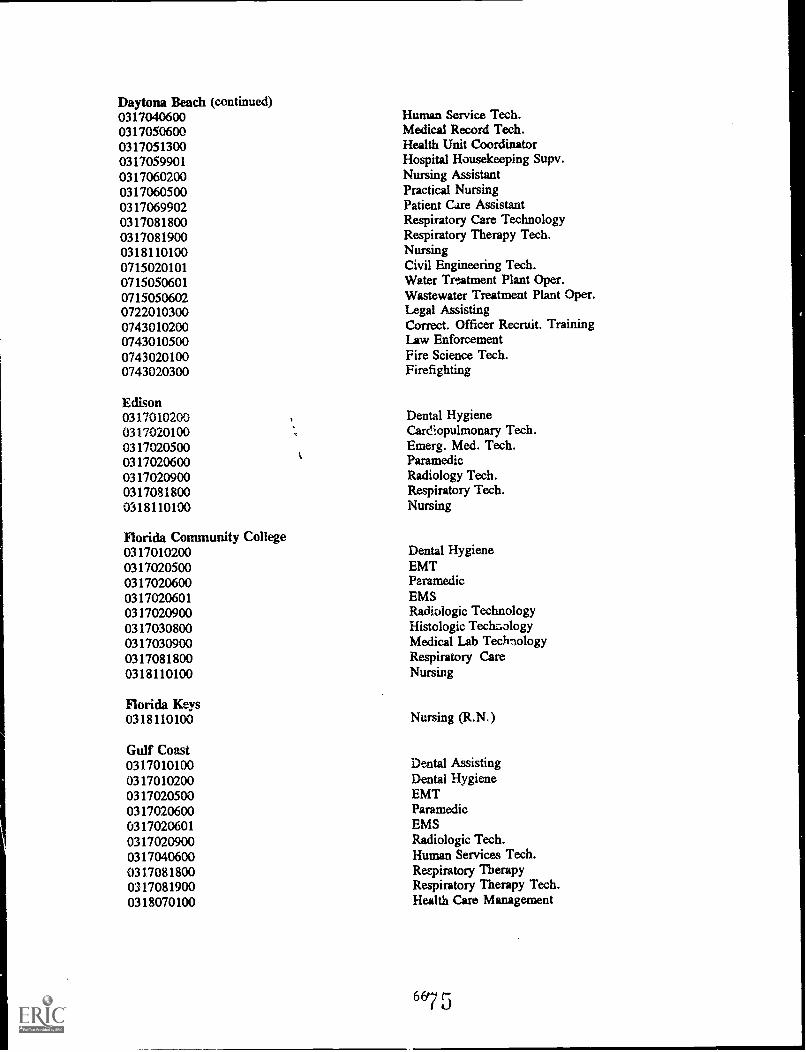
Daytona Beach (continued)031704060003170506000317051300031705990103170602000317060500031706990203170818000317081900031811010007150201010715050601071505060207220103000743010200074301050007430201000743020300
Edison0317010200031702010003170205000317020600031702090003170818000318110100
Florida Community College031701020003170205000317020600031702060103170209000317030800031703090003170818000318110100
Florida Keys0318110100
Gulf Coast0317010100031701020003170205000317020600031702060103170209000317040600031708180003170819000318070100
Human Service Tech.Medical Record Tech.Health Unit CoordinatorHospital Housekeeping Supv.Nursing AssistantPractical NursingPatient Care AssistantRespiratory Care TechnologyRespiratory Therapy Tech.NursingCivil Engineering Tech.Water Treatment Plant Oper.Wastewater Treatment Plant Oper.Legal AssistingCorrect. Officer Recruit. TrainingLaw EnforcementFire Science Tech.Firefighting
Dental HygieneCardiopulmonary Tech.Emerg. Med. Tech.ParamedicRadiology Tech.Respiratory Tech.Nursing
Dental HygieneEMTParamedicEMSRadio logic TechnologyHistologic TechnologyMedical Lab TechnologyRespiratory CareNursing
Nursing (R.N.)
Dental AssistingDental HygieneEMTParamedicEMSRadio logic Tech.Human Services Tech.Retpiratory TherapyRespiratory Therapy Tech.Health Care Management
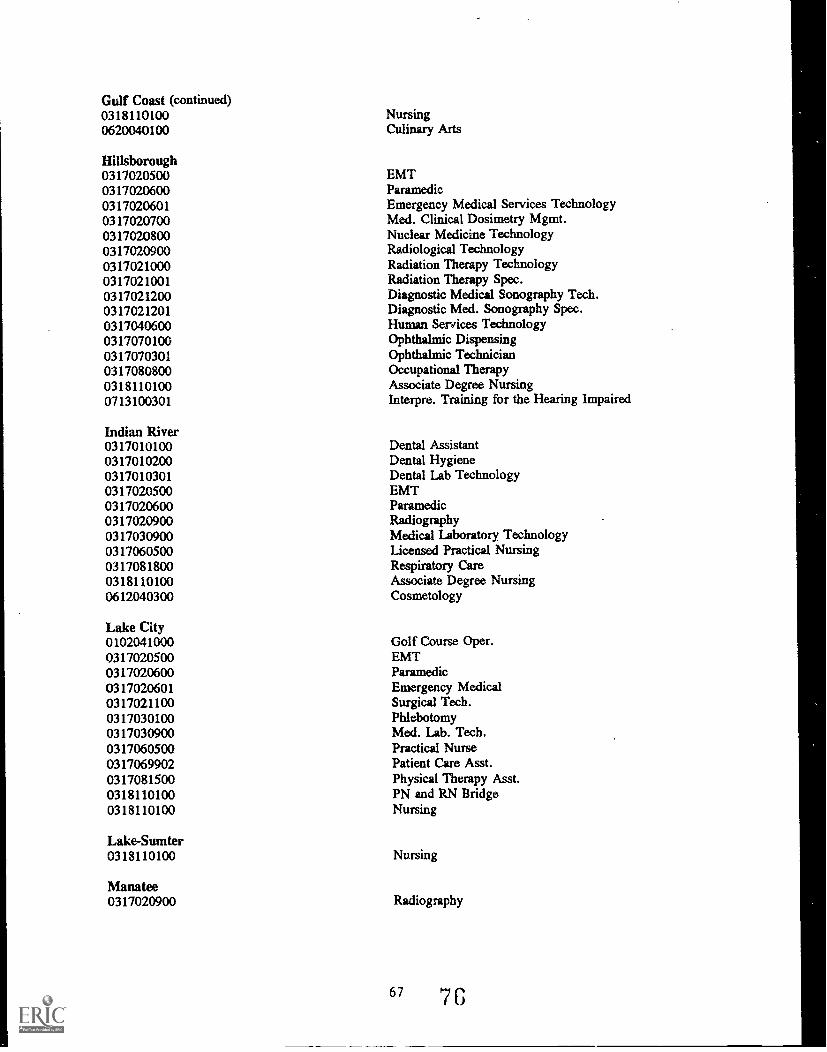
Gulf Coast (continued)03181101000620040100
Hillsborough0317020500031702060003170206010317020700031702080003170209000317021000031702100103170212000317021201031704060003170701000317070301031708080003181101000713100301
Indian River03170101000317010200031701030103170205000317020600031702090003170309000317060500031708180003181101000612040300
Lake City010204100003170205000317020600031702060103170211000317030100031703090003170605000317069902031708150003181101000318110100
Lake-Sumter0318110100
Manatee0317020900
NursingCulinary Arts
EMTParamedicEmergency Medical Services TechnologyMed. Clinical Dosimetry Mgmt.Nuclear Medicine TechnologyRadiological TechnologyRadiation Therapy TechnologyRadiation Therapy Spec.Diagnostic Medical Sonography Tech.Diagnostic Med. Sonography Spec.Human Services TechnologyOphthalmic DispensingOphthalmic TechnicianOccupational TherapyAssociate Degree NursingInterpre. Training for the Hearing Impaired
Dental AssistantDental HygieneDental Lab TechnologyEMTParamedicRadiographyMedical Laboratory TechnologyLicensed Practical NursingRespiratory CareAssociate Degree NursingCosmetology
Golf Course Oper.EMTParamedicEmergency MedicalSurgical Tech.PhlebotomyMed. Lab. Tech.Practical NursePatient Care Asst.Physical Therapy Asst.PN and RN BridgeNursing
Nursing
Radiography
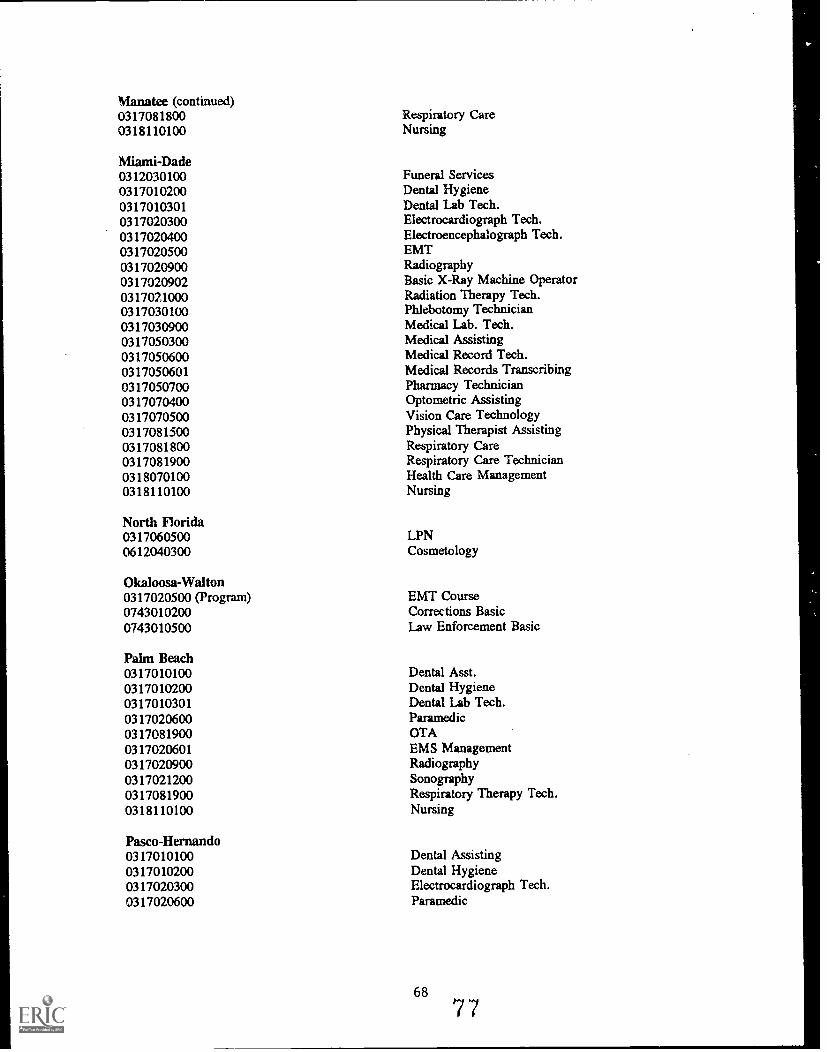
Manatee (continued)03170818000318110100
Miami-Dade0312030100031701020003170103010317020300031702040003170205000317020900031702090203170210000317030100031703090003170503000317050600031705060103170507000317070400031707050003170815000317081800031708190003180701000318110100
North Florida03170605000612040300
Olcaloosa-Walton0317020500 (Program)07430102000743010500
Palm Beach0317010100031701020003170103010317020600031708190003170206010317020900031702120003170819000318110100
Pasco-Hernando0317010100031701020003170203000317020600
Respiratory CareNursing
Funeral ServicesDental HygieneDental Lab Tech.Electrocardiograph Tech.Electroencephalograph Tech.EMTRadiographyBasic X-Ray Machine OperatorRadiation Therapy Tech.Phlebotomy TechnicianMedical Lab. Tech.Medical AssistingMedical Record Tech.Medical Records TranscribingPharmacy TechnicianOptometric AssistingVision Care TechnologyPhysical Therapist AssistingRespiratory CareRespiratory Care TechnicianHealth Care ManagementNursing
LPNCosmetology
EMT CourseCorrections BasicLaw Enforcement Basic
Dental Asst.Dental HygieneDental Lab Tech.ParamedicOTAEMS ManagementRadiographySonographyRespiratory Therapy Tech.Nursing
Dental AssistingDental HygieneElectrocardiograph Tech.Paramedic
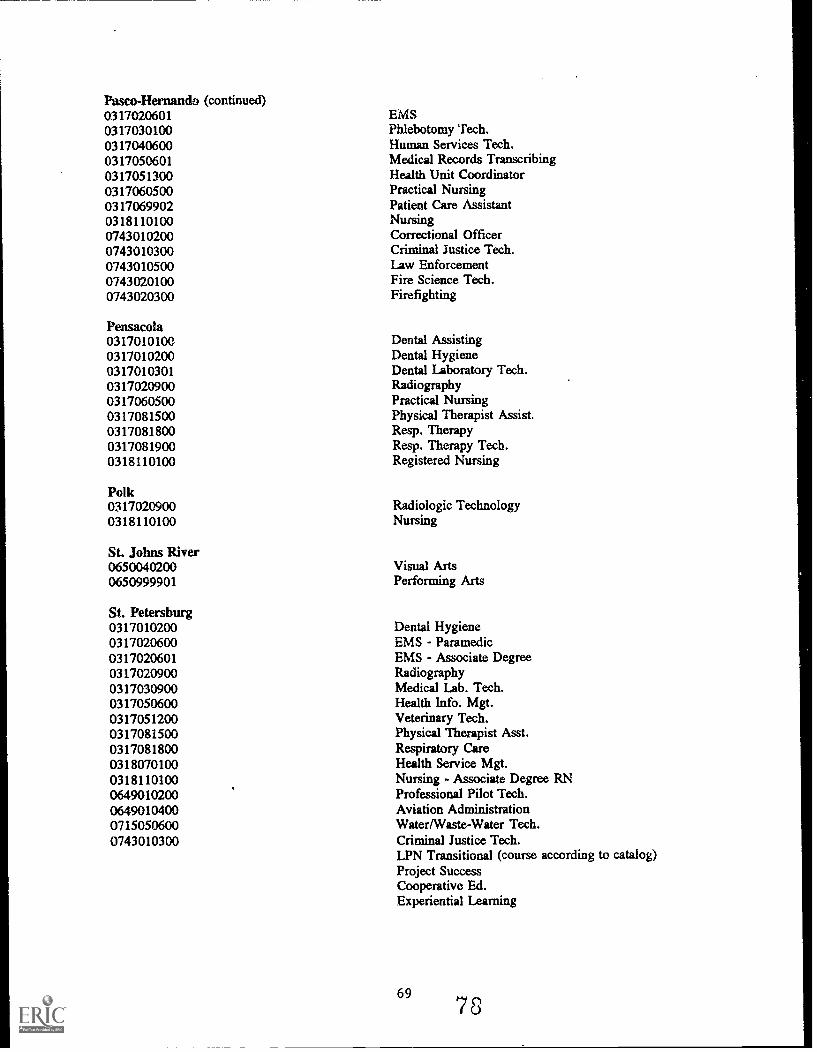
Pasco-Hernando (continued)0317020601 EMS0317030100 Phlebotomy Tech.0317040600 Human Services Tech.0317050601 Medical Records Transcribing0317051300 Health Unit Coordinator0317060500 Practical Nursing0317069902 Patient Care Assistant0318110100 Nursing0743010200 Correctional Officer0743010300 Criminal Justice Tech.0743010500 Law Enforcement0743020100 Fire Science Tech.0743020300 Firefighting
Pensacola0317010100 Dental Assisting0317010200 Dental Hygiene0317010301 Dental Laboratory Tech.0317020900 Radiography0317060500 Practical Nursing0317081500 Physical Therapist Assist.0317081800 Resp. Therapy0317081900 Resp. Therapy Tech.0318110100 Registered Nursing
Polk03170209000318110100
St. Johns River06500402000650999901
Radio logic TechnologyNursing
Visual ArtsPerforming Arts
St. Petersburg0317010200 Dental Hygiene0317020600 EMS - Paramedic0317020601 EMS - Associate Degree0317020900 Radiography0317030900 Medical Lab. Tech.0317050600 Health Info. Mgt.0317051200 Veterinary Tech.0317081500 Physical Therapist Asst.0317081800 Respiratory Care0318070100 Health Service Mgt.0318110100 Nursing - Associate Degree RN0649010200 Professional Pilot Tech.0649010400 Aviation Administration0715050600 Water/Waste-Water Tech.0743010300 Criminal Justice Tech.
LPN Transitional (course according to catalog)Project SuccessCooperative Ed.Experiential Learning
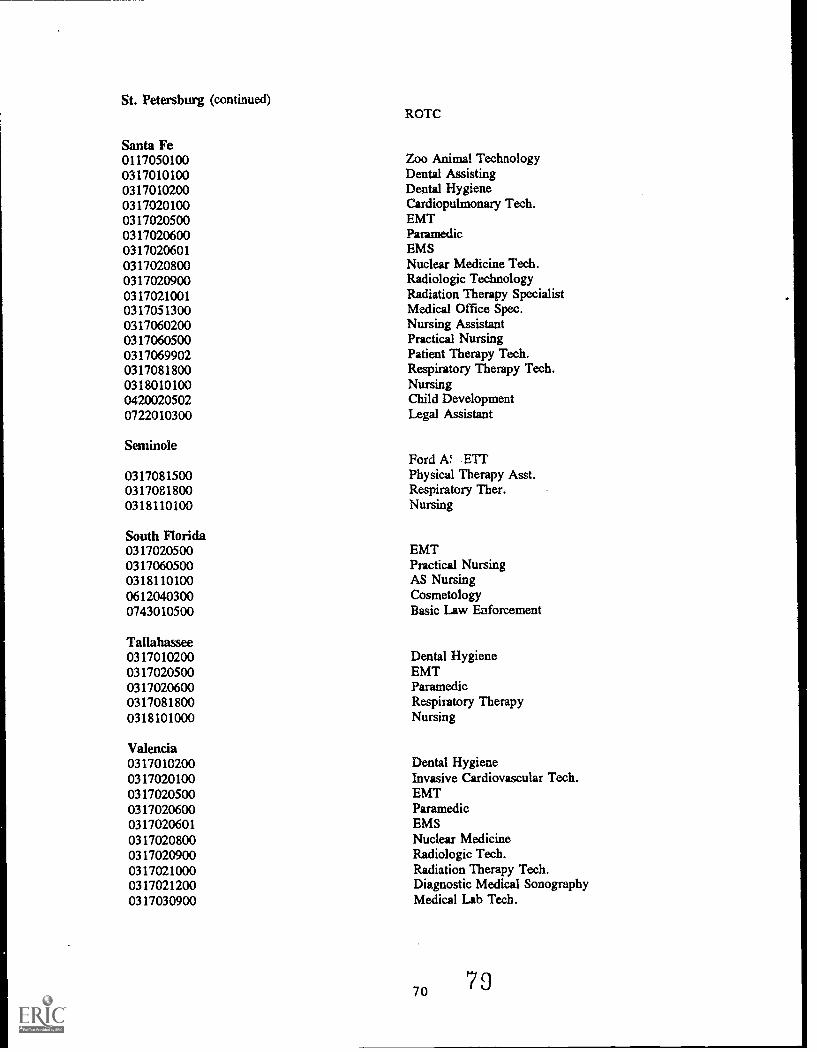
St. Petersburg (continued)ROTC
Santa Fe0117050100 Zoo Animal Technology0317010100 Dental Assisting0317010200 Dental Hygiene0317020100 Cardiopulmonary Tech.0317020500 EMT0317020600 Paramedic0317020601 EMS0317020800 Nuclear Medicine Tech.0317020900 Radio logic Technology0317021001 Radiation Therapy Specialist0317051300 Medical Office Spec.0317060200 Nursing Assistant0317060500 Practical Nursing0317069902 Patient Therapy Tech.0317081800 Respiratory Therapy Tech.0318010100 Nursing0420020502 Child Development0722010300 Legal Assistant
SeminoleFord A` ETT
0317081500 Physical Therapy Asst.0317081800 Respiratory Ther.0318110100 Nursing
South Florida0317020500 EMT0317060500 Practical Nursing0318110100 AS Nursing0612040300 Cosmetology0743010500 Basic Law Enforcement
Tallahassee0317010200 Dental Hygiene0317020500 EMT0317020600 Paramedic0317081800 Respiratory Therapy0318101000 Nursing
Valencia0317010200 Dental Hygiene0317020100 Invasive Cardiovascular Tech.0317020500 EMT0317020600 Paramedic0317020601 EMS0317020800 Nuclear Medicine0317020900 Radiologic Tech.0317021000 Radiation Therapy Tech.0317021200 Diagnostic Medical Sonography0317030900 Medical Lab Tech.
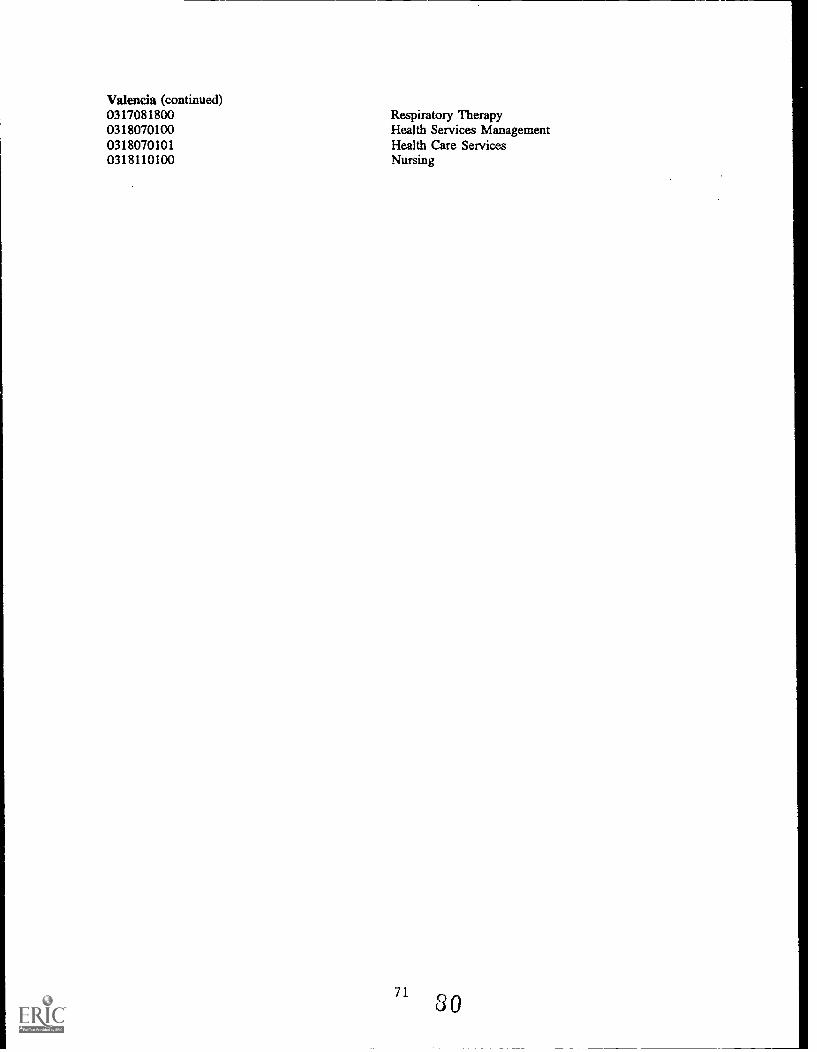
Valencia (continued)0317081800 Respiratory Therapy0318070100 Health Services Management0318070101 Health Care Services0318110100 Nursing
ARTICULATION ACCOUNTABILITY MEASURE 4.3
The number of community college associate in arts degree transfers, native universitystudents, and other transfers who applied for, were admitted and enrolled in identifiedlimited access programs.
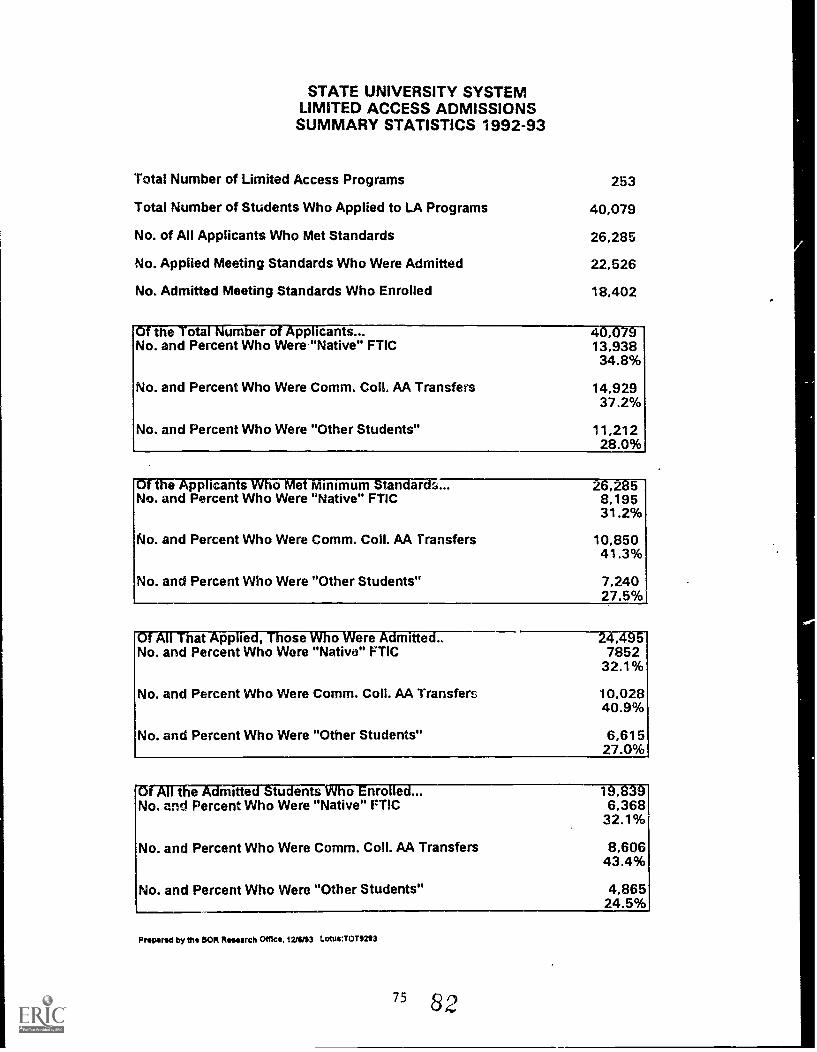
STATE UNIVERSITY SYSTEMLIMITED ACCESS ADMISSIONSSUMMARY STATISTICS 1992-93
Total Number of Limited Access Programs
Total Number of Students Who Applied to LA Programs
No. of All Applicants Who Met Standards
No. Applied Meeting Standards Who Were Admitted
No. Admitted Meeting Standards Who Enrolled
253
40,079
26,285
22,526
18,402
t e ota um er o 'pp 'cants... 41,f13,93834.8%
No. and Percent Who Were "Native" FTIC
No. and Percent Who Were Comm. Coll. AA Transfers
No. and Percent Who Were "Other Students"
14,92937.2%
11,21228.0%
e pp 'cants I I I et inimum tan areNo. and Percent Who Were "Native" FTIC
No. and Percent Who Were Comm. Coil. AA Transfers
No. and Percent Who Were "Other Students"
2-672ar8,19531.2%
10,85041.3%
7,24027.5%
at pp ye , ose Isere mineNo. and Percent Who Were "Native" FTIC
No. and Percent Who Were Comm. Coll. AA Transfers
No. and Percent Who Were "Other Students"
24,495785232.1%
10,02840.9%
6,61527.0%
e mate tu ents " o nro e 1 ,No. and Percent Who Were "Native" FTIC 6,368
32.1%
No. and Percent Who Were Comm. Coll. AA Transfers
No. and Percent Who Were "Other Students"
8,60643.4%
4,86524.5%
Prepared by the BOR Research Office, 12K/S3 Lotus:TOT12t3
" 82
OBJECTIVE 5.0
TO PROVIDE QUALITY EDUCATION THAT PREPARES STUDENT FOR THEIR CHOSEN CAREER WITHIN
THE PARAMETERS OF 60 CREDIT HOURS FOR AN ASSOCIATE IN ARTS DEGREE AND 120 HOURSFOR A BACCALAUREATE DEGREE.
ARTICULATION ACCOUNTABILITY MEASURE 5.14111MIP
The number of credit hours to earn an associate in arts degree in the Community CollegeSystem.
The original measure included the number of credit hours to earn an associate in arts degree bycommunity college and university. The data are only available for community colleges and onlyin aggregate form.
8377
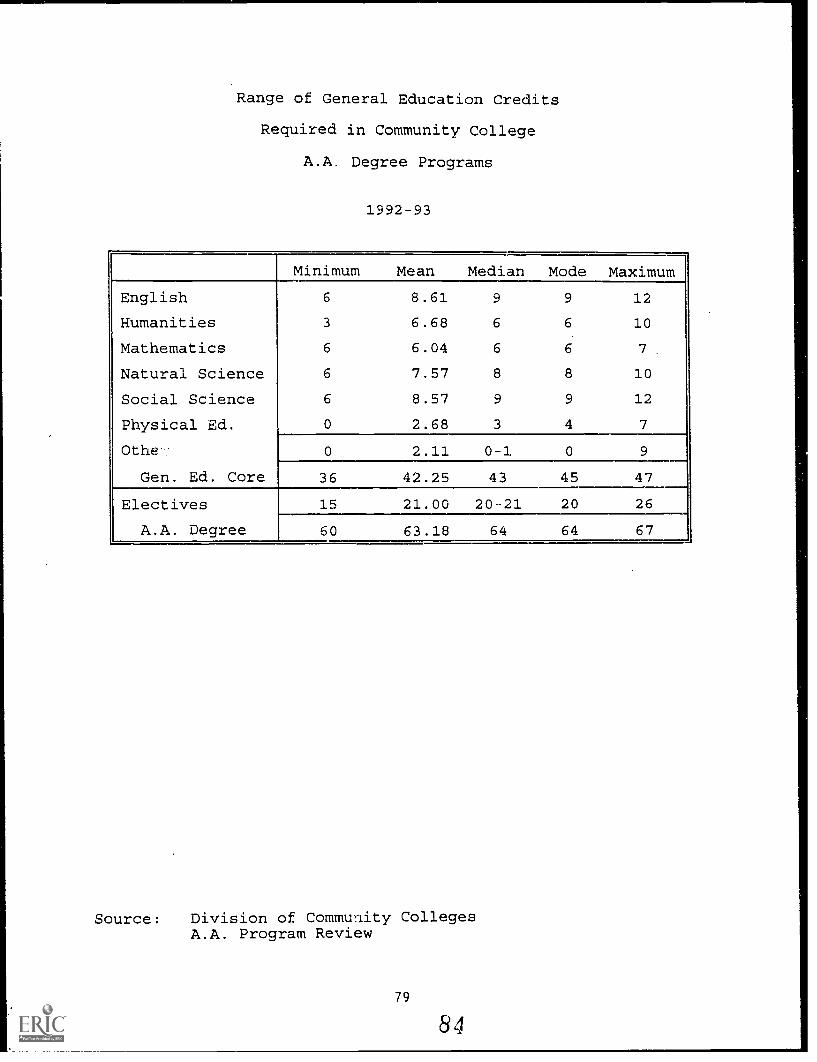
Range of General Education Credits
Required in Community College
A.A. Degree Programs
1992-93
Minimum Mean Median Mode Maximum
English 6 8.61 9 9 12
Humanities 3 6.68 6 6 10
Mathematics 6 6.04 6 6 7 .
Natural Science 6 7.57 8 8 10
Social Science 6 8.57 9 9 12
Physical Ed. 0 2.68 3 4 7
Othe.: 0 2.11 0-1 0 9
Gen. Ed. Core 36 42.25 43 45 47
Electives 15 21.00 20-21 20 26
A.A. Degree 60 63.18 64 64 67
Source: Division of Community CollegesA.A. Program Review
79
ARTICULATION ACCOUNTABILITY MEASURE 5.2
The number of credit hours to earn a baccalaureate degree by program, by university.
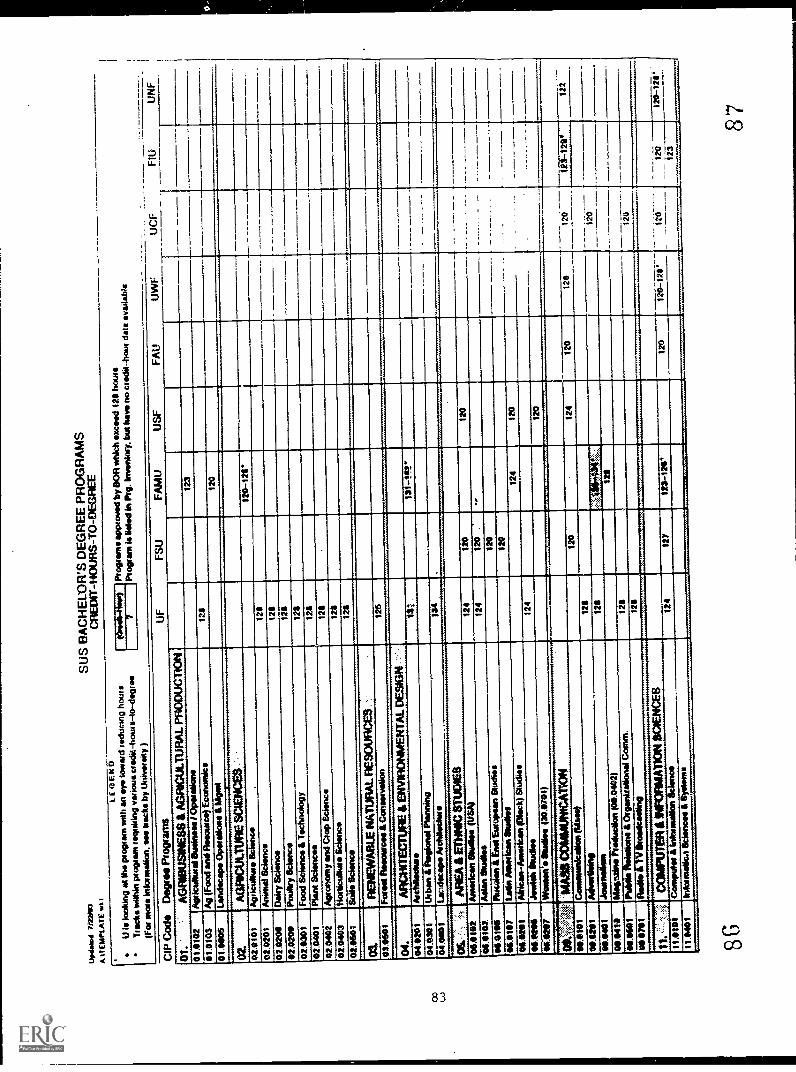
Upd
ated
,t22
01K
1A
VI
EM
PLA
T E
wit
LE
GE
ND
U is
kic
king
at i
s pr
ogra
m w
ith a
n ey
eto
war
d (e
duci
ng h
ow.
Tra
cks
with
in m
omen
t rog
uein
g ve
nous
cred
it -
hour
s -l
o- d
egre
e
(Fat
IM
MO
info
rmat
ion.
see
bac
k* b
yM
inna
sky
)
SUS
BA
CH
EL
OR
'S D
EG
RE
E P
RO
GR
AM
SC
RE
DIT
-HO
UR
S-T
O-D
EG
RE
E
tOrs
er84
1440
)Pr
ows/
se a
ppro
ved
by B
OA
whi
ch e
xcee
d 12
1 ho
me
7Pr
ogra
m I
. Wed
in P
ro. I
nven
tory
. but
haw
no
cred
it-ho
ur d
ale
evai
lab1
e
OP
Cod
s D
egre
e Pr
ogra
ms
OF
FSU
F A
MU
USF
FAU
UW
F
01.
GR
IOlit
liiiii
i AG
RIC
UL
TU
RA
L P
RO
DU
CT
ION
01.0
102
Aos
icul
lund
lise
inoe
s / O
pera
tions
123
01.0
105
Ag
(Foo
d en
dR
OS
OU
NC
OE
cono
mic
s12
1
01.0
006
Lan
dsca
pe O
pers
licat
e &
Moi
st12
0.-
02.
muv
uutin
e SC
IEN
CE
S --
02.0
101
Agr
icul
ture
Sci
ence
120-
121*
02.0
201
APA
IIIM
ID S
cien
ce12
1
02.0
201
Dai
ry S
cien
ce12
8
02.0
n0Po
utby
Sci
ence
128
02.0
301
Food
Sci
ence
a T
echn
olog
y12
8
02.0
401
Plan
t Sci
ence
s12
1
....-
02.0
402
Agr
onom
y sa
d C
rop
Scie
nce
121
.
02.0
403
Hor
ticul
ture
Sci
ence
128
02.0
601
Soils
Sci
ence
128
02.
03.0
601
HI
NE
WA
KE
um
utuc
ries
ounc
m ..
:,Fo
rme
Rse
wer
ces
&C
onse
rvat
ion
126
-...,
...--
m.
--'1
1...
.,
04.
AR
OR
ITE
CT
UIR
E ..
EN
VIR
ON
ME
NT
AL
DE
SIG
N
.
04.0
201
isch
ilece
me
131-
1.1t
1"
04.0
300
Urb
an &
Reo
lone
l Ple
nnin
g
6400
01tu
lece
per
Aid
okso
we
011.
.-:-
.:'..
..,;i:
AR
EA
I E
TH
NIC
ST
UD
IES
06.0
102
124
120
120
06.0
106
120
.
06.0
106
.7ri
T .
.12
0
11.0
107
111.
0101
Ulla
AII
MP(
1011
01 S
tudi
es12
0
Ppie
ra-l
med
eas
Illie
ck S
tudi
es12
412
0
11.1
2111
Jow
ls&
Stu
dios
124
06.0
217
Wom
en a
Ood
les
(30.
1701
)--
....
120
.M
AU
CO
MM
UN
ICA
TIO
N1.
...12
0
10.0
101
Con
witu
nica
tion
Mes
e)12
012
412
012
612
8-12
114
In
00.1
101
128
120
1110
411
Joir
ousl
isra
128
WO
D 0
410
Mso
n281
0 Pr
o/m
oon
'00.
0402
)
011.
0601
OD
070
1
PM/is
& O
roar
ketio
nel C
orm
.R
adio
eari
ceel
ini
120
11..:
`: '
'C
OM
PUT
ER
& I
NFO
RM
AT
ION
SCIE
NC
ES
......
......
.e.e
......
.
120
-I11
.010
1C
aesu
ra &
into
rmat
ion
124
127
123-
121°
120
120-
128'
120
fii-
Tgt
11.1
401
into
tinel
ko &
emce
e &
Sys
iern
s_-
_1-1
111
123
..
8687
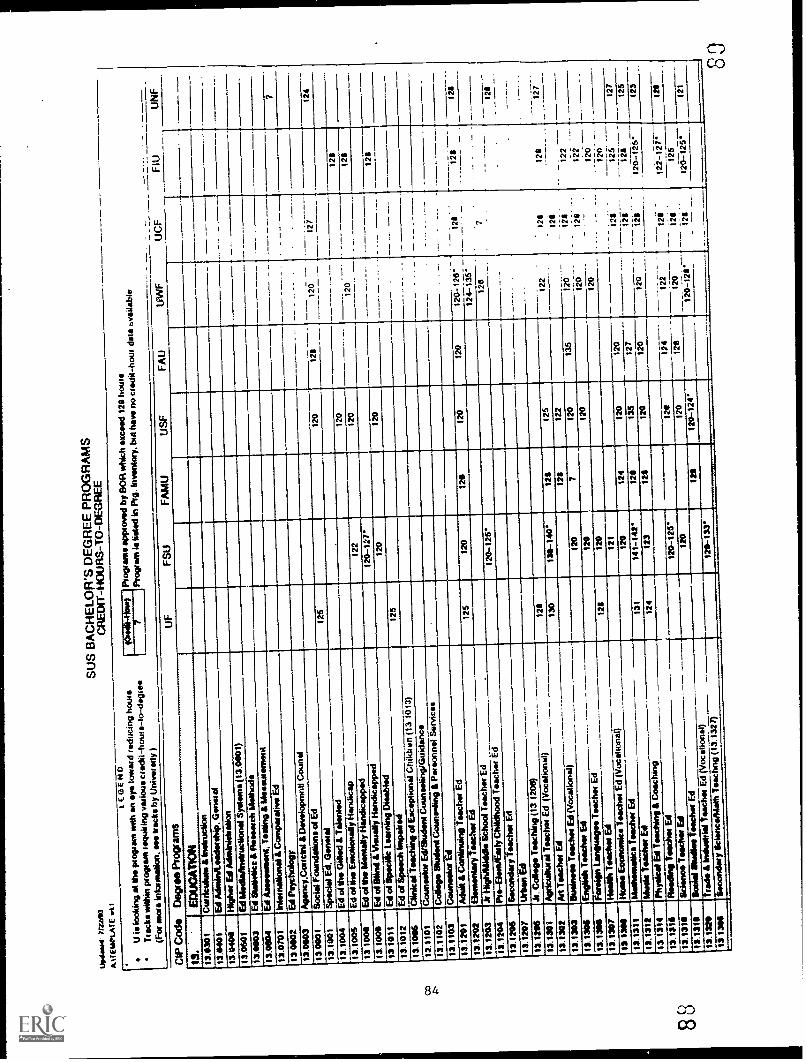
UpA
ahm
l ?M
AIO
EM
PtA
TE
I
LEG
EN
DU
is k
icki
ng e
l Oho
pro
gram
with
an
eye
tow
ard
redu
cing
hou
rs
Tra
cks
with
in p
rogr
am s
mirk
ing
vario
us a
uxin
-hou
rs-t
o-do
ves
(For
111
b011
1 it1
$0,1
1111
010f
1. O
Wtr
acks
by
Uni
vers
ity )
SU
S B
AC
HE
LOR
'S D
EG
RE
EP
RO
GR
AM
SC
RE
D1T
-HO
UR
S-T
O-D
EG
RE
E
Pro
gram
s ap
prov
ed b
y 13
011
whi
ch e
xcee
d12
8 ho
urs
Pro
gram
le li
sted
in P
ig. I
nver
gory
.bu
t hav
e no
cro
dit-
hour
dat
a ev
aila
ble
CIP
Cod
e D
egre
e P
rogr
ams
OF
FS
UF
AM
UU
SF
FA
UW
FFIU
13.
ED
UC
AT
ION
13.1
1301
Cur
ricul
um &
kis
truc
lIon
_
13.1
1401
Ed
Adm
iaiL
eMer
dip.
Gon
ad13
.040
0M
ahar
Ed
Aits
bink
tkag
on
13.0
601
Ed
Med
iarI
ndru
clio
nal S
yste
me
(13.
0001
)
13.0
003
13.0
004
Ed
Mai
reke
0 R
esea
rch
Mah
ods
Ed
Ass
essm
ent.
Too
ling
&M
easu
rem
en1
13.0
701
War
ta Il
ona
& C
ompa
rativ
e E
d
---
- --
.. _
127
13.0
002
Ed
Psy
chol
ogy
13.0
003
Age
ncy.
Con
clill
&D
evel
opnw
HIC
oune
l12
013
.000
1S
ocia
l Fou
ndat
ions
of E
d
13.1
001
Spe
cial
Ed.
Ger
iesa
l12
512
012
112
4
13.1
004
Ed
of d
m G
AM
& T
alen
ted
.
13.1
005
Ed
of th
e E
moS
iona
lly H
andi
cap
120
120
1211
13 1
000
Ed
ol O
ho M
enta
lly H
andi
capp
ed12
212
012
8
13.1
001
Ed
o4 B
lind
& V
isua
lly H
andi
capp
ed12
0 -1
27
13 1
011
Ed
of S
poci
fic L
earn
ing
Dis
able
d12
012
012
8
13.1
012
Ed
of S
peec
h Im
paire
d12
5
13.1
016
Clin
ical
Tea
diin
g of
Exc
eptio
nalC
hikh
on (
13 1
013)
13.1
101
Cou
nsel
or E
d/S
tudi
en! C
omes
ting/
Gui
danc
--12
1
7
'
QS
128
.
121
"
126
128
121
121
-128 12
8
124
13.1
102
Col
lege
Stu
dent
Cou
neoh
ng &
Per
sonn
el S
ervi
ces
.r
-
13.1
103
Cou
nsel
or E
d
13.1
201
Adu
lt &
CoM
inui
ng T
omb*
, Ed
- --
-12
1_
'_
_ __
___
120 .
-122
__
122
120
120
125
128
13.1
202
Ber
mos
lary
Tea
cher
Ed
125
120
120
120
120
'12
0-12
6'12
1
13.1
203
.k H
igh&
Akk
lla S
choo
l Im
am E
d.
124-
135'
_ . _12
8_
_ _
____. _
.. _
__
--liT
-'
13.1
204
Pre
-Ela
rafE
ady
Chi
ldho
od T
oach
mE
d12
0-12
5'12
0
l& 1
206
I--
13.1
207
Sec
onda
ry U
mbe
r E
dlif
toff
Ed
206
13.1
206
k. C
oleg
e T
each
ing
(13
1206
)
13.1
301
Agr
icul
tura
l Tea
cher
Ed
(Voc
atio
nal)
128
13.1
302
An
Tea
cher
Ed
--13
013
11-1
40*
126
125
122
13.1
303
Wai
mea
Tea
cher
Ed
(Voc
ahon
ol)
120
122
12.1
306
Eng
lish
Tea
cins
Ed
120
712
013
512
0
13.1
300
Far
aign
Lan
guag
es T
each
erE
d12
012
012
0
13.1
307
Hee
* 'N
acho
Ed
121
120
r12
0
13 1
2011
Hal
m E
rman
tics
leac
her
Ed
(Voc
atio
nal)
Mal
honw
eice
imam
Ed
121
120
124
120
120
13.1
311
127
13.1
312
Mus
k m
oles
t Ed
131
141-
142
1211
135
127
125
13 1
314
Ph
Ed
Tea
chin
g &
Coa
chin
g12
412
312
812
012
012
0- -1
2 0:
- T
2S12
3
13.1
316
Ree
ding
Tea
cher
EA
122
120
112
2-12
r
13.1
311
Sam
ar T
each
er E
dlo
ofa
Ood
les
eerii
rm E
d
120-
125
120
124
12i-
13.1
311
120
120
120
125
120-
125'
13.1
320
rade
& In
erra
fiel T
each
erE
d (V
ocat
iona
l)12
112
0-12
4*12
0-12
812
1
13 1
366
Sec
onda
ry S
clon
ceni
alh
Toa
chng
(13.
1327
)12
0-13
3*
BO
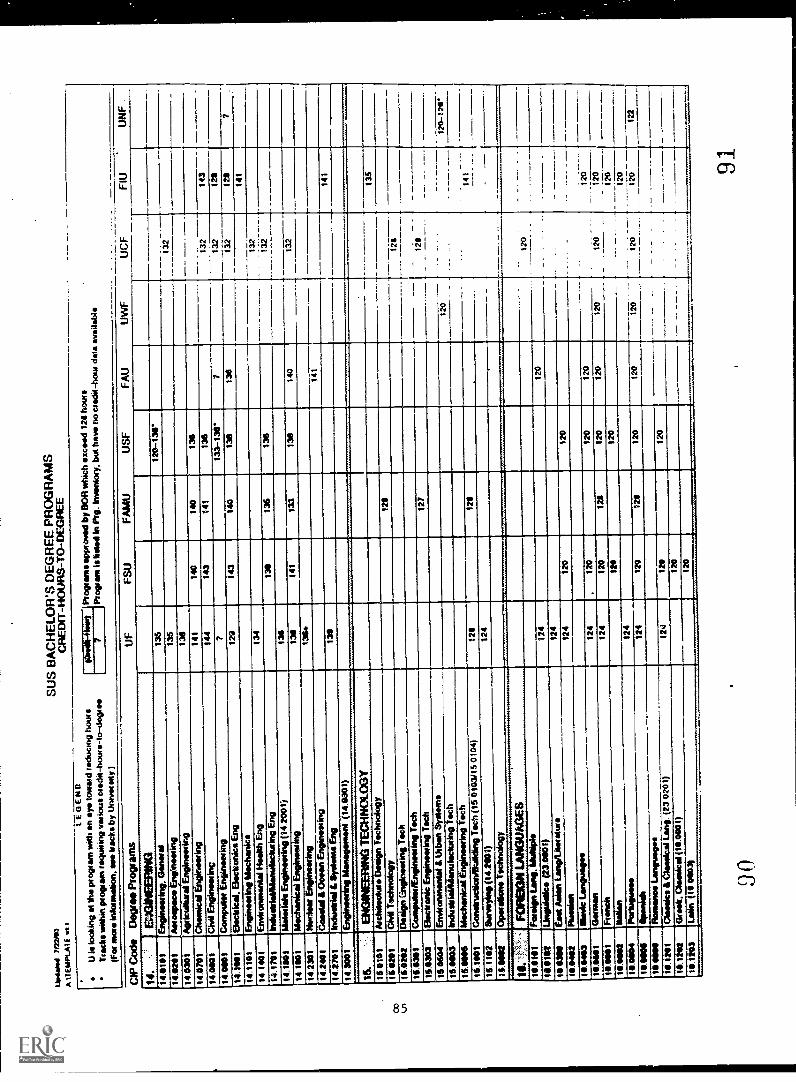
Geo
loN
4 7/
2201
0A
VIE
MP
LAI E
LEG
EN
D--
U le
look
ing
M e
ta p
rogr
am w
ith a
n ey
e to
war
d (m
imin
gbo
ws
Tra
cks
with
in p
rogr
am r
equi
ring
vario
us m
odel
-hew
e-t
o-do
w e
a(F
or m
ore
inio
nnal
ion.
see
bac
ks b
y U
nive
rsity
)
SU
S B
AC
HE
LOR
'S D
EG
RE
E P
RO
GR
AM
SC
RE
DIT
-HO
UR
S-T
o-D
EG
RE
E
Pro
gram
s ap
prov
ed b
y 00
ft *t
ech
exce
ed 1
28 h
ours
Pro
gram
Is li
sted
In M
g. I.
..mom
but
haw
no
cred
it-ho
ur d
ata
avai
labl
e
CIP
Cod
e D
egre
e P
rogr
ams
OF
FS
UF
AM
UU
SF
FA
UU
WF
UC
FFIU
14.
EO
GIN
EE
RIN
G14
.010
1E
ngin
eerin
g. G
ram
m/
136
120-
136
14.0
241
Aer
ospa
ce E
men
eerin
g13
513
2
14.0
301
Aw
ricul
luta
l Eng
inee
ring
136
14.0
701
Che
mic
al E
ngin
eerin
g14
114
014
013
0
14.0
601
CM
Eng
iste
atin
e14
414
314
113
813
214
3
14.0
001
Com
pete
Eng
inee
ring
?13
3-13
6'7
132
128
14.1
401
Ele
ctric
al. E
lect
roni
c* E
ng12
314
314
013
013
813
212
1
14.1
101
Eng
inee
ring
Mec
hani
cs14
1
14 1
401
Env
ironm
enta
l lie
eith
Eng
134
132
1 32
wire
sIn
erel
rialiM
enul
eclu
ring
Eng
130
136
14.1
101
Mat
eria
ls E
ngin
eerin
g (1
4.20
01)
138
14.1
1101
Mec
hani
cal E
ngin
eerin
g13
014
113
314
013
2
14.2
301
Mai
m E
ngin
emin
g14
.240
1C
omte
& O
rman
Eng
inee
ring
141
14.2
701
Indv
eria
l & S
elen
e B
ig14
1
14.3
001
Eng
inee
ring
Man
egen
sonl
(14
.030
1)...
..wiV
iao.
Wr
15.
TE
CH
NO
LOG
Y15
010
1A
scha
eram
e D
esig
n T
echn
olog
y43
5
15.1
201
CM
Tec
hnol
ogy
in12
8
128
120
120
120
15.0
202
Des
ign
Ceg
inee
ring
Tec
h15
.030
1C
ompu
ter/
Eng
amer
ing
Tec
h14
.030
3B
ecam
e E
ngin
eerin
g T
ech
127
-.
--_
141
15.0
604
ErM
ionm
ente
l & U
rban
Sye
eme
15.0
3In
dint
rialli
flanu
lacl
utin
g T
ech
120
_12
0-11
2*
15.1
1606
Mec
hank
ai E
ngin
eerin
g T
ech
15.1
401
Com
atec
lionA
taild
ing
Tec
h (1
5 01
03/1
5 01
04)
128
1211
15.1
102
eurw
Ar4
(142
.31)
124
11.1
1111
2O
imot
elki
ll is
chtic
dogy
--...
......
.....
1g."
1:!
......
......
......
......
r.«.
.....-
......
...LA
NG
UA
GE
S-
120
1111
111
For
eign
Imp,
Mul
liple
16.6
101
Ling
uist
ics
(23.
0601
)12
412
0
I503
00E
rtel
"M
an L
ang/
Laer
etur
e12
4
141.
6402
Rum
en12
412
012
0
10.6
03M
IMIC
Lan
guag
es
1111
541
(lam
est
124
.12
612
012
0
1011
461
Fre
nch
124
120
121
120
120
120
120
_ . _ 12
0
16.4
402
Men
124
120
10.0
004
Por
luip
me
124
120
16.0
006
4ra*
124
120
128
120
120
120
120
122
IS M
NflO
NN
NO
S L
angu
mpe
s
10.1
201
Med
ea li
ttelli
Cal
Lan
g. (
23 0
201)
124
120
120
10.1
262
Gre
ek C
lelle
iCei
(11
1.00
01)
124
10.1
803
lAili
n (I
0 01
104
120
9091
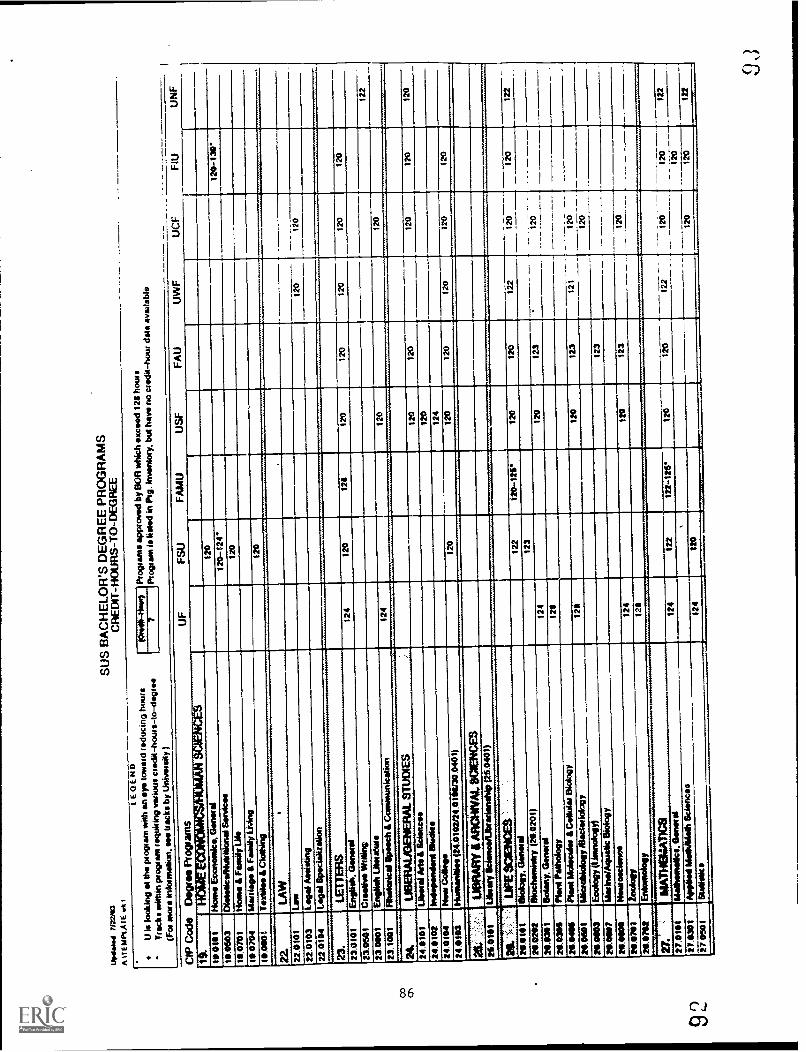
CO
CY
N
9 2.
Upd
aeN
I 712
2/11
0A
%T
EM
PLA
TE
wt I
SU
S B
AC
HE
LOR
'S D
EG
RE
E P
RO
GR
AM
SC
RE
DIT
-HO
UR
S-T
O-D
EG
RE
E
LEG
EN
DU
is S
ootin
g m
the
prog
ram
with
an
eye
tow
ard
redu
cing
hou
rs
Tra
cks
Whi
n pr
ogra
m r
ogue
ing
wor
ious
cted
it-ha
ws-
to-d
tptr
e(F
oe o
w*
Inko
nalio
n. s
ee tr
acks
by
Uni
veis
ity )
',mam
ma
appr
oved
by
BO
B w
hich
exc
eed
121
hour
sP
rogr
am Is
lard
ed in
Pig
. Inv
ento
ry. b
ut h
ave
no c
redi
t-ho
w d
ata
avai
labl
e
CIP
Cod
sse
Pro
gram
sO
FF
SU
EM
UU
SF
FA
UU
WF
UC
FF
IUU
NF
1ly
e , .
..rT
veyt
,L,y
1 'T
yr.1
.2.1
Ivor
. -.
19 0
101
HO
RN
Eco
nom
ics.
Gon
stal
120
1905
03D
isio
ticsi
Nuo
ilios
sel S
ervi
ces
120-
124
120-
139'
10.0
701
Wow
. & F
amily
Lib
120
10 0
704
Mar
riage
&F
arah
, Wag
19.0
601
Tor
nado
& C
loth
ing
120
22.
LAW
22.0
101
Law
22.0
103
Lega
l Mis
ting
120
120
22.0
104
Lega
l Spe
cial
izat
ion
23.
LET
TE
RS
23.0
101
Eng
lish.
Bon
otel
124
120
1211
120
120
120
120
120
23.0
501
CU
MM
INS
lith
iline
23.0
901
Em
pish
Lam
inae
122
23.1
001
Rha
loric
al S
peec
h &
Com
mun
icat
ion
124
120
120
24.
US
ER
ALK
IEN
IER
AL
9Tuo
ms
24.1
1101
Libe
ral A
rts
& S
cien
ces
y12
012
012
012
012
0
24.0
102
Inde
pend
ent a
udio
s12
0
24.0
104
New
Col
lege
124
24.0
103
Hum
mili
so (
24.0
142/
24.0
1161
30.0
401)
120
120
120
120
120
120
264-
LIO
NA
NY
II A
RC
M&
SC
IEN
CE
S26
.010
1M
assy
Icio
nosi
Ubr
aria
notti
p (2
5.04
01)
211.
.5,:.
UP
E e
aBiC
ES
211.
0101
Bio
logy
. Gen
eral
122
120-
126'
120
120
122
120
120
122
26.0
202
Illoc
hoot
hOry
(20
.020
1)12
312
0_
20.0
3111
0a1m
y, G
oose
d12
412
012
3-
26.0
306
Ha4
Pat
holo
gy12
11
26.0
416
Pan
t Mam
mie
s &
Coa
ster
Elic
eogy
120
120
26.0
501
Incr
obio
agy
/Bac
torio
logy
121
120
123
121
26.0
603
Eco
logy
(Li
vano
logy
)
20.0
107
lAse
insl
Agu
rdic
Bio
logy
123
2001
109
Now
asci
enat
26.6
701
124
120
123
120
20.0
792
EM
omol
ogy
129
V.
MA
INM
AT
ICS
120
i20
27.0
101
Mal
lom
Mic
s. G
emm
el12
412
212
2 -1
25*
120
120
122
122
27.0
301
App
lied
14el
hale
lh S
cier
icro
s
-_12
0
27 0
501
lital
isik
s12
412
0-.
... .-
120
120
122
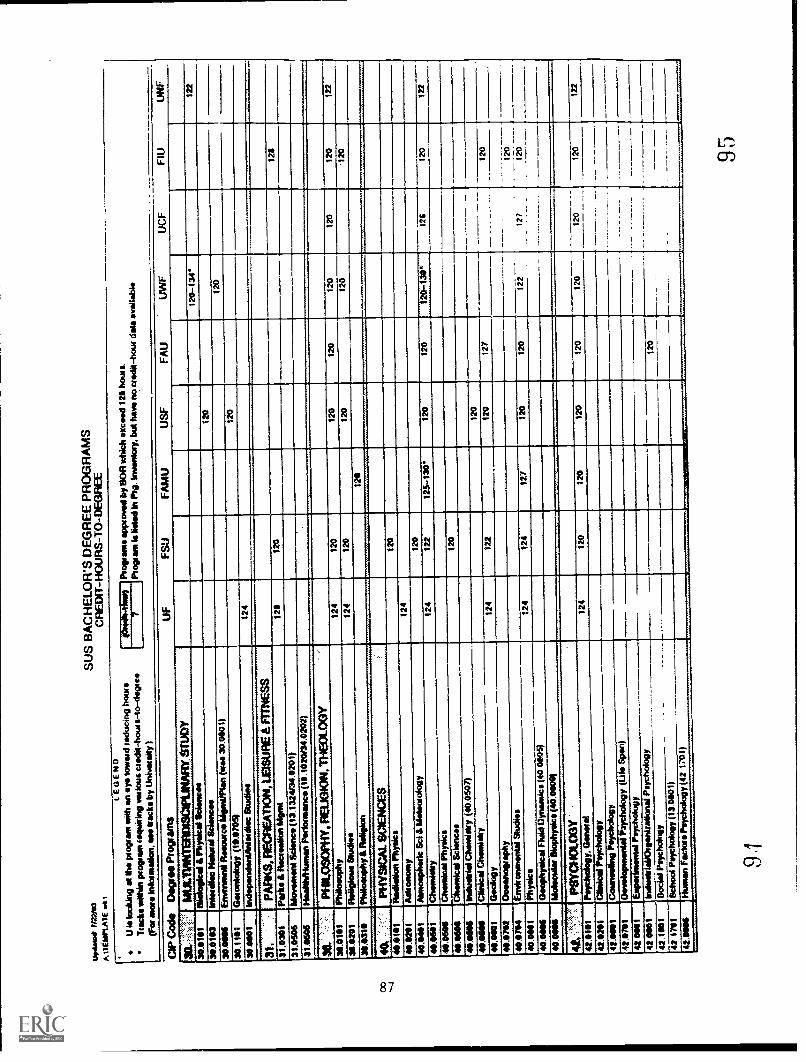
Gpd
alot
T/2
210
A.G
EM
PLA
TE
wil
SUS BACHELOR'S DEGREE PROGRAMS
CREDIT-HOURS-TO-DEGREE
LEG
EN
DU
Is lo
okin
g al
Oho
pio
gram
with
an
eye
low
ard
redu
cing
hour
.
back
s w
ithin
pro
gram
rog
uein
g va
rious
cre
dit-
bout
a-io
-dag
roo
(For
ato
m in
lone
alio
n. a
ss tr
acks
by
Uni
vers
ity)
IPro
tpam
s ap
prov
al b
y B
OR
Mic
h ex
ceed
121
hou
rs.
Pro
gram
le W
ed in
Pig
. Inv
enke
y. b
ut h
ave
no c
redi
t-ho
ur d
ata
evad
able
firs1
1141
010)
7
C1P
Cods Degree Programs
UF
FSU
FAMU
USF
FAU
UWF
UCF
FIU
UHF
acC
4:14
:'-'
muc
twar
rasc
rutu
aySTUDY
30.0
101
.-
& P
hysi
cal S
Cie
nCee
120-
134*
122
311.
0103
InM
ails
o P
iaM
mal
Sci
ence
s12
0
30.0
016
&M
INN
OW
R11
60K
al k
tgw
g/P
lan
(am
30.
0601
)12
0
30.1
1111
Gm
onlo
logy
111
1.07
05)
120
3020
01ki
dope
nden
IAnn
edis
c S
tudi
oe12
4
31.
PA
RK
S. F
IEC
RE
A11
0N, L
EIS
UR
E &
'ME
SS
31.0
301
Par
ks &
Som
alia
n ki
p*12
1112
012
0
31.0
506
Mea
n* S
cien
ce (
13.1
3241
34.0
201)
31.0
606
Hea
lM/H
uman
Poi
lorm
anco
(16
.102
044.
0202
)
PH
ILO
SO
PH
Y. R
ELI
GIO
, . T
HE
OLO
GY
31.0
111
Phi
loso
phy
124
120
120
120
120
120
120
122
31.0
201
124
120
120
120
-120
36.0
310
120
.-
41.1
1111
1
40.1
211
Ast
rono
my
4Mou
phIS
ci&
.oto
Iogy
124
40.0
461
120
40.0
651
Che
mis
try
124
122
125-
130
120
120
120-
130"
126
120
122
46.0
600
Che
mic
al P
hysi
cs46
.160
0C
hom
ical
Sci
ence
s12
0
40.0
1111
1In
dy/M
al C
heas
islry
(40
.050
7)41
.061
11C
linic
al C
hem
isky
120
12 7
411.
1001
Geo
logy
124
122
129
127
120
40.0
702
4O
cean
cepa
phy
120
120
40.0
704
Env
ironm
enla
l Stu
dies
40.0
661
Phy
sics
124
124
127
120
120
122
40.0
06G
eopA
yslc
al F
luid
Dyn
amic
s (4
0.00
05)
40.0
1111
1M
olec
ular
Bio
phys
ics
(40.
0001
1
--.
:.
41..:
'-'.:.
.P
SY
CH
OLO
GY
-
120
42.6
101
Pay
chc4
.4y.
13en
ersd
124
120
120
120
120
120
120
122
42.0
201
MO
W P
erho
logy
42.0
111
Com
nesl
ing
Psy
chol
ogy
_
_.
42.0
711
Dev
elop
mon
lal P
sych
olog
y (U
M S
pan)
42 M
elT
hope
dmen
nal P
sych
olog
y42
1101
Inde
stria
1/0/
gani
zatio
nal P
sych
olog
y42
.111
11S
ocia
l Pry
chol
ogy
120
42 1
701
Sch
ool P
sych
olog
y (1
3.01
01)
42.1
1606
'Hum
an F
acio
rs P
sych
olog
y (4
2 17
01)
-4--
.__
...
9.1
95
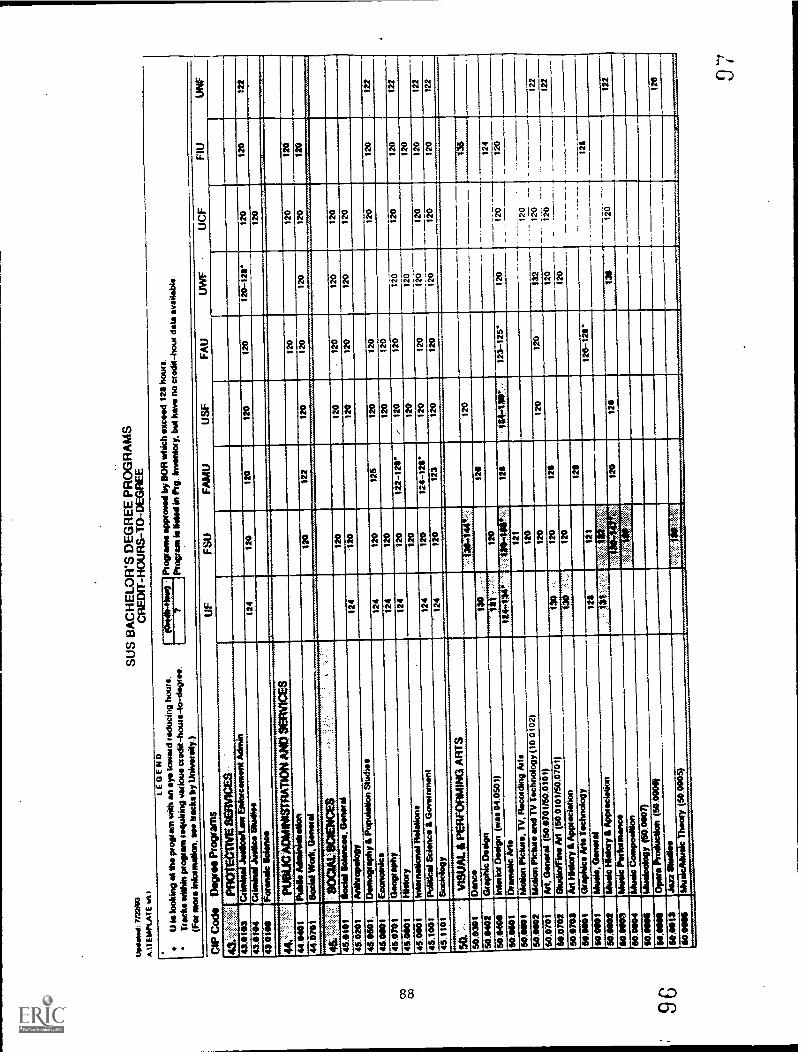
Upd
ated
: 712
2111
13
ALT
EM
PLA
IE IA
SU
S B
AC
HE
LOR
'S D
EG
RE
E P
RO
GR
AM
SC
RE
DIT
-H
OU
RS
-TO
--D
EG
RE
E
LEG
EN
DU
is lo
okin
g ei
t du
prog
ram
with
an
eye
lam
ed m
imin
gho
urs.
Tuc
ks w
iden
pec
epar
n m
quiti
ng m
ime
cced
it-ho
uts-
to-d
agur
e.W
et n
em in
lonn
elbo
n, a
ce b
acks
by
Uni
vers
ity.)
IPlo
gpan
ie a
mow
ed b
y O
M M
ich
*nee
d 12
0 ho
urs
Pro
gtee
n is
/Meg
Ni P
ig. i
nven
tott
but h
aw n
o et
odit-
bout
data
ava
ilabl
o.10
/4.4
114b
ite)
[7
CA
P C
ode
Deg
ree
Pro
gram
sU
FF
SU
FA
MU
US
EF
AU
LNIIF
UC
FF
IUU
NF
4,V
egA
tP
RO
MO
TIV
E S
EM
ME
S -
43.0
103
Grio
nlita
i Jut
ilkni
tim E
nlac
emen
t43
.010
4C
r."
"r-
Sili
i...
124
120
120
120
120
120-
1211
*12
012
012
2
43.0
114
Fat
enei
c S
elen
a12
0
AC
IMIN
IST
RA
PO
N A
ND
SE
RV
ICE
S
44.1
1401
Pub
lie M
tain
lets
allo
n12
012
012
0
44.0
701
Soc
ial W
ait.
Gom
a!12
012
212
012
012
012
012
0
415a
:i44:
:.'4)
CIE
RC
E$
45.0
101
Soc
ial S
eisn
cee.
Gen
eral
120
120
.12
012
012
0
45.0
201
Aril
lwap
olog
y12
4.1
2012
012
012
012
0
45.0
501.
Den
togi
aphy
a P
opul
atio
n &
tidie
s
45.0
1101
Eco
nom
ies
124
120
125
120
120
120
120
122
45.0
701
Gle
ogim
by12
412
012
012
0
45.0
001
His
tory
124
120
122-
1211
'.
120
120
120
120
120
122
45.0
001
kgen
taga
nal R
elal
ione
120
120--
120
120
45.1
001
Poi
llica
l Sci
ence
a G
ovet
nmnt
124
120
174-
120*
120
120
120
120
120
122
45.1
101
Soc
iolo
gy12
4/2
012
312
012
012
012
012
012
2
SO
. ...
'V
ISU
AL
4 P
C-R
fOR
AIN
I1 A
RT
S50
.030
1D
onee
120
,O
s'
50.0
402
Sce
ptic
Des
ign
-rs
-
50.5
4441
Ints
ciac
Om
ega
(was
04.
0501
)12
0*2
0
120
120
120
124
50.5
4101
Ota
ntab
e M
e11
4,14
4*..:
.:1;1
.1:
1144
111p
....-
123-
125
120
120
50.0
1101
Mal
lon
Pfe
lute
, TV
. Rec
ordi
ng A
na12
1
50.0
1102
Mal
ian
Plc
lace
and
7V
Tec
hnol
ogy
(10
0102
)12
0
60.0
701
PA
Gen
inal
(50
.070
1/50
.010
1)12
012
012
011
212
2
50.0
702
9lud
io/F
ine
Pit
(50.
0101
/50.
0701
)13
412
012
012
2
50.0
703
Ad
Hila
ry a
App
ieci
atio
n.
..:12
0in
50.0
1101
acap
hice
Ms
Toc
hnol
ogy
50.0
001
lAtis
ic, f
imin
al12
0 14.:i
a''.
121
EX
EM
E12
0-12
112
1
50.1
1410
2M
usic
dory
a A
ppui
elat
ion
50.1
1003
Mod
e "w
. IM
101/
Nal
.;=i2
1in
aLlin
120
130
120
122
50.0
1104
Mill
ie C
ompo
sibo
n50
.011
110
IMei
calo
gy (
50.0
1107
)
50.1
1001
1O
pm,
-15
0.00
341
so.g
ois
kin
Slu
diee
isea
was -
In
scow
arm
The
ory
(50.
0005
)--
.....
......
-.w
.w.w
......
......
.-- J7
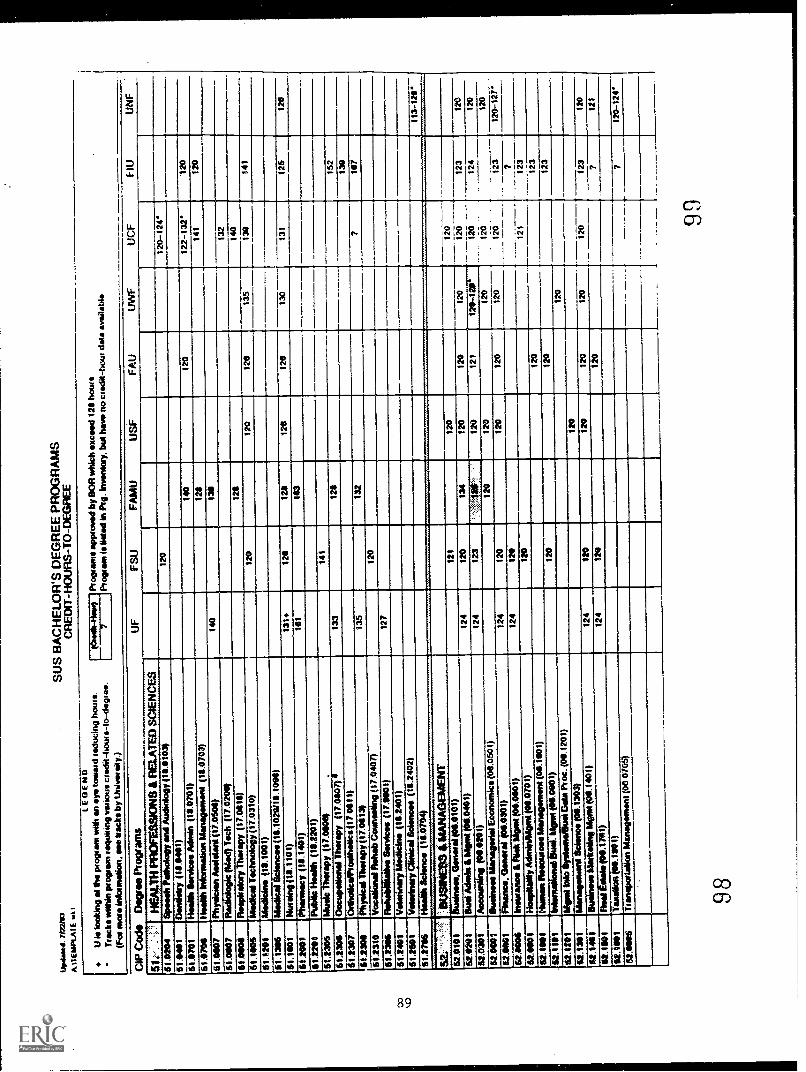
ravl
ara4
. 712
2101
A.1
1EM
PLA
1E w
k I
SUS BACHELOR'S DEGREE PROGRAMS
CREDIT-HOURS-TO-DEGREE
tEci
EN
DW
e lo
okin
g at
the
wow
ed w
ith a
n ay
e to
war
d m
imin
g he
ws.
Tuc
ks M
ein
prog
ram
req
uirin
g od
ious
coe
dit-
hang
-to-
dogm
a.W
oo d
ole
inlo
imal
ion,
see
bac
ks b
y U
niva
c oi
ly)
Pro
gram
s ap
prov
ed b
y B
OR
whi
ch e
xcee
d 12
8 ho
ur s
Pro
gram
is li
ded
in P
ig. I
nven
tory
. but
hav
e no
coo
dit-
hew
dat
a av
aila
ble
CIP Cod
D.orse Ptoiams
UF
FS
UF
AM
UU
SF
FA
UU
WF
UC
FF
IUU
NF
HE
ALI
IIPR
OF
ES
SO
ON
S &
RE
LAT
ED
SC
IEN
CE
S51
.020
4S
peed
s.
.an
d A
udio
logy
116
0103
112
012
0-12
4__
___,
.51
0411
Oen
lieb
y (1
8.04
01)
51.0
701
Rea
l& S
amba
s A
dmit
(10.
0701
)14
012
012
2-13
2'12
0
61.0
7011
Hea
lth In
form
atio
n M
anag
emen
t (11
.070
3)12
$14
112
0
51.0
407
Phy
sici
an A
ssid
ara
(17.
0506
)14
013
0
51.0
007
Rad
holo
vie
(Mod
) T
ech
07.0
20*
132
51.0
0011
Rae
/Mab
ry T
hera
py (
17.0
111)
128
140
51.1
005
Med
ical
Tec
hnoi
ogy
(17.
0310
)12
012
012
013
513
014
1
51.1
201
Med
icin
e (*
11.1
001)
51.1
316
Med
ical
WO
MA
N{
(111
.102
9/ 1
11.1
0M)
51.1
1101
Nur
sing
(11
1.11
01)
131+
120
128
126
126
130
131
125
120
51.2
001
Pha
rmac
y (1
1.14
01)
101
183
11.2
201
Pid
dle
Hea
lth (
11.2
201)
51.1
305
Mus
ic T
hera
py (
17.0
1106
).
141
61.2
301
Occ
upat
iona
l The
rapy
(17
.080
7)13
312
115
2
51.2
307
Odh
olie
s/P
rost
liMis
s (1
7 06
11)
130
61.2
300
Phy
sica
l The
rapy
(17
.011
3)13
513
27
107
51.2
310
Voc
atio
nal r
iatia
b C
cnan
eelin
g (1
7.04
07)
120
51.2
311
Ser
vice
s (1
7.11
901)
127
61.2
401
Ved
orna
ry lA
edsc
ine
(16.
2401
)51
2501
VeS
edne
ry C
linic
al S
cien
ces
(*1.
2402
)--
51.2
716
Hea
l* S
cien
ce (
10.0
764)
113-
128
!.61.
SS
INE
1334
14A
NA
G13
.41E
(T52
0101
&M
mes
. Gen
etal
#16
.010
1)12
112
012
0
52.0
201
----
-lisl
ariaa
Wm
* (0
1040
1)12
412
013
412
012
012
012
0
120
120
120
121
123
120
52.0
301
Am
ount
ing
(010
201)
124
123
,...4
42/V
:-
120
121
121-
1210
124
120
62.0
101
Ihm
oine
se M
anag
eria
l Eco
nom
ics
(00.
0501
)12
012
012
012
3
120
5200
01F
low
sice
. Gen
eral
(06
.030
1)12
412
012
012
0-1
2012
0-12
7*
52.0
006
Inew
anoi
r &
hid
' Mon
tt (0
11.0
10 I)
124
120
1
62.0
1101
Hos
pita
lity
Arb
itin/
Mgm
l (01
.070
1)12
012
3I
52.1
001
12.1
101
--V
dern
adol
tal
Hum
eri R
eeou
rom
Man
agem
ent 1
01.1
100
120
I.12
3
Bud
. lamat
(011
.011
01)
120
120
123
52.1
201
Mim
i L's
ic Il
yste
mel
euei
Dat
a P
roc.
(06
.120
1)12
0
52.1
311
Man
agem
ent S
cien
ce (
00.1
303)
120
120
62.1
461
Ihm
ines
esl
ingMontt
(01.
1401
)12
412
012
012
012
012
312
0
61.1
101
Red
Elid
e(0ains)
124
120
120
712
1
112.
1110
1T
axat
ion
(06.
1101
)
62.6
1105
Tra
nspo
rialio
n M
anag
emen
t (00
070
6)7
120-
124*
-- -
---
-
9998
OBJECTIVE 6.0
TO PROVIDE, WHERE APPROPRIATE, A LOGICAL PROGRESSION AND SEQUENCING OF COURSESTHAT WOULD ALLOW VOCATIONAL CERTIFICATE STUDENTS TO PROGRESS UP A CAREER LADDER
WITHOUT HAVING TO UNNECESSARILY REPEAT COURSES AND WITHOUT OTHER OBSTRUCTIONS.
The five articulation accountability measures listed below were first developed for Objective 6.0.However, data were not available for any of the measures except 6.2 which was eventuallyincluded in measure 3.1 and measure 6.4. (The number of statewide agreements is two.)Therefore, no measures or supporting data were included for this Objective. The Objective wasincluded in the final report because it was a primary objective and not simply a measure forwhich there were no data.
6.1 The number and percent of vocational certificate students articulating to an associate inscience degree program-by-program.
6.2 The number and percent of associate in science degree graduates transferring to a stateuniversity.
6.3 The number of institution-to-institution articulation agreements by pi ogram.
6.4 The number of statewide program-specific articulation agreements.
6.5 The number of students who are assigned credit applicable to associate in science andassociate in arts degree programs transferring from a postsecondary adult vocational program.
ARTICULATION ACCOUNTABILITY MEASURE 7.1
The number of articulation activities (i.e., workshops, mentoring, seminars, faculty-to-faculty sessions, etc.) planned and conducted during the fiscal year by secondary andpostsecondary inqitutions showing which colleges, universities, and schools are meeting.
931 01
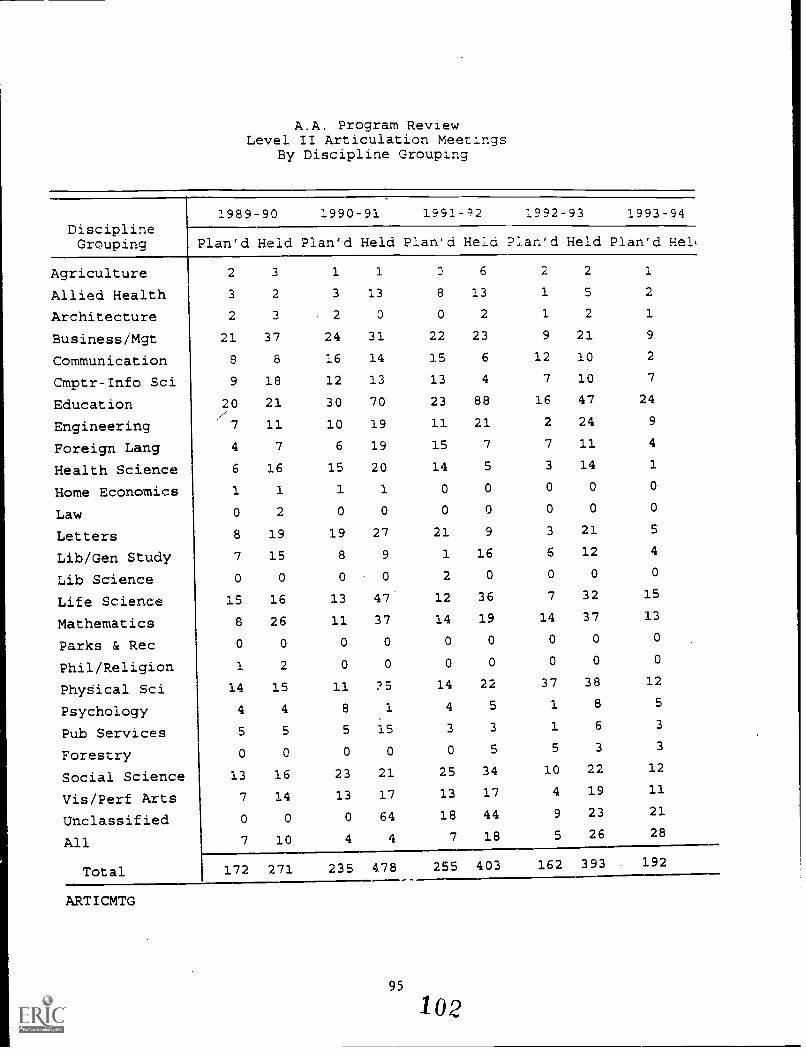
A.A. Program ReviewLevel II Articulation Meetings
By Discipline Grouping
Discipline1989-90 1990-91 1991-?2 1992-93 1993-94
Grouping Plan'd Held Plan'd Held Plan'd Held Plan'd Held Plan'd Het
Agriculture 2 3 1 1 0 6 2 2 1
Allied Health 3 2 3 13 8 13 1 5 2
Architecture 2 3 2 0 0 2 1 2 1
Business/Mgt 21 37 24 31 22 23 9 21 9
Communication 8 8 16 14 15 6 12 10 2
Cmptr-Info Sci 9 18 12 13 13 4 7 10 7
Education 20 21 30 70 23 88 16 47 24/
Engineering 7 11 10 19 11 21 2 24 9
Foreign Lang 4 7 6 19 15 7 7 11 4
Health Science 6 16 15 20 14 5 3 14 1
Home Economics 1 1 1 1 0 0 0 0 0
Law 0 2 0 0 0 0 0 0 0
Letters 8 19 19 27 21 9 3 21 5
Lib/Gen Study 7 15 8 9 1 16 6 12 4
Lib Science 0 0 0 0 2 0 0 0 0
Life Science 15 16 13 47' 12 36 7 32 15
Mathematics 8 26 11 37 14 19 14 37 13
Parks & Rec 0 0 0 0 0 0 0 0 0
Phil/Religion 1 2 0 0 0 0 0 0 0
PhySical Sci 14 15 11 ?5 14 22 37 38 12
Psychology 4 4 8 1 4 5 1 8 5
Pub Services 5 5 5 15 3 3 1 6 3
Forestry 0 0 -, 0 0 0 5 5 3 3
Social Science 13 16 23 21 25 34 10 22 12.
Vis/Perf Arts 7 14 13 17 13 17 4 19 11
Unclassified 0 0 0 64 18 44 9 23 21
All 7 10 4 4 7 18 5 26 28
Total 172 271 235 478 255 403 162 393 192
ARTICMTG
95
102
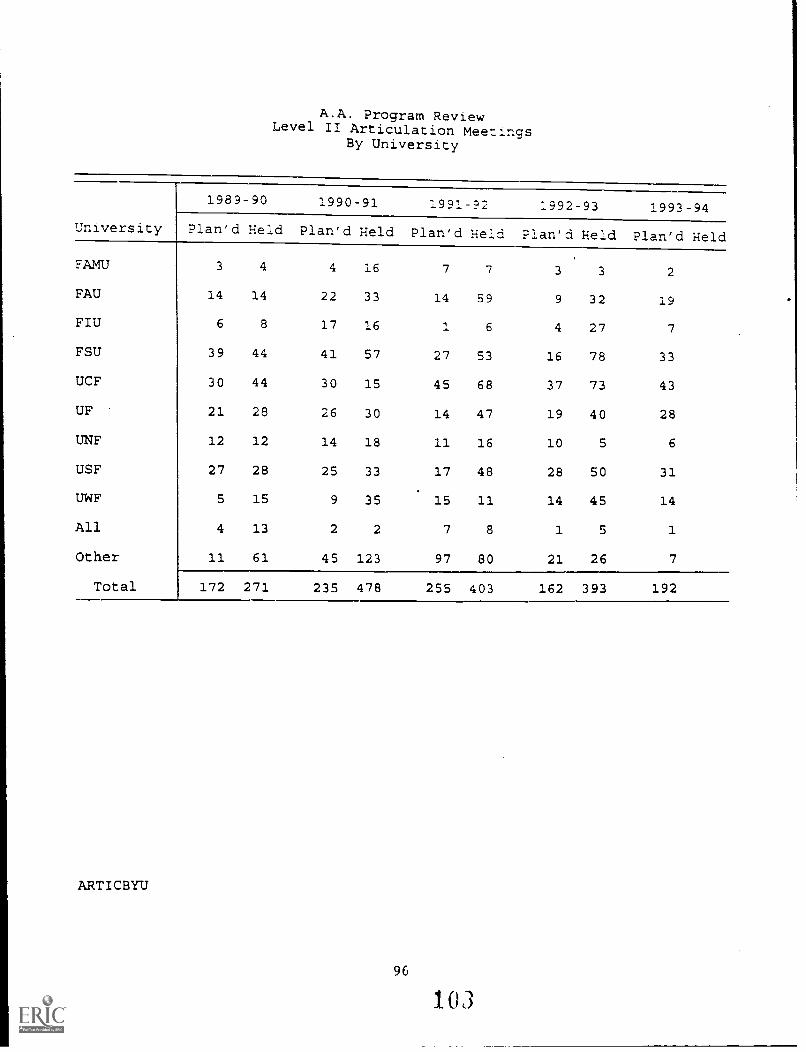
A.A. Program ReviewLevel II Articulation Meetings
By University
1989-90 1990-91 1991 -92 1992-93 1993-94
University Plan'd Held Plan'd Held Plan'd Held Plan'd Held Plan'd Held
FAMU 3 4 4 16 7 7 3 3 2
FAU 14 14 22 33 14 59 9 32 19
FIU 6 8 17 161... 6 4 27 7
FSU 39 44 41 57 27 53 16 78 33
UCF 30 44 30 15 45 68 37 73 43
OF 21 28 26 30 14 47 19 40 28
UNF 12 12 14 18 11 16 10 5 6
USF 27 28 25 33 17 48 28 50 31
UWF 5 15 9 35 15 11 14 45 14
All 4 13 2 2 7 8 1 5 1
Other 11 61 45 123 97 80 21 26 7
Total 172 271 235 478 255 403 162 393 192
ARTICBYU
96
103
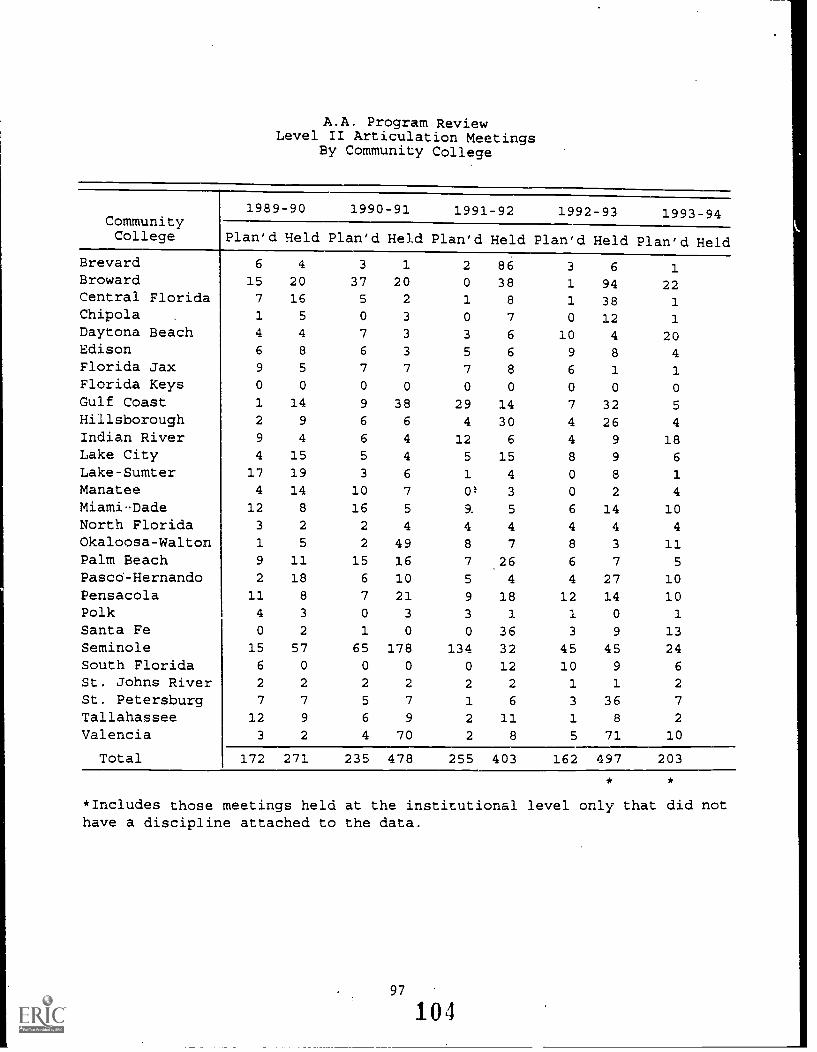
A.A. Program ReviewLevel II Articulation Meetings
By Community College
CommunityCollege
1989-90 1990-91 1991-92 1992-93 1993-94
Plan'd Held Plan'd Held Plan'd Held Plan'd Held Plan'd Held
Brevard 6 4 3 1 2 86 3 6 1Broward 15 20 37 20 0 38 1 94 22Central Florida 7 16 5 2 1 8 1 38 1Chipola 1 5 0 3 0 7 0 12 1
Daytona Beach 4 4 7 3 3 6 10 4 20Edison 6 8 6 3 5 6 9 8 4Florida Jax 9 5 7 7 7 8 6 1 1Florida Keys 0 0 0 0 0 0 0 0 0
Gulf Coast 1 14 9 38 29 14 7 32 5
Hillsborough 2 9 6 6 4 30 4 26 4
Indian River 9 4 6 4 12 6 4 9 18Lake City 4 15 5 4 5 15 8 9 6
Lake-Sumter 17 19 3 6 1 4 0 8 1
Manatee 4 14 10 7 01' 3 0 2 4
Miami-Dade 12 8 16 5 9. 5 6 14 10North Florida 3 2 2 4 4 4 4 4 4
Okaloosa-Walton 1 5 2 49 8 7 8 3 11Palm Beach 9 11 15 16 7 26 6 7 5
Pascd-Hernando 2 18 6 10 5 4 4 27 10Pensacola 11 8 7 21 9 18 12 14 10Polk 4 3 0 3 3 1 1 0 1
Santa Fe 0 2 1 0 0 36 3 9 13Seminole 15 57 65 178 134 32 45 45 24South Florida 6 0 0 0 0 12 10 9 6
St. Johns River 2 2 2 2 2 2 1 1 2
St. Petersburg 7 7 5 7 1 6 3 36 7
Tallahassee 12 9 6 9 2 11 1 8 2
Valencia 3 2 4 70 2 8 5 71 10
Total 172 271 235 478 255 403 162 497 203
*Includes those meetings held at the institutional level only that did nothave a discipline attached to the data.
97
104
TABLES
OBJECTIVE 1.0
TO ADEQUATELY PREPARE SECONDARY STUDENTS SO THEY CAN SMOOTHLY ARTICULATE TO APOSTSECONDARY INSTITUTION WITHOUT OBSTRUCTIONS AS RAPIDLY AS THEIR CIRCUMSTANCES
PERMIT.
To PROVIDE FOR THE ASSESSMENT OF BASIC SKILLS AND THE LEVEL OF KNOWLEDGE WHICHENSURES EDUCATIONAL CONTINUITY AND ADEQUATE PREPAREDNESS OF STUDENTS.
TO DETERMINE THE RELATIONSHIP BETWEEN CLAST AND ARTICULATION. To WHAT EXTENTMAE'S CLAST INFLUENCE THE SMOOTH MOVEMENT OF STUDENTS FROM ONE LEVEL TOANOTHER?
1.1
Articulation Accountability Measures
The number and percent of high school graduates, reported by gender and byracial/ethnic categories, who enter an area vocational center, a public communitycollege, or the State University System.
1.2 The number and percent of first-time-in-college students by gender andracial/ethnic categories who graduated from a Florida public high school in thepreceding year, who do not score above the cut-off scores on the entry levelplacement tests and are referred to college preparatory instruction.
1.3 The number and percent of community college and native university students bygender, race and institution, who took the CLAST exam and passed or failed anyof the four sub-tests on the most recent administration of the CLAST exam.
1.4 The number and percent of an identified cohort group who took the CLAST examand passed or failed any of the four sub-tests on the first administration, secondadministration and third administration.
1.5 The number of CLAST ;:vaivcrs given by college and university.
1.6 The number and percent of students by gender and racial/ethnic categories whoreceived an associate in arts, associate in science, vocational certificate orbaccalaureate degree.
"106
OBJECTIVE 2.0
To PROVIDE ARTICULATED ACCELERATION MECHANISMS THAT ALLOW SECONDARY STUDENTS TO
PROCEED THROUGH THE EDUCATIONAL SYSTEM AS RAPIDLY AS THEIR CIRCUMSTANCES PERMIT.
Articulation Accountability Measures
2.1 The number and percent of secondary students participating in each of thefollowing articulated acceleration programs:
o Advanced Placemento International Baccalaureate
OBJECTIVE 3.0
To FACILITATE THE SMOOTH TRANSFER OF COMMUNITY COLLEGE ASSOCIATE IN ARTS DEGREEGRADUATES TO A STATE UNIVERSITY IN THEIR PREFERRED PROGRAM MAJOR WITHOUTOBSTRUCTIONS DUE TO INADEQUATE COURSE SELECTION, INSUFFICIENT PERFORMANCE, ORADMINISTRATIVE DIFFICULTIES.
Articulation Accountability Measures
3.1 The number of community college associate in arts and "ociate in sciencedegree graduates transferring from each community college each of the ninestate universities by race and gender.
3.2 A comparison of the upper level performance of community college associate inarts degree graduates, with native university students, community collegeassociate in science transfers, and other transfers by:
o mean grade point averageo 3.0 and above GPAo 2.0 and below GPAo percent suspendedo percent graduatedo average number of semester hours per termo average total semester hours to degree
102107
OBJECTIVE 4.0
To PROVIDE ACCESS TO PROGRAMS TO ALL STUDENTS WHO HAVE MET THE PROGRAMPREREQUISITE COURSE REQUIREMENTS AND WHO HAVE EARNED A SATISFACTORY GRADE POINT
AVERAGE. To ONLY LIMIT ACCESS TO PROGRAMS BECAUSE THE MARKETPLACE CANNOTACCOMMODATE THE NUMBERS OF STUDENTS INTERESTED IN ENTERING THE PROGRAM.
Articulation Accountability Measures
4.1 The number and names of limited access programs in the State UniversitySystem, by university.
4.2 The number and names of limited access programs in the Community CollegeSystem, by college.
4.3 The number of community college associate in arts degree transfers, nativeuniversity students, and other transfers who applied for, were admitted or deniedand enrolled in identified limited access programs.
OBJECTIVE 5.0
To PROVIDE QUALITY EDUCATION THAT PREPARES STUDENTS FOR THEIR CHOSEN CAREERWITHIN THE PARAMETERS OF 60 CREDIT HOURS FOR AN ASSOCIATE IN ARTS DEGREE AND 120
HOURS FOR A BACCALAUREATE DEGREE.
Articulation Accountability Measures
5.1 The number of credit hours to earn an associate in arts degree by community
college.
5.2 The number of credit hours to earn a baccalaureate degree by program, by
university.
08
OBJECTIVE 6.0
To PROVIDE, WHERE APPROPRIATE, A LOGICAL PROGRESSION AND SEQUENCING OF COURSESTHAT WOULD ALLOW VOCATIONAL CERTIFICATE STUDENTS TO PROGRESS UP A CAREER LADDER
WITHOUT HAVING TO UNNECESSARILY REPEAT COURSES AND WITHOUT OTHER OBSTRUCTIONS.
No measures - Data were not available for any of the accountability measures for Objective 6.0,except the number of associate in science degree graduates transferring to a state university,which was combined with Measure 3.1.
OBJECTIVE 7.0
To DETERMINE THE RELATIONSHIP BETWEEN ARTICULATION ACCOUNTABILITY MEASURES AND
SYSTEMATIC EFFORTS, PROCESSES AND SERVICES.
Articulation Accountability Measures
7.1 The number of articulation activities (i.e., workshops, mentoring, seminars,faculty-to-faculty sessions, etc.) planned and conducted during the fiscal year bysecondary and postsecondary institutions showing which colleges, universities,and schools are meeting.
104109
,
PLACIONCO" a. amPaarmonwar COP .
EC)UATION
110 BEST COPY AVAILABLE


![DOCUMENT RESUME ED 389 352 JC 950 569 TITLE INSTITUTION ... · DOCUMENT RESUME ED 389 352 JC 950 569 TITLE Annual Report to the Governor, 1994-1995 [and] Statistical Supplement to](https://img.pdfslide.net/doc/110x75/5f1506541cea4037667700fc/document-resume-ed-389-352-jc-950-569-title-institution-document-resume-ed-389.jpg)