Embed Size (px)
Citation preview

ED 385 061
AUTHORTITLE
INSTITUTION
SPONS AGENCY
PUB DATECONTRACTNOTEAVAILABLE FROM
PUB TYPE
EDRS PRICEDESCRIPTORS
IDENTIFIERS
ABSTRACT
DOCUMENT RESUME
EC :504 094
Erickson, Ron; And OthersState Special Education Outcomes: A Report on HowStates Are Assessing Educational Outcomes forStudents with Disabilities, 1994.National Center on Educational Outcomes, Minneapolis,MN.
Special Education Programs (ED/OSERS), Washington,DC.
Mar 95H159C0000439p.Publications Office, NCEO, 350 Elliott Hall, 75 E.River Rd., Minneapolis, MN 55455 ($15).Reports Descriptive (141)
MF01/PCO2 Plus Postage.*Accountability; Administrators; *Disabilities;*Educational Assessment; *Educational Objectives;Educational Policy; Elementary Secondary Education;Evaluation Methods; National Surveys; *Outcomes ofEducation; Program Development; School Districts;Special Education; State Departments of Education;Statewide Planning; *Student Evaluation; StudentParticipation*Goals 2000; National Center on EducationalOutcomes
Results of a 1994 survey of state directors ofspecial education are presented for 47 states, 7 protectorates, andthe District of Columbia. Four major issues were surveyed: theeffects of activities outlined In Goals 2000 on state specialeducation service delivery systems; efforts that states are making todevelop learner goals and related assessments; how broadly theNational Center on Educational Outcomes model of educational outcomesand indicators has been disseminated and used within state and localeducational agencies; and the extent to which students withdisabilities are participating in statewide achievement assessments.Narrative summaries, tables, and figures include information on thestatus of outcomes development and assessment development for eachstate and state policies on learner outcomes and outcomes-relatedassessments. For each state, statewide assessments are listed andtheir purposes are identified as either for student accountability,school or district accountability, or instructional decision-making.The study found that Goals 2000 is seen by most state directors ashaving a positive impact on students with disabilities, that mcitstates have adopted statements of learner goals or outcomes, and thatmost states are developing or reviewing assessment systems designedto measure student progress toward these outcomes. (SW)
*********A******************************************A******************
Reproductions supplied by EDRS are the best that can be made *
from the original document.***********************************************************************

U.S. DEPARTMENT OF EDUCATIONOffice of Educatdanal Research and Improvement
EDUCATIONAL RESOURCES INFORMATIONCENTER (ERIC)
Z ,01Krs. document has been reproduced asthe person or orgamzetion
0 IN,nor changes have been made to mprove'eproduct,on qualdy
Pontsot v.ew or op,mons slated In this doCument do not neCeSsardy represent 01/1C,alOERI posIlden nr poncy
"PERMISSION TO REPRODUCE THIS
MATERIAL HAS BEEN GRANTED BY
TO THE EDUCATIONAL RESOURCES
INFORMATION CENTER (ERIC)
"11()NAI.I..N 1 I l11)1't A 110\,\I()LI( M\11-,-;
A Report on
How States are Assessing
Educational Outcomes
for Students with
.)11C;2;l` dill ,111()11 .110 I ill111,111 11m l'ICTIFICIlt L \ Ill 1lII1I11,-.01,1
2BEST COPY AVAILABLE

19.4 StateSpecial EducationOutcomes
National Centeron Fducational ()utcorne,
Collegc of Education andni-n n Development
L tliver!.-;ity Of NIinne,,ota
oll,11.1ordhon \\.
',LC loud M.Ito 1. \ dMLi
tho svuion,t1 Htcito
-tol- of I dt.h..otioii
A Report on
How States are Assessing
Educational OutcoMes
for Students with Disabilities
BEST CO' AVAILABLE
March 1995
NCEO Core Staff:
Robert H. BruininksJudith L. ElliottRonald N. EricksonPatricia J. GrafstromKevin S. McGrewDorene L. ScottPatricia S. SeppanenMartha L. Thurlow,
assistant directorJames E. Ysseld v ke,
director
The National Center on Educa-tional Outcomes (NCEO) wasestablished in October 1990 towork with state departments ofeducation, national policy-making groups, and oti-iers tofacilitate and enrich the develop-ment and use of indicators ofeducational outcomes forstudents with disabilities. It isbelieved that responsible use ofsuch indicators will enablestudents with disabilities toachieve better results from theireducational experiences. TheCenter represents a collaborativeeffort of the University ofMinnesota, the NationalAssociation of State Directors ofSpecial Education, and St. CloudState University.
The Center is supported througha cooperative agreement with theU.S. Department of Education,Office of Special EducationPrograms (H159C00004).Opinions or points of view donot necessarily represent those ofthe U.S. Department of Educationor Offices within it.
Additional copies of thisreport may be ordered for$15.00. Please write or call:
Publications OfficeNCEO350 Elliott Hall75 E. River RoadMinneapolis. MN 55455612-626-1530

AcknowledgmentsMany people provided input onboth he content and format ofthis 1994 special educationsurvey. NCEO especiallyexpresses its appreciation tothose who devoted their time toanswering the survey quesions.
F
Special thanksgo to:
Office of SpecialEducation Programs,U.S. Department of Education:
Louis DanielsonDavid Malouf
Report Update:
Trish Gra fstrom
State Special Education Outcomes1994 was prepared by Ron Erickson,Martha Thurlow, and Kathryn Thor.

Executive SummaryThis report by the NationalCenter on Educational Outcomes(NCEO) presents the results ofthe fourth annual survey of statedirectors of special education.NCEO sent the survey to direc-tors of all 50 regular states andthe 10 unique states that providespecial education services underthe provisions of the Individualswith Disabilities Education Act.The major findings of the 1994special education survey include:
The majority of state directorsof special education have re-ceived training and/or informa-tion about Coals 201.10, the federalinitiative designed to supportstate and local reform efforts.This information and training hascome from a variety of state andfederal sources.
111 Coals 2000 is seen by moststate directors of special educa-tion as having a positive impacton students with disabilities, andis considered a positive force forincluding students with disabili-ties in statewide reform activities.
IIII Most states have identifiedand adopted statements oflearner goals or outcomes.Assessment systems designed tomeasure student progress towardthese outcomes are currentlyunder development or review inmost states.
II The most prevalent policy inplace to promote the adoption ofstate-ratified learner goals andrelated assessments is onewhereby the state strictly man-dates the adoption of such sys-tems by local districts.
I The NCEO Conceptual Modelof Outcomes and Indicators hasreached a broad audience of statedirectors of special education,and has been used to assist instate-level reform activities.
Information on the participa-tion of students with disabilitiesin statewide assessment pro-grams is still largely inaccessibleor unavailable to most statedirectors of special education.

State Directors of Special Education
ALABAMABill East
KENTUCKY11,1111,10cm
NORTH CAROLINALowell I larris
WISCONSINJuanita Pawlisch
ALASKA LOUISIANA NORTH DAKOTA WYOMING
Myra I Lowe Leon Borne Gary Gronberg Sharon Davarn
ARIZONA MAINE OHIOKathryn Lund David Stockford John Ilerner
AMERICAN SAMOA
ARKANSAS MARYLAND OKLAHOMA Jane French
Diane Sydoriak Richard Steinke John orpolongoBUREAU OF INDIAN
CALIFORNIA MASSACHUSETTS OREGON AFFAIRS
Leo Sandoval Pamela Kaufmann Karen Brazeau Lena Mills
COLORADO MICHIGAN PENNSYLVANIA DISTRICT OF
Fred Smokoski Richard Baldwin Michele Desera COLUMBIAB. Garnett Pinkne,.
CONNECTICUT MINNESOTA RHODE ISLANDTom Gi Hung Wayne Erickson Robert Pry hoda GUAM
DELAWARE MISSISSIPPI SOUTH CAROLINA
Vince Lcon (;uerren,
Martha Brooks Carolyn Black Ora Spann COMMONWEALTHOF THE NORTHERN
FLORIDA MISSOURI SOUTH DAKOTA MARIANA ISLANDS
Bettye kVeir vIelodie l'riedebach Deborah Barnett Barbara Rudy
GEORGIA MONTANA TENNESSEE REPUBLIC OF THE
Paulette Bragg Robert Runkel Joe Fisher MARSHALL ISLANDSKanchi I losia
HAWAII NEBRASKA TEXASMargaret I )onova n Gary Sherman Jill Gray FEDERATED STATES
OF MICRONESIA
IDAHO NEVADA UTAII N'Iakir Keller
Fred lialcom Gloria I)opi Steve KukicPALAU
ILLINOIS NEW HAMPSHIRE VERMONT Peter Elechuus
Gail I .ieberman Nate Norris Dennis KanePUERTO RICO
INDIANA NEW JERSEY VIRGINIA MoralesPaul . \'h Port-mi.,' Gant werk Jo Lynne Demar
U.S. VIRGIN ISLANDS
IOWA NEW MEXICO WASHINGTON Priscilla Stridiron
leanonne I Ligon Diego Gallegos Douglas GillNote: In ,1111. r.ponNr, IN, it1;.1111,-Ivr1 Ir .rn orb, r
KANSAS NEW YORK WEST VIRGINIA ror,onncl
Carol I )ermover Iom Neveld i no Michael Valentine

Table of Contents
Introduction
Part One: Goals 2000: Educate America Act 3
'l able 1 Sources Providing States with Information on Goals 200 4
Figure 1 kVill Gods 2000 Have an Impact' 6
Figure 2 Goals 2000:1 vpc 01 ImpactFigure 3 States' Planning Response to Gods 20(1)
Part Two: State Policies on Learner Outcomes and Related Assessments 9
Table 2 Status on Outcomes and Assessments Development 11
table 3 State Policy on Learner Outcomes 12
Table 4 State Policy on Outcomes-Related Assessments 14
Figure 4 States Using 1: \isting Assessmt. oh; 16
Figure 5 - States Using New Forms of Assessment 16
Part Three: The NCEO Conceptual Model of Outcomes and Indicators . . 17
Figure 6 -States' Level of Awareness of the NCFO Model is
Part Four: Participation of Students with Disabilitiesin Statewide Assessments
I able - Students w ith I )isabilities Participating in .Assessments . 20
Figure 7 Availability of Assessment I )ato on Studentswith Disabilities 22
Conclusion 23
Appendix
migernamesmiiminiuni
Introduction
NCEO's MissionNCEO is a collaborative effortof the National Association ofState Directors of Special Edu-cation (NASDSE), the Univer-sity of Minnesota, and SaintCloud State Unive..sity. Part ofNCEO's mission hat; been tolead the nation in identifyingeducational outcomes forstudents with disabilities and todevelop possible indicators thatcould be used to monitor thoseimportant outcomes.
The Center works with nationalpolicTnaking groups, statedepartments of education, andother groups and individuals topromote national discussion ofeducational goals and indicatorsthat include students with dis-abilities. To accomplish this,NCE.0 has four major goals:
Goal 1 .1-o promote the devel-opment of a system of indica-tors for use with all students,including those with disabili-ties.
Goal 2 To support and enhancethe measurement of educa-tional outcomes and indica-tors for students withdisabilities.
Goal 3 To enhance the avail-ability and use of outcomesinformation in decisionmaking at the federal and statelevels.
Goal 4 To identify and developindicators that can be used to
make judgments about theextent to which educationworks for students with dis-abilities, and that can be usedto improve programs andservices.
The Center undertakes manyactivities to accomplish thesegoals. In addition to the statesurvey, the Center examines andanalyzes existing national andstate data that could provideinformation on outcomes forstudents with disabilities. Itworks with other groups andorganizations (such as the Na-tional Center for EducationStatistics) to address issuesrelated to current national andstatewide assessment efforts.And it has developed a concep-tual model of outcomes andindicators through a collabora-tive effort involving state andnational agencies, parents, andprofessionals.
About the State SurveyNCEO produced its first reporton state special education out-collies in ittle did anyonerealize the incredible magnitudeof educational Morin efforts thatwould soon follow, both locallyand nationally. Virtually everystate has become invol%ed insome type of educational reformmovement. States have placedmuch attention on establishinglearner goals and accompanyingassessment systems capable of
measuring these goals. Federalefforts have included those of:
ill the National Education GoalsPanel monitoring progresstoward eight national educationgoals;
various standards-settinggroups producing world-classstandards in numerous curricularareas; and
N Congress passing Goals 2000:Educate America Act.
The federal legislation has stimu-lated and supported a variety ofstate-level activities that fosterquality educational opportunitiesfor all students. Consequently,education is undergoing rapidchange and reform.
The question now is, I low doesspecial education participate inthis movement?
NCEO offers some preliminaryanswers to this question in itsState Special Education Outcomes1994 report. Survey questions forthis report focus on four majorissues:
(1) What effect the activitiesoutlined in Goals 2000: TheEducate America Act have on statespecial education service deliverysystems;
(2) What efforts states are makingto develop learner goals andrelated assessments;

Introduction
(3) How broadly the NCEOmodel of educational outcomesand indicators has been dissemi-nated and used within state andlocal educational agencies;
(4) The extent to which studentswith disabilities are participatingin statewide achievement assess-ments now being used by states.
This year's report surveyed statespecial education directors in allfifty regular states and the tenunique states that must abide by
the provisions of P. L. 101-476,bulipiduals zoith Disabilities Educa-tio Act (IDEA). NCEO gatheredthe responses through a mailedor faxed survey, or through aninterview. In some cases, statespecial education directorsdesignated other state officials toassist in answering the surveyquestions. There was a 100percent response rate.
10
il'UnititielStater
American Samoa = Am Samoa
Bureau of Indian Affairs = BIA
Commonwealth of theNorthern Mariana Islands =CN MI
District of Columbia = DC
Federated States ofMicronesia = FSM
Guam
Palau
Puerto Rico
Republic of the MarshallIslands = RMI
U.S. Virgin ;sla rids = USVI

Part One:Goals 2000: Educate America Act
During the past year, three piecesof federal legislation passed thatsupported the current momen-tum for change in Americaneducation: the Schools to WorkOpportunity Act, the ImproPingAmerica's Schools Act (formerlycalled the Elementary and Sccond-ani Education Act), and Goals2000: Educate America Act.
the Goals 2000 legislation placedinto law the six original nationalgoals, which were k.'staHished atthe 1989 Charlottesville educa-tion summit, plus two additionalgoals aimed at improving teach-ers' professional developmentand parents' involvement inschool. Goals 2000's central tenetemphasizes setting high, chal-lenging standards for all stu-dents, including students withdisabilities.
States that choose to submitapplications for funding underthis legislation must write stateimprovement plans and provideevidence on how such plansinclude students with disabilities.State-level planning teams thatare funded by first-year grants
also must include representativesfrom a broad constituent audi-ence, including special education.
To find Out how aware andinvolved state directors of specialeducation are regarding Goals2000 legislation, the survey askedthem three questions: How muchinformation. and training did theyreceive about Goals 2000?; Whatimpact did they believe Goals2000 would have on studentswith disabilities ?; How did theyplan to respond to Goals 2000 inthe coming year?
Sources of Information onGoals 2000111 TOW('
Most directors of special educa-tion received some type of infor-mation or training about Goals2000 since it was signed into lawin March 1994. This came mostoften from the respondent's ownstate department of education.NASDSE and the Office of Spe-cial Education Programs (OSEP)of the U.S. Department ofEducation.
The Impact of Goals 2000 onStudents with Disabilities
Figures 1 and 2
Nearly all state directors believedthat Goals 2000 would have amostly positive impact on stu-dents with disabilities, andwould foster their inclusion ofstudents with disabilities in statereform efforts. They also ex-pressed expectations of greaterinclusion in curriculum andinstruction, assessment, andhigher academic standards.
Responses to Goals 2000
MI Figure 3
I .ikely responses of states to Goals2000 during the upcoming yearwere: (a) to provide training ortechnical assistance to localeducation agencies and specialeducation directors on how toapply for Goals 2000 funding, or(b) to continue to participate withstate officials on the Goals 2000planning teams.
Other responses included seek-ing changes in how specialeducation was funded, andmonitoring the progress of thelegislation at the federal level.

Part One Sources of Information on Goals 2000
,.:..,,..
'T. e, Sour
State
,', rovidingS,
OSEP
ates,vithl.nformattoronFederallyFundedProjects
.
Goals 20.
:fr
NoInformationNASDSE
State Deptof
EducationOther
Alabama ii aAlaska a li
Arizona aArkansas
California
Colorado a aConnecticut
Delaware
Florida
Georgia aHawaii
Idaho
Illinois
Indiana
Iowa aKansas,
Kentuck\ ti
Louisiana a is
Maine
Maryland aMassachusetts
Michigan a
Minnesota a
miscissippi aMissouri a aMontana
Nebraska
Ne\ada
New I lampshire
New .Terse, a
12
4

State Special Education Outcomes 1994
State OS EPFederallyFundedProjects
NASDSEState Dept
ofEducation
OtherNo
Information
New Mexico
New York
North Carolina
North Dakota
Ohio ail
Oklahoma
Oregon
Pennsylvania
Rhode Island
South Carolina
South Dakota
Tennessee
Texas
Utah
Vermont
Virginia
Washington
West Virginia Ili
Wisconsin
WN.ornin2
Ain Samoa
WA
CNM I
DC
FSM
Guam
Palau
Puerto Rico
10,11
L'S VI
TOTALS 31 11 41 12 42 5
13

Part One Impact of Goals 2000 on Students with Disabilities
'Figure 1 Will oa s uvu Have animpacti
No3%
Y. II g I- I S.
Unsure8%
Unsure2%
14
Positive andNegative
6%
Negative15%

Part One Responses to Goals 2000
Figure 3 States'..Planning Resposse to Goals 2000 <Y
Not Specified
Other
Planning with RegularEducation Programs
Training Local EducationAgencies
o Number of States
7

Part Two:State Policies on Learner Outcomesand Related Assessments
Standards and assessments arethe two concepts that form thecenterpiece of American educa-tional reform in the 1990s. Per-haps during no other period ofour nation's history has so muchinterest and effort been generatedin the area of setting academicstandardsstatements of whatstudents should know and beable to do in the 21st century.
To meet the requirements forGoals 2000 funding, states need toprovide evidence that challeng-ing content standards have beenestablished for all students in avariety of academic disciplines.States may select these standardsthrough a collaborative planningprocess, or by adopting those ofstandards-setting groups. Statesalso must give attention to thedevelopment of new forms ofassessment to adequately mea-sure student performance onthese standards.
The movement to create stan-dards and develop new forms ofstudent assessment were wellunderway in many states by thetime Goals 2000 was signed intolaw. The policies that those statesdeveloped to support the stan-dards and assessments differfrom state to slate, just as do therelationships between states andlocal education agencies.
What is even more variablebetween states, though, is theimplementation of standards andassessments. Some states chooseto address standards that arespecific to particular disciplinessuch as mathematics, science,and social studies. Other statesmay define expectations aboutintegrated higher thinking skills.They use different words todescribe their standards. Amongthe terms often used are out-comes, goals, and curriculumframeworks. NCEO chose to usethe phrase "learner goals oroutcomes" to encompass thesevarious terms, with the recogni-tion that significant differencesexist among them in practice.
16
Current Status of Outcomesand Assessments
Table 2
States can develop outcomeswithout assessments and viceversa. Since Goals 2000 and theImproving America's Schools Act(formerly the Elementary andSecondary Education Act) requireassessments linked to standards,NCEO needs to know how statesare developing both outcomesand assessments.
The survey asked respondents todescribe their states' progress inidentifying learner goals oroutcomes and in developingrelated assessments. Table 2places the 50 regular states and10 unique states into a matrixthat identifies each state's statusin both outcomes and assess-ments development. The tablereveals the significant breadth ofcurrent reform activities takingplace across the states: 23 statesreport having a set of learnergoals or outcomes completed andavailable, with another 26 statesin the process of developing,reviewing or revising them at thepresent time. In terms of assess-ment activity, the survey re-vealed that most states are at theinitial stages of reform: only 12states report having assessment

Part Two: The State Policies on Learner Outcomes and Related Assessments
systems complete and availablefor use, with another 33 indicat-ing that their systems are cur-rently under development orreview.
Some respondents indicate thatthe development of Outcomesand assessments had been com-pleted in certain curriculumareas, but not in others. Stateswhose directors answered in thismanner were placed in the"under development" category.
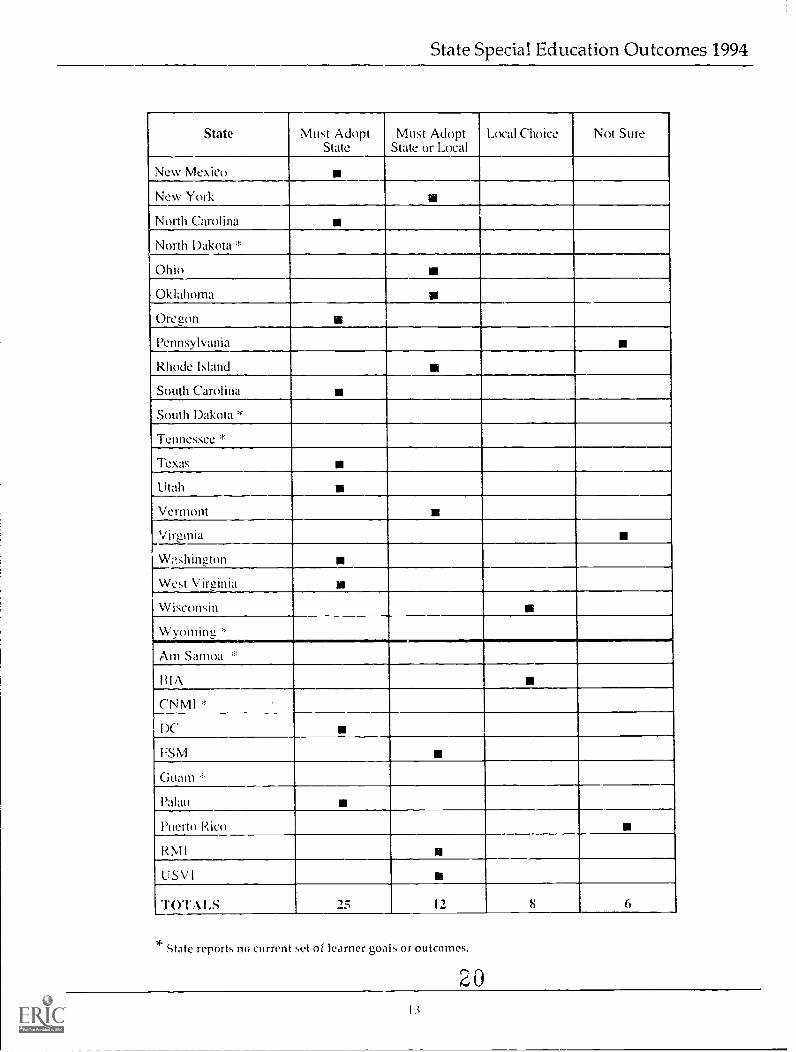
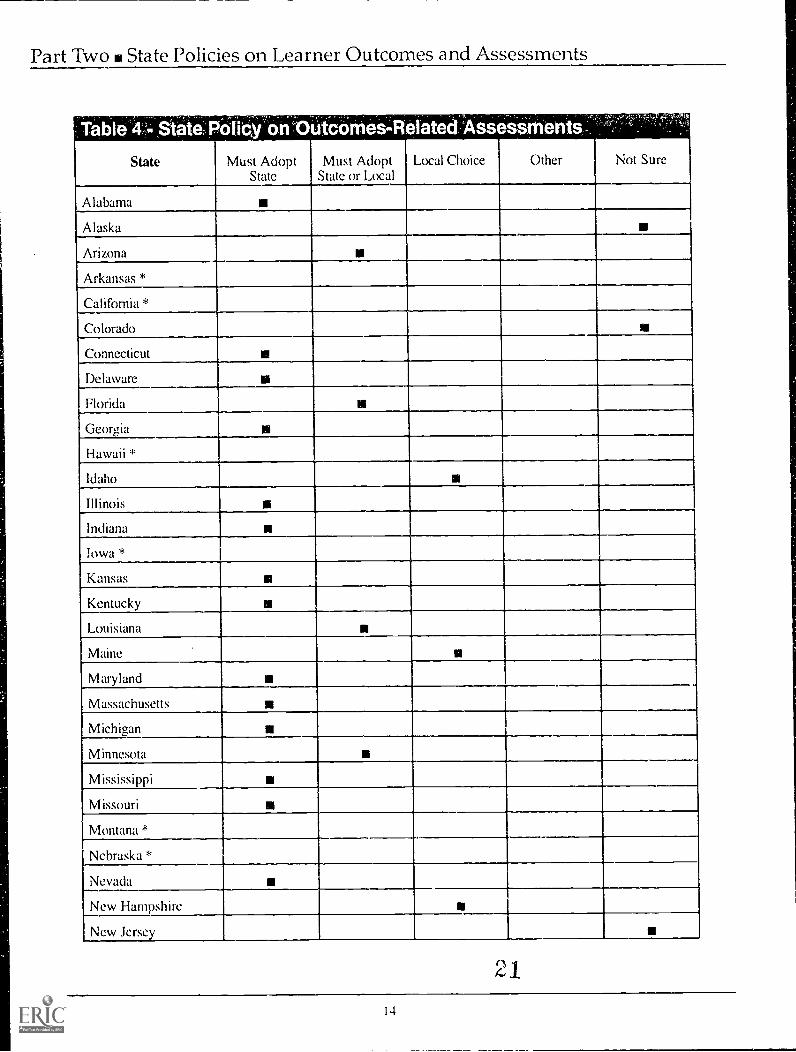
State Policies on LearnerOutcomes and AssessmentsU Tables .3 and 4
The most prevalent state policyon outcomes and assessmentsmandates the adoption of learnergoals and the use of state-ratifiedassessments at the local districtlevel.
Other reported policies give localeducational agencies the optionof either adopting the state-developed outcomes fameworkand its accompanying assessmentprogram, or developing andadopting their own frameworksand assessments. Still othersreport having policies that allowlocal districts the option ofdeciding whether to adopt anysystem of accountability.
Figures 4 and 5
Almost equal percentages ofstates were:
(1) using assessments already inuse in the state;
(2) developing new instrumentsfor the purpose of measuringtheir articulated learner goals oroutcomes.
17
I()

Part Two Current Status of Outcomes and Assessments
StattwiotQutqotrps and Asses
Completed
Outcomes Development
UnderDevelopment
Other Status No articulatedOutcomes atPresent
Not Sure
Completed AlabamaConnecticutIllinoisMarylandNevadaNew MexicoPennsylvaniaWisconsinFSMUSVI
Arizona South Carolina
CD
EC2.0CD
>0Ca04-.
0Cf)CI)
CDV)CD
UnderDevelopment
FloridaGeo; ,,ia,IndianaMaineMassachusettcsMichiganOklahomaVermontWest VirginiaIX'
AlaskaColoradoDelaware[(mhoKansasKentuckyLouisianaMinnesotaMissouriNew HampshireNew JerseyNew YorkNorth CarolinaOhioOregonRhode IslandTexasUtahWashingtonBIAPuerto RicoR NI I
NIississippi
No MandatedAssessmentProgram atPresent
ArkansasHawaiiMontana
Cali1OrniaVirginia
IowaNebraskaNorth DakotaSouth DakotaWyomingAin SamoaCNMIGuam
Tennessee
Not Sure Palau

Part Two State Policies on Learner Outcomes and Assessments
State Must AdoptState
Must AdoptState or Local
Local Choice
.
Not Sure
Alabama
Alaska
Arizona
Arkansas
California
Colorado
Connecticut
Delaware
Florida
Georgia
Hawaii
Idaho
Illinois
Indiana
Iowa
Kansas
Kentucky
Louisiana
Maine
M ar land
Massachusetts
Michigan
Minnesota
Mississippi
Missouri
Montana
Nebraska
Ne\ ada
New Hampshire
New JerseN
1912
State Special Education Outcomes 1994
State Must AdoptState
Must AdoptState or Local
Local Choice Not Sure
New Mexico
New York
North Carolina
North Dakota ''
Ohio
Oklahoma
Oregon
Pennsylvania
Rhode Island
South Carolina
South Dakota *
Tennessee
Texas
Utah
Vermont
Virginia
NVillington
West Virginia
Wisconsin III
Wyoming *
Ain Samoa
13IA ac NJ m i *
DC
ISM
Guam *
Palau
Puerto Rico
RMI
USVI
TOTALS 25 12 8
* State reports no current set of learnergoals or outcomes.
20
Part Two State Policies on Learner Outcomes and Assessments
Table''' We.:
State
liC4':'b 'ort
Must AdoptState
Ucbm-eslelated:AssessthentOther
.i ...
Not SureMust AdoptState or Local
Local Choice
Alabama
Alaska
Arizona
Arkansas *
California *
Colorado
Connecticut
Delaware
Florida aGeor6a
Hawaii *
Idaho
Illinois
Indiana
Iowa *
Kansas
Kentucky aLouisiana
.
Maine
Maryland
Massachusetts
Michigan
Minnesota
Mississippi
Missouri
Montana *
Nebraska *
Nevada
New Hampshire
New Jersey
21.
14

State Special Education Outcomes 1994
State Must AdoptState
Must AdoptState or Local
Local Choice Other Not Sure
New Mexico Iiii
New York
North Carolina
North Dakota *
Ohio
Oklahoma
Oregon
Pennsylvania
Rhode Island
South Carolina
South Dakota *
Tennessee *
Texas
Utah
Vermont
Virginia *
Washington
West Virginia
Wisconsin
-Wyoming *
An Samoa
131A
CNM1 *
DC
FSM
Guam *
Palau *
Puerto Rico
RMI
USVI
roTALs 27 8 6 1 4
State reports no current outcome-related assessment program.
15

Part Two State Policies on Learner Outcomes and Assessments
tetesUsing Existing 'Assessments
Yes70%
Awogig-0,4"--
'4.A. .kg >
Not Sure12%
No18%
Sing-NewFornistd Assessment ;
Not SureNo 14%5%
16

Part Three:The NCEO Conceptual Model ofOutcomes and Indicators
NCEO developed a conceptualmodel of educational outcomesand indicators to assess theeffectiveness of education for allstudents, including those withdisabilities.
NCEO created the model coop-eratively with educational policy-makers, researchers, teachers andparents. State directors of special
education commented on theextent to which they were awareof this model, and to what extentit had been useful in their currentreform efforts.
111 Figure 6
Most state directors were familiarWith the model. Only 7 directors,or about 12 percent, were un-
aware of the model, and 23directors, or about 38 percent,had either shared the model withcolleagues, or used it in theirreform efforts.
Conceptual Model of Outcomes
= OUTCOME DOMAIN Physical I leahlt
Responsibility andIndependence
Presence andParticipation
Contribution andCititenship
Academic andFunctional Literacy
Pers011al and SOCialAdJUStillnt
SatiNt aci ion
Rei,mrces(Input and Conte t
EducationalOppoitunit and
Process
4)0A, c, iilatim,and Adaptatim
1
17
BEST COPY AVAILABLE

Part Three The NCEO Conce_ ta2aiffiodel of Outcomes and Indicators
Figure 6- tatesLLeitel Awareness of the NCE0 Mo e
Used Model
Seen & Shared
Aware: Seen
Aware: Not Seen
Not Aware
P'-`{ `Iry :'#4'
Es Number of States
40

Part Four:Participation of Students withDisabilities in Statewide Assessments
Since 1991, NCEO has reportedthe rates at which students withdisabilities participate in state-wide assessments. In the past,their participation in statewidetesting programs had varied agreat deal, with estimates forstates ranging from 0',/, to 100',.Many respondents were unableto provide an estimate.
Participation Rates inStatewide AssessmentsM Table 5
In the 1994 survey, NCEO askedfor the participation rate for eachassessment administered by astate. Using Viezoing the Land-scape, which was producedjointly by the North CentralRegional Education Laboratory(NCREL) and the Council ofChief State School Officers(CCSSO) to identify assessments,NCEO listed each state's currentassessment battery and asked forthe participation rates. (SeeAppendix for lists of assessmentsand rates for each one.)
Assessments were coded accord-ing to the purpose of the assess-ment noted in Viewing the Land-scape, and then summarized forthree classifications:
(1) student accountability (forexample, assessments used todetermine grade promotion orgraduation);
(2) school accountability (forexample, assessments that assignrewards or sanctions to districtsor schools); or
(3) instructional decision making(for example, assessments usedfor placement or instructionaldecisions).
Despite NCEO's request for morespecific information, most statesstill could not report the partici-pation rates for students withdisabilities. What is clear is thatmany of the statewide assess-ments serve multiple purposes.For this reason, participationrates for the different purposestend to look quite similar.
26
Some states could only provideestimates, which can vary greatlyin their accuracy. Furthermore,other states report that the datawere not immediately or conve-niently available. The DK or"Don't Know" response was alsoused to classify those stateswhere other related data mayhave been reported, such as thepercentage of all test takers whohad a special educationdesignation.
Figure 7
Participation rates were availablemost often (in 18 states) forassessments used for schoolaccountability. The were avail-able least often (in 10 states) forassessments used for studentaccountability.
19

Part Four Participation of in Statewide Assessments
_.. able :5 'Students.
Witit Disablities:Participatirigifli.AstesSmentSchool or District
AccountabilityState Student
AccountabilityInstructional
Decision MakingNOTcells Ia veradisc&particasseswit hi(See ,assesca tag
* Parwereall ascater;
rI-. Ns(
asses
NAstateasst.,into I
DK -Stateasse!-c a tqknovrate('
Alabama 63.5 45.0 56.5*
Alaska NA DK DK
Arizona I)K DK DK
Arkansas NA I)K DK
California DK NA DK
Colorado *4: * * * *
Connecticut 94.0 84.0 84.0
Delaware NA 84.0 84.0
Florida 81.0 1)K 30.0*
Georgia I)K DK DK
Hawaii DK DK DK
Idaho NA DK DK
Illinois NA 25.0 NA
Indiana DK 1)K DK
Iowa ** ** **
Kansan NA DK DK
Kentucky NA 100.0 100.0
Louisiana 5.0 5.0* 5.0*
Maine DK DK l)K
Maryland NA 90.0 90.0
Massachusetts NA 50.0 NA
Michigan DK DK DK
Minnesota
Mississippi DK DK DK
Missouri NA I)K DK
Montana NA 90.0 NA
Nebraska .!..i. 11
Nevada DK DK DK
New Hampshire NA DK NA
New Jersey 43.0 54.5 54.5
: Percentages inrepresent ange of students withilities who-ipate across allsments that falln that category.Appendix forsments within eachory.)
icipation ratesnot available for
sessments in thisorv.
statewidesnients.
Not Applicabledoes not have ansment that fallshis category.
1)on't Knowhas one or more
-Anent in thisorv, but does not
the participation
20
27

State Special Education Outcomes 1994
State StudentAccountability
School or DistrictAccountability
InstructionalDecision Making
New Mexico DK DK DK
New York NA 91.5 91.5
North Carolina NA 7.0 7.0
North Dakota DK DK DK
Ohio DK DK DK
Oklahoma DK DK DK
Oregon NA 88.5 88.5
Pennsylvania NA DK DK
Rhode Island NA 70.0* 70.0*
South Carolina DK DK DK
South Dakota NA DK DK
Tennessee 99.0 86.4* 74.0*
40.0 40.0 40.0
Utah 75.0 75.0 75.0
Vermont NA DK DK
Virginia 13.0 13.0* 13.0
Washington NA DK DK
West Vin2inia DK DK DK
Wisconsin NA DK DK
\V \ ()mint! ::: !:
...a..Am Samoa NA NA NA
13IA NA NA NA
CN M I NA NA NA
DC NA NA NA
FS M NA NA NA
Guam NA NA NA
Palau NA NA NA
Puerto R !co NA NA NA
RNI1
USN] NA NA NA
21

Part Four Participation Rates in Statewide Assessments
igure,7 - Availability of Assess ent Data on Students With "sabilitiee'"s
Purpose of Assessments
Instructional DecisionMaking
School Accountability
15 26
18 26
Student Accountability 10 15
10 20 30
Number of States
40
Participation Rates Available Participation Rates Not Available
(750

Conclusion
Now is an exciting time in educa-tion. Findings from the 1994special education survey providetestimony to many ambitiousefforts currently underway instate education systems.
Feedback from state directorsabout Collis 20(X) suggests thatthis federal initiative provides aunique opportunity for collabora-tive planning and bridge-build-ing between special and generaleducation interests.
Indeed, such collaboration willbecome more important asdeliberations continue over theidentification of learner goals,and as states devise and mandatenew forms of valid and reliablemeasures of student perfor-ma nce.
(-1 r-ti
If education in the United Statesis to become accountable for allstudents, then students withdisabilities will need to be con-sidered throughout the entireprocess of reform--from theidentification of learner goals tothe reporting of results.

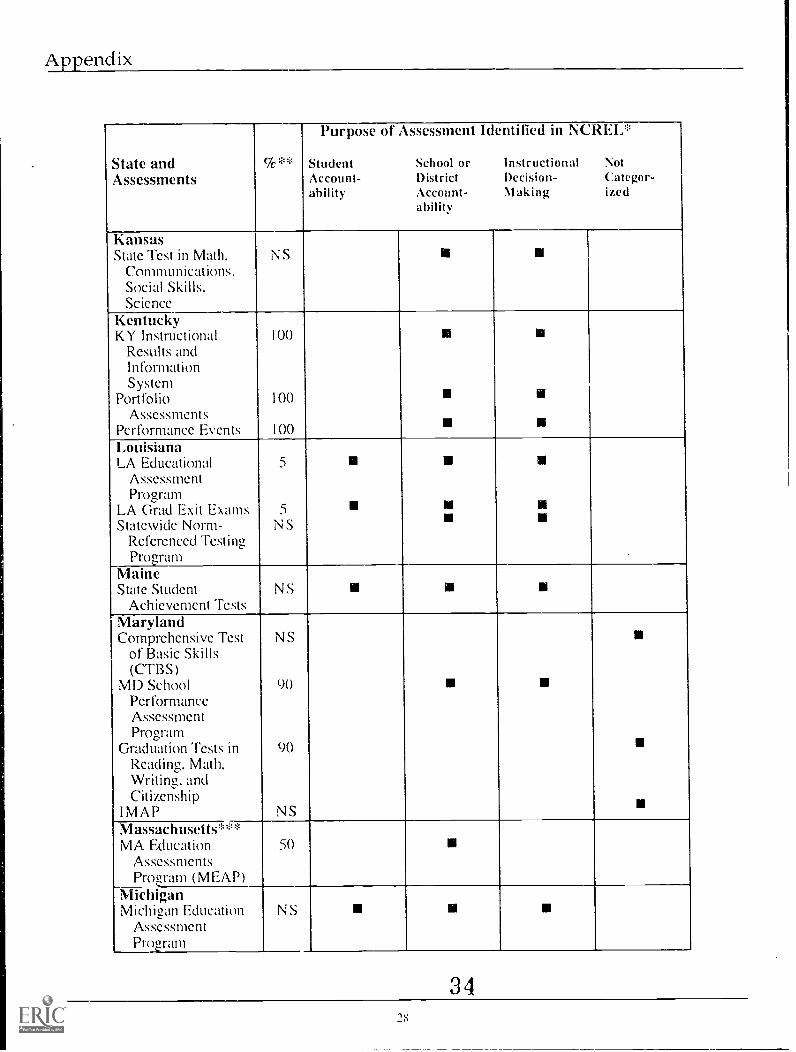
Appendix
The chart in this appendix lists allassessments identified in theNCREL report Viewing theLandscape, plus additionalassessments identified by thestates.
For each assessment, NCEOlisted the percentage of studentswith disabilities reported by thestate respondent to its surveyand then the purpose(s) accord-ing to the NCREL report.
These data are the basis for thesummary information providedin Table 5 (see page 20). Whenmore than one assessment wasidentified for a single purpose,the average of the percentages forthese assessments was reportedin Table 5.
31

Appendix
State andAssessments
c/c**
P- pose of Assessment Identified in NCREI,
Student School or Instructional 1otAccount- District Decision- Categor-ability Account- Making iced
abilityAlabamaIntegrated Reading
and Writing39
Assessment forGrade Two
Basic Competency 56Tests
SAT 45AL Direct 60
Assessment ofWriting
High School Basic 71Skills Exit Exam
Differential Aptitude NSTests with CareerInterest Inventory
AlaskaITBS NSWriting Exam NS El
Arizona1TBS NSTest of Achievement
and ProficiencyNS
District AssessmentPlans NS
ArkansasMinimum NS
Performance TestsSAT NSWriting Assessment NSCaliforniaGolden State Exams NSColoradoNONEConnecticutCT Mastery Test 74 MI
CT Academic 94Performance Test
Delaware***Writing Exam 84Performance Based 84 II
Assessment inReading and Math
32

State Special Education Outcomes 1994
State andAssessments
ck **
Purpose of Assessment Identified in NCREL*
Student School or Instructional NotAccount- District Decision- ('ategor-ability Account- Making ized
ability
FloridaHigh School
Competency TestFL 'Writing
AssessmentProgram
Grade 10Assessment Test
81
30
NS
N
N
GeorgiaGA Curriculum
BasedAssessments
GA High SchoolGraduation Test
1TBSTest of Achievement
and ProficiencyGA Kindergarten
Test
NS
NS
NSNS
NS
N
E
N
HawaiiSATTest of Essential
Competencies(FISTEC)
N SNS
S
IdahoTest of Achievement
and ProficiencyITBSDirect Writing
AssessmentPerformance
'MathematicsAssessment
InterdisciplinaryAssessments
NS
NSNS
NS
NS
Illinois1. Goal AssessmentProgram
25
IndianaIN Statewide Testinl..;
for EducationalProgress
(PASS
NS
NS
N
IowaNONE
273
Appendix
State andAssessments
%**
Purpose of Assessment Identified in NCREL*
Student School or Instructional NotAccount- District Decision- Categor-ability Account- Making ized
ability
KansasState Test in Math, NS III
Conimunications.Social Skills.Science
KentuckyKY Instructional 100
Results andInformationSystem
Portfolio 100Assessments
Performance Events 100LouisianaLA Educational 5
AssessmentProgram
LA Grad Exit Exams 5 MI
Statewide Norm- NSReferenced TestingProgram
MaineState Student NS
Achievement TestsMarylandComprehensive Test
of Basic SkillsNS
(CTBS)MD School 90
PerformanceAssessmentProgram
Graduation Tests in 90Reading, Math,Writing, andCitizenship
!MAP NSMassachusetts **MA Education 50
AssessmentsProgram (MEAP)
MichiganMichigan Education NS M
AssessmentProgram
3428

State Special Education Outcomes 1994
State andAssessments
%**
Purpose of Assessment Identified in NCREL*
Student School or Instructional NotAccount- District Decision- Categor-ability Account- Making ized
ability
MinnesotaNONEMississippiFunctional Literacy
ExaminationITBSTest of Achievement
and Proficiency
NS
NSNS
N N N
N
MissouriMissouri Mastery
Achievement TestNS
MontanaStandardised
AchievementTesting
90
NebraskaNONENevadaCTBSAnalytic-Trait Score
WritingHigh School
Proficiency ExamProgram
NSNS
NS
NN
N
New HampshireCATNH Educational
AssessmentProgram (NHEAP)
NSNS
New JerseyGrade S Early
Warning TestHigh School
Proficiency Test(HSPT)
66
43
III
N
New MexicoNM Reading
AssessmentAchievement
AssessmentDirect Writing
AssessmentHigh School
CompetencyExaminations
NS
NS
NS
N S
MI
N
N
Me,
2 9

Appendix
State andAssessments
% * *
Purpose of Assessment Identified in NCREI,*
Student School or instructional NotAccount- District Decision- Categor-ability Account- Maki;ig ized
ability
New YorkPupil Evaluation 92
Program TestProgram Evaluation 91 N
TestsNorth CarolinaEnd-of-Grade Tests 10 I isEnd-of-Course Tests 4 N
Writing NSCompetency Test NSComputer Skills NS
Proficiency TestNorth DakotaC'TBS NS In
OhioNorm Referenced NS
Achievement TestsNinth-Grade NS
ProficiencyTesting
OklahomaNorm-Referenced NS
AchievementNorm-Referenced NS
WritingAssessment
Criterion- NSReferenced TestingProgram
OregonReading, 90
Mathematics andHealthAssessments
Statewide Writing 87Assessment
PennsylvaniaReading and Math NS
State AssessmentWriting State NS
Assessment
36
30

State Special Education Outcomes 1994
State andAssessments
c/c**
Purpose of Assessment Identified in NCREI,*
Student School or Instructional NotAccount- District Decision- Categor-ability Account- Making ized
ability
Rhode IslandMetropolitan 70 M
Achievement TestHealth Education 70 M
ExamsPhysical Education NS M
ExamsWriting Exam 70South CarolinaMetropolitan NS 111
Achievement 'FestBasic Skills NS
AssessmentProgram
Exit Examination NSSouth DakotaSAT NSCareer Assessment NS
Pro 2ramTennesseeTN Comprehensive 74 N
AssessmentProgram
TN Proficiency Test 99 II
WritiR Assessment NSTexasTX Assessment of 40
Academic Skills(TAAS)
UtahSAT 65Core Curriculum 75 II
AssessmentPro 2ram
VermontPortfolio NS
AssessmentsUniform Tests in NS
Math and WritingVirginiaLiteracy Passport 13
Testing ProgramITBS NSTests of NS
Achievement andProficiency
31

Appendix
State andAssessments
WI:*
Purpose of Assessment Identified in NCREL*
Student School or Instructional NotAccount- District Decision- ('ategor-ability Account- Making ized
ability
WashingtonCTBSCurriculum
FrameworksAssessment
NSNS a
West VirginiaCriterion-Referenced
TestsCTBSState Writing
Assessment
N S
NSNS
a
aII
a
WisconsinThird Grade Reading
TestACT 8th Grade
EXPLOREACT 10th Grade
PLAN
NS
NS
N S
a
a
WyomingNONEAm SamoaSATMinimum
Competency TestLocally Developed
CurriculumReferenced Tests
NS80
NS
I
MACTBS NS aCNMICAT 60DCCTBSNational Assessment
of EducationalProgress (NAEP)
4141
a
FMFSM National
Standardized Testsin Language Arts.and Mathematics
NS
GuamLife and School
Survival Skills TestBrigance
50
90
38

State Special Education Outcomes 1994
State andAssessments
%**
Purpose of Assessment Identified in NCREL*
Student School or Instructional NotAccount- District Decision- Categor-ability Account- Making ized
ability
PalauCriterion-Referenced
TestBriganceEducation Needs
AssessmentPre-School
SupplementaryScreeningInventory
Denver IIHawaii Early
Learning ProfileIsland Infant &
ToddlersScreeningInstruments
NS
7070
70
NS70
70
a
a
Puerto RicoAprenda: Reading,
LanguageAprenda: MathAprenda: Basic
Skills
NS
NSNS
NJ
RMINONEUSVIMetropolitan
Achievement TestNS MI
* North Central Regional Educational Laboratory
** Percent of students with disabilities participating in assessment
*** Original NCREL coding of the assessment was revised by the state director
NOTE: NS stands for "Not Sure"
3933