Embed Size (px)
Citation preview
EDDY CURRENT ANALYSIS ROUND ROBIN USING THE NRC STEAM GENERATOR MOCKUP
D. S. Kupperman,* J. Muscara,** S. Bakhtiari,* J. Y. Park* and W. J. Shack*
* Argonne National Laboratory
Energy Technology Division 9700 South Cass Avenue Argonne, Illinois 60439
E-mail: [email protected]
** U.S. Nuclear Regulatory Commission Office of Nuclear Regulatory Research
Division of Engineering Technology Mail Stop T-10E10
Washington, DC 20555 E-mail: [email protected]
To be published in the Proceedings of the 4th International Steam Generator Conference, May 5-8, 2002, Toronto, Canada This work is sponsored by the Office of Nuclear Regulatory Research, U.S. Nuclear Regulatory Commission, under Job Code W6487;
EDDY CURRENT ANALYSIS ROUND ROBIN USING THE NRC STEAM GENERATOR MOCKUP
D. S. Kupperman,* J. Muscara,** S. Bakhtiari,* J. Y. Park* and W. J. Shack*
ABSTRACT This paper discusses round-robin exercises to assess inspection reliability using the NRC steam generator (SG) mock-up at Argonne National Laboratory. The purpose of the round robins is to assess the current reliability of SG tubing inservice inspection, determine the probability of detection (POD) as function of flaw size or severity, and assess the capability for sizing of flaws. The mock-up contains hundreds of cracks and simulations of artifacts such as corrosion deposits and tube support plates that make detection and characterization of cracks more difficult in operating steam generators than in most laboratory situations. Eddy current signals from the laboratory-grown cracks used in the mock-up have been reviewed to ensure that they provide reasonable simulations of those obtained in the field. The mock-up contains 400 tube openings. Each tube contains nine 22.2-mm (7/8-in.) diameter, 30.5-cm (1-ft) long, Alloy 600 test sections. The flaws are located in the tube sheet near the roll transition zone (RTZ), in the tube support plate (TSP), and in the freespan. The flaws are primarily intergranular stress corrosion cracks (axial and circumferential, ID and OD). In addition to the simulated tube sheet and TSP the mock-up has simulated sludge and magnetite deposits. A validated multiparameter eddy current algorithm that provided a detailed isometric plot for every flaw was used to establish the reference state of defects in the mock-up. The detection results for the 11 teams were used to develop POD curves as a function of maximum depth, voltage and the parameter mp, for the various types of flaws. The 95% one-sided confidence limits (OSL), which include errors in maximum depth estimates, are presented along with the POD curves. For the second round robin a reconfigured mock-up is being used to evaluate the effectiveness of eddy current arrays.
* Argonne National Laboratory
Energy Technology Division 9700 South Cass Avenue Argonne, Illinois 60439
E-mail: [email protected]
** U.S. Nuclear Regulatory Commission Office of Nuclear Regulatory Research
Division of Engineering Technology Mail Stop T-10E10
Washington, DC 20555 E-mail: [email protected]
EDDY CURRENT ANALYSIS ROUND ROBIN USING THE NRC STEAM GENERATOR MOCKUP
D. S. Kupperman, J. Muscara, S. Bakhtiari, J. Y. Park and W. J. Shack
INTRODUCTION One major outcome of regulatory activity over the past 10 years intended to develop guidance for tube integrity assessments is the development and implementation of two key concepts, condition monitoring and operational assessment. Condition monitoring is an assessment of the current state of the steam generator (SG) relative to the performance criteria of structural integrity. An operational assessment is an attempt to assess what will be the state of a generator relative to the structural integrity performance criteria at the end of the next operating cycle. The predictions of the operational assessment from the previous cycle can be compared with the results of the condition monitoring assessment to verify the adequacy of the methods and data used to perform the operational assessment. The reliability of the in-service inspection (ISI) is critical to the effectiveness of the assessment processes. Quantitative information on probability of detection (POD) and sizing accuracy of flaws for the inservice inspection techniques are needed for conditional monitoring and operational assessment. Eddy-current (EC) inspection techniques are the primary means of ISI for assessing the condition of SG tubes in current use. Detection of flaws by EC depends on detecting the changes in impedance produced by the flaw. However, many other variables, including tube material properties, tube geometry, and degradation morphology, can produce impedance changes, and the accuracy of distinguishing between the changes produced by such artifacts and those produced by flaws is strongly influenced by EC data analysis and acquisition practices (including human factors). Similarly, although it can be shown that there is a relationship between the depth of a defect into the tube wall and the EC signal phase response, in practice, those things that affect detection also affect sizing capability. The approach chosen for this program was to develop an SG tube bundle mock-up that simulates the key features of operating SGs so that the inspection results from the mock-up would be representative of those for operating SGs. Considerable effort was expended in preparing realistic flaws and verifying that their EC signals and morphologies are representative of those from operating SGs. The mock-up includes stress corrosion cracks of different orientations and morphologies at various locations in the mock-up and simulates the artifacts and support structures that may affect the EC signals. In this exercise all analysts examine the same data provided on copies of optical disks that contain the data to be analyzed. The team-to-team variation in detection capability is the result of analyst variability in interpretation of eddy current signals. The fits to the POD data and the subsequent lower 95% confidence limits are influenced by the uncertainty in crack depth determined by a multiparameter algorithm and the number of cracks in the sample set. In this report, the probabilities of detecting flaws of various types and at various locations are presented as logistic fit curves to the raw data, along with lower 95% confidence limits.
Nomenclature CIDSCC (circumferential inner diameter stress corrosion crack/cracking), CODSCC (circumferential outer diameter stress corrosion crack/cracking), FS (freespan), IGA (intergranular attack), LIDSCC (longitudinal inner-diameter stress corrosion crack/cracking), LODSCC (longitudinal outer diameter stress corrosion crack/cracking), NDE (nondestructive evaluation), ODSCC (outer diameter stress corrosion crack/cracking), OSL (One-sided 95% confidence limits), POD (probability of detection), RR (round-robin), SG (steam generator), TS (tube sheet), TSP (tube support plate), and TW (throughwall). ROUND ROBIN EXERCISE The procedures and processes for the round-robin (RR) studies mimic those currently practiced by commercial teams in actual inspections. Teams participating in the RR exercise reported their data analysis results on flaw types, sizes, and locations, as well as other commonly used parameters such as signal amplitude (voltage) and phase [1]. An important part of the first round-robin exercise was the NDE Task Group, an expert group from ISI vendors, utilities, EPRI, ANL, and the NRC. The task group reviewed signals from the laboratory-grown cracks used in the mock-up to ensure that they provide reasonable simulations of those obtained from real cracks. The Task Group participated in the development of the RR and provided input on the quality of the mock-up data, the nature of flaws, and procedures for data acquisition, analysis, and documentation. Because the destructive examination of all the flaws in the mock-up would be extremely expensive and time-consuming, several laboratory NDE methods (including various EC and UT procedures) were evaluated as a way to characterize the defects in the mock-up tubes so that the reference state can be estimated without destructive examinations. Based on these evaluations, multiparameter analysis of rotating probe data that was implemented at ANL was used to determine the reference state of the mock-up test sections [2]. This effort provided sizing estimates for the tube bundle defects. Validation of the multiparameter algorithm was carried out by comparing EC profiles to profiles of test sections mapped by fractography techniques. Alloy 600 test sections fabricated at ANL were cracked by using a 1M aqueous solution of sodium tetrathionate at room temperature and atmospheric pressure. In addition, many cracks included in the mockup were provided by Westinghouse. MOCK-UP DESIGN The mock-up tube bundle consists of 400 Alloy 600 tubes made up of nine test sections, each 0.3 m (1 ft.) long. The test sections are arranged in nine levels, each having 400 tube sections. The lowest level simulates the tube sheet, while the 4th, 7th, and 9th levels simulate tube support
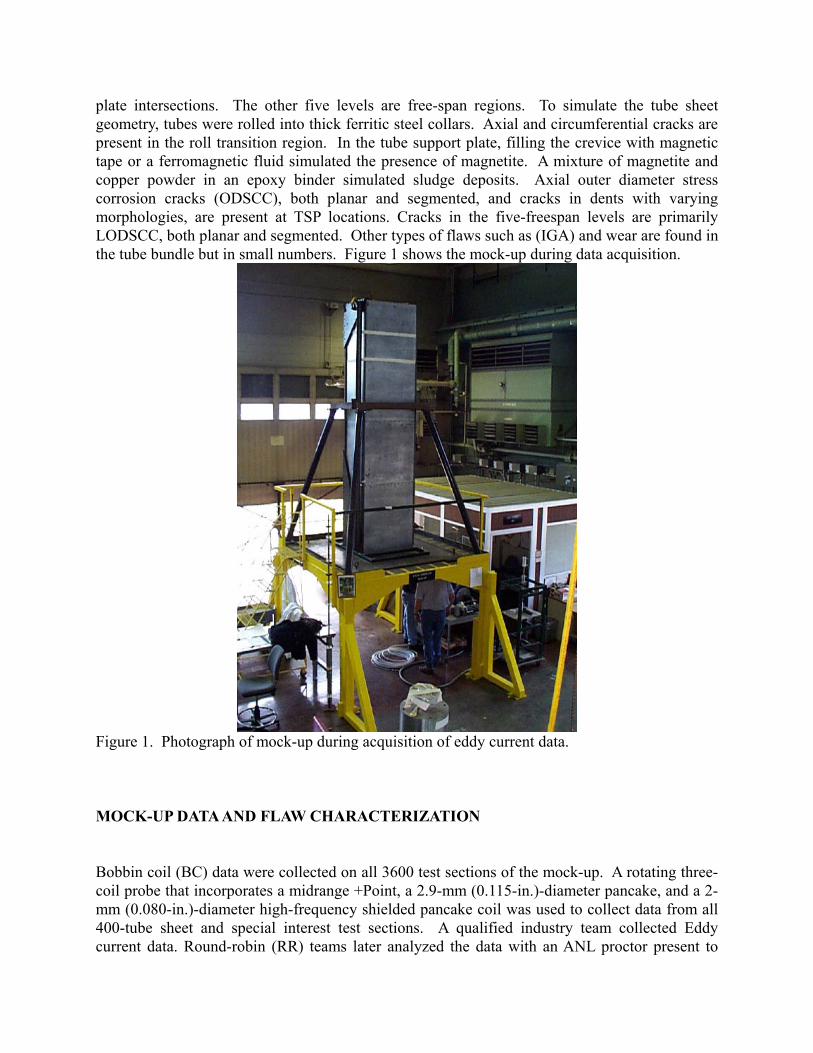
plate intersections. The other five levels are free-span regions. To simulate the tube sheet geometry, tubes were rolled into thick ferritic steel collars. Axial and circumferential cracks are present in the roll transition region. In the tube support plate, filling the crevice with magnetic tape or a ferromagnetic fluid simulated the presence of magnetite. A mixture of magnetite and copper powder in an epoxy binder simulated sludge deposits. Axial outer diameter stress corrosion cracks (ODSCC), both planar and segmented, and cracks in dents with varying morphologies, are present at TSP locations. Cracks in the five-freespan levels are primarily LODSCC, both planar and segmented. Other types of flaws such as (IGA) and wear are found in the tube bundle but in small numbers. Figure 1 shows the mock-up during data acquisition.
Figure 1. Photograph of mock-up during acquisition of eddy current data. MOCK-UP DATA AND FLAW CHARACTERIZATION Bobbin coil (BC) data were collected on all 3600 test sections of the mock-up. A rotating three-coil probe that incorporates a midrange +Point, a 2.9-mm (0.115-in.)-diameter pancake, and a 2-mm (0.080-in.)-diameter high-frequency shielded pancake coil was used to collect data from all 400-tube sheet and special interest test sections. A qualified industry team collected Eddy current data. Round-robin (RR) teams later analyzed the data with an ANL proctor present to
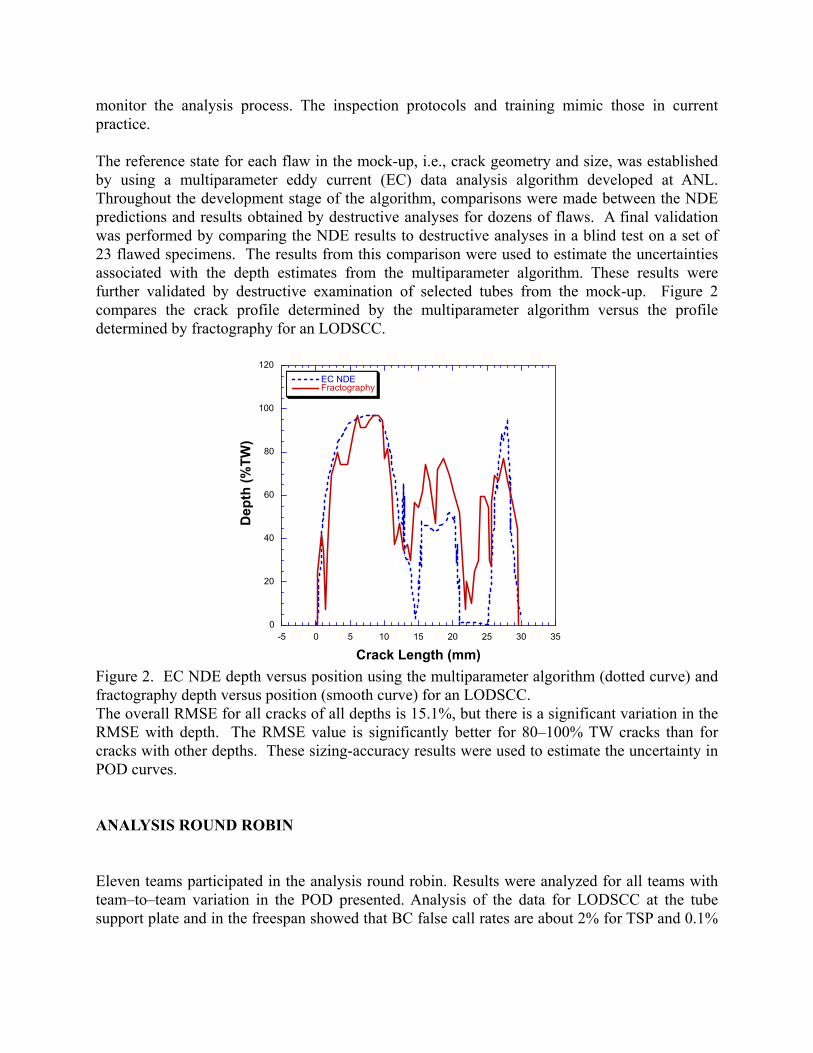
monitor the analysis process. The inspection protocols and training mimic those in current practice. The reference state for each flaw in the mock-up, i.e., crack geometry and size, was established by using a multiparameter eddy current (EC) data analysis algorithm developed at ANL. Throughout the development stage of the algorithm, comparisons were made between the NDE predictions and results obtained by destructive analyses for dozens of flaws. A final validation was performed by comparing the NDE results to destructive analyses in a blind test on a set of 23 flawed specimens. The results from this comparison were used to estimate the uncertainties associated with the depth estimates from the multiparameter algorithm. These results were further validated by destructive examination of selected tubes from the mock-up. Figure 2 compares the crack profile determined by the multiparameter algorithm versus the profile determined by fractography for an LODSCC.
0
20
40
60
80
100
120
-5 0 5 10 15 20 25 30 35
EC NDEFractography
Dep
th (%
TW)
Crack Length (mm) Figure 2. EC NDE depth versus position using the multiparameter algorithm (dotted curve) and fractography depth versus position (smooth curve) for an LODSCC. The overall RMSE for all cracks of all depths is 15.1%, but there is a significant variation in the RMSE with depth. The RMSE value is significantly better for 80–100% TW cracks than for cracks with other depths. These sizing-accuracy results were used to estimate the uncertainty in POD curves. ANALYSIS ROUND ROBIN Eleven teams participated in the analysis round robin. Results were analyzed for all teams with team–to–team variation in the POD presented. Analysis of the data for LODSCC at the tube support plate and in the freespan showed that BC false call rates are about 2% for TSP and 0.1%
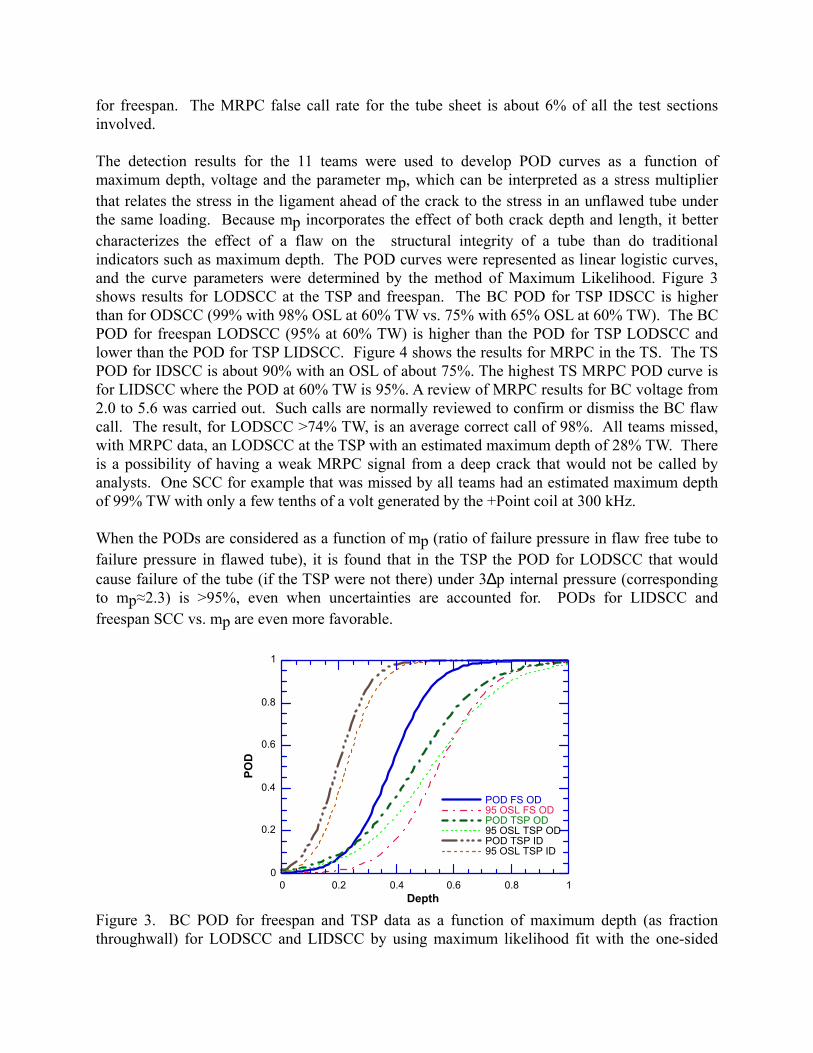
for freespan. The MRPC false call rate for the tube sheet is about 6% of all the test sections involved. The detection results for the 11 teams were used to develop POD curves as a function of maximum depth, voltage and the parameter mp, which can be interpreted as a stress multiplier that relates the stress in the ligament ahead of the crack to the stress in an unflawed tube under the same loading. Because mp incorporates the effect of both crack depth and length, it better characterizes the effect of a flaw on the structural integrity of a tube than do traditional indicators such as maximum depth. The POD curves were represented as linear logistic curves, and the curve parameters were determined by the method of Maximum Likelihood. Figure 3 shows results for LODSCC at the TSP and freespan. The BC POD for TSP IDSCC is higher than for ODSCC (99% with 98% OSL at 60% TW vs. 75% with 65% OSL at 60% TW). The BC POD for freespan LODSCC (95% at 60% TW) is higher than the POD for TSP LODSCC and lower than the POD for TSP LIDSCC. Figure 4 shows the results for MRPC in the TS. The TS POD for IDSCC is about 90% with an OSL of about 75%. The highest TS MRPC POD curve is for LIDSCC where the POD at 60% TW is 95%. A review of MRPC results for BC voltage from 2.0 to 5.6 was carried out. Such calls are normally reviewed to confirm or dismiss the BC flaw call. The result, for LODSCC >74% TW, is an average correct call of 98%. All teams missed, with MRPC data, an LODSCC at the TSP with an estimated maximum depth of 28% TW. There is a possibility of having a weak MRPC signal from a deep crack that would not be called by analysts. One SCC for example that was missed by all teams had an estimated maximum depth of 99% TW with only a few tenths of a volt generated by the +Point coil at 300 kHz. When the PODs are considered as a function of mp (ratio of failure pressure in flaw free tube to failure pressure in flawed tube), it is found that in the TSP the POD for LODSCC that would cause failure of the tube (if the TSP were not there) under 3∆p internal pressure (corresponding to mp≈2.3) is >95%, even when uncertainties are accounted for. PODs for LIDSCC and freespan SCC vs. mp are even more favorable.
0
0.2
0.4
0.6
0.8
1
0 0.2 0.4 0.6 0.8 1
POD FS OD95 OSL FS ODPOD TSP OD95 OSL TSP ODPOD TSP ID95 OSL TSP ID
POD
Depth Figure 3. BC POD for freespan and TSP data as a function of maximum depth (as fraction throughwall) for LODSCC and LIDSCC by using maximum likelihood fit with the one-sided
95% confidence limit. Maximum depth uncertainty is included. Depths are determined with the multiparameter algorithm.
0
0.2
0.4
0.6
0.8
1
0 0.2 0.4 0.6 0.8 1
L&C IDL&C 95 OSL IDL&C ODL&C 95 OSL OD
POD
Depth
Tube SheetAxial & Circ SCC
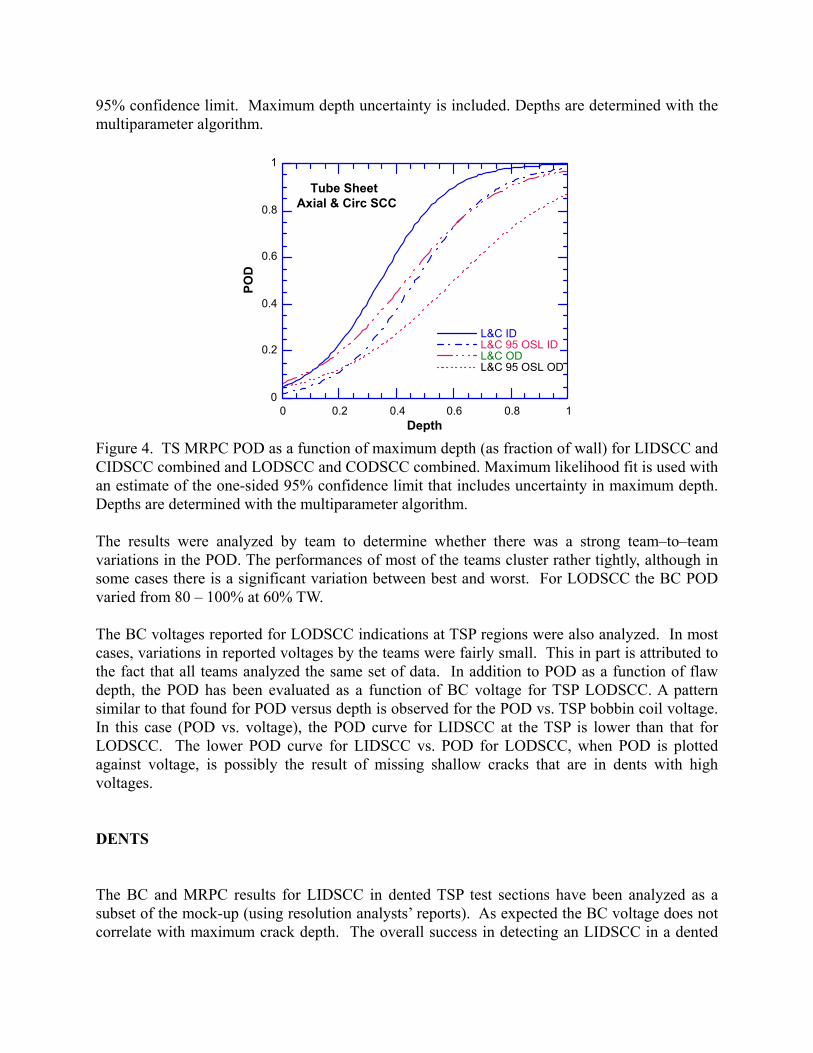
Figure 4. TS MRPC POD as a function of maximum depth (as fraction of wall) for LIDSCC and CIDSCC combined and LODSCC and CODSCC combined. Maximum likelihood fit is used with an estimate of the one-sided 95% confidence limit that includes uncertainty in maximum depth. Depths are determined with the multiparameter algorithm. The results were analyzed by team to determine whether there was a strong team–to–team variations in the POD. The performances of most of the teams cluster rather tightly, although in some cases there is a significant variation between best and worst. For LODSCC the BC POD varied from 80 – 100% at 60% TW. The BC voltages reported for LODSCC indications at TSP regions were also analyzed. In most cases, variations in reported voltages by the teams were fairly small. This in part is attributed to the fact that all teams analyzed the same set of data. In addition to POD as a function of flaw depth, the POD has been evaluated as a function of BC voltage for TSP LODSCC. A pattern similar to that found for POD versus depth is observed for the POD vs. TSP bobbin coil voltage. In this case (POD vs. voltage), the POD curve for LIDSCC at the TSP is lower than that for LODSCC. The lower POD curve for LIDSCC vs. POD for LODSCC, when POD is plotted against voltage, is possibly the result of missing shallow cracks that are in dents with high voltages. DENTS The BC and MRPC results for LIDSCC in dented TSP test sections have been analyzed as a subset of the mock-up (using resolution analysts’ reports). As expected the BC voltage does not correlate with maximum crack depth. The overall success in detecting an LIDSCC in a dented
TSP location is somewhat less than for LIDSCC in TSP locations without dents. Nevertheless, success with a bobbin coil in detecting LIDSCC in a dent is generally high for depths greater than 40%TW. The dent signal can mask the presence of an SCC but generally for voltages in the 2.5-4.5 volts range the detection rate was good. It is evident that some mock-up LIDSCC in a dented TSP were detected correctly by the BC data but then incorrectly dismissed using the MRPC data. Most, but not all of those cases, are for depths less than about 45%TW. SIZING Mock-up data for several cracks were used to compare the profiling results from industry experts to the results obtained from application of the Argonne multiparameter algorithm. The objective of the exercise was to obtain information of the variation possible for maximum depth estimates when using the same EC data. A comparison was made of the maximum depths for a variety of crack morphologies estimated by two recognized EC NDE experts using the same procedure with +Point data at 300 kHz against the results of maximum depth from application of the multiparameter algorithm to mainly pancake phase and amplitude data. The deeper the crack the better the comparison. For one nearly through wall TSP crack, the variation was only about 10%. In a couple of worst cases, the variation was over 40%TW (i.e. tube sheet SCC). ARRAY PROBES The X-Probe is a transmit-receive eddy current array. The transmit coil establishes the eddy current while receive coils read flaw created disruptions in currents, represented as phase and amplitude variations in the voltage plane. The advantages of the X-Probe are its sensitivity to flaw orientation and characterization of noise signals. The array can travel through tubing at speeds comparable to bobbin coils, and much faster than rotating coils, while still providing spatial and orientation information for both axial and circumferential cracks. Data from the NRC steam generator mock-up was collected using the X-probe in order to prepare for a round robin exercise for that probe. The purpose of the exercise was to test the probe performance with the mock-up and finalize analyst guidelines for an X-Probe round robin. Documentation including training manuals and schedules are currently being prepared. An example from the mock-up comparing X-Probe and +Point 3D signal amplitude plots with a 3D depth profile generated by the Argonne multiparameter algorithm that uses amplitude and phase information from an MRPC to generate profiles is presented in Figure 5a-c. The +Point probe is the rotating probe of choice for inservice inspections involving the steam generator tube sheet as well as special interest locations. The multiparameter results are derived from phase and
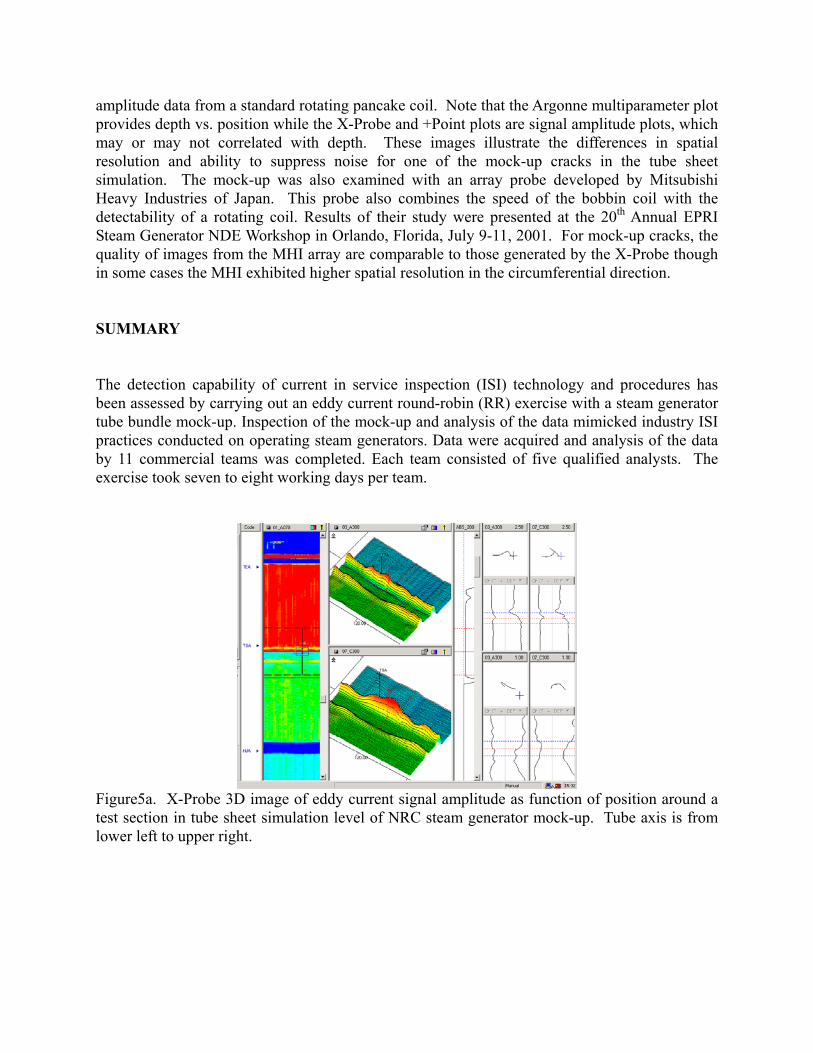
amplitude data from a standard rotating pancake coil. Note that the Argonne multiparameter plot provides depth vs. position while the X-Probe and +Point plots are signal amplitude plots, which may or may not correlated with depth. These images illustrate the differences in spatial resolution and ability to suppress noise for one of the mock-up cracks in the tube sheet simulation. The mock-up was also examined with an array probe developed by Mitsubishi Heavy Industries of Japan. This probe also combines the speed of the bobbin coil with the detectability of a rotating coil. Results of their study were presented at the 20th Annual EPRI Steam Generator NDE Workshop in Orlando, Florida, July 9-11, 2001. For mock-up cracks, the quality of images from the MHI array are comparable to those generated by the X-Probe though in some cases the MHI exhibited higher spatial resolution in the circumferential direction. SUMMARY The detection capability of current in service inspection (ISI) technology and procedures has been assessed by carrying out an eddy current round-robin (RR) exercise with a steam generator tube bundle mock-up. Inspection of the mock-up and analysis of the data mimicked industry ISI practices conducted on operating steam generators. Data were acquired and analysis of the data by 11 commercial teams was completed. Each team consisted of five qualified analysts. The exercise took seven to eight working days per team.
Figure5a. X-Probe 3D image of eddy current signal amplitude as function of position around a test section in tube sheet simulation level of NRC steam generator mock-up. Tube axis is from lower left to upper right.
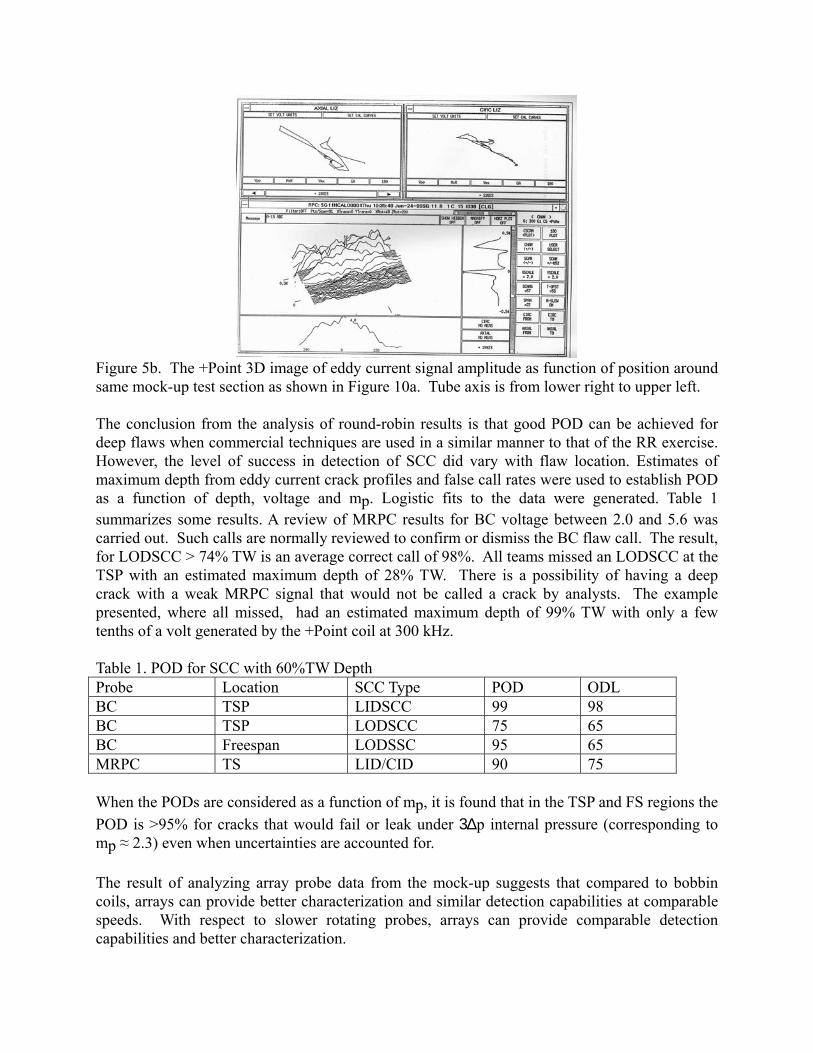
Figure 5b. The +Point 3D image of eddy current signal amplitude as function of position around same mock-up test section as shown in Figure 10a. Tube axis is from lower right to upper left. The conclusion from the analysis of round-robin results is that good POD can be achieved for deep flaws when commercial techniques are used in a similar manner to that of the RR exercise. However, the level of success in detection of SCC did vary with flaw location. Estimates of maximum depth from eddy current crack profiles and false call rates were used to establish POD as a function of depth, voltage and mp. Logistic fits to the data were generated. Table 1 summarizes some results. A review of MRPC results for BC voltage between 2.0 and 5.6 was carried out. Such calls are normally reviewed to confirm or dismiss the BC flaw call. The result, for LODSCC > 74% TW is an average correct call of 98%. All teams missed an LODSCC at the TSP with an estimated maximum depth of 28% TW. There is a possibility of having a deep crack with a weak MRPC signal that would not be called a crack by analysts. The example presented, where all missed, had an estimated maximum depth of 99% TW with only a few tenths of a volt generated by the +Point coil at 300 kHz. Table 1. POD for SCC with 60%TW Depth Probe Location SCC Type POD ODL BC TSP LIDSCC 99 98 BC TSP LODSCC 75 65 BC Freespan LODSSC 95 65 MRPC TS LID/CID 90 75 When the PODs are considered as a function of mp, it is found that in the TSP and FS regions the POD is >95% for cracks that would fail or leak under 3∆p internal pressure (corresponding to mp ≈ 2.3) even when uncertainties are accounted for. The result of analyzing array probe data from the mock-up suggests that compared to bobbin coils, arrays can provide better characterization and similar detection capabilities at comparable speeds. With respect to slower rotating probes, arrays can provide comparable detection capabilities and better characterization.
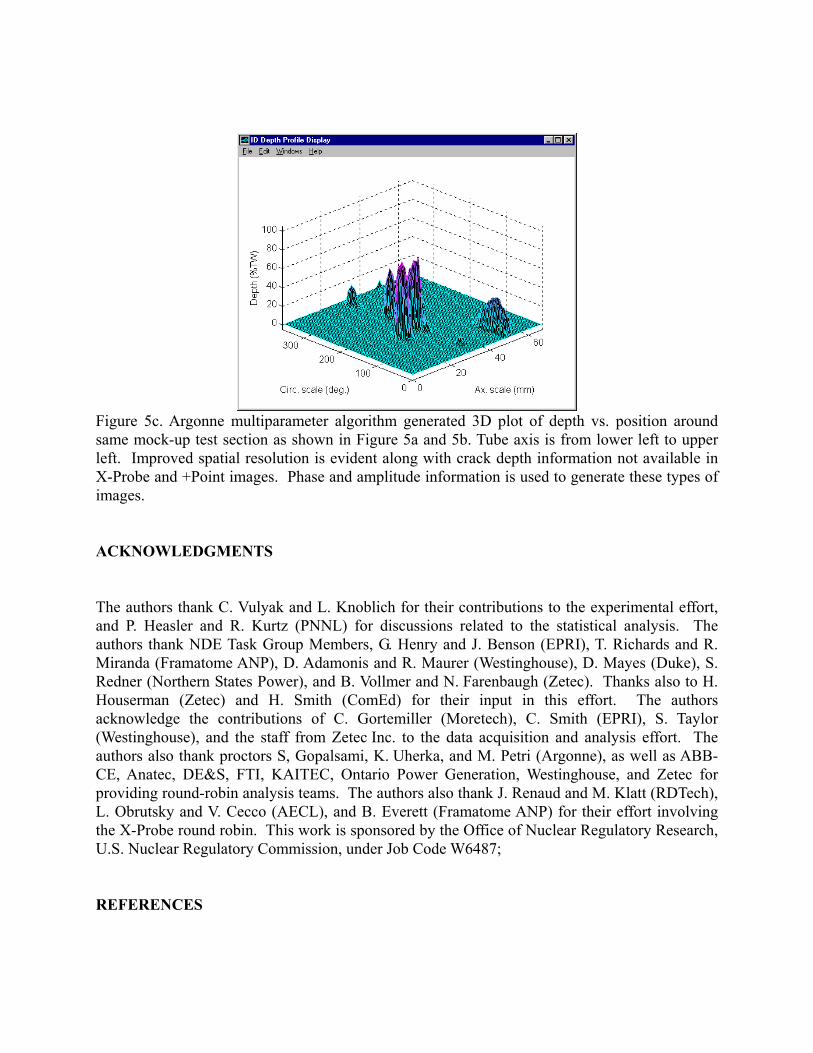
Figure 5c. Argonne multiparameter algorithm generated 3D plot of depth vs. position around same mock-up test section as shown in Figure 5a and 5b. Tube axis is from lower left to upper left. Improved spatial resolution is evident along with crack depth information not available in X-Probe and +Point images. Phase and amplitude information is used to generate these types of images. ACKNOWLEDGMENTS The authors thank C. Vulyak and L. Knoblich for their contributions to the experimental effort, and P. Heasler and R. Kurtz (PNNL) for discussions related to the statistical analysis. The authors thank NDE Task Group Members, G. Henry and J. Benson (EPRI), T. Richards and R. Miranda (Framatome ANP), D. Adamonis and R. Maurer (Westinghouse), D. Mayes (Duke), S. Redner (Northern States Power), and B. Vollmer and N. Farenbaugh (Zetec). Thanks also to H. Houserman (Zetec) and H. Smith (ComEd) for their input in this effort. The authors acknowledge the contributions of C. Gortemiller (Moretech), C. Smith (EPRI), S. Taylor (Westinghouse), and the staff from Zetec Inc. to the data acquisition and analysis effort. The authors also thank proctors S, Gopalsami, K. Uherka, and M. Petri (Argonne), as well as ABB-CE, Anatec, DE&S, FTI, KAITEC, Ontario Power Generation, Westinghouse, and Zetec for providing round-robin analysis teams. The authors also thank J. Renaud and M. Klatt (RDTech), L. Obrutsky and V. Cecco (AECL), and B. Everett (Framatome ANP) for their effort involving the X-Probe round robin. This work is sponsored by the Office of Nuclear Regulatory Research, U.S. Nuclear Regulatory Commission, under Job Code W6487; REFERENCES
1. D. R. Diercks, S. Bakhtiari, K. E. Kasza, D. S. Kupperman, S. Majumdar, J. Y. Park, and W. J. Shack, “Steam Generator Tube Integrity Program, Annual Report, October 1999-September 2000,” NUREG/CR-6511, Vol. 8, U.S. Nuclear Regulatory Commission, Washington, DC, February 2002. 2. S. Bakhtiari, J. Y. Park, D. S. Kupperman, S. Majumdar, and W. J. Shack, “Advanced NDE for Steam Generator Tubing,” NUREG/CR-6746, U. S. Nuclear Regulatory Commission, Washington, DC, August 2001.