Embed Size (px)
Citation preview

Edelweiss Financial Services Limited
Q4FY18 and FY18 Earnings Update

Safe Harbour
2
DISCLAIMERS:This presentation and the discussion may contain certain words or phrases that are forward - looking statements, which are tentative, based on currentexpectations of the management of Edelweiss Financial Services Ltd. or any of its subsidiaries and associate companies (“Edelweiss”). Actual results may varysignificantly from the forward-looking statements contained in this presentations due to various risks and uncertainties. These risks and uncertainties include theeffect of economic and political conditions in India and outside India, volatility in interest rates and in the securities market, new regulations and Governmentpolicies that may impact the businesses of Edelweiss as well as the ability to implement its strategy. The information contained herein is as of the date referencedand Edelweiss does not undertake any obligation to update these statements. Edelweiss has obtained all market data and other information from sourcesbelieved to be reliable or are its internal estimates unless otherwise stated, although its accuracy or completeness can not be guaranteed. The presentationrelating to business wise financial performance, ex-insurance numbers, balance sheet, asset books of Edelweiss and industry data herein is reclassified/regroupedbased on Management estimates and may not directly correspond to published data. The numbers have also been rounded off in the interest of easierunderstanding. Numbers have been re-casted, wherever required. PAT ex-ins is excluding Minority Interest. Prior period figures have been regrouped/reclassifiedwherever necessary. All information in this presentation has been prepared solely by the company and has not been independently verified by anyone else.This presentation is for information purposes only and does not constitute an offer or recommendation to buy or sell any securities of Edelweiss. Thispresentation also does not constitute an offer or recommendation to buy or sell any financial products offered by Edelweiss. Any action taken by you on the basisof the information contained herein is your responsibility alone and Edelweiss or its directors or employees will not be liable in any manner for the consequencesof such action taken by you. Edelweiss and/or its directors and/or its employees may have interests or positions, financial or otherwise, in the securitiesmentioned in this presentation.
Edelweiss Financial Services Limited Corporate Identity Number: L99999MH1995PLC094641For more information, please visit www.edelweissfin.com or drop us an e-mail on [email protected].
NOTES:
Slide 5,7,15: Balance Sheet numbers are on net basis
Slide 7: Distressed Credit (ARC assets) and Funds under Management have been calculated after removing Edelweiss contribution
Slide 21: Insurance includes General Insurance loss of INR 10 Cr in Q4FY18; BMU, Corp & Others includes profits from discontinued businesses for past periods
Slide 31: Gross and Net NPA% calculated excluding Distressed Credit and Episodic book
Slide 48: Net Worth Includes unrealised gains on equity and mutual fund investments per IRDA norms
Slide 53: Others includes Provident Funds, Insurance companies & Corporates
Slide 56: Key institutional shareholders: Holding of known affiliates have been clubbed together for the purpose of this information

Contents
3
2
3
4
Quarterly Performance Highlights
Overview & Business Approach
Business Performance Highlights
1
Annual Performance Overview
5 ESG at Edelweiss

Overview & Business Approach

7.3%
22.1%
FY12 FY18
Edelweiss at a Glance
5
PAT Consolidated Balance Sheet Assets Customer Assets
128
890
FY12 FY18
7,500
1,68,900
FY12 FY18
13,289
55,086
FY12 FY18
1.2%
2.6%
FY12 FY18
141
1,036
FY12 FY18
INR Cr
PAT Ex-Insurance RoE Ex-Insurance RoA Ex-Insurance

We are a Diversified Financial Services Company
6
Credit
• Retail Credit
• Corporate Credit
• Distressed Credit
Insurance
• Life Insurance
• General Insurance
Franchise & Advisory
• Wealth Management
• Asset Management
• Capital Markets
Bank-like business model
Multiple vectors of growth
Consistent growth and profitability
Reduction in volatility
Growth aligned with market tailwinds
Career opportunities and retention of management

7
Customer Assets
Distressed Credit (ARC Assets)
Assets Under Advice (Wealth Management)
43%
9%
49%
1,68,900
37,800
90,100
YoY Growth
Total Assets 43%2,24,000
As on 31st March’18 (rounded off to nearest 100) INR Cr
Funds under Management (Asset Management) 56%28,300
Clients
~12 lacs
Employees
10,052
Assets under Custody & Clearing 171%12,700
Balance Sheet Assets 42%55,100
Offices
448
Our Asset Base is a Mix of Own and Customer Related Assets…

…Generating Profits from both Spread and Fee Income
8
Business SegmentsFY18 Pre MI PAT
(INR Cr)% Contribution
Credit Business
Retail Mortgage 66
LAS, SME, Agri and Business Loans 134
Structured Collateralised Credit 159
Wholesale Mortgage 180
Distressed Credit 192
Franchise & Advisory Business
Wealth Management & Asset Management 162
Capital Markets 146
BMU, Corporate and Others 83
Total Ex- Insurance 1,122 100%
15%
13%
7%
14%
16%
6%
12%
17%

1,535 2,115
2,799
4,188
6,031
8,952
16,188
FY12 FY13 FY14 FY15 FY16 FY17 FY18
Retail Credit - Capital Employed
(INR Cr)
Our Assets are Increasingly Retail on the Credit Side…
9
Retail credit is now 39% of the total credit bookKey vectors for our growth will be SME Loans and Retail Mortgages
Building Platform

4,800 7,000 8,900
17,700
29,500
60,300
90,100
FY12 FY13 FY14 FY15 FY16 FY17 FY18
…And on the Wealth Management Side
10
Wealth Management AUA (INR Cr)
We cater to UHNI as well as the fast-growing Affluent segments

6,315
23,418
40,214
54,738
81,424
1,17,323
1,67,791
FY12 FY13 FY14 FY15 FY16 FY17 FY18
11
We are one of the Fastest Growing Life Insurance Companies
9
34
63
97
138
165
251
FY12 FY13 FY14 FY15 FY16 FY17 FY18
Collected Individual APE (INR Cr) Number of Policies in force
Agency-led multi-channel distribution approach

Cost to income ratio (Ex-Insurance)
Scale Benefits Leading to Operating Efficiencies…
12
70%
65%
59% 59% 60%
54%
47%
FY12 FY13 FY14 FY15 FY16 FY17 FY18

…Aided by Technology Initiatives across Businesses
13
Retail Lending
• Digital lending enabled by India Stack
Life Insurance
• Lead management system across channels,integrated with policy issuance systemsDigital Acquisition
Retail Lending
• Automated underwriting and risk assessment
Global Risk
• Integrated risk engagement and development platform
Risk
Global Risk
• Provide early warning signals
• Enable proactive action on portfolio
Capital Markets
• Insurance aggregator platform for B2B clients
Wealth Mgmt
• ESOP desk – end to end processing for corporates
Wealth Mgmt
• State of art desktop trading platform
• Advanced technical analysis Customer Experience
Wealth Mgmt
• Edelweiss Mobile Trader >1.7 lakh users
• Contributing to 50% of online revenue
Life Insurance
• End to end portal for managing agents, from on-boarding to pay outs
Asset Mgmt
• Distributor platform to manage clients account opening, transactions, and portfolio tracking Distribution
We have Significantly Improved Balance Sheet Efficiency…
14
RoE
7.3%
11.3%12.2%
15.6%
18.6%
20.7%22.1%
6.0%7.6% 8.2%
11.3%12.9%
15.5%17.1%
FY12 FY13 FY14 FY15 FY16 FY17 FY18
Ex-Insurance RoE Consolidated RoE
RoA
1.2%
1.7%1.9% 1.9%
1.8%
2.4%2.6%
1.2% 1.2%1.4%
1.5%1.3%
1.7%
2.0%
FY12 FY13 FY14 FY15 FY16 FY17 FY18
Ex-Insurance RoA Consolidated RoA
…As reflected in profitability across business cycles

PAT (INR Cr) Balance Sheet (INR Cr)
27% growth in balance sheet assets supported a 38% growth in profits
13,289 14,529 16,204
27,072
32,145
38,667
55,086
FY12 FY13 FY14 FY15 FY16 FY17 FY18
…Ensuring Our Diversified Model Delivers Consistent Growth
15
128178
220
329
414
609
890
FY12 FY13 FY14 FY15 FY16 FY17 FY18

Consolidated PAT CAGR was 38% Over 28 Quarters
16
33 27 3546 48 51 57
70 69 62 68 7289 90 98 103 111 120
133154 155 166
187212 222
234
272
308
33 26 29 39 40 42 46 51 56 4658 61
78 79 83 88 91 96 106122
140 144 155170
196209
236248
Q1
FY1
2
Q2
FY1
2
Q3
FY1
2
Q4
FY1
2
Q1
FY1
3
Q2
FY1
3
Q3
FY1
3
Q4
FY1
3
Q1
FY1
4
Q2
FY1
4
Q3
FY1
4
Q4
FY1
4
Q1
FY1
5
Q2
FY1
5
Q3
FY1
5
Q4
FY1
5
Q1
FY1
6
Q2
FY1
6
Q3
FY1
6
Q4
FY1
6
Q1
FY1
7
Q2
FY1
7
Q3
FY1
7
Q4
FY1
7
Q1
FY1
8
Q2
FY1
8
Q3
FY1
8
Q4
FY1
8
Ex-Insurance PAT Consolidated PAT
Profit after Tax (INR Cr)
Sustained PAT growth trajectory

Aspirations for 2020 : Our Report Card
17
Consistently grow our PAT at 25% - 35% annually1
Achieve a Consolidated RoE% of at least 18% 2
Achieve an Ex-Insurance RoE of at least 22%3
Bring down Ex-Insurance Cost to Income Ratio to below 50%4
Increase Retail Credit Book to 50% of Total Credit Book5
Maintain our asset quality with GNPA below 2%6
Enhance long term credit rating to AAA7
FY17
47%
15.5%
20.7%
54%
33%
1.59%
AA
FY18
46%
17.1%
22.1%
47%
39%
1.75%
AA
2020 Aspirations as disclosed in FY17

Quarterly Performance Highlights – Q4FY18

Q4FY18 Performance Highlights
19
Consistent growth in profits…
• Consolidated PAT growth of 46% YoY
• Ex-Insurance PAT growth of 45% YoY
1
…Distributed across businesses
• Credit business grew 50% YoY
• Franchise & Advisory business grew 28% YoY
2
Key performance parameters
• Consolidated RoE 15.3%
• Consolidated RoA 1.8%
• Consolidated C/I ratio 62%
3Ex-Insurance RoE 21.6%
Ex-Insurance RoA 2.8%
Ex-Insurance C/I ratio 45%

Consolidated Q4FY18 PAT Growth of 46%
20
PATConsolidated
(INR Cr)
PAT Ex-Insurance
Balance Sheet
Y-o-Y Growth
46%
45%
42%
170
Q4FY17
212
38,667
248
Q4FY18
308
55,086
1
236
Q3FY18
48,796
272
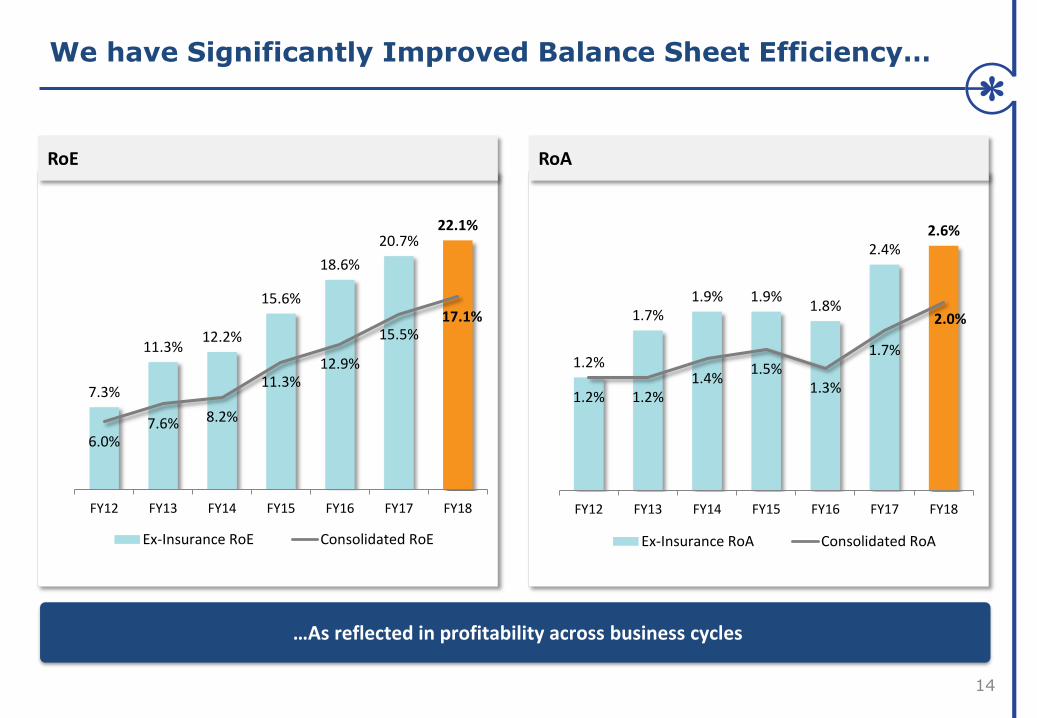
Profit Growth Across Businesses
21
(INR Cr) Q4FY17 Q3FY18 Q4FY18Y-o-Y
Growth
PAT 170 236 248 46%
Credit 128 167 192 50%
Franchise & Advisory 78 79 99 28%
Insurance (42) (35) (60) -
BMU, Corp & Others 7 25 17 -
2
FY16 FY17 FY182 Year CAGR
414 609 890 47%
337 447 645 38%
72 193 308 106%
(104) (110) (146) -
110 79 83 -

Key Ratios
Key Performance Parameters
22
Consolidated Q4FY17 Q3FY18 Q4FY18 FY17 FY18
RoE 16.1% 17.4% 15.3% 15.5% 17.1%
RoA 1.7% 2.0% 1.8% 1.7% 2.0%
Cost to Income Ratio 67% 59% 62% 67% 60%
Ex-Insurance Q4FY17 Q3FY18 Q4FY18 FY17 FY18
RoE 22.2% 22.5% 21.6% 20.7% 22.1%
RoA 2.7% 2.6% 2.8% 2.4% 2.6%
Cost to Income Ratio 51% 46% 45% 54% 47%
3
RoE has dropped due to equity infusion at Edelweiss level and Life Insurance (full quarter impact)
C/I increase is due to seasonality of LI business

Annual Performance Overview - FY18

Financial Snapshot – FY18
24
INR Cr EOP Equity Profit after Tax RoE RoA
Pre Minority
Credit 5,624 731 18.1% 2.2%
Franchise & Advisory 225 308
BMU, Corp & Others 618 83 9.7% 1.0%
Life & General Insurance 1,296 (260)
(-) Minority 1,089 (28)
Total Consolidated 6,673 890 17.1% 2.0%
Total Ex-Insurance 5,944 1,036 22.1% 2.6%
RoE is calculated on Average Equity

Credit Business Performance Snapshot
25
Credit Business FY18(INR Cr)
Total Y-o-Y Retail Y-o-Y Corporate Y-o-Y Distressed Y-o-Y
EOP Capital Employed 42,010 52% 16,188 81% 19,525 41% 6,297 32%
EOP Equity 5,624 49% 1,574 68% 2,873 36% 1,177 61%
Net Interest Income 2,608 54% 661 54% 1,462 37% 485 141%
PAT 731 44% 200 64% 339 18% 192 98%
• Growth driven by our diversified credit book
• Scale up Corporate Credit opportunity through co-investment from Asset Management fund
• Focus on increasing Retail Credit book
Net Interest Margin 7.7% 5.2% 9.4% 9.1%
Cost to Income 34% 46% 31% 27%
RoE 18.1% 15.8% 18.8% 20.0%
RoA 2.2% 1.6% 2.2% 3.6%
PAT and RoE are Pre MI

Franchise & Advisory Business Performance Snapshot
26
Franchise & Advisory Business FY18 (INR Cr)
Total Y-o-YWealth Mgmt
Y-o-Y Asset Mgmt
Y-o-YCapital Mkts
Y-o-Y
Net Revenue 1,330 25% 580 28% 130 151% 620 12%
PAT 308 60% 130 83% 32 354% 146 28%
Cost to Income 65% 67% 63% 64%
Cost to income ratio down from 85% in FY16 to 65% in FY18 as businesses scale up
Assets under AdviceAssets under Management
Assets under Custody and Clearing
90,100 49% 29,200 60% 12,700 171%
Customer Assets

Life Insurance Performance Snapshot
27
(INR Cr) FY18 Y-o-Y
Net Premium Income 619 45%
Investment & Other Income 163 8%
Total Business 782 36%
Profit After Tax (233) -
Minority (114) -
Edelweiss’ share in PAT (119) -
Net Worth 1,156 58%
Equity infusion in Q3FY18 from Edelweiss and JV partner Tokio Marine to fund growth

Business Update
CREDIT
Retail Credit – Corporate Credit – Distressed Credit

Credit Business is a Mix of Diversified and Scalable Assets
29Credit Franchise & Advisory Life Insurance
As on 31st March ’18Capital Employed
(INR Cr)
% Share
Retail Credit 16,188 39%
Retail Mortgage 6,672 16% Blend of loans to home owners and home buyers
SME & Business Loans 3,677 9% Underserved and highly scalable, focus area for future
Loan against Securities 4,640 11% Catering to Retail & Wealth Mgmt customers in Capital Markets
Agri and Rural Finance 1,199 3% Large scalable opportunity with low competitive intensity
Corporate Credit 19,525 46%
Structured Collateralised Credit 9,352 22% Customized credit solutions with robust risk management systems
Wholesale Mortgage 10,173 24% Developer financing for primarily residential properties
Distressed Credit 6,297 15% Leading Asset Reconstruction Company in India
Total Credit Book 42,010 100%

FY17 FY18
27,608 42,010
16.2% 16.3%
10.3% 9.8%
7.2% 7.7%
1,695 2,608
36% 34%
319 616
447 645
18.2% 18.3%
2.1% 2.2%
Credit Business at a Glance
30Credit Franchise & Advisory Life Insurance
Credit Business (INR Cr)
Capital Employed
Average Interest Yield
Average Cost of Borrowing
Net Interest Margin
Net Revenue
Cost to Income
Provisions & Write Offs
PAT
RoE
RoA

Asset Quality at a Glance
31Credit Franchise & Advisory Life Insurance
Outstanding Provision Held and Total Provision Cover includes Standard Asset Provisioning
At the end of FY17 FY18
Gross NPA (INR Cr) 362 624
Gross NPA % 1.59% 1.75%
Net NPA % 0.60% 0.70%
Outstanding Provision Held (INR Cr) 314 507
Total Provision Cover 87% 81%
Average Collateral cover on Corporate book 2.3X 2.1X
Average Loan-To-Value on Retail book ~45% ~45%

SME Retail Mortgage
Secured UnsecuredSmall
Ticket HLLAP
Average Yields % 13% 20% 11% 11%
Median Ticket Size 1 Cr 13 lacs 12 lacs 20 lacs
Retail Credit Expanding Footprint
32Credit Franchise & Advisory Life Insurance
8,952
14,200
16,188
8,952
16,188
Q4FY17
Q3FY18
Q4FY18
FY17 FY18
Business HighlightsCapital Employed
(INR Cr) SME
• Originations up 76% on Y-o-Y basis
• Digital journey (Phygital) begun - Enhanced efficiency and client
experience
• 88 locations live up from 17 locations as on March’17
Retail Mortgage
• Strong FY18 with originations up 147% on Y-o-Y basis

Business HighlightsCapital Employed
(INR Cr)
Calibrated Growth in Corporate Credit
33Credit Franchise & Advisory Life Insurance
13,875
16,372
19,525
13,875
19,525
Q4FY17
Q3FY18
Q4FY18
FY17 FY18
• Risk-management centered approach to collateralized lending
• In house team of experts for carrying out detailed evaluations
− Counterparty, Collateral and Cash flows
• Ring fenced structures and hybrid collateral pool ensures
lower loss given defaults
• Incremental growth to largely come through the fund
structure going forward

Agri Credit Expected to Scale Up
34
Business Highlights
• One of the few organized players providing end to end business solutions in the Agri value chain
• Leveraging the large opportunity size of the Agri financing industry
• Continued focus on increasing the credit book; disbursements grew by 93% on a YoY basis
• Network of 523 warehouses across 17 states in India; investments in risk management capabilities
• Empanelled with 19 banks for Collateral Management Services
Credit Franchise & Advisory Life Insurance
Agri Credit Book Size (INR Cr) Collateral Value (INR Cr)
9461,761
2,747 735
828
745
FY16 FY17 FY18
Collateral Manager Stock Storage Stock
1,6812,589
262
463
885
FY16 FY17 FY18
3,492

Distressed Credit Performance on Track…
35Credit Franchise & Advisory Life Insurance
Business Highlights
• Focus on large operating and EBITDA earning assets that need
financial restructuring
• Strong focus on resolutions aided by changes in Insolvency
and Bankruptcy Code norms
• Actively targeting opportunities in the second round of NCLT
cases
• AUM stood at INR 44,100 Cr as on 31st March 2018
4,781
5,543
6,297
4,781
6,297
Q4FY17
Q3FY18
Q4FY18
FY17 FY18
Capital Employed
(INR Cr)

…With Improvement in Recoveries
36
677
1,082
2,574
FY16 FY17 FY18
Top 10 industry exposure% by Acquisition price
18%
12%7%
8%
7%
7%
6%
5%4%4%
22%
Steel
Power
Cement
Real Estate
Infrastructure
Paper
Textiles
Chemicals
Ship Building
Ports
Others
ARC Recoveries (INR Cr)
Credit Franchise & Advisory Life Insurance

Business Update
FRANCHISE & ADVISORY
Wealth Management – Asset Management – Capital Markets

Franchise & Advisory Business at a Glance
38Credit Franchise & Advisory Life Insurance
Franchise & Advisory (INR Cr)
FY17 FY18
Net Revenue 1,060 1,330
Cost to Income 73% 65%
PAT 193 308

Assets Under Advice (INR Cr)
Wealth Management AUA Continues to Scale Up…
39Credit Franchise & Advisory Life Insurance
60,300
84,700 90,100
60,300
90,100
Q4FY17
Q3FY18
Q4FY18
FY 17 FY 18
Business Highlights
• Over 50% CAGR growth in AUA in the last 5 years
• Maintained yields of ~70-80 bps on AUA
• Added 63 RMs in the UHNI business, bringing the total strength
to 172
As on31st Mar’18
Number of Clients
AUA (INR cr)
Number of RMs
Ultra High Net Worth Individuals 1,250 69,100 172
Affluent 4,50,000 21,000 654

…Driving Efficiency and Productivity…
40
90% 88%
76%
67%
FY15 FY16 FY17 FY18
Cost to Income Ratio AUA per Rupee of Total Cost
… through digitization of core and front end technology platform
126 138
175
232
FY15 FY16 FY17 FY18
Credit Franchise & Advisory Life Insurance
INR

Wealth Management Business Overview
41
60,300
15,100
14,700
90,100
OpeningAUA
Net NewMoney
MarketMovement
Closing AUA
94% 89%73% 74%
6% 11%27% 26%
FY15 FY16 FY17 FY18
Distribution Assets Advisory Assets
Wealth AUA Movement in FY18Wealth AUA Breakup INR Cr
Credit Franchise & Advisory Life Insurance

Credit Franchise & Advisory Life Insurance
Asset Management has Healthy Growth in AUM
42
Alternative Assets (INR Cr)
Mutual Funds AUM (INR Cr)
11,40015,200 17,700
11,400
17,700
Q4FY17
Q3FY18
Q4FY18
FY17 FY18
6,800
10,800 11,500
6,800
11,500
Q4FY17
Q3FY18
Q4FY18
FY17 FY18
Alternative Assets
• Raised INR 1,530 Cr in first closure of Edelweiss Infra Yield Fund
• Deployed ~INR 1,000 Cr across real estate and stressed funds in Q4 FY18
Mutual Funds
• Garnered ~INR 350 Cr in Edelweiss Maiden Opportunities Fund launched in Q4 FY18
• Increase in investor base by over 50% in Q4FY18 over last quarter
Business Highlights
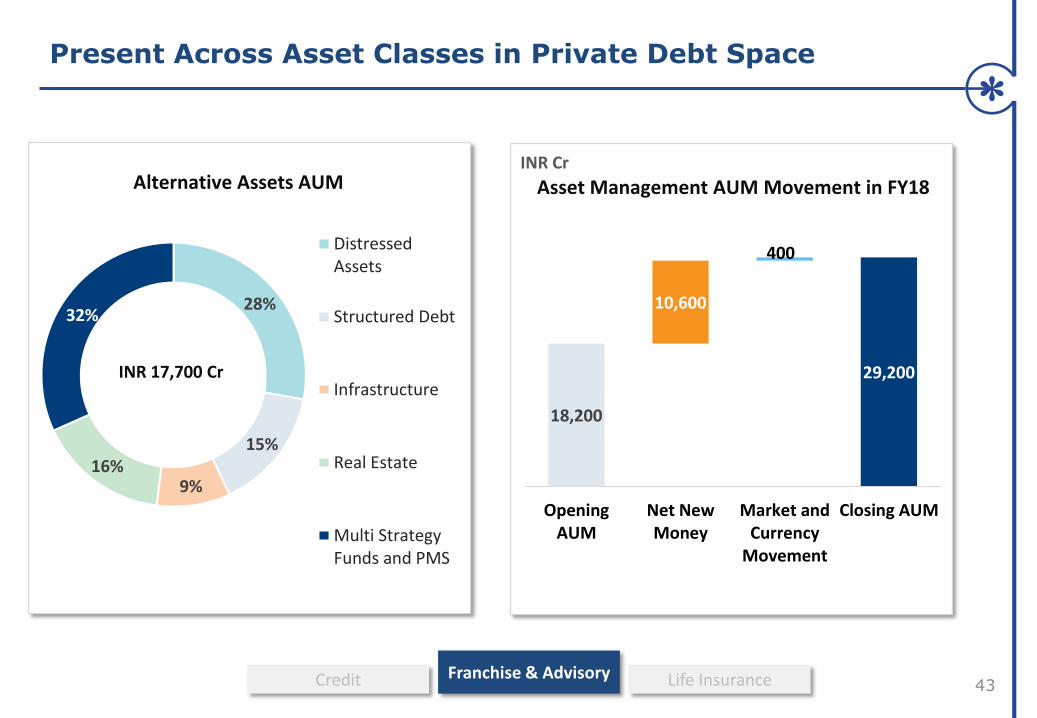
Present Across Asset Classes in Private Debt Space
43
18,200
10,600
400
29,200
OpeningAUM
Net NewMoney
Market andCurrency
Movement
Closing AUM
INR Cr
28%
15%
9%16%
32%
DistressedAssets
Structured Debt
Infrastructure
Real Estate
Multi StrategyFunds and PMS
INR 17,700 Cr
Alternative Assets AUM Asset Management AUM Movement in FY18
Credit Franchise & Advisory Life Insurance

Capital Markets Strong Performance Continues
44
Key Equity Capital Market Transactions
Credit Franchise & Advisory Life Insurance
Business Highlights
Equity Capital Markets
• Closed five capital market transactions during the quarter
• Increased block market share during the year from 4.1% to 4.6%
• Ranked 2nd in Global Custodian Agent Banks (ABEM) Survey
Debt Capital Markets
• Ranked 1st in placements of commercial paper with 23% share
for FY18
• Ranked 1st as arrangers of public issues with market share of
81% in FY18
Ranking and market share for Debt Capital markets as per Prime Database as on 1st May 2018
Key Debt Capital Market Transactions
QIP INR 1,000 Cr
BRLM
IPO INR 937 Cr
BRLM
Shriram Transport Finance
INR 995 Cr
Arranger
Power Finance Corporation
INR 2,795 Cr
Arranger
United India Insurance
INR 900 Cr
Arranger
IPO INR 2,000 Cr
BRLM

Business Update
Life Insurance

Distribution
• Agency-led multi-channel distribution approach with emphasis on productivity
• 121 branches and ~31,000 PFAs across 93 locations in India
Product Mix
Morningstar has rated all our ULIP funds 4 or 5 star
Investments Capability
Channel Mix
Credit Franchise & Advisory Life Insurance
Life Insurance – Long Term Value Creation
46
17%
9%13%12%
9% 10%
Equity Large Cap Fund Bond Fund Managed Fund
Fund Benchmark5 Year CAGR%
16%
31%31%
22%
Traditional Par Traditional Non Par ULIP Group
New Business Premium FY18
63%14%
2%
13%
8%
Agency Banca Broker Direct Edelweiss
Individual New Business Premium FY18
Product Mix and Channel Mix source: Audited FY18 Financials. Investment Data source: NSE, Crisil, Morningstar

One of the Fastest Growing in Individual Annual Premium
Equivalent
47
Collected Individual Annual Premium Equivalent CAGR growth since FY15
Credit Franchise & Advisory Life Insurance
Number of Policies Issued(Individual Business )
• Collected Individual Annual Premium Equivalent (APE) - INR 130 Cr for the quarter, growth of 56% YoY
• Indian Embedded Value (IEV) at INR 1,635 Cr as on 31st March’18
• Total Premium – INR 310 Cr for the quarter, growth of 52% YoY
• Leveraging technology
• Digital Sales (Vikram) for Agency is 62% and Direct Channel is 100% for Q4 FY18
• Claim Settlement Ratio has increased to 95% in FY18 from 93% in FY17
• 13th month overall persistency for FY18 is ~78%
Business Highlights
Industry data source : Life Insurance Council
22
15
31
Q4 FY17 Q3 FY18 Q4 FY18
(In '000)
37%
15% 16%
Edelweiss TokioLife Insurance
Peer Set Industry

Life Insurance – Key Financials
48Credit Franchise & Advisory Life Insurance
Edelweiss Tokio Life Insurance Company Limited (ETLI)
(INR Cr) FY17 FY18
Net Premium Income 426 619
Investment Income and Other Income 151 163
Total Business 577 782
Profit After Tax (216) (233)
Minority (106) (114)
Edelweiss’ Share in PAT (110) (119)
Net Worth 732 1,156
Indian Embedded Value (IEV) 1,081 1,635

Balance Sheet

Key Highlights – Balance Sheet
50
1
2
3
4
Matched Asset-Liability profile
Comfortable capital adequacy ratio at 17.04%
Diversified borrowings mix
Liquidity cushion at 9% of Balance Sheet
Stable business model reflected in credit ratings5

Matched Asset - Liability Profile
51
% o
f A
sset
s an
d L
iab
iliti
es
As on 31st March ‘18: INR 55,086 Cr
• Positive asset-liability matching across durations
• BMU manages ALM under the aegis of Asset Liability Committee
6%
24%
35%44%
65%
100%
6%
20% 23%
36%
65%
100%
Asset SpecificBorrowing
0-3 Mnth 3-6 Mnth 6-12 Mnth 1-3 years 3+ years
Assets Liabilities
1

Comfortable Capital Adequacy Ratio
52
Tier I
Tier II
Total Capital
Capital Structure as on 31st March 2018(INR Cr)
7,934
1,594
9,528
Risk Weighted Assets
55,904
88% of gross assets of INR 63,514 Cr
Capital Adequacy Ratio
17.04%
Debt/Equity : 4.9
(excluding Treasury assets )
2

Diversified Sources of Borrowing
53
30%
41%
7%
11%
11%
Sources of BorrowingsAs on 31st March’18
Total BorrowingsINR 47,323 Cr
Mutual Funds
Banks
Asset Specific
Borrowing
Retail
Others
3

Liquidity Cushion at 9% of Balance Sheet
54
• A well diversified liquidity
cushion comprising:
− Banking Lines
− Fixed Deposits
− Government Securities, Mutual Funds etc
• Steady growth in liquidity
cushion to provide for any liquidity event
• Continually evaluate the
composition through various instruments to ensure
immediacy, relevance and cost
efficiency
7801,270
2,700 2,750920
1,630
1,350
2,450
FY15 FY16 FY17 FY18
On Balance Sheet Off Balance Sheet
Liquidity Cushion
INR Cr
1,700
2,900
4,050
% of Balance Sheet
6% 9% 10% 9%
4
5,200

Stable Business Model Reflected in Credit Ratings
55
Purpose (Debt Programme) Rating agency Rating
Short term CRISIL A1+
Short term CARE A1+
Short term ICRA A1+
Long term BWR AA+
Long term CARE AA
Long term CRISIL AA
Long term ICRA AA
Long term SMERA AA+
5

Significant Institutional Ownership
56
43.9%
28.7%
22.5%
4.9%
Foreign Institutions
& Companies
Promoters & Employees
DIIs, Non Institutions
& Others
Employee Trust
Shareholding PatternKey Shareholders above 1% (As on 31st March’18)
Name Percent
1 BIH SA 4.20%
2 HDFC Mutual Fund 2.31%
3 Goldman Sachs Funds 1.93%
4 Steadview Capital Management 1.58%
5 Caisse de dépôt et placement du Québec (CDPQ) 1.53%
6 Vanguard 1.50%
7 DSP Blackrock 1.23%
8 Blackrock Fund Advisors 1.21%
9 Fidelity International 1.10%
10 Rakesh Jhunjhunwala 1.09%
11 Baron Funds 1.05%

ESG at Edelweiss

Our ESG Framework is based on the United Nations Sustainable
Development Goals
58
People Focused Goals
No Poverty, Zero Hunger & Economic Growth Quality Education Gender Equality
Planet Focused Goals
Affordable & Clean Energy Responsible Consumption Climate Support
Par
tne
rsh
ips

EdelGive Foundation - Unique Philanthropic Platform
IMPACTCAPACITY BUILDING
Non-Financial Support
Financial Support
PARTNERSHIPS
INVESTMENTS
Build Organizational
Capacity
Non-ProfitOrganization
FinancialGains
EdelGiveFoundation
Ede
lGiv
e p
latf
orm
s
Foundations
HNIs / Individuals
Corporates
Tow
ard
s a
hig
h im
pac
t so
cial
se
cto
r
Stronger Organizations
Philanthropy Network
Enhanced Social Impact
Focuses on Education, Livelihood and Women’s Empowerment

EdelGive Foundation - Key Metrics
60
Grants and Funding
Capacity Building – Non financial support
Employee Engagement % More than 85% engaged in financial and non financial giving
Man Hours spent till date 29,500 hrs
Field Visits till date 78
Employee Engagement
Grantees More than 95 NGOs
Funds Committed > INR 125Cr
Presence in Indian States 14 States
Funding Partners 108
Cumulative till date
Employees provided skills and time pro bono in over 60 projects till date
• Strategy and leadership
• Financial planning
• Systems, processes and technology
• Human resources

Creating Continuous Talent and Leadership Pipeline
61
• Institutionalized the ethos that in the workplace
leaders create leaders
• Our leadership programmes are focused towards
identifying and grooming leaders at every level
o Manco leadership team – 49
o Senior Leaders – 181
o Business and Emerging Leaders - 393
• Top management is a healthy mix of home grown
leaders and lateral hires
• Development endeavors at Edelweiss are
structured, framework driven and continuous
Leadership groups account for ~6% of the total employee strength
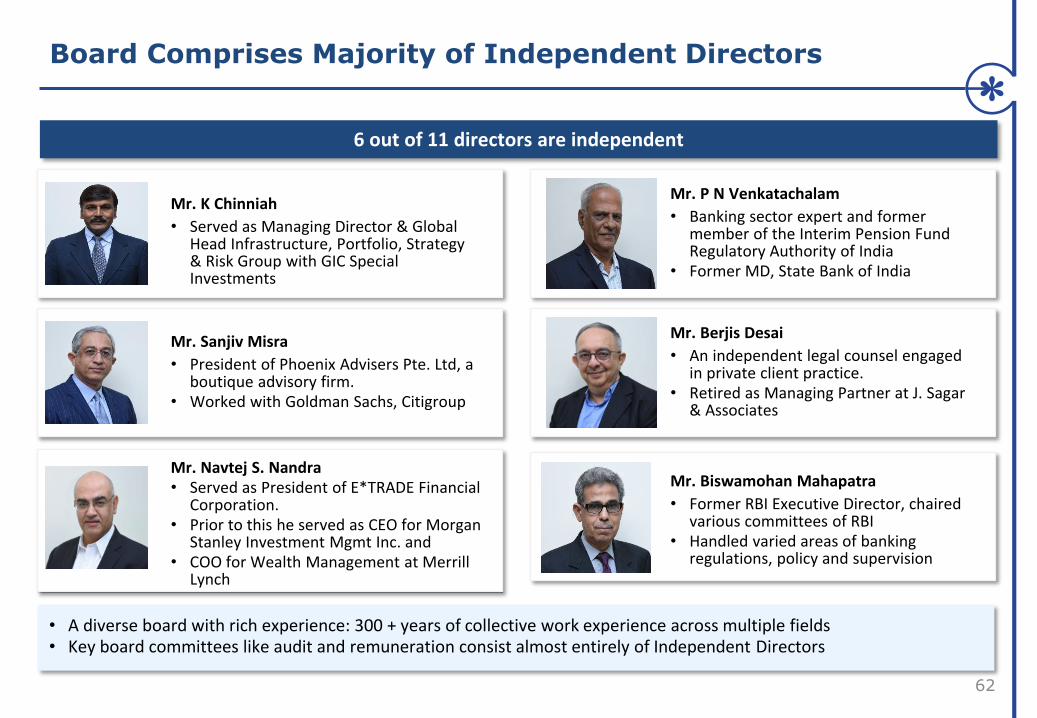
Board Comprises Majority of Independent Directors
62
6 out of 11 directors are independent
• A diverse board with rich experience: 300 + years of collective work experience across multiple fields• Key board committees like audit and remuneration consist almost entirely of Independent Directors
Mr. Sanjiv Misra
• President of Phoenix Advisers Pte. Ltd, a boutique advisory firm.
• Worked with Goldman Sachs, Citigroup
Mr. Berjis Desai
• An independent legal counsel engaged in private client practice.
• Retired as Managing Partner at J. Sagar & Associates
Mr. K Chinniah
• Served as Managing Director & Global Head Infrastructure, Portfolio, Strategy & Risk Group with GIC Special Investments
Mr. P N Venkatachalam
• Banking sector expert and former member of the Interim Pension Fund Regulatory Authority of India
• Former MD, State Bank of India
Mr. Navtej S. Nandra • Served as President of E*TRADE Financial
Corporation. • Prior to this he served as CEO for Morgan
Stanley Investment Mgmt Inc. and • COO for Wealth Management at Merrill
Lynch
Mr. Biswamohan Mahapatra
• Former RBI Executive Director, chaired various committees of RBI
• Handled varied areas of banking regulations, policy and supervision

63
Wealth Creators Super 50Dalal Street Journal 2018
Best Private Bank - IndiaAsiamoney Best Bank Awards 2018
Best Product Innovation - Wealth PlusET Now BFSI Awards 2017
Awards and Recognition
Fastest Growing Housing Finance CompanyGolden Globe Tigers Awards 2018
Best Housing Finance Company (mid & small) ET Now BFSI Awards 2017
Featured among India’s Super 50 CompaniesForbes India 2017