Embed Size (px)
Citation preview
P14043 Smart Cane Test Plans
T1- Rotation under Pressure Test
Date Completed:4/1/2014
Performed By: Aaron Vogel, Lauren Bell, Jess Davila, William McIntyre, Jake Luckman
Objective:
The objective of this test is to ensure that the rollers spin at specified speed range under the design grip pressure range.
Engineering Requirement: S1, S2, S3
S1: Maximum Grip Pressure of 3 PSI
S2: Rotation Speed Range at 3 psi of 20-60 RPM
S3: Rotation Speed Range at 0 psi of 20-60 RPM
Materials:
2”x12” nylon strap/ribbon
Electrical tape
0.4 lb weight (2psi)
0.6 lb weight (3psi)
0.8 lb weight (4psi)
Two tables
Power Management System with Microcontroller
Simulator box
Stopwatch
Handle Assembly
Material Resources:
Table (available in the Machine Shop)
Process:
1. Before finishing the assembly of the roller sub-assembly, use brightly colored paint to paint half of the circular support shaft diameter that faces in the normal direction towards the end cap. Then finish assembling the handle assembly and fasten handle to the cane using the cane-handle adapter.
P14043 Smart Cane Test Plans
2. Separate two tables and place handle across the gap with the rollers aligned with gap and secure with tape.
3. Remove end cap from the end of the handle so that the painted end of the shaft is visible to monitor rotation.
4. Simultaneously run the rollers clockwise and start the stopwatch. Count the number of rotations for 1 minute and record the rotational speed
5. Repeat Step 4 in the counterclockwise direction6. Hang the”2 psi” weighted strap loop onto the roller so that it stays in place during rolling.7. Repeat steps 4 and 5 with the weighted strap applying pressure to the rollers. Repeat with the
“3psi” and “4psi” weights.8. Repeat the procedure (steps 4 through 7) three times fully recharging the batteries for each set
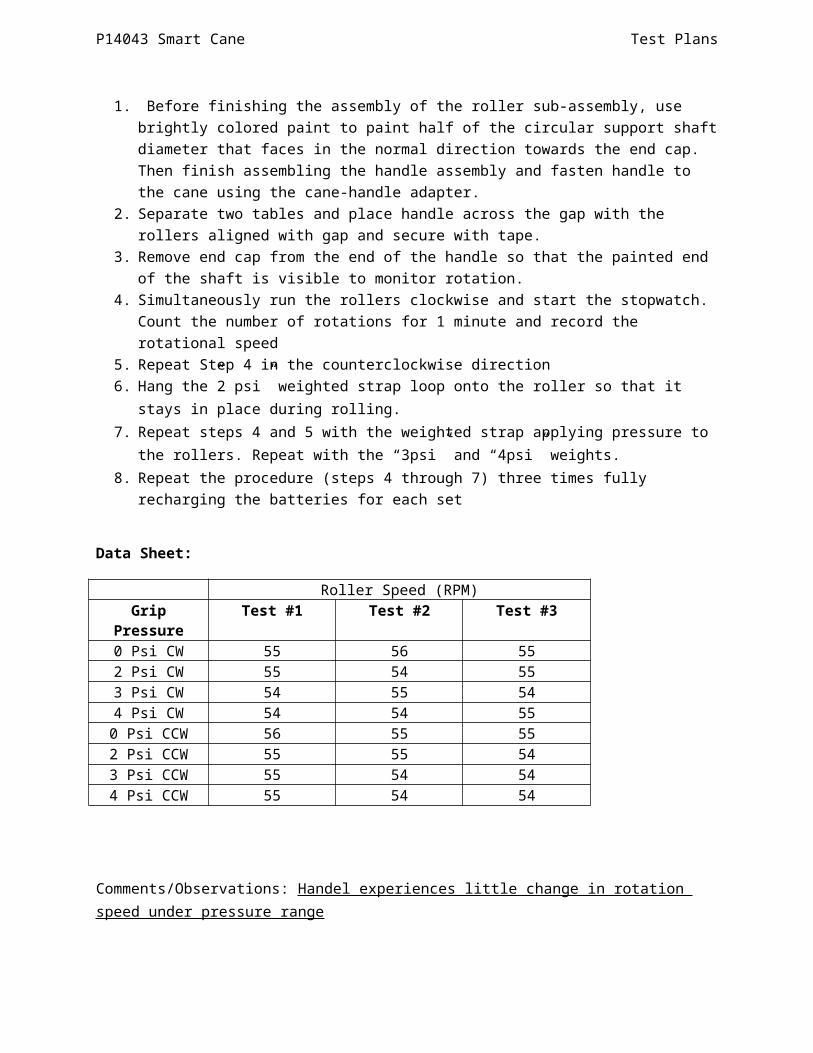
Data Sheet:
Roller Speed (RPM)Grip Pressure Test #1 Test #2 Test #3
0 Psi CW 55 56 552 Psi CW 55 54 553 Psi CW 54 55 544 Psi CW 54 54 55
0 Psi CCW 56 55 552 Psi CCW 55 55 543 Psi CCW 55 54 544 Psi CCW 55 54 54
Comments/Observations: Handel experiences little change in rotation speed under pressure range
P14043 Smart Cane Test Plans
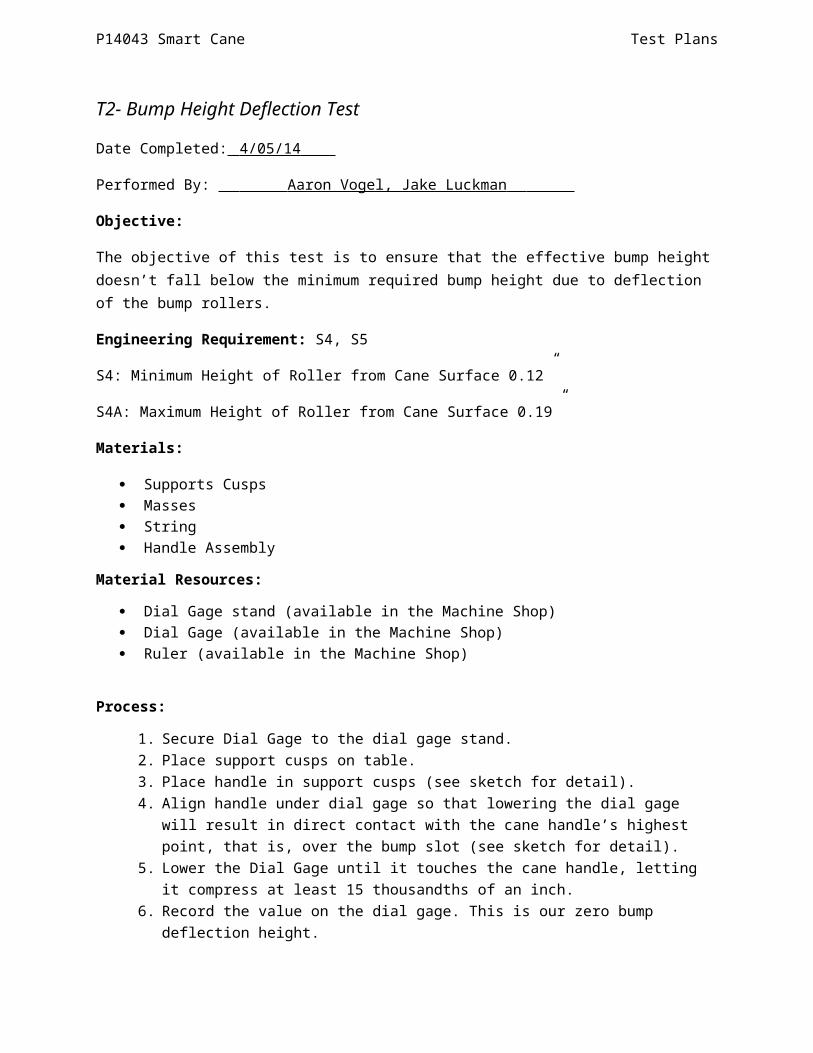
T2- Bump Height Deflection Test
Date Completed: 4/05/14
Performed By: Aaron Vogel, Jake Luckman
Objective:
The objective of this test is to ensure that the effective bump height doesn’t fall below the minimum required bump height due to deflection of the bump rollers.
Engineering Requirement: S4, S5
S4: Minimum Height of Roller from Cane Surface 0.12”
S4A: Maximum Height of Roller from Cane Surface 0.19”
Materials:
Supports Cusps Masses String Handle Assembly
Material Resources:
Dial Gage stand (available in the Machine Shop) Dial Gage (available in the Machine Shop) Ruler (available in the Machine Shop)
Process:
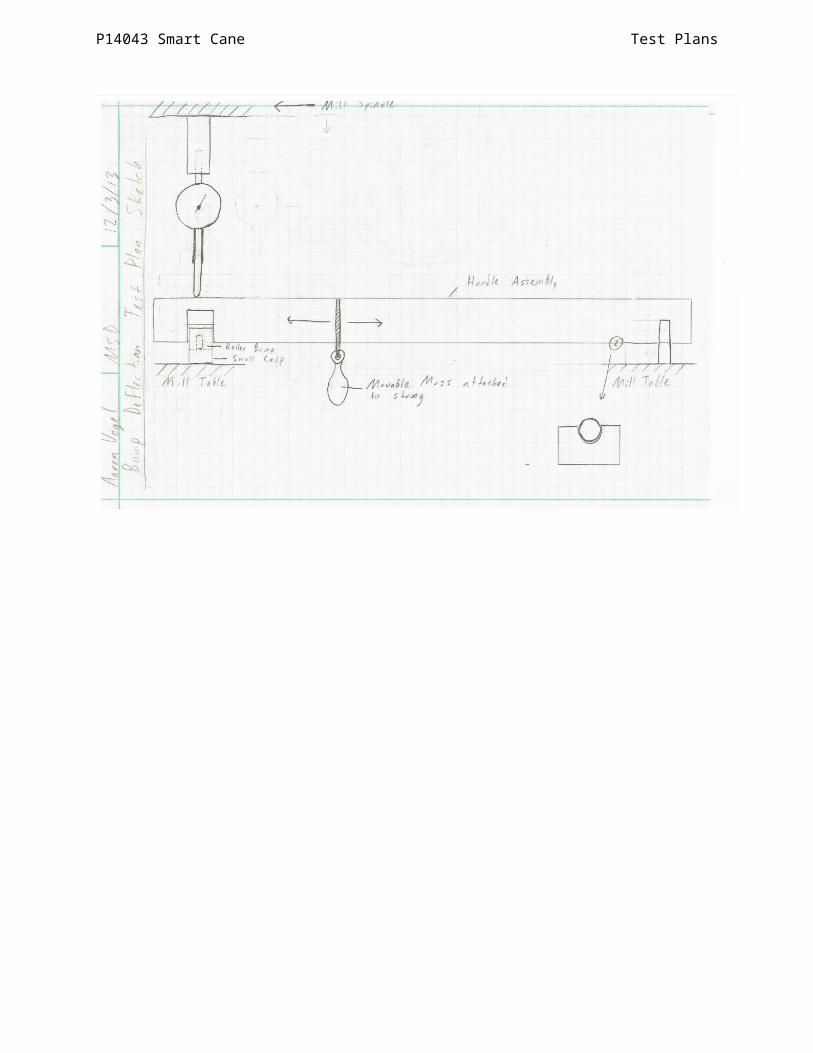
1. Secure Dial Gage to the dial gage stand.2. Place support cusps on table.3. Place handle in support cusps (see sketch for detail).4. Align handle under dial gage so that lowering the dial gage will result in direct contact with
the cane handle’s highest point, that is, over the bump slot (see sketch for detail).5. Lower the Dial Gage until it touches the cane handle, letting it compress at least 15
thousandths of an inch. 6. Record the value on the dial gage. This is our zero bump deflection height.7. Attach the mass to the center of the handle via string so that the mass is located directly
underneath the cane, with its weight centered underneath.8. Slide the stringed mass along the handle to appropriate locations that correspond to the
appropriate forces/pressures exerted on the bump bearings.9. Record the corresponding values of deflection from the dial gage.10. Repeat procedures 6-10 three times.
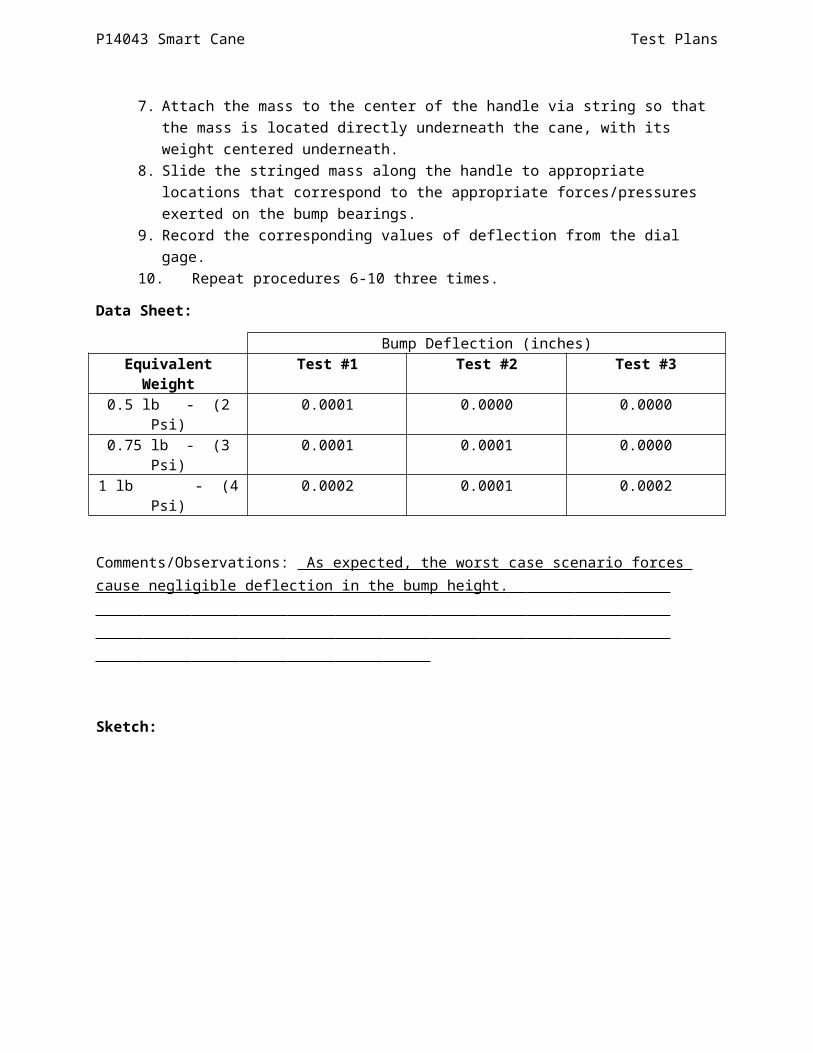
Data Sheet:
P14043 Smart Cane Test Plans
Bump Deflection (inches)Equivalent Weight Test #1 Test #2 Test #3
0.5 lb - (2 Psi) 0.0001 0.0000 0.00000.75 lb - (3 Psi) 0.0001 0.0001 0.00001 lb - (4 Psi) 0.0002 0.0001 0.0002
Comments/Observations: As expected, the worst case scenario forces cause negligible deflection in the bump height.
Sketch:
P14043 Smart Cane Test Plans
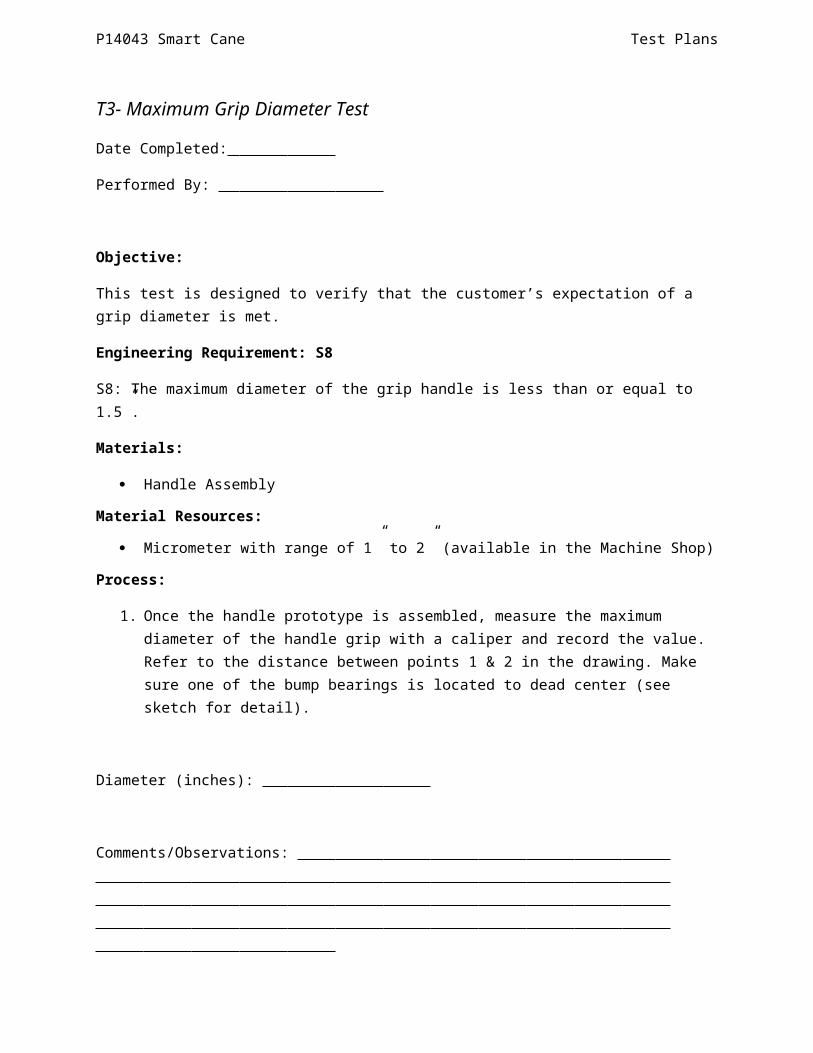
T3- Maximum Grip Diameter Test
Date Completed:
Performed By:
Objective:
This test is designed to verify that the customer’s expectation of a grip diameter is met.
Engineering Requirement: S8
S8: The maximum diameter of the grip handle is less than or equal to 1.5”.
Materials:
Handle Assembly
Material Resources:
Micrometer with range of 1” to 2” (available in the Machine Shop)
Process:
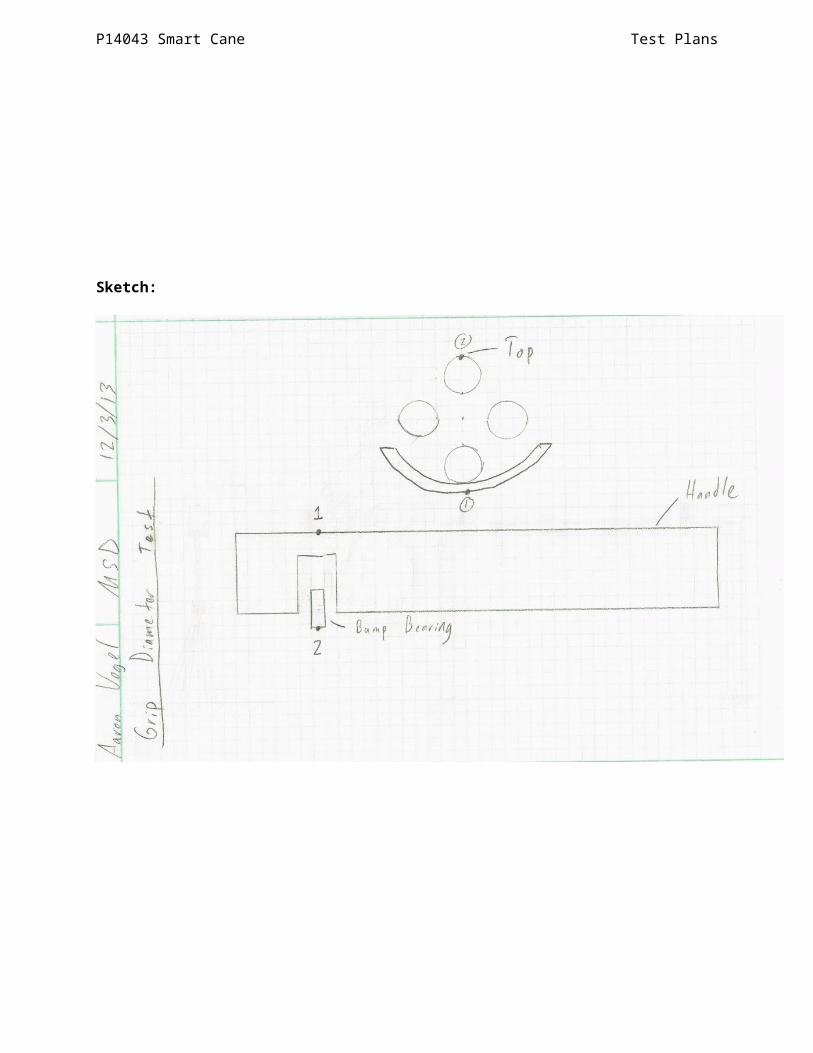
1. Once the handle prototype is assembled, measure the maximum diameter of the handle grip with a caliper and record the value. Refer to the distance between points 1 & 2 in the drawing. Make sure one of the bump bearings is located to dead center (see sketch for detail).
Diameter (inches):
Comments/Observations:
P14043 Smart Cane Test Plans
Sketch:
P14043 Smart Cane Test Plans
T4- Weight of the Handle Test
Date Completed:
Performed By:
Objective:
This test will be done to verify that the customer’s requirement of a handle that weighs less than or equal to 1 pound is met.
Engineering Requirement: S11
S11: The maximum weight of the handle must not exceed 1 pound.
Materials:
Handle Assembly
Material Resources:
Digital Scale (available from the ME Dept.)
Process:
1. Measure the weight of the handle assembly with the provided scale.2. Record the value.
Weight (lb.):
Comments/Observations:
P14043 Smart Cane Test Plans
T5- Motor Quality Test
Date Completed:
Performed By:
Objective:
This test will be done to ensure that the motor works prior to being assembled into the handle assembly.
Materials:
Motor 2 alligator clip style leads
Material Resources:
Power Supply (available from the ME Dept.)
Process:
1. Power the motor @ 6 volts using the power supply, and record whether it turns the motor shaft or not.
2. Switch the leads (switching the motors rotation direction), and repeat procedure 1.
Motor Works CW (Y/N)
Motor Works CCW (Y/N)
Comments/Observations:

P14043 Smart Cane Test Plans
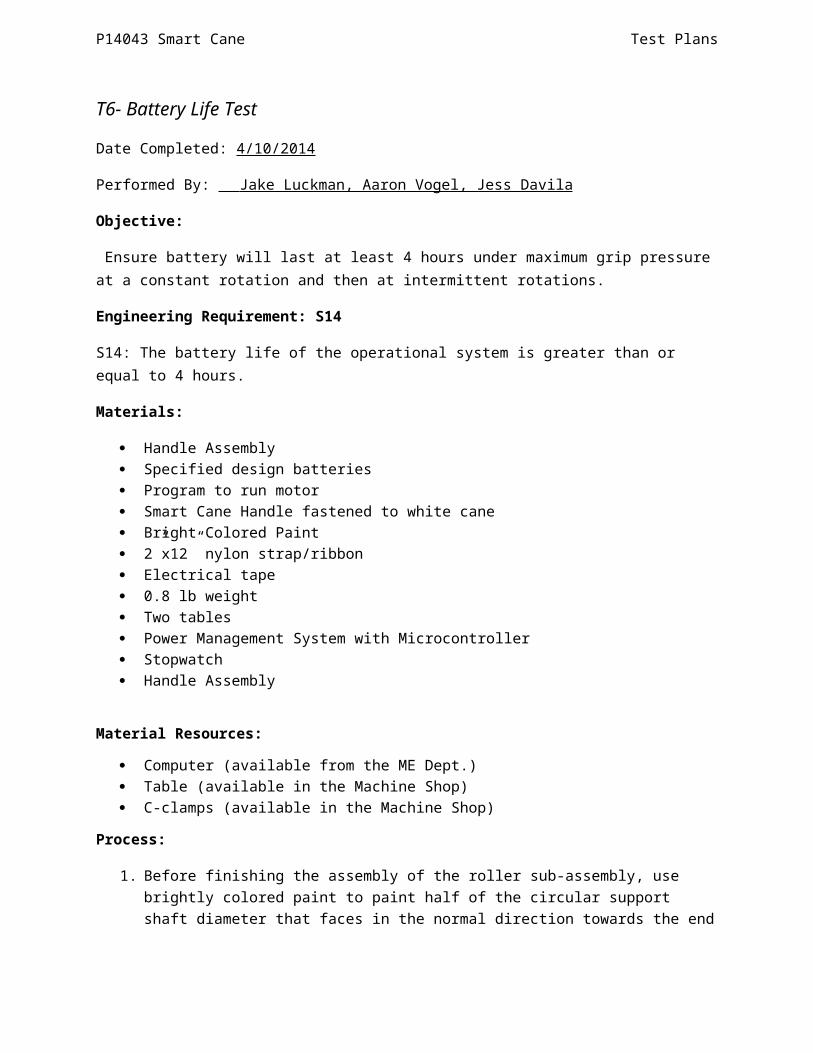
T6- Battery Life Test
Date Completed: 4/10/2014
Performed By: Jake Luckman, Aaron Vogel, Jess Davila
Objective:
Ensure battery will last at least 4 hours under maximum grip pressure at a constant rotation and then at intermittent rotations.
Engineering Requirement: S14
S14: The battery life of the operational system is greater than or equal to 4 hours.
Materials:
Handle Assembly Specified design batteries Program to run motor Smart Cane Handle fastened to white cane Bright Colored Paint 2”x12” nylon strap/ribbon Electrical tape 0.8 lb weight Two tables Power Management System with Microcontroller Stopwatch Handle Assembly
Material Resources:
Computer (available from the ME Dept.) Table (available in the Machine Shop) C-clamps (available in the Machine Shop)
Process:
1. Before finishing the assembly of the roller sub-assembly, use brightly colored paint to paint half of the circular support shaft diameter that faces in the normal direction towards the end cap. Then finish assembling the handle assembly and fasten handle to the cane using the cane-handle adapter.
2. Separate two tables and place handle across the gap with the rollers aligned with gap and secure with tape
3. Tape and secure the nylon strap loop to the weight.4. Hang the weighted strap loop onto the roller so that it stays in place during rolling.
P14043 Smart Cane Test Plans
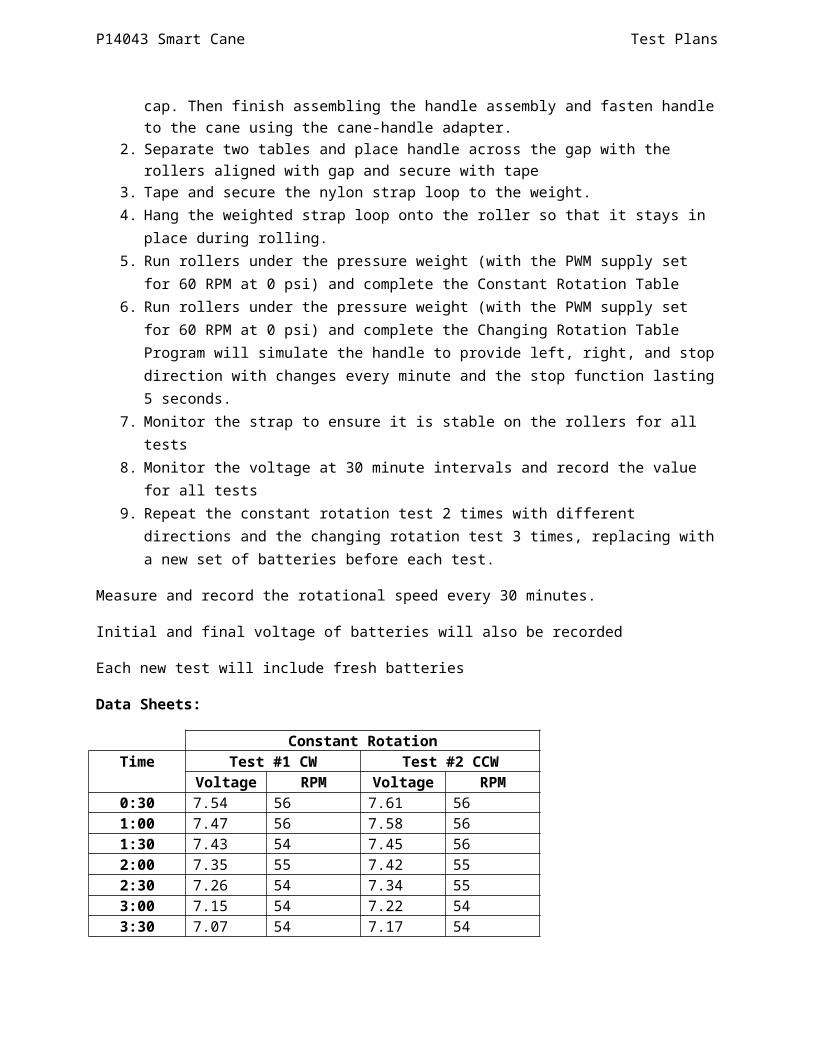
5. Run rollers under the pressure weight (with the PWM supply set for 60 RPM at 0 psi) and complete the Constant Rotation Table
6. Run rollers under the pressure weight (with the PWM supply set for 60 RPM at 0 psi) and complete the Changing Rotation TableProgram will simulate the handle to provide left, right, and stop direction with changes every minute and the stop function lasting 5 seconds.
7. Monitor the strap to ensure it is stable on the rollers for all tests8. Monitor the voltage at 30 minute intervals and record the value for all tests9. Repeat the constant rotation test 2 times with different directions and the changing rotation
test 3 times, replacing with a new set of batteries before each test.
Measure and record the rotational speed every 30 minutes.
Initial and final voltage of batteries will also be recorded
Each new test will include fresh batteries
Data Sheets:
Constant RotationTime Test #1 CW Test #2 CCW
Voltage RPM Voltage RPM0:30 7.54 56 7.61 561:00 7.47 56 7.58 561:30 7.43 54 7.45 562:00 7.35 55 7.42 552:30 7.26 54 7.34 553:00 7.15 54 7.22 543:30 7.07 54 7.17 544:00 7.02 54 7.12 54
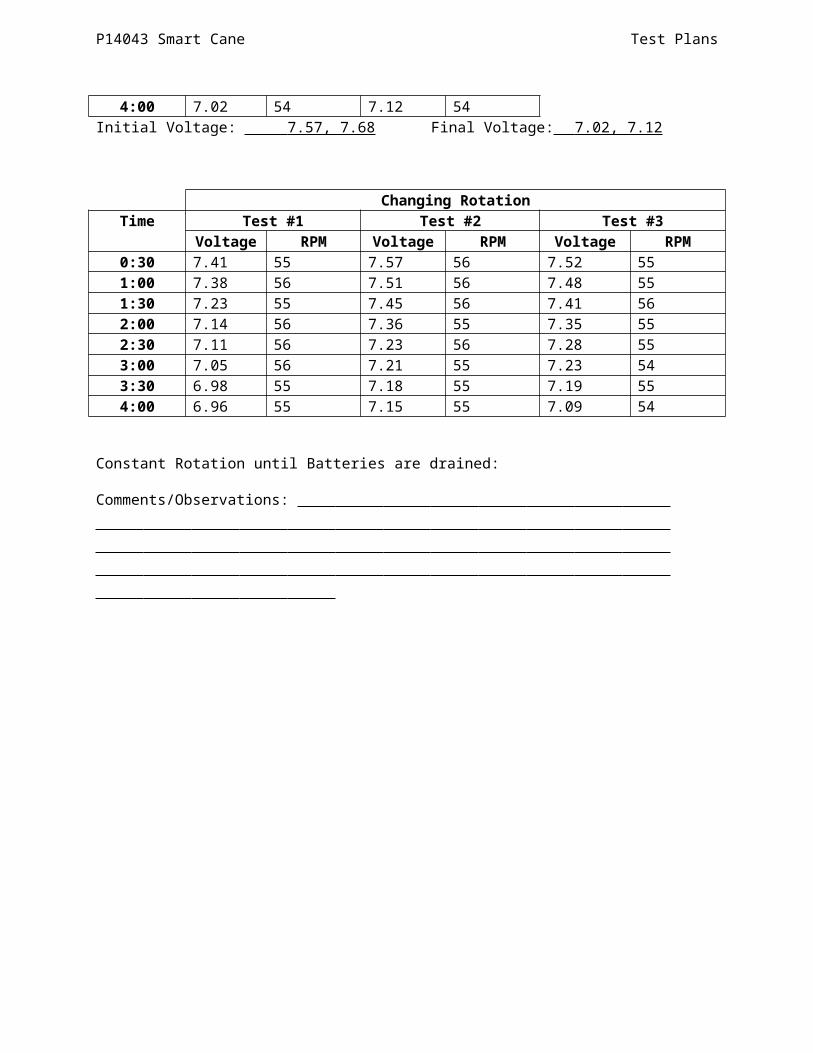
Initial Voltage: 7.57, 7.68 Final Voltage: 7.02, 7.12
Changing RotationTime Test #1 Test #2 Test #3
Voltage RPM Voltage RPM Voltage RPM0:30 7.41 55 7.57 56 7.52 551:00 7.38 56 7.51 56 7.48 551:30 7.23 55 7.45 56 7.41 562:00 7.14 56 7.36 55 7.35 552:30 7.11 56 7.23 56 7.28 553:00 7.05 56 7.21 55 7.23 543:30 6.98 55 7.18 55 7.19 554:00 6.96 55 7.15 55 7.09 54

P14043 Smart Cane Test Plans
Constant Rotation until Batteries are drained:
Comments/Observations:
P14043 Smart Cane Test Plans
T7- Motor Ramp-Up Time Test
Date Completed:4/4/2014
Performed By: Jake Luckman
Background:
We have already determined that users can determine which direction the bumps are turning in the hand at a minimum of 20 RPM. Our requirement is that this speed must be reached within 500ms to give the user enough time to react.
Objective:
This test will determine the amount of time it takes for the roller to reach 20 RPM under 4 psi of grip pressure and ensure it is less than 500ms.
Engineering Requirement: S6
S6: The time from motor input signal to when the roller reaches the minimum rotation speed of 20 RPM must be less than or equal to 500ms.
Materials:
Handle Assembly Fully charged batteries Simulator box Bright Colored Paint 2”x12” nylon strap/ribbon Electrical tape 0.8 lb weight Two tables Power Management System with Microcontroller Digital video camera with known FPS rate Video software capable of stepping through frame-by-frame (Ex. http://www.bsplayer.com/) On-screen protractor (Ex. PickPic Editor http://www.picpick.org/en/) LED 220 Ohm Resistor
Material Resources:
Camera and Tri-Pod (available from the ME Dept.) Tables (available in the Machine Shop) LED (MSD supplies) 220 Ohm Resistor (MSD supplies) 2 Alligator clips (EE Department)
P14043 Smart Cane Test Plans
Process:
1. Before finishing the assembly of the roller sub-assembly, use brightly colored paint to paint half of the circular support shaft diameter that faces in the normal direction towards the end cap. Then finish assembling the handle assembly and fasten handle to the cane using the cane-handle adapter.
2. Separate two tables and place handle across the gap with the rollers aligned with gap and secure with tape
3. Tape and secure the nylon strap loop to the weight.4. Hang the weighted strap loop onto the roller so that it stays in place during rolling.5. Run rollers under the pressure weight (with the PWM supply set for 60 RPM at 0 psi) and
complete the Constant Rotation Table6. Remove end cap from the end of the handle so that the painted end of the shaft is visible to
monitor rotation.7. Remove the battery cover and clip alligator clips to the leads on the back of the motor. Attach the
leads to the LED, and add the 220Ω resistor in the series.8. Fix the LED to the end of the cane handle with tape (see sketch for location and orientation).
Ensure it will be in view of the camera9. Place the camera on an adjustable tripod and focus it on the cane end (see sketch for details).10. Use the simulator box to position the bright color dot or one of the bearings (whichever is easier
for later viewing) at an arbitrary 0 degrees position. For example, position a bearing so that it is centered and at its highest position.
11. Start recording the camera12. Using the simulation box, power the dc motor to the operational voltage of 7.5 Volts for about 1
second and then turn off the simulator box. Repeat 3 or 4 times for later analysis.13. Using video view software, step the frames until the LED turns on. Then step one frame and
measure the position of the reference point relative to the zero reference point and record the position.
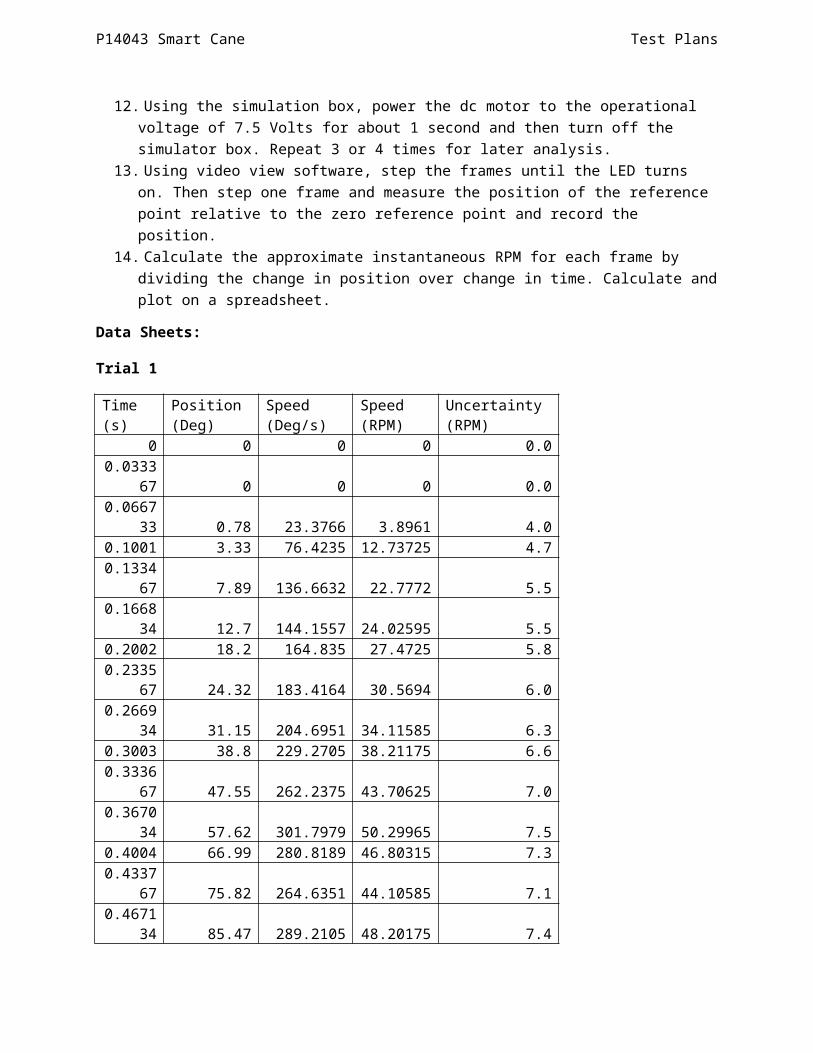
14. Calculate the approximate instantaneous RPM for each frame by dividing the change in position over change in time. Calculate and plot on a spreadsheet.
Data Sheets:
Trial 1
Time (s)Position (Deg)
Speed (Deg/s)
Speed (RPM)
Uncertainty (RPM)
0 0 0 0 0.00.03336
7 0 0 0 0.00.06673
3 0.78 23.3766 3.8961 4.00.1001 3.33 76.4235 12.73725 4.7
0.133467 7.89 136.6632 22.7772 5.5
0.16683 12.7 144.1557 24.02595 5.5
P14043 Smart Cane Test Plans
40.2002 18.2 164.835 27.4725 5.8
0.233567 24.32 183.4164 30.5694 6.0
0.266934 31.15 204.6951 34.11585 6.3
0.3003 38.8 229.2705 38.21175 6.60.33366
7 47.55 262.2375 43.70625 7.00.36703
4 57.62 301.7979 50.29965 7.50.4004 66.99 280.8189 46.80315 7.3
0.433767 75.82 264.6351 44.10585 7.1
0.467134 85.47 289.2105 48.20175 7.4
0.500501 93.7 246.6531 41.10885 6.8
Trial 2
Time (s)Position (Deg)
Speed (Deg/s)
Speed (RPM)
Uncertainty (RPM)
0 0 0 0 0.00.03336
7 0 0 0 0.00.06673
3 1.05 31.4685 5.24475 4.10.1001 5.33 128.2716 21.3786 5.3
0.133467 9.89 136.6632 22.7772 5.5
0.166834 13.5 108.1917 18.03195 5.1
0.2002 18.9 161.838 26.973 5.80.23356
7 25.74 204.9948 34.1658 6.30.26693
4 32.49 202.2975 33.71625 6.30.3003 39.94 223.2765 37.21275 6.5
0.333667 48.95 270.0297 45.00495 7.1
0.367034 58.52 286.8129 47.80215 7.3
0.4004 68.43 297.0027 49.50045 7.50.43376 77.02 257.4423 42.90705 7.0
P14043 Smart Cane Test Plans
70.46713
4 86.87 295.2045 49.20075 7.40.50050
1 95.7 264.6351 44.10585 7.1
Trial 3
Time (s)Position (Deg)
Speed (Deg/s)
Speed (RPM)
Uncertainty (RPM)
0 0 0 0 0.00.03336
7 0 0 0 0.00.06673
3 0.88 26.3736 4.3956 4.10.1001 4.32 103.0968 17.1828 5.0
0.133467 7.99 109.9899 18.33165 5.1
0.166834 12.5 135.1647 22.52745 5.4
0.2002 17.91 162.1377 27.02295 5.80.23356
7 23.62 171.1287 28.52145 5.90.26693
4 30.29 199.8999 33.31665 6.20.3003 37.94 229.2705 38.21175 6.6
0.333667 45.95 240.0597 40.00995 6.7
0.367034 55.52 286.8129 47.80215 7.3
0.4004 64.43 267.0327 44.50545 7.10.43376
7 75.02 317.3823 52.89705 7.70.46713
4 84.87 295.2045 49.20075 7.40.50050
1 94.7 294.6051 49.10085 7.4
Trial 2
Time it takes to reach full rotational speed (ms)Grip Pressure Test #1
Time at 20 RPMTest #2
Time at 20 RPMTest #3
Time at 20 RPM
P14043 Smart Cane Test Plans
4 Psi 0.167 .2002 .1334
Comments/Observations: Motor ramp up is well within spec of 500ms, even with uncertainties and under the maximum grip pressure, therefor the handle passes the test
Sketch:
P14043 Smart Cane Test Plans