Embed Size (px)
Citation preview
Edinburgh Research Explorer
Numerical Investigation on the Progressive Collapse Behavior ofPrecast Reinforced Concrete Frame Sub-assemblages
Citation for published version:Feng, D-C, Wu, G & Lu, Y 2018, 'Numerical Investigation on the Progressive Collapse Behavior of PrecastReinforced Concrete Frame Sub-assemblages' ASCE Journal of Performance of Constructed Facilities.
Link:Link to publication record in Edinburgh Research Explorer
Document Version:Peer reviewed version
Published In:ASCE Journal of Performance of Constructed Facilities
General rightsCopyright for the publications made accessible via the Edinburgh Research Explorer is retained by the author(s)and / or other copyright owners and it is a condition of accessing these publications that users recognise andabide by the legal requirements associated with these rights.
Take down policyThe University of Edinburgh has made every reasonable effort to ensure that Edinburgh Research Explorercontent complies with UK legislation. If you believe that the public display of this file breaches copyright pleasecontact [email protected] providing details, and we will remove access to the work immediately andinvestigate your claim.
Download date: 23. May. 2018
Numerical Investigation on the Progressive Collapse Behavior of Precast1
Reinforced Concrete Frame Sub-assemblages2
De-Cheng Feng1, Gang Wu2, and Yong Lu33
1Key Laboratory of Concrete and Prestressed Concrete Structures of the Ministry of Education,4
Southeast University, 2 Sipailou, Nanjing 210096, China5
2Key Laboratory of Concrete and Prestressed Concrete Structures of the Ministry of Education,6
Southeast University, 2 Sipailou, Nanjing 210096, China, with corresponding author. Email:7
3Institute for Infrastructure and Environment, School of Engineering, The University of9
Edinburgh, Edinburgh EH9 3JL, UK10
ABSTRACT11
This paper presents a numerical investigation of the progressive collapse behavior of the precast12
reinforced concrete (RC) frame sub-assemblages. An efficient numerical model for the precast13
RC frame sub-assemblages under progressive collapse is developed based on OpenSEES software,14
where the fiber beam element is used for the beams and columns and the Joint2D element is used15
for the beam-to-column connections. To consider the significant bond-slip effect inside the joint16
core of the precast RC frame sub-assemblages, the stress-slip relationship for reinforcement bars17
with different embedded lengths is derived and used to generate the force-deformation relation18
for the springs incorporated in the Joint2D element. The numerical model is validated through19
comparisons with the experimental results of RC sub-assemblages subjected to column removal20
scenarios in terms of load-displacement curve, compressive arch action, catenary action capacity,21
etc. Finally systematic parametric studies are conducted based on the validated numerical model22
to investigate the influences of some typical parameters that involved in precast RC structures on23
the progressive collapse capacity of the sub-assemblages.24
1 De-Cheng Feng, December 7, 2017
Keywords: progressive collapse, precast, RC frame sub-assemblages, numerical simulation,25
OpenSEES26
INTRODUCTION27
Progressive collapse of reinforced concrete (RC) structures has caught widespread attentions28
around the world in recent years, since great loss of public properties and human lives has been29
caused by progressive collapse of structures, and there has been an increasing trend of extreme30
events due to malicious attacks, accidental gas explosion and vehicle impact, etc.(Ellingwood31
2006). To mitigate the progressive collapse risk of RC structures, some specific methods have been32
developed in various design codes and guidelines, e.g., General Service Administration (GSA)33
2013 (GSA 2013) and Department of Defense (DoD) 2013 (DoD 2013). Among the proposed34
design methods, the alternate load path (ALP) method is the most commonly used one due to its35
efficiency and ease of operation (Pham et al. 2016). With this method, one middle column will be36
removed to check whether the remaining structure can bridge over the missing column. Although37
simply removing one column in the ALP method does not simulate the real initial damage scenario38
(a complete removal of a column is rarely seen in real incidents), it is considered as an effective39
way to assess the progressive collapse potential.40
In light of the fundamental concepts of ALP approach, several experimental tests of RC beam-41
column sub-assemblages subjected to column removal scenarios have been conducted in the litera-42
ture to investigate their progressive collapse resistance, i.e., thework done by Sasani andKropelnicki43
(Sasani and Kropelnicki 2008), Yi et al. (Yi et al. 2008), Su et al. (Su et al. 2009), Yap and Li44
(Yap and Li 2011), Qian and Li (Qian and Li 2012), Yu and Tan (Yu and Tan 2013), Ren et al.45
(Ren et al. 2016), Lu et al. (Lu et al. 2016) and Qian et al. (Qian et al. 2016), etc. However,46
although experimental studies can provide first-hand results of RC frame sub-assemblages against47
progressive collapse, conducting such experiments are generally very costly and time consuming.48
Furthermore, due to the constraints of the experimental facilities and space, among other factors,49
it is impractical to investigate the influence of a variety of parameters on the progressive collapse50
behavior using physical experiments.51
2 De-Cheng Feng, December 7, 2017
On the other hand, many numerical models have also been developed to study the progressive52
collapse behavior of RC frame sub-assemblages. Generally, the models may be grouped into53
three categories: the detailed finite element models, the fiber element-based models and the macro54
component-based models. Detailed finite element models (Sasani et al. 2011; Qian and Li 2011;55
Bao et al. 2012; Pham et al. 2016) usually adopt three-dimensional (3D) solid elements to simulate56
the behavior of an RC sub-assemblage, and the detailed local responses including concrete cracking57
and crushing, steel yielding and fracture, can be obtained. However, the computational effort of58
this approach is extremely demanding and oftentimes some convergence issues may also arise.59
Fiber element-based models (Valipour and Foster 2010; Li et al. 2011; Brunesi and Nascimbene60
2014; Brunesi et al. 2015; Feng et al. 2016a; Yu et al. 2016; Brunesi and Parisi 2017) use fiber61
beam-column elements with co-rotational formulation to model the structure, in which the large62
deformation effect is well considered. This approach is much faster than using detailed finite63
element models, and the numerical accuracy in terms of the global response can also be guaranteed64
(Li et al. 2016a; Li et al. 2016b). However, some specific failure modes, e.g, bong-slip and bar65
fracture, cannot be reflected. The macro component-based models (Bao et al. 2008; Yu and Tan66
2014) strive to achieve an adequate balance between the analysis accuracy and computational67
efficiency. In this type of models, fiber elements are still used to model beams and columns, but68
additional component-based joint model consisting of series of springs is introduced to represent69
the essential mechanisms of a beam-to-column connection; thus local failure in the joint region such70
as the bar slip and fracture can be incorporated. For these reasons, the macro component-based71
models are deemed more suitable for the progressive collapse analysis of RC frame assemblages.72
So far the existing studies, either experimental or numerical, have mainly focused on the73
monolithic RC structures, while little attention has been paid on the progressive collapse capacity74
of precast RC structures. Actually, the precast structures are now widely used around the world75
due to various advantages such as the product quality, construction speed, and so on. Especially in76
rapidly developing countries like China, there is a great demand for precast structures due to the77
rapid process of urbanization. Therefore, there is an urgent need to study the progressive collapse78
3 De-Cheng Feng, December 7, 2017
behavior of precast structures. Kang and Tan (Kang and Tan 2015a; Kang and Tan 2017) conducted79
a set of experiments to investigate the progressive collapse capacity of precast sub-assemblages, and80
some special features that are unique in precast structures, e.g., discontinuous reinforcement, were81
also analyzed. However, no numerical model has been developed for precast RC sub-assemblages82
under a progressive collapse scenario up till now. Compared with the monolithic RC structures, the83
bond-slip effect is particularly significant in precast structures since the post-cast concrete quality84
can hardly be guaranteed (Kang and Tan 2015b), and therefore careful handling of this important85
feature is required in a numerical model.86
Based on the above-mentioned aspects, this paper aims at developing an efficient numerical87
model for precast RC frame sub-assemblages against progressive collapse based on the software88
OpenSEES, and subsequently performing systemic parametric studies to investigate the progressive89
collapse behavior of precast sub-assemblages. First the numerical model is introduced in detail,90
where the fiber beam element is used for the beams and columns and the Joint2D element is used91
for the beam-to-column connections. In particular, an analytical stress-slip model is derived for92
the beam reinforcement in the middle joint of a precast sub-assemblage. The developed numerical93
model is then validated through comparison with the experimental results of the precast sub-94
assemblages under a column removal scenario. With the validated numerical model, systematic95
parametric studies are conducted to study the influences of some unique parameters in precast RC96
structures on its progressive collapse performance.97
PROGRESSIVE COLLAPSE MODELING APPROACH BASED ON OPENSEES98
As mentioned before, the progressive collapse process of precast frame sub-assemblages in-99
volves several complex behavioral developments of the structure, including material nonlinearity,100
geometrical nonlinearity, bond-slip effect, and bar fracture. Furthermore, the force transfer mecha-101
nism from beams to columns through the connection part should also be clearly represented in the102
numerical model. Although a detailed model involving continuum solid elements can capture these103
local responses, the numerical efficiency and convergence issue remain a problem. Therefore, an104
alternative marco-level element approach based on fiber element and Joint2D element (Altoontash105
4 De-Cheng Feng, December 7, 2017
2004), which are available in OpenSEES, is adopted in this paper to simulate the progressive106
collapse behavior of precast sub-assemblages.107
Proposed modeling approach for precast sub-assemblage108
In the proposed numericalmodeling of the precast sub-assemblages, conventional displacement-109
based (DB) fiber beam-column elements are used to simulate the beams and columns, while Joint2D110
element is used to model the beam-to-column connection, as indicated in Fig. 1. The fiber element111
is based on co-rotational formulation to include large deformation effect, and Gauss-Legendre112
quadrature is used in the element. The cross-section of the element is divided into concrete and113
reinforcement fibers, and each fiber has its own uniaxial constitutive law. Different fibers can have114
different constitutive laws, and thus the properties of precast and post-cast concrete can be assigned115
separately and the confinement effect provided by stirrups can also be considered. The concrete116
damage-plasticity model (ConcreteD), which is implemented in OpenSEES and recommended in a117
Chinese code for design of concrete structures (Ministry of Construction of the People’s Republic of118
China 2010), and the bilinear steel model (Steel01) are adopted for concrete and reinforcement119
fibers, respectively. The details for the two material models are given in Appendix I and II.120
The Joint2D element is developed by Altoontash (Altoontash 2004), which is actually a sim-121
plified version of the BeamColumnJoint element in OpenSEES (Lowes and Altoontash 2003), and122
large deformation effect can also be accounted for in the model. Although similar component-based123
joint models are also proposed in the literature (Bao et al. 2008; Yu and Tan 2013; Yu and Tan 2014)124
to model the progressive collapse behavior of RC sub-assemblages, they seem to be more com-125
plicated and need complex calibration of the component properties. The proposed element herein126
modifies the original Joint2D element to suit for a progressive collapse analysis, and consists of five127
spring components, representing the shear distortion of the joint panel and the moment-rotation128
behavior including the bar bond-slip effect of the section at the four ends of beams and columns,129
respectively. The five spring components are defined with uniaxial force-deformation relations130
(Altoontash 2004). For the central shear spring, usually the shear stress-strain relation τ − γ is131
determined based on the modified compression field theory (MCFT) (Vecchio and Collins 1986)132
5 De-Cheng Feng, December 7, 2017
or the softened truss model (STM) (Hsu 1988), and then it is converted to the equivalent moment-133
rotation relation M − θ of the joint panel with the following expressions: M = τVJ , θ = arctan γ,134
where VJ is the volume of the panel. However, several studies indicate that there is no significant135
shear deformation of the joint panel when the sub-assemblage is under progressive collapse, since136
the joint is subjected to vertical displacement and restrained by the surrounding beam and columns137
(Bao et al. 2008; Yu and Tan 2013; Yu and Tan 2014; Rashidian et al. 2016). Hence, the shear138
spring is assumed to be elastic in this paper, enabling a rigid shear panel behavior. For the interface139
springs at the beam and column ends, which actually represents the member-end rotation due to140
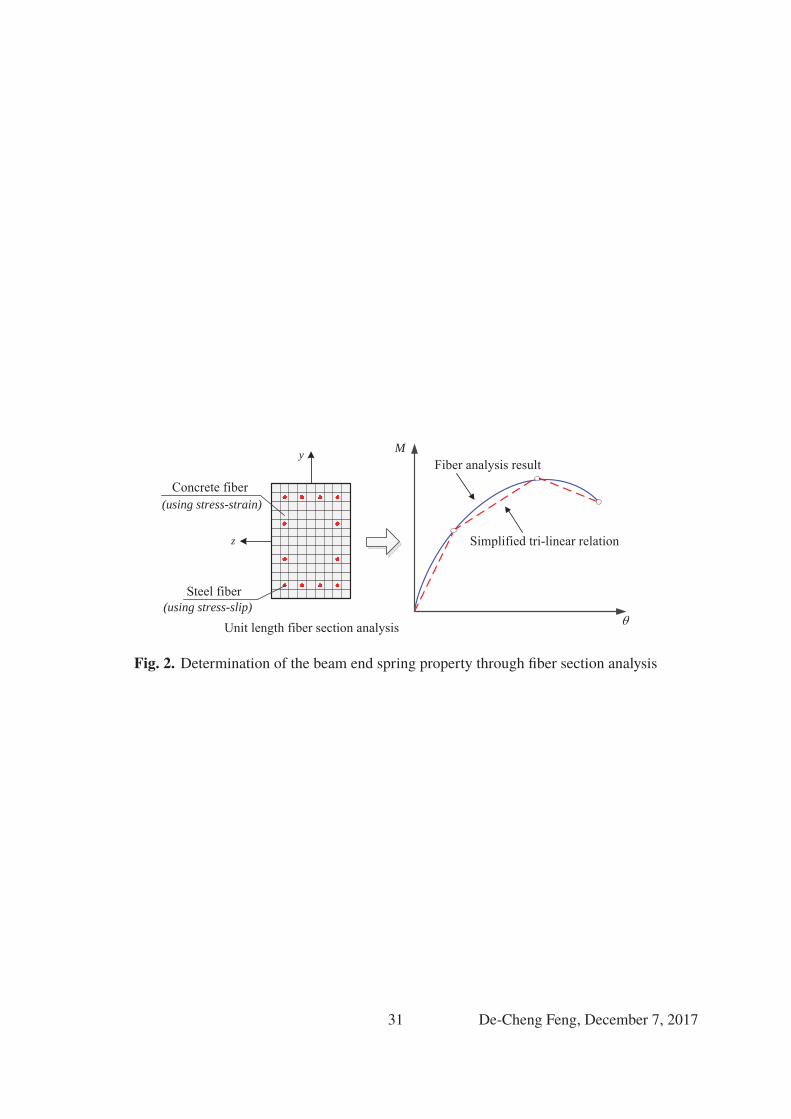
bond-slip effect, the corresponding force-deformation relation is calibrated based on a fiber section141
analysis (unit length) with the stress-strain relation for the steel fibers replaced by the stress-slip142
relation (Altoontash 2004), and the bar fracture is considered through aMin-Max criterion material143
in OpenSEES (Feng et al. 2016a). Moreover, the column end springs can be further simplified144
as rigid since no failure would occur at the column-joint interface when the sub-assemblage is145
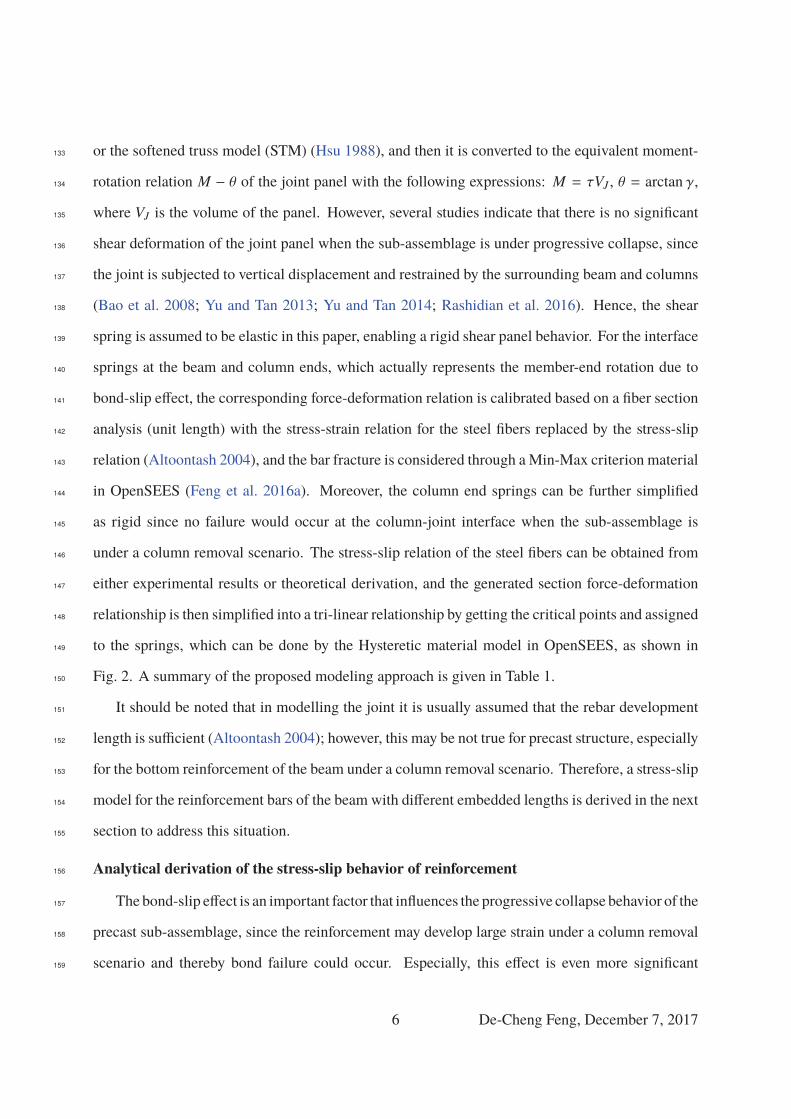
under a column removal scenario. The stress-slip relation of the steel fibers can be obtained from146
either experimental results or theoretical derivation, and the generated section force-deformation147
relationship is then simplified into a tri-linear relationship by getting the critical points and assigned148
to the springs, which can be done by the Hysteretic material model in OpenSEES, as shown in149
Fig. 2. A summary of the proposed modeling approach is given in Table 1.150
It should be noted that in modelling the joint it is usually assumed that the rebar development151
length is sufficient (Altoontash 2004); however, this may be not true for precast structure, especially152
for the bottom reinforcement of the beam under a column removal scenario. Therefore, a stress-slip153
model for the reinforcement bars of the beam with different embedded lengths is derived in the next154
section to address this situation.155
Analytical derivation of the stress-slip behavior of reinforcement156
The bond-slip effect is an important factor that influences the progressive collapse behavior of the157
precast sub-assemblage, since the reinforcement may develop large strain under a column removal158
scenario and thereby bond failure could occur. Especially, this effect is even more significant159
6 De-Cheng Feng, December 7, 2017
for precast structures since the quality of the post-cast concrete in the joint core region cannot be160
guaranteed as themonolithic structures. Moreover, although some of the existingmacro-models can161
account for bond-slip effect, there is commonly an associated assumption that the embedded length162
for bars is sufficient; consequently the applicability is restricted, especially for precast concrete163
structures.164
In the present modeling approach introduced in the previous subsection, the bond-slip effect is165
considered through the beam interface springs in the Joint2D element, and the spring properties are166
calibrated through a unit length fiber section analysis discussed before. Hence, a stress-slip model167
is needed herein.168
The bond-slip behavior of the beam reinforcement when subjected to progressive collapse169
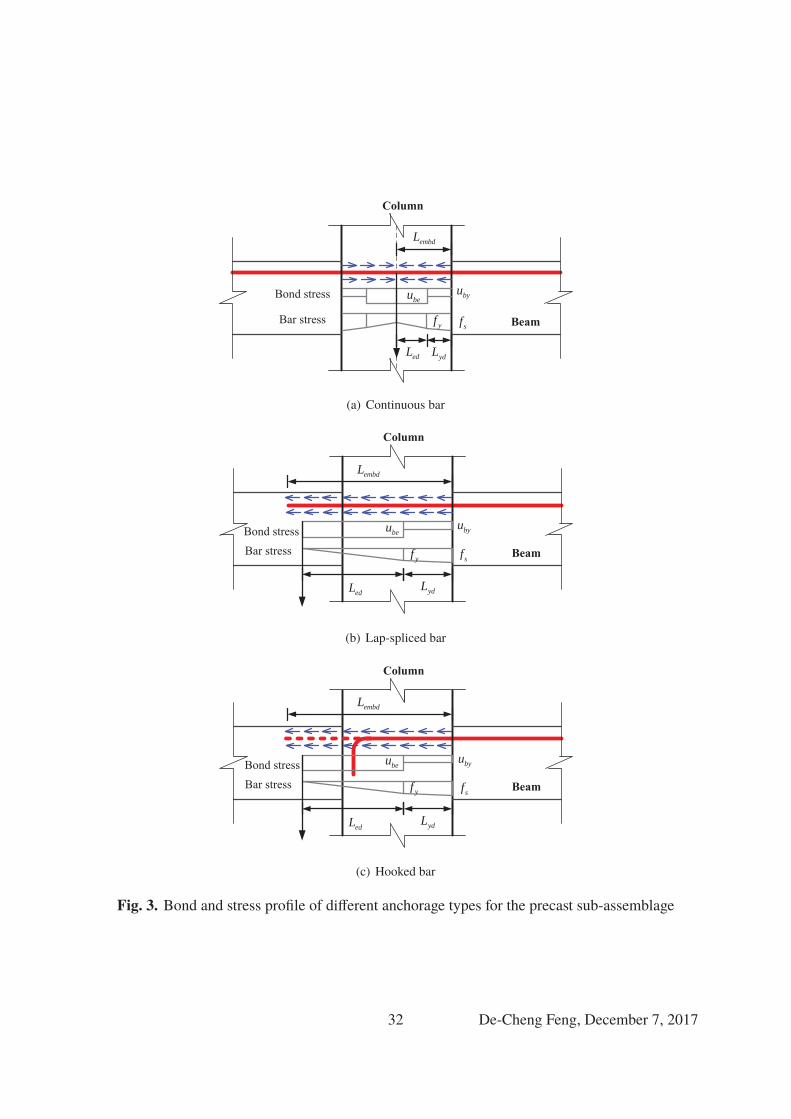
actually depends on the anchorage type. Generally, three kinds of anchorage are used in precast RC170
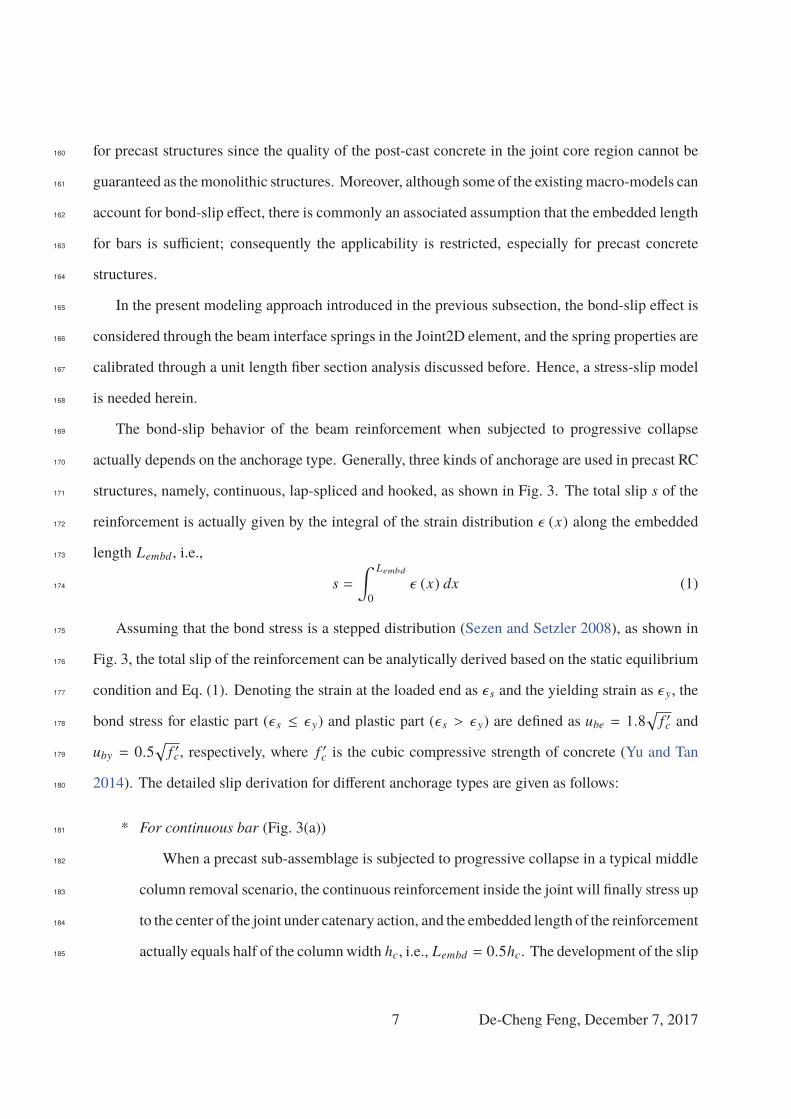
structures, namely, continuous, lap-spliced and hooked, as shown in Fig. 3. The total slip s of the171
reinforcement is actually given by the integral of the strain distribution ε (x) along the embedded172
length Lembd , i.e.,173
s =∫ Lembd
0
ε (x) dx (1)174
Assuming that the bond stress is a stepped distribution (Sezen and Setzler 2008), as shown in175
Fig. 3, the total slip of the reinforcement can be analytically derived based on the static equilibrium176
condition and Eq. (1). Denoting the strain at the loaded end as ε s and the yielding strain as ε y, the177
bond stress for elastic part (ε s ≤ ε y) and plastic part (ε s > ε y) are defined as ube = 1.8√
f ′c and178
uby = 0.5√
f ′c, respectively, where f ′c is the cubic compressive strength of concrete (Yu and Tan179
2014). The detailed slip derivation for different anchorage types are given as follows:180
* For continuous bar (Fig. 3(a))181
When a precast sub-assemblage is subjected to progressive collapse in a typical middle182
column removal scenario, the continuous reinforcement inside the joint will finally stress up183
to the center of the joint under catenary action, and the embedded length of the reinforcement184
actually equals half of the columnwidth hc, i.e., Lembd = 0.5hc. The development of the slip185
7 De-Cheng Feng, December 7, 2017
can be divided into three stages. At first the bar is elastic and the corresponding developed186
elastic bond length Led can be determined by the force equilibrium187
Led =f sdb
4ube(2)188
where db is the bar diameter; f s is the reinforcement stress. Then the slip is obtained189
through Eq. (1)190
s =∫ Led
0
ε (x) dx =ε s
2Led (3)191
After that the bar yields but is not stressed up to the center, the yielded length Lyd is192
given by193
Lyd =
(f s − f y
)db
4uby(4)194
and the slip is computed as195
s =∫ Led
0
ε (x) dx +∫ Lyd
Led
ε (x) dx =ε y
2Led +
ε y + ε s
2Lyd (5)196
Finally, the reinforcement is stressed up to the center of the joint under catenary action,197
but the slip at the center point is still zero due to symmetry. The corresponding elastic198
developed length and yielded developed length are199
Lyd =
(f s − f y
)db
4uby, Led = Lembd − Lyd (6)200
and the slip is201
s =∫ Led
0
ε (x) dx +∫ Lyd
Led
ε (x) dx =ε end + ε y
2Led +
ε y + ε s
2Lyd (7)202
where ε end can be determined through similar triangle method. Note that no pull-out failure203
will occur in this case.204
8 De-Cheng Feng, December 7, 2017
205
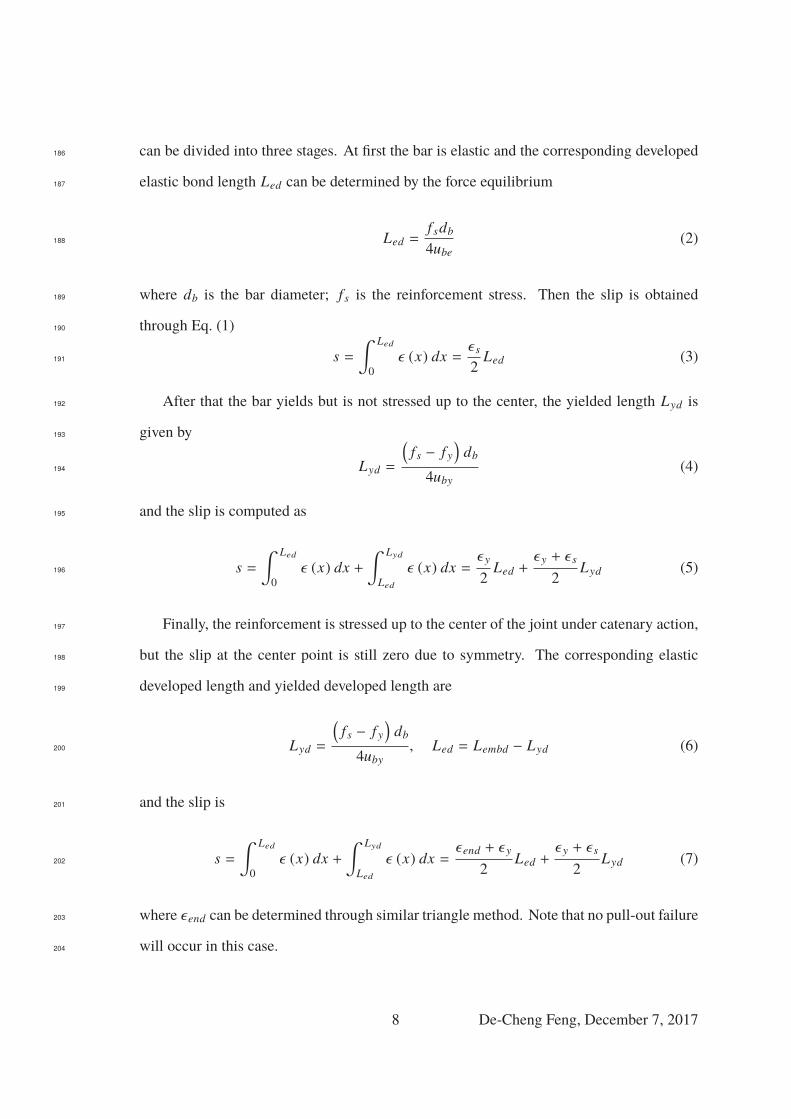
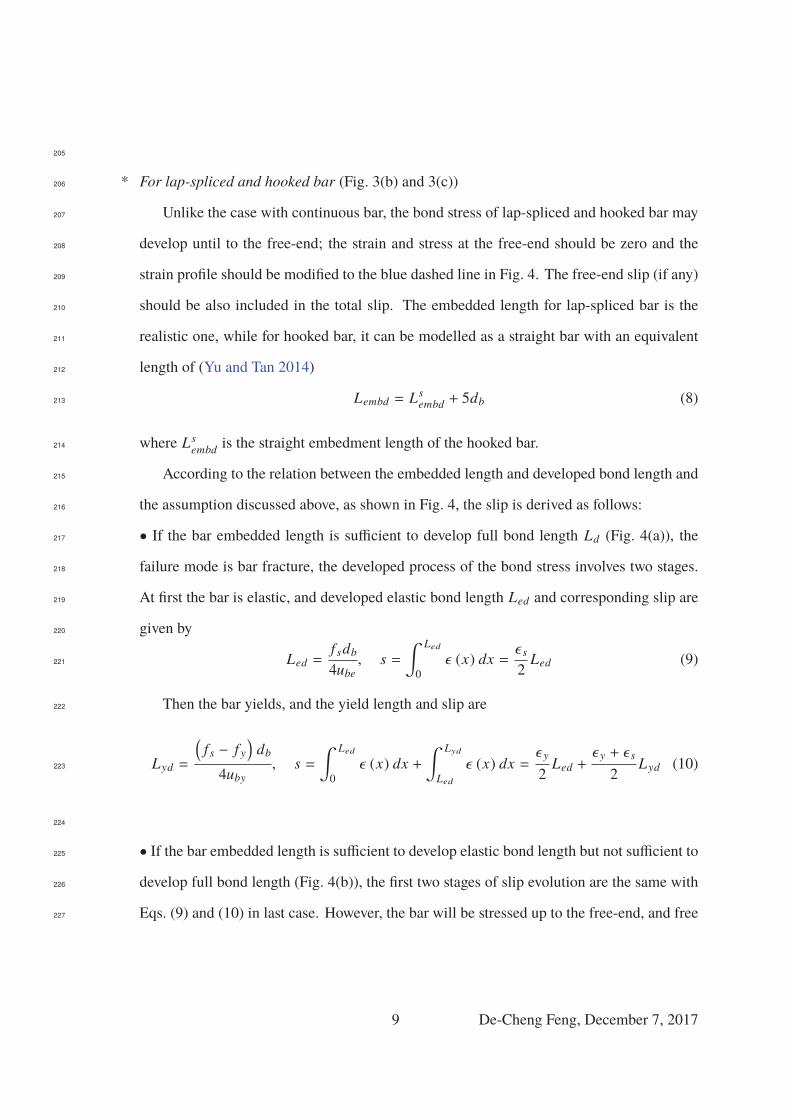
* For lap-spliced and hooked bar (Fig. 3(b) and 3(c))206
Unlike the case with continuous bar, the bond stress of lap-spliced and hooked bar may207
develop until to the free-end; the strain and stress at the free-end should be zero and the208
strain profile should be modified to the blue dashed line in Fig. 4. The free-end slip (if any)209
should be also included in the total slip. The embedded length for lap-spliced bar is the210
realistic one, while for hooked bar, it can be modelled as a straight bar with an equivalent211
length of (Yu and Tan 2014)212
Lembd = Lsembd + 5db (8)213
where Lsembd is the straight embedment length of the hooked bar.214
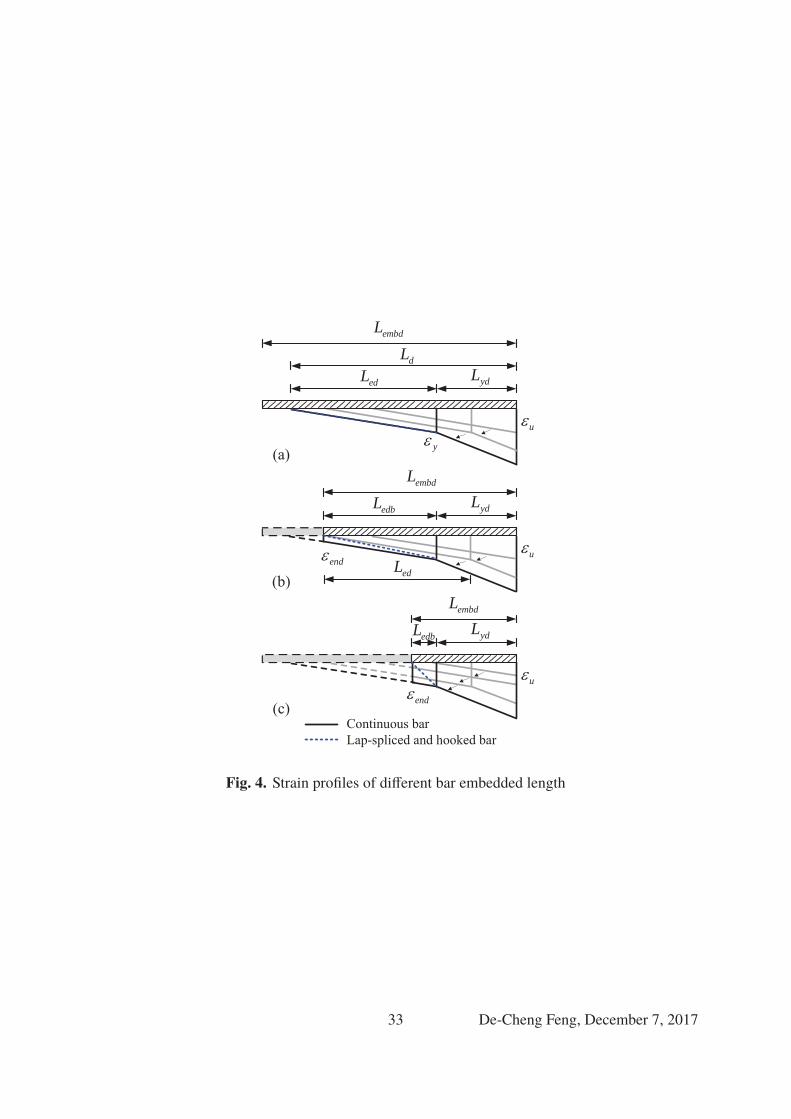
According to the relation between the embedded length and developed bond length and215
the assumption discussed above, as shown in Fig. 4, the slip is derived as follows:216
• If the bar embedded length is sufficient to develop full bond length Ld (Fig. 4(a)), the217
failure mode is bar fracture, the developed process of the bond stress involves two stages.218
At first the bar is elastic, and developed elastic bond length Led and corresponding slip are219
given by220
Led =f sdb
4ube, s =
∫ Led
0
ε (x) dx =ε s
2Led (9)221
Then the bar yields, and the yield length and slip are222
Lyd =
(f s − f y
)db
4uby, s =
∫ Led
0
ε (x) dx +∫ Lyd
Led
ε (x) dx =ε y
2Led +
ε y + ε s
2Lyd (10)223
224
• If the bar embedded length is sufficient to develop elastic bond length but not sufficient to225
develop full bond length (Fig. 4(b)), the first two stages of slip evolution are the same with226
Eqs. (9) and (10) in last case. However, the bar will be stressed up to the free-end, and free227
9 De-Cheng Feng, December 7, 2017
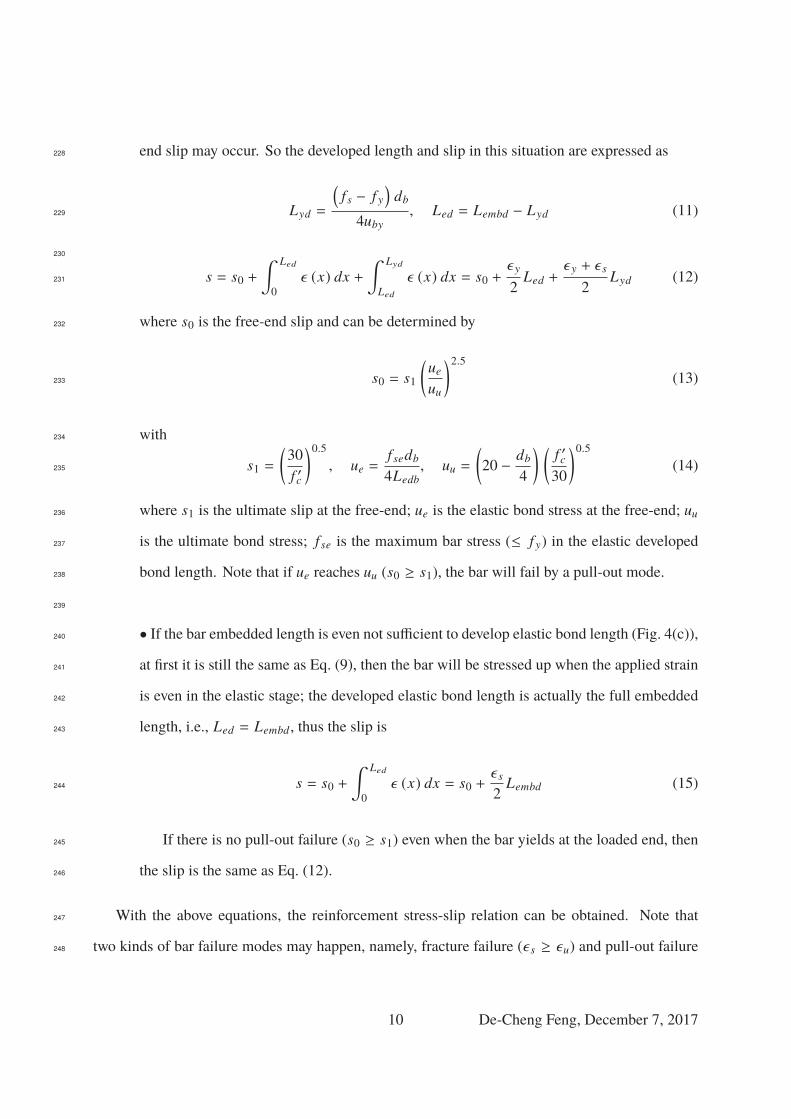
end slip may occur. So the developed length and slip in this situation are expressed as228
Lyd =
(f s − f y
)db
4uby, Led = Lembd − Lyd (11)229
230
s = s0 +∫ Led
0
ε (x) dx +∫ Lyd
Led
ε (x) dx = s0 +ε y
2Led +
ε y + ε s
2Lyd (12)231
where s0 is the free-end slip and can be determined by232
s0 = s1
(ue
uu
)2.5(13)233
with234
s1 =(30
f ′c
)0.5, ue =
f sedb
4Ledb, uu =
(20 − db
4
) (f ′c30
)0.5(14)235
where s1 is the ultimate slip at the free-end; ue is the elastic bond stress at the free-end; uu236
is the ultimate bond stress; f se is the maximum bar stress (≤ f y) in the elastic developed237
bond length. Note that if ue reaches uu (s0 ≥ s1), the bar will fail by a pull-out mode.238
239
• If the bar embedded length is even not sufficient to develop elastic bond length (Fig. 4(c)),240
at first it is still the same as Eq. (9), then the bar will be stressed up when the applied strain241
is even in the elastic stage; the developed elastic bond length is actually the full embedded242
length, i.e., Led = Lembd , thus the slip is243
s = s0 +∫ Led
0
ε (x) dx = s0 +ε s
2Lembd (15)244
If there is no pull-out failure (s0 ≥ s1) even when the bar yields at the loaded end, then245
the slip is the same as Eq. (12).246
With the above equations, the reinforcement stress-slip relation can be obtained. Note that247
two kinds of bar failure modes may happen, namely, fracture failure (ε s ≥ εu) and pull-out failure248
10 De-Cheng Feng, December 7, 2017
(s0 ≥ s1); here whichever mode is first reached will be treated as the failure of the bar. Meanwhile,249
the bond-slip effect is neglected for reinforcement under compression in this paper. In fact, when250
subjected to progressive collapse, the reinforcement will eventually undergo tension to develop251
catenary action, thus the bond-slip behavior under compression will have little influence on its252
global performance.253
Nonlinear solution strategy254
The numerical simulation of progressive collapse of precast sub-assemblage includes several255
extreme behaviors, i.e., material and geometrical nonlinearity, bar fracture etc. Therefore, some256
convergence issue may arise in the simulation and the numerical solution algorithm is a challenge257
aspect. To improve the numerical performance, a varying solution strategy is employed in this paper.258
The analysis starts with the full Newton-Raphson algorithm, which has the fastest convergence rate,259
and the convergence tolerance is set as 10−6 on the norm of energy increment. The maximum260
number of iterations for each time step is defined as 200. If the solution cannot be obtained in a261
single step, the analysis switches the algorithm in turn tomodifiedNewton-Raphsonmethod, Krylov262
Newton acceleration method and Newton line search method until the convergence is attained. If it263
still fails to obtain a solution, the iteration number is increased (i.e., 1000). If a solution still cannot264
be obtained, a larger tolerance is then adopted (i.e., 10−4). After the convergence is obtained, all265
these settings are returned back to the default ones for the next step.266
VALIDATION OF THE PROPOSED MODELING APPROACH267
Overview of progressive collapse test on precast RC sub-assemblages268
To validate the proposed numerical modeling approach for precast RC sub-assemblages, the269
experiments conducted by Kang and Tan’s group (Kang and Tan 2015a; Kang et al. 2015) are270
simulated. The experiments were performed to investigate whether the precast sub-assemblages271
could develop catenary action under column removal, even though they could exhibit similar272
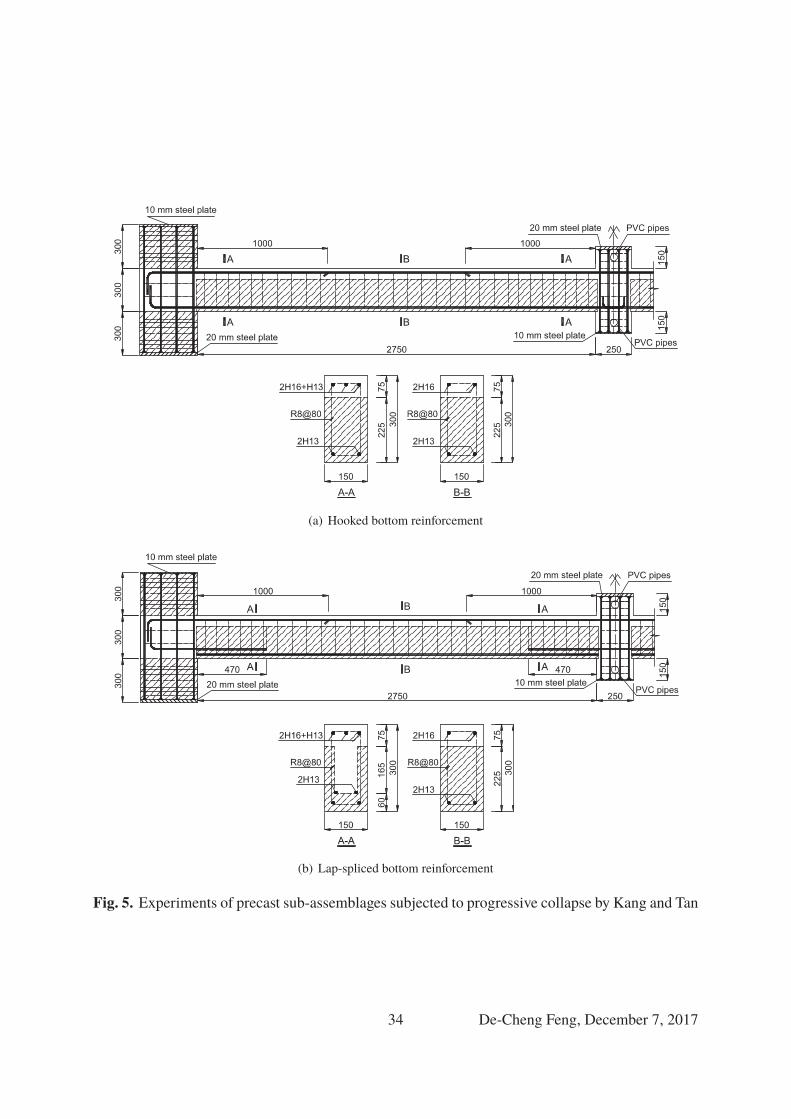
seismic performance as the monolithic structures. Totally six specimens, designed in accordance273
with Eurocode 2, were tested. The geometrical dimensions were kept the same, and the differences274
11 De-Cheng Feng, December 7, 2017
came from the reinforcing details. Each specimen was made up of two precast beam units and two275
end columns stubs, and the precast components were assembled in the joint region through cast-276
in-situ concrete. The span for the beams was 2750 mm, while the cross-section dimensions were277
300 × 150 mm for beams, 250 × 250 mm for middle columns and 400 × 450 mm for end column278
stubs. Two kinds of reinforcing details were used in the connection region, namely, hooked (90◦279
bent) and lap-spliced, as shown in Fig. 5. Apart from the reinforcing details, the main investigating280
parameter was the reinforcing ratio, which is listed in Table 2.281
The material properties of the specimens, including concrete and reinforcement, are given in282
Table 3, where bar H13 and H16 marked with * were used for specimen MJ-B-1.19/0.59R only.283
The two end column stubs were restrained each by two load cells in in the horizontal direction,284
and one pin support in the vertical direction. In addition, two sets of steel columns were arranged285
on each side of the middle span of the beams to prevent out-of-plane failure of the specimens.286
Column removal was simulated through gradually increasing the vertical displacement at the top287
of the middle column stub. More details about the experiments can be found in (Kang and Tan288
2015a; Kang et al. 2015).289
Analysis results290
The established numericalmodel is demonstrated in Fig. 6. The beams and columns aremodeled291
with fiber elements, and the joints are represented with the Joint2D model discussed above. The292
finite element mesh size is defined as the section height to avoid softening localization issue (Feng293
et al. 2015), and two integration points are used for each element. The sections are divided into294
two parts, i.e., the precast part and the cast-in-situ part, and each part is discretized into 20 concrete295
fibers, and the number and locations of the steel fibers are assigned according to the reinforcement296
detail of each beam and column. Material model parameters are determined according to Table 2,297
and the concrete tensile strength is given by 0.25√
fc, where fc is the compressive strength. The298
confinement effect is considered through Mander model (Mander et al. 1988). The embedded299
length for the continuous reinforcement bars is set as half of the column width, i.e., 125 mm, and300
for the bent bar it is 190+5dbmm and for the lap-spliced bar it is 470mm. The boundary conditions301
12 De-Cheng Feng, December 7, 2017
of the end column stubs are simulated with lateral elastic springs, and the stiffness is assumed to be302
the level of 105 kN/m, which is consistent with the recommendation in (Yu and Tan 2013) based on303
the measurement of the reaction forces and the displacements. Vertical load is applied at the top of304
the middle column stub through displacement control, and for a quasi static analysis the time step305
is set as 1 mm/s.306
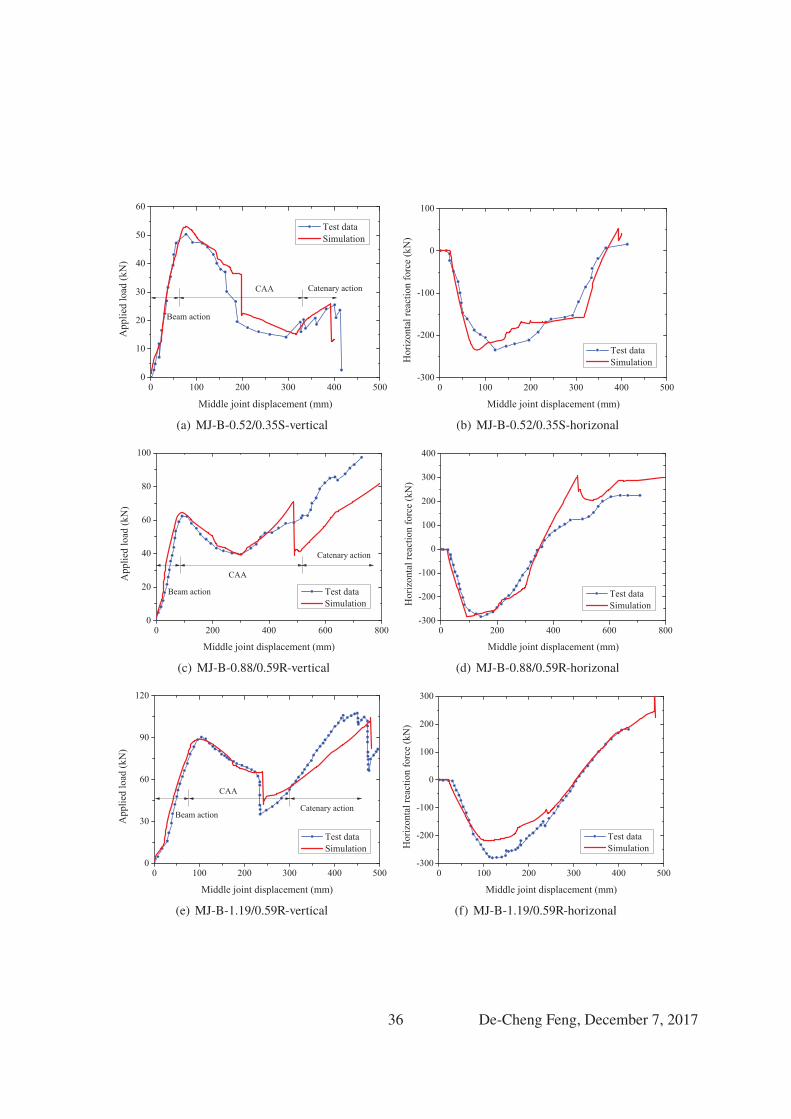
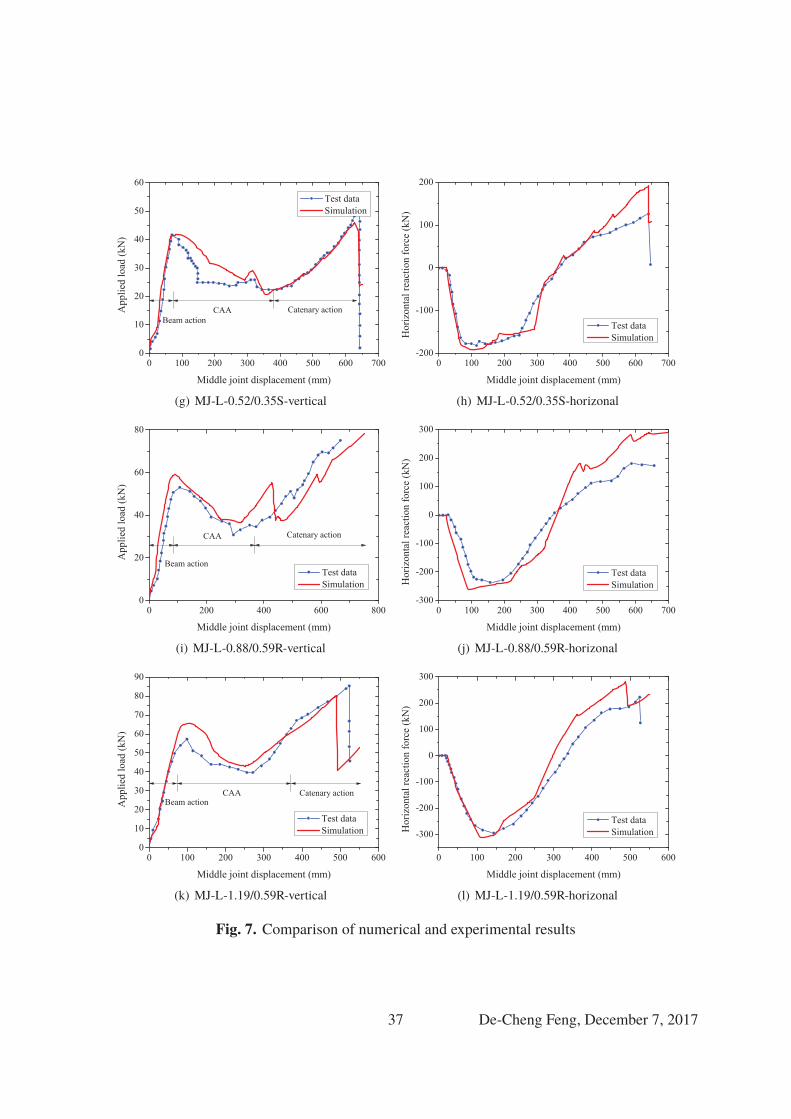
The simulated vertical displacement of themiddle column versus the vertical applied load on the307
column top, as well as the horizonal reaction forces of the beams (or the beam axial forces) of all the308
six specimens are plotted against the experimental results in Fig. 7. Good agreements are achieved309
between the numerical and experimental results for nearly all the specimens. It can be found from310
the applied load-vertical displacement curves that the initial stiffness, flexural beam action, and311
the effects of compressive arch action (CAA) and catenary action all can be well reflected by the312
numerical model. Furthermore, the bar fracture failure at the middle column joint and end column313
stubs can also be reproduced.314
More specifically, the CAA capacities predicted by the numerical model for specimens MJ-315
B-0.52/0.35S, MJ-B-0.88/0.59R, MJ-B-1.19/0.59R and MJ-L-0.52/0.35S are nearly the same as316
the experimental results, while they are 6 kN and 8.3 kN larger than the experimental values for317
specimens MJ-L-0.88/0.59R and MJ-L-1.19/0.59R, respectively, which corresponds to the relative318
differences of 11% and 14% between the numerical and experimental results. The numerical319
models also predict quite well the bar fracture at the middle and end column joints for specimens320
MJ-B-0.52/0.35S, MJ-B-1.19/0.59R and MJ-L-0.52/0.35S and MJ-L-1.19/0.59R, while the results321
for specimens MJ-B-0.88/0.59R and MJ-L-0.88/0.59R are less comparable with the experimental322
ones. This may be caused by the uncertainty in material properties, especially the fracture strain of323
the reinforcement bars.324
For the horizonal reaction force curves, the numerical results also exhibit good agreement with325
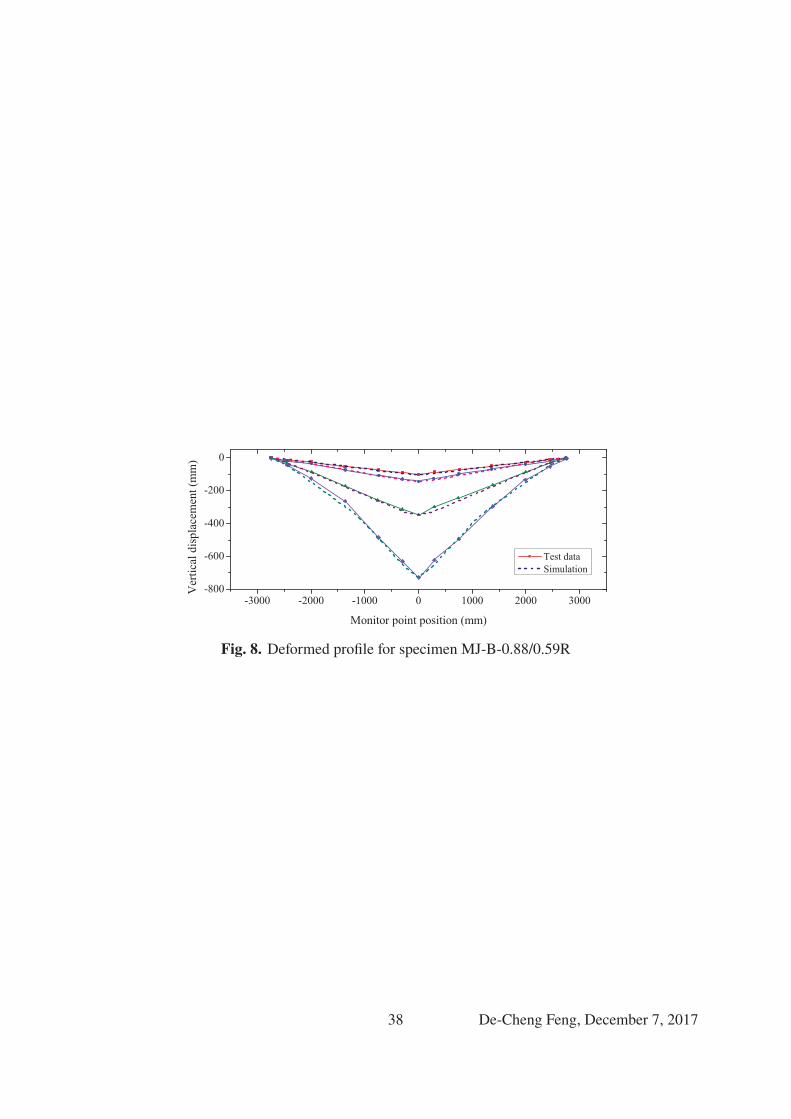
the experimental results. Take the specimen MJ-B-0.88/0.59R as an example, the beam axial force326
is first under compression and then transits to tension due to catenary action from a displacement327
around 350 mm. The calculated maximum compression force is 282.7 kN which matches almost328
13 De-Cheng Feng, December 7, 2017
exactly the measured value of 282.5 kN. Fig. 8 also gives the comparison of the deformed profile329
of specimen MJ-B-0.88/0.59R under different vertical displacements obtained from the numerical330
model and the experiment. As can be seen in the figure, the two sets of results match well with331
each other. In general, the numerical results indicate that the developed finite element model can332
predict realistically the responses of precast RC frame sub-assemblages, and therefore can be used333
as an effective tool in a progressive collapse analysis.334
PARAMETRIC STUDIES ON PROGRESSIVE COLLAPSE BEHAVIOR OF PRECAST RC335
SUB-ASSEMBLAGES336
With the validated numerical model, parametric studies can be performed to investigate the337
influences of a variety of factors on the progressive collapse behavior of the precast RC sub-338
assemblages. It is worth noting at this juncture that many basic design parameters, including339
reinforcement ratio, beam depth, concrete strength, slab effect, boundary condition, etc., have been340
widely studied before (Yu and Tan 2013; Yu and Tan 2014; Pham et al. 2016). The present study341
therefore mainly focuses on a few factors that are particularly important for the analysis of precast342
RC structures, namely, the modeling strategies, the strength of the cast-in-situ concrete, and the343
anchorage length of the reinforcement bars at the joint region. To concentrate the observation344
to these factors, the specimen MJ-L-0.88/0.59R is selected as a reference case to conduct the345
parametric studies as described in the following subsections.346
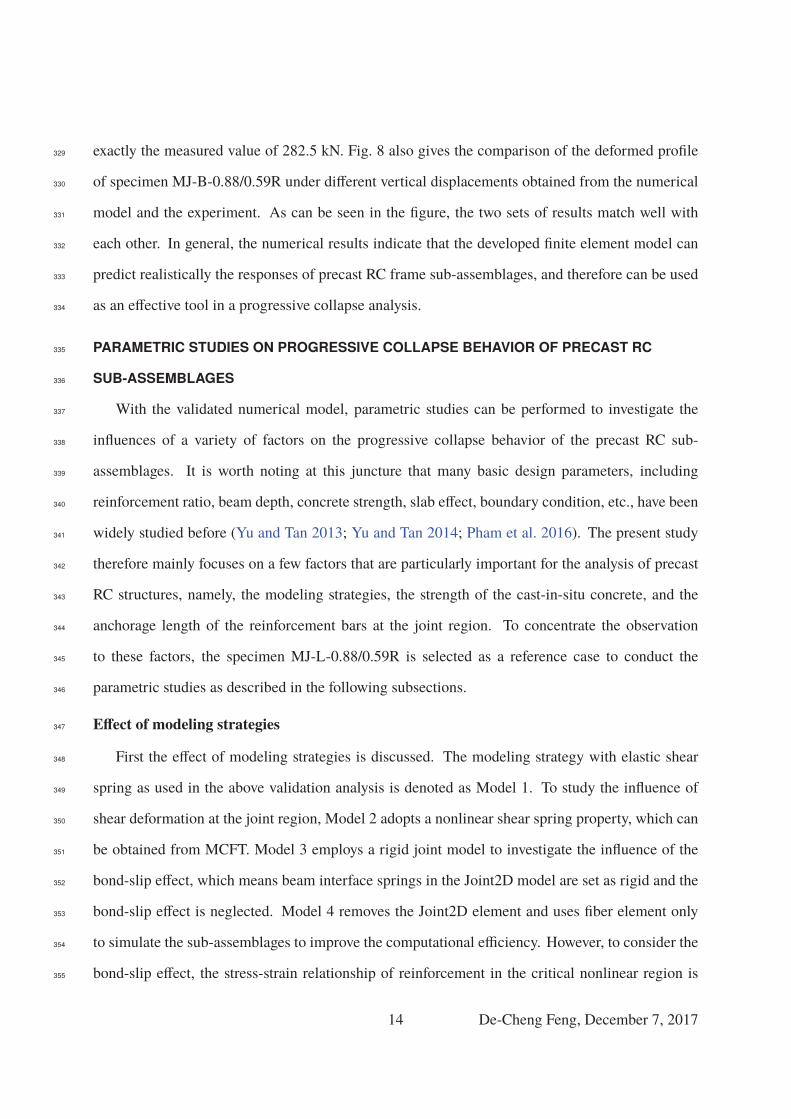
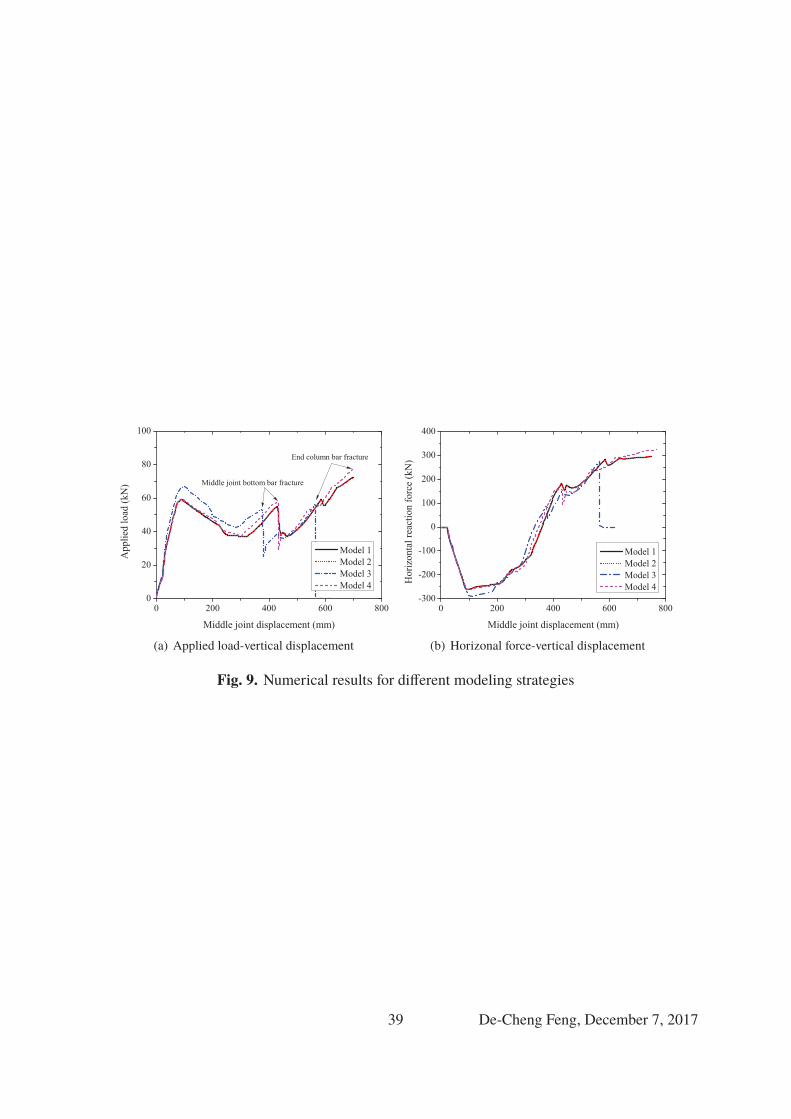
Effect of modeling strategies347
First the effect of modeling strategies is discussed. The modeling strategy with elastic shear348
spring as used in the above validation analysis is denoted as Model 1. To study the influence of349
shear deformation at the joint region, Model 2 adopts a nonlinear shear spring property, which can350
be obtained from MCFT. Model 3 employs a rigid joint model to investigate the influence of the351
bond-slip effect, which means beam interface springs in the Joint2D model are set as rigid and the352
bond-slip effect is neglected. Model 4 removes the Joint2D element and uses fiber element only353
to simulate the sub-assemblages to improve the computational efficiency. However, to consider the354
bond-slip effect, the stress-strain relationship of reinforcement in the critical nonlinear region is355
14 De-Cheng Feng, December 7, 2017
modified by assuming that the equivalent strain is the sum of the slip and the bar deformation (Bao356
et al. 2012), i.e., ε′ = ε + s/Lp, where s is the bar slip derived above and Lp is the critical nonlinear357
region length, usually equals beam height.358
The results for the four models are demonstrated in Fig. 9. As can be seen in the figure, the359
results by Model 1 and Model 2 are nearly the same, which indicates that considering the shear360
deformation actually has little influence on the analysis of progressive collapse behavior of precast361
concrete structures. This conclusion echoes closely observations made in previous researches by362
(Bao et al. 2008; Yu and Tan 2013; Yu and Tan 2014; Rashidian et al. 2016). Model 3 appears to363
overestimate the CAA capacity of the specimen, and the bar fracture occurs earlier than the other364
two models since the fixed-end rotation caused by bar slip at the beam interface is not accounted365
for in Model 3. On the other hand, Model 1 and Model 4 predict almost the same results, which366
means developing an equivalent reinforcement model including bond-slip is an alternative way367
for modeling precast frame sub-assemblage under progressive collapse, and the computational368
efficiency can be also improved.369
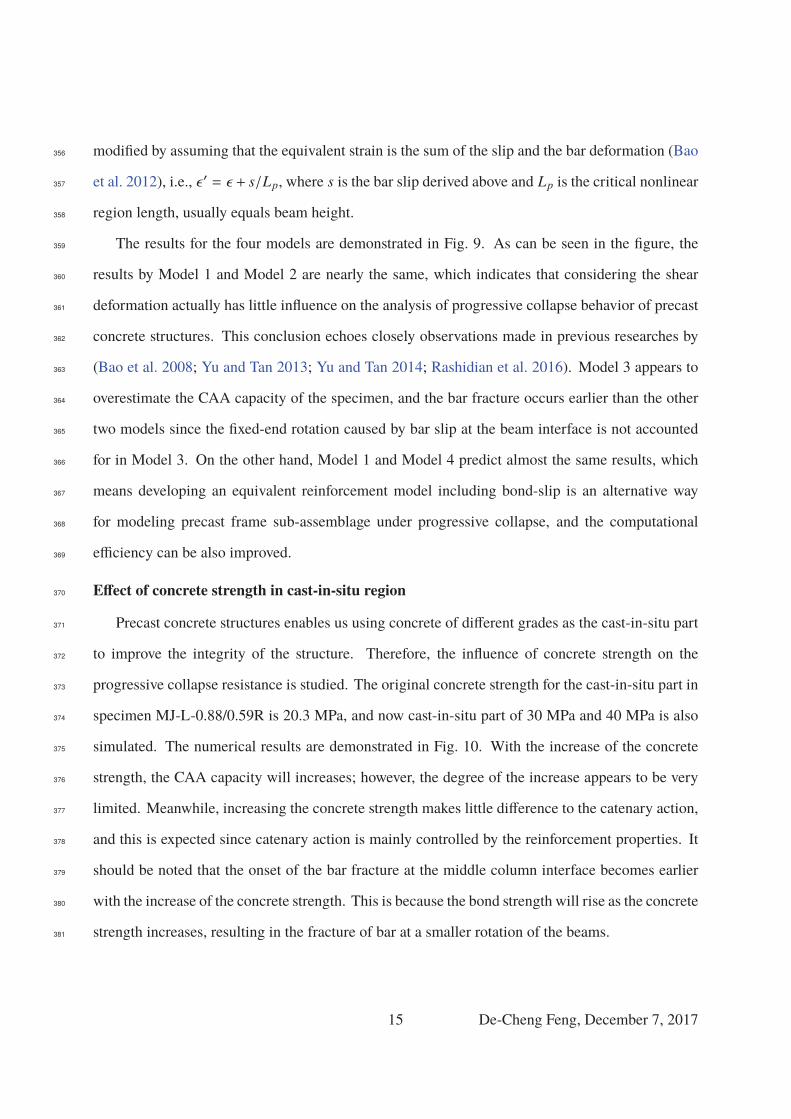
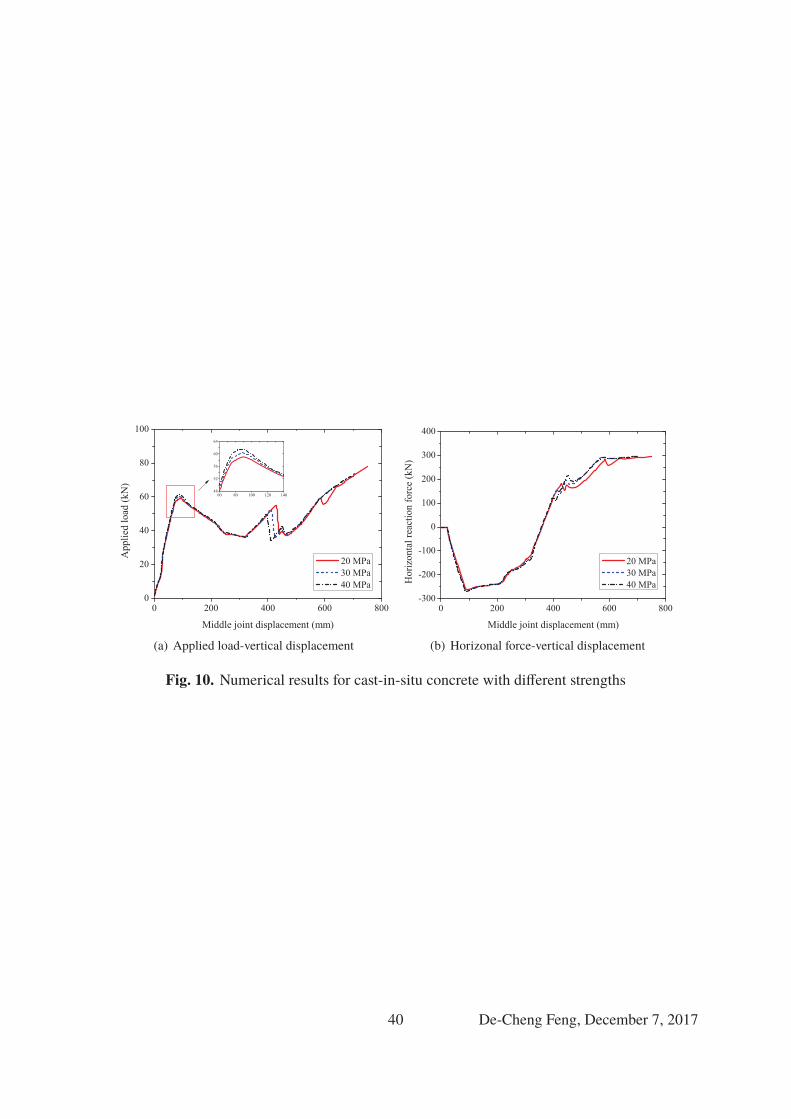
Effect of concrete strength in cast-in-situ region370
Precast concrete structures enables us using concrete of different grades as the cast-in-situ part371
to improve the integrity of the structure. Therefore, the influence of concrete strength on the372
progressive collapse resistance is studied. The original concrete strength for the cast-in-situ part in373
specimen MJ-L-0.88/0.59R is 20.3 MPa, and now cast-in-situ part of 30 MPa and 40 MPa is also374
simulated. The numerical results are demonstrated in Fig. 10. With the increase of the concrete375
strength, the CAA capacity will increases; however, the degree of the increase appears to be very376
limited. Meanwhile, increasing the concrete strength makes little difference to the catenary action,377
and this is expected since catenary action is mainly controlled by the reinforcement properties. It378
should be noted that the onset of the bar fracture at the middle column interface becomes earlier379
with the increase of the concrete strength. This is because the bond strength will rise as the concrete380
strength increases, resulting in the fracture of bar at a smaller rotation of the beams.381
15 De-Cheng Feng, December 7, 2017
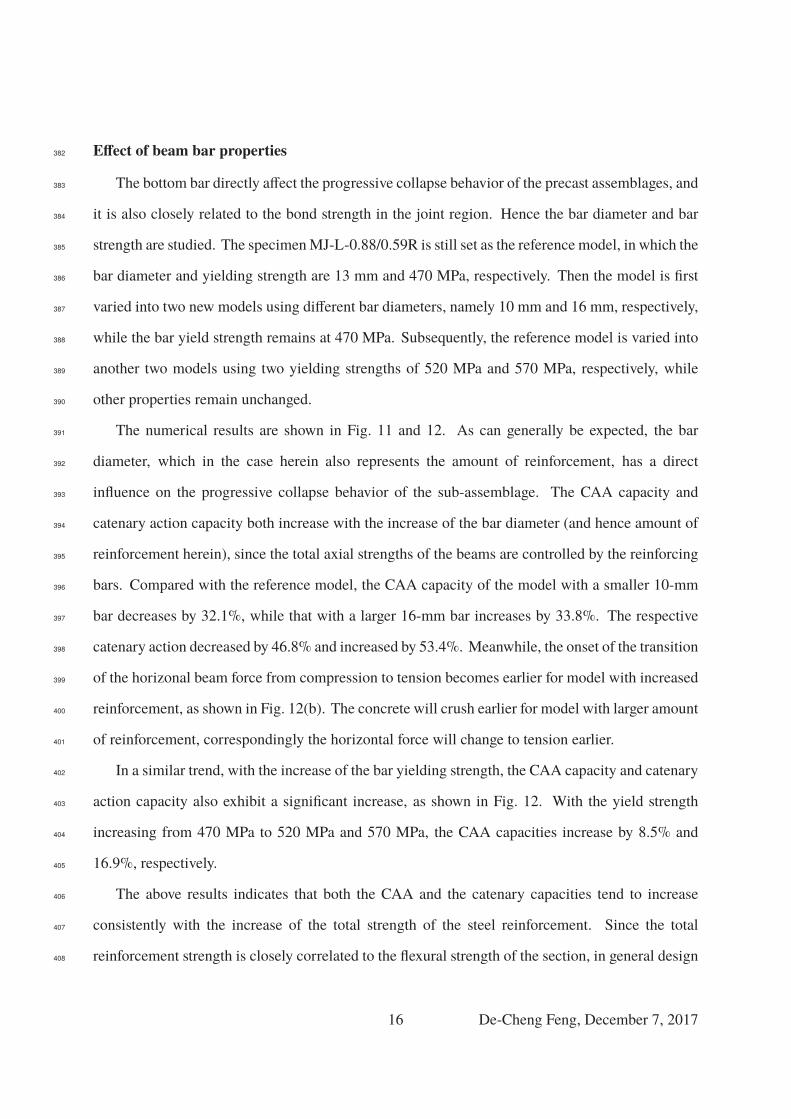
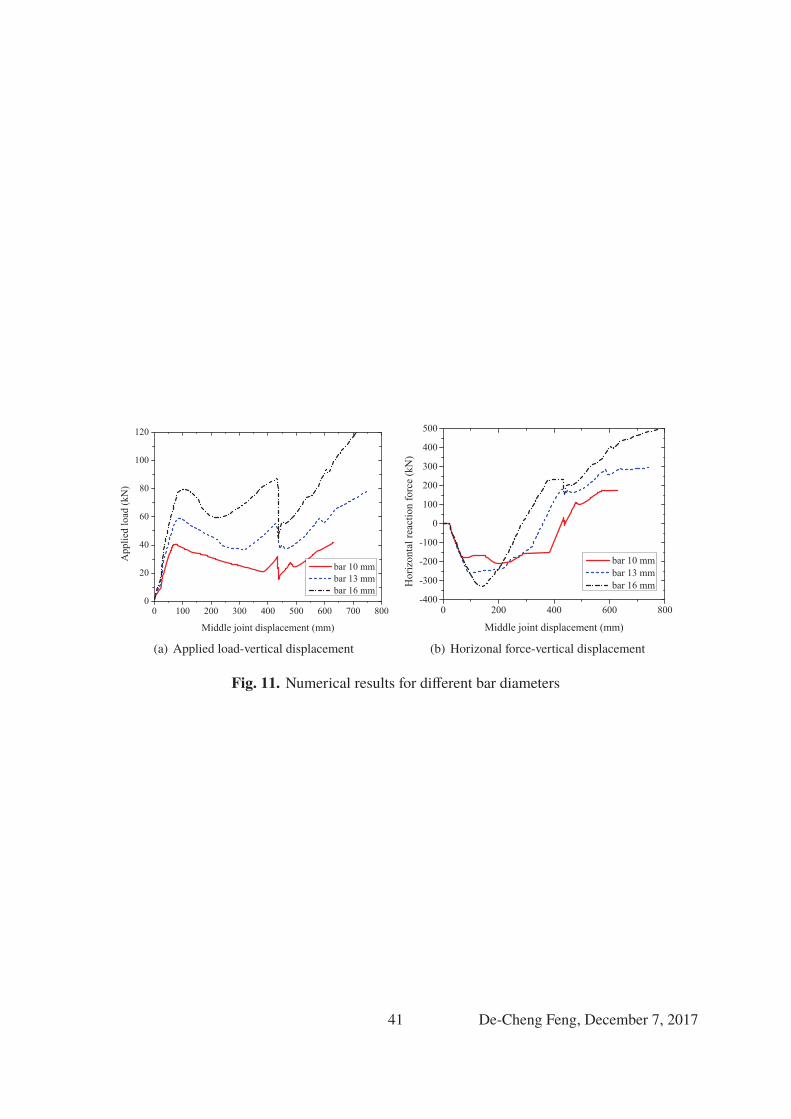
Effect of beam bar properties382
The bottom bar directly affect the progressive collapse behavior of the precast assemblages, and383
it is also closely related to the bond strength in the joint region. Hence the bar diameter and bar384
strength are studied. The specimenMJ-L-0.88/0.59R is still set as the reference model, in which the385
bar diameter and yielding strength are 13 mm and 470 MPa, respectively. Then the model is first386
varied into two new models using different bar diameters, namely 10 mm and 16 mm, respectively,387
while the bar yield strength remains at 470 MPa. Subsequently, the reference model is varied into388
another two models using two yielding strengths of 520 MPa and 570 MPa, respectively, while389
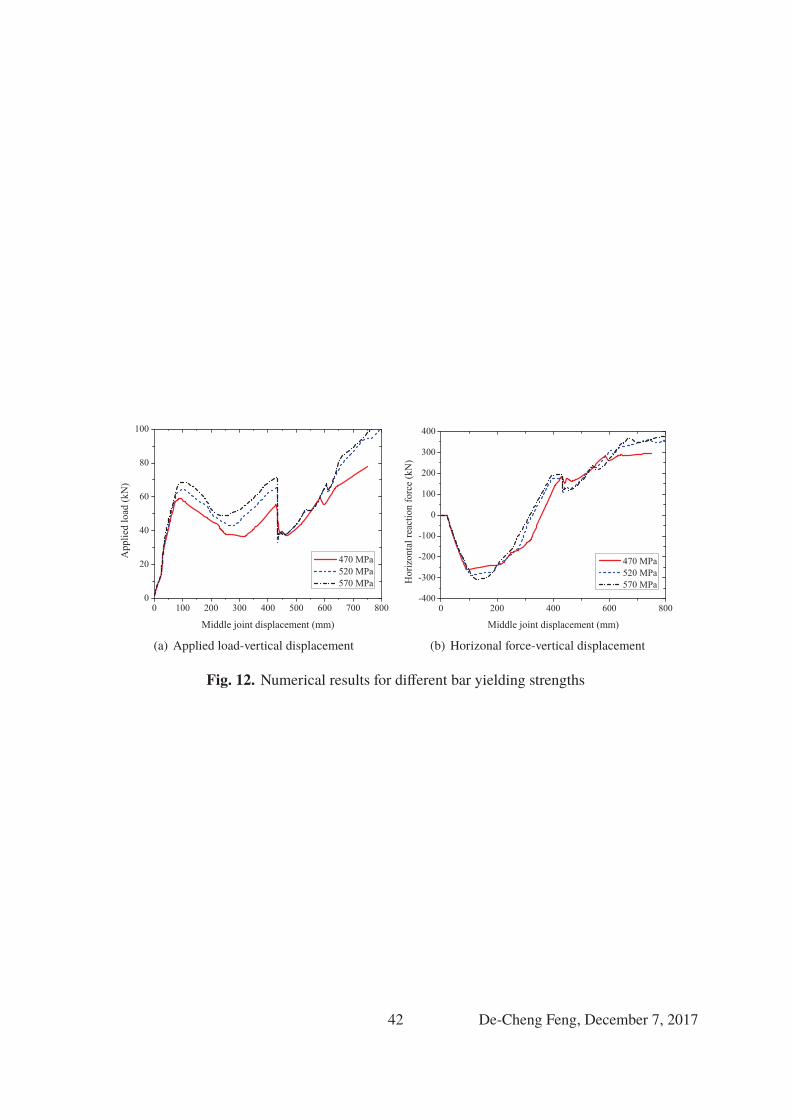
other properties remain unchanged.390
The numerical results are shown in Fig. 11 and 12. As can generally be expected, the bar391
diameter, which in the case herein also represents the amount of reinforcement, has a direct392
influence on the progressive collapse behavior of the sub-assemblage. The CAA capacity and393
catenary action capacity both increase with the increase of the bar diameter (and hence amount of394
reinforcement herein), since the total axial strengths of the beams are controlled by the reinforcing395
bars. Compared with the reference model, the CAA capacity of the model with a smaller 10-mm396
bar decreases by 32.1%, while that with a larger 16-mm bar increases by 33.8%. The respective397
catenary action decreased by 46.8% and increased by 53.4%. Meanwhile, the onset of the transition398
of the horizonal beam force from compression to tension becomes earlier for model with increased399
reinforcement, as shown in Fig. 12(b). The concrete will crush earlier for model with larger amount400
of reinforcement, correspondingly the horizontal force will change to tension earlier.401
In a similar trend, with the increase of the bar yielding strength, the CAA capacity and catenary402
action capacity also exhibit a significant increase, as shown in Fig. 12. With the yield strength403
increasing from 470 MPa to 520 MPa and 570 MPa, the CAA capacities increase by 8.5% and404
16.9%, respectively.405
The above results indicates that both the CAA and the catenary capacities tend to increase406
consistently with the increase of the total strength of the steel reinforcement. Since the total407
reinforcement strength is closely correlated to the flexural strength of the section, in general design408
16 De-Cheng Feng, December 7, 2017
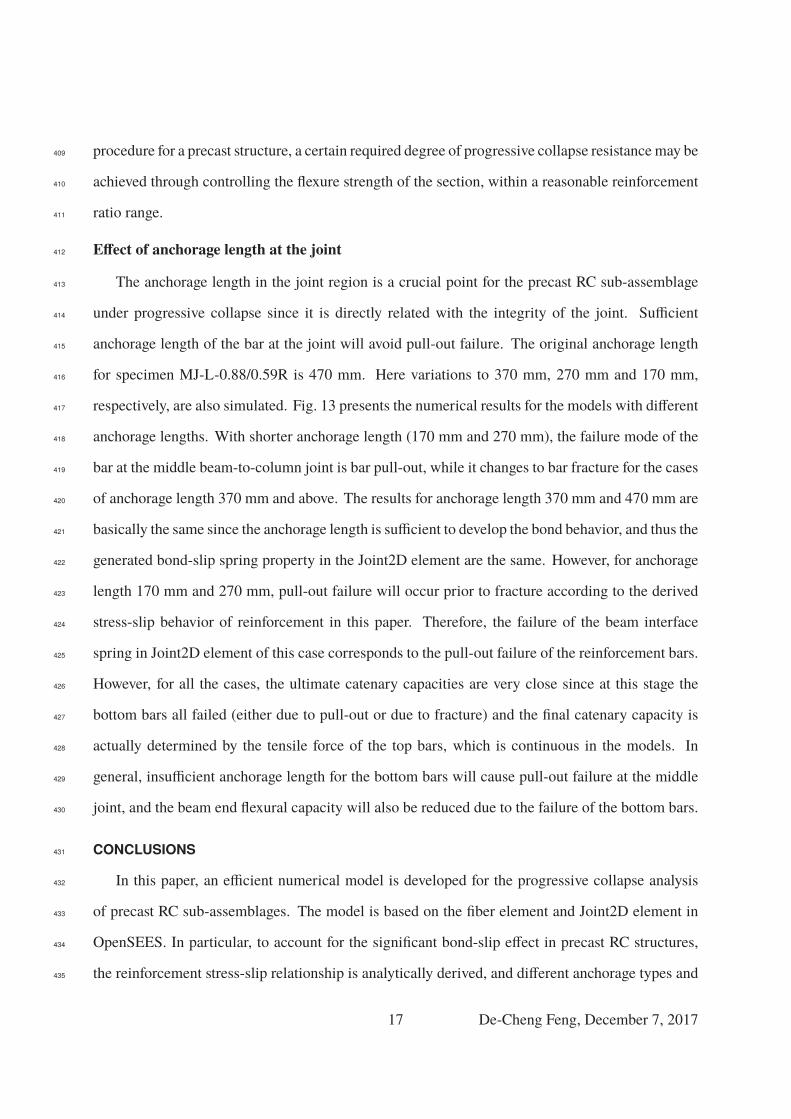
procedure for a precast structure, a certain required degree of progressive collapse resistancemay be409
achieved through controlling the flexure strength of the section, within a reasonable reinforcement410
ratio range.411
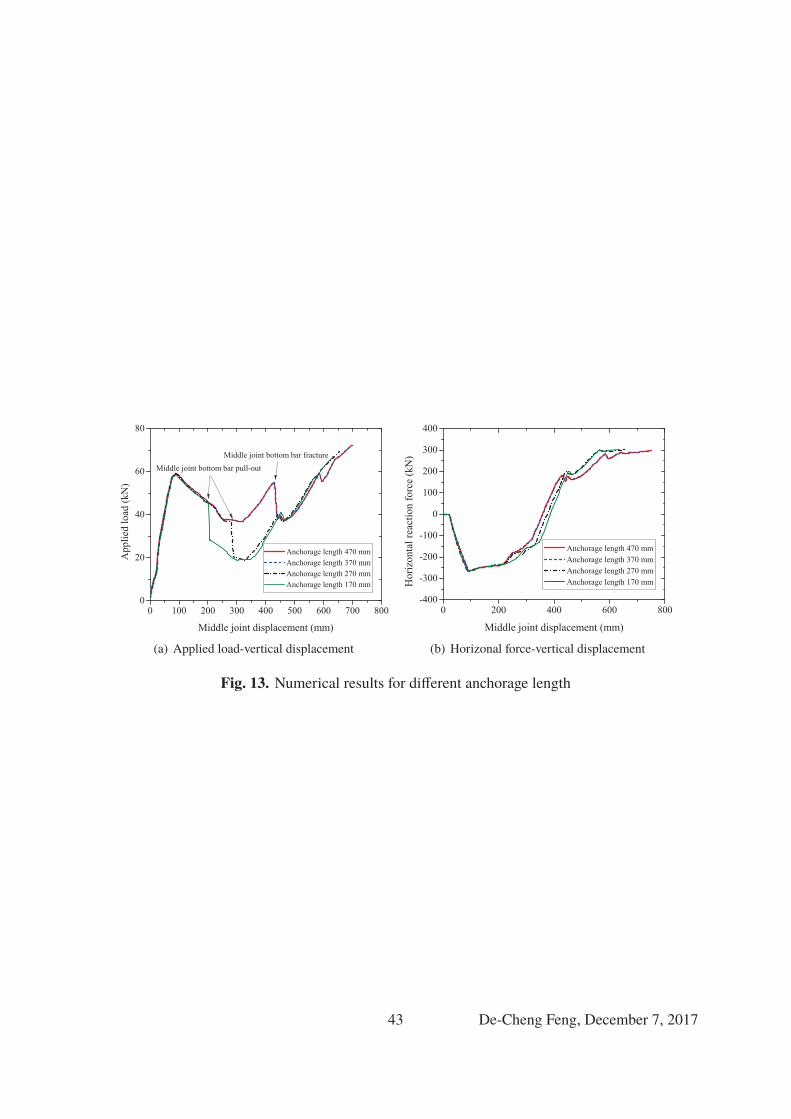
Effect of anchorage length at the joint412
The anchorage length in the joint region is a crucial point for the precast RC sub-assemblage413
under progressive collapse since it is directly related with the integrity of the joint. Sufficient414
anchorage length of the bar at the joint will avoid pull-out failure. The original anchorage length415
for specimen MJ-L-0.88/0.59R is 470 mm. Here variations to 370 mm, 270 mm and 170 mm,416
respectively, are also simulated. Fig. 13 presents the numerical results for the models with different417
anchorage lengths. With shorter anchorage length (170 mm and 270 mm), the failure mode of the418
bar at the middle beam-to-column joint is bar pull-out, while it changes to bar fracture for the cases419
of anchorage length 370 mm and above. The results for anchorage length 370 mm and 470 mm are420
basically the same since the anchorage length is sufficient to develop the bond behavior, and thus the421
generated bond-slip spring property in the Joint2D element are the same. However, for anchorage422
length 170 mm and 270 mm, pull-out failure will occur prior to fracture according to the derived423
stress-slip behavior of reinforcement in this paper. Therefore, the failure of the beam interface424
spring in Joint2D element of this case corresponds to the pull-out failure of the reinforcement bars.425
However, for all the cases, the ultimate catenary capacities are very close since at this stage the426
bottom bars all failed (either due to pull-out or due to fracture) and the final catenary capacity is427
actually determined by the tensile force of the top bars, which is continuous in the models. In428
general, insufficient anchorage length for the bottom bars will cause pull-out failure at the middle429
joint, and the beam end flexural capacity will also be reduced due to the failure of the bottom bars.430
CONCLUSIONS431
In this paper, an efficient numerical model is developed for the progressive collapse analysis432
of precast RC sub-assemblages. The model is based on the fiber element and Joint2D element in433
OpenSEES. In particular, to account for the significant bond-slip effect in precast RC structures,434
the reinforcement stress-slip relationship is analytically derived, and different anchorage types and435
17 De-Cheng Feng, December 7, 2017
lengths are considered. To validate the numerical model, a set of recently reported experiments436
of six precast RC sub-assemblages under a middle column removal scenario are simulated. The437
results indicate that the proposed model can well capture the typical progressive collapse behaviors438
of the precast RC structures, including behaviors in the flexural, CAA, and catenary stages.439
With the validated numerical model, several important factors influencing the analysis of440
precast structures are investigated, these include the modeling strategy, the post-cast concrete441
strength, the bar diameter and yielding strength (or total reinforcement contributions), and the442
bottom bar anchorage length. The results indicate that the bond-slip effect has a sensible influence443
and therefore should be considered in the numerical model; otherwise the CAA capacity will be444
overestimated and the beam end rotation capacity will be underestimated. Improving the concrete445
strength of cast-in-situ part will increase the CAA capacity, but the extent appears to be limited. The446
reinforcement altogether, through bar diameter and yielding strength, will have a great influence on447
the CAA capacity as well as the catenary capacity. These two capacities will increase consistently448
with increasing the bar diameter and yielding strength; but the onset of beam horizontal force449
transition from compression to tension will also become earlier. The failure mode of the bar at the450
middle column joint depends on the anchorage length. Pull-out failure will happen for insufficient451
anchorage length and fracture failure will happen for sufficient anchorage length. However, in both452
cases the final catenary action capacity is nearly the same in principle since it is dominated by the453
tensile force of the top bars.454
In general, the numerical model developed in this paper represents a balanced consideration455
between the analysis accuracy and computational efficiency. The proposed model approach can be456
used as an effective tool for progressive collapse analysis of precast structures. It should be noted457
that some other detailed aspects relating to precast RC structures, like the interface between precast458
and cast-in-situ concrete surfaces and the bond deterioration, still requires further study in order to459
be considered in the numerical model.460
ACKNOWLEDGEMENTS461
The authors would like to acknowledge financial supports from the National Key Research and462
18 De-Cheng Feng, December 7, 2017
Development Program of China (No. 2016YFC0701400), the National Natural Science Foun-463
dation of China (Grant No. 51708106), the Natural Science Foundation of Jiangsu Province464
(Grant No. BK20170680), and the Fundamental Research Funds for the Central Universities (Nos.465
2242017k30002, 2242017k40212).466
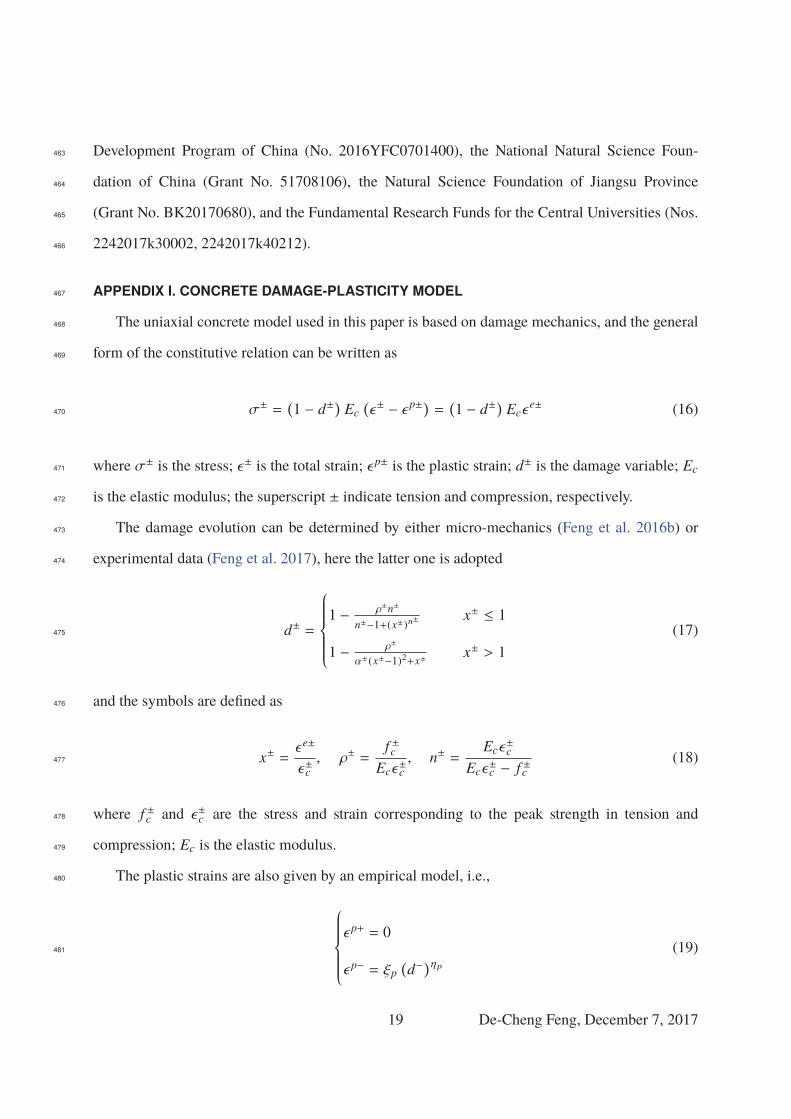
APPENDIX I. CONCRETE DAMAGE-PLASTICITY MODEL467
The uniaxial concrete model used in this paper is based on damage mechanics, and the general468
form of the constitutive relation can be written as469
σ± =(1 − d±
)Ec
(ε± − ε p±) = (
1 − d±)
Ecεe± (16)470
where σ± is the stress; ε± is the total strain; ε p± is the plastic strain; d± is the damage variable; Ec471
is the elastic modulus; the superscript ± indicate tension and compression, respectively.472
The damage evolution can be determined by either micro-mechanics (Feng et al. 2016b) or473
experimental data (Feng et al. 2017), here the latter one is adopted474
d± =
⎧⎪⎪⎪⎪⎪⎨⎪⎪⎪⎪⎪⎩
1 − ρ±n±
n±−1+(x±)n±x± ≤ 1
1 − ρ±α±(x±−1)2+x± x± > 1
(17)475
and the symbols are defined as476
x± =ε e±
ε±c, ρ± =
f ±cEcε
±c, n± =
Ecε±c
Ecε±c − f ±c
(18)477
where f ±c and ε±c are the stress and strain corresponding to the peak strength in tension and478
compression; Ec is the elastic modulus.479
The plastic strains are also given by an empirical model, i.e.,480
⎧⎪⎪⎪⎪⎪⎨⎪⎪⎪⎪⎪⎩
ε p+ = 0
ε p− = ξp(d−
)ηp (19)481
19 De-Cheng Feng, December 7, 2017
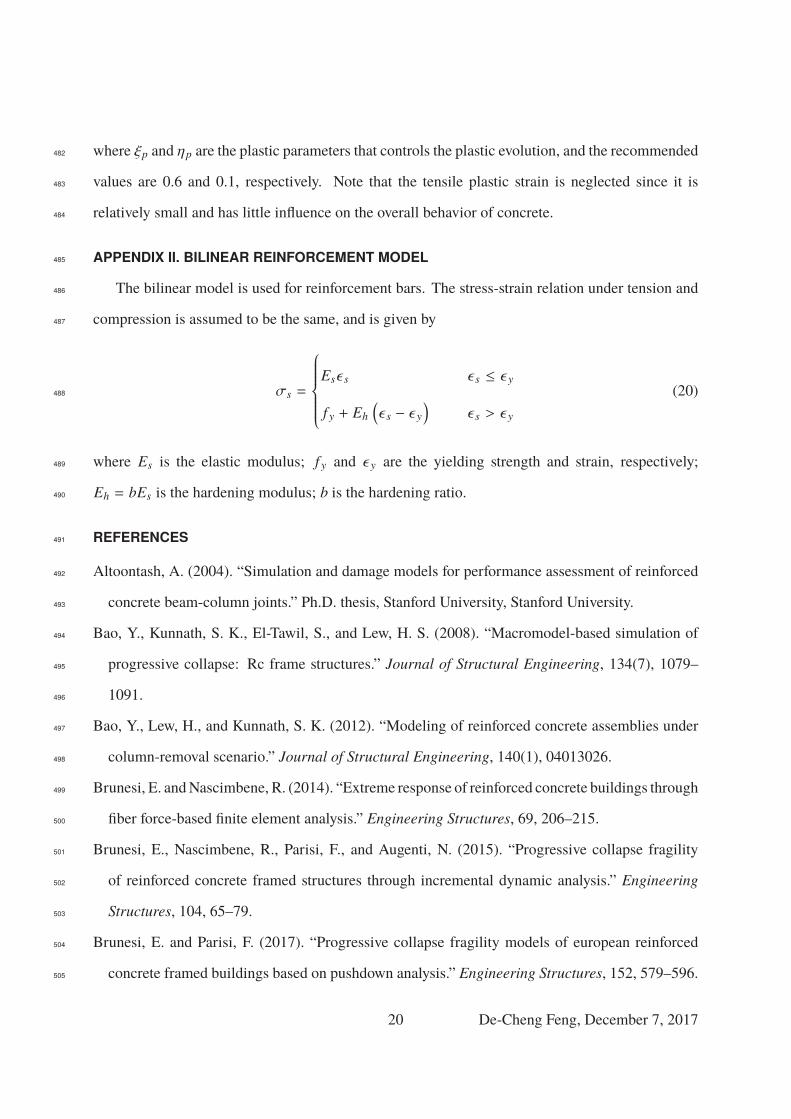
where ξp and ηp are the plastic parameters that controls the plastic evolution, and the recommended482
values are 0.6 and 0.1, respectively. Note that the tensile plastic strain is neglected since it is483
relatively small and has little influence on the overall behavior of concrete.484
APPENDIX II. BILINEAR REINFORCEMENT MODEL485
The bilinear model is used for reinforcement bars. The stress-strain relation under tension and486
compression is assumed to be the same, and is given by487
σs =
⎧⎪⎪⎪⎪⎪⎨⎪⎪⎪⎪⎪⎩
Esε s ε s ≤ ε yf y + Eh
(ε s − ε y
)ε s > ε y
(20)488
where Es is the elastic modulus; f y and ε y are the yielding strength and strain, respectively;489
Eh = bEs is the hardening modulus; b is the hardening ratio.490
REFERENCES491
Altoontash, A. (2004). “Simulation and damage models for performance assessment of reinforced492
concrete beam-column joints.” Ph.D. thesis, Stanford University, Stanford University.493
Bao, Y., Kunnath, S. K., El-Tawil, S., and Lew, H. S. (2008). “Macromodel-based simulation of494
progressive collapse: Rc frame structures.” Journal of Structural Engineering, 134(7), 1079–495
1091.496
Bao, Y., Lew, H., and Kunnath, S. K. (2012). “Modeling of reinforced concrete assemblies under497
column-removal scenario.” Journal of Structural Engineering, 140(1), 04013026.498
Brunesi, E. andNascimbene, R. (2014). “Extreme response of reinforced concrete buildings through499
fiber force-based finite element analysis.” Engineering Structures, 69, 206–215.500
Brunesi, E., Nascimbene, R., Parisi, F., and Augenti, N. (2015). “Progressive collapse fragility501
of reinforced concrete framed structures through incremental dynamic analysis.” Engineering502
Structures, 104, 65–79.503
Brunesi, E. and Parisi, F. (2017). “Progressive collapse fragility models of european reinforced504
concrete framed buildings based on pushdown analysis.” Engineering Structures, 152, 579–596.505
20 De-Cheng Feng, December 7, 2017
DoD (2013). “Unified facilities criteria: design of buildings to resist progressive collapse.” Report506
No. UFC 4-023-03, Department of Defense, Washington DC, United States.507
Ellingwood, B. R. (2006). “Mitigating risk from abnormal loads and progressive collapse.” Journal508
of Performance of Constructed Facilities, 20(4), 315–323.509
Feng, D.-C., Kolay, C., Ricles, J. M., and Li, J. (2016a). “Collapse simulation of reinforced concrete510
frame structures.” The Structural Design of Tall and Special Buildings, 12(25), 578–601.511
Feng, D.-C., Ren, X., and Li, J. (2015). “Implicit gradient delocalization method for force-based512
frame element.” Journal of Structural Engineering, 142(2), 04015122.513
Feng, D.-C., Ren, X., and Li, J. (2016b). “Stochastic damage hysteretic model for concrete based514
on micromechanical approach.” International Journal of Non-Linear Mechanics, 83, 15–25.515
Feng, D.-C., Wu, G., Sun, Z.-Y., and Xu, J.-G. (2017). “A flexure-shear timoshenko fiber beam516
element based on softened damage-plasticity model.” Engineering Structures, 140, 483–497.517
GSA (2013). “Alternate path analysis & design guidelines for progressive collapse resistance.”518
Report no., General Service Administration, Washington DC, United States.519
Hsu, T. T. (1988). “Softened truss model theory for shear and torsion.” ACI Structural Journal,520
85(6).521
Kang, S.-B. and Tan, K.-H. (2015a). “Behaviour of precast concrete beam–column sub-assemblages522
subject to column removal.” Engineering Structures, 93, 85–96.523
Kang, S.-B. and Tan, K.-H. (2015b). “Bond–slip behaviour of deformed reinforcing bars embedded524
in well-confined concrete.” Magazine of Concrete Research, 68(10), 515–529.525
Kang, S.-B. and Tan, K.-H. (2017). “Progressive collapse resistance of precast concrete frames with526
discontinuous reinforcement in the joint.” Journal of Structural Engineering, 143(9), 04017090.527
Kang, S.-B., Tan, K.-H., and Yang, E.-H. (2015). “Progressive collapse resistance of precast beam–528
column sub-assemblages with engineered cementitious composites.” Engineering Structures, 98,529
186–200.530
Li, Y., Lu, X., Guan, H., and Ren, P. (2016a). “Numerical investigation of progressive collapse531
resistance of reinforced concrete frames subject to column removals from different stories.”532
21 De-Cheng Feng, December 7, 2017
Advances in Structural Engineering, 19(2), 314–326.533
Li, Y., Lu, X., Guan, H., Ren, P., and Qian, L. (2016b). “Probability-based progressive collapse-534
resistant assessment for reinforced concrete frame structures.” Advances in Structural Engineer-535
ing, 19(11), 1723–1735.536
Li, Y., Lu, X., Guan, H., and Ye, L. (2011). “An improved tie force method for progressive collapse537
resistance design of reinforced concrete frame structures.”Engineering Structures, 33(10), 2931–538
2942.539
Lowes, L. N. and Altoontash, A. (2003). “Modeling reinforced-concrete beam-column joints sub-540
jected to cyclic loading.” Journal of Structural Engineering, 129(12), 1686–1697.541
Lu, X., Lin, K., Li, Y., Guan, H., Ren, P., and Zhou, Y. (2016). “Experimental investigation542
of rc beam-slab substructures against progressive collapse subject to an edge-column-removal543
scenario.” Engineering Structures.544
Mander, J. B., Priestley, M. J., and Park, R. (1988). “Theoretical stress-strain model for confined545
concrete.” Journal of Structural Engineering, 114(8), 1804–1826.546
Ministry of Construction of the People’s Republic of China, B. (2010). “Code for design of concrete547
structures.” Gb50010-2010, Beijing, China.548
Pham, A.-T., Tan, K.-H., and Yu, J. (2016). “Numerical investigations on static and dynamic549
responses of reinforced concrete sub-assemblages under progressive collapse.” Engineering550
Structures.551
Qian, K. and Li, B. (2011). “Experimental and analytical assessment on rc interior beam-column552
subassemblages for progressive collapse.” Journal of Performance of Constructed Facilities,553
26(5), 576–589.554
Qian, K. and Li, B. (2012). “Performance of three-dimensional reinforced concrete beam-column555
substructures under loss of a corner column scenario.” Journal of Structural Engineering, 139(4),556
584–594.557
Qian, K., Li, B., and Zhang, Z. (2016). “Influence of multicolumn removal on the behavior of rc558
floors.” Journal of Structural Engineering, 142(5), 04016006.559
22 De-Cheng Feng, December 7, 2017
Rashidian, O., Abbasnia, R., Ahmadi, R., and Nav, F. M. (2016). “Progressive collapse of exterior560
reinforced concrete beam–column sub-assemblages: Considering the effects of a transverse561
frame.” International Journal of Concrete Structures and Materials, 10(4), 479–497.562
Ren, P., Li, Y., Lu, X., Guan, H., and Zhou, Y. (2016). “Experimental investigation of progressive563
collapse resistance of one-way reinforced concrete beam–slab substructures under a middle-564
column-removal scenario.” Engineering Structures, 118, 28–40.565
Sasani, M. and Kropelnicki, J. (2008). “Progressive collapse analysis of an rc structure.” The566
Structural Design of Tall and Special Buildings, 17(4), 757–771.567
Sasani, M., Werner, A., and Kazemi, A. (2011). “Bar fracture modeling in progressive collapse568
analysis of reinforced concrete structures.” Engineering Structures, 33(2), 401–409.569
Sezen, H. and Setzler, E. J. (2008). “Reinforcement slip in reinforced concrete columns.” ACI570
Structural Journal, 105(3), 280.571
Su, Y., Tian, Y., and Song, X. (2009). “Progressive collapse resistance of axially-restrained frame572
beams.” ACI Structural Journal, 106(5), 600.573
Valipour, H. R. and Foster, S. J. (2010). “Finite element modelling of reinforced concrete framed574
structures including catenary action.” Computers & structures, 88(9), 529–538.575
Vecchio, F. J. and Collins, M. P. (1986). “The modified compression-field theory for reinforced576
concrete elements subjected to shear.” ACI Structural Journal, ACI, 83(2), 219–231.577
Yap, S. L. and Li, B. (2011). “Experimental investigation of reinforced concrete exterior beam-578
column subassemblages for progressive collapse.” ACI Structural Journal, 108(5), 542.579
Yi, W.-J., He, Q.-F., Xiao, Y., and Kunnath, S. K. (2008). “Experimental study on progressive580
collapse-resistant behavior of reinforced concrete frame structures.” ACI Structural Journal,581
105(4), 433.582
Yu, J. and Tan, K.-H. (2013). “Experimental and numerical investigation on progressive collapse583
resistance of reinforced concrete beam column sub-assemblages.” Engineering Structures, 55,584
90–106.585
Yu, J. and Tan, K.-H. (2014). “Numerical analysis with joint model on rc assemblages subjected to586
23 De-Cheng Feng, December 7, 2017
progressive collapse.” Magazine of Concrete Research, 66(23), 1201–1218.587
Yu, X. H., Lu, D. G., Qian, K., and Li, B. (2016). “Uncertainty and sensitivity analysis of reinforced588
concrete frame structures subjected to column loss.” Journal of Performance of Constructed589
Facilities, 04016069.590
24 De-Cheng Feng, December 7, 2017
List of Tables591
1 Summary of the proposed modeling approach . . . . . . . . . . . . . . . . . . . . 26592
2 Reinforcing details of the tested specimens . . . . . . . . . . . . . . . . . . . . . . 27593
3 Material properties of the tested specimens . . . . . . . . . . . . . . . . . . . . . 28594
25 De-Cheng Feng, December 7, 2017
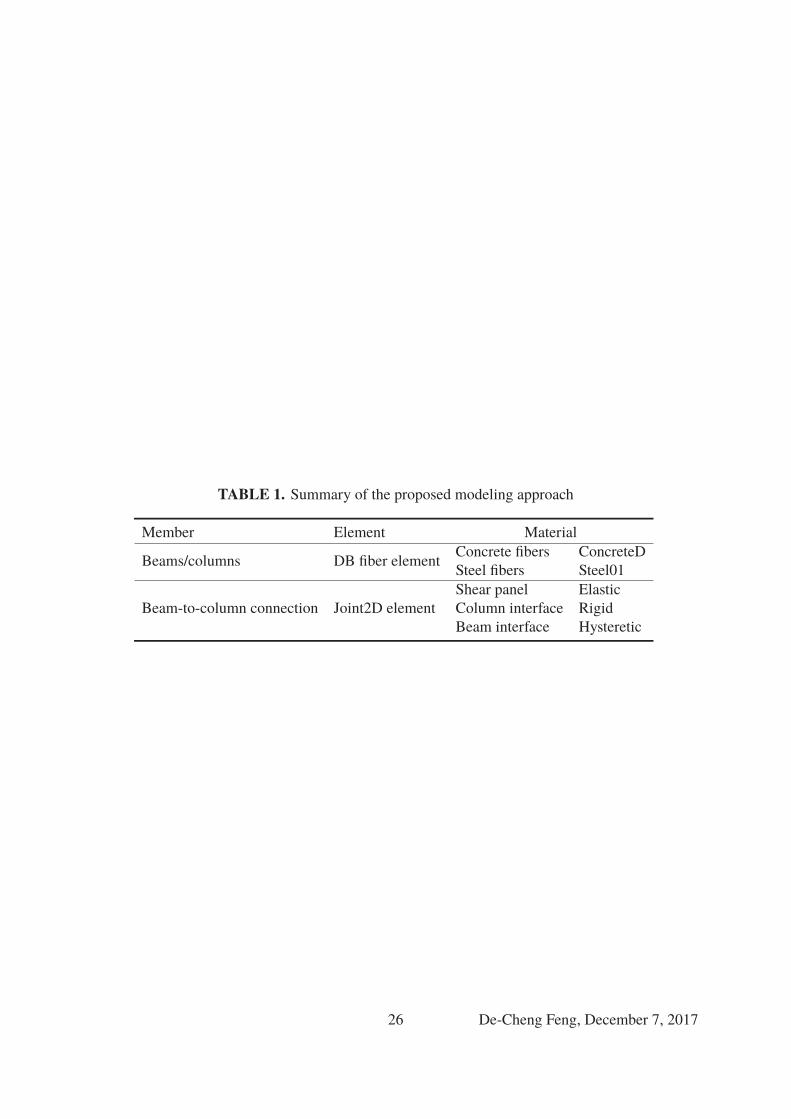
TABLE 1. Summary of the proposed modeling approach
Member Element Material
Beams/columns DB fiber elementConcrete fibers ConcreteD
Steel fibers Steel01
Beam-to-column connection Joint2D element
Shear panel Elastic
Column interface Rigid
Beam interface Hysteretic
26 De-Cheng Feng, December 7, 2017
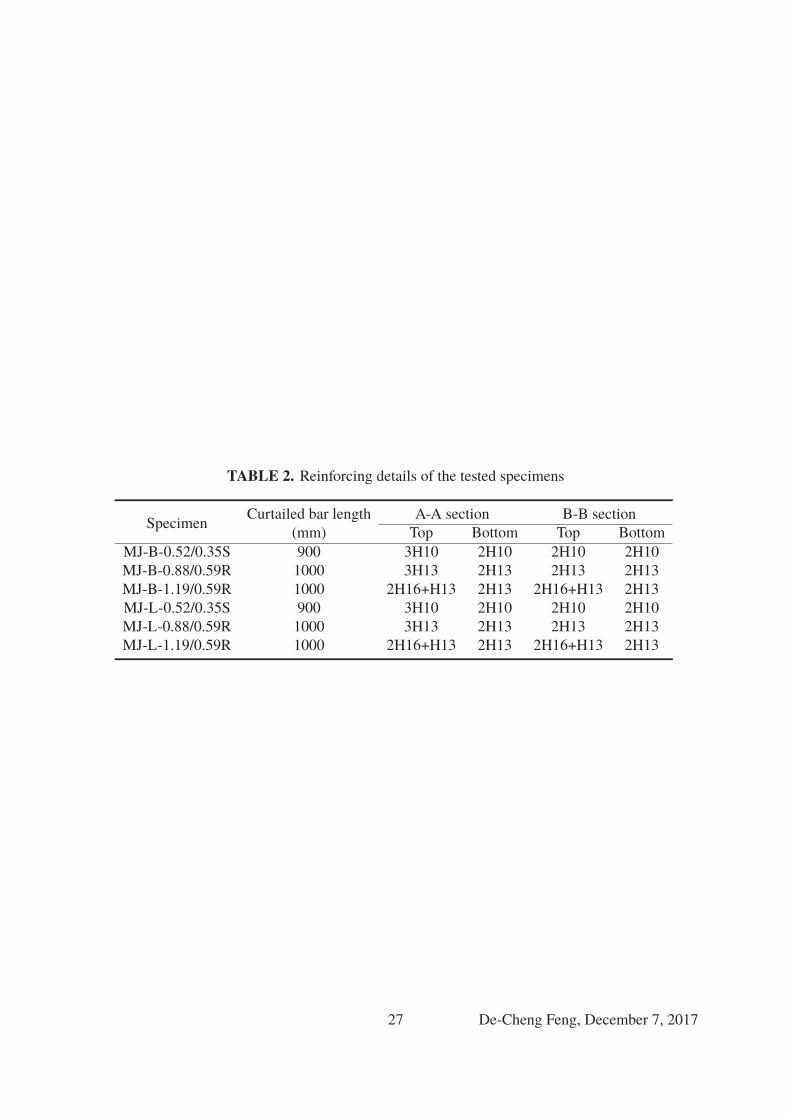
TABLE 2. Reinforcing details of the tested specimens
SpecimenCurtailed bar length A-A section B-B section
(mm) Top Bottom Top Bottom
MJ-B-0.52/0.35S 900 3H10 2H10 2H10 2H10
MJ-B-0.88/0.59R 1000 3H13 2H13 2H13 2H13
MJ-B-1.19/0.59R 1000 2H16+H13 2H13 2H16+H13 2H13
MJ-L-0.52/0.35S 900 3H10 2H10 2H10 2H10
MJ-L-0.88/0.59R 1000 3H13 2H13 2H13 2H13
MJ-L-1.19/0.59R 1000 2H16+H13 2H13 2H16+H13 2H13
27 De-Cheng Feng, December 7, 2017
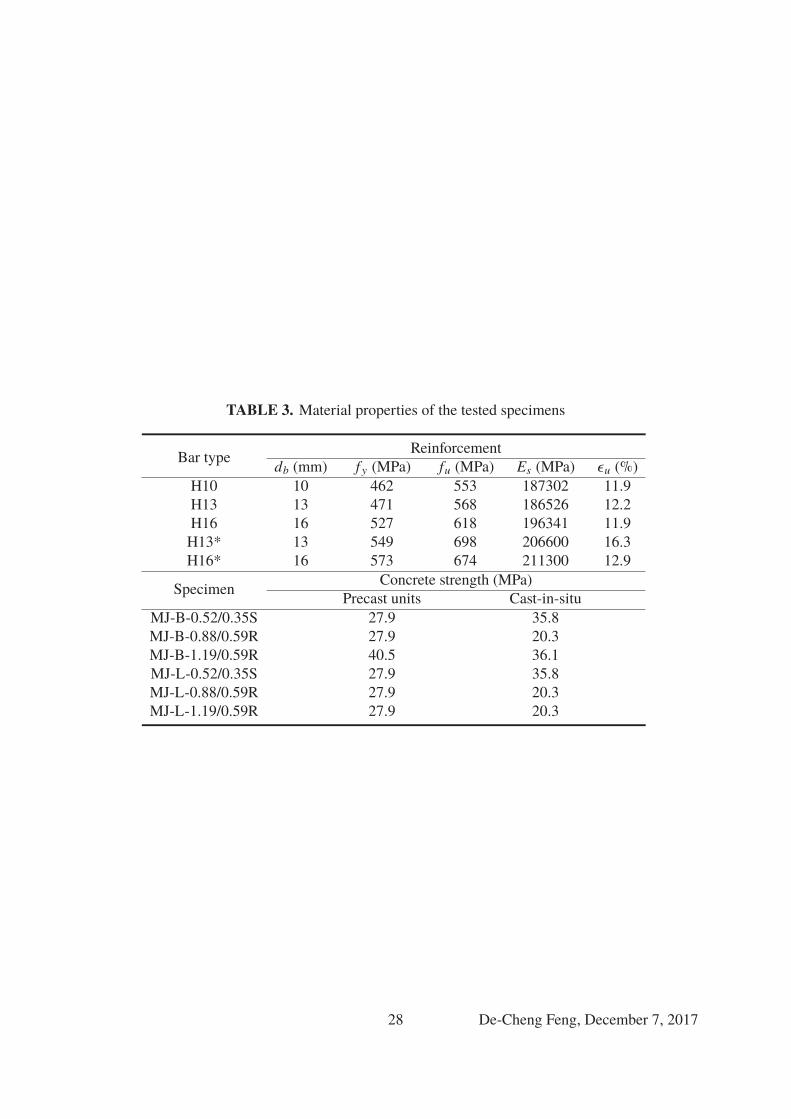
TABLE 3. Material properties of the tested specimens
Bar typeReinforcement
db (mm) f y (MPa) fu (MPa) Es (MPa) εu (%)
H10 10 462 553 187302 11.9
H13 13 471 568 186526 12.2
H16 16 527 618 196341 11.9
H13* 13 549 698 206600 16.3
H16* 16 573 674 211300 12.9
SpecimenConcrete strength (MPa)
Precast units Cast-in-situ
MJ-B-0.52/0.35S 27.9 35.8
MJ-B-0.88/0.59R 27.9 20.3
MJ-B-1.19/0.59R 40.5 36.1
MJ-L-0.52/0.35S 27.9 35.8
MJ-L-0.88/0.59R 27.9 20.3
MJ-L-1.19/0.59R 27.9 20.3
28 De-Cheng Feng, December 7, 2017
List of Figures595
1 Joint2D element for precast sub-assemblage under progressive collapse . . . . . . 30596
2 Determination of the beam end spring property through fiber section analysis . . . 31597
3 Bond and stress profile of different anchorage types for the precast sub-assemblage 32598
4 Strain profiles of different bar embedded length . . . . . . . . . . . . . . . . . . . 33599
5 Experiments of precast sub-assemblages subjected to progressive collapse by Kang600
and Tan . . . . . . . . . . . . . . . . . . . . . . . . . . . . . . . . . . . . . . . . 34601
6 Established finite element model . . . . . . . . . . . . . . . . . . . . . . . . . . . 35602
7 Comparison of numerical and experimental results . . . . . . . . . . . . . . . . . 37603
8 Deformed profile for specimen MJ-B-0.88/0.59R . . . . . . . . . . . . . . . . . . 38604
9 Numerical results for different modeling strategies . . . . . . . . . . . . . . . . . . 39605
10 Numerical results for cast-in-situ concrete with different strengths . . . . . . . . . 40606
11 Numerical results for different bar diameters . . . . . . . . . . . . . . . . . . . . . 41607
12 Numerical results for different bar yielding strengths . . . . . . . . . . . . . . . . 42608
13 Numerical results for different anchorage length . . . . . . . . . . . . . . . . . . . 43609
29 De-Cheng Feng, December 7, 2017
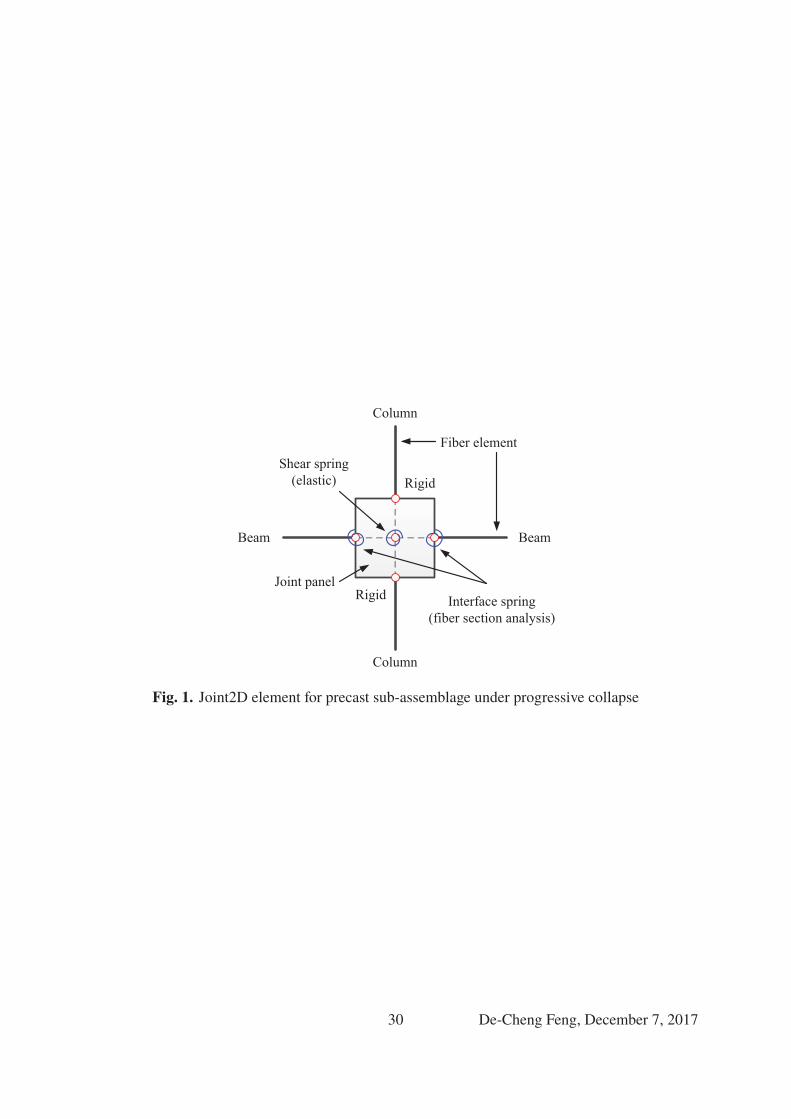
Fig. 1. Joint2D element for precast sub-assemblage under progressive collapse
30 De-Cheng Feng, December 7, 2017
y
z
M
(using stress-strain)
(using stress-slip)
Fig. 2. Determination of the beam end spring property through fiber section analysis
31 De-Cheng Feng, December 7, 2017
sf
embdL
beu byu
yf
ydLedL
(a) Continuous bar
embdL
ydLedL
sf
byubeu
yf
(b) Lap-spliced bar
ydLedL
embdL
sf
byubeu
yf
(c) Hooked bar
Fig. 3. Bond and stress profile of different anchorage types for the precast sub-assemblage
32 De-Cheng Feng, December 7, 2017
y
u
embdL
edL
ydL
embdL
edbL ydL
embdL
ydLedbL
u
u
edL
end
end
dL
Fig. 4. Strain profiles of different bar embedded length
33 De-Cheng Feng, December 7, 2017
(a) Hooked bottom reinforcement
(b) Lap-spliced bottom reinforcement
Fig. 5. Experiments of precast sub-assemblages subjected to progressive collapse by Kang and Tan
34 De-Cheng Feng, December 7, 2017
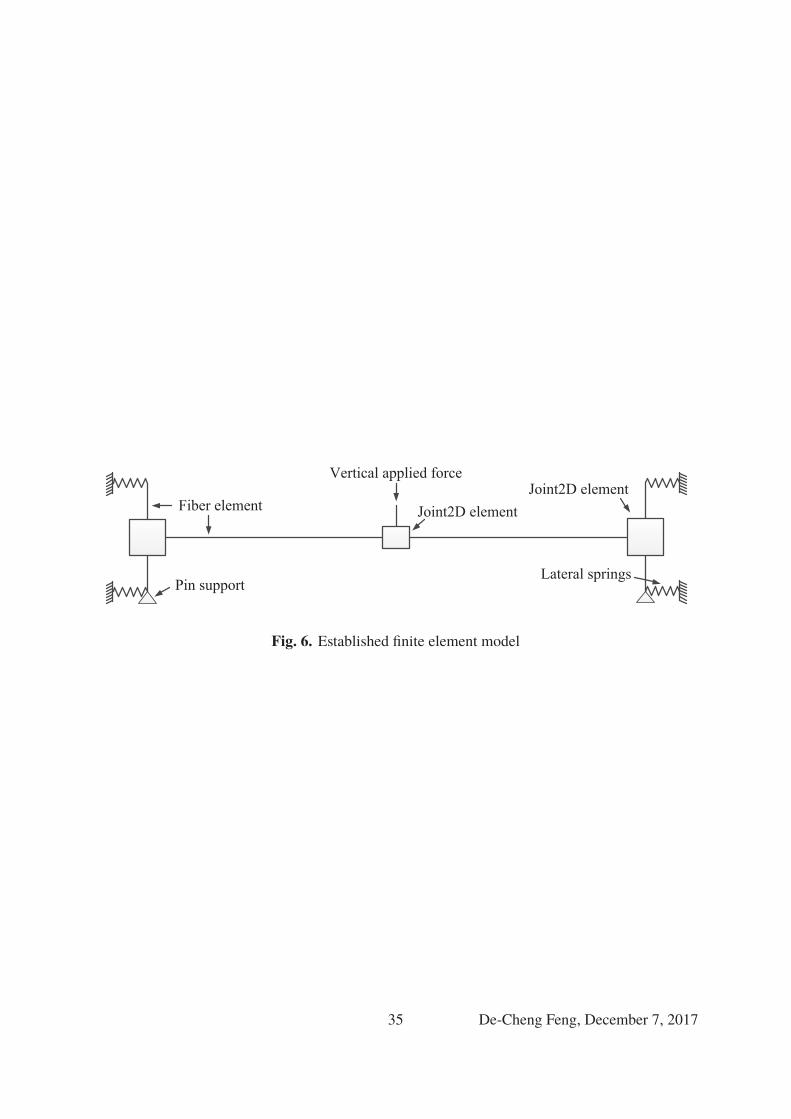
Fig. 6. Established finite element model
35 De-Cheng Feng, December 7, 2017
0 100 200 300 400 5000
10
20
30
40
50
60
Beam action
Catenary action
App
lied
load
(kN
)
Middle joint displacement (mm)
Test data Simulation
CAA
(a) MJ-B-0.52/0.35S-vertical
0 100 200 300 400 500-300
-200
-100
0
100
Hor
izon
tal r
eact
ion
forc
e (k
N)
Middle joint displacement (mm)
Test data Simulation
(b) MJ-B-0.52/0.35S-horizonal
0 200 400 600 8000
20
40
60
80
100
App
lied
load
(kN
)
Middle joint displacement (mm)
Test data Simulation
Beam action
Catenary action
CAA
(c) MJ-B-0.88/0.59R-vertical
0 200 400 600 800-300
-200
-100
0
100
200
300
400
Hor
izon
tal r
eact
ion
forc
e (k
N)
Middle joint displacement (mm)
Test data Simulation
(d) MJ-B-0.88/0.59R-horizonal
0 100 200 300 400 5000
30
60
90
120
App
lied
load
(kN
)
Middle joint displacement (mm)
Test data Simulation
Beam actionCatenary action
CAA
(e) MJ-B-1.19/0.59R-vertical
0 100 200 300 400 500-300
-200
-100
0
100
200
300
Hor
izon
tal r
eact
ion
forc
e (k
N)
Middle joint displacement (mm)
Test data Simulation
(f) MJ-B-1.19/0.59R-horizonal
36 De-Cheng Feng, December 7, 2017
0 100 200 300 400 500 600 7000
10
20
30
40
50
60
App
lied
load
(kN
)
Middle joint displacement (mm)
Test data Simulation
Beam actionCatenary actionCAA
(g) MJ-L-0.52/0.35S-vertical
0 100 200 300 400 500 600 700-200
-100
0
100
200
Hor
izon
tal r
eact
ion
forc
e (k
N)
Middle joint displacement (mm)
Test data Simulation
(h) MJ-L-0.52/0.35S-horizonal
0 200 400 600 8000
20
40
60
80
App
lied
load
(kN
)
Middle joint displacement (mm)
Test data Simulation
Beam action
Catenary actionCAA
(i) MJ-L-0.88/0.59R-vertical
0 100 200 300 400 500 600 700-300
-200
-100
0
100
200
300
Hor
izon
tal r
eact
ion
forc
e (k
N)
Middle joint displacement (mm)
Test data Simulation
(j) MJ-L-0.88/0.59R-horizonal
0 100 200 300 400 500 6000
10
20
30
40
50
60
70
80
90
App
lied
load
(kN
)
Middle joint displacement (mm)
Test data Simulation
Beam actionCatenary actionCAA
(k) MJ-L-1.19/0.59R-vertical
0 100 200 300 400 500 600
-300
-200
-100
0
100
200
300
Hor
izon
tal r
eact
ion
forc
e (k
N)
Middle joint displacement (mm)
Test data Simulation
(l) MJ-L-1.19/0.59R-horizonal
Fig. 7. Comparison of numerical and experimental results
37 De-Cheng Feng, December 7, 2017
-3000 -2000 -1000 0 1000 2000 3000-800
-600
-400
-200
0
Ver
tical
disp
lace
men
t (m
m)
Monitor point position (mm)
Test data Simulation
Fig. 8. Deformed profile for specimen MJ-B-0.88/0.59R
38 De-Cheng Feng, December 7, 2017
0 200 400 600 8000
20
40
60
80
100
App
lied
load
(kN
)
Middle joint displacement (mm)
Model 1 Model 2 Model 3 Model 4
Middle joint bottom bar fracture
End column bar fracture
(a) Applied load-vertical displacement
0 200 400 600 800-300
-200
-100
0
100
200
300
400
Model 1 Model 2 Model 3 Model 4H
oriz
onta
l rea
ctio
n fo
rce
(kN
)
Middle joint displacement (mm)
(b) Horizonal force-vertical displacement
Fig. 9. Numerical results for different modeling strategies
39 De-Cheng Feng, December 7, 2017
0 200 400 600 8000
20
40
60
80
100
60 80 100 120 14048
52
56
60
64
20 MPa 30 MPa 40 MPa
App
lied
load
(kN
)
Middle joint displacement (mm)
(a) Applied load-vertical displacement
0 200 400 600 800-300
-200
-100
0
100
200
300
400
20 MPa 30 MPa 40 MPaH
oriz
onta
l rea
ctio
n fo
rce
(kN
)
Middle joint displacement (mm)
(b) Horizonal force-vertical displacement
Fig. 10. Numerical results for cast-in-situ concrete with different strengths
40 De-Cheng Feng, December 7, 2017
0 100 200 300 400 500 600 700 8000
20
40
60
80
100
120
bar 10 mm bar 13 mm bar 16 mm
App
lied
load
(kN
)
Middle joint displacement (mm)
(a) Applied load-vertical displacement
0 200 400 600 800-400
-300
-200
-100
0
100
200
300
400
500
bar 10 mm bar 13 mm bar 16 mmH
oriz
onta
l rea
ctio
n fo
rce
(kN
)
Middle joint displacement (mm)
(b) Horizonal force-vertical displacement
Fig. 11. Numerical results for different bar diameters
41 De-Cheng Feng, December 7, 2017
0 100 200 300 400 500 600 700 8000
20
40
60
80
100
470 MPa 520 MPa 570 MPa
App
lied
load
(kN
)
Middle joint displacement (mm)
(a) Applied load-vertical displacement
0 200 400 600 800-400
-300
-200
-100
0
100
200
300
400
470 MPa 520 MPa 570 MPaH
oriz
onta
l rea
ctio
n fo
rce
(kN
)
Middle joint displacement (mm)
(b) Horizonal force-vertical displacement
Fig. 12. Numerical results for different bar yielding strengths
42 De-Cheng Feng, December 7, 2017
0 100 200 300 400 500 600 700 8000
20
40
60
80
Middle joint bottom bar fractureMiddle joint bottom bar pull-out
Anchorage length 470 mm Anchorage length 370 mm Anchorage length 270 mm Anchorage length 170 mm
App
lied
load
(kN
)
Middle joint displacement (mm)
(a) Applied load-vertical displacement
0 200 400 600 800-400
-300
-200
-100
0
100
200
300
400
Anchorage length 470 mm Anchorage length 370 mm Anchorage length 270 mm Anchorage length 170 mmH
oriz
onta
l rea
ctio
n fo
rce
(kN
)
Middle joint displacement (mm)
(b) Horizonal force-vertical displacement
Fig. 13. Numerical results for different anchorage length
43 De-Cheng Feng, December 7, 2017