Embed Size (px)
Citation preview

Edinburgh Research Explorer
Ice-sheet collapse and sea-level rise at the Bølling warming14,600 years ago
Citation for published version:Deschamps, P, Durand, N, Bard, E, Hamelin, B, Camoin, G, Thomas, AL, Henderson, GM, Okuno, J &Yokoyama, Y 2012, 'Ice-sheet collapse and sea-level rise at the Bølling warming 14,600 years ago' Nature,vol 483, no. 7391, pp. 559-564. DOI: 10.1038/nature10902
Digital Object Identifier (DOI):10.1038/nature10902
Link:Link to publication record in Edinburgh Research Explorer
Document Version:Peer reviewed version
Published In:Nature
Publisher Rights Statement:The final version of this work was published in Nature of the Nature Publishing Group (2012)
General rightsCopyright for the publications made accessible via the Edinburgh Research Explorer is retained by the author(s)and / or other copyright owners and it is a condition of accessing these publications that users recognise andabide by the legal requirements associated with these rights.
Take down policyThe University of Edinburgh has made every reasonable effort to ensure that Edinburgh Research Explorercontent complies with UK legislation. If you believe that the public display of this file breaches copyright pleasecontact [email protected] providing details, and we will remove access to the work immediately andinvestigate your claim.
Download date: 22. Jun. 2018

Ice-sheet collapse and sea-level rise at the Bølling warming 14,600 years ago Pierre Deschamps*, Nicolas Durand, Edouard Bard, Bruno Hamelin, Gilbert Camoin, Alexander L. Thomas, Gideon M. Henderson, Jun'ichi Okuno and Yusuke Yokoyama *Corresponding Author.
This is the author’s final draft as submitted for publication. The final version was published in Nature by the Nature Publishing Group (2012) Cite As: Deschamps, P, Durand, N, Bard, E, Hamelin, B, Camoin, G, Thomas, AL, Henderson, GM, Okuno, J & Yokoyama, Y 2012, 'Ice-sheet collapse and sea-level rise at the Bølling warming 14,600 years ago' Nature, vol 483, no. 7391, pp. 559-564. DOI: 10.1038/nature10902 Made available online through Edinburgh Research Explorer

Supplementary Information The Tahiti records Unlike islands located near active margins, such as Barbados or Vanuatu, Tahiti (Society Islands, French Polynesia) is a hot-spot volcanic island characterized by a slow and regular subsidence rate. Located at a considerable distance from large ice sheets, the coral reefs of Tahiti are far from major isostatic rebound effects, so that eustatic change dominates the local relative sea level (RSL) during deglaciation (Milne and Mitrovica, 2008). For this reason, the island of Tahiti provides an ideal far-field setting to constrain the Melt-Water Pulse (MWP) events that are thought to have punctuated the last deglaciation.
The first reconstruction of sea-level rise from Tahiti for the last deglaciation was established on the basis of two vertical holes (P6 and P7) drilled onshore through the modern barrier-reef in front of Papeete harbour (Bard et al., 1996a). Recently, this first record was augmented by three additional deviated holes (P8, P9, P10) at the same site (Bard et al., 2010). In these onshore holes, the oldest age obtained for the last deglacial reef sequence (i.e. above the contact with Pleistocene reef carbonates) was 13.924 ± 0.064 ka BP (thousands of years Before Present, where Present refers to AD 1950) at 84.2 meters below sea level (mbsl) (Bard et al., 2010). The absence of older material in these onshore holes is expected based on simple numerical model that simulates reef development in response to sea-level fluctuation. Such modelling demonstrates that the recovery of older deglacial corals, including those forming during the period spanning the Last-Glacial Maximum (LGM) and MWPs requires offshore drilling into the fossil reef structure seaward of the present-day barrier reef (see Bard et al., 1996a, or below). The IODP Expedition 310 "Tahiti Sea Level" The Integrated Ocean Drilling Program (IODP) Expedition 310 “Tahiti Sea Level” was carried out in October and November 2005. Logistical difficulties of working in shallow water required the utilization of a Mission Specific Platform, the DP Hunter vessel, equipped with a high specification dynamic positioning system allowing safe operation close to the coral reef. The offshore drilling operations recovered more than 400 m of post-glacial reef material (Camoin et al., 2007b) in three distinct areas around Tahiti (Fig. S1). Maraa and Faaa areas display a regular and gentle fore-reef slope from the outer edge to the modern barrier reef, while the Tiarei area exhibits two successive ridges on a depressed surface seaward of the living barrier reef. These ridges are invaluable features for sea-level reconstruction, because they allow us to document precisely the time window for MWP-1A (see main text for explanation).
In each of the three areas drilled during IODP 310, several boreholes were cored along transects at varying water depths (ranging from 41.6 to 117.5 m for the whole

expedition) in an attempt to retrieve the entire postglacial reef sequence (Camoin et al., 2007b). A total of 37 boreholes were drilled at 22 different sites, with penetration to a maximum depth of 161.8 mbsl. Standard core recovery was calculated at ~57%, but high-resolution downhole imagery and wire line logs indicate the presence of significant primary pore space such that the true recovery was actually much higher, and >90% (Inwood et al., 2008).
Figure S1: Location map of the three areas (Maraa, Faaa and Tiareri) investigated
during Expedition 310 operations (from Camoin et al., 2007b). For each area, the different sites cored are listed.
The reef framework that forms the bulk of the last deglacial carbonate sequence is characterized by the widespread development of microbialites, which locally represent the major structural and volumetric component of reef rock. Infilling of primary cavities by encrusting microbialites strengthens the coralgal frameworks, which contributed to the excellent core recovery achieved during Expedition 310. The excellent preservation of the original framework also offers reliable evidence as to which samples are in growth position when sampling for sea-level reconstruction.

In several cases, we also dated coral samples that belong to the unconsolidated horizon occurring at the base of the deglacial sequence. Although there is, in at least some cases, no clear evidence for in situ position, these samples can nevertheless be of significant interest because they constitute the first datable material of the post-glacial reef sequence in each drill hole and, therefore, may provide insights into the timing of reef initiation on the submerged surface of older Pleistocene reef carbonates.
Although we dated various types of corals (see Table S1), U-Th dating were mainly focused on massive Porites (mp), robust branching Pocillopora (rbp) and branching Pocillopora (bpo). These genera are abundant in offshore holes and, in most cases, are free of encrusting microbiallites; they could therefore be easily cleaned prior to dissolution and represented the most suitable material for U-Th dating. We also determined the ecological assemblages to which the coral samples belong (Table S1) on the basis of the six distinctive coralgal assemblages previously identified in the IODP holes (Abbey et al., 2011; Camoin et al., 2007a; Camoin et al.):
1. the robust branching Pocillopora/massive Montipora (PM) assemblage, indicative of the shallowest water depth of 0 to 10 m;
2. the massive Porites (mP) assemblage that thrives at depths ranging from 0 to 20 m, and is occasionally seen at depths up to 25 m;
3. the tabular Acropora (tA) assemblage that thrives at depths ranging from 5 to 15 m;
4. the branching Porites/Pocillopora (PP) assemblage that also thrives at depths ranging from 5 to 15 m;
5. the branching Porites/encrusting Porites and Montipora (PPM) assemblage that characterizes somewhat deeper environments (5 - 25 m);
6. the encrusting Agaricid and Faviid (AFM) assemblage that typifies environments deeper than 20 m.
Occurrence of vermetid gastropods that are indicative of shallow environments (< 5-6 m, Cabioch et al., 1999b) was also noted in some samples as a robust water-depth indicator.
Noteworthy is the scarcity, in offshore holes, of the robust branching Acropora gr. robusta-danai species. This species typifies the "APH" assemblages (Acropora robusta/danai and Pocillopora cf. verrucosa, and thick crusts of Hydrolithon onkodes, see Montaggioni and Bard, 1998; Montaggioni et al., 1997) that prevails in onshore drill holes, especially after 12 ka BP (Bard et al., 1996a; Cabioch et al., 1999a; Montaggioni et al., 1997). In IODP holes, robust branching Acropora are very rare in the Faaa and Maraa reef sequences prior to ~13.9 ka BP, and are totally absent in the Tiarei sequence. The striking appearance of Acropora gr. robusta-danai as a dominant species in the Tahiti reef, coeval with the end of MWP-1A, may be related to a significant change in environmental conditions concurrent with the MWP-1A event. The ecological implications of this finding will be discussed elsewhere (Camoin et al., Submitted)

230Th-U dating of coral: analytical procedures and results U-Th analyses are reported in Table S1. Activity ratios and ages are calculated using the decay constants determined by Cheng et al. (2000). All reported errors are given at the 2σ level. Labels (#1, #2, etc) indicate replicate analyses obtained on different pieces of the same coral sample. U-Th ages are calculated using the Isoplot software (Ludwig, 2003). No correction for detrital 230Th were processed because 232Th concentrations are in most cases low (≤ 0.5 ppb). Ages are presented in years before 1950 AD. XRD detection of secondary calcite in corals For each coral sample, we checked the presence of diagenetic calcite by powder XRD analysis. We used a calibration method optimized for the detection and quantification of very low amount of secondary calcite. The procedure, described in detail in Sepulcre et al. (2009), relies on a thorough calibration of the instrument by means of gravimetric pure standard mixtures and was assessed using two different XRD instruments. It is worth mentioning that this procedure involves measuring XRD peak areas rather than peak heights alone. Reproducibility tests convincingly demonstrate that this is the optimal method for precise quantification of calcite when it constitutes a small fraction of the total mass. To take into account possible natural heterogeneity in the coral samples, XRD determinations were carried out on three distinct slides for each sample. Detection limit for calcite achieved by this method is about 0.2% (Sepulcre et al., 2009). Quantification limit is about 0.9% (Currie, 1999). This last theoretical quantification limit does not reflect the true overall analytical performance; standard measurements demonstrate that quantification is possible at 0.3% calcite. Only samples that contain <1% calcite were considered for U-Th dating in this paper. This criterion follows that used in previous work (Hughen et al., 2004; Reimer et al., 2006). U-Th analyses Most U-Th analyses were performed using a VG-54 thermo-ionisation mass spectrometer equipped with a 30 cm electrostatic analyzer and a pulse-counting Daly detector at the CEREGE. We prepared a mixed 233U-236U-229Th spike that was calibrated against the Harwell HU-1 uraninite standard (using an aliquot of the solution originating from GEOTOP). For the calibration of the 229Th/233U ratio, we adopted the 230Th/238U mean atomic ratio for HU-1 determined by Cheng et al. (2000) for this solution (19.995×10⁻⁶), which deviates by 3‰ from the secular equilibrium value (19.939×10⁻⁶). The 236U/233U spike ratio (~1) was calibrated against the 238U/235U ratio of the HU-1 solution, assuming a value of 137.88, following the procedure described in Deschamps et al. (2003). Recent measurements have demonstrated that this ratio is not completely homogenous in nature (e.g. Stirling et al., 2007; Weyer et al., 2008), and have indicated a value in HU-1 of 137.769 ± 0.011/0.024 (Condon et al., 2010). Here, however, we maintain the use of the previously assumed value of 137.88 to ensure that calculated ages can be directly compared to previous data from Tahiti. The <1‰ difference in assumed and measured 238U/235U values in HU-1 leads to an insignificant change in final ages. Stirling et al. (2007) have also evaluated the impact of variations in 238U/235U on

the accuracy of U-series ages. They calculated the bias in U-series isotopic compositions and age resulting from a departure of the 235U/238U ratio away from 137.88 for different analytical configurations (e.g. 233U-229Th or 236U-229Th spikes). Although they did not explicitly explore the present case where the mass discrimination is internally monitored by a 236U/233U spike, they showed that only minor offsets in age (few years) and (234U/238U)0 will be induced for young samples (< 30 ka), especially when the HU-1 standard solution is used to calibrate the spike tracer. It is also noteworthy that, according to Stirling and co-authors, the 238U/235U isotopic compositions of seawater and marine carbonates are identical within analytical uncertainties to that of the HU-1 standard. Thus, our analytical approach likely cancels out any systematic offset due to a departure from the accepted 238U/235U value for marine samples.
The U-concentration of our mixed spike was calibrated against the NIST-SRM4321B standard solution, with a certified U-content and an overall 2σ uncertainty of about 6‰ (i.e. larger than the individual statistical errors on TIMS U-content analyses). Our spike calibration was assessed by comparison with a mixed gravimetric 238U/232Th standard and yielded results consistent with those obtained with a previous 233U-229Th spike used at CEREGE.
For uranium analyses, masses 233, 234, 235 and 236 are measured in peak jumping mode. The 236U/233U ratio is used to monitor internally the instrumental mass bias effects. This strategy avoids monitoring the large 238U ion beam, and avoids many of the problems related to gain calibration of the Daly/Faraday detectors (Deschamps et al., 2003; Stirling et al., 2007). For thorium analyses, techniques are similar to those reported previously (Bard et al., 1990).
The long-term reproducibility of U-isotope analyses achieved during the course of this study was assessed by replicate measurements on the NBS-960 international standard and yielded a mean value of (234U/238U) = 0.9635 ± 0.0008 (2σ, n=23) in excellent agreement with our previous determinations of the same standard: (234U/238U) = 0.9634 ± 0.0037 (2σ, n=6; Bard et al., 1996) and (234U/238U) = 0.9624 ± 0.0019 (2σ, n=23, Delanghe et al., 2002) and with values reported in the literature (see determinations and compilation by Andersen et al., 2004; Deschamps et al., 2003). The 2σ precision of U-Th ages ranges in most cases from 1.5 to 4‰ (± 20 to 50 years in ages). Internal reproducibility was also checked by replicate measurements of several samples that all show agreement within errors (Table S1).
Calculated initial (234U/238U)0 values of post-glacial samples analysed in this study yield a mean value of 1.1458 ± 0.0020 (2σ). This value is consistent with recent determinations of modern sea-water and corals (Cutler et al., 2004; Delanghe et al., 2002; Robinson et al., 2004). For coeval corals, (234U/238U)0 values agree within analytical reproducibility. This clustering of (234U/238U)0 values (Table S1) substantially narrows the uncertainties in marine (234U/238U)0 value compared to previous datasets (e.g. Vanuatu, Papua New Guinea and Barbados) that encompass this period (Cabioch et al., 2003; Cutler et al., 2004; Fairbanks et al., 2005) and is significantly narrower than

the ± 4.8‰ range adopted by the IntCal Working Group et al. (Hughen et al., 2004; Reimer et al., 2009) for the interval 0-17 ka.
Some samples were also analysed at Oxford using a MC-ICP-MS (see detailed analytical procedure in Thomas et al., 2009, and Mason and Henderson, 2010). In order to assess the external reproducibility, duplicate measurements were also performed by the Oxford team and CEREGE team, which also showed very good agreement (see Table S1). Subsidence rate of Tahiti The Tahiti Island is part of the Society archipelago formed as the Pacific plate drifted over a fixed hot spot. It is thus characterized by a slow and regular subsidence. A long-term (1 Ma) subsidence rate has been estimated at about 0.25 mm/yr (Le Roy, 1994) while a value of 0.15 mm/yr has been reported for the Holocene (Pirazzoli and MontaggionI, 1988). This value is compatible with the lower estimate of 0.2 mm/yr based on the recovery of an aerial basalt lava flow, dated at 549 ± 11 ka (2σ) by K-Ar, at ~114 m depth below the carbonate sequence in the P7 onshore hole (Bard et al., 1996a). Data obtained on pre- LGM Tahiti corals (Thomas et al., 2009) are consistent with this first estimate of 0.25 mm/yr. Especially, two corals collected at 147 mbsl with U-Th ages of 153 ka (MIS 6) indicate an upper limit of 0.4 mm/yr for the subsidence of the island, assuming a MIS 6 sea-level lowstand of < 90 m. Modern subsidence was recently assessed by Fadil et al. (2011) with direct measurements by GPS and other geodetic instruments. These authors calculated their average rate based on four Tahiti GPS stations (0.25 ± 0.5, 0.3 ± 0.6, 0.6 ± 1.6, 0.8 ± 0.8 mm/yr). Taking into account the uncertainty for each value leads to a weighted average of 0.38 ± 0.34 mm/yr. In their Table 3, Fadil et al. (2011) also listed three other modern subsidence values based on geodetic approaches (0.04 ± 0.2, 0.27 ± 1.1, 0.2 ± 0.3 mm/yr). A weighted average of 0.15 ± 0.15 mm/yr can be derived by using all seven values. Consequently, the observations over different periods show that the overall subsidence is small and that there is good agreement between very different methods of assessment. Assuming that the true value lies within the range 0-0.4 mm/yr, the systematic shift in corrected bathymetry would not exceed 2-3 meters over the last 16 ka. Uncertainty on the assessment of the MWP-1A amplitude, arising from island subsidence during the 350 years of MWP-1A, is entirely negligible and well below the uncertainties linked to depth distribution of coral assemblages. The extended Tahiti record and the Timing and Amplitude of MWP-1A event The deglacial Tahiti record is now based by more than 200 U-Th age data. For samples collected during the IODP expedition, in almost each hole, all ages are in stratigraphic order (see Fig. S2) substantiating the reproducibility of the analytical method and the overall excellent preservation of the corals collected during offshore coring.

Figure S2: Sea-level history reconstructed from onshore and offshore holes drilled in
the Tahiti coral reef (Bard et al., 1996a; Bard et al., 2010). Onshore holes are represented by grey symbols whereas holes drilled during the IODP Expedition 310 "Tahiti Sea Level" and reported here for the first time are represented by coloured symbols. Lines are drawn between points from the same hole to show that samples are in correct stratigraphic order. Samples that are not in situ are highlighted with arrows. Ex-situ samples from holes M0023A&B could indicate that MWP-1A ended before 14.31 ka BP.
The general MWP-1A features rely on critical samples that belong to coral sequences in holes M0023A, M0023B, M0024A and M0015A. These sequences are central to assessment of the MWP-1A event and are described in detail in Figure S3.


Figure S3: Lithological description, adapted from Camoin et al. (2007b), of key coral sequences that portray the MWP-1A event. Ages are U-Th dating in ka before 1950 (Table S1). Fig S3-a: Line scans of core sections 9-1 – 10-1 from Hole M0024A (Tiarei). Fig S3-b: Line scans of core sections 35-1 – 37-1 from Hole M0015A (Maraa). Fig S3-c: Line scans of core sections 12-1 – 14-1 from Hole M0023A (Tiarei). Fig S3-d: Line scans of core sections 12-1 – 16-1 from Hole M0023B (Tiarei).
Sea level during the early part of the deglaciation The oldest sample (9B-15R-1W 13-20) retrieved in the deglacial sequence during the IODP Expedition is dated at 16.09 ± 0.04 ka BP (see Fig. S4). This robust branching Pocillopora was collected at a subsidence-corrected depth of 117 mbsl, at the interface with the underlying Pleistocene unit. The sample is in growth position and belongs to the shallow-water coralgal assemblage Pocillopora/massive Montipora (hereafter “PM assemblage”) that typifies the shallowest depositional environment at depths less than 10 m at Tahiti. This sample constrains the RSL to the 117 - 107 m range during the first part of the deglaciation. Although it is a reworked clast, the robust branching Pocillopora (24A-15R-1W 16-20) collected at a corrected depth of 115 mbsl and dated at 15.74 ± 0.03 ka strengthens this first estimate. Further constraints are provided by an encrusting Montipora (25B-11R-1W 70-74) collected at a subsidence-corrected depth of 114 mbsl. This sample, dated at 15.31 ± 0.02 ka BP, is associated with vermetid gastropods whose bathymetric habitat is restricted to less than ~5 m depth (Cabioch et al., 1999a; Cabioch et al., 1999b; Laborel, 1986). This constrains RSL to 114 - 109 mbsl at 15.31 ka (Fig. S4). Assuming that the sea level did not drop during that period, we may infer that sea level was between 117 and 109 mbsl during the early part of the deglaciation (~16 ka) at Tahiti. Pre-MWP-1A sea level The pre-MWP-1A sea level is constrained by three samples collected at a subsidence-corrected depth of 105 mbsl (see Fig. S4): two robust branching Pocillopora (samples 24A-10R-1W 65-75 and 24A-10R-1W 98-116, see Fig. S3-a) and one massive Montipora (15A-37R-1W 19-28). The latter sample is in growth position and grew immediately on pre-glacial substratum (Fig. S3-b). The two Robust Branching Pocillopora belong to the shallow-water coralalgal assemblage PM (< 10 m). These samples are also associated with vermetid gastropods that are indicative of a very shallow environment (< ~5 m, Cabioch et al., 1999a; Cabioch et al., 1999b). Based on these shallow-water coral samples, we consider that we can realistically constrain sea level to 105 - 100 mbsl between 14.65 - 14.60 ka.
We propose that this range should be restricted further to 104 - 100 mbsl, by considering that these coral colonies grew most likely at least 1 meter below the mean sea level. This is substantiated by the position of the two samples found at shallowest depths in holes M0024A and M0011A prior to MWP1A: a robust/columnar Porites
(24A-10R-2W 69-72) and a massive Porites (11A-6R-1W 24-35) that were both living at a depth of 106.5 mbsl and dated at 14.75 ± 0.03 ka and 14.93 ± 0.06 ka, respectively (Fig. S4). The assumption of a nonzero sea-level rise (on the order of at least 10 millimetres per year, a rate that seems realistic for this time window since the mean rate estimated for the early part of the last deglaciation is 11.1 ± 2.4 mm/yr - see Section "Rate of sea-level rise") implies that the sea level reached at least 104 mbsl at 14.65 ka (2.5 m rise in 250 years).
In addition to the shallowest coralgal assemblages discussed above, we also dated a number of deeper-living coral samples, that were living up to 118 mbsl (subsidence corrected) during the same time window, clearly deeper than the estimated sea level (see Fig. S4). In general, this depth range is consistent with the modern depth distribution of those species (Fig. S4). However, a noticeable exception is the Robust Branching Acropora sample 20A-24R-2W 38-42 (Faaa site) dated at 14.66 ± 0.06 ka. This sample is accompanied by Robust Branching Pocillopora and Encrusting Montipora (Camoin et al., 2007b), an assemblage that generally typifies a shallow environment. By analogy with its modern counterpart, the depth interval of this assemblage is generally less than 10 m (Cabioch et al., 1999b) and it seems statistically unlikely that this coral assemblage could have thrived at depths reaching 20 m. In this case, the sample was at least at 14 m below sea level at that time (i.e. the difference between its depth of 118 m and other species found at 104 m; see Fig. S4).
We hypothesize that this can be considered as an indication that sea level was probably in the lower half of the conservative range deduced above, which would suggest a pre-MWP-1A sea level of ≈ 104 - 102 m in the 14.65 - 14.60 ka time window.
Timing of MWP-1A inception The three samples 24A-10R-1W 65-75, 24A-10R-1W 98-116 and 15A-37R-1W 19-28, dated at 14.58 ± 0.05 ka, 14.61 ± 0.03 ka and 14.65 ± 0.02 ka respectively, mark the beginning of MWP-1A. As discussed in the main text, bracketing more precisely MWP 1A inception (i.e. at a decadal scale) requires taking the reef response to

acceleration in sea-level rise into account (i.e. the time interval during which a particular coralgal assemblage remains within its depth tolerance; note that this is completely different to the time lag required to colonize the Pleistocene surface after its flooding). This is illustrated in Fig. S4b which shows that the two robust branching Pocillopora samples dated at 14.58 and 14.61 ka may have accommodated the first part of the sea-level rise related to MWP-1A. Assuming a local rate of sea-level rise on the order of 50 mm/yr during MWP-1A and considering that these two coral colonies may have grown 5 meters beneath the sea surface, the inception of MWP-1A may have started 100 years earlier. Considering our preferred range of 104 - 102 mbsl, this pushes the MWP 1A inception earlier by ca. 50 years. For these reasons, we consider that the earliest possible age for MWP-1A inception is 14.65 ka. A similar logic was used by Liu and Milliman (2004) in their revisitation of the Barbados MWP-1A chronology.


Figure S4: (a) Coral core depths vs U-Th ages of Tahiti samples for the 16.2 – 13.7 ka time window. Grey symbols correspond to coral samples collected in onshore holes (Bard et al. 2010), whereas coloured symbols correspond to in situ samples collected in offshore holes drilled during the IODP Expedition 310 reported here for the first time. Depths are expressed in meters below present sea level and are corrected for a constant subsidence rate of 0.25 mm/yr. Error bars reported for U-Th ages are 2σ. The vertical bars reported for each coral sample correspond to their optimal bathymetric habitat range inferred from the coralgal assemblage identification: 0–10 m for PM assemblage, 0–20 m for mP, 5-15 m for tA and PP assemblages, 5-25 m for PPM assemblages. For the AFM assemblage (> 20 m), no vertical bar is displayed. Orange bars indicate samples associated to vermetid gastropods that are indicative of shallow environment (0–5 m). The blue line delineates the sea-level curve obtained by considering the tie points previously determined by Bard et al. (Bard et al., 2010) for the 0 -14 ka period and those discussed in the text after that period. In this scenario, MWP-1A event lasted 350 ka and had a 16 m amplitude. The shaded grey band illustrates our estimate of the most likely range of the Tahiti RSL over the last deglaciation. It is constrained by considering the lower (blue line) and upper bounds of sea-level changes constrained by taking the ecological ranges of multiple coralgal assemblages. For the tie points previously defined by Bard et al. (2010), a reasonable leeway of 2 m was considered. For the MWP-1A time window, this estimate takes into consideration that the MWP-1A event might start later than 14.65 ka and end earlier than 14.31 ka. (b) Blow-up of the MWP-1A time window (15 – 13.9 ka). The two yellow areas represent the most realistic range that we infer for the MWP-1A onset and termination in terms of timing and sea level (see text). The purple line represents an extreme, but possible scenario involving a very abrupt MWP-1A event that started at 14.5 ka and finished at 14.4 ka with an amplitude of 18 meters. The black broken line represents a plausible scenario involving a rate of sea-level rise of 50 mm/yr during MWP-1A and considering that the sea level attained 104 mbsl (the upper bound of our preferred range) at the time that the two Pocillopora samples dated at 14.58 ka and 14.61 ka grew. This scenario shows that the MWP-1A inception may have started at 14.65 ka. Another scenario (dashed black line) still assumes a 50 mm/yr rate of sea-level rise but considers that the two branching Pocillopora lived ca. 5 meters beneath sea surface. In this case, the MWP-1A inception may have started 100 years earlier.
Reef response to MWP-1A The change in reef development strategy that follows the MWP-1A is well documented in hole M0024A where shallow-water assemblages dominated by robust branching

Pocillopora, massive Porites and encrusting Montipora were substituted for branching Porites species after 14.58 ka (see Fig. S3-a). These branching Porites belong to the branching Porites/Pocillopora (PP) assemblage which is typical of an environment of moderate energy and light intensity, ranging from 5 to 15m depth.
Investigations of Site M0009 (Tiarei) samples provide further evidence of such an ecological response to MWP-1A. At this site, we observe a rapid increase in the vertical accretion rate of the reef accompanied by a change in coralgal assemblages (see Fig. S5), from the shallowest assemblage (PM) to the deepest assemblages (AFM, PPM). This occurred at 14.5 ka. Although this cannot be regarded as a definite demonstration, we argue that this increase in the vertical accretion rate probably occurred in response to the sea-level rise related to MWP-1A.
Figure S5: Increase in vertical reef accretion rate of the reef at Site M0009 (Tiarei) in
response to the acceleration in sea-level rise related to MWP-1A. The reef response is accompanied by a change in coralgal assemblages (PM: robust branching Pocillopora/massive Montipora; tA: tabular Acropora; mP: massive Porites; PP: branching Porites/Pocillopora; PPM: branching Porites/encrusting Porites and Montipora; AFM: encrusting agaricids and faviids).

MWP-1A termination and post-MWP-1A sea level The end of MWP-1A is evidenced by a discontinuity within the sedimentary record and is captured by shallow coral samples recovered at the interface of the underlying Pleistocene in holes drilled at an intermediate position on the fore-reef slopes of Tiarei sites. The coral samples that marked the MWP-1A termination were recovered in holes M0023A (Fig. S3-c) and M0023B (Fig. S3-d). In these holes, the first datable corals to colonize the pre-glacial substratum after the sea-level jump are two branching Pocillopora. These two samples are in growth position and are dated at 14.28 ± 0.02 ka (23B-12R-2W 113-127) and 14.31 ± 0.04 ka (23A-13R-2W 32-37). These samples provide a robust constraint on the end of the MWP-1A event at ~14.31 ka. This can be considered a lower bound for the MWP-1A chronozone if we take into account the time lag in reef initiation (i.e. the time required by corals to colonize the Pleistocene surface that followed substrate flooding). Two reworked coral fragments recovered at the interface of the underlying Pleistocene unit in cores 23A-14R and 23B-15R are dated at 14.59 ± 0.03 ka and 14.28 ± 0.03 ka respectively (see Fig. S3-c, S3-d and Fig. S2). Although these samples should be interpreted with caution because they were not in-situ, they might indicate that the end of MWP-1A was older than 14.3 ka (Fig. S2).
The two in situ branching Pocillopora samples were recovered at a subsidence-corrected depth of 88 m. They belong to a coralgal assemblage that is indicative of shallow-water conditions (< 15 m) and are also associated with vermetid gastropods. This constrains the paleodepth range to ≤ 5 m (Cabioch et al., 1999b) and provides a first conservative estimate (i.e. 88 – 83 mbsl) of the sea level at 14.31 ka at Tahiti. These first constraints seem robust because a sea level above 83 mbsl at 14.31 ka would imply sea-level rise close to zero for the next 300 years, (onshore data - P7 and P8 holes - indicate a sea level near ~ 80 mbsl at 14 ka; (see Fig. S5 and Bard et al., 1996a; Bard et al., 2010). Note also that we cannot rule out that these corals grew just below the surface of the water, 88 m is thus a plausible lower bound for the post-MWP-1A sea level.
As discussed above for the pre-MWP-1A sea level, we must also take into consideration
the coral colonies that thrived between 112 – 103 mbsl during the 14.4 - 14.2 ka time window (see Fig. S4b). During the 14.3 – 14.2 ka interval (i.e., after MWP-1A termination), most of the corals that we dated are massive Porites (18A-18R-1W 40-50, 109 m depth; 18A-19R-1W 107-110, 112 m depth; 9C-11R-2W 0-4, 108 m depth; 9D-7R-1W 11-28, 108 m depth; 9D-7R-1W 28-45, 108 m depth). Abbey et al. (2011) have identified these Massive Porites as P. lobata (holes M0018A and M0009D) and P. solida (hole M0009D), which are abundant up to 20 m water depth and may be observed up to 25 m deep in modern reef systems from French Polynesia (Bouchon, 1985; Bouchon, 1996; Cabioch et al., 1999b; Camoin et al., Submitted; Chevalier and Kuhlman, 1983; Faure and Laboute, 1984; Kuhlman and Chevalier, 1986; Sugihara et al., 2006). Several branching Pocillopora or Porites (9D-7R-2W 64-71; 9E-9R-1W 32-36; 21A-17R-1W 13-19; 21B-16R-1W 39-44) are also observed between 109 and
104 mbsl during the 14.4 - 14.3 ka time span, i.e. just before or during the MWP-1A termination. These corals belong to the PP coralgal assemblage that generally developed at depths ranging from 5 to 15 m (Camoin et al.).
It is remarkable that most of these samples are either in the deepest part of their usually accepted habitat depth range, or even deeper than this range by several meters (Fig. S4). Therefore, we consider again that this gives us a clue that sea level was most likely close to the lower-end limit of the 88 - 83 m conservative range derived from the shallowest coral specimens. Assuming again that sea level was probably within the lower half of this range, this would therefore lead to a reduced estimate of c.a. 88 - 86 m after the MWP-1A termination.
MWP-1A amplitude Considering the most conservative estimates discussed above for the pre- and post-MWP-1A sea-level positions (i.e. 105 - 100 mbsl and 88 - 83 mbsl), we derive a MWP-1A amplitude ranging from 12 to 22 meters. Based on arguments above, however, we consider it more likely that the true amplitude was between 14 and 18 meters (104 - 102 mbsl and 88 - 86 mbsl). In either case, the middle of the amplitude range is 16 or 17 meters.
We are fully aware of the uncertainties related to the sea-level determinations using habitat zone of different coral species, which often have only a limited statistical significance. Accordingly, we also consider an alternative approach to constrain the MWP-1a amplitude at Tahiti, which follows Bard et al. (2010) who determined average rates of sea-level rise around the Younger Dryas period. We calculate mean local rate of sea-level rise throughout the pre- and post-MWP-1A periods by means of linear regression fitted through the uppermost samples for the periods before and after the jump (see Fig. S6). For the post-MWP-1A period (i.e. 14.31 ka to 12.85 ka), we include the two branching Pocillopora samples (23B-12R-2W 113-127; 23A-13R-2W 32-37) from site M0023 that mark the end of MWP-1A, together with all onshore samples, with the exception of those of the lower part of the P8 hole (as discussed in Bard et al., 2010). We calculate a mean rate of 13.8 ± 1.1 mm/yr (2 standard errors). For the pre-MWP-1A period, we take into consideration all the uppermost samples in the holes from the 16.2 to 14.6 ka time window (see Fig. S6). For this period, we obtain a mean rate of 11.1 ± 2.4 mm/yr. The MWP-1A amplitude at Tahiti can be assessed by considering the gap between the two linear fits. Using this approach, we deduce a MWP-1A amplitude of 17 meters with a 2 σ uncertainty of 2.2 meters (estimated by considering the error envelope on linear fits -see Fig S6). This value agrees closely with the estimate inferred from the depth distribution of coralgal assemblages.
It could be questioned whether the difference in elevations between the stratigraphic units containing the dated corals should be considered to determine MWP-1A amplitude instead of the elevation of the relevant corals. The difference between the depth of the coral samples that we dated and the stratigraphic boundaries (limit of the biological “assemblages”) is less than a meter (see Fig. S3) and therefore

within the inherent uncertainty of the coral-based approach. This option will therefore also lead to an estimate of MWP-1A amplitude of ~16 meters.
Figure S6: MWP-1A amplitude estimate inferred from the gap between linear fits
throughout the pre- and post-MWP-1A periods. Regression lines (in blue) and their error envelopes (in red and orange) were calculated using Isoplot 3.00 software (Ludwig, 2003). Samples used for regression calculation are highlighted in red. Uncertainties in pre- and post-jump depths are shown by green horizontal bars and are calculated by considering the error envelopes at 14.65 ka and 14.31 ka. The two extreme bounds (i.e. 12 and 22 meters) of MWP-1A amplitude inferred from habitat depth range of shallow coralgal assemblage are also shown. This comparison shows that these two extreme are very unlikely, thus strengthening our preferred range (i.e. 14 to 18 meters) constrained by taking together the ecological requirements of multiple coralgal assemblages and the depositional context.
Rate of sea-level rise during the jump The detailed assessment of the timing and amplitude of MWP-1A sea-level change

leads to an average rate of sea-level rise of 46 ± 6 mm/yr (i.e.16 ± 2 in 350 yr) at Tahiti during the event (see Table S2). Note that this value is only a minimum estimate, since we do not take into consideration any time lag in reef initiation on the submerged surface, nor the uncertainties related to the MWP-1A inception. Assuming an extreme scenario where MWP-1A started at 14.5 ka and terminated at 14.4 ka (see Fig. S4-b), the local rate of the sea-level rise associated to the MWP-1A event could have reached 160 ± 20 mm/yr. Tahiti RSL curve By combining all these observations, we are also able to derive the lower and upper bounds of Tahiti RSL over the last deglaciation (see Table S2 and Figures 2, 3 and S4). For the 14 - 9 ka time window, we consider the tie points and sea-level rates previously determined by Bard et al. (2010). Note that the sea-level position at 19 ka was arbitrary fixed at 119 mbsl (see main text). Table S2: Age and estimated lower and upper bounds of the different tie points that
define the Tahiti RSL curve. Points n°1 to 4 were previously defined by Bard et al. (2010).
Reconciling the Tahiti and the Barbados record The MWP-1A timeframe derived from the extended Tahiti record contradicts the previous timing inferred from the Barbados coral-reef record, which was also established on the basis of U-Th dating (see Fig. 3). In the latter, the MWP-1A was first identified between 14.2 and 13.8 ka, but a thorough re-examination of this record conducted Liu and Milliman (2004) to reappraise this timing and to bracket the MWP-1A between 14.3 to 14.0 ka. Some studies have questioned this conventionally accepted Barbados timing (Kienast et al., 2003; Weaver et al., 2003), but most of the arguments raised against it

have been contradicted by the updated data set provided by Fairbanks et al. (Fairbanks et al., 2005; Peltier and Fairbanks, 2006) that complemented the original record and refined previous ages through the use of improved analytical method. These new data suggest that the MWP-1A occurred even later than initially delineated by the original Barbados curve, i.e. between 14.08 and 13.61 ka. Whatever the data set considered for the Barbados record, it was generally argued that the MWP-1A coincided with the Older Dryas, the cooling event that terminated the Bølling warm period (Bard et al., 1996a; Liu and Milliman, 2004; Stanford et al., 2006). In contrast, the extended Tahiti record presented here indicates that the MWP-1A occurred at least 400 to 500 years earlier, and was therefore synchronous with the Bølling period (Fig. 2).
Figure S7: Reappraisal of the amplitude of MWP-1A at Barbados (Fairbanks et al.,
2005; Peltier and Fairbanks, 2006) considering the new MWP-1A chronozone inferred from the present study. Over the 14.3 - 9 ka period, the dark grey line corresponds to the Barbados sea-level curve as determined by linear fits of sea-level data (here A. palmata). For the 13 - 9 ka time window, the calculations are done by considering specific time intervals related to known climatic boundaries (see Bard et al., 2010, for more details).

It is very unlikely that this discrepancy could be related to any analytical bias as the paired radiocarbon and U-Th analyses that were carried out on the Tahiti corals (Durand et al., ms in prep, Durand et al., 2010) as well as on Barbados corals (Fairbanks et al., 2005) are highly consistent with the Intcal09 calibration curve for the relevant period (Reimer et al., 2009). The only way to reconcile the Barbados and Tahiti data sets is to consider that the onset of MWP-1A in the Barbados would correspond record to A. palmata samples RGF 15-5-3 and RGF 9-13-3 which were dated at about 14.550 ka BP (Peltier and Fairbanks, 2006). In this respect, it can be noticed that the samples from Barbados hole 9, corresponding to the time interval spanning 14.55 to 14.08 BP ka, actually indicate an unusual and significant increase in the rate of sea level rise compared to the other part of the deglaciation (Fig. S7). Weaver et al. (2003) also pointed out that the A. palmata sample RGF 9-8-2 dated at 14.08 ± 0.03 ka BP and generally considered as marking the start of the MWP-1A in the Barbados record is overlain by deeper-water species, Porites asteroides and A. cervicornis, suggesting that this sample may be part of a deepening-upward sequence which would have been already initiated earlier in response to the rapidly rising sea level. Another direct implication of this hypothesis is that A. palmata habitat is not limited to the 3 - 7m depth range (Lighty et al., 1982) as it is generally assumed in the literature, but instead that this species may thrive in deeper reef environments (Weaver et al., 2003), commonly deeper that 10 m and occasionally down to 20 m as supported by direct observations (Goreau and Wells, 1967; Hubbard, 2009). In addition, studies of the A. palmata distribution in modern reefs, may not be completely applicable to the deglaciation, a period during which sea level was rising at an average rate exceeding 10 mm/yr.
This re-evaluation of the MWP 1A timeframe also requires a reassessment of the MWP-1A amplitude at Barbados. Assuming a 350 yr duration of MWP-1A, and extrapolating the general trend line delineated by hole 12 for the period following the jump (see Fig. S7), we can derive a ~15 m amplitude of sea-level rise at Barbados during the MWP 1A time window. Reappraisal of the Sunda Shelf record The Sunda Shelf record obtained by Hanebuth et al. (2000) on mangrove organic material of a shallow siliciclastic platform describes a very sharp sea-level jump between 14.6 and 14.3 ka (see Fig. 3 and Fig. S8). Scepticism has first been expressed on the timeframe of this record as it relies on AMS-14C ages, which are subject to much greater uncertainty than U-Th chronologies and may be significantly hampered by the occurrence of radiocarbon plateaus that prevent any high-resolution chronology (Stanford et al., 2006). This is particularly problematic in the present case because the 14C ages of samples that marked the MWP-1A event in the Sunda record coincide with the 500-year-long 14C plateau overlapping with the Bølling period (Reimer et al., 2009). The samples that marked MWP-1A event closely cluster around a conventional 14C-age of 12.42 ± 0.03 ka BP (1SD, n = 17).

Figure S8: Sea-level record from the Sunda Shelf (Hanebuth et al., 2000). 14C ages are
conventional (uncalibrated) ages in yr BP with statistical errors given at 1σ, which does not include the error in the reservoir age correction.
This mean age for the MWP-1A event is derived by averaging 14C-ages of all samples contained between 80 and 100 mbsl in the Sunda shelf record. In doing this, we hypothesize that the MWP-1A is a sufficiently abrupt and sharp event to be considered as the brief spell marked by the samples contained within this depth interval. Bearing in mind the scatter and uncertainty in the 14C dataset (see Fig. S5), this approach seems suitable. This conventional 14C timeframe makes MWP-1A coeval with the onset of the Bølling that have been dated at 12.46 ± 0.15 14C ka BP in North Atlantic sediments (Bard et al., 1987). Using the IntCal09 calibration curve (Reimer et al., 2009), the mean calendar age of the “Sunda” MWP-1A can be refined to the 1σ interval 14.18 - 14.62 ka BP, or to 14.14 - 14.94 ka BP considering the 2σ interval. Although these uncertainties remain large, this age interval is consistent with the MWP-1A chronozone inferred from the new Tahiti record, but does not display any overlap with that previously based on the Barbados record (Fairbanks et al., 2005; Peltier and Fairbanks, 2006).

Numerical modelling of reef growth in response to a MWP We used a 2D numerical model previously constructed and used by Bard et al. (1996a; 1996b) to simulate the building of the Tahiti coral reef in response to MWP-1A. It includes the simultaneous effects of sea-level fluctuations, local subsidence/uplift and reef growth on the development and the internal structure of a reef system. The model is based on equations described in Bosscher & Schlager (1992), which combines the skeletal growth of reef-building corals (where photosynthetic rate, calcification rate, and skeletal growth rate are proportional) and the Beer-Lambertʼs law that describes the light distribution in the water column. Thus, the coral reef vertical growth rate is a function of water depth. Moreover, the model offers the possibility to display age-depth relationships along virtual drill holes at different locations in the reef structure. This approach is especially useful to compare the model outputs with data derived from real holes or to identify key sites for future drilling operation. For the present study, the model has been updated and now takes into account continental and marine erosion modelled using a diffusion law (Bosence and Waltham, 1990; Nakamura and Nakamori, 2007). This update will be presented in more details elsewhere. Note that similar models have been used to simulate reef growth over longer time scales (Koelling et al., 2009; Webster et al., 2007), but not with the specific purpose to investigate the reef response to MWPs. Here, we operate this model over the last deglaciation by considering a simplified sea-level curve derived from the Tahiti onshore and offshore records (see the curve in Fig. 2). The input sea-level curve is shown on Fig. S9-a&b and Fig. S10-a (thick blue curve). The rates of the sea-level rise for the different time windows of the curve are as follows: 19 - 16.09 ka, 0.7 mm/yr; 16.09 - 14.93 ka, 9.1 mm/yr; 14.93 - 14.65 ka, 8.9 mm/yr; 14.65 - 14.31 ka, 45.9 mm/yr; 14.31 – 14 ka, 20.3 mm/yr; 14 - 12.9 ka, 12.1 mm/yr; 12.9 - 11.6 ka, 8.6 mm/yr; 11.6 – 9 ka, 11.2 mm/yr; 9 – 5 ka, 7.2 mm/yr; 5 to the present, 0 mm/yr. The amplitude of the sea-level jump corresponding to MWP-1A is thus 15.6 m during 340 years. For the sake of clarity, the part of the reef which accreted during the MWP-1A event is coloured in red (see Fig. S9-c and S10-b). The coloured curves within the cross-section represent isochron topographies drawn every 500 years (see the colour bar at the right of Fig. S9-c and Fig. S10-c). The x-axis is the distance seaward, and the y-axis is the depth.

Figure S9. Two-dimensional structure of a modelled reef developed on constant slope
during the last 20,000 years in response to MWP-1A. In the present study, the model was run considering two different initial topographies for the Pleistocene substrate. Fig. S9 displays the outputs of the model with a constant

slope for the Pleistocene basement. For this simulation, the following parameters have been used: subsidence rate = 0.25 mm/yr, growth rate = 13 mm/yr; radiation extension coefficient k = 0.125; light saturation: the fraction of the surface light irradiation needed for maximum reef growth (I0 Ik-1) = 6 (light saturation at about 15% of the surface value); erosion diffusion coefficient Kd = 0.01 m2/yr.
The age-depth relations simulated in different vertical and deviated holes drilled onshore (drill n°1 to n°3) on the present-day reef and offshore (drill n°4, see Fig. S9-c) are shown in Fig. S9-b&c. These simulations clearly illustrate that onshore drill holes are only capable of recovering reef material after MWP-1A. Post MWP-1A reef shows a general keep-up development and substantiates previous results obtained by Bard et al. (Bard et al., 1996a; Bard et al., 2010) on P6 to P10 onshore holes. Moreover, these simulations highlight the fact that the deviated hole (drill n°3) records older and deeper corals than the vertical hole (drill n°2) (see Fig. S9-a). This is in agreement with the results obtained on onshore drill holes, where corals of the lower section of the deviated P8 hole plot slightly lower than those of the vertical P7 hole (Bard et al., 2010). Conversely, offshore drill holes (drill n°4) enabled recovery of corals accreted before MWP-1A, but record a deepening sequence after the MWP-1A event (Fig. S9-b), in agreement with new data presented in this study (e.g. Sites M0024 and M0009; see Fig. 2 and Fig. S2).
Our model was also run considering the real topography of the basement substrate (corresponding to the Pleistocene / post-glacial boundary) as inferred from seismic and multibeam bathymetric data produced during the SISMITA cruise (Camoin et al., 2003). Fig. S10-c displays the overall internal reef structure, along a seaward transect, accreted during the last 20 ka while Fig. S10-b is a blow-up of the model output in the outer part of the reef system (location indicated by the grey area in Fig. S10-c). The sea level curve and the parameters used for this model (Fig. S10-b) are the same than those in Fig. S9 (see Fig. S9-b), except for the growth rate which is 8 mm/yr. As shown in Fig. S10-b, the stratigraphic level corresponding to MWP-1A is very thin. In Fig. S10-a, the age-depth record, simulated by the model, is displayed for 3 virtual vertical holes whose locations are indicated in Fig. S10-c.
For virtual holes drilled in the outer edge of the system (drill n°7), the reef growth model simulates a general upward growth before MWP-1A, followed by a deepening-upward trend after the MWP-1A spell. A further point worth emphasizing is that, as depicted by drill n°6 record, the reef system failed to keep pace with sea-level rise during the entire MWP-1A interval. This is highly consistent with observational data obtained during the course of this study (Site M0005, see Fig. 2 and Fig. S2). Only holes collected in intermediate position on the fore-reef slope (drill n°5) between the outer edge and the modern reef are able to capture the sea-level position immediately following MWP-1A. It is also noteworthy that our present model does not take into account any time lag in reef initiation. However, after MWP-1A, the reef experienced a deepening event which was weaker than that observed on the outer edge of the reef system. This phenomenon is observed in the key IODP Site M0023.

Figure S10: Two-dimensional structure of a modelled reef developed during the last
20 000 years in response to a rapid MWP (same timing and amplitude than in Fig. S2). The basement substrate (corresponding to the Pleistocene / post-glacial boundary) used in this figure is obtained from the

seismic and multibeam bathymetric data produced during the SISMITA cruise (Camoin et al., 2003).
GIA model Model predictions of the glacio-hydro-isostatic adjustment (GIA) were conducted using the parameters described elsewhere (Johnston, 1993; Lambeck et al., 2003; Nakada and Lambeck, 1987; Okuno and Nakada, 2001). The model included both an earth component describing the viscoelastic nature of the solid earth and an ice component documenting the history of ice melting reconstructed mainly from far-field sea-level observations (e.g. Lambeck et al., 2002; Yokoyama et al., 2001; Yokoyama et al., 2000). This model provides an accurate treatment of time-dependent continental shorelines (Lambeck et al., 2003), but does not take into consideration the feedback onto sea level from Earth-rotation changes. We employed the same earth model parameters as used by Bassett et al. (2005) with a lithosphere thickness of 100 km and sublithospheric upper mantle viscosity of 5.1020 Pa.s. For the lower mantle viscosity, we consider the high-viscosity lower mantle value (4.1022 Pa.s) adopted by Bassett et al. (2005). We also generate a suite of GIA predictions by varying the viscosity of the lower mantle from 1022 Pa.s to 1023 Pa.s in order to assess the sensitivity of GIA results to variations in the visco-elastic Earth model.
This ice model was tuned in such a way that the eustatic sea level (ESL) rise during MWP-1A chronozone represents 14 meters of eustatic amplitude (ESL curve shown in Fig. S11-e&b). The term eustatic refers here to the sea-level change associated with the change in ocean volume resulting from the melting or growth of land-based ice sheets (i.e., the total meltwater volume divided by the area of the ocean, taking into consideration its variation through time). This definition corresponds to the one used by Clark et al. (2002) and Milne and Mitrovica (2008) and is equivalent to the "ice-volume equivalent sea-level change" defined by Lambeck et al. (QSR, 2000).
RSL predictions at Tahiti and Barbados derived from this GIA model are illustrated in Fig. S11. We have considered three distinct melting scenarios in which the respective contributions of the Antarctic Ice sheet and the Northern Hemisphere Ice Sheet vary from 20:80 (Fig. S11-e&f), 50:50 (Fig. S11-c&d) to 80:20 (Fig. S11-a&b). The ice model was slightly adjusted to account for the newly obtained timing and magnitude of MWP-1A from Tahitian sea level observations. This ice model allows us to determine the Eustatic Sea-Level (ESL) curve depicted in Fig. S11-e. Note that it is this ESL curve that we use to calculate the ESL rate depicted in Fig. 3.
Only the 80:20 scenario provides a satisfactory fit to the Tahiti record. Both the 20:80 scenario (Fig. S11-e), and the 50:50 scenario (Fig. S11-c), under-evaluate the post-MWP-1A sea level at Tahiti, by more than 10 m. This general tendency is in agreement with previous studies that demonstrated that increasing the Antarctic contribution to MWP-1A reduces the magnitude of the sea-level jump at the Tahiti far-field site relative to that at Barbados (Bassett et al., 2005; Clark et al., 2002; Farrell and Clark, 1976).

In contrast, our GIA predictions tend to predict sea level a few meters deeper than deduced at Barbados over the entire deglaciation period, when the optimal value of the viscosity (4.1022 Pa.s) adopted by Bassett et al. (Bassett et al., 2005) is considered. In this case, only the 20:80 scenario provides an acceptable fit to the Barbados data. However, increasing the value for the lower mantle viscosity to 1023 Pa.s reduces this discrepancy, whatever the South:North melting scenario.
The large discrepancy between observed and predicted post-MWP-1A sea level at Tahiti for the 20:80 scenario allows us to rule out a melting scenario involving a dominant North Hemisphere source for MWP-1A. Owing to the uncertainties in the Earth model parameters and second order misfits observed between predictions and observational constraints from Tahiti and Barbados, it remains difficult at this stage to go further in the quantification of the respective contributions of North and South Hemisphere to MWP-1A. However, these results, together with previous studies (Bassett et al., 2005; Clark et al., 2002) substantiate the hypothesis of a substantial AIS contribution to MWP-1A, that very likely represented half, or more, of equivalent eustatic sea-level rise observed during this event.
Our GIA experiments have been conducted considering an ice model that imposes a eustatic rise of 14 m during the MWP-1A time window. No experiment has been carried out to assess the sensitivity of the GIA outputs to this value. However, the relationship between ESL and RSL is consistent with the Clark et al.' study (2002) that provides a comparison of sea-level fingerprintings arising from MWP-1A at different far-field sites. These authors show that the RSL amplitude of MWP-1A recorded at Tahiti should be amplified with respect to the ESL amplitude whatever its source(s). Indeed, thay calculated that the MWP-1A amplitude observed at Tahiti is amplified by about ~10%, ~20% and ~30% if MWP-1A is sourced from WAIS, the entire AIS or LIS, respectively. Considering our preferred 14-18 m range of RSL amplitude for MWP-1A at Tahiti, we can derive a 10-16 m range for the ESL jump related to the MWP-1A event. Note that this range is estimated by considering all possible MWP-1A source(s) and that it is considerably less than previous estimates.


Figure S11: Numerical RSL predictions at Tahiti and Barbados for varying AIS and NHIS contributions to the MWP-1A event and for distinct values of the lower mantle viscosity (1, 2, 4, and 10x1022 Pa.s). The blue bands for the Tahiti plots correspond to our preferred estimate of Tahiti RSL (see Fig. S4a).

References: Abbey, E., Webster, J.M., Braga, J.C., Sugihara, K., Wallace, C., Iryu, Y., Potts, D.,
Done, T., Camoin, G., Seard, C., 2011. Variation in deglacial coralgal assemblages and their paleoenvironmental significance: IODP Expedition 310, "Tahiti Sea Level". Global and Planetary Change, 76(1-2): 1-15.
Andersen, M.B., Stirling, C.H., Potter, E.-K., Halliday, A.N., 2004. Toward epsilon levels of measurement precision on 234U/238U by using MC-ICPMS. International Journal of Mass Spectrometry, 237(2-3): 107-118.
Bard, E., Arnold, M., Maurice, P., Duprat, J., Moyes, J., Duplessy, J.C., 1987. Retreat Velocity of the North-Atlantic Polar Front During the Last Deglaciation Determined by C-14 Accelerator Mass-Spectrometry. Nature, 328(6133): 791-794.
Bard, E., Hamelin, B., Arnold, M., Montaggioni, L., Cabioch, G., Faure, G., Rougerie, F., 1996a. Deglacial sea-level record from Tahiti corals and the timing of global meltwater discharge. Nature, 382: 241-244.
Bard, E., Hamelin, B., Delanghe-Sabatier, D., 2010. Deglacial Meltwater Pulse 1B and Younger Dryas Sea Levels Revisited with Boreholes at Tahiti. Science, 327(5970): 1235-1237.
Bard, E., Hamelin, B., Fairbanks, R.G., Zindler, A., Mathieu, G., Arnold, M., 1990. U/Th and 14C ages of corals from Barbados and their use for calibrating the 14C time scale beyond 9000 years BP. Nuclear Instrument and Methods in Physics Research, B-52: 461-468.
Bard, E., Jouannic, C., Hamelin, B., Pirazzoli, P., Arnold, M., Faure, G., Sumosusastro, P., Syaefudin, 1996b. Pleistocene sea levels and tectonic uplift based on dating of corals from Sumba Island, Indonesia. Geophysical Research Letters, 23(12): 1473-1476.
Bassett, S.E., Milne, G.A., Mitrovica, J.X., Clark, P.U., 2005. Ice sheet and solid earth influences on far-field sea-level histories. Science, 309(5736): 925-928.
Bosence, D., Waltham, D., 1990. Computer modeling the internal architecture of carbonate platforms. Geology, 18: 26-30.
Bosscher, H., Schlager, W., 1992. Computer simulation of reef growth. Sedimentology, 39: 503-512.
Bouchon, C., 1985. Quantitative study of scleractinian coral communities of Tiahura Reef (Moorea Island, French Polynesia). Proceedings of the 5th International Coral Reef Congress, Tahiti, pp. 279–284.
Bouchon, C., 1996. Recherches sur des Peuplements de Scléractiniaires Indo-pacifiques (Mer Rouge, Océan Indien, Océan Pacifique). Ph.D. Thesis. Université Aix-Marseille I, Marseille, 306 pp.
Cabioch, G., Banks-Cutler, K.A., Beck, W.J., Burr, G.S., Correge, T., Edwards, R.L., Taylor, F.W., 2003. Continuous reef growth during the last 23 cal kyr BP in a tectonically active zone (Vanuatu, SouthWest Pacific). Quaternary Science Reviews, 22(15-17): 1771-1786.

Cabioch, G., Camoin, G.F., Montaggioni, L.F., 1999a. Postglacial growth history of a French Polynesian barrier reef tract, Tahiti, central Pacific. Sedimentology, 46(6): 985-1000.
Cabioch, G., Montaggioni, L.F., Faure, G., Ribaud-Laurenti, A., 1999b. Reef coralgal assemblages as recorders of paleobathymetry and sea level changes in the Indo-Pacific province. Quaternary Science Reviews, 18(14): 1681-1695.
Camoin, G., Cabioch, G., Hamelin, B., Lericolais, G., 2003. Rapport de mission SISMITA, Institut de recherche pour le développement, Papeete, Polynesia Francaise.
Camoin, G., Iryu, Y., McInroy, D., Scientists, E., 2007a. IODP Expedition 310 reconstructs sea-Level, climatic and environmental changes in the South Pacific during the Last Deglaciation. Scientific Drilling, 5: 4-12.
Camoin, G., Iryu, Y., McInroy, D., Scientists', E., 2007b. Expedition 310. Proceedings IODP. Integrated Ocean Drilling Program Management International, College Station, Texas.
Camoin, G., Séard, C., Deschamps, P., Webster, J., Abbey, E., Braga, J.C., Durand, N., Bard, E., Hamelin, B., Yokoyama, Y., Thomas, A.L., Submitted. Reef response to sea-level and environmental changes during the last deglaciation. IODP Expedition 310 “Tahiti Sea Level”.
Cheng, H., Edwards, R.L., Hoff, J., Gallup, C.D., Richards, D.A., Asmerom, Y., 2000. The half-lives of Uranium-234 and Thorium-230. Chemical Geology, 169(1-2): 17-33.
Chevalier, J.P., Kuhlman, D.H.H., 1983. Les scléractiniaires de Moorea. Ile de la Société (Polynésie française). J. Soc. Océan., 34: 55-75.
Clark, P.U., Mitrovica, J.X., Milne, G.A., Tamisiea, M.E., 2002. Sea-level fingerprinting as a direct test for the source of global meltwater pulse IA. Science, 295(5564): 2438-2441.
Condon, D.J., McLean, N., Noble, S.R., Bowring, S.A., 2010. Isotopic composition (U-238/U-235) of some commonly used uranium reference materials. Geochimica et Cosmochimica Acta, 74(24): 7127-7143.
Currie, L.A., 1999. Detection and quantification limits: origins and historical overview. Analytica Chimica Acta, 391(2): 127-134.
Cutler, K.B., Gray, S.C., Burr, G.S., Edwards, R.L., Taylor, F.W., Cabioch, G., Beck, J.W., Cheng, H., Moore, J., 2004. Radiocarbon calibration and comparison to 50 kyr BP with paired C-14 and Th-230 dating of corals from Vanuatu and Papua New Guinea. Radiocarbon, 46(3): 1127-1160.
Delanghe, D., Bard, E., Hamelin, B., 2002. New TIMS constraints on the uranium-238 and uranium-234 in seawaters from the main ocean basins and the Mediterranean Sea. Marine Chemistry, 80(1): 79-93.
Deschamps, P., Doucelance, R., Ghaleb, B., Michelot, J.L., 2003. Further investigations on optimized tail correction and high-precision measurement of Uranium isotopic ratios using Multi-Collector ICP-MS. Chemical Geology, 201(1-2): 141-160.

Durand, N., Deschamps, P., Bard, E., Hamelin, B., Camoin, G., Thomas, A.L., Henderson, G.M., Yokoyama, Y., 2010. New insight into the radiocarbon calibration based on 14C and U-Th dating of corals drilled offshore Tahiti. In: Abstracts, G.R. (Editor), EGU General Assembly, Wien.
Fadil, A., Sichoix, L., Barriot, J.-P., OrtÈga, P., Willis, P., 2011. Evidence for a slow subsidence of the Tahiti Island from GPS, DORIS, and combined satellite altimetry and tide gauge sea level records. Comptes Rendus Geoscience, 343(5): 331-341.
Fairbanks, R.G., Mortlock, R.A., Chiu, T.-C., Cao, L., Kaplan, A., Guilderson, T.P., Fairbanks, T.W., Bloom, A.L., Grootes, P.M., Nadeau, M.-J., 2005. Radiocarbon calibration curve spanning 0 to 50,000 years BP based on paired 230Th/234U/238U and 14C dates on pristine corals. Quaternary Science Reviews, 24(16-17): 1781.
Farrell, W.E., Clark, J.A., 1976. POSTGLACIAL SEA-LEVEL. Geophysical Journal of the Royal Astronomical Society, 46(3): 647-667.
Faure, G., Laboute, P., 1984. Formations récifales: I. Définition des unités récifales et distribution des principaux peuplements de Scléractiniaires. L'atoll de Tikehau : premiers résultats. Océanographie, 22: 108-136.
Goreau, T.F., Wells, J.W., 1967. The shallow water scleractinia of Jamaïca: revised list of species and their vertical distribution range. Bulletin of Marine Science: 442-453.
Hanebuth, T., Stattegger, K., Grootes, P.M., 2000. Rapid flooding of the sunda shelf: a late-glacial sea-level record. Science, 288: 1033-1035.
Hubbard, D.K., 2009. Depth and species-related patterns of Holocene reef accretion in the Caribbean and western Atlantic: a critical assessment of existing models. In: Swart, P., Eberli, G.P., McKenzie, J. (Eds.), Perspectives in Carbonate Geology: A Tribute to the Career of Robert Nathan Ginsburg. Spec. Publ. Int. Assoc. Sedimentol. (41), pp. 1-18.
Hughen, K.A., Baillie, M.G.L., Bard, E., Beck, J.W., Bertrand, C.J.H., Blackwell, P.G., Buck, C.E., Burr, G.S., Cutler, K.B., Damon, P.E., Edwards, R.L., Fairbanks, R.G., Friedrich, M., Guilderson, T.P., Kromer, B., McCormac, G., Manning, S., Ramsey, C.B., Reimer, P.J., Reimer, R.W., Remmele, S., Southon, J.R., Stuiver, M., Talamo, S., Taylor, F.W., van der Plicht, J., Weyhenmeyer, C.E., 2004. Marine04 marine radiocarbon age calibration, 0-26 cal kyr BP. Radiocarbon, 46(3): 1059-1086.
Inwood, J., Brewer, T., Braaksma, H., Pezard, P., 2008. Integration of core, logging and drilling data in modern reefal carbonates to improve core location and recovery estimates (IODP Expedition 310). Journal of the Geological Society, 165: 585-596.
Johnston, P., 1993. The effect of spatially nonuniform water loads on prediction of sea-level change. Geophysical Journal International, 114(3): 615-634.
Kienast, M., Hanebuth, T.J.J., Pelejero, C., Steinke, S., 2003. Synchroneity of meltwater pulse 1a and the Bolling warming: New evidence from the South China Sea. Geology, 31(1): 67-70.

Koelling, M., Webster, J.M., Camoin, G., Iryu, Y., Bard, E., Seard, C., 2009. SEALEX - Internal reef chronology and virtual drill logs from a spreadsheet-based reef growth model. Global and Planetary Change, 66(1-2): 149-159.
Kuhlman, D.H.H., Chevalier, J.P., 1986. Les coraux (Scléractiniaires et Hydrocoralliaires) de l'atoll de Takapoto, îles Tuamotu: aspects écologiques. Marine Ecology, 7: 75-104.
Laborel, J., 1986. Vermetid gastropods as sea-level indicators. In: Plassche, O.V.d. (Ed.), Sea-Level Research: a Manual for the Collection and Evaluation of Data. Geo Books, Norwich, pp. 281-310.
Lambeck, K., Purcell, A., Johnston, P., Nakada, M., Yokoyama, Y., 2003. Water-load definition in the glacio-hydro-isostatic sea-level equation. Quaternary Science Reviews, 22(2-4): 309-318.
Lambeck, K., Yokoyama, Y., Purcell, T., 2002. Into and out of the Last Glacial Maximum: sea-level change during Oxygen Isotope Stages 3 and 2. Quaternary Science Reviews, 21(1-3): 343-360.
Le Roy, I., 1994. Evolution des volcans en système de point chaud: île de Tahiti, archipel de la Société (polynésie française), Université de Paris XI, 271 pp.
Lighty, R.G., Macintyre, I.G., Stuckenrath, R., 1982. Acropora palmata reef Framework: a reliable indicator of sea level in the western atlantic for the past 10,000 years. Coral Reefs: 125-130.
Liu, J.P., Milliman, J.D., 2004. Reconsidering meltwater pulses 1A and 1B: global impacts of rapid sea level rise. Journal of Ocean University of China, 3(2): 183-190.
Ludwig, K.R., 2003. Isoplot 3.00: A Geochronological Toolkit for Microsoft Excel, Geochronological Centre Special Publication, Berkeley.
Mason, A.J., Henderson, G.M., 2010. Correction of multi-collector-ICP-MS instrumental biases in high-precision uranium-thorium chronology. International Journal of Mass Spectrometry, 295(1-2): 26-35.
Milne, G.A., Mitrovica, J.X., 2008. Searching for eustasy in deglacial sea-level histories. Quaternary Science Reviews, 27(25-26): 2292-2302.
Montaggioni, L.F., Bard, E., 1998. Continuous record of reef growth over the past 14ky on the mid-Pacific island of Tahiti: Reply. Geology, 26(5): 479-480.
Montaggioni, L.F., Cabioch, G., Camoin, G.F., Bard, E., RibaudLaurenti, A., Faure, G., Dejardin, P., Recy, J., 1997. Continuous record of reef growth over the past 14 k.y. on the mid-Pacific island of Tahiti. Geology, 25(9): 862.
Nakada, M., Lambeck, K., 1987. Glacial rebound and relative sea-level variations - a new appraisal. Geophysical Journal of the Royal Astronomical Society, 90(1): 171-224.
Nakamura, T., Nakamori, T., 2007. A geochemical model for coral reef formation. Coral Reefs, 26: 741-755.
Okuno, J., Nakada, M., 2001. Effects of water load on geophysical signals due to glacial rebound and implications for mantle viscosity. Earth Planets and Space, 53(12): 1121-1135.

Peltier, W.R., Fairbanks, R.G., 2006. Global glacial ice volume and Last Glacial Maximum duration from an extended Barbados sea level record. Quaternary Science Reviews, 25(23-24): 3322.
Pirazzoli, P.A., MontaggionI, L.F., 1988. Holocene sea-level changes in french Polynesia. Palaeogeography, Palaeoclimatology, Palaeoecology,, 68: 153-175.
Reimer, P.J., Baillie, M.G.L., Bard, E., Bayliss, A., Beck, J.W., Blackwell, P.G., Ramsey, C.B., Buck, C.E., Burr, G.S., Edwards, R.L., Friedrich, M., Grootes, P.M., Guilderson, T.P., Hajdas, I., Heaton, T.J., Hogg, A.G., Hughen, K.A., Kaiser, K.F., Kromer, B., McCormac, F.G., Manning, S.W., Reimer, R.W., Richards, D.A., Southon, J.R., Talamo, S., Turney, C.S.M., van der Plicht, J., Weyhenmeye, C.E., 2009. Intcal09 and Marine09 Cadiocarbon age calibration curves, 0-50,000 years cal BP. Radiocarbon, 51(4): 1111-1150.
Reimer, P.J., Baillie, M.G.L., Bard, E., Warren Beck, J., Blackwell, P.G., Buck, C.E., Burr, G.S., Lawrence Edwards, R., Friedrich, M., Guilderson, T.P., Hogg, A.G., Hughen, K.A., Kromer, B., McCormac, G., Manning, S., Reimer, R.W., Southon, J.R., Stuiver, M., van der Plicht, J., Weyhenmeyer, C.E., 2006. Comment on "Radiocarbon calibration curve spanning 0 to 50,000 years BP based on paired 230Th/234U/238U and 14C dates on pristine corals" by R.G. Fairbanks et al. (Quaternary Science Reviews 24 (2005) 1781-1796) and "Extending the radiocarbon calibration beyond 26,000 years before present using fossil corals" by T.-C. Chiu et al. (Quaternary Science Reviews 24 (2005) 1797-1808). Quaternary Science Reviews, 25(7-8): 855.
Robinson, L.F., Belshaw, N.S., Henderson, G.M., 2004. U and Th concentrations and isotope ratios in modern carbonates and waters from the Bahamas. Geochimica et Cosmochimica Acta, 68(8): 1777-1789.
Sepulcre, S., Durand, N., Bard, E., 2009. Mineralogical determination of reef and periplatform carbonates: calibration and implications for paleoceanography and radiochronology. Global and Planetary Change, 66: 1-9.
Stanford, J.D., Rohling, E.J., Hunter, S.E., Roberts, A.P., Rasmussen, S.O., Bard, E., McManus, J., Fairbanks, R.G., 2006. Timing of meltwater pulse 1a and climate responses to meltwater injections. Paleoceanography, 21(4).
Stirling, C.H., Andersen, M.B., Potter, E.K., Halliday, A.N., 2007. Low-temperature isotopic fractionation of uranium. Earth and Planetary Science Letters, 264: 208-225.
Sugihara, K., Yamada, T., Iryu, Y., 2006. Contrasts of coral zonation between Ishigaki Island (Japan, northwest Pacific) and Tahiti Island (French Polynesia, central Pacific), and its significance in Quaternary reef growth histories. In: Camoin, G., Droxler, A., Fulthorpe, C., Miller, K. (Editors), SEALAIX'06. Association des Sedimentologistes Français, Giens, France, pp. 179-180.
Thomas, A.L., Henderson, G.M., Deschamps, P., Yokoyama, Y., Mason, A.J., Bard, E., Hamelin, B., Durand, N., Camoin, G., 2009. Penultimate Deglacial Sea-Level Timing from Uranium/Thorium Dating of Tahitian Corals. Science, 324(5931): 1186-1189.

Weaver, A.J., Saenko, O.A., Clark, P.U., Mitrovica, J.X., 2003. Meltwater pulse 1A from Antarctica as a trigger of the bolling-allerod warm interval. Science, 299(5613): 1709-1713.
Webster, J.M., Wallace, L.M., Clague, D.A., Braga, J.C., 2007. Numerical modeling of the growth and drowning of Hawaiian coral reefs during the last two glacial cycles (0-250 kyr). Geochemistry Geophysics Geosystems, 8.
Weyer, S., Anbar, A.D., Gerdes, A., Gordon, G.W., Algeo, T.J., Boyle, E.A., 2008. Natural fractionation of 238U/235U. Geochimica et Cosmochimica Acta, 72(2): 345-359.
Yokoyama, Y., De Deckker, P., Lambeck, K., Johnston, P., Fifield, L.K., 2001. Sea-level at the Last Glacial Maximum: evidence from northwestern Australia to constrain ice volumes for oxygen isotope stage 2. Palaeogeography Palaeoclimatology Palaeoecology, 165(3-4): 281-297.
Yokoyama, Y., Lambeck, K., De Deckker, P., Johnston, P., Fifield, L.K., 2000. Timing of the Last Glacial Maximum from observed sea-level minima. Nature, 406(6797): 713-716.

Table S1: U-Th ages and coral description Activity ratios and ages are calculated using the new decay constants determined by Cheng et al. (2000). All reported errors are given at the 2σ level. Labels #1, #2, etc, stands for replicated analyses obtained on different pieces of the same coral sample. U-Th ages are calculated using the Isoplot software (Ludwig, 2003). No correction for detrital 230Th were processed because 232Th concentrations are in most cases low (≤ 0.5 ppb). Ages are presented in years before 1950 AD. Coral types are: mp, massive Porites sp.; bp, branching Porites sp; ep, encrusting Porites sp; rbp, robust branching Pocillopora sp.; bpo, branching Pocillopora sp; ta, tabular Acropora sp.; ra, robust Acropora; ep, encrusting Porites sp.; ba, branching Acropora sp.; em, encrusting Montipora sp.; mm, massive Montipora sp; fm, foliacious Montipora sp; pa, Pavona sp; ml, massive Leptastrea sp. Coralgal assemblages are: PM, robust branching Pocillopora/massive Montipora (0 – 10 m); mP: massive Porites (0 – 20 m); tA: tabular Acropora (5 - 15 m); PP: branching Porites/Pocillopora (5 – 15 m); PPM: branching Porites/encrusting Porites and Montipora (5-25 m); AFM: encrusting Agaricid and Faviid (> 20 m). Occurrence of vermetid gastropod that is indicative of very shallow environment (> 5 m) is indicated by asterisk.
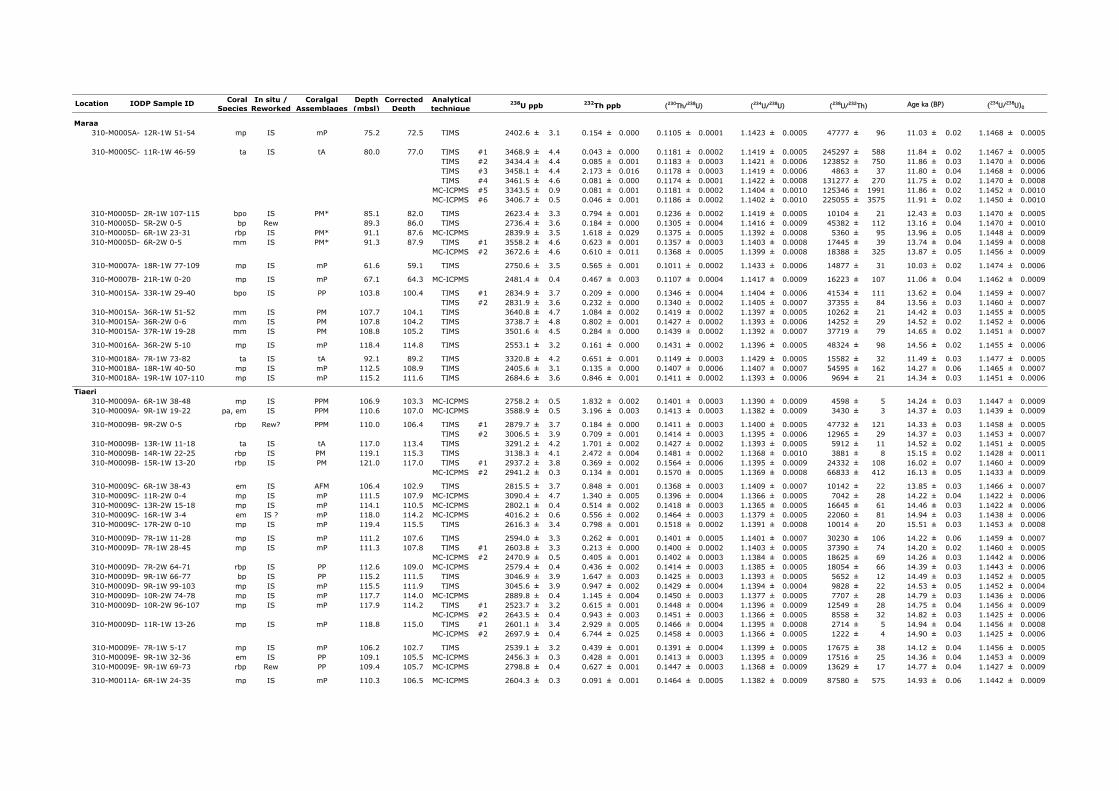
Location Coral Species
In situ / Reworked
Coralgal Assemblages
Depth (mbsl)
Corrected Depth
Analytical technique
Maraa310-M0005A- 12R-1W 51-54 mp IS mP 75.2 72.5 TIMS 2402.6 ± 3.1 0.154 ± 0.000 0.1105 ± 0.0001 1.1423 ± 0.0005 47777 ± 96 11.03 ± 0.02 1.1468 ± 0.0005
310-M0005C- 11R-1W 46-59 ta IS tA 80.0 77.0 TIMS #1 3468.9 ± 4.4 0.043 ± 0.000 0.1181 ± 0.0002 1.1419 ± 0.0005 245297 ± 588 11.84 ± 0.02 1.1467 ± 0.0005TIMS #2 3434.4 ± 4.4 0.085 ± 0.001 0.1183 ± 0.0003 1.1421 ± 0.0006 123852 ± 750 11.86 ± 0.03 1.1470 ± 0.0006TIMS #3 3458.1 ± 4.4 2.173 ± 0.016 0.1178 ± 0.0003 1.1419 ± 0.0006 4863 ± 37 11.80 ± 0.04 1.1468 ± 0.0006TIMS #4 3461.5 ± 4.6 0.081 ± 0.000 0.1174 ± 0.0001 1.1422 ± 0.0008 131277 ± 270 11.75 ± 0.02 1.1470 ± 0.0008
MC-ICPMS #5 3343.5 ± 0.9 0.081 ± 0.001 0.1181 ± 0.0002 1.1404 ± 0.0010 125346 ± 1991 11.86 ± 0.02 1.1452 ± 0.0010MC-ICPMS #6 3406.7 ± 0.5 0.046 ± 0.001 0.1186 ± 0.0002 1.1402 ± 0.0010 225055 ± 3575 11.91 ± 0.02 1.1450 ± 0.0010
310-M0005D- 2R-1W 107-115 bpo IS PM* 85.1 82.0 TIMS 2623.4 ± 3.3 0.794 ± 0.001 0.1236 ± 0.0002 1.1419 ± 0.0005 10104 ± 21 12.43 ± 0.03 1.1470 ± 0.0005310-M0005D- 5R-2W 0-5 bp Rew 89.3 86.0 TIMS 2736.4 ± 3.6 0.184 ± 0.000 0.1305 ± 0.0004 1.1416 ± 0.0009 45382 ± 112 13.16 ± 0.04 1.1470 ± 0.0010310-M0005D- 6R-1W 23-31 rbp IS PM* 91.1 87.6 MC-ICPMS 2839.9 ± 3.5 1.618 ± 0.029 0.1375 ± 0.0005 1.1392 ± 0.0008 5360 ± 95 13.96 ± 0.05 1.1448 ± 0.0009310-M0005D- 6R-2W 0-5 mm IS PM* 91.3 87.9 TIMS #1 3558.2 ± 4.6 0.623 ± 0.001 0.1357 ± 0.0003 1.1403 ± 0.0008 17445 ± 39 13.74 ± 0.04 1.1459 ± 0.0008
MC-ICPMS #2 3672.6 ± 4.6 0.610 ± 0.011 0.1368 ± 0.0005 1.1399 ± 0.0008 18388 ± 325 13.87 ± 0.05 1.1456 ± 0.0009
310-M0007A- 18R-1W 77-109 mp IS mP 61.6 59.1 TIMS 2750.6 ± 3.5 0.565 ± 0.001 0.1011 ± 0.0002 1.1433 ± 0.0006 14877 ± 31 10.03 ± 0.02 1.1474 ± 0.0006
310-M0007B- 21R-1W 0-20 mp IS mP 67.1 64.3 MC-ICPMS 2481.4 ± 0.4 0.467 ± 0.003 0.1107 ± 0.0004 1.1417 ± 0.0009 16223 ± 107 11.06 ± 0.04 1.1462 ± 0.0009
310-M0015A- 33R-1W 29-40 bpo IS PP 103.8 100.4 TIMS #1 2834.9 ± 3.7 0.209 ± 0.000 0.1346 ± 0.0004 1.1404 ± 0.0006 41534 ± 111 13.62 ± 0.04 1.1459 ± 0.0007TIMS #2 2831.9 ± 3.6 0.232 ± 0.000 0.1340 ± 0.0002 1.1405 ± 0.0007 37355 ± 84 13.56 ± 0.03 1.1460 ± 0.0007
310-M0015A- 36R-1W 51-52 mm IS PM 107.7 104.1 TIMS 3640.8 ± 4.7 1.084 ± 0.002 0.1419 ± 0.0002 1.1397 ± 0.0005 10262 ± 21 14.42 ± 0.03 1.1455 ± 0.0005310-M0015A- 36R-2W 0-6 mm IS PM 107.8 104.2 TIMS 3738.7 ± 4.8 0.802 ± 0.001 0.1427 ± 0.0002 1.1393 ± 0.0006 14252 ± 29 14.52 ± 0.02 1.1452 ± 0.0006310-M0015A- 37R-1W 19-28 mm IS PM 108.8 105.2 TIMS 3501.6 ± 4.5 0.284 ± 0.000 0.1439 ± 0.0002 1.1392 ± 0.0007 37719 ± 79 14.65 ± 0.02 1.1451 ± 0.0007
310-M0016A- 36R-2W 5-10 mp IS mP 118.4 114.8 TIMS 2553.1 ± 3.2 0.161 ± 0.000 0.1431 ± 0.0002 1.1396 ± 0.0005 48324 ± 98 14.56 ± 0.02 1.1455 ± 0.0006
310-M0018A- 7R-1W 73-82 ta IS tA 92.1 89.2 TIMS 3320.8 ± 4.2 0.651 ± 0.001 0.1149 ± 0.0003 1.1429 ± 0.0005 15582 ± 32 11.49 ± 0.03 1.1477 ± 0.0005310-M0018A- 18R-1W 40-50 mp IS mP 112.5 108.9 TIMS 2405.6 ± 3.1 0.135 ± 0.000 0.1407 ± 0.0006 1.1407 ± 0.0007 54595 ± 162 14.27 ± 0.06 1.1465 ± 0.0007310-M0018A- 19R-1W 107-110 mp IS mP 115.2 111.6 TIMS 2684.6 ± 3.6 0.846 ± 0.001 0.1411 ± 0.0002 1.1393 ± 0.0006 9694 ± 21 14.34 ± 0.03 1.1451 ± 0.0006
Tiaeri310-M0009A- 6R-1W 38-48 mp IS PPM 106.9 103.3 MC-ICPMS 2758.2 ± 0.5 1.832 ± 0.002 0.1401 ± 0.0003 1.1390 ± 0.0009 4598 ± 5 14.24 ± 0.03 1.1447 ± 0.0009310-M0009A- 9R-1W 19-22 pa, em IS PPM 110.6 107.0 MC-ICPMS 3588.9 ± 0.5 3.196 ± 0.003 0.1413 ± 0.0003 1.1382 ± 0.0009 3430 ± 3 14.37 ± 0.03 1.1439 ± 0.0009
310-M0009B- 9R-2W 0-5 rbp Rew? PPM 110.0 106.4 TIMS #1 2879.7 ± 3.7 0.184 ± 0.000 0.1411 ± 0.0003 1.1400 ± 0.0005 47732 ± 121 14.33 ± 0.03 1.1458 ± 0.0005TIMS #2 3006.5 ± 3.9 0.709 ± 0.001 0.1414 ± 0.0003 1.1395 ± 0.0006 12965 ± 29 14.37 ± 0.03 1.1453 ± 0.0007
310-M0009B- 13R-1W 11-18 ta IS tA 117.0 113.4 TIMS 3291.2 ± 4.2 1.701 ± 0.002 0.1427 ± 0.0002 1.1393 ± 0.0005 5912 ± 11 14.52 ± 0.02 1.1451 ± 0.0005310-M0009B- 14R-1W 22-25 rbp IS PM 119.1 115.3 TIMS 3138.3 ± 4.1 2.472 ± 0.004 0.1481 ± 0.0002 1.1368 ± 0.0010 3881 ± 8 15.15 ± 0.02 1.1428 ± 0.0011310-M0009B- 15R-1W 13-20 rbp IS PM 121.0 117.0 TIMS #1 2937.2 ± 3.8 0.369 ± 0.002 0.1564 ± 0.0006 1.1395 ± 0.0009 24332 ± 108 16.02 ± 0.07 1.1460 ± 0.0009
MC-ICPMS #2 2941.2 ± 0.3 0.134 ± 0.001 0.1570 ± 0.0005 1.1369 ± 0.0008 66833 ± 412 16.13 ± 0.05 1.1433 ± 0.0009
310-M0009C- 6R-1W 38-43 em IS AFM 106.4 102.9 TIMS 2815.5 ± 3.7 0.848 ± 0.001 0.1368 ± 0.0003 1.1409 ± 0.0007 10142 ± 22 13.85 ± 0.03 1.1466 ± 0.0007310-M0009C- 11R-2W 0-4 mp IS mP 111.5 107.9 MC-ICPMS 3090.4 ± 4.7 1.340 ± 0.005 0.1396 ± 0.0004 1.1366 ± 0.0005 7042 ± 28 14.22 ± 0.04 1.1422 ± 0.0006310-M0009C- 13R-2W 15-18 mp IS mP 114.1 110.5 MC-ICPMS 2802.1 ± 0.4 0.514 ± 0.002 0.1418 ± 0.0003 1.1365 ± 0.0005 16645 ± 61 14.46 ± 0.03 1.1422 ± 0.0006310-M0009C- 16R-1W 3-4 em IS ? mP 118.0 114.2 MC-ICPMS 4016.2 ± 0.6 0.556 ± 0.002 0.1464 ± 0.0003 1.1379 ± 0.0005 22060 ± 81 14.94 ± 0.03 1.1438 ± 0.0006310-M0009C- 17R-2W 0-10 mp IS mP 119.4 115.5 TIMS 2616.3 ± 3.4 0.798 ± 0.001 0.1518 ± 0.0002 1.1391 ± 0.0008 10014 ± 20 15.51 ± 0.03 1.1453 ± 0.0008
310-M0009D- 7R-1W 11-28 mp IS mP 111.2 107.6 TIMS 2594.0 ± 3.3 0.262 ± 0.001 0.1401 ± 0.0005 1.1401 ± 0.0007 30230 ± 106 14.22 ± 0.06 1.1459 ± 0.0007310-M0009D- 7R-1W 28-45 mp IS mP 111.3 107.8 TIMS #1 2603.8 ± 3.3 0.213 ± 0.000 0.1400 ± 0.0002 1.1403 ± 0.0005 37390 ± 74 14.20 ± 0.02 1.1460 ± 0.0005
MC-ICPMS #2 2470.9 ± 0.5 0.405 ± 0.001 0.1402 ± 0.0003 1.1384 ± 0.0005 18625 ± 69 14.26 ± 0.03 1.1442 ± 0.0006310-M0009D- 7R-2W 64-71 rbp IS PP 112.6 109.0 MC-ICPMS 2579.4 ± 0.4 0.436 ± 0.002 0.1414 ± 0.0003 1.1385 ± 0.0005 18054 ± 66 14.39 ± 0.03 1.1443 ± 0.0006310-M0009D- 9R-1W 66-77 bp IS PP 115.2 111.5 TIMS 3046.9 ± 3.9 1.647 ± 0.003 0.1425 ± 0.0003 1.1393 ± 0.0005 5652 ± 12 14.49 ± 0.03 1.1452 ± 0.0005310-M0009D- 9R-1W 99-103 mp IS mP 115.5 111.9 TIMS 3045.6 ± 3.9 0.947 ± 0.002 0.1429 ± 0.0004 1.1394 ± 0.0004 9828 ± 22 14.53 ± 0.05 1.1452 ± 0.0004310-M0009D- 10R-2W 74-78 mp IS mP 117.7 114.0 MC-ICPMS 2889.8 ± 0.4 1.145 ± 0.004 0.1450 ± 0.0003 1.1377 ± 0.0005 7707 ± 28 14.79 ± 0.03 1.1436 ± 0.0006310-M0009D- 10R-2W 96-107 mp IS mP 117.9 114.2 TIMS #1 2523.7 ± 3.2 0.615 ± 0.001 0.1448 ± 0.0004 1.1396 ± 0.0009 12549 ± 28 14.75 ± 0.04 1.1456 ± 0.0009
MC-ICPMS #2 2643.5 ± 0.4 0.943 ± 0.003 0.1451 ± 0.0003 1.1366 ± 0.0005 8558 ± 32 14.82 ± 0.03 1.1425 ± 0.0006310-M0009D- 11R-1W 13-26 mp IS mP 118.8 115.0 TIMS #1 2601.1 ± 3.4 2.929 ± 0.005 0.1466 ± 0.0004 1.1395 ± 0.0008 2714 ± 5 14.94 ± 0.04 1.1456 ± 0.0008
MC-ICPMS #2 2697.9 ± 0.4 6.744 ± 0.025 0.1458 ± 0.0003 1.1366 ± 0.0005 1222 ± 4 14.90 ± 0.03 1.1425 ± 0.0006
310-M0009E- 7R-1W 5-17 mp IS mP 106.2 102.7 TIMS 2539.1 ± 3.2 0.439 ± 0.001 0.1391 ± 0.0004 1.1399 ± 0.0005 17675 ± 38 14.12 ± 0.04 1.1456 ± 0.0005310-M0009E- 9R-1W 32-36 em IS PP 109.1 105.5 MC-ICPMS 2456.3 ± 0.3 0.428 ± 0.001 0.1413 ± 0.0003 1.1395 ± 0.0009 17516 ± 25 14.36 ± 0.04 1.1453 ± 0.0009310-M0009E- 9R-1W 69-73 rbp Rew PP 109.4 105.7 MC-ICPMS 2798.8 ± 0.4 0.627 ± 0.001 0.1447 ± 0.0003 1.1368 ± 0.0009 13629 ± 17 14.77 ± 0.04 1.1427 ± 0.0009
310-M0011A- 6R-1W 24-35 mp IS mP 110.3 106.5 MC-ICPMS 2604.3 ± 0.3 0.091 ± 0.001 0.1464 ± 0.0005 1.1382 ± 0.0009 87580 ± 575 14.93 ± 0.06 1.1442 ± 0.0009
IODP Sample ID 238U ppb 232Th ppb (230Th/238U) (234U/238U) (238U/232Th) Age ka (BP) (234U/238U)0
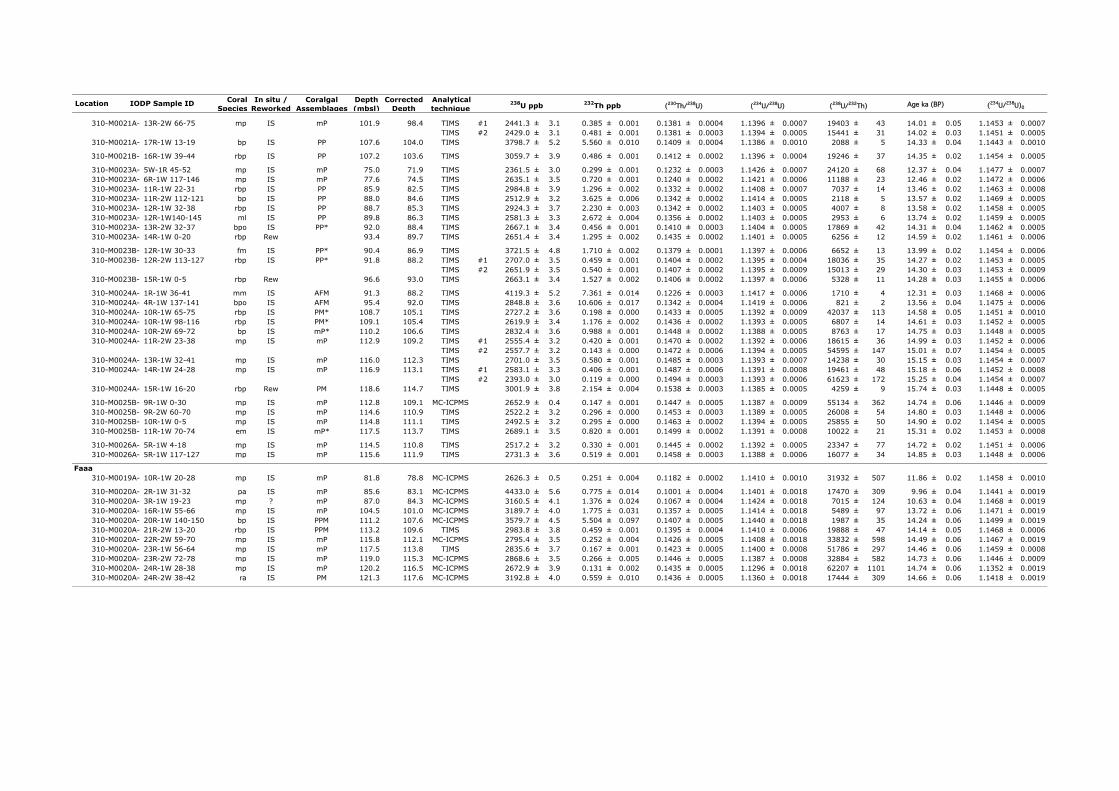
Location Coral Species
In situ / Reworked
Coralgal Assemblages
Depth (mbsl)
Corrected Depth
Analytical technique
IODP Sample ID 238U ppb 232Th ppb (230Th/238U) (234U/238U) (238U/232Th) Age ka (BP) (234U/238U)0
310-M0021A- 13R-2W 66-75 mp IS mP 101.9 98.4 TIMS #1 2441.3 ± 3.1 0.385 ± 0.001 0.1381 ± 0.0004 1.1396 ± 0.0007 19403 ± 43 14.01 ± 0.05 1.1453 ± 0.0007TIMS #2 2429.0 ± 3.1 0.481 ± 0.001 0.1381 ± 0.0003 1.1394 ± 0.0005 15441 ± 31 14.02 ± 0.03 1.1451 ± 0.0005
310-M0021A- 17R-1W 13-19 bp IS PP 107.6 104.0 TIMS 3798.7 ± 5.2 5.560 ± 0.010 0.1409 ± 0.0004 1.1386 ± 0.0010 2088 ± 5 14.33 ± 0.04 1.1443 ± 0.0010
310-M0021B- 16R-1W 39-44 rbp IS PP 107.2 103.6 TIMS 3059.7 ± 3.9 0.486 ± 0.001 0.1412 ± 0.0002 1.1396 ± 0.0004 19246 ± 37 14.35 ± 0.02 1.1454 ± 0.0005
310-M0023A- 5W-1R 45-52 mp IS mP 75.0 71.9 TIMS 2361.5 ± 3.0 0.299 ± 0.001 0.1232 ± 0.0003 1.1426 ± 0.0007 24120 ± 68 12.37 ± 0.04 1.1477 ± 0.0007310-M0023A- 6R-1W 117-146 mp IS mP 77.6 74.5 TIMS 2635.1 ± 3.5 0.720 ± 0.001 0.1240 ± 0.0002 1.1421 ± 0.0006 11188 ± 23 12.46 ± 0.02 1.1472 ± 0.0006310-M0023A- 11R-1W 22-31 rbp IS PP 85.9 82.5 TIMS 2984.8 ± 3.9 1.296 ± 0.002 0.1332 ± 0.0002 1.1408 ± 0.0007 7037 ± 14 13.46 ± 0.02 1.1463 ± 0.0008310-M0023A- 11R-2W 112-121 bp IS PP 88.0 84.6 TIMS 2512.9 ± 3.2 3.625 ± 0.006 0.1342 ± 0.0002 1.1414 ± 0.0005 2118 ± 5 13.57 ± 0.02 1.1469 ± 0.0005310-M0023A- 12R-1W 32-38 rbp IS PP 88.7 85.3 TIMS 2924.3 ± 3.7 2.230 ± 0.003 0.1342 ± 0.0002 1.1403 ± 0.0005 4007 ± 8 13.58 ± 0.02 1.1458 ± 0.0005310-M0023A- 12R-1W140-145 ml IS PP 89.8 86.3 TIMS 2581.3 ± 3.3 2.672 ± 0.004 0.1356 ± 0.0002 1.1403 ± 0.0005 2953 ± 6 13.74 ± 0.02 1.1459 ± 0.0005310-M0023A- 13R-2W 32-37 bpo IS PP* 92.0 88.4 TIMS 2667.1 ± 3.4 0.456 ± 0.001 0.1410 ± 0.0003 1.1404 ± 0.0005 17869 ± 42 14.31 ± 0.04 1.1462 ± 0.0005310-M0023A- 14R-1W 0-20 rbp Rew 93.4 89.7 TIMS 2651.4 ± 3.4 1.295 ± 0.002 0.1435 ± 0.0002 1.1401 ± 0.0005 6256 ± 12 14.59 ± 0.02 1.1461 ± 0.0006
310-M0023B- 12R-1W 30-33 fm IS PP* 90.4 86.9 TIMS 3721.5 ± 4.8 1.710 ± 0.002 0.1379 ± 0.0001 1.1397 ± 0.0006 6652 ± 13 13.99 ± 0.02 1.1454 ± 0.0006310-M0023B- 12R-2W 113-127 rbp IS PP* 91.8 88.2 TIMS #1 2707.0 ± 3.5 0.459 ± 0.001 0.1404 ± 0.0002 1.1395 ± 0.0004 18036 ± 35 14.27 ± 0.02 1.1453 ± 0.0005
TIMS #2 2651.9 ± 3.5 0.540 ± 0.001 0.1407 ± 0.0002 1.1395 ± 0.0009 15013 ± 29 14.30 ± 0.03 1.1453 ± 0.0009310-M0023B- 15R-1W 0-5 rbp Rew 96.6 93.0 TIMS 2663.1 ± 3.4 1.527 ± 0.002 0.1406 ± 0.0002 1.1397 ± 0.0006 5328 ± 11 14.28 ± 0.03 1.1455 ± 0.0006
310-M0024A- 1R-1W 36-41 mm IS AFM 91.3 88.2 TIMS 4119.3 ± 5.2 7.361 ± 0.014 0.1226 ± 0.0003 1.1417 ± 0.0006 1710 ± 4 12.31 ± 0.03 1.1468 ± 0.0006310-M0024A- 4R-1W 137-141 bpo IS AFM 95.4 92.0 TIMS 2848.8 ± 3.6 10.606 ± 0.017 0.1342 ± 0.0004 1.1419 ± 0.0006 821 ± 2 13.56 ± 0.04 1.1475 ± 0.0006310-M0024A- 10R-1W 65-75 rbp IS PM* 108.7 105.1 TIMS 2727.2 ± 3.6 0.198 ± 0.000 0.1433 ± 0.0005 1.1392 ± 0.0009 42037 ± 113 14.58 ± 0.05 1.1451 ± 0.0010310-M0024A- 10R-1W 98-116 rbp IS PM* 109.1 105.4 TIMS 2619.9 ± 3.4 1.176 ± 0.002 0.1436 ± 0.0002 1.1393 ± 0.0005 6807 ± 14 14.61 ± 0.03 1.1452 ± 0.0005310-M0024A- 10R-2W 69-72 bp IS mP* 110.2 106.6 TIMS 2832.4 ± 3.6 0.988 ± 0.001 0.1448 ± 0.0002 1.1388 ± 0.0005 8763 ± 17 14.75 ± 0.03 1.1448 ± 0.0005310-M0024A- 11R-2W 23-38 mp IS mP 112.9 109.2 TIMS #1 2555.4 ± 3.2 0.420 ± 0.001 0.1470 ± 0.0002 1.1392 ± 0.0006 18615 ± 36 14.99 ± 0.03 1.1452 ± 0.0006
TIMS #2 2557.7 ± 3.2 0.143 ± 0.000 0.1472 ± 0.0006 1.1394 ± 0.0005 54595 ± 147 15.01 ± 0.07 1.1454 ± 0.0005310-M0024A- 13R-1W 32-41 mp IS mP 116.0 112.3 TIMS 2701.0 ± 3.5 0.580 ± 0.001 0.1485 ± 0.0003 1.1393 ± 0.0007 14238 ± 30 15.15 ± 0.03 1.1454 ± 0.0007310-M0024A- 14R-1W 24-28 mp IS mP 116.9 113.1 TIMS #1 2583.1 ± 3.3 0.406 ± 0.001 0.1487 ± 0.0006 1.1391 ± 0.0008 19461 ± 48 15.18 ± 0.06 1.1452 ± 0.0008
TIMS #2 2393.0 ± 3.0 0.119 ± 0.000 0.1494 ± 0.0003 1.1393 ± 0.0006 61623 ± 172 15.25 ± 0.04 1.1454 ± 0.0007310-M0024A- 15R-1W 16-20 rbp Rew PM 118.6 114.7 TIMS 3001.9 ± 3.8 2.154 ± 0.004 0.1538 ± 0.0003 1.1385 ± 0.0005 4259 ± 9 15.74 ± 0.03 1.1448 ± 0.0005
310-M0025B- 9R-1W 0-30 mp IS mP 112.8 109.1 MC-ICPMS 2652.9 ± 0.4 0.147 ± 0.001 0.1447 ± 0.0005 1.1387 ± 0.0009 55134 ± 362 14.74 ± 0.06 1.1446 ± 0.0009310-M0025B- 9R-2W 60-70 mp IS mP 114.6 110.9 TIMS 2522.2 ± 3.2 0.296 ± 0.000 0.1453 ± 0.0003 1.1389 ± 0.0005 26008 ± 54 14.80 ± 0.03 1.1448 ± 0.0006310-M0025B- 10R-1W 0-5 mp IS mP 114.8 111.1 TIMS 2492.5 ± 3.2 0.295 ± 0.000 0.1463 ± 0.0002 1.1394 ± 0.0005 25855 ± 50 14.90 ± 0.02 1.1454 ± 0.0005310-M0025B- 11R-1W 70-74 em IS mP* 117.5 113.7 TIMS 2689.1 ± 3.5 0.820 ± 0.001 0.1499 ± 0.0002 1.1391 ± 0.0008 10022 ± 21 15.31 ± 0.02 1.1453 ± 0.0008
310-M0026A- 5R-1W 4-18 mp IS mP 114.5 110.8 TIMS 2517.2 ± 3.2 0.330 ± 0.001 0.1445 ± 0.0002 1.1392 ± 0.0005 23347 ± 77 14.72 ± 0.02 1.1451 ± 0.0006310-M0026A- 5R-1W 117-127 mp IS mP 115.6 111.9 TIMS 2731.3 ± 3.6 0.519 ± 0.001 0.1458 ± 0.0003 1.1388 ± 0.0006 16077 ± 34 14.85 ± 0.03 1.1448 ± 0.0006
Faaa310-M0019A- 10R-1W 20-28 mp IS mP 81.8 78.8 MC-ICPMS 2626.3 ± 0.5 0.251 ± 0.004 0.1182 ± 0.0002 1.1410 ± 0.0010 31932 ± 507 11.86 ± 0.02 1.1458 ± 0.0010
310-M0020A- 2R-1W 31-32 pa IS mP 85.6 83.1 MC-ICPMS 4433.0 ± 5.6 0.775 ± 0.014 0.1001 ± 0.0004 1.1401 ± 0.0018 17470 ± 309 9.96 ± 0.04 1.1441 ± 0.0019310-M0020A- 3R-1W 19-23 mp ? mP 87.0 84.3 MC-ICPMS 3160.5 ± 4.1 1.376 ± 0.024 0.1067 ± 0.0004 1.1424 ± 0.0018 7015 ± 124 10.63 ± 0.04 1.1468 ± 0.0019310-M0020A- 16R-1W 55-66 mp IS mP 104.5 101.0 MC-ICPMS 3189.7 ± 4.0 1.775 ± 0.031 0.1357 ± 0.0005 1.1414 ± 0.0018 5489 ± 97 13.72 ± 0.06 1.1471 ± 0.0019310-M0020A- 20R-1W 140-150 bp IS PPM 111.2 107.6 MC-ICPMS 3579.7 ± 4.5 5.504 ± 0.097 0.1407 ± 0.0005 1.1440 ± 0.0018 1987 ± 35 14.24 ± 0.06 1.1499 ± 0.0019310-M0020A- 21R-2W 13-20 rbp IS PPM 113.2 109.6 TIMS 2983.8 ± 3.8 0.459 ± 0.001 0.1395 ± 0.0004 1.1410 ± 0.0006 19888 ± 47 14.14 ± 0.05 1.1468 ± 0.0006310-M0020A- 22R-2W 59-70 mp IS mP 115.8 112.1 MC-ICPMS 2795.4 ± 3.5 0.252 ± 0.004 0.1426 ± 0.0005 1.1408 ± 0.0018 33832 ± 598 14.49 ± 0.06 1.1467 ± 0.0019310-M0020A- 23R-1W 56-64 mp IS mP 117.5 113.8 TIMS 2835.6 ± 3.7 0.167 ± 0.001 0.1423 ± 0.0005 1.1400 ± 0.0008 51786 ± 297 14.46 ± 0.06 1.1459 ± 0.0008310-M0020A- 23R-2W 72-78 mp IS mP 119.0 115.3 MC-ICPMS 2868.6 ± 3.5 0.266 ± 0.005 0.1446 ± 0.0005 1.1387 ± 0.0008 32884 ± 582 14.73 ± 0.06 1.1446 ± 0.0009310-M0020A- 24R-1W 28-38 mp IS mP 120.2 116.5 MC-ICPMS 2672.9 ± 3.9 0.131 ± 0.002 0.1435 ± 0.0005 1.1296 ± 0.0018 62207 ± 1101 14.74 ± 0.06 1.1352 ± 0.0019310-M0020A- 24R-2W 38-42 ra IS PM 121.3 117.6 MC-ICPMS 3192.8 ± 4.0 0.559 ± 0.010 0.1436 ± 0.0005 1.1360 ± 0.0018 17444 ± 309 14.66 ± 0.06 1.1418 ± 0.0019


![Edinburgh Research Explorer - COnnecting REpositories · Edinburgh Research Explorer ... demonstrated good inter-rater reliability [14,15]. Moreover, we ... Participants were community-resident,](https://img.pdfslide.net/doc/110x75/5e85a48b4a019226407e6438/edinburgh-research-explorer-connecting-repositories-edinburgh-research-explorer.jpg)