Embed Size (px)
Citation preview
Edison Electric Institute Financial Conference
November 12 – 13, 2014
1 2014 EEI Financial Conference
Cautionary Statements Regarding Forward-Looking Information
This presentation contains certain forward-looking statements within the meaning of
the Private Securities Litigation Reform Act of 1995, that are subject to risks and
uncertainties. The factors that could cause actual results to differ materially from the
forward-looking statements made by Exelon Corporation, Commonwealth Edison
Company, PECO Energy Company, Baltimore Gas and Electric Company and Exelon
Generation Company, LLC (Registrants) include those factors discussed herein, as well
as the items discussed in (1) Exelon’s 2013 Annual Report on Form 10-K in (a) ITEM
1A. Risk Factors, (b) ITEM 7. Management’s Discussion and Analysis of Financial
Condition and Results of Operations and (c) ITEM 8. Financial Statements and
Supplementary Data: Note 22; (2) Exelon’s Third Quarter 2014 Quarterly Report on
Form 10-Q in (a) Part II, Other Information, ITEM 1A. Risk Factors; (b) Part 1, Financial
Information, ITEM 2. Management’s Discussion and Analysis of Financial Condition and
Results of Operations and (c) Part I, Financial Information, ITEM 1. Financial
Statements: Note 18; and (3) other factors discussed in filings with the SEC by the
Registrants. Readers are cautioned not to place undue reliance on these forward-
looking statements, which apply only as of the date of this presentation. None of the
Registrants undertakes any obligation to publicly release any revision to its forward-
looking statements to reflect events or circumstances after the date of this
presentation.
2 2014 EEI Financial Conference
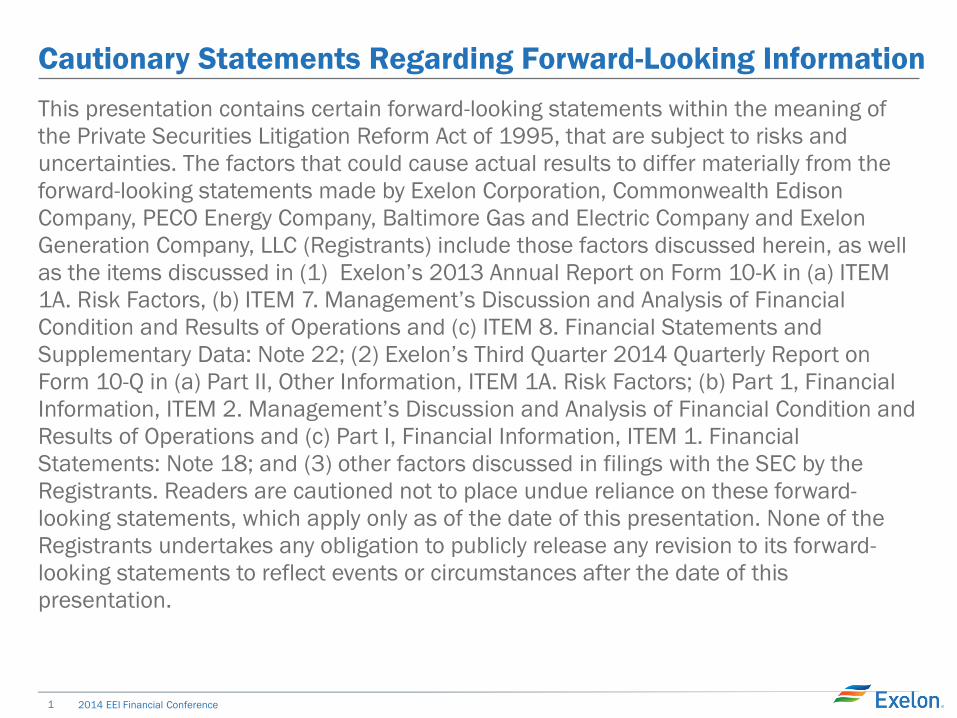
Our Strategy
Exelon Corporation
Exelon Utilities Exelon Generation
Attributes
Value Drivers
Guiding Principle
Corresponding Actions
• Regulated growth
• Dividend stability
• Operational excellence
• Earnings growth
• Dividend yield
• Public policy advocacy
General Characteristics
Role & Focus
• Provide dividend coverage and
stable earnings growth platform
• Invest in regulated growth
opportunities
• Competitive growth
• Commodity exposure
• Operational excellence
• Free cash flow growth
• Power prices/volatility
• Public policy advocacy
• Diversify business to provide
growth and reduce earnings
volatility
• Invest in existing and adjacent
markets and introduce new
products and services
Exelon’s Strategy Leverage the integrated business model to create value and
diversify our business
3 2014 EEI Financial Conference
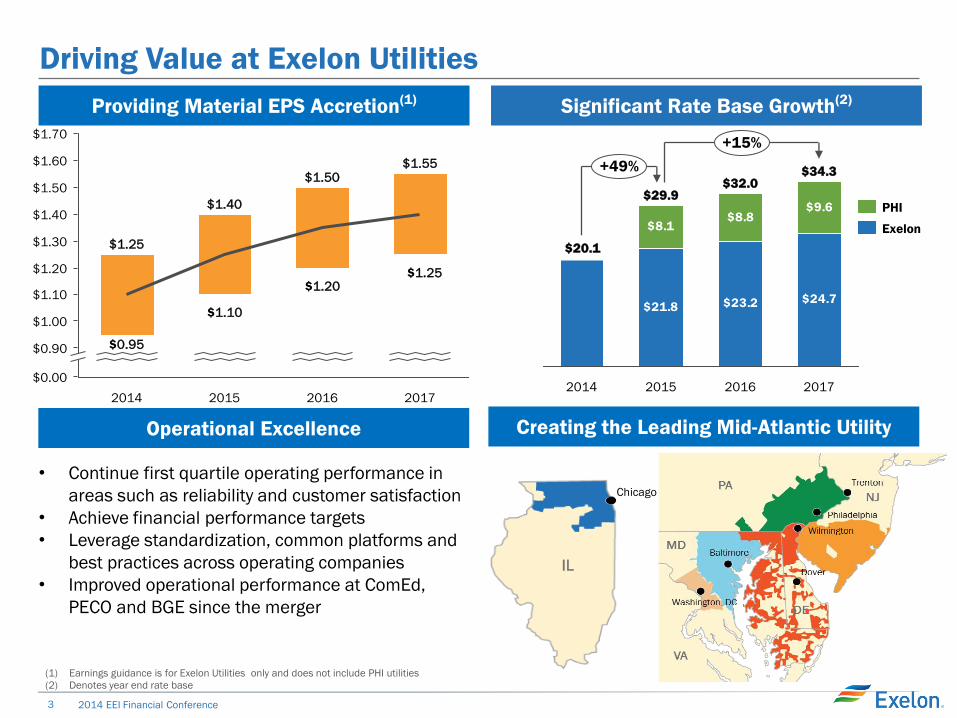
Driving Value at Exelon Utilities
Providing Material EPS Accretion(1) Significant Rate Base Growth(2)
Operational Excellence Creating the Leading Mid-Atlantic Utility
• Continue first quartile operating performance in
areas such as reliability and customer satisfaction
• Achieve financial performance targets
• Leverage standardization, common platforms and
best practices across operating companies
• Improved operational performance at ComEd,
PECO and BGE since the merger
IL
Chicago
$1.60
$1.50
$1.40
$1.30
$1.70
$1.10
$1.00
$0.90
$1.20
$0.00
2017 2016
$1.55 $1.50
2015
$1.40
2014
$1.25
$1.20 $1.25
$0.95
$1.10 $21.8 $23.2 $24.7
$8.1$8.8
$9.6
$20.1
+15%
+49%
2017
$34.3
2016
$32.0
2015
$29.9
2014
Exelon
PHI
(1) Earnings guidance is for Exelon Utilities only and does not include PHI utilities
(2) Denotes year end rate base
$20.1
4 2014 EEI Financial Conference
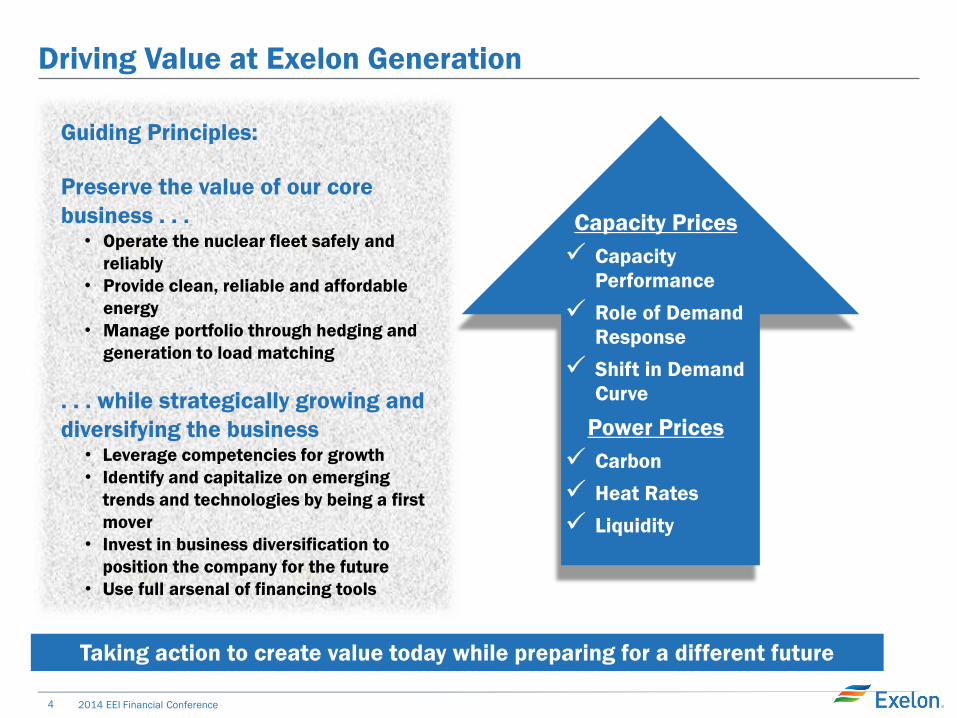
Driving Value at Exelon Generation
Capacity Prices
Capacity
Performance
Role of Demand
Response
Shift in Demand
Curve
Power Prices
Carbon
Heat Rates
Liquidity
Taking action to create value today while preparing for a different future
Guiding Principles:
Preserve the value of our core
business . . . • Operate the nuclear fleet safely and
reliably
• Provide clean, reliable and affordable
energy
• Manage portfolio through hedging and
generation to load matching
. . . while strategically growing and
diversifying the business • Leverage competencies for growth
• Identify and capitalize on emerging
trends and technologies by being a first
mover
• Invest in business diversification to
position the company for the future
• Use full arsenal of financing tools
5 2014 EEI Financial Conference
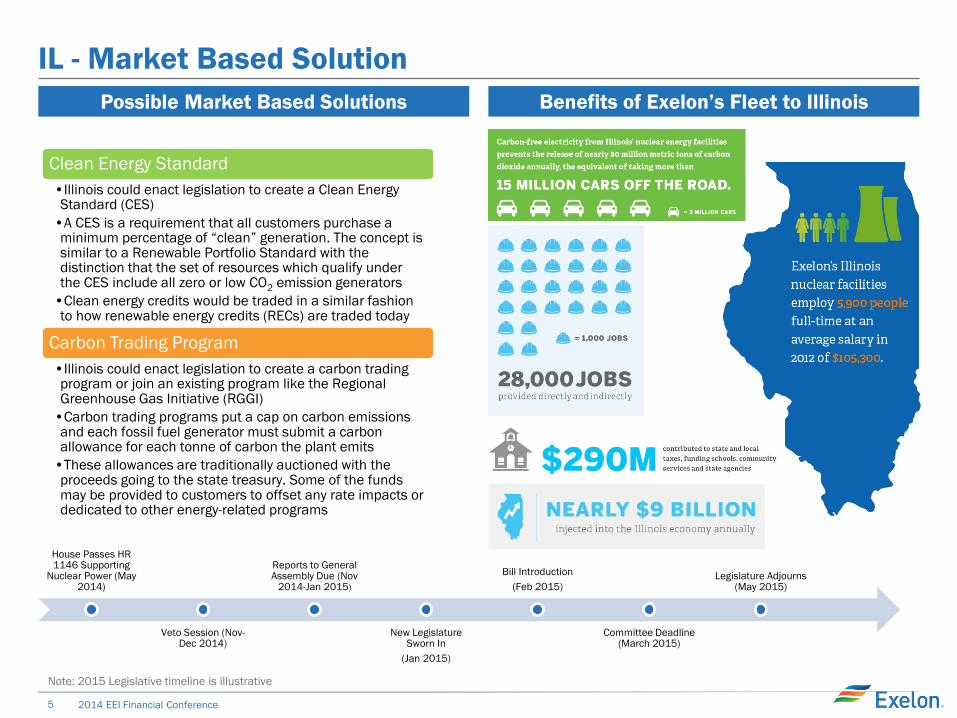
IL - Market Based Solution
House Passes HR 1146 Supporting
Nuclear Power (May 2014)
Veto Session (Nov-Dec 2014)
Reports to General Assembly Due (Nov
2014-Jan 2015)
New Legislature Sworn In
(Jan 2015)
Bill Introduction
(Feb 2015)
Committee Deadline (March 2015)
Legislature Adjourns (May 2015)
Possible Market Based Solutions Benefits of Exelon’s Fleet to Illinois
Clean Energy Standard
•Illinois could enact legislation to create a Clean Energy Standard (CES)
•A CES is a requirement that all customers purchase a minimum percentage of “clean” generation. The concept is similar to a Renewable Portfolio Standard with the distinction that the set of resources which qualify under the CES include all zero or low CO2 emission generators
•Clean energy credits would be traded in a similar fashion to how renewable energy credits (RECs) are traded today
Carbon Trading Program
•Illinois could enact legislation to create a carbon trading program or join an existing program like the Regional Greenhouse Gas Initiative (RGGI)
•Carbon trading programs put a cap on carbon emissions and each fossil fuel generator must submit a carbon allowance for each tonne of carbon the plant emits
•These allowances are traditionally auctioned with the proceeds going to the state treasury. Some of the funds may be provided to customers to offset any rate impacts or dedicated to other energy-related programs
Note: 2015 Legislative timeline is illustrative
6 2014 EEI Financial Conference
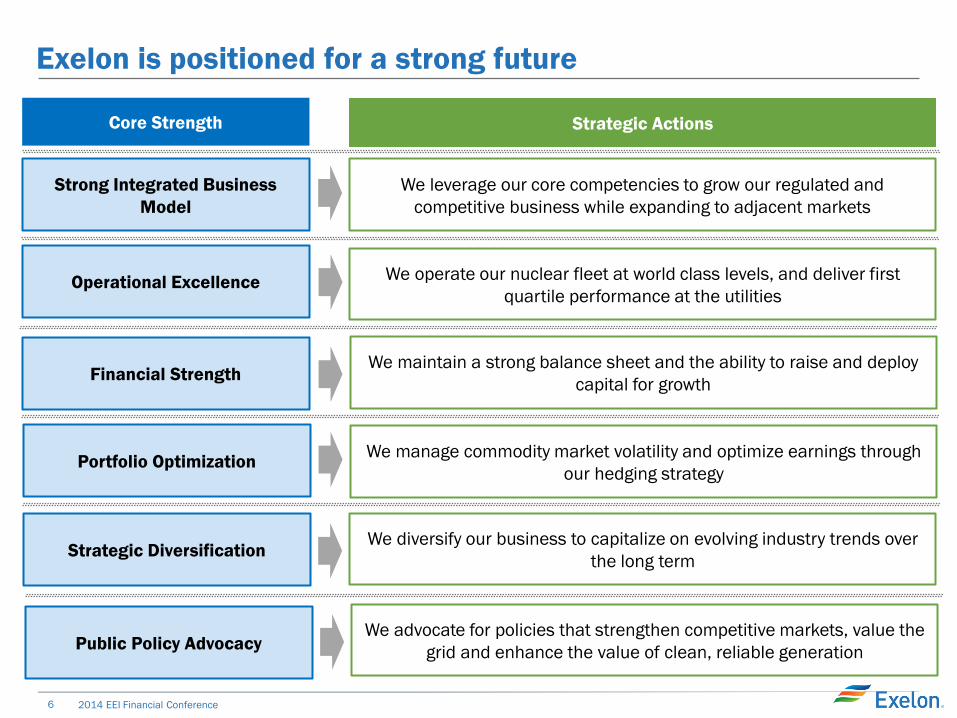
Exelon is positioned for a strong future
Operational Excellence
Financial Strength
Portfolio Optimization
Strategic Diversification
Strong Integrated Business
Model
We operate our nuclear fleet at world class levels, and deliver first
quartile performance at the utilities
We maintain a strong balance sheet and the ability to raise and deploy
capital for growth
We manage commodity market volatility and optimize earnings through
our hedging strategy
We diversify our business to capitalize on evolving industry trends over
the long term
We leverage our core competencies to grow our regulated and
competitive business while expanding to adjacent markets
Core Strength Strategic Actions
Public Policy Advocacy We advocate for policies that strengthen competitive markets, value the
grid and enhance the value of clean, reliable generation

Key Developments
8 2014 EEI Financial Conference
0
25
50
75
100
125
150
175
200
225
250
2014/15 2015/16 2016/17 2017/18
GW
of
UC
AP
Nuclear Coal/Biomass
Oil Dual-Fuel Gas
EE + Imports + Hydro Uncleared-in-RPM Nuclear + Coal
Gas Without Dual Fuel Potential CP DR
CP Procurement Target (80% of Reliability Target)
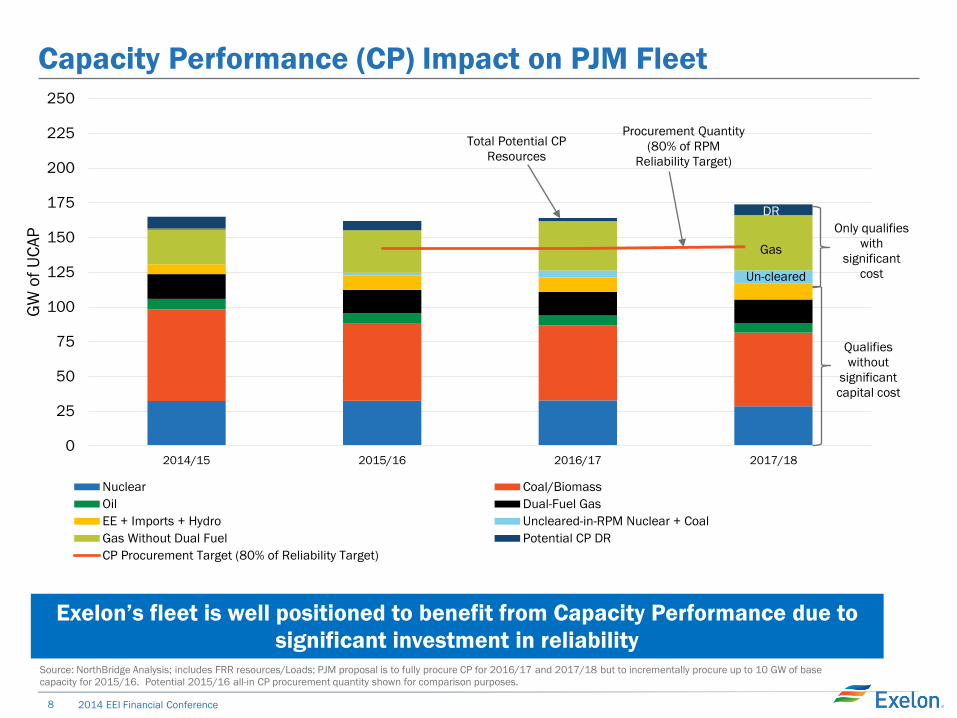
Capacity Performance (CP) Impact on PJM Fleet
Gas
DR
Total Potential CP
Resources
Procurement Quantity
(80% of RPM
Reliability Target)
Source: NorthBridge Analysis; includes FRR resources/Loads; PJM proposal is to fully procure CP for 2016/17 and 2017/18 but to incrementally procure up to 10 GW of base
capacity for 2015/16. Potential 2015/16 all-in CP procurement quantity shown for comparison purposes.
Only qualifies
with
significant
cost
Qualifies
without
significant
capital cost
Un-cleared
Exelon’s fleet is well positioned to benefit from Capacity Performance due to
significant investment in reliability
9 2014 EEI Financial Conference
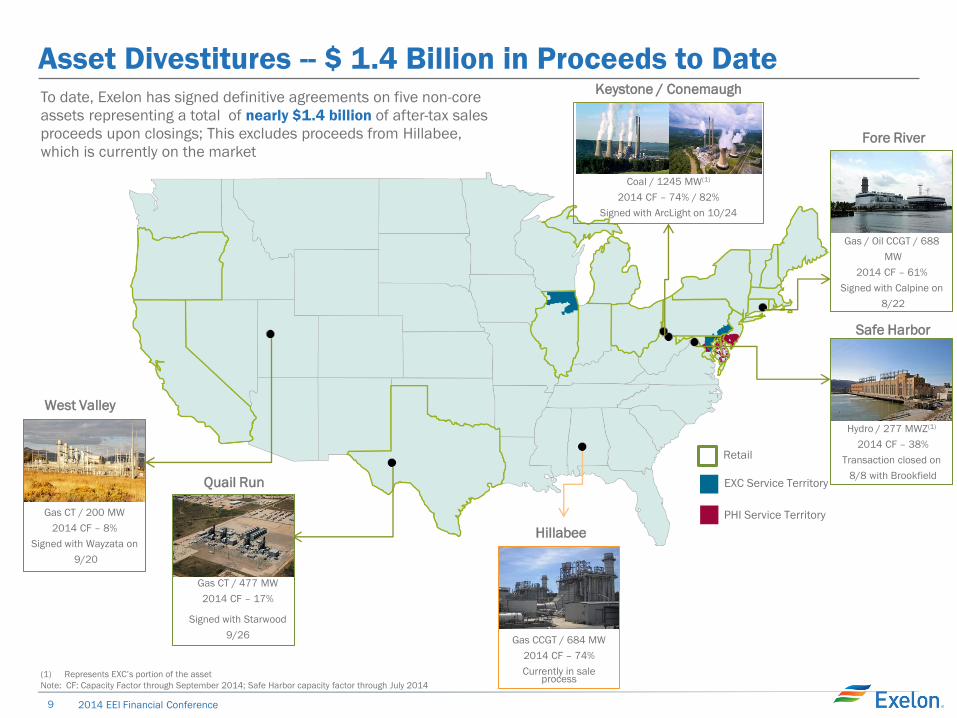
Asset Divestitures -- $ 1.4 Billion in Proceeds to Date
Retail
EXC Service Territory
PHI Service Territory
(1) Represents EXC’s portion of the asset
Note: CF: Capacity Factor through September 2014; Safe Harbor capacity factor through July 2014
Gas CT / 200 MW
2014 CF – 8%
Signed with Wayzata on
9/20
West Valley
Gas CT / 477 MW
2014 CF – 17%
Signed with Starwood
9/26
Quail Run
Gas / Oil CCGT / 688
MW
2014 CF – 61%
Signed with Calpine on
8/22
Fore River
Hydro / 277 MWZ(1)
2014 CF – 38%
Transaction closed on
8/8 with Brookfield
Safe Harbor
Coal / 1245 MW(1)
2014 CF – 74% / 82%
Signed with ArcLight on 10/24
Keystone / Conemaugh
Gas CCGT / 684 MW
2014 CF – 74%
Currently in sale process
Hillabee
To date, Exelon has signed definitive agreements on five non-core
assets representing a total of nearly $1.4 billion of after-tax sales
proceeds upon closings; This excludes proceeds from Hillabee,
which is currently on the market
10 2014 EEI Financial Conference
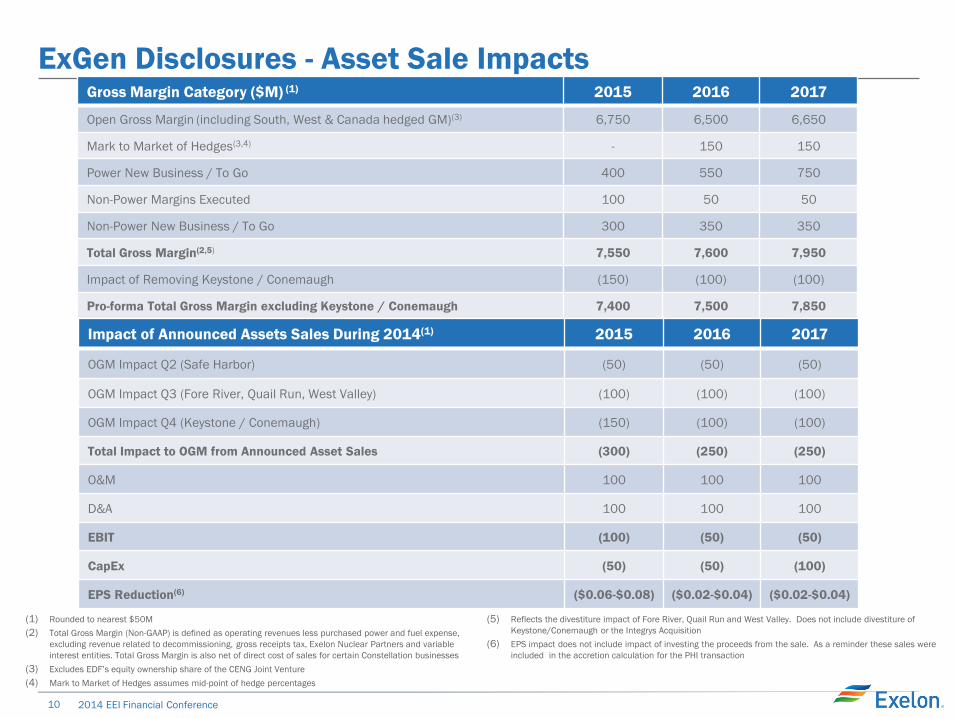
ExGen Disclosures - Asset Sale Impacts Gross Margin Category ($M) (1) 2015 2016 2017
Open Gross Margin (including South, West & Canada hedged GM)(3) 6,750 6,500 6,650
Mark to Market of Hedges(3,4) - 150 150
Power New Business / To Go 400 550 750
Non-Power Margins Executed 100 50 50
Non-Power New Business / To Go 300 350 350
Total Gross Margin(2,5) 7,550 7,600 7,950
Impact of Removing Keystone / Conemaugh (150) (100) (100)
Pro-forma Total Gross Margin excluding Keystone / Conemaugh 7,400 7,500 7,850
Impact of Announced Assets Sales During 2014(1) 2015 2016 2017
OGM Impact Q2 (Safe Harbor) (50) (50) (50)
OGM Impact Q3 (Fore River, Quail Run, West Valley) (100) (100) (100)
OGM Impact Q4 (Keystone / Conemaugh) (150) (100) (100)
Total Impact to OGM from Announced Asset Sales (300) (250) (250)
O&M 100 100 100
D&A 100 100 100
EBIT (100) (50) (50)
CapEx (50) (50) (100)
EPS Reduction(6) ($0.06-$0.08) ($0.02-$0.04) ($0.02-$0.04)
(1) Rounded to nearest $50M
(2) Total Gross Margin (Non-GAAP) is defined as operating revenues less purchased power and fuel expense,
excluding revenue related to decommissioning, gross receipts tax, Exelon Nuclear Partners and variable
interest entities. Total Gross Margin is also net of direct cost of sales for certain Constellation businesses
(3) Excludes EDF’s equity ownership share of the CENG Joint Venture
(4) Mark to Market of Hedges assumes mid-point of hedge percentages
(5) Reflects the divestiture impact of Fore River, Quail Run and West Valley. Does not include divestiture of
Keystone/Conemaugh or the Integrys Acquisition
(6) EPS impact does not include impact of investing the proceeds from the sale. As a reminder these sales were
included in the accretion calculation for the PHI transaction
11 2014 EEI Financial Conference
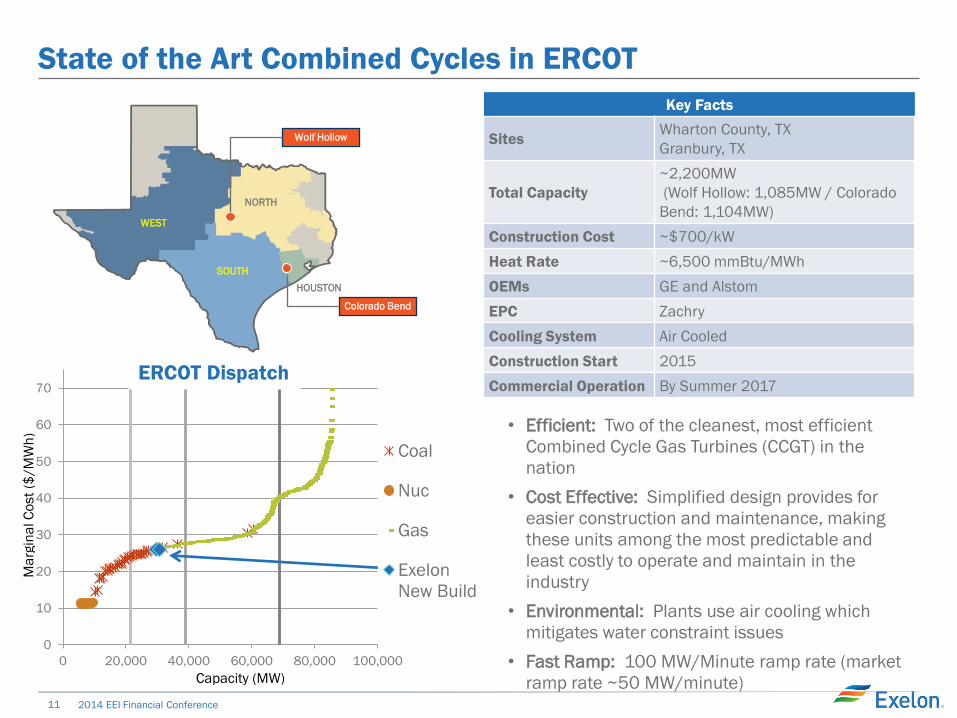
State of the Art Combined Cycles in ERCOT
• Efficient: Two of the cleanest, most efficient
Combined Cycle Gas Turbines (CCGT) in the
nation
• Cost Effective: Simplified design provides for
easier construction and maintenance, making
these units among the most predictable and
least costly to operate and maintain in the
industry
• Environmental: Plants use air cooling which
mitigates water constraint issues
• Fast Ramp: 100 MW/Minute ramp rate (market
ramp rate ~50 MW/minute)
WEST
SOUTH
NORTH
HOUSTON
Wolf Hollow
Colorado Bend
Key Facts
Sites Wharton County, TX
Granbury, TX
Total Capacity
~2,200MW
(Wolf Hollow: 1,085MW / Colorado
Bend: 1,104MW)
Construction Cost ~$700/kW
Heat Rate ~6,500 mmBtu/MWh
OEMs GE and Alstom
EPC Zachry
Cooling System Air Cooled
Construction Start 2015
Commercial Operation By Summer 2017
0
10
20
30
40
50
60
70
0 20,000 40,000 60,000 80,000 100,000
Coal
Nuc
Gas
Exelon
New Build
Ma
rgin
al C
ost
($/M
Wh
)
Capacity (MW)
ERCOT Dispatch
12 2014 EEI Financial Conference
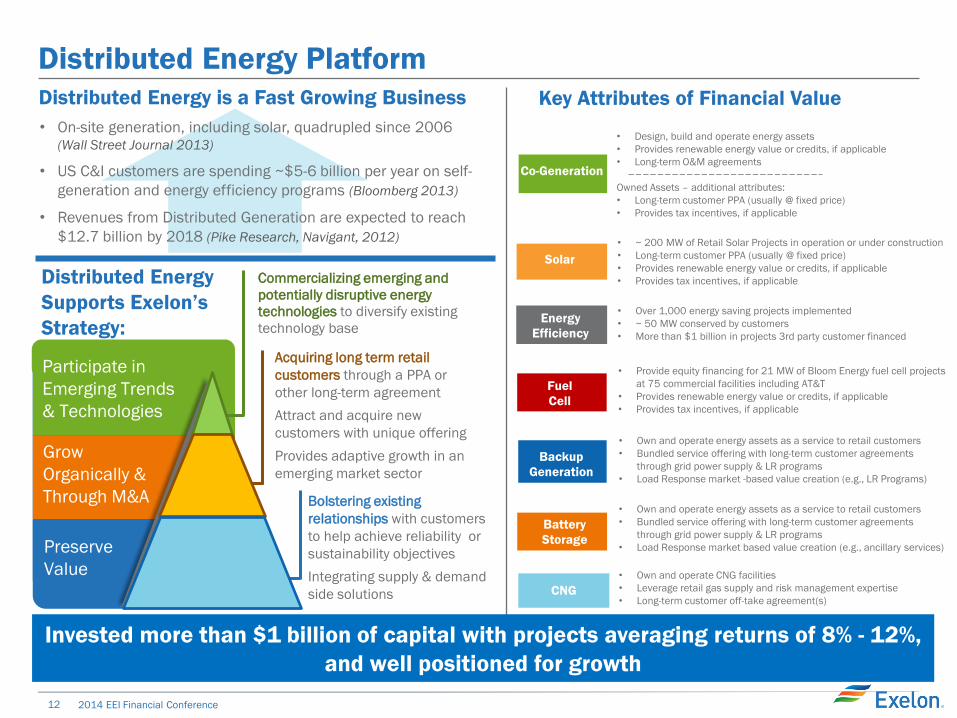
Distributed Energy Platform Distributed Energy is a Fast Growing Business
• On-site generation, including solar, quadrupled since 2006 (Wall Street Journal 2013)
• US C&I customers are spending ~$5-6 billion per year on self-
generation and energy efficiency programs (Bloomberg 2013)
• Revenues from Distributed Generation are expected to reach
$12.7 billion by 2018 (Pike Research, Navigant, 2012)
Distributed Energy
Supports Exelon’s
Strategy:
Grow
Organically &
Through M&A
Preserve
Value
Participate in
Emerging Trends
& Technologies
Commercializing emerging and
potentially disruptive energy
technologies to diversify existing
technology base
Acquiring long term retail
customers through a PPA or
other long-term agreement
Attract and acquire new
customers with unique offering
Provides adaptive growth in an
emerging market sector
Bolstering existing
relationships with customers
to help achieve reliability or
sustainability objectives
Integrating supply & demand
side solutions
Key Attributes of Financial Value
Backup
Generation
Battery
Storage
Co-Generation
Fuel
Cell
CNG
Solar
Energy
Efficiency
• Provide equity financing for 21 MW of Bloom Energy fuel cell projects
at 75 commercial facilities including AT&T
• Provides renewable energy value or credits, if applicable
• Provides tax incentives, if applicable
• Own and operate CNG facilities
• Leverage retail gas supply and risk management expertise
• Long-term customer off-take agreement(s)
• ~ 200 MW of Retail Solar Projects in operation or under construction
• Long-term customer PPA (usually @ fixed price)
• Provides renewable energy value or credits, if applicable
• Provides tax incentives, if applicable
• Over 1,000 energy saving projects implemented
• ~ 50 MW conserved by customers
• More than $1 billion in projects 3rd party customer financed
• Own and operate energy assets as a service to retail customers
• Bundled service offering with long-term customer agreements
through grid power supply & LR programs
• Load Response market -based value creation (e.g., LR Programs)
• Own and operate energy assets as a service to retail customers
• Bundled service offering with long-term customer agreements
through grid power supply & LR programs
• Load Response market based value creation (e.g., ancillary services)
• Design, build and operate energy assets
• Provides renewable energy value or credits, if applicable
• Long-term O&M agreements
Owned Assets – additional attributes:
• Long-term customer PPA (usually @ fixed price)
• Provides tax incentives, if applicable
Invested more than $1 billion of capital with projects averaging returns of 8% - 12%,
and well positioned for growth
Financial Update
14 2014 EEI Financial Conference
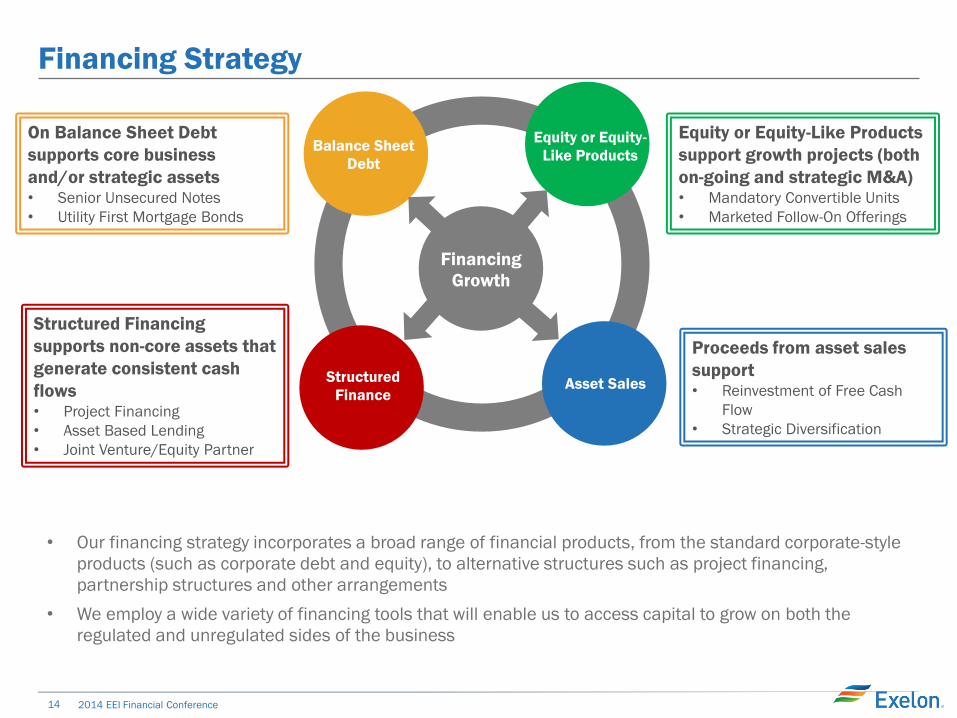
Financing Strategy
• Our financing strategy incorporates a broad range of financial products, from the standard corporate-style
products (such as corporate debt and equity), to alternative structures such as project financing,
partnership structures and other arrangements
• We employ a wide variety of financing tools that will enable us to access capital to grow on both the
regulated and unregulated sides of the business
Financing
Growth
Balance Sheet
Debt
Equity or Equity-
Like Products
Structured
Finance
On Balance Sheet Debt
supports core business
and/or strategic assets • Senior Unsecured Notes
• Utility First Mortgage Bonds
Equity or Equity-Like Products
support growth projects (both
on-going and strategic M&A) • Mandatory Convertible Units
• Marketed Follow-On Offerings
Structured Financing
supports non-core assets that
generate consistent cash
flows • Project Financing
• Asset Based Lending
• Joint Venture/Equity Partner
Asset Sales
Proceeds from asset sales
support • Reinvestment of Free Cash
Flow
• Strategic Diversification
15 2014 EEI Financial Conference
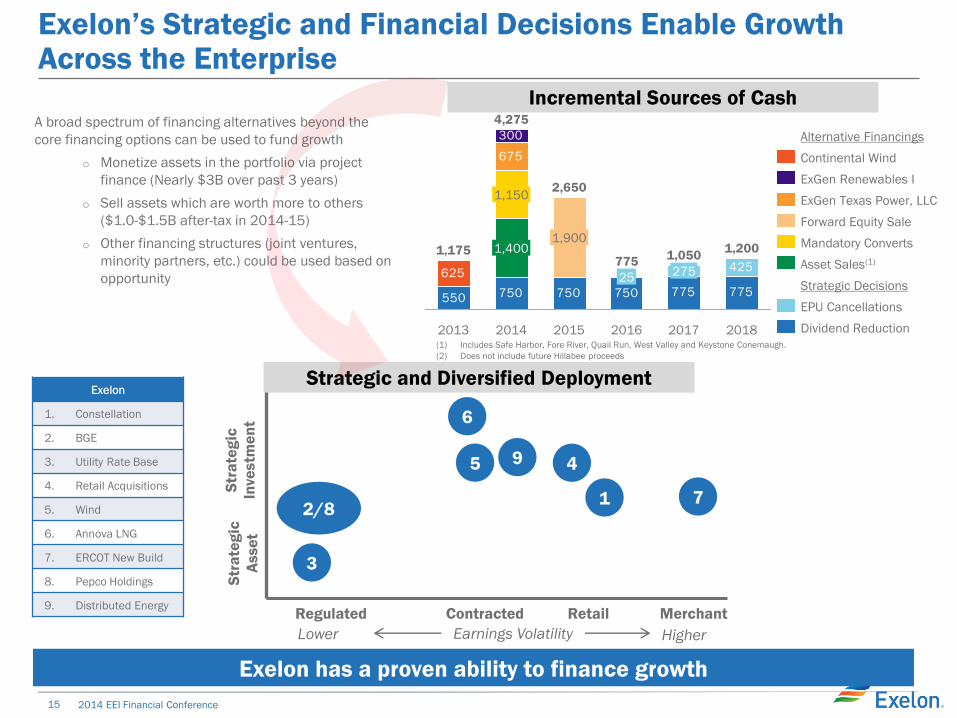
Exelon’s Strategic and Financial Decisions Enable Growth Across the Enterprise
Exelon has a proven ability to finance growth
A broad spectrum of financing alternatives beyond the
core financing options can be used to fund growth
o Monetize assets in the portfolio via project
finance (Nearly $3B over past 3 years)
o Sell assets which are worth more to others
($1.0-$1.5B after-tax in 2014-15)
o Other financing structures (joint ventures,
minority partners, etc.) could be used based on
opportunity
Incremental Sources of Cash
750 750 750 775 775550
425
675
300
625 275
2016
775
25
2015
2,650
1,900
2014 2018
1,200
2017
1,050
4,275
1,400
1,150
2013
1,175
Strategic and Diversified Deployment Exelon
1. Constellation
2. BGE
3. Utility Rate Base
4. Retail Acquisitions
5. Wind
6. Annova LNG
7. ERCOT New Build
8. Pepco Holdings
9. Distributed Energy
25
775
1,200
2018
425
2017
775
275
2016
775
750
1,050
2015
3,950
750
500
2,700
2014
2,650
750
900
700
300
2013
1,175
550
625
3
4
2/8 7
6
1
5
Str
ate
gic
Asse
t
Contracted Retail Regulated
Earnings Volatility Higher Lower
Str
ate
gic
Inve
stm
en
t
Merchant
Strategic Decisions
Dividend Reduction
Alternative Financings
Forward Equity Sale
Mandatory Converts
ExGen Texas Power, LLC
Asset Sales(1)
EPU Cancellations
ExGen Renewables I
Continental Wind
(1) Includes Safe Harbor, Fore River, Quail Run, West Valley and Keystone Conemaugh.
(2) Does not include future Hillabee proceeds
9
16 2014 EEI Financial Conference
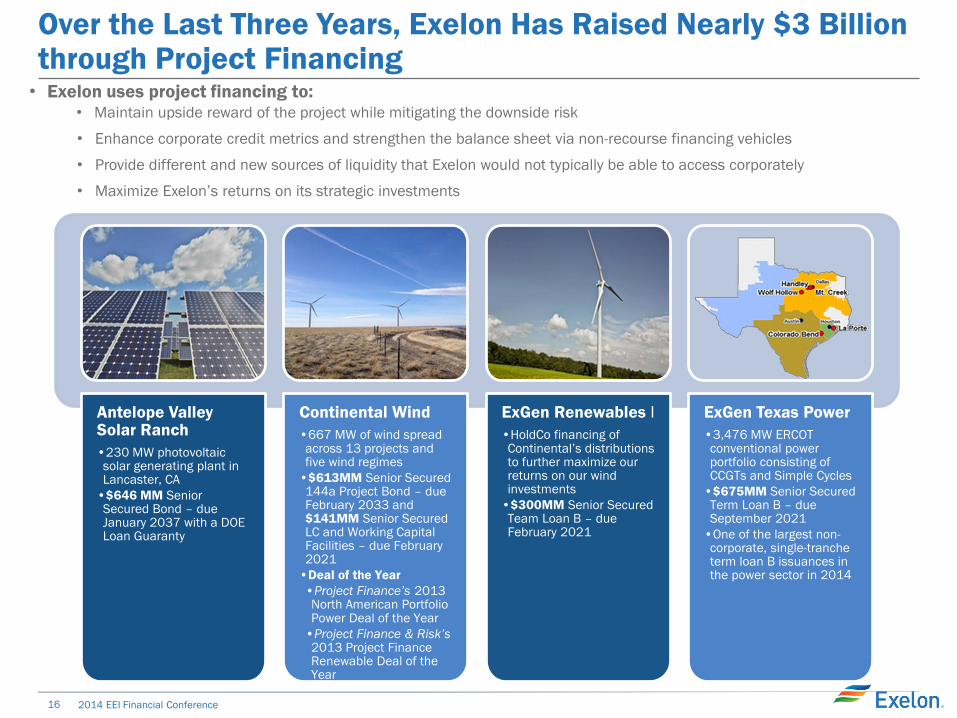
Over the Last Three Years, Exelon Has Raised Nearly $3 Billion through Project Financing
• Exelon uses project financing to: • Maintain upside reward of the project while mitigating the downside risk
• Enhance corporate credit metrics and strengthen the balance sheet via non-recourse financing vehicles
• Provide different and new sources of liquidity that Exelon would not typically be able to access corporately
• Maximize Exelon’s returns on its strategic investments
Antelope Valley Solar Ranch
•230 MW photovoltaic solar generating plant in Lancaster, CA
•$646 MM Senior Secured Bond – due January 2037 with a DOE Loan Guaranty
Continental Wind
•667 MW of wind spread across 13 projects and five wind regimes
•$613MM Senior Secured 144a Project Bond – due February 2033 and $141MM Senior Secured LC and Working Capital Facilities – due February 2021
•Deal of the Year
•Project Finance’s 2013 North American Portfolio Power Deal of the Year
•Project Finance & Risk’s 2013 Project Finance Renewable Deal of the Year
ExGen Renewables I
•HoldCo financing of Continental’s distributions to further maximize our returns on our wind investments
•$300MM Senior Secured Team Loan B – due February 2021
ExGen Texas Power
•3,476 MW ERCOT conventional power portfolio consisting of CCGTs and Simple Cycles
•$675MM Senior Secured Term Loan B – due September 2021
•One of the largest non-corporate, single-tranche term loan B issuances in the power sector in 2014
17 2014 EEI Financial Conference
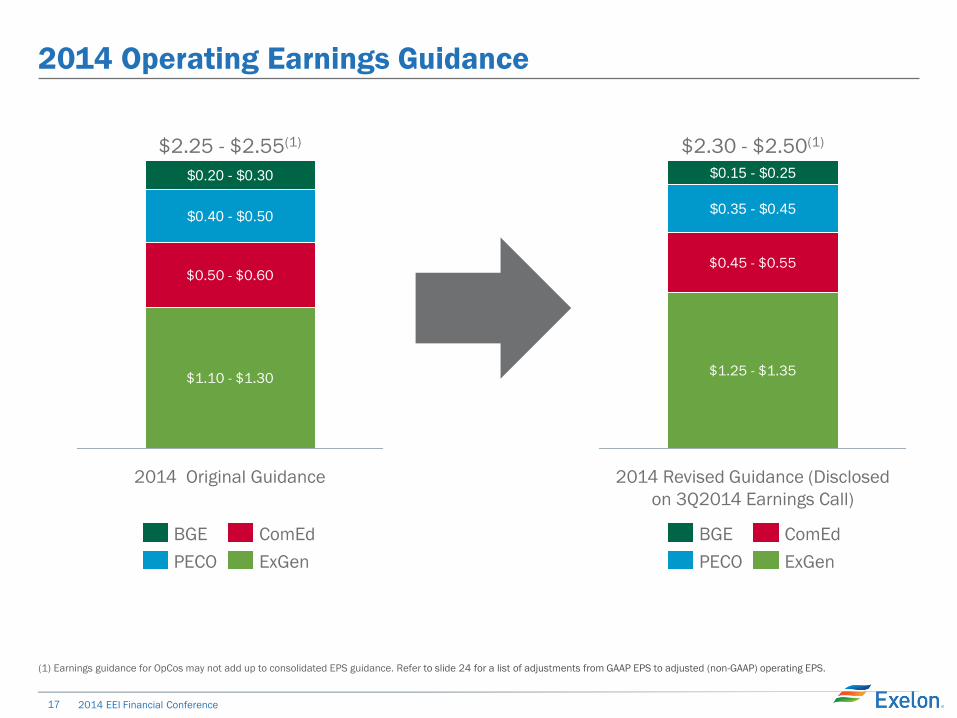
2014 Operating Earnings Guidance
2014 Original Guidance
$2.25 - $2.55(1)
$1.10 - $1.30
$0.50 - $0.60
$0.40 - $0.50
$0.20 - $0.30
ExGen
ComEd
PECO
BGE
2014 Revised Guidance (Disclosed
on 3Q2014 Earnings Call)
$2.30 - $2.50(1)
$1.25 - $1.35
$0.45 - $0.55
$0.35 - $0.45
$0.15 - $0.25
ExGen
ComEd
PECO
BGE
(1) Earnings guidance for OpCos may not add up to consolidated EPS guidance. Refer to slide 24 for a list of adjustments from GAAP EPS to adjusted (non-GAAP) operating EPS.
18 2014 EEI Financial Conference
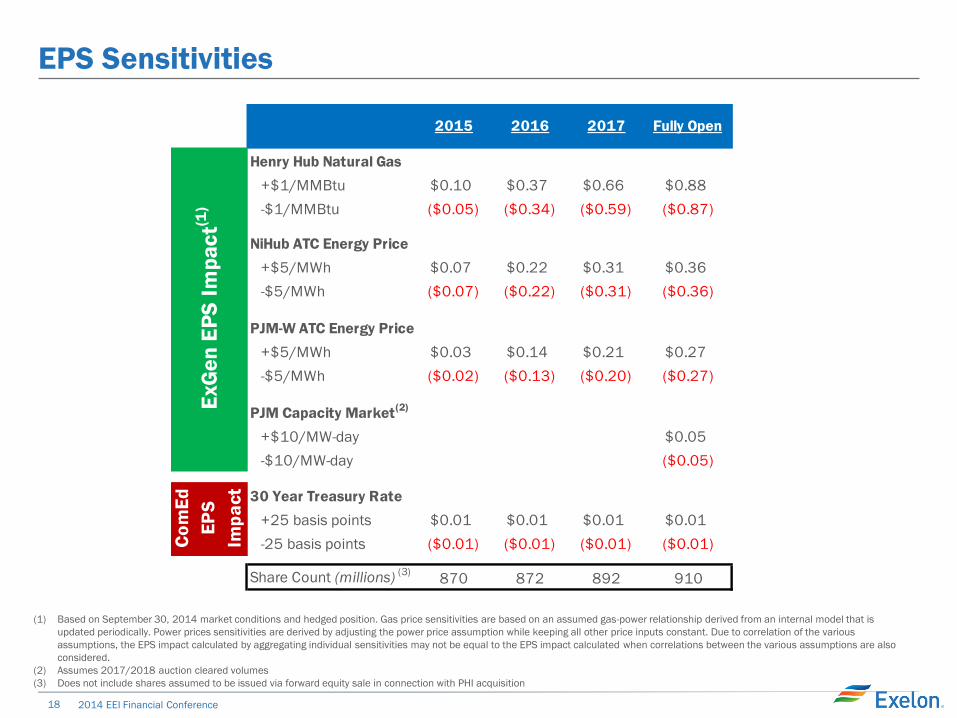
EPS Sensitivities
2015 2016 2017 Fully Open
Henry Hub Natural Gas
+$1/MMBtu $0.10 $0.37 $0.66 $0.88
-$1/MMBtu ($0.05) ($0.34) ($0.59) ($0.87)
NiHub ATC Energy Price
+$5/MWh $0.07 $0.22 $0.31 $0.36
-$5/MWh ($0.07) ($0.22) ($0.31) ($0.36)
PJM-W ATC Energy Price
+$5/MWh $0.03 $0.14 $0.21 $0.27
-$5/MWh ($0.02) ($0.13) ($0.20) ($0.27)
PJM Capacity Market(2)
+$10/MW-day $0.05
-$10/MW-day ($0.05)
30 Year Treasury Rate
+25 basis points $0.01 $0.01 $0.01 $0.01
-25 basis points ($0.01) ($0.01) ($0.01) ($0.01)
Share Count (millions)(3)
870 872 892 910
Co
mE
d
EP
S
Imp
ac
t
ExG
en
EP
S I
mp
ac
t(1)
(1) Based on September 30, 2014 market conditions and hedged position. Gas price sensitivities are based on an assumed gas-power relationship derived from an internal model that is
updated periodically. Power prices sensitivities are derived by adjusting the power price assumption while keeping all other price inputs constant. Due to correlation of the various
assumptions, the EPS impact calculated by aggregating individual sensitivities may not be equal to the EPS impact calculated when correlations between the various assumptions are also
considered.
(2) Assumes 2017/2018 auction cleared volumes
(3) Does not include shares assumed to be issued via forward equity sale in connection with PHI acquisition
19 2014 EEI Financial Conference
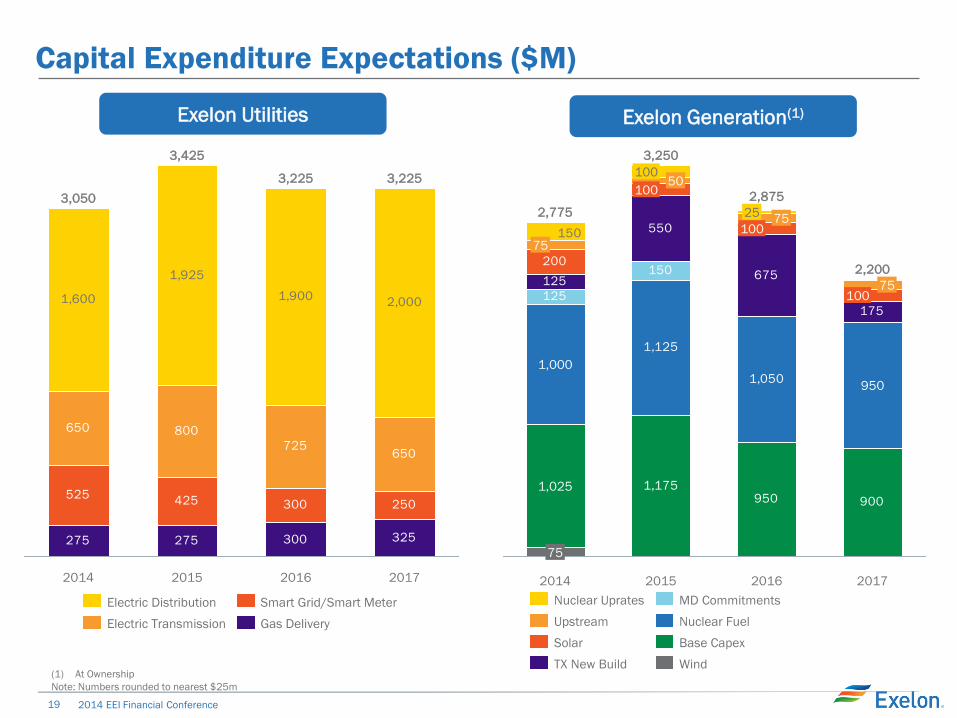
Capital Expenditure Expectations ($M)
Exelon Utilities Exelon Generation(1)
(1) At Ownership
Note: Numbers rounded to nearest $25m
275 275 300 325
525425 300 250
650 800
725650
1,600
1,925
1,9002,000
2016
3,225
2015
3,425
2014
3,050
2017
3,225
Gas Delivery
Smart Grid/Smart Meter
Electric Transmission
Electric Distribution
1,175950 900
1,125
1,050
550
675
175
125
150125
200
150
3,250
100 50
100
2014
2,775
75
1,025
1,000
950
100 75
2016
2,875
100 75
25
2015
2,200
2017
75
Wind
Base Capex
Nuclear Fuel
MD Commitments
TX New Build
Solar
Upstream
Nuclear Uprates
20 2014 EEI Financial Conference
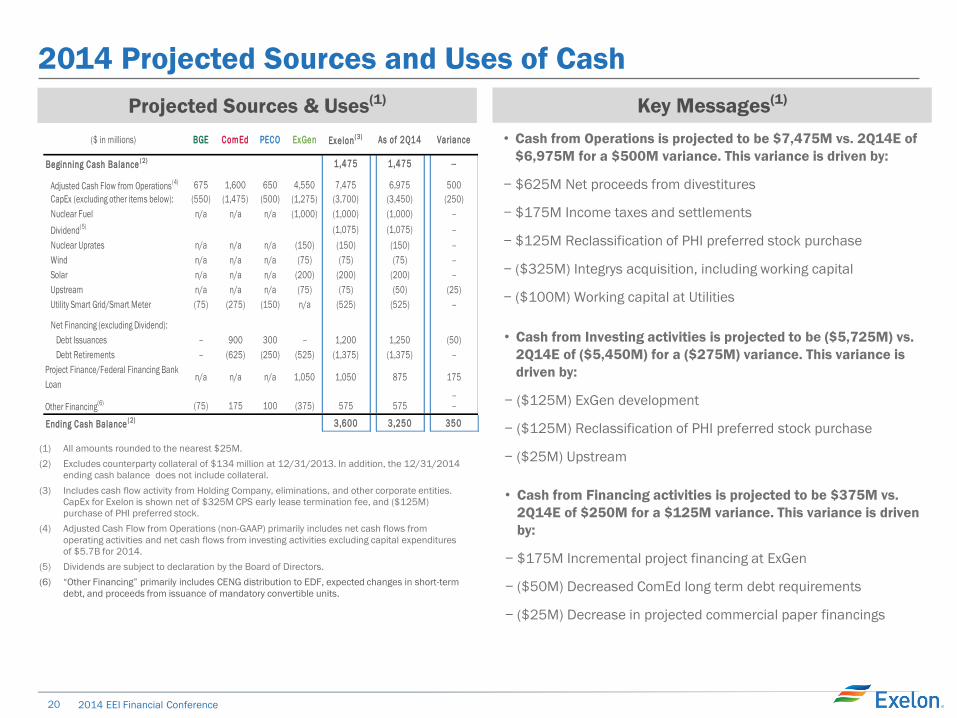
2014 Projected Sources and Uses of Cash
Key Messages(1)
• Cash from Operations is projected to be $7,475M vs. 2Q14E of
$6,975M for a $500M variance. This variance is driven by:
− $625M Net proceeds from divestitures
− $175M Income taxes and settlements
− $125M Reclassification of PHI preferred stock purchase
− ($325M) Integrys acquisition, including working capital
− ($100M) Working capital at Utilities
• Cash from Financing activities is projected to be $375M vs.
2Q14E of $250M for a $125M variance. This variance is driven
by:
− $175M Incremental project financing at ExGen
− ($50M) Decreased ComEd long term debt requirements
− ($25M) Decrease in projected commercial paper financings
• Cash from Investing activities is projected to be ($5,725M) vs.
2Q14E of ($5,450M) for a ($275M) variance. This variance is
driven by:
− ($125M) ExGen development
− ($125M) Reclassification of PHI preferred stock purchase
− ($25M) Upstream
Projected Sources & Uses(1)
(1) All amounts rounded to the nearest $25M.
(2) Excludes counterparty collateral of $134 million at 12/31/2013. In addition, the 12/31/2014
ending cash balance does not include collateral.
(3) Includes cash flow activity from Holding Company, eliminations, and other corporate entities.
CapEx for Exelon is shown net of $325M CPS early lease termination fee, and ($125M)
purchase of PHI preferred stock.
(4) Adjusted Cash Flow from Operations (non-GAAP) primarily includes net cash flows from
operating activities and net cash flows from investing activities excluding capital expenditures
of $5.7B for 2014.
(5) Dividends are subject to declaration by the Board of Directors.
(6) “Other Financing” primarily includes CENG distribution to EDF, expected changes in short-term
debt, and proceeds from issuance of mandatory convertible units.
($ in millions) BGE ComEd PECO ExGen Exelon( 3) As of 2Q14 Variance
Beginning Cash Balance( 2) 1,475 1,475 --
Adjusted Cash Flow from Operations(4) 675 1,600 650 4,550 7,475 6,975 500
CapEx (excluding other items below): (550) (1,475) (500) (1,275) (3,700) (3,450) (250)
Nuclear Fuel n/a n/a n/a (1,000) (1,000) (1,000) --
Dividend(5) (1,075) (1,075) --
Nuclear Uprates n/a n/a n/a (150) (150) (150) --
Wind n/a n/a n/a (75) (75) (75) --
Solar n/a n/a n/a (200) (200) (200) --
Upstream n/a n/a n/a (75) (75) (50) (25)
Utility Smart Grid/Smart Meter (75) (275) (150) n/a (525) (525) --
Net Financing (excluding Dividend):
Debt Issuances -- 900 300 -- 1,200 1,250 (50)
Debt Retirements -- (625) (250) (525) (1,375) (1,375) --
Project Finance/Federal Financing Bank
Loann/a n/a n/a 1,050 1,050 875 175
--Other Financing
(6) (75) 175 100 (375) 575 575 --
Ending Cash Balance( 2) 3,600 3,250 350
21 2014 EEI Financial Conference
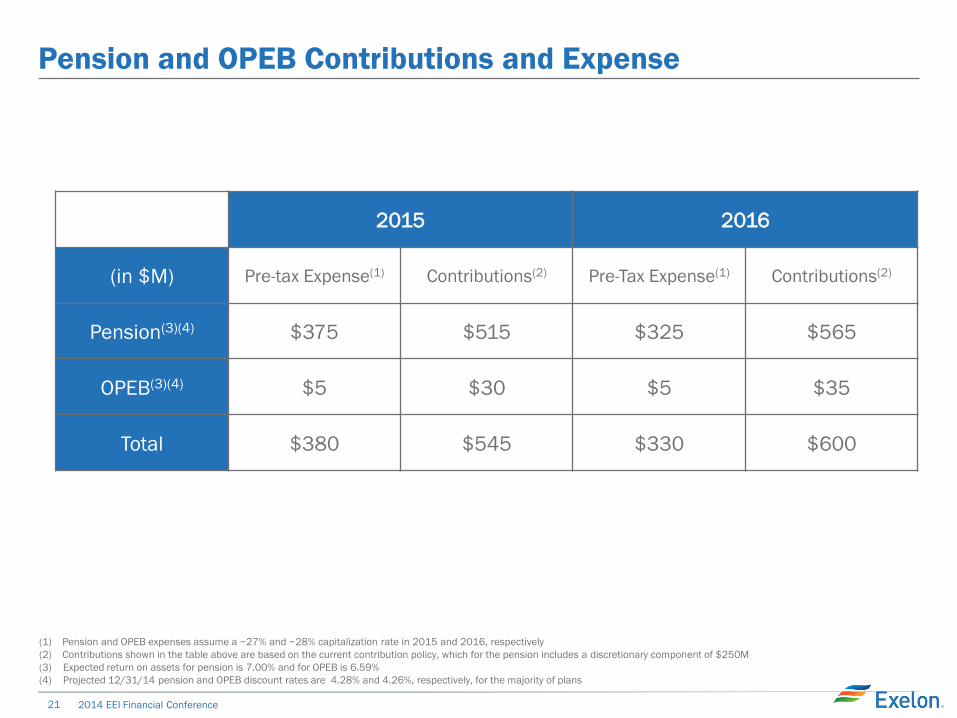
Pension and OPEB Contributions and Expense
2015 2016
(in $M) Pre-tax Expense(1) Contributions(2) Pre-Tax Expense(1) Contributions(2)
Pension(3)(4) $375 $515 $325 $565
OPEB(3)(4) $5 $30 $5 $35
Total $380 $545 $330 $600
(1) Pension and OPEB expenses assume a ~27% and ~28% capitalization rate in 2015 and 2016, respectively
(2) Contributions shown in the table above are based on the current contribution policy, which for the pension includes a discretionary component of $250M
(3) Expected return on assets for pension is 7.00% and for OPEB is 6.59%
(4) Projected 12/31/14 pension and OPEB discount rates are 4.28% and 4.26%, respectively, for the majority of plans
22 2014 EEI Financial Conference
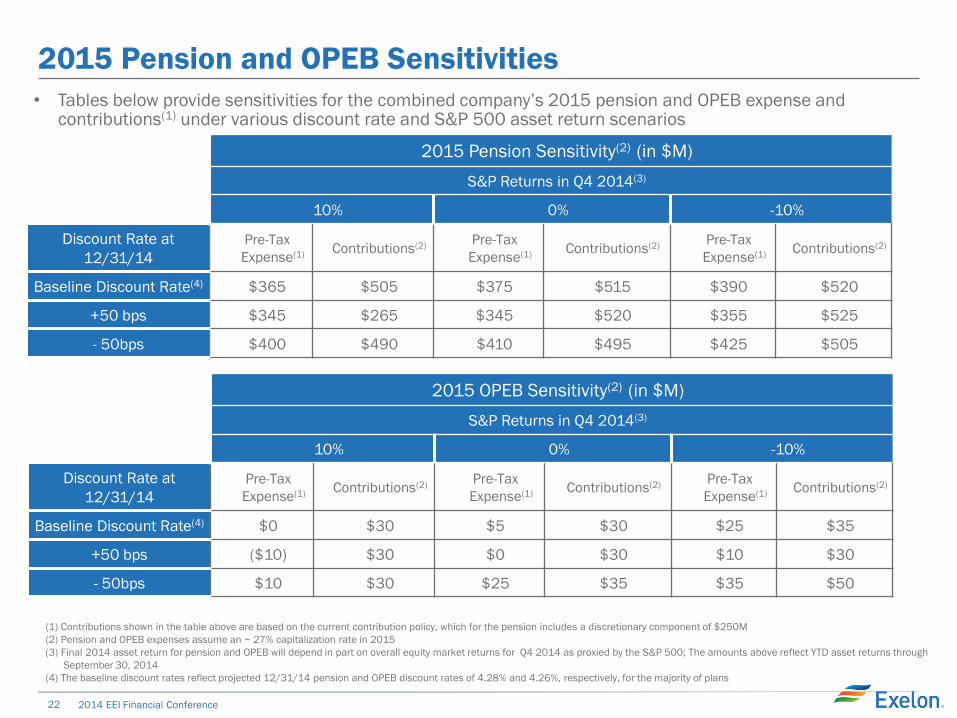
2015 Pension and OPEB Sensitivities
• Tables below provide sensitivities for the combined company’s 2015 pension and OPEB expense and contributions(1) under various discount rate and S&P 500 asset return scenarios
(1) Contributions shown in the table above are based on the current contribution policy, which for the pension includes a discretionary component of $250M
(2) Pension and OPEB expenses assume an ~ 27% capitalization rate in 2015
(3) Final 2014 asset return for pension and OPEB will depend in part on overall equity market returns for Q4 2014 as proxied by the S&P 500; The amounts above reflect YTD asset returns through
September 30, 2014
(4) The baseline discount rates reflect projected 12/31/14 pension and OPEB discount rates of 4.28% and 4.26%, respectively, for the majority of plans
2015 Pension Sensitivity(2) (in $M)
S&P Returns in Q4 2014(3)
10% 0% -10%
Discount Rate at
12/31/14
Pre-Tax
Expense(1) Contributions(2)
Pre-Tax
Expense(1) Contributions(2)
Pre-Tax
Expense(1) Contributions(2)
Baseline Discount Rate(4) $365 $505 $375 $515 $390 $520
+50 bps $345 $265 $345 $520 $355 $525
- 50bps $400 $490 $410 $495 $425 $505
2015 OPEB Sensitivity(2) (in $M)
S&P Returns in Q4 2014(3)
10% 0% -10%
Discount Rate at
12/31/14
Pre-Tax
Expense(1) Contributions(2)
Pre-Tax
Expense(1) Contributions(2)
Pre-Tax
Expense(1) Contributions(2)
Baseline Discount Rate(4) $0 $30 $5 $30 $25 $35
+50 bps ($10) $30 $0 $30 $10 $30
- 50bps $10 $30 $25 $35 $35 $50
23 2014 EEI Financial Conference
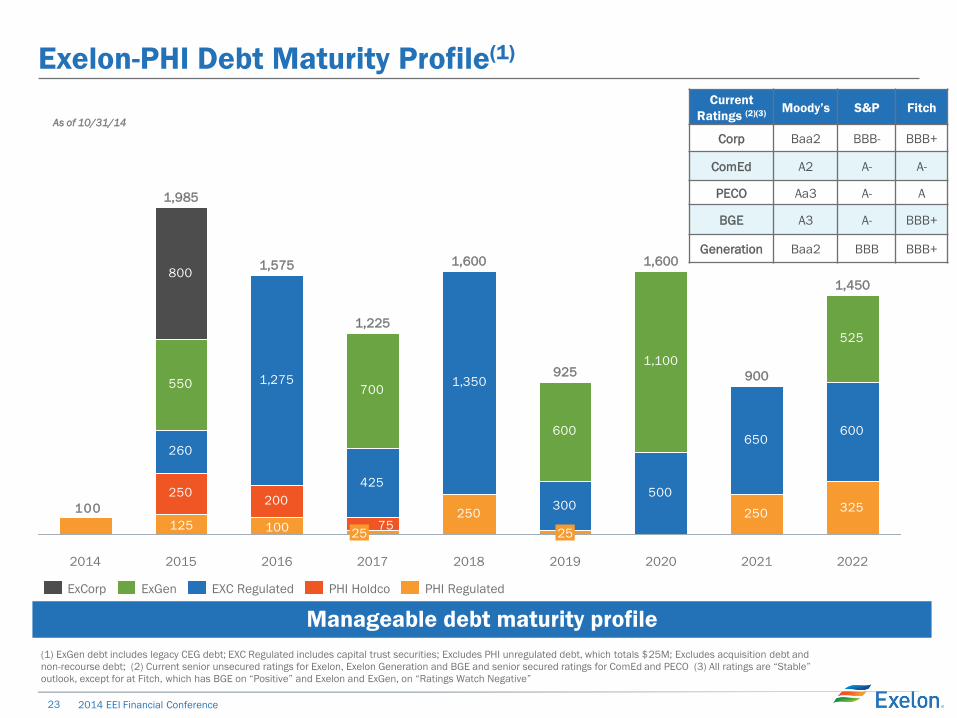
Exelon-PHI Debt Maturity Profile(1)
250 250325
260
1,275
425
1,350
300500
650600
550700
600
1,100
525
100125
100
75
200250
800
2022
1,450
2016
1,575
2015
1,985
2014 2021
900
2020
1,600
2019
925
25
2018
1,600
2017
1,225
25
ExCorp PHI Holdco PHI Regulated EXC Regulated ExGen
(1) ExGen debt includes legacy CEG debt; EXC Regulated includes capital trust securities; Excludes PHI unregulated debt, which totals $25M; Excludes acquisition debt and
non-recourse debt; (2) Current senior unsecured ratings for Exelon, Exelon Generation and BGE and senior secured ratings for ComEd and PECO (3) All ratings are “Stable”
outlook, except for at Fitch, which has BGE on “Positive” and Exelon and ExGen, on “Ratings Watch Negative”
As of 10/31/14
Manageable debt maturity profile
Current
Ratings (2)(3) Moody’s S&P Fitch
Corp Baa2 BBB- BBB+
ComEd A2 A- A-
PECO Aa3 A- A
BGE A3 A- BBB+
Generation Baa2 BBB BBB+
24 2014 EEI Financial Conference
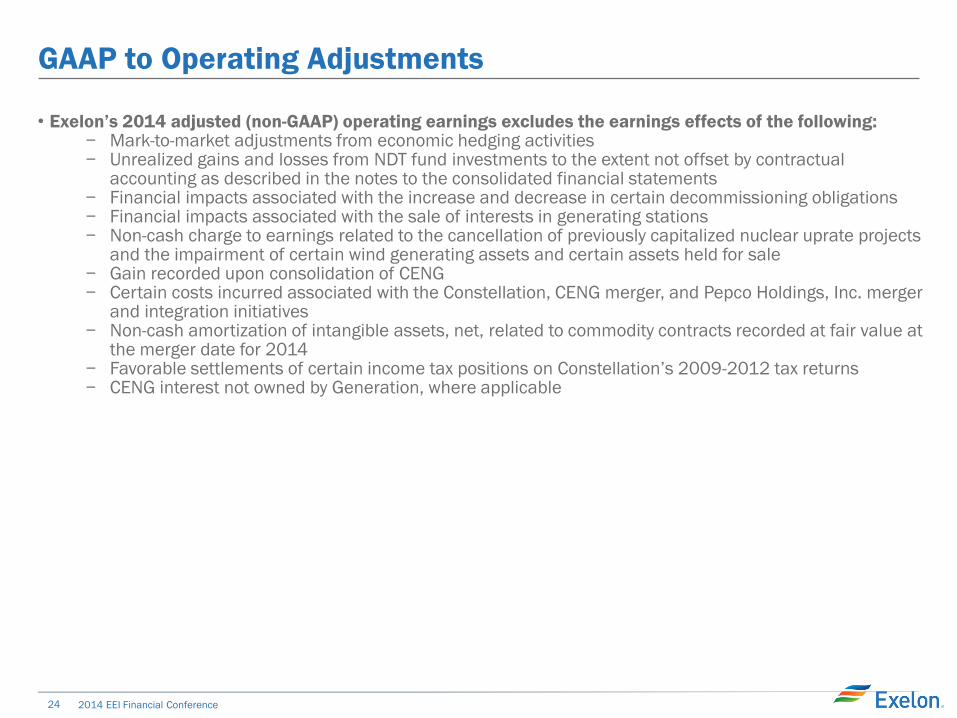
GAAP to Operating Adjustments
• Exelon’s 2014 adjusted (non-GAAP) operating earnings excludes the earnings effects of the following: − Mark-to-market adjustments from economic hedging activities − Unrealized gains and losses from NDT fund investments to the extent not offset by contractual
accounting as described in the notes to the consolidated financial statements − Financial impacts associated with the increase and decrease in certain decommissioning obligations − Financial impacts associated with the sale of interests in generating stations − Non-cash charge to earnings related to the cancellation of previously capitalized nuclear uprate projects
and the impairment of certain wind generating assets and certain assets held for sale − Gain recorded upon consolidation of CENG − Certain costs incurred associated with the Constellation, CENG merger, and Pepco Holdings, Inc. merger
and integration initiatives − Non-cash amortization of intangible assets, net, related to commodity contracts recorded at fair value at
the merger date for 2014 − Favorable settlements of certain income tax positions on Constellation’s 2009-2012 tax returns − CENG interest not owned by Generation, where applicable
Exelon Utilities
26 2014 EEI Financial Conference
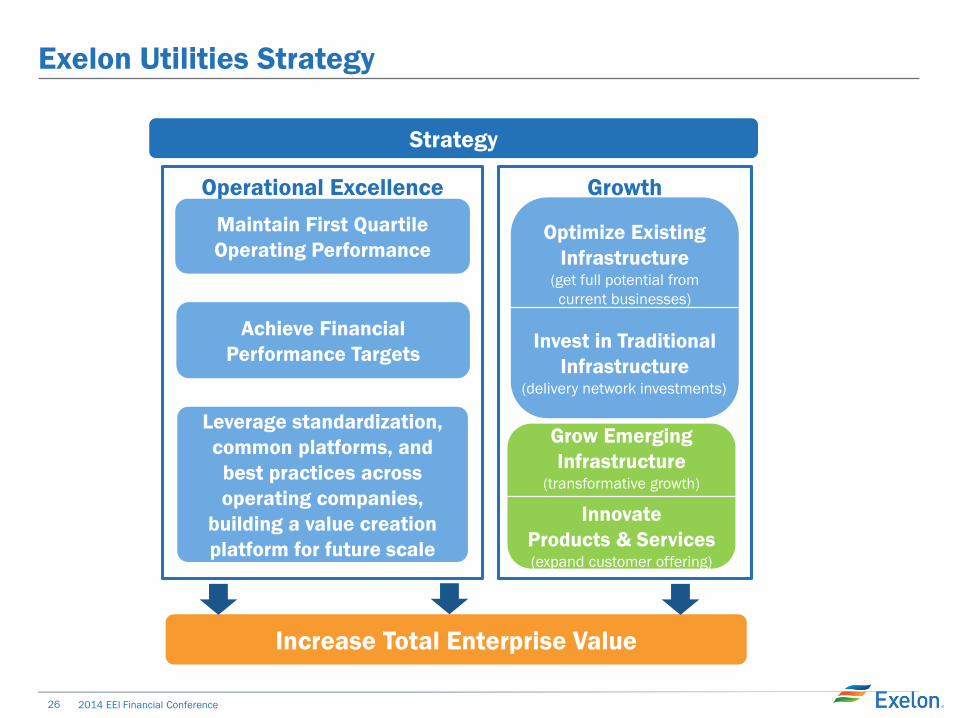
Exelon Utilities Strategy
Strategy
Increase Total Enterprise Value
Maintain First Quartile
Operating Performance
Achieve Financial
Performance Targets
Leverage standardization,
common platforms, and
best practices across
operating companies,
building a value creation
platform for future scale
Optimize Existing
Infrastructure (get full potential from
current businesses)
Invest in Traditional
Infrastructure (delivery network investments)
Grow Emerging
Infrastructure (transformative growth)
Innovate
Products & Services (expand customer offering)
Operational Excellence Growth
27 2014 EEI Financial Conference
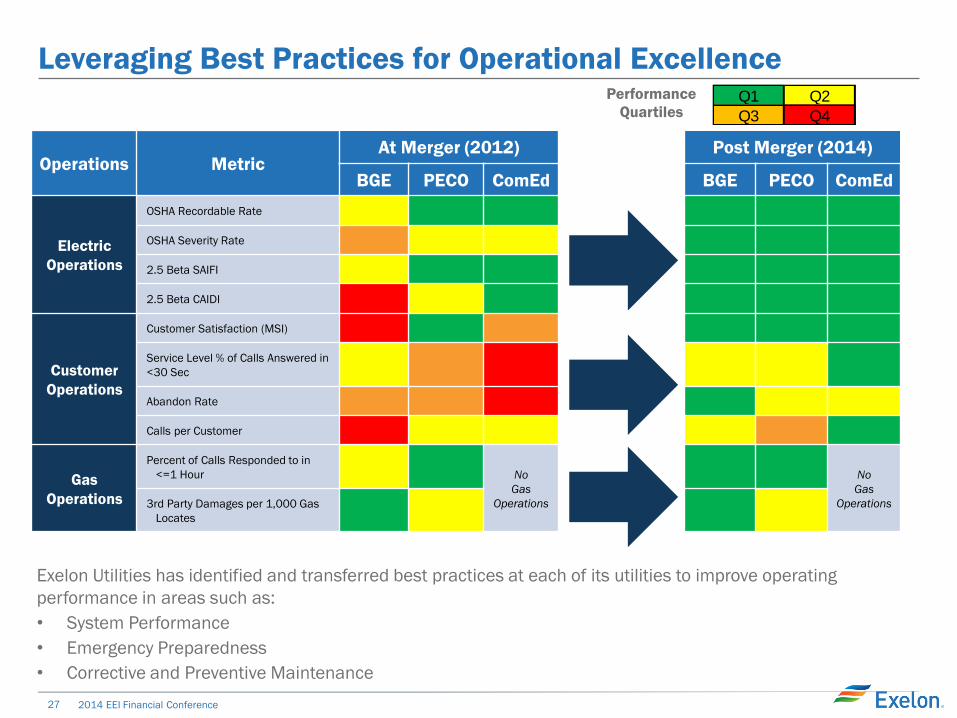
Leveraging Best Practices for Operational Excellence
Operations Metric At Merger (2012) Post Merger (2014)
BGE PECO ComEd BGE PECO ComEd
Electric
Operations
OSHA Recordable Rate
OSHA Severity Rate
2.5 Beta SAIFI
2.5 Beta CAIDI
Customer
Operations
Customer Satisfaction (MSI)
Service Level % of Calls Answered in
<30 Sec
Abandon Rate
Calls per Customer
Gas
Operations
Percent of Calls Responded to in
<=1 Hour No
Gas
Operations
No
Gas
Operations 3rd Party Damages per 1,000 Gas
Locates
Q1 Q2
Q3 Q4
Performance
Quartiles
Exelon Utilities has identified and transferred best practices at each of its utilities to improve operating
performance in areas such as:
• System Performance
• Emergency Preparedness
• Corrective and Preventive Maintenance
28 2014 EEI Financial Conference
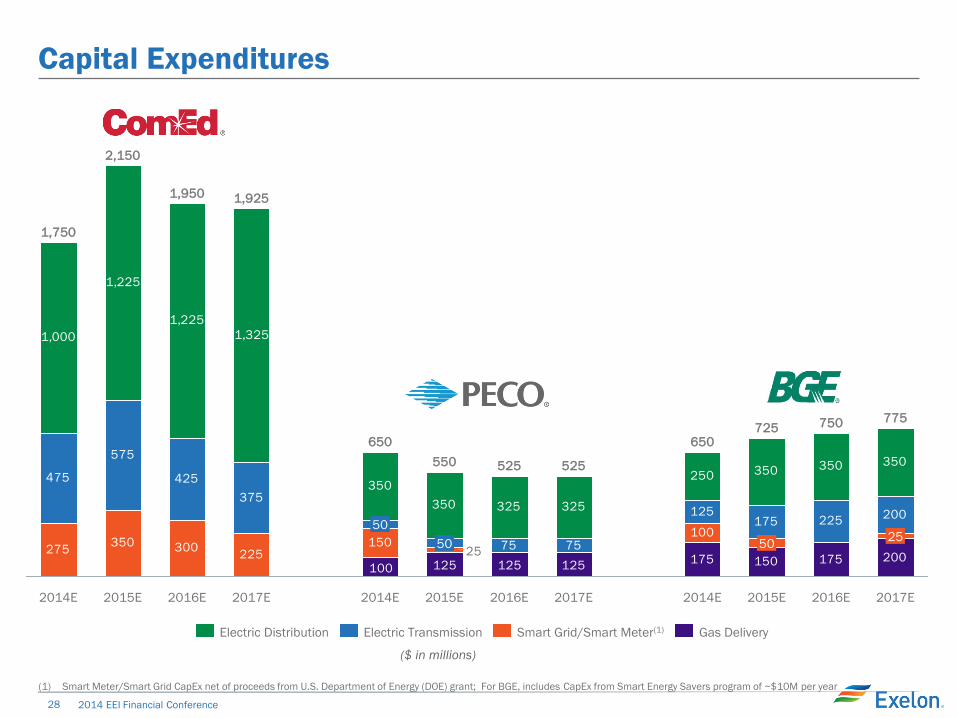
Capital Expenditures
(1) Smart Meter/Smart Grid CapEx net of proceeds from U.S. Department of Energy (DOE) grant; For BGE, includes CapEx from Smart Energy Savers program of ~$10M per year
175 150 175 200275
350 300225
150100
475
575
425
375
75 75
125175 225
200
1,000
1,225
1,225
1,325
350
350 325 325
250 350 350 350
125125125100
25
2017E
775
25
2016E
750
2015E
725
50
2014E
650
2017E
525
2016E
525
2015E
550
50
2014E
650
50
2017E
1,925
2016E
1,950
2015E
2,150
2014E
1,750
Gas Delivery Electric Transmission Smart Grid/Smart Meter(1) Electric Distribution
($ in millions)
29 2014 EEI Financial Conference
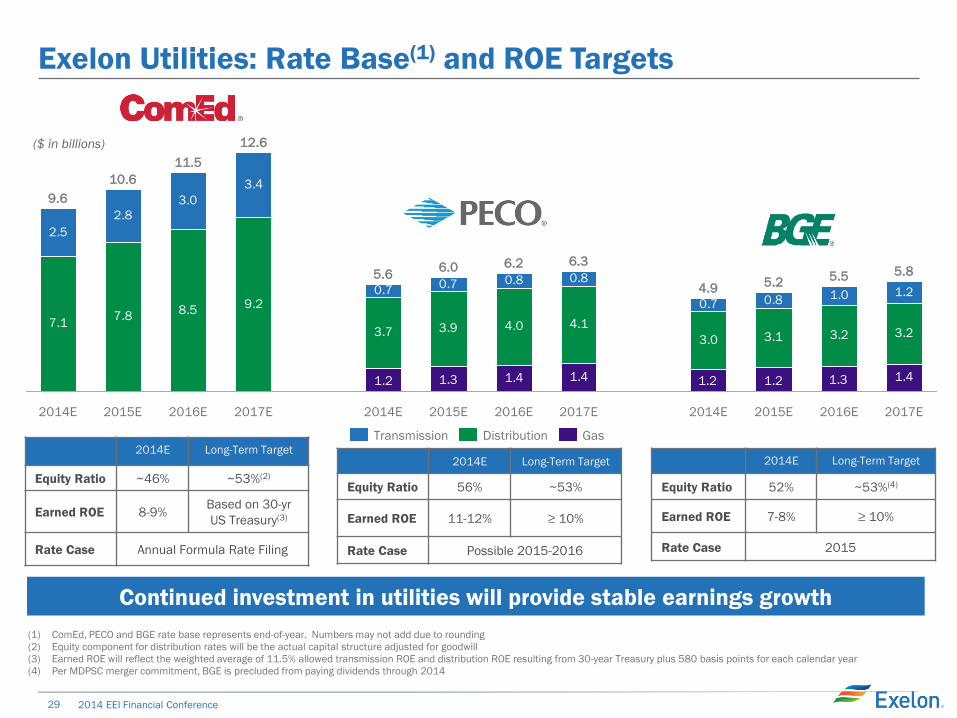
Exelon Utilities: Rate Base(1) and ROE Targets
2014E Long-Term Target
Equity Ratio 52% ~53%(4)
Earned ROE 7-8% ≥ 10%
Rate Case 2015
2014E Long-Term Target
Equity Ratio ~46% ~53%(2)
Earned ROE 8-9% Based on 30-yr
US Treasury(3)
Rate Case Annual Formula Rate Filing
Continued investment in utilities will provide stable earnings growth
($ in billions)
(1) ComEd, PECO and BGE rate base represents end-of-year. Numbers may not add due to rounding
(2) Equity component for distribution rates will be the actual capital structure adjusted for goodwill
(3) Earned ROE will reflect the weighted average of 11.5% allowed transmission ROE and distribution ROE resulting from 30-year Treasury plus 580 basis points for each calendar year
(4) Per MDPSC merger commitment, BGE is precluded from paying dividends through 2014
2014E Long-Term Target
Equity Ratio 56% ~53%
Earned ROE 11-12% ≥ 10%
Rate Case Possible 2015-2016
1.4 1.4 1.4
7.17.8
8.59.2
3.7 3.9 4.0 4.1
3.0 3.1 3.2 3.2
2.5
2.8
3.0
3.4
0.70.7 0.8 0.8
0.7 0.8 1.0 1.2
1.31.21.21.31.2
5.5
2015E 2017E
5.8
2016E
5.2
2014E
4.9
2017E
6.3
2014E
9.6
2016E
6.2
2015E
6.0
2014E
5.6
2017E
12.6
2016E
11.5
2015E
10.6
Gas Distribution Transmission
30 2014 EEI Financial Conference
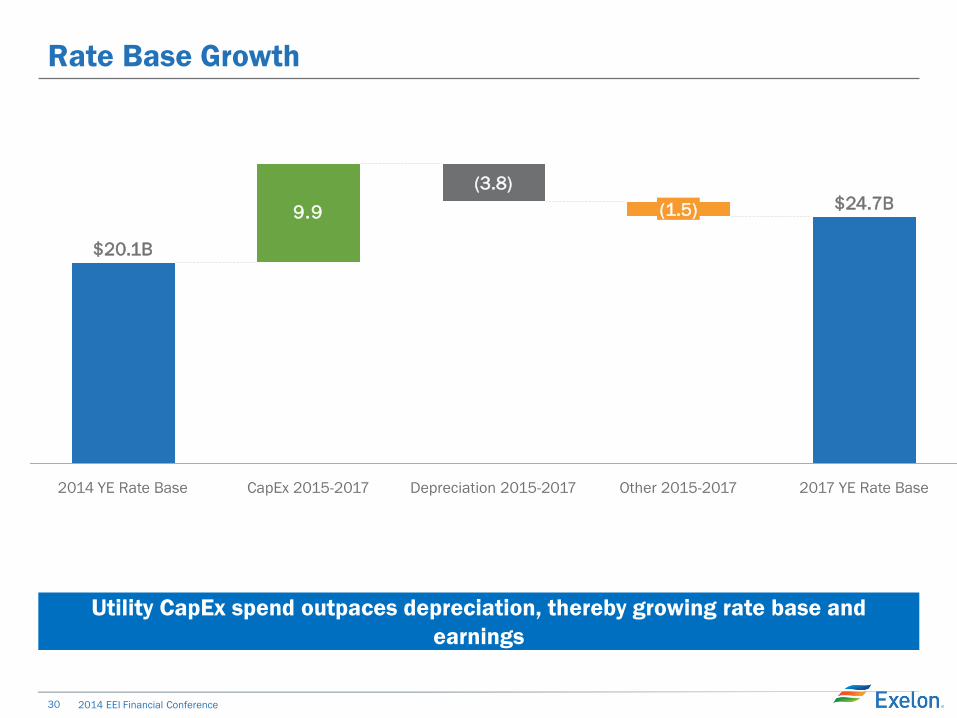
9.9
2017 YE Rate Base Other 2015-2017
$24.7B (1.5)
Depreciation 2015-2017
(3.8)
CapEx 2015-2017 2014 YE Rate Base
$20.1B
Rate Base Growth
Utility CapEx spend outpaces depreciation, thereby growing rate base and
earnings
31 2014 EEI Financial Conference
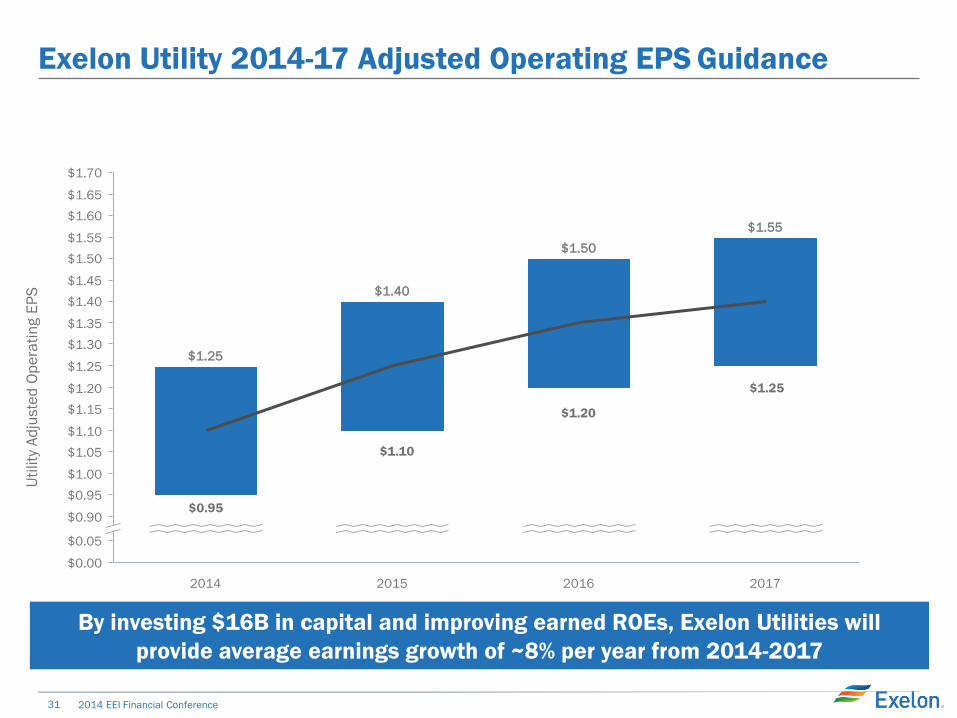
Exelon Utility 2014-17 Adjusted Operating EPS Guidance
$1.40
$0.95
$1.00
$1.45
$1.55
$1.60
$1.15
$1.35
$0.90
$0.05
$1.30
$1.10
$1.25
$1.20
$0.00
$1.05
$1.65
$1.50
$1.70
$1.55
$1.50
$1.40
2016 2017 2014
$1.25
2015
$1.25
$1.20
$0.95
Uti
lity
Ad
juste
d O
pe
rati
ng E
PS
By investing $16B in capital and improving earned ROEs, Exelon Utilities will
provide average earnings growth of ~8% per year from 2014-2017
$1.10
32 2014 EEI Financial Conference
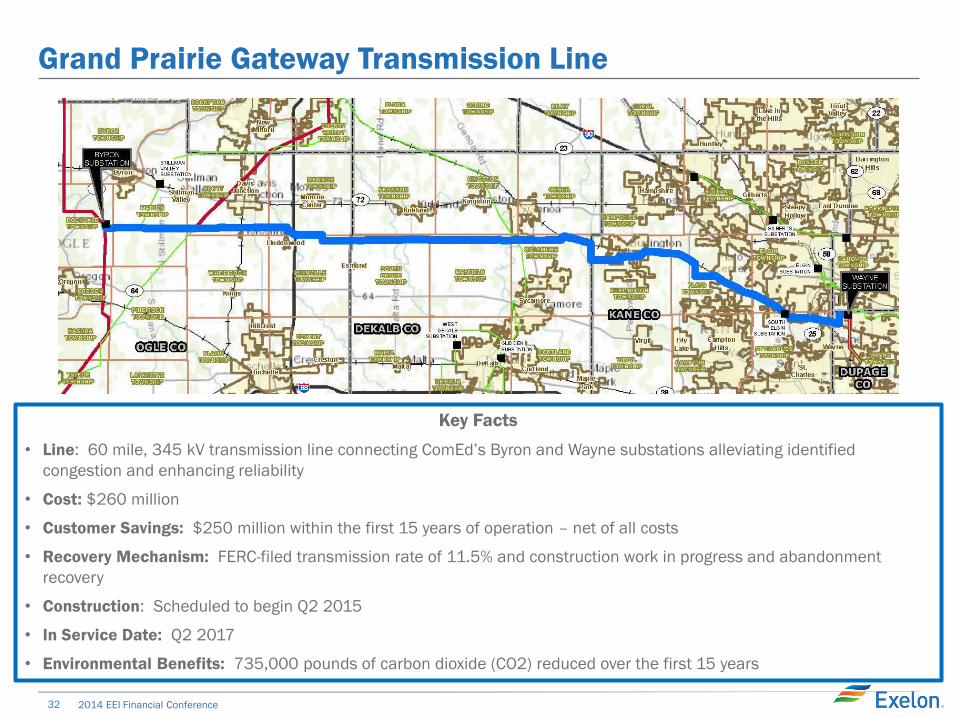
Grand Prairie Gateway Transmission Line
Key Facts
• Line: 60 mile, 345 kV transmission line connecting ComEd’s Byron and Wayne substations alleviating identified
congestion and enhancing reliability
• Cost: $260 million
• Customer Savings: $250 million within the first 15 years of operation – net of all costs
• Recovery Mechanism: FERC-filed transmission rate of 11.5% and construction work in progress and abandonment
recovery
• Construction: Scheduled to begin Q2 2015
• In Service Date: Q2 2017
• Environmental Benefits: 735,000 pounds of carbon dioxide (CO2) reduced over the first 15 years
33 2014 EEI Financial Conference
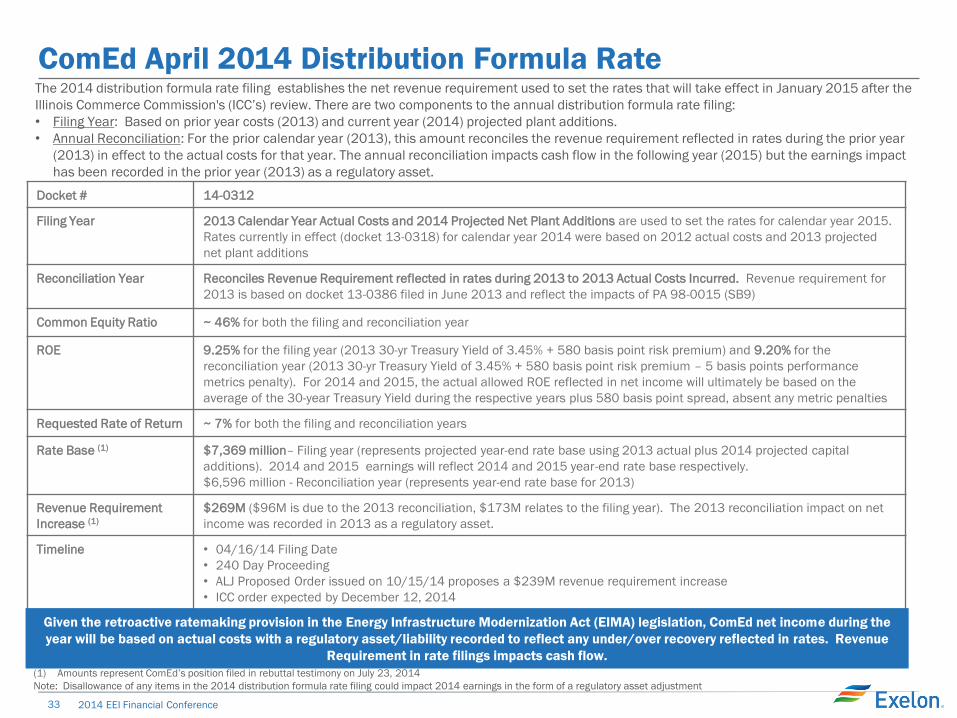
ComEd April 2014 Distribution Formula Rate
Docket # 14-0312
Filing Year 2013 Calendar Year Actual Costs and 2014 Projected Net Plant Additions are used to set the rates for calendar year 2015.
Rates currently in effect (docket 13-0318) for calendar year 2014 were based on 2012 actual costs and 2013 projected
net plant additions
Reconciliation Year Reconciles Revenue Requirement reflected in rates during 2013 to 2013 Actual Costs Incurred. Revenue requirement for
2013 is based on docket 13-0386 filed in June 2013 and reflect the impacts of PA 98-0015 (SB9)
Common Equity Ratio ~ 46% for both the filing and reconciliation year
ROE 9.25% for the filing year (2013 30-yr Treasury Yield of 3.45% + 580 basis point risk premium) and 9.20% for the
reconciliation year (2013 30-yr Treasury Yield of 3.45% + 580 basis point risk premium – 5 basis points performance
metrics penalty). For 2014 and 2015, the actual allowed ROE reflected in net income will ultimately be based on the
average of the 30-year Treasury Yield during the respective years plus 580 basis point spread, absent any metric penalties
Requested Rate of Return ~ 7% for both the filing and reconciliation years
Rate Base (1) $7,369 million– Filing year (represents projected year-end rate base using 2013 actual plus 2014 projected capital
additions). 2014 and 2015 earnings will reflect 2014 and 2015 year-end rate base respectively.
$6,596 million - Reconciliation year (represents year-end rate base for 2013)
Revenue Requirement
Increase (1)
$269M ($96M is due to the 2013 reconciliation, $173M relates to the filing year). The 2013 reconciliation impact on net
income was recorded in 2013 as a regulatory asset.
Timeline • 04/16/14 Filing Date
• 240 Day Proceeding
• ALJ Proposed Order issued on 10/15/14 proposes a $239M revenue requirement increase
• ICC order expected by December 12, 2014
(1) Amounts represent ComEd’s position filed in rebuttal testimony on July 23, 2014
Note: Disallowance of any items in the 2014 distribution formula rate filing could impact 2014 earnings in the form of a regulatory asset adjustment
The 2014 distribution formula rate filing establishes the net revenue requirement used to set the rates that will take effect in January 2015 after the
Illinois Commerce Commission's (ICC’s) review. There are two components to the annual distribution formula rate filing:
• Filing Year: Based on prior year costs (2013) and current year (2014) projected plant additions.
• Annual Reconciliation: For the prior calendar year (2013), this amount reconciles the revenue requirement reflected in rates during the prior year
(2013) in effect to the actual costs for that year. The annual reconciliation impacts cash flow in the following year (2015) but the earnings impact
has been recorded in the prior year (2013) as a regulatory asset.
Given the retroactive ratemaking provision in the Energy Infrastructure Modernization Act (EIMA) legislation, ComEd net income during the
year will be based on actual costs with a regulatory asset/liability recorded to reflect any under/over recovery reflected in rates. Revenue
Requirement in rate filings impacts cash flow.
34 2014 EEI Financial Conference
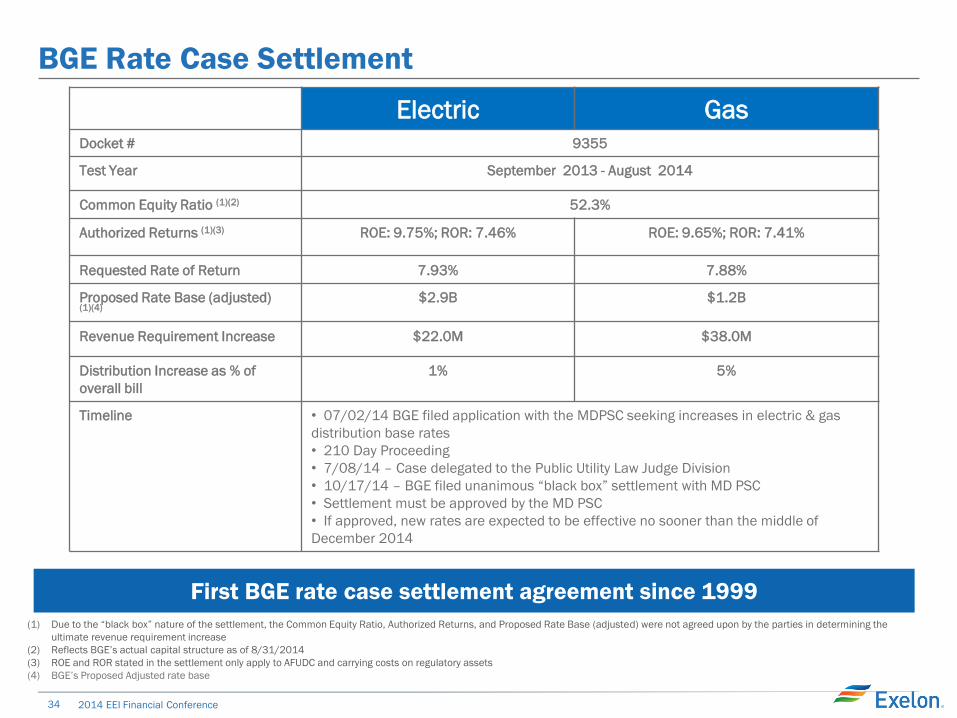
BGE Rate Case Settlement
Electric Gas
Docket # 9355
Test Year September 2013 - August 2014
Common Equity Ratio (1)(2) 52.3%
Authorized Returns (1)(3) ROE: 9.75%; ROR: 7.46% ROE: 9.65%; ROR: 7.41%
Requested Rate of Return 7.93% 7.88%
Proposed Rate Base (adjusted) (1)(4)
$2.9B $1.2B
Revenue Requirement Increase $22.0M $38.0M
Distribution Increase as % of
overall bill
1% 5%
Timeline • 07/02/14 BGE filed application with the MDPSC seeking increases in electric & gas
distribution base rates
• 210 Day Proceeding
• 7/08/14 – Case delegated to the Public Utility Law Judge Division
• 10/17/14 – BGE filed unanimous “black box” settlement with MD PSC
• Settlement must be approved by the MD PSC
• If approved, new rates are expected to be effective no sooner than the middle of
December 2014
(1) Due to the “black box” nature of the settlement, the Common Equity Ratio, Authorized Returns, and Proposed Rate Base (adjusted) were not agreed upon by the parties in determining the
ultimate revenue requirement increase
(2) Reflects BGE’s actual capital structure as of 8/31/2014
(3) ROE and ROR stated in the settlement only apply to AFUDC and carrying costs on regulatory assets
(4) BGE’s Proposed Adjusted rate base
First BGE rate case settlement agreement since 1999
35 2014 EEI Financial Conference
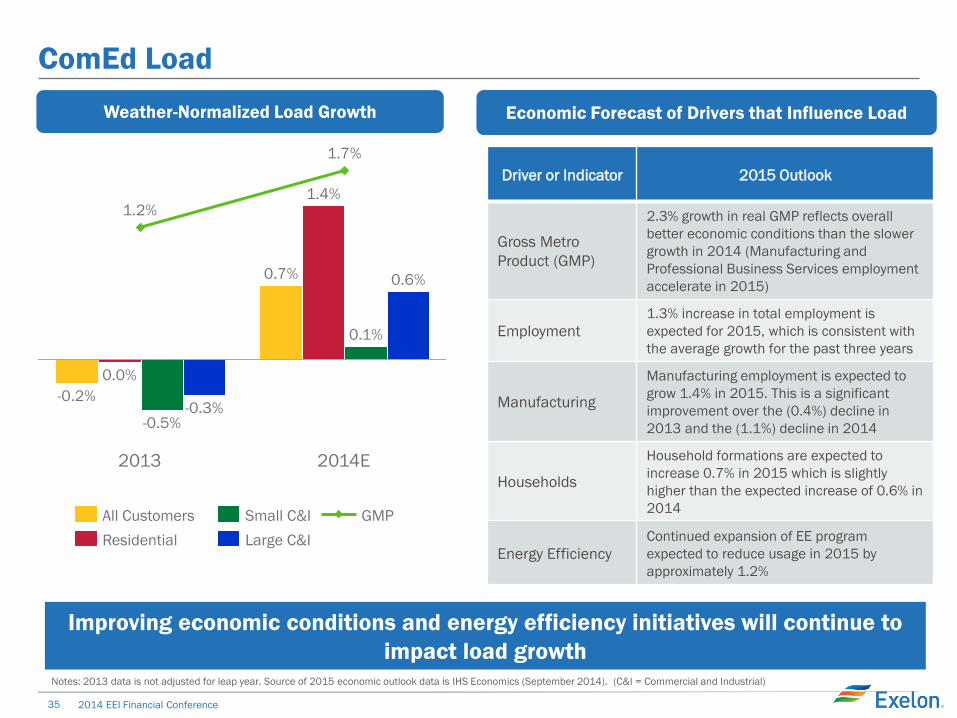
ComEd Load
Weather-Normalized Load Growth Economic Forecast of Drivers that Influence Load
2014E
0.6%
0.1%
1.4%
0.7%
1.7%
2013
-0.3% -0.5%
0.0%
-0.2%
1.2%
GMP
Large C&I
Small C&I
Residential
All Customers
Driver or Indicator 2015 Outlook
Gross Metro
Product (GMP)
2.3% growth in real GMP reflects overall
better economic conditions than the slower
growth in 2014 (Manufacturing and
Professional Business Services employment
accelerate in 2015)
Employment
1.3% increase in total employment is
expected for 2015, which is consistent with
the average growth for the past three years
Manufacturing
Manufacturing employment is expected to
grow 1.4% in 2015. This is a significant
improvement over the (0.4%) decline in
2013 and the (1.1%) decline in 2014
Households
Household formations are expected to
increase 0.7% in 2015 which is slightly
higher than the expected increase of 0.6% in
2014
Energy Efficiency
Continued expansion of EE program
expected to reduce usage in 2015 by
approximately 1.2%
Notes: 2013 data is not adjusted for leap year. Source of 2015 economic outlook data is IHS Economics (September 2014). (C&I = Commercial and Industrial)
Improving economic conditions and energy efficiency initiatives will continue to
impact load growth
36 2014 EEI Financial Conference
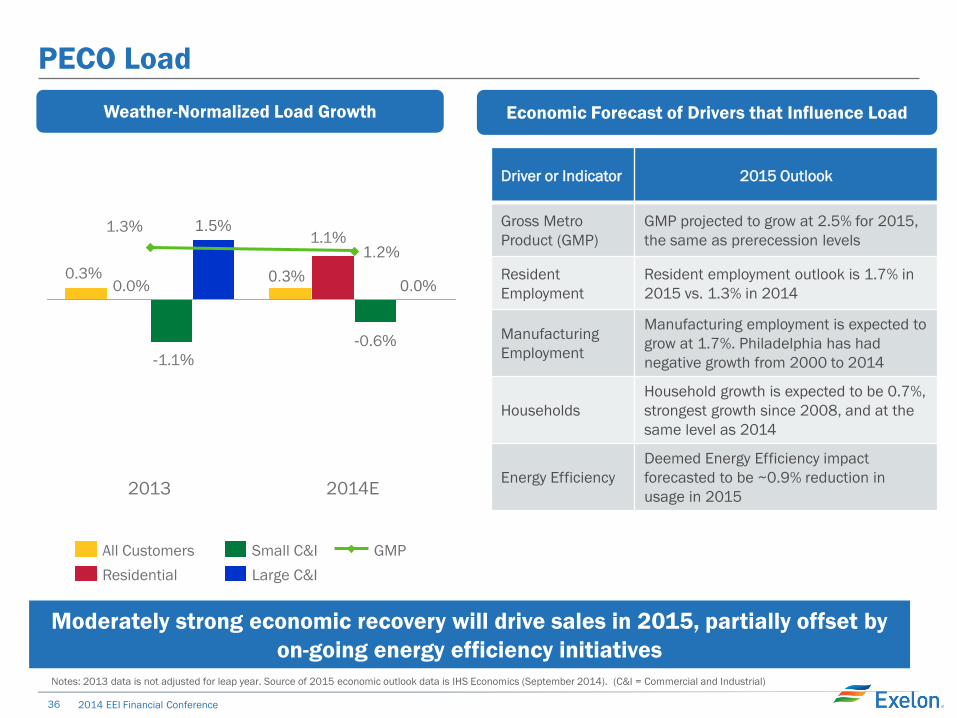
PECO Load
Weather-Normalized Load Growth Economic Forecast of Drivers that Influence Load
2014E
-0.6%
0.0%
1.1%
0.3%
1.2%
2013
1.5%
-1.1%
0.0%
1.3%
GMP
Large C&I
Small C&I
Residential
All Customers
Driver or Indicator 2015 Outlook
Gross Metro
Product (GMP)
GMP projected to grow at 2.5% for 2015,
the same as prerecession levels
Resident
Employment
Resident employment outlook is 1.7% in
2015 vs. 1.3% in 2014
Manufacturing
Employment
Manufacturing employment is expected to
grow at 1.7%. Philadelphia has had
negative growth from 2000 to 2014
Households
Household growth is expected to be 0.7%,
strongest growth since 2008, and at the
same level as 2014
Energy Efficiency
Deemed Energy Efficiency impact
forecasted to be ~0.9% reduction in
usage in 2015
Moderately strong economic recovery will drive sales in 2015, partially offset by
on-going energy efficiency initiatives
0.3%
Notes: 2013 data is not adjusted for leap year. Source of 2015 economic outlook data is IHS Economics (September 2014). (C&I = Commercial and Industrial)
37 2014 EEI Financial Conference
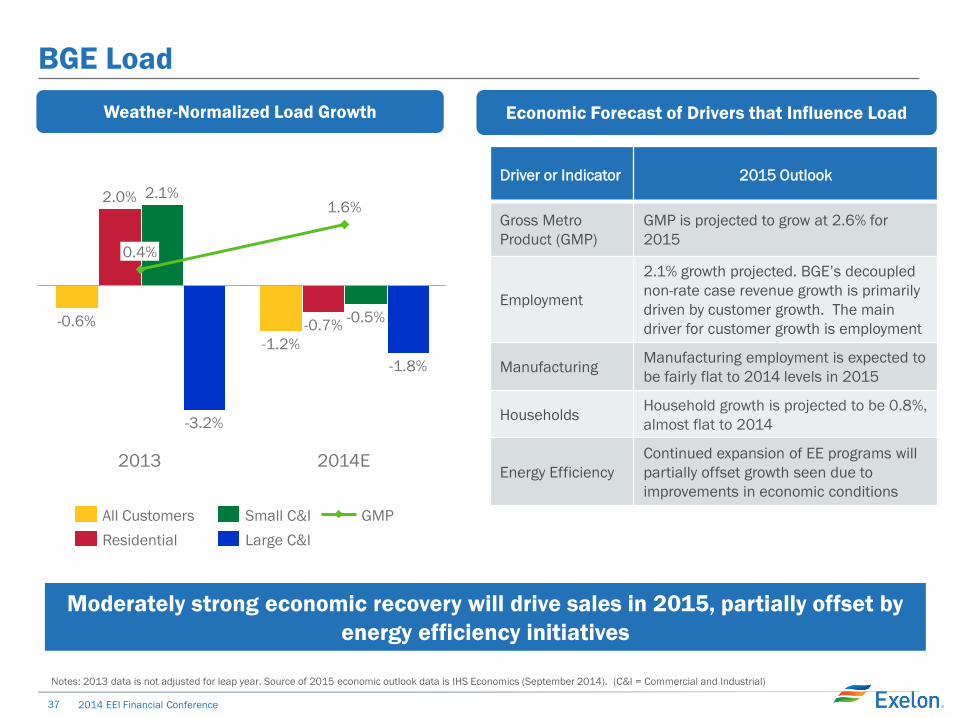
BGE Load
Weather-Normalized Load Growth Economic Forecast of Drivers that Influence Load
2014E
-1.8%
-0.5% -0.7%
-1.2%
1.6%
2013
-3.2%
2.1% 2.0%
-0.6%
0.4%
GMP
Large C&I
Small C&I
Residential
All Customers
Moderately strong economic recovery will drive sales in 2015, partially offset by
energy efficiency initiatives
Driver or Indicator 2015 Outlook
Gross Metro
Product (GMP)
GMP is projected to grow at 2.6% for
2015
Employment
2.1% growth projected. BGE’s decoupled
non-rate case revenue growth is primarily
driven by customer growth. The main
driver for customer growth is employment
Manufacturing Manufacturing employment is expected to
be fairly flat to 2014 levels in 2015
Households Household growth is projected to be 0.8%,
almost flat to 2014
Energy Efficiency
Continued expansion of EE programs will
partially offset growth seen due to
improvements in economic conditions
Notes: 2013 data is not adjusted for leap year. Source of 2015 economic outlook data is IHS Economics (September 2014). (C&I = Commercial and Industrial)

PHI Acquisition
39 2014 EEI Financial Conference
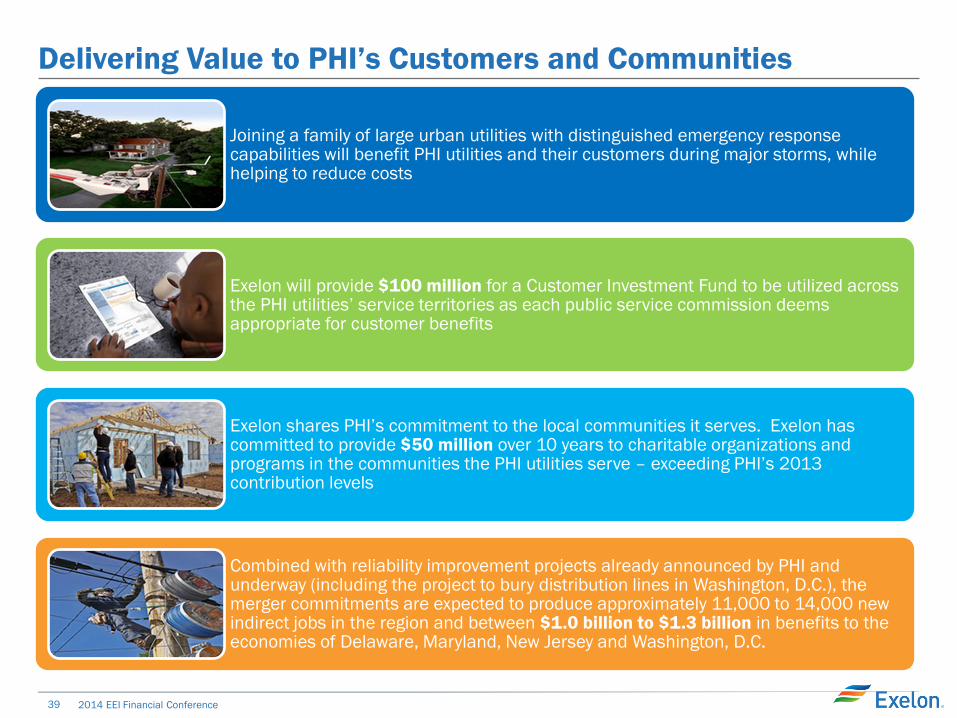
Delivering Value to PHI’s Customers and Communities
Joining a family of large urban utilities with distinguished emergency response capabilities will benefit PHI utilities and their customers during major storms, while helping to reduce costs
Exelon will provide $100 million for a Customer Investment Fund to be utilized across the PHI utilities’ service territories as each public service commission deems appropriate for customer benefits
Exelon shares PHI’s commitment to the local communities it serves. Exelon has committed to provide $50 million over 10 years to charitable organizations and programs in the communities the PHI utilities serve – exceeding PHI’s 2013 contribution levels
Combined with reliability improvement projects already announced by PHI and underway (including the project to bury distribution lines in Washington, D.C.), the merger commitments are expected to produce approximately 11,000 to 14,000 new indirect jobs in the region and between $1.0 billion to $1.3 billion in benefits to the economies of Delaware, Maryland, New Jersey and Washington, D.C.
40 2014 EEI Financial Conference
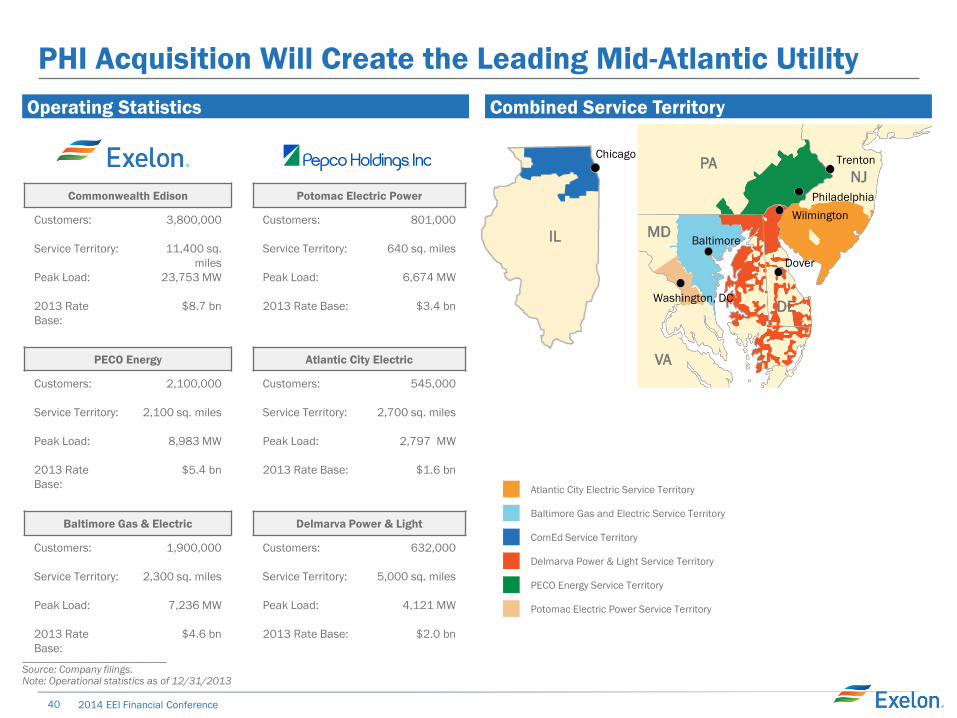
PHI Acquisition Will Create the Leading Mid-Atlantic Utility
Operating Statistics
Commonwealth Edison Potomac Electric Power
Customers:
Service Territory:
Peak Load:
2013 Rate
Base:
3,800,000
11,400 sq.
miles
23,753 MW
$8.7 bn
Customers:
Service Territory:
Peak Load:
2013 Rate Base:
801,000
640 sq. miles
6,674 MW
$3.4 bn
PECO Energy Atlantic City Electric
Customers:
Service Territory:
Peak Load:
2013 Rate
Base:
2,100,000
2,100 sq. miles
8,983 MW
$5.4 bn
Customers:
Service Territory:
Peak Load:
2013 Rate Base:
545,000
2,700 sq. miles
2,797 MW
$1.6 bn
Baltimore Gas & Electric Delmarva Power & Light
Customers:
Service Territory:
Peak Load:
2013 Rate
Base:
1,900,000
2,300 sq. miles
7,236 MW
$4.6 bn
Customers:
Service Territory:
Peak Load:
2013 Rate Base:
632,000
5,000 sq. miles
4,121 MW
$2.0 bn
___________________________ Source: Company filings. Note: Operational statistics as of 12/31/2013
Combined Service Territory
Potomac Electric Power Service Territory
Atlantic City Electric Service Territory
Delmarva Power & Light Service Territory
Baltimore Gas and Electric Service Territory
PECO Energy Service Territory
ComEd Service Territory
IL
Chicago
DE
MD
PA NJ
VA
Philadelphia
Baltimore
Dover
Wilmington
Trenton
Washington, DC
41 2014 EEI Financial Conference
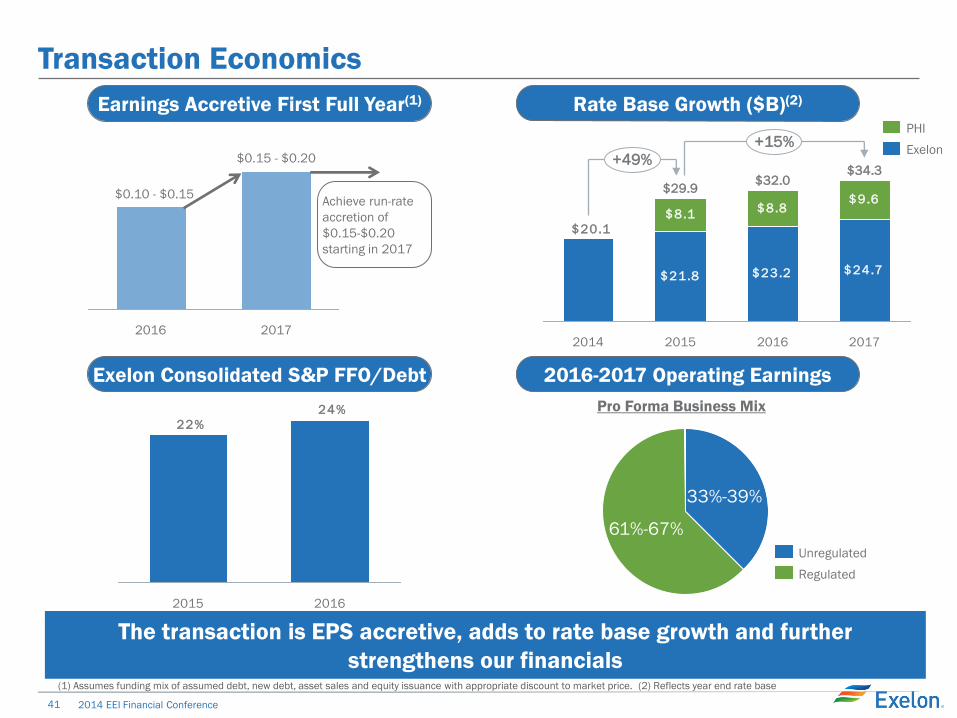
Earnings Accretive First Full Year(1)
Transaction Economics (3)
Exelon Consolidated S&P FFO/Debt
24%
22%
2015 2016
(1) Assumes funding mix of assumed debt, new debt, asset sales and equity issuance with appropriate discount to market price. (2) Reflects year end rate base
2016-2017 Operating Earnings
33%-39%
61%-67%
Pro Forma Business Mix
Regulated
Unregulated
Rate Base Growth ($B)(2)
$21.8 $23.2 $24.7
$8.1$8.8
$9.6
$20.1
$34.3
+15%
+49%
2017 2014 2015 2016
$29.9 $32.0
Exelon
PHI
2017 2016
$0.10 - $0.15
$0.15 - $0.20
Achieve run-rate
accretion of
$0.15-$0.20
starting in 2017
The transaction is EPS accretive, adds to rate base growth and further
strengthens our financials
42 2014 EEI Financial Conference
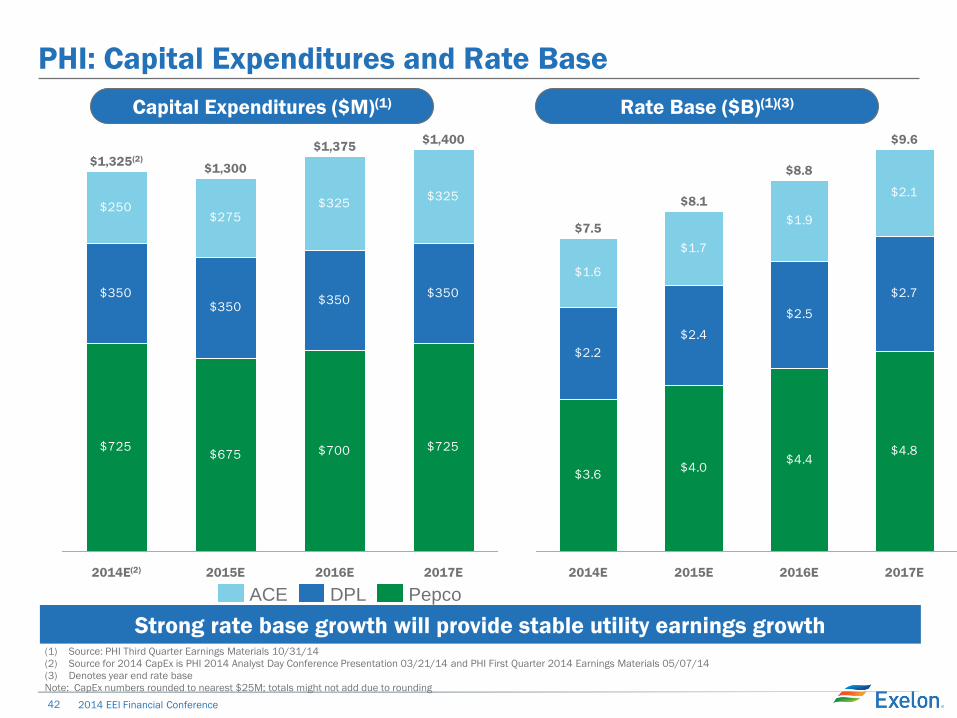
PHI: Capital Expenditures and Rate Base
$725$675 $700 $725
$350$350
$350$350
$250$275
$325$325
$1,400
2017E 2016E
$1,375
2015E
$1,300
2014E(2)
$1,325(2)
Pepco DPL ACE
Rate Base ($B)(1)(3) Capital Expenditures ($M)(1)
$4.0$4.4
$4.8
$2.2
$2.4
$2.5
$2.7
$1.6
$1.7
$1.9
$2.1
$3.6
2016E
$8.8
2015E
$8.1
2014E
$7.5
2017E
$9.6
(1) Source: PHI Third Quarter Earnings Materials 10/31/14
(2) Source for 2014 CapEx is PHI 2014 Analyst Day Conference Presentation 03/21/14 and PHI First Quarter 2014 Earnings Materials 05/07/14
(3) Denotes year end rate base
Note: CapEx numbers rounded to nearest $25M; totals might not add due to rounding
Strong rate base growth will provide stable utility earnings growth
43 2014 EEI Financial Conference
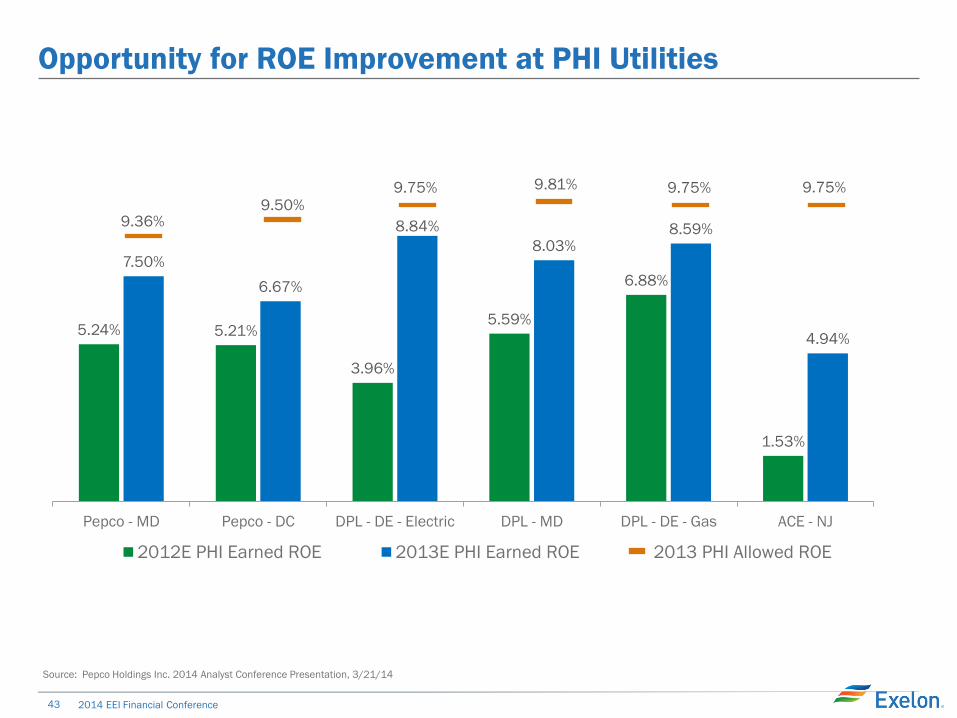
Opportunity for ROE Improvement at PHI Utilities
Source: Pepco Holdings Inc. 2014 Analyst Conference Presentation, 3/21/14
5.24% 5.21%
3.96%
5.59%
6.88%
1.53%
7.50%
6.67%
8.84%
8.03% 8.59%
4.94%
9.36% 9.50%
9.75% 9.81% 9.75% 9.75%
Pepco - MD Pepco - DC DPL - DE - Electric DPL - MD DPL - DE - Gas ACE - NJ
2012E PHI Earned ROE 2013E PHI Earned ROE 2013 PHI Allowed ROE
44 2014 EEI Financial Conference
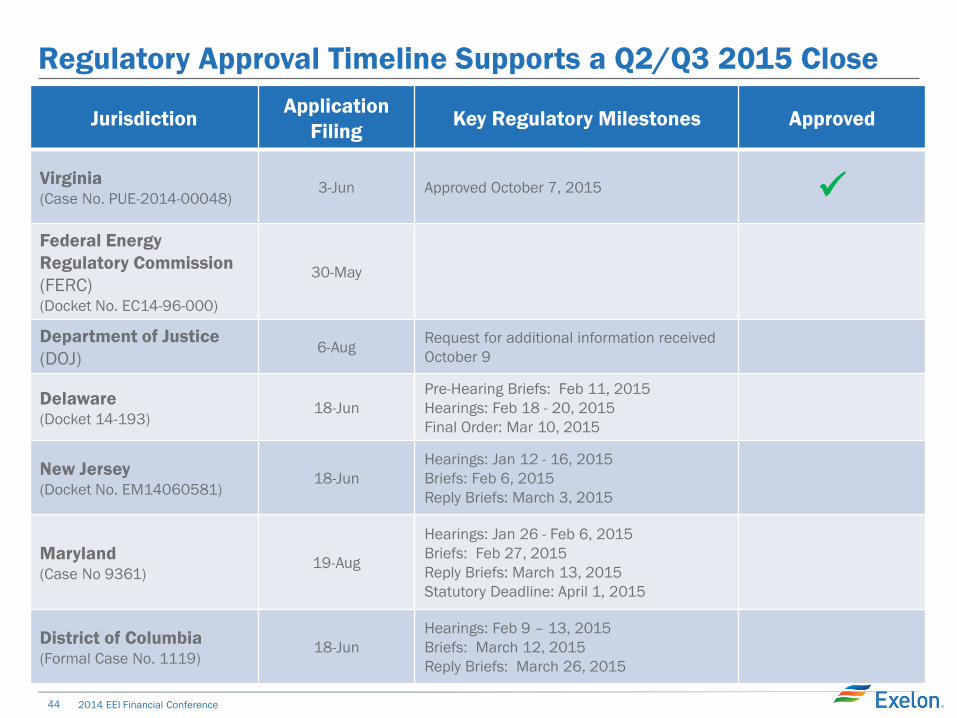
Regulatory Approval Timeline Supports a Q2/Q3 2015 Close
Jurisdiction Application
Filing Key Regulatory Milestones Approved
Virginia (Case No. PUE-2014-00048)
3-Jun Approved October 7, 2015
Federal Energy
Regulatory Commission
(FERC) (Docket No. EC14-96-000)
30-May
Department of Justice
(DOJ) 6-Aug
Request for additional information received
October 9
Delaware (Docket 14-193)
18-Jun
Pre-Hearing Briefs: Feb 11, 2015
Hearings: Feb 18 - 20, 2015
Final Order: Mar 10, 2015
New Jersey (Docket No. EM14060581)
18-Jun
Hearings: Jan 12 - 16, 2015
Briefs: Feb 6, 2015
Reply Briefs: March 3, 2015
Maryland (Case No 9361)
19-Aug
Hearings: Jan 26 - Feb 6, 2015
Briefs: Feb 27, 2015
Reply Briefs: March 13, 2015
Statutory Deadline: April 1, 2015
District of Columbia (Formal Case No. 1119)
18-Jun
Hearings: Feb 9 – 13, 2015
Briefs: March 12, 2015
Reply Briefs: March 26, 2015
46 2014 EEI Financial Conference
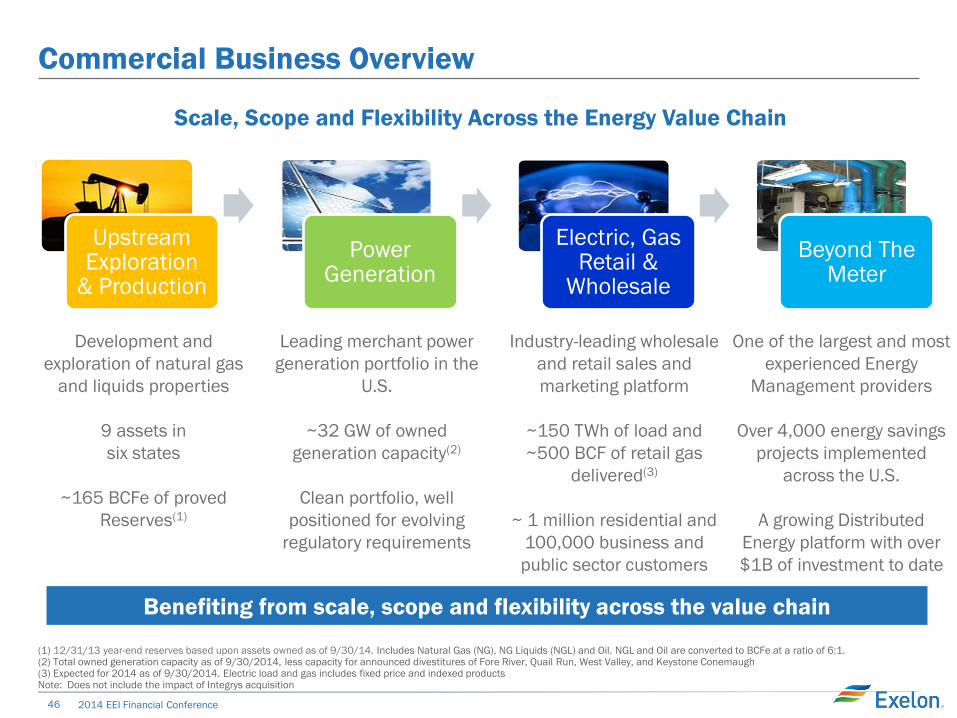
Commercial Business Overview
Upstream Exploration
& Production
Power Generation
Electric, Gas Retail &
Wholesale
Beyond The Meter
Scale, Scope and Flexibility Across the Energy Value Chain
Development and
exploration of natural gas
and liquids properties
9 assets in
six states
~165 BCFe of proved
Reserves(1)
Leading merchant power
generation portfolio in the
U.S.
~32 GW of owned
generation capacity(2)
Clean portfolio, well
positioned for evolving
regulatory requirements
Industry-leading wholesale
and retail sales and
marketing platform
~150 TWh of load and
~500 BCF of retail gas
delivered(3)
~ 1 million residential and
100,000 business and
public sector customers
One of the largest and most
experienced Energy
Management providers
Over 4,000 energy savings
projects implemented
across the U.S.
A growing Distributed
Energy platform with over
$1B of investment to date
Benefiting from scale, scope and flexibility across the value chain
(1) 12/31/13 year-end reserves based upon assets owned as of 9/30/14. Includes Natural Gas (NG), NG Liquids (NGL) and Oil. NGL and Oil are converted to BCFe at a ratio of 6:1. (2) Total owned generation capacity as of 9/30/2014, less capacity for announced divestitures of Fore River, Quail Run, West Valley, and Keystone Conemaugh (3) Expected for 2014 as of 9/30/2014. Electric load and gas includes fixed price and indexed products Note: Does not include the impact of Integrys acquisition
47 2014 EEI Financial Conference
10
15
5
9
18
7
15
16
49
71
27
97
25
ERCOT
38
Mid-Atlantic
108
Canada
Midwest
111
23
South/West/
New York
10
New England
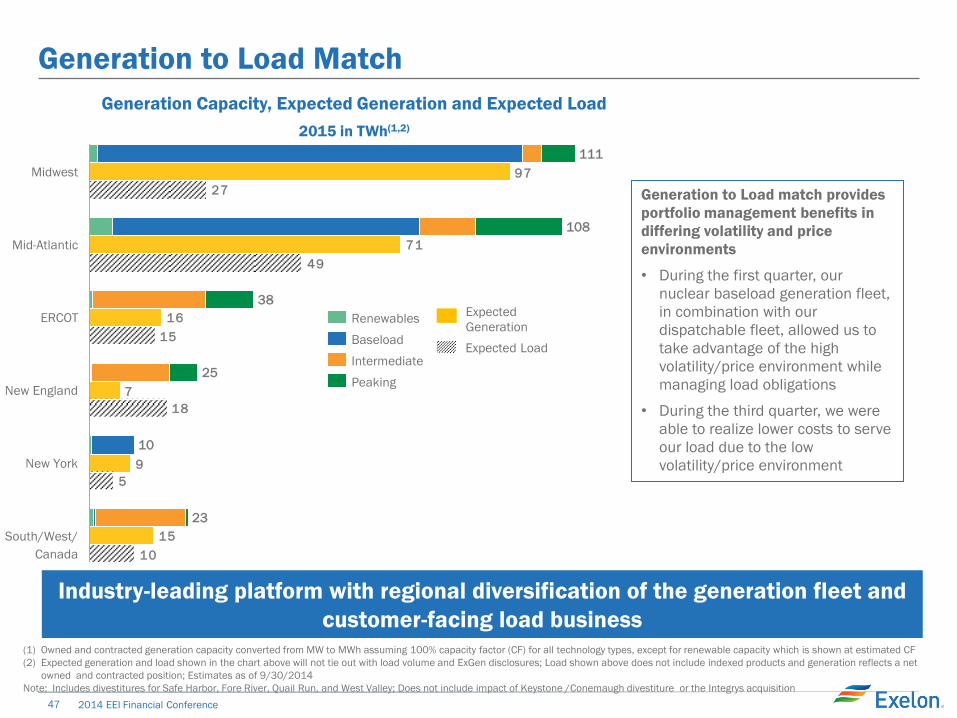
Generation to Load Match
Industry-leading platform with regional diversification of the generation fleet and
customer-facing load business
Generation Capacity, Expected Generation and Expected Load
2015 in TWh(1,2)
(1) Owned and contracted generation capacity converted from MW to MWh assuming 100% capacity factor (CF) for all technology types, except for renewable capacity which is shown at estimated CF
(2) Expected generation and load shown in the chart above will not tie out with load volume and ExGen disclosures; Load shown above does not include indexed products and generation reflects a net
owned and contracted position; Estimates as of 9/30/2014
Note: Includes divestitures for Safe Harbor, Fore River, Quail Run, and West Valley; Does not include impact of Keystone /Conemaugh divestiture or the Integrys acquisition
Expected Load
Expected
Generation Baseload
Intermediate
Peaking
Renewables
Generation to Load match provides
portfolio management benefits in
differing volatility and price
environments
• During the first quarter, our
nuclear baseload generation fleet,
in combination with our
dispatchable fleet, allowed us to
take advantage of the high
volatility/price environment while
managing load obligations
• During the third quarter, we were
able to realize lower costs to serve
our load due to the low
volatility/price environment
48 2014 EEI Financial Conference
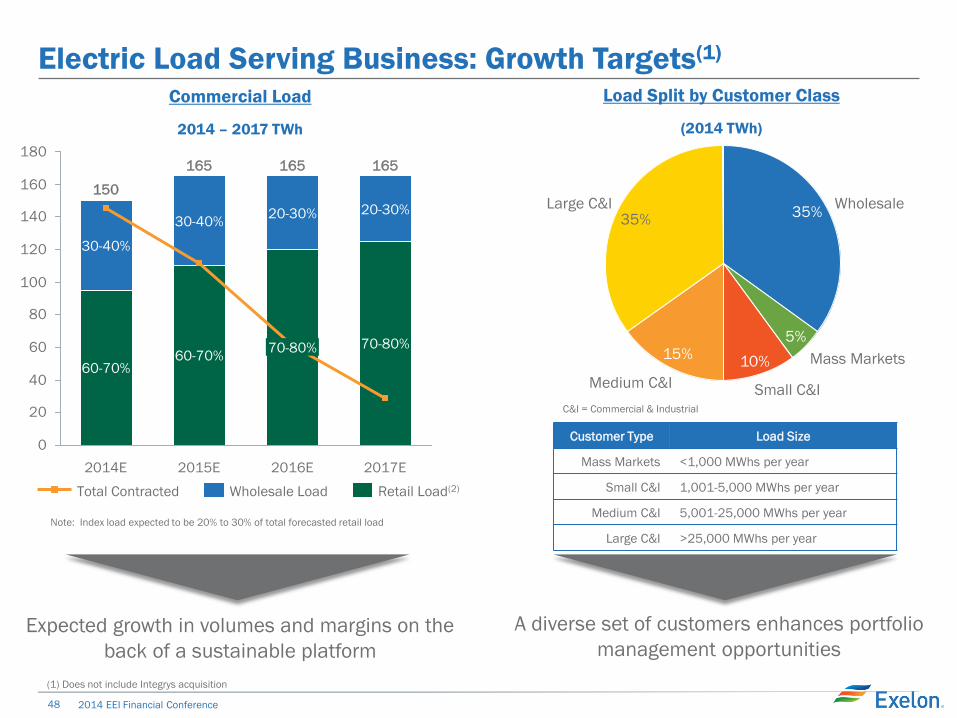
Electric Load Serving Business: Growth Targets(1)
0
20
40
60
80
100
120
140
160
180
2015E 2017E 2016E 2014E
165
70-80%
20-30%
165
60-70%
30-40%
150
60-70%
30-40%
165
70-80%
20-30%
Retail Load(2) Wholesale Load Total Contracted
Commercial Load
2014 – 2017 TWh
8%
15%
Load Split by Customer Class
(2014 TWh)
Expected growth in volumes and margins on the
back of a sustainable platform
A diverse set of customers enhances portfolio
management opportunities
Note: Index load expected to be 20% to 30% of total forecasted retail load
Customer Type Load Size
Mass Markets <1,000 MWhs per year
Small C&I 1,001-5,000 MWhs per year
Medium C&I 5,001-25,000 MWhs per year
Large C&I >25,000 MWhs per year
Medium C&I
Large C&I 35%
15%
Small C&I
10% Mass Markets
5%
Wholesale 35%
C&I = Commercial & Industrial
(1) Does not include Integrys acquisition
49 2014 EEI Financial Conference
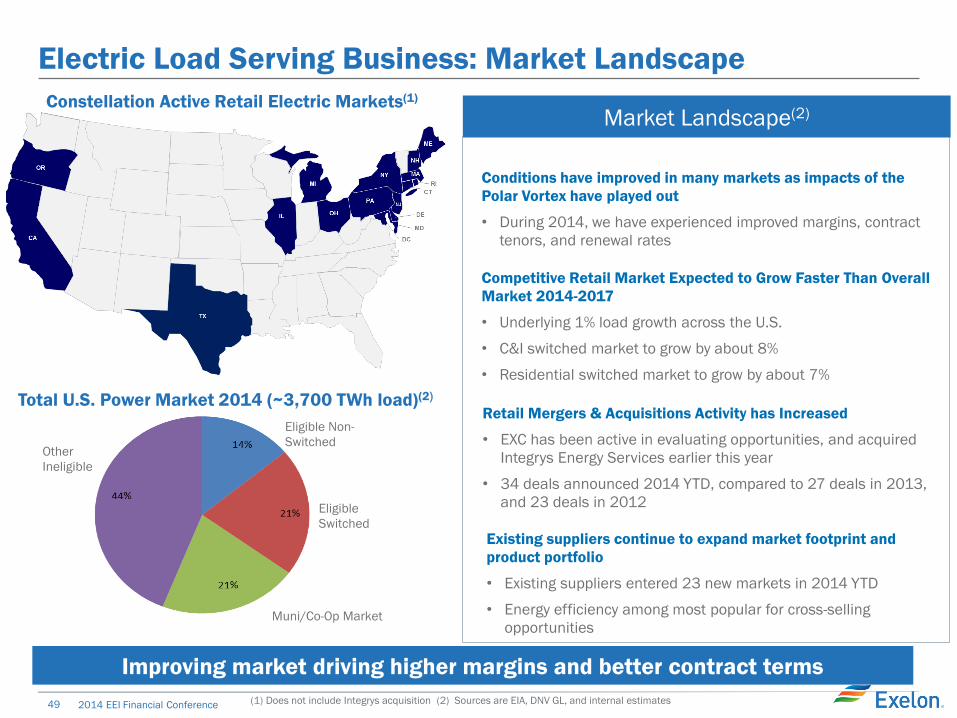
Electric Load Serving Business: Market Landscape
Total U.S. Power Market 2014 (~3,700 TWh load)(2)
Eligible Non-
Switched
Eligible
Switched
Muni/Co-Op Market
Other
Ineligible
Constellation Active Retail Electric Markets(1)
Competitive Retail Market Expected to Grow Faster Than Overall
Market 2014-2017
• Underlying 1% load growth across the U.S.
• C&I switched market to grow by about 8%
• Residential switched market to grow by about 7%
Retail Mergers & Acquisitions Activity has Increased
• EXC has been active in evaluating opportunities, and acquired
Integrys Energy Services earlier this year
• 34 deals announced 2014 YTD, compared to 27 deals in 2013,
and 23 deals in 2012
Conditions have improved in many markets as impacts of the
Polar Vortex have played out
• During 2014, we have experienced improved margins, contract
tenors, and renewal rates
Existing suppliers continue to expand market footprint and
product portfolio
• Existing suppliers entered 23 new markets in 2014 YTD
• Energy efficiency among most popular for cross-selling
opportunities
Market Landscape(2)
(1) Does not include Integrys acquisition (2) Sources are EIA, DNV GL, and internal estimates
Improving market driving higher margins and better contract terms
50 2014 EEI Financial Conference
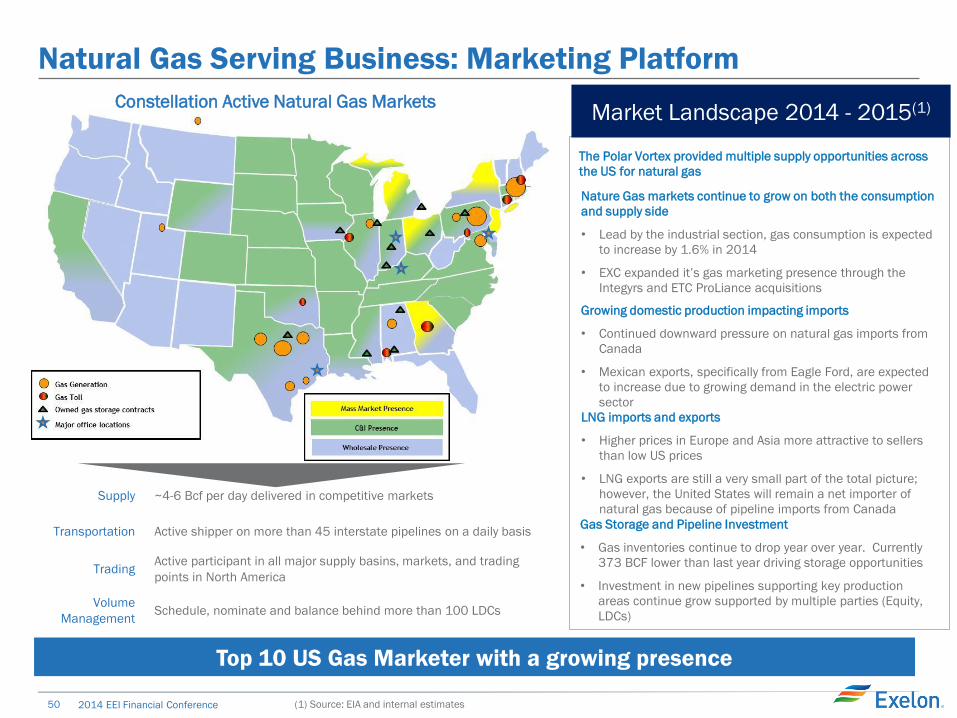
Natural Gas Serving Business: Marketing Platform
Constellation Active Natural Gas Markets
Supply ~4-6 Bcf per day delivered in competitive markets
Transportation Active shipper on more than 45 interstate pipelines on a daily basis
Trading Active participant in all major supply basins, markets, and trading
points in North America
Volume
Management Schedule, nominate and balance behind more than 100 LDCs
Nature Gas markets continue to grow on both the consumption
and supply side
• Lead by the industrial section, gas consumption is expected
to increase by 1.6% in 2014
• EXC expanded it’s gas marketing presence through the
Integyrs and ETC ProLiance acquisitions
Growing domestic production impacting imports
• Continued downward pressure on natural gas imports from
Canada
• Mexican exports, specifically from Eagle Ford, are expected
to increase due to growing demand in the electric power
sector
The Polar Vortex provided multiple supply opportunities across
the US for natural gas
LNG imports and exports
• Higher prices in Europe and Asia more attractive to sellers
than low US prices
• LNG exports are still a very small part of the total picture;
however, the United States will remain a net importer of
natural gas because of pipeline imports from Canada
Gas Storage and Pipeline Investment
• Gas inventories continue to drop year over year. Currently
373 BCF lower than last year driving storage opportunities
• Investment in new pipelines supporting key production
areas continue grow supported by multiple parties (Equity,
LDCs)
(1) Source: EIA and internal estimates
Market Landscape 2014 - 2015(1)
Top 10 US Gas Marketer with a growing presence
51 2014 EEI Financial Conference
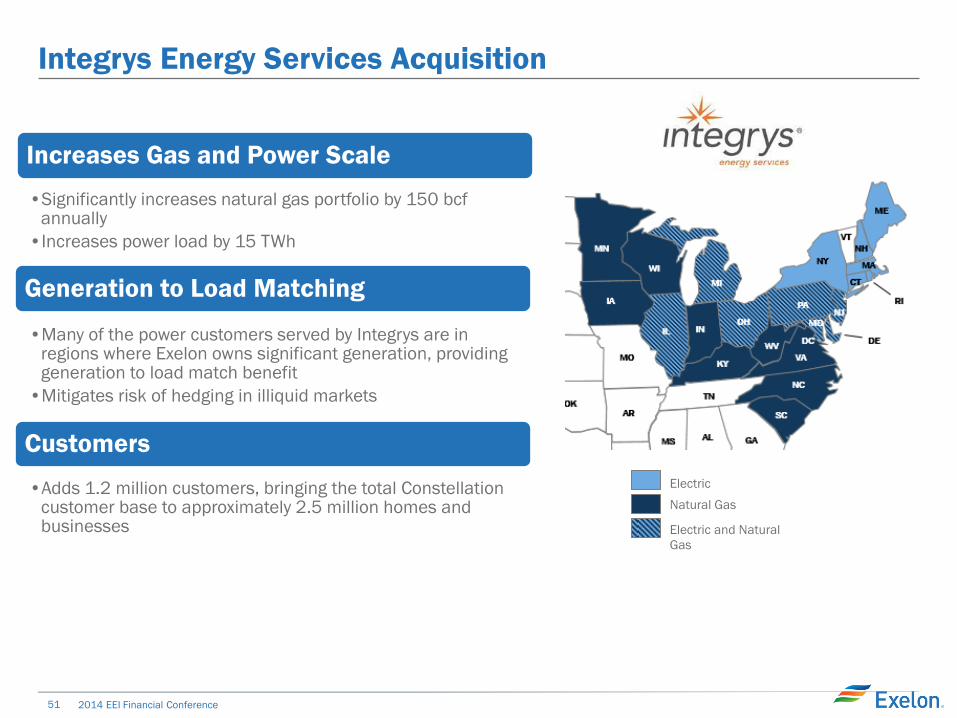
Integrys Energy Services Acquisition
Natural Gas
Electric
Electric and Natural
Gas
Increases Gas and Power Scale
•Significantly increases natural gas portfolio by 150 bcf annually
•Increases power load by 15 TWh
Generation to Load Matching
•Many of the power customers served by Integrys are in regions where Exelon owns significant generation, providing generation to load match benefit
•Mitigates risk of hedging in illiquid markets
Customers
•Adds 1.2 million customers, bringing the total Constellation customer base to approximately 2.5 million homes and businesses
52 2014 EEI Financial Conference
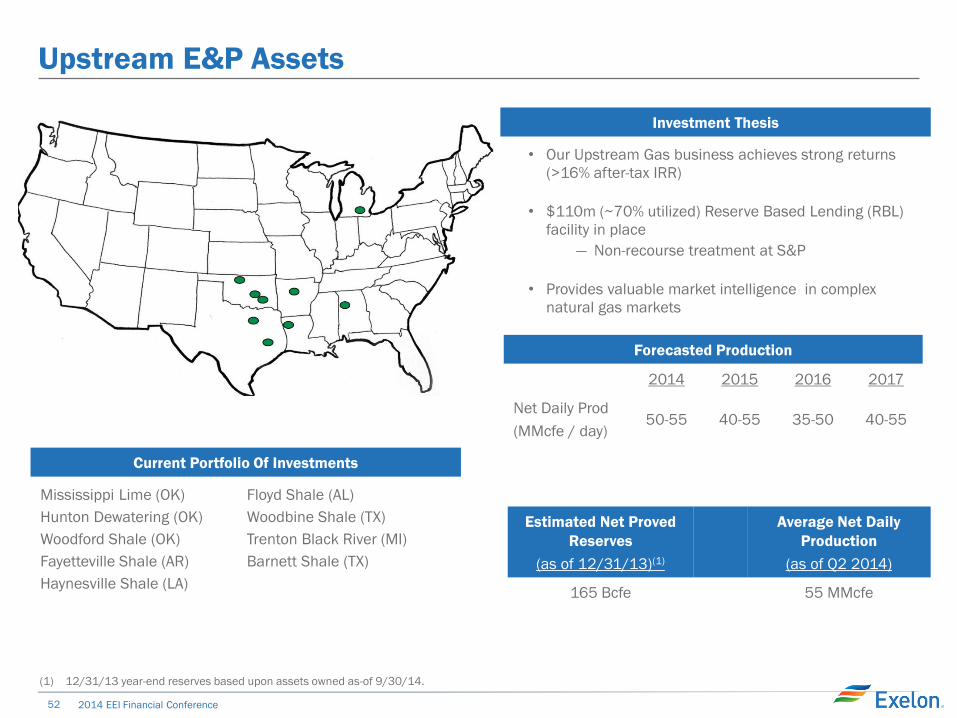
(1) 12/31/13 year-end reserves based upon assets owned as-of 9/30/14.
Upstream E&P Assets
Estimated Net Proved
Reserves
(as of 12/31/13)(1)
Average Net Daily
Production
(as of Q2 2014)
165 Bcfe 55 MMcfe
Investment Thesis
• Our Upstream Gas business achieves strong returns
(>16% after-tax IRR)
• $110m (~70% utilized) Reserve Based Lending (RBL)
facility in place
― Non-recourse treatment at S&P
• Provides valuable market intelligence in complex
natural gas markets
Forecasted Production
2014 2015 2016 2017
Net Daily Prod
(MMcfe / day) 50-55 40-55 35-50 40-55
Current Portfolio Of Investments
Mississippi Lime (OK)
Hunton Dewatering (OK)
Woodford Shale (OK)
Fayetteville Shale (AR)
Haynesville Shale (LA)
Floyd Shale (AL)
Woodbine Shale (TX)
Trenton Black River (MI)
Barnett Shale (TX)
53 2014 EEI Financial Conference
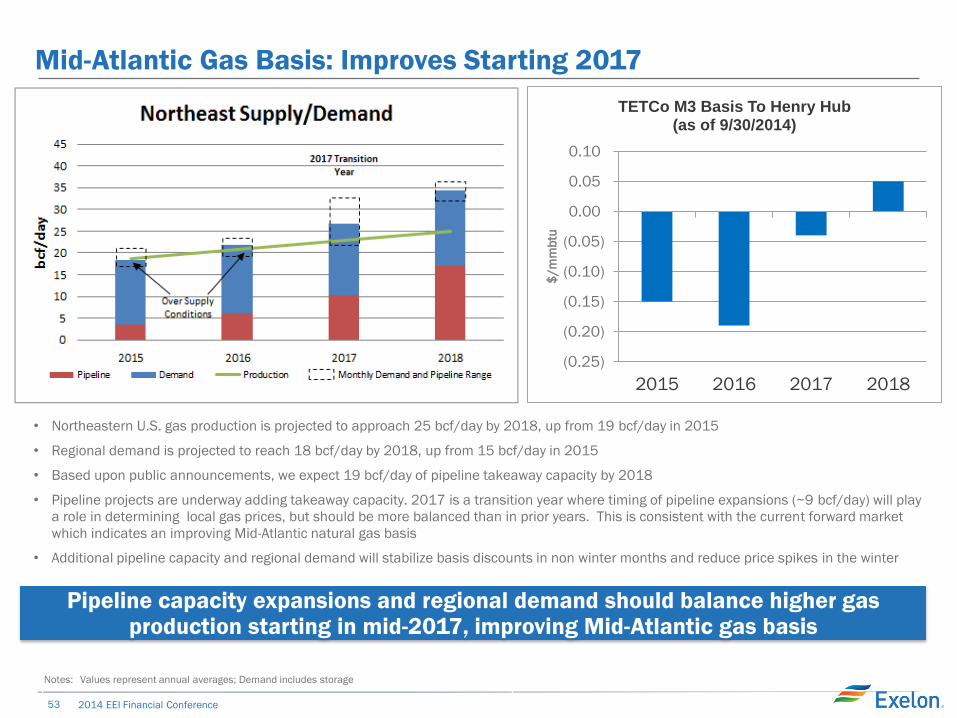
Pipeline capacity expansions and regional demand should balance higher gas production starting in mid-2017, improving Mid-Atlantic gas basis
Mid-Atlantic Gas Basis: Improves Starting 2017
• Northeastern U.S. gas production is projected to approach 25 bcf/day by 2018, up from 19 bcf/day in 2015
• Regional demand is projected to reach 18 bcf/day by 2018, up from 15 bcf/day in 2015
• Based upon public announcements, we expect 19 bcf/day of pipeline takeaway capacity by 2018
• Pipeline projects are underway adding takeaway capacity. 2017 is a transition year where timing of pipeline expansions (~9 bcf/day) will play
a role in determining local gas prices, but should be more balanced than in prior years. This is consistent with the current forward market
which indicates an improving Mid-Atlantic natural gas basis
• Additional pipeline capacity and regional demand will stabilize basis discounts in non winter months and reduce price spikes in the winter
(0.25)
(0.20)
(0.15)
(0.10)
(0.05)
0.00
0.05
0.10
2015 2016 2017 2018
$/m
mb
tu
TETCo M3 Basis To Henry Hub (as of 9/30/2014)
Notes: Values represent annual averages; Demand includes storage
54 2014 EEI Financial Conference
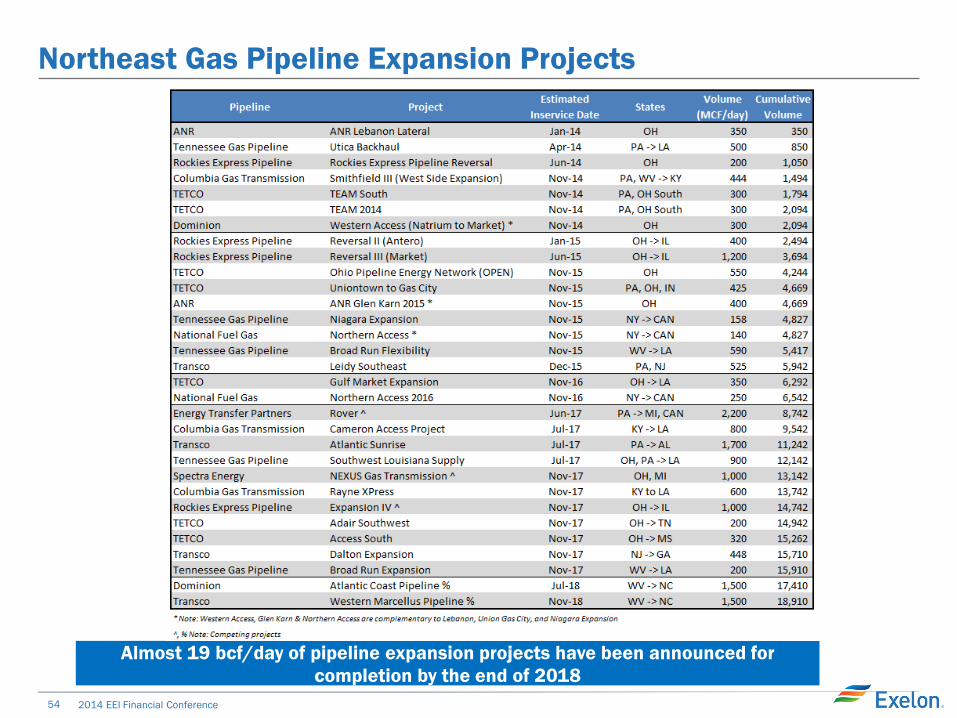
Northeast Gas Pipeline Expansion Projects
Almost 19 bcf/day of pipeline expansion projects have been announced for
completion by the end of 2018
55 2014 EEI Financial Conference
0
5
10
15
20
25
2012 2013 2014 2015 2016
PJM Announced and Forecasted Retirements
PJM Annual Coal Retirements PJM Cumulative Coal Retirements
GW
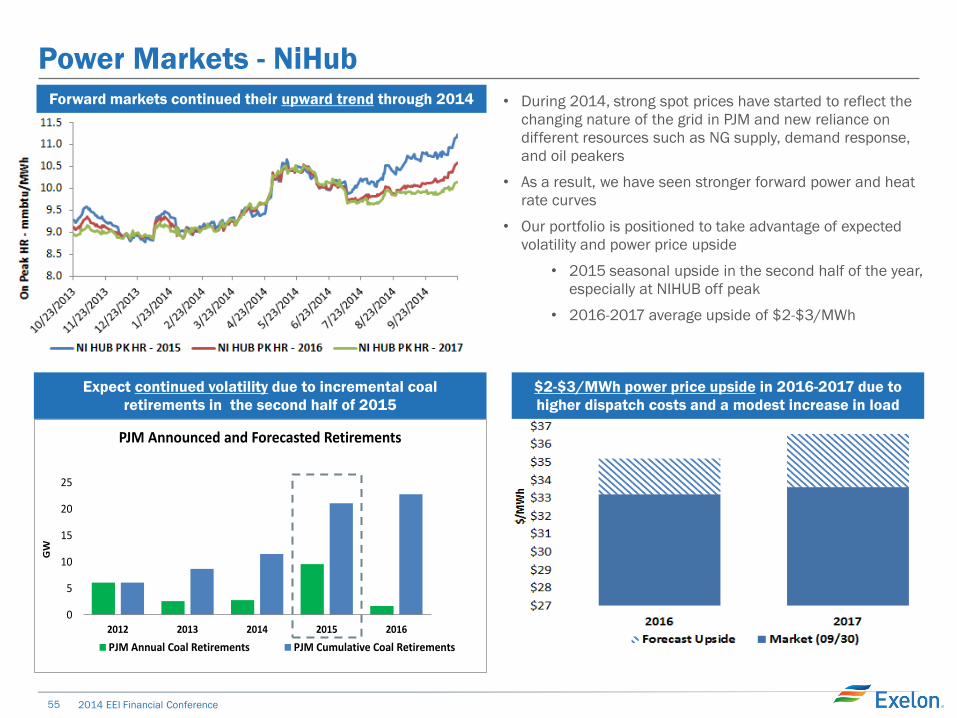
Power Markets - NiHub
$2-$3/MWh power price upside in 2016-2017 due to
higher dispatch costs and a modest increase in load
Expect continued volatility due to incremental coal
retirements in the second half of 2015
Forward markets continued their upward trend through 2014 • During 2014, strong spot prices have started to reflect the
changing nature of the grid in PJM and new reliance on
different resources such as NG supply, demand response,
and oil peakers
• As a result, we have seen stronger forward power and heat
rate curves
• Our portfolio is positioned to take advantage of expected
volatility and power price upside
• 2015 seasonal upside in the second half of the year,
especially at NIHUB off peak
• 2016-2017 average upside of $2-$3/MWh
56 2014 EEI Financial Conference
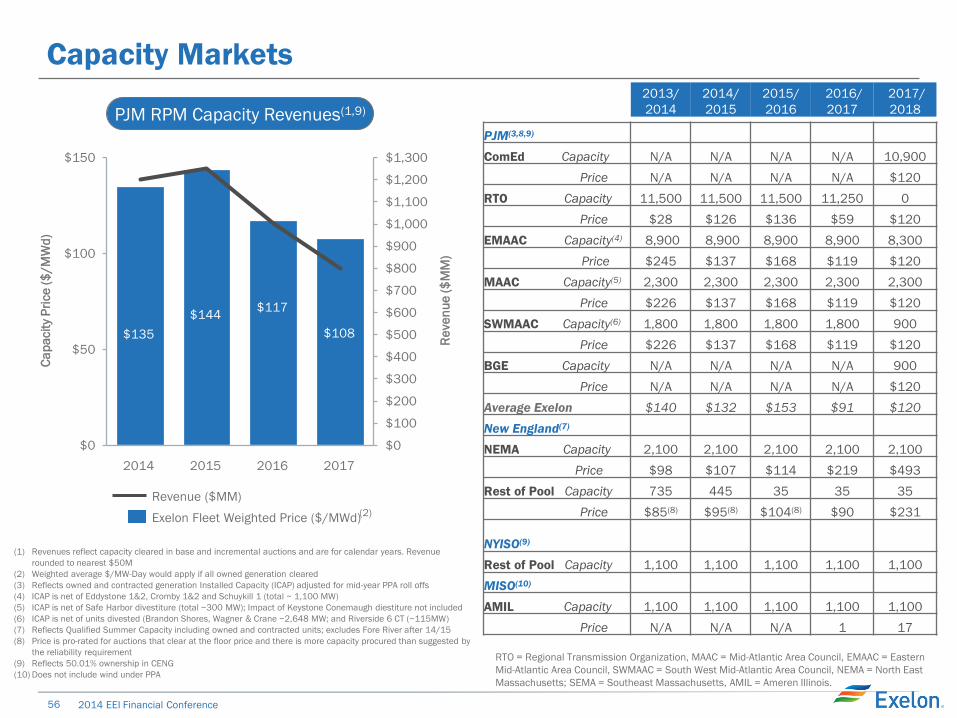
Capacity Markets 2013/
2014
2014/
2015
2015/
2016
2016/
2017
2017/
2018
PJM(3,8,9)
ComEd Capacity N/A N/A N/A N/A 10,900
Price N/A N/A N/A N/A $120
RTO Capacity 11,500 11,500 11,500 11,250 0
Price $28 $126 $136 $59 $120
EMAAC Capacity(4) 8,900 8,900 8,900 8,900 8,300
Price $245 $137 $168 $119 $120
MAAC Capacity(5) 2,300 2,300 2,300 2,300 2,300
Price $226 $137 $168 $119 $120
SWMAAC Capacity(6) 1,800 1,800 1,800 1,800 900
Price $226 $137 $168 $119 $120
BGE Capacity N/A N/A N/A N/A 900
Price N/A N/A N/A N/A $120
Average Exelon $140 $132 $153 $91 $120
New England(7)
NEMA Capacity 2,100 2,100 2,100 2,100 2,100
Price $98 $107 $114 $219 $493
Rest of Pool Capacity 735 445 35 35 35
Price $85(8) $95(8) $104(8) $90 $231
NYISO(9)
Rest of Pool Capacity 1,100 1,100 1,100 1,100 1,100
MISO(10)
AMIL Capacity 1,100 1,100 1,100 1,100 1,100
Price N/A N/A N/A 1 17
RTO = Regional Transmission Organization, MAAC = Mid-Atlantic Area Council, EMAAC = Eastern
Mid-Atlantic Area Council, SWMAAC = South West Mid-Atlantic Area Council, NEMA = North East
Massachusetts; SEMA = Southeast Massachusetts, AMIL = Ameren Illinois.
$0
$100
$200
$300
$400
$500
$600
$700
$800
$900
$1,000
$1,100
$1,200
$1,300
$0
$50
$100
$150
2017 2016 2015
Re
ve
nu
e (
$M
M)
2014
Ca
pa
cit
y P
rice
($
/M
Wd
)
$135
$144 $117
$108
PJM RPM Capacity Revenues(1,9)
Exelon Fleet Weighted Price ($/MWd)
Revenue ($MM)
(2)
(1) Revenues reflect capacity cleared in base and incremental auctions and are for calendar years. Revenue
rounded to nearest $50M
(2) Weighted average $/MW-Day would apply if all owned generation cleared
(3) Reflects owned and contracted generation Installed Capacity (ICAP) adjusted for mid-year PPA roll offs
(4) ICAP is net of Eddystone 1&2, Cromby 1&2 and Schuykill 1 (total ~ 1,100 MW)
(5) ICAP is net of Safe Harbor divestiture (total ~300 MW); Impact of Keystone Conemaugh diestiture not included
(6) ICAP is net of units divested (Brandon Shores, Wagner & Crane ~2,648 MW; and Riverside 6 CT (~115MW)
(7) Reflects Qualified Summer Capacity including owned and contracted units; excludes Fore River after 14/15
(8) Price is pro-rated for auctions that clear at the floor price and there is more capacity procured than suggested by
the reliability requirement
(9) Reflects 50.01% ownership in CENG
(10) Does not include wind under PPA
57 2014 EEI Financial Conference
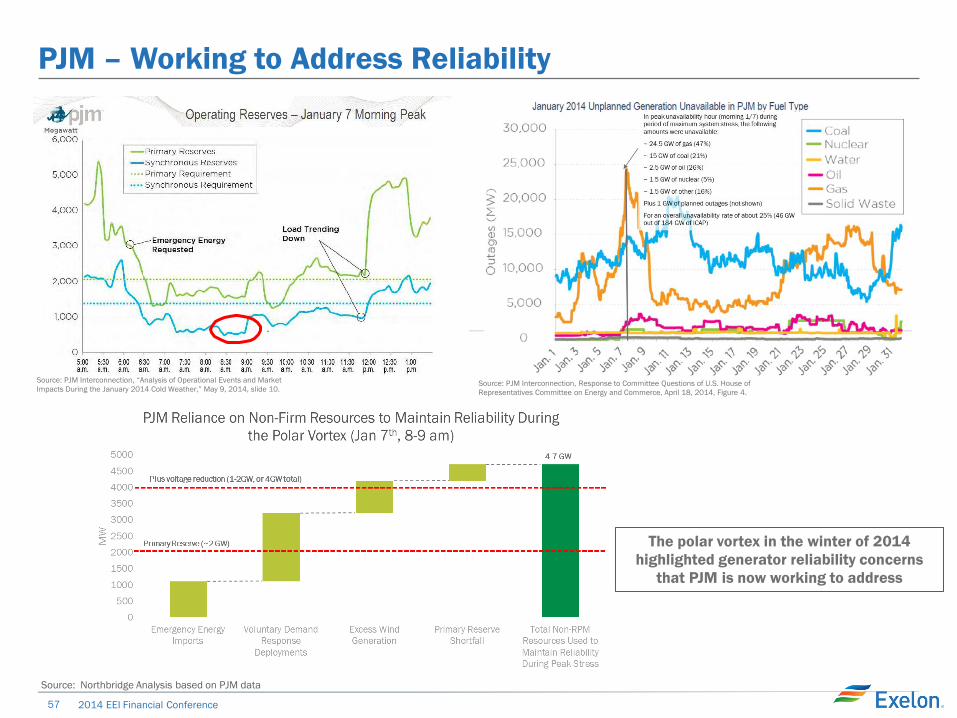
PJM – Working to Address Reliability
Source: PJM Interconnection, Response to Committee Questions of U.S. House of
Representatives Committee on Energy and Commerce, April 18, 2014, Figure 4.
Source: PJM Interconnection, “Analysis of Operational Events and Market
Impacts During the January 2014 Cold Weather,” May 9, 2014, slide 10.
The polar vortex in the winter of 2014
highlighted generator reliability concerns
that PJM is now working to address
Source: Northbridge Analysis based on PJM data
58 2014 EEI Financial Conference
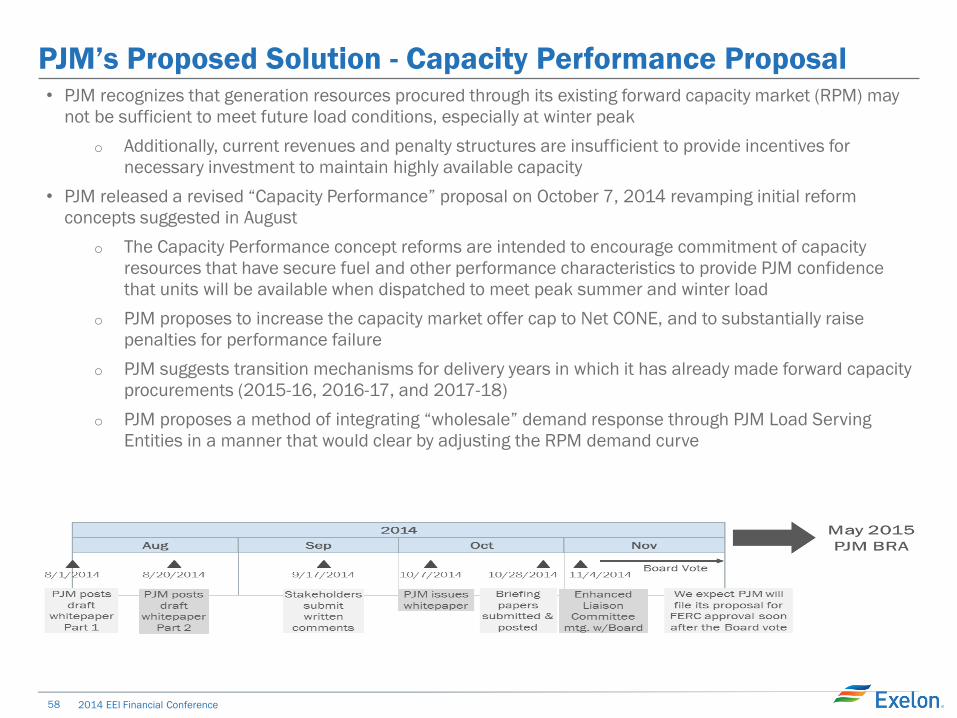
PJM’s Proposed Solution - Capacity Performance Proposal • PJM recognizes that generation resources procured through its existing forward capacity market (RPM) may
not be sufficient to meet future load conditions, especially at winter peak
o Additionally, current revenues and penalty structures are insufficient to provide incentives for
necessary investment to maintain highly available capacity
• PJM released a revised “Capacity Performance” proposal on October 7, 2014 revamping initial reform
concepts suggested in August
o The Capacity Performance concept reforms are intended to encourage commitment of capacity
resources that have secure fuel and other performance characteristics to provide PJM confidence
that units will be available when dispatched to meet peak summer and winter load
o PJM proposes to increase the capacity market offer cap to Net CONE, and to substantially raise
penalties for performance failure
o PJM suggests transition mechanisms for delivery years in which it has already made forward capacity
procurements (2015-16, 2016-17, and 2017-18)
o PJM proposes a method of integrating “wholesale” demand response through PJM Load Serving
Entities in a manner that would clear by adjusting the RPM demand curve
59 2014 EEI Financial Conference
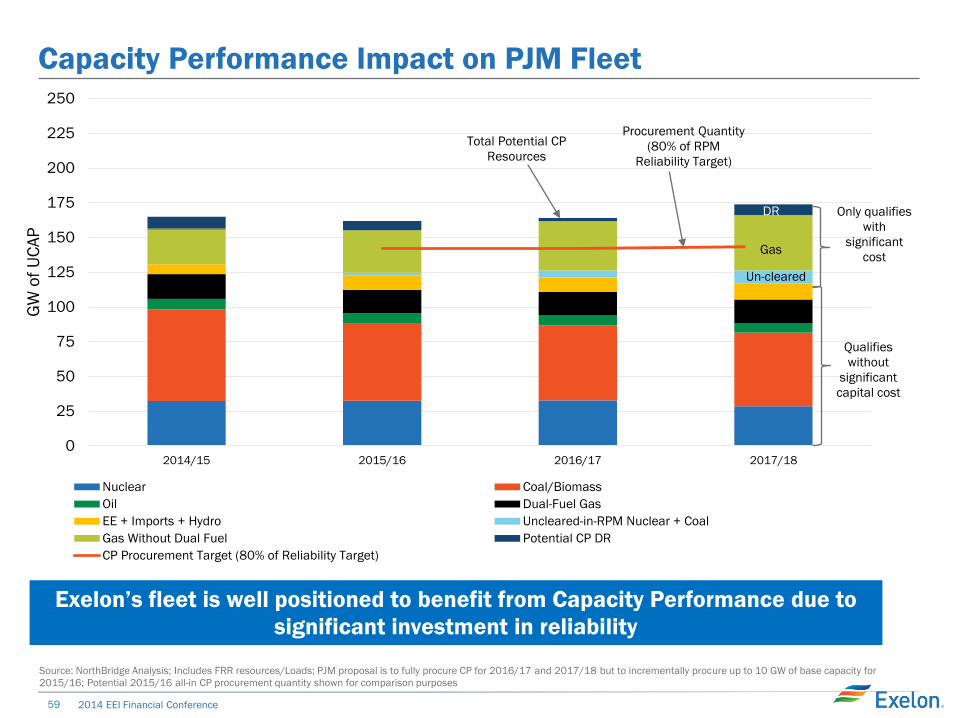
Capacity Performance Impact on PJM Fleet
0
25
50
75
100
125
150
175
200
225
250
2014/15 2015/16 2016/17 2017/18
GW
of
UC
AP
Nuclear Coal/Biomass
Oil Dual-Fuel Gas
EE + Imports + Hydro Uncleared-in-RPM Nuclear + Coal
Gas Without Dual Fuel Potential CP DR
CP Procurement Target (80% of Reliability Target)
Gas
DR
Total Potential CP
Resources
Procurement Quantity
(80% of RPM
Reliability Target)
Source: NorthBridge Analysis; Includes FRR resources/Loads; PJM proposal is to fully procure CP for 2016/17 and 2017/18 but to incrementally procure up to 10 GW of base capacity for
2015/16; Potential 2015/16 all-in CP procurement quantity shown for comparison purposes
Only qualifies
with
significant
cost
Qualifies
without
significant
capital cost
Un-cleared
Exelon’s fleet is well positioned to benefit from Capacity Performance due to
significant investment in reliability
60 2014 EEI Financial Conference
Exelon Generation Disclosures
As of September 30, 2014
61 2014 EEI Financial Conference
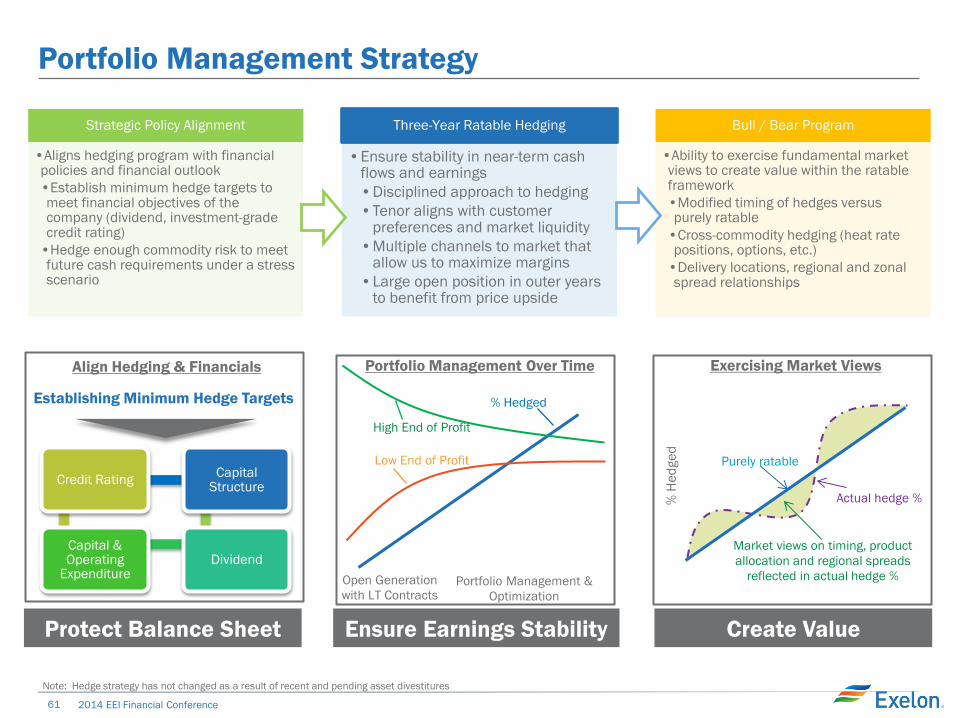
Portfolio Management Strategy
Protect Balance Sheet Ensure Earnings Stability Create Value
Strategic Policy Alignment
•Aligns hedging program with financial policies and financial outlook
•Establish minimum hedge targets to meet financial objectives of the company (dividend, investment-grade credit rating)
•Hedge enough commodity risk to meet future cash requirements under a stress scenario
Three-Year Ratable Hedging
•Ensure stability in near-term cash flows and earnings
•Disciplined approach to hedging
•Tenor aligns with customer preferences and market liquidity
•Multiple channels to market that allow us to maximize margins
•Large open position in outer years to benefit from price upside
Bull / Bear Program
•Ability to exercise fundamental market views to create value within the ratable framework
•Modified timing of hedges versus purely ratable
•Cross-commodity hedging (heat rate positions, options, etc.)
•Delivery locations, regional and zonal spread relationships
Exercising Market Views
% H
ed
ge
d
Purely ratable
Actual hedge %
Market views on timing, product
allocation and regional spreads
reflected in actual hedge %
High End of Profit
Low End of Profit
% Hedged
Open Generation
with LT Contracts Portfolio Management &
Optimization
Portfolio Management Over Time Align Hedging & Financials
Establishing Minimum Hedge Targets
Credit Rating
Capital & Operating
Expenditure Dividend
Capital Structure
Note: Hedge strategy has not changed as a result of recent and pending asset divestitures
62 2014 EEI Financial Conference
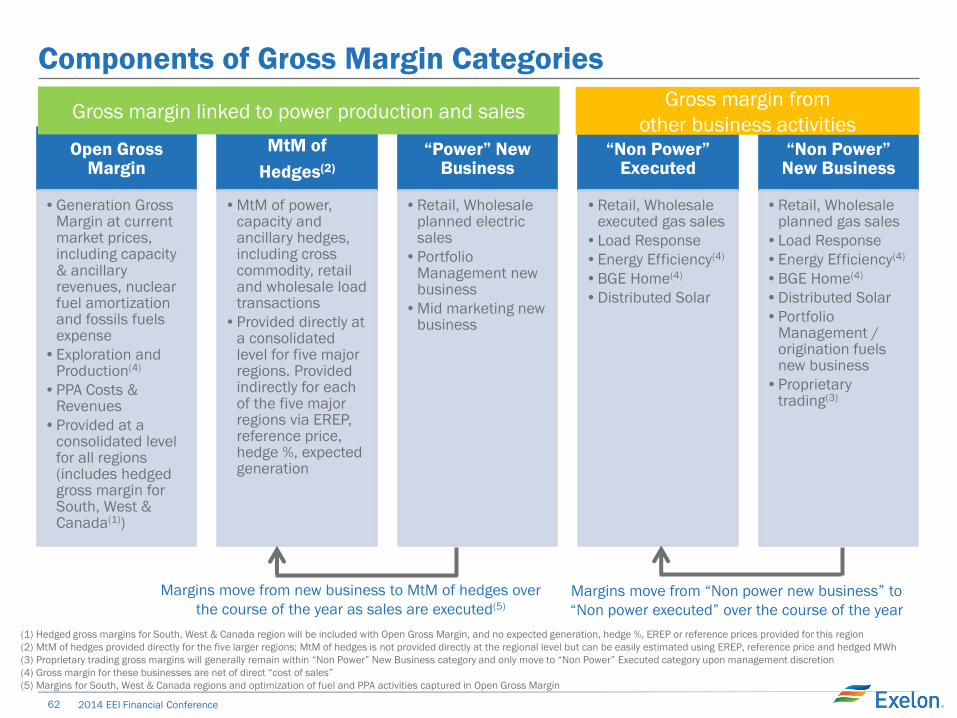
Components of Gross Margin Categories
Open Gross Margin
•Generation Gross Margin at current market prices, including capacity & ancillary revenues, nuclear fuel amortization and fossils fuels expense
•Exploration and Production(4)
•PPA Costs & Revenues
•Provided at a consolidated level for all regions (includes hedged gross margin for South, West & Canada(1))
MtM of
Hedges(2)
•MtM of power, capacity and ancillary hedges, including cross commodity, retail and wholesale load transactions
•Provided directly at a consolidated level for five major regions. Provided indirectly for each of the five major regions via EREP, reference price, hedge %, expected generation
“Power” New Business
•Retail, Wholesale planned electric sales
•Portfolio Management new business
•Mid marketing new business
“Non Power” Executed
•Retail, Wholesale executed gas sales
•Load Response
•Energy Efficiency(4)
•BGE Home(4)
•Distributed Solar
“Non Power” New Business
•Retail, Wholesale planned gas sales
•Load Response
•Energy Efficiency(4)
•BGE Home(4)
•Distributed Solar
•Portfolio Management / origination fuels new business
•Proprietary trading(3)
Margins move from new business to MtM of hedges over
the course of the year as sales are executed(5)
Margins move from “Non power new business” to
“Non power executed” over the course of the year
Gross margin linked to power production and sales Gross margin from
other business activities
(1) Hedged gross margins for South, West & Canada region will be included with Open Gross Margin, and no expected generation, hedge %, EREP or reference prices provided for this region
(2) MtM of hedges provided directly for the five larger regions; MtM of hedges is not provided directly at the regional level but can be easily estimated using EREP, reference price and hedged MWh
(3) Proprietary trading gross margins will generally remain within “Non Power” New Business category and only move to “Non Power” Executed category upon management discretion
(4) Gross margin for these businesses are net of direct “cost of sales”
(5) Margins for South, West & Canada regions and optimization of fuel and PPA activities captured in Open Gross Margin
63 2014 EEI Financial Conference
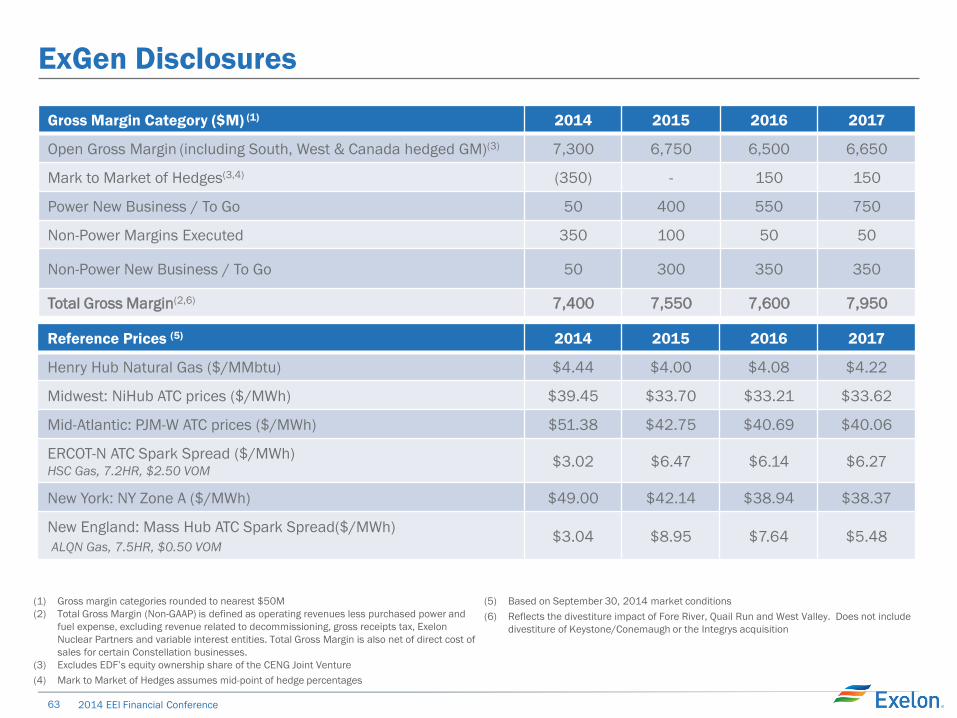
ExGen Disclosures
Gross Margin Category ($M) (1) 2014 2015 2016 2017
Open Gross Margin (including South, West & Canada hedged GM)(3) 7,300 6,750 6,500 6,650
Mark to Market of Hedges(3,4) (350) - 150 150
Power New Business / To Go 50 400 550 750
Non-Power Margins Executed 350 100 50 50
Non-Power New Business / To Go 50 300 350 350
Total Gross Margin(2,6) 7,400 7,550 7,600 7,950
Reference Prices (5) 2014 2015 2016 2017
Henry Hub Natural Gas ($/MMbtu) $4.44 $4.00 $4.08 $4.22
Midwest: NiHub ATC prices ($/MWh) $39.45 $33.70 $33.21 $33.62
Mid-Atlantic: PJM-W ATC prices ($/MWh) $51.38 $42.75 $40.69 $40.06
ERCOT-N ATC Spark Spread ($/MWh) HSC Gas, 7.2HR, $2.50 VOM
$3.02 $6.47 $6.14 $6.27
New York: NY Zone A ($/MWh) $49.00 $42.14 $38.94 $38.37
New England: Mass Hub ATC Spark Spread($/MWh)
ALQN Gas, 7.5HR, $0.50 VOM $3.04 $8.95 $7.64 $5.48
(1) Gross margin categories rounded to nearest $50M
(2) Total Gross Margin (Non-GAAP) is defined as operating revenues less purchased power and
fuel expense, excluding revenue related to decommissioning, gross receipts tax, Exelon
Nuclear Partners and variable interest entities. Total Gross Margin is also net of direct cost of
sales for certain Constellation businesses.
(3) Excludes EDF’s equity ownership share of the CENG Joint Venture
(4) Mark to Market of Hedges assumes mid-point of hedge percentages
(5) Based on September 30, 2014 market conditions
(6) Reflects the divestiture impact of Fore River, Quail Run and West Valley. Does not include
divestiture of Keystone/Conemaugh or the Integrys acquisition
64 2014 EEI Financial Conference
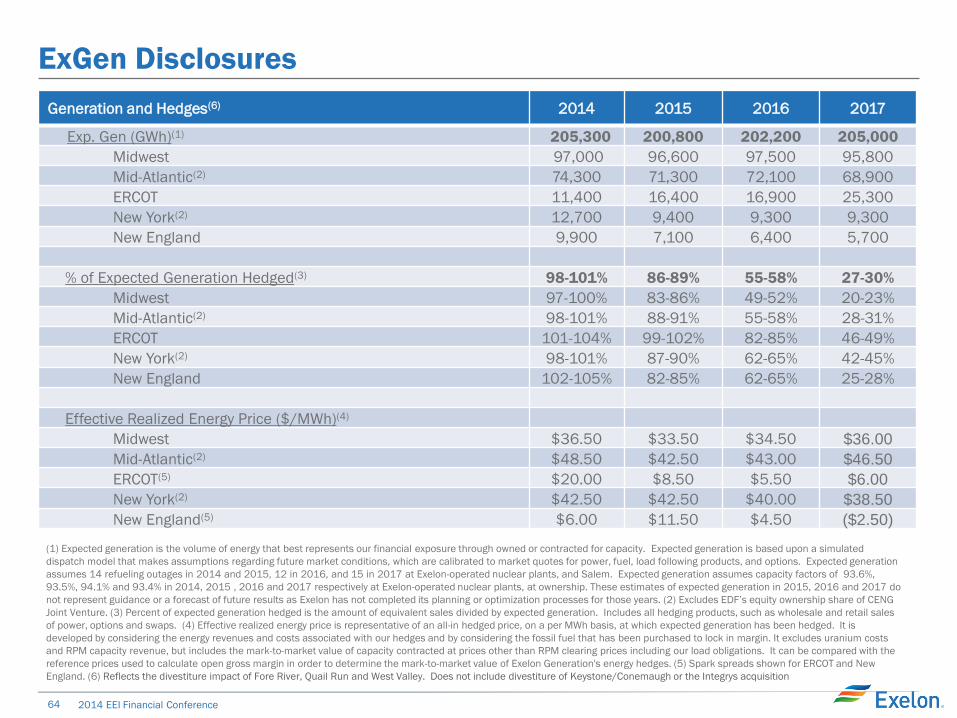
ExGen Disclosures
Generation and Hedges(6) 2014 2015 2016 2017
Exp. Gen (GWh)(1) 205,300 200,800 202,200 205,000
Midwest 97,000 96,600 97,500 95,800
Mid-Atlantic(2) 74,300 71,300 72,100 68,900
ERCOT 11,400 16,400 16,900 25,300
New York(2) 12,700 9,400 9,300 9,300
New England 9,900 7,100 6,400 5,700
% of Expected Generation Hedged(3) 98-101% 86-89% 55-58% 27-30%
Midwest 97-100% 83-86% 49-52% 20-23%
Mid-Atlantic(2) 98-101% 88-91% 55-58% 28-31%
ERCOT 101-104% 99-102% 82-85% 46-49%
New York(2) 98-101% 87-90% 62-65% 42-45%
New England 102-105% 82-85% 62-65% 25-28%
Effective Realized Energy Price ($/MWh)(4)
Midwest $36.50 $33.50 $34.50 $36.00
Mid-Atlantic(2) $48.50 $42.50 $43.00 $46.50
ERCOT(5) $20.00 $8.50 $5.50 $6.00
New York(2) $42.50 $42.50 $40.00 $38.50
New England(5) $6.00 $11.50 $4.50 ($2.50)
(1) Expected generation is the volume of energy that best represents our financial exposure through owned or contracted for capacity. Expected generation is based upon a simulated
dispatch model that makes assumptions regarding future market conditions, which are calibrated to market quotes for power, fuel, load following products, and options. Expected generation
assumes 14 refueling outages in 2014 and 2015, 12 in 2016, and 15 in 2017 at Exelon-operated nuclear plants, and Salem. Expected generation assumes capacity factors of 93.6%,
93.5%, 94.1% and 93.4% in 2014, 2015 , 2016 and 2017 respectively at Exelon-operated nuclear plants, at ownership. These estimates of expected generation in 2015, 2016 and 2017 do
not represent guidance or a forecast of future results as Exelon has not completed its planning or optimization processes for those years. (2) Excludes EDF’s equity ownership share of CENG
Joint Venture. (3) Percent of expected generation hedged is the amount of equivalent sales divided by expected generation. Includes all hedging products, such as wholesale and retail sales
of power, options and swaps. (4) Effective realized energy price is representative of an all-in hedged price, on a per MWh basis, at which expected generation has been hedged. It is
developed by considering the energy revenues and costs associated with our hedges and by considering the fossil fuel that has been purchased to lock in margin. It excludes uranium costs
and RPM capacity revenue, but includes the mark-to-market value of capacity contracted at prices other than RPM clearing prices including our load obligations. It can be compared with the
reference prices used to calculate open gross margin in order to determine the mark-to-market value of Exelon Generation's energy hedges. (5) Spark spreads shown for ERCOT and New
England. (6) Reflects the divestiture impact of Fore River, Quail Run and West Valley. Does not include divestiture of Keystone/Conemaugh or the Integrys acquisition
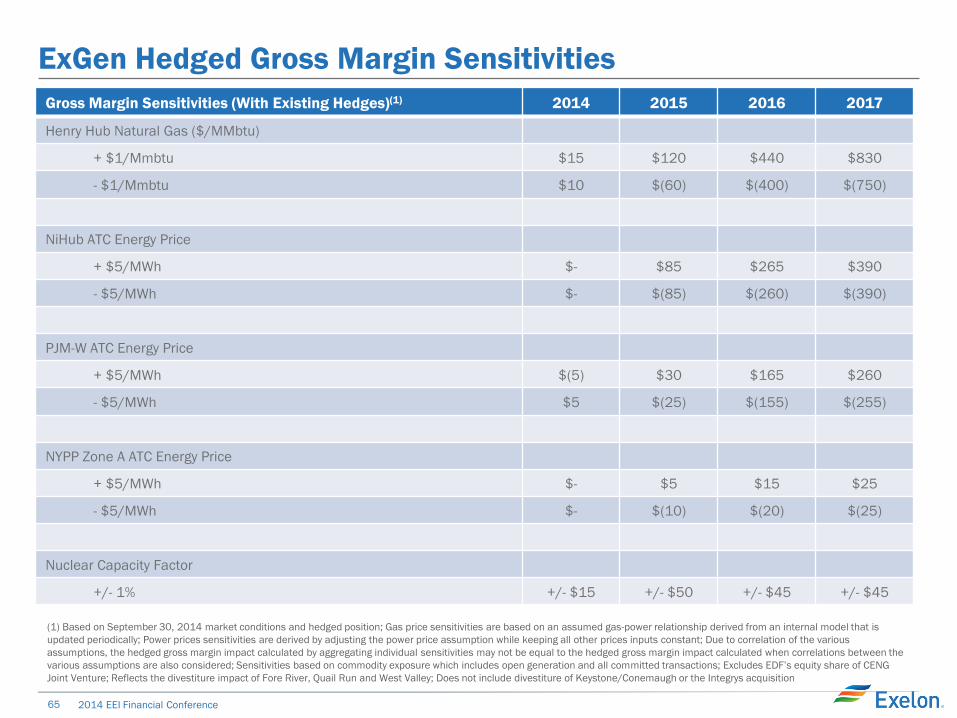
65 2014 EEI Financial Conference
ExGen Hedged Gross Margin Sensitivities
(1) Based on September 30, 2014 market conditions and hedged position; Gas price sensitivities are based on an assumed gas-power relationship derived from an internal model that is
updated periodically; Power prices sensitivities are derived by adjusting the power price assumption while keeping all other prices inputs constant; Due to correlation of the various
assumptions, the hedged gross margin impact calculated by aggregating individual sensitivities may not be equal to the hedged gross margin impact calculated when correlations between the
various assumptions are also considered; Sensitivities based on commodity exposure which includes open generation and all committed transactions; Excludes EDF’s equity share of CENG
Joint Venture; Reflects the divestiture impact of Fore River, Quail Run and West Valley; Does not include divestiture of Keystone/Conemaugh or the Integrys acquisition
Gross Margin Sensitivities (With Existing Hedges)(1) 2014 2015 2016 2017
Henry Hub Natural Gas ($/MMbtu)
+ $1/Mmbtu $15 $120 $440 $830
- $1/Mmbtu $10 $(60) $(400) $(750)
NiHub ATC Energy Price
+ $5/MWh $- $85 $265 $390
- $5/MWh $- $(85) $(260) $(390)
PJM-W ATC Energy Price
+ $5/MWh $(5) $30 $165 $260
- $5/MWh $5 $(25) $(155) $(255)
NYPP Zone A ATC Energy Price
+ $5/MWh $- $5 $15 $25
- $5/MWh $- $(10) $(20) $(25)
Nuclear Capacity Factor
+/- 1% +/- $15 +/- $50 +/- $45 +/- $45
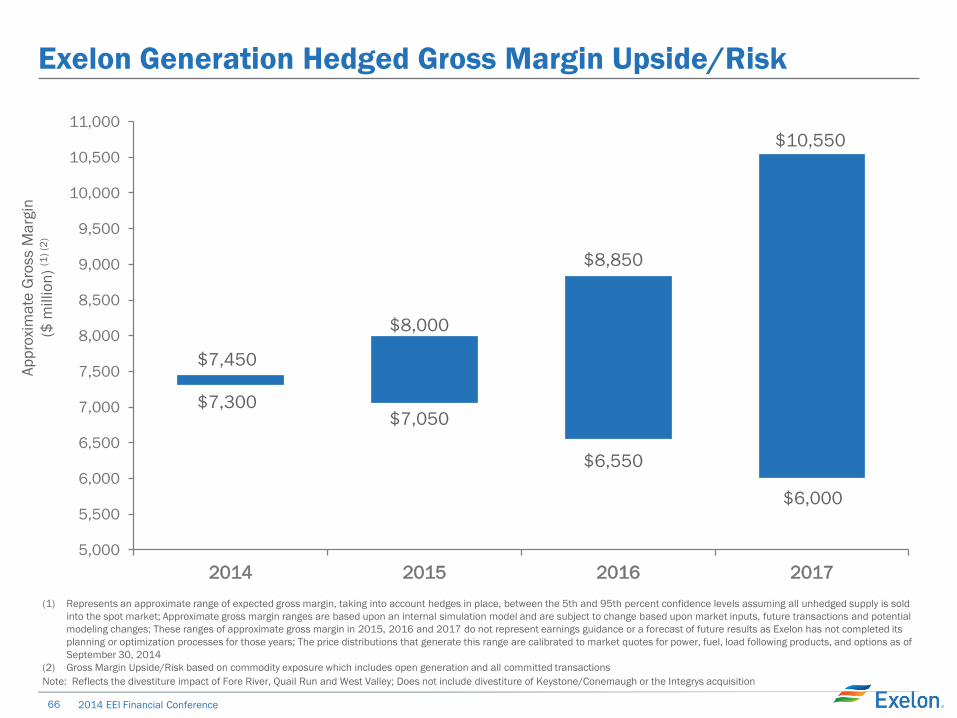
66 2014 EEI Financial Conference
Exelon Generation Hedged Gross Margin Upside/Risk
(1) Represents an approximate range of expected gross margin, taking into account hedges in place, between the 5th and 95th percent confidence levels assuming all unhedged supply is sold
into the spot market; Approximate gross margin ranges are based upon an internal simulation model and are subject to change based upon market inputs, future transactions and potential
modeling changes; These ranges of approximate gross margin in 2015, 2016 and 2017 do not represent earnings guidance or a forecast of future results as Exelon has not completed its
planning or optimization processes for those years; The price distributions that generate this range are calibrated to market quotes for power, fuel, load following products, and options as of
September 30, 2014
(2) Gross Margin Upside/Risk based on commodity exposure which includes open generation and all committed transactions
5,000
5,500
6,000
6,500
7,000
7,500
8,000
8,500
9,000
9,500
10,000
10,500
11,000
2014 2015 2016 2017
$8,850
$6,550
$10,550
$6,000
$7,450
$7,300
$8,000
$7,050
Note: Reflects the divestiture impact of Fore River, Quail Run and West Valley; Does not include divestiture of Keystone/Conemaugh or the Integrys acquisition
Ap
pro
xim
ate
Gro
ss M
arg
in
($ m
illio
n)
(1)
(2)
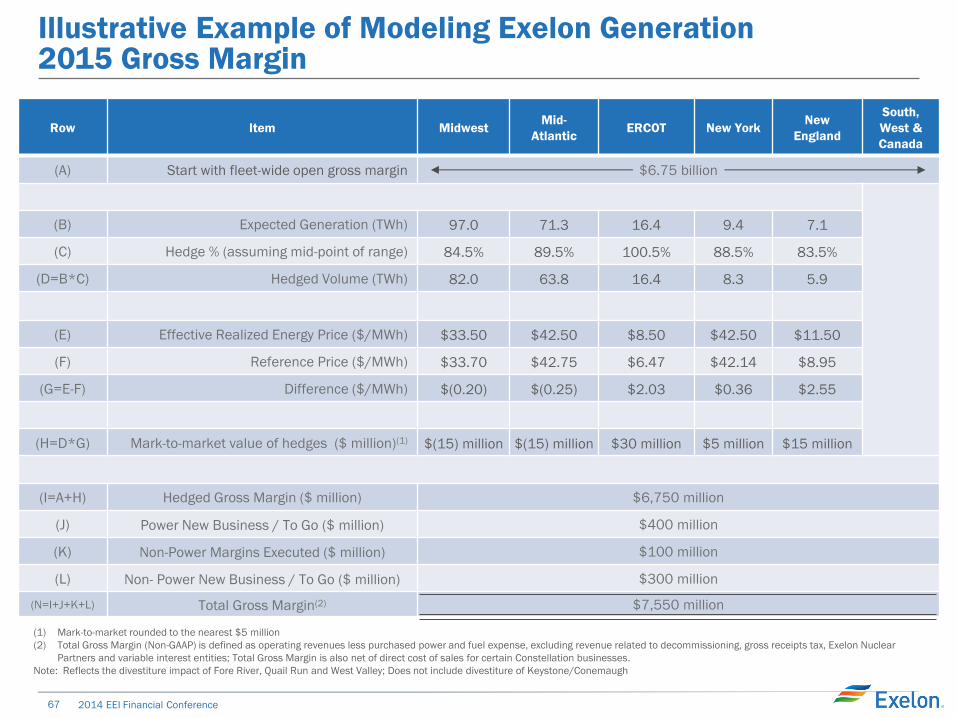
67 2014 EEI Financial Conference
(1) Mark-to-market rounded to the nearest $5 million
(2) Total Gross Margin (Non-GAAP) is defined as operating revenues less purchased power and fuel expense, excluding revenue related to decommissioning, gross receipts tax, Exelon Nuclear
Partners and variable interest entities; Total Gross Margin is also net of direct cost of sales for certain Constellation businesses.
Note: Reflects the divestiture impact of Fore River, Quail Run and West Valley; Does not include divestiture of Keystone/Conemaugh
Illustrative Example of Modeling Exelon Generation 2015 Gross Margin
Row Item Midwest Mid-
Atlantic ERCOT New York
New
England
South,
West &
Canada
(A) Start with fleet-wide open gross margin $6.75 billion
(B) Expected Generation (TWh) 97.0 71.3 16.4 9.4 7.1
(C) Hedge % (assuming mid-point of range) 84.5% 89.5% 100.5% 88.5% 83.5%
(D=B*C) Hedged Volume (TWh) 82.0 63.8 16.4 8.3 5.9
(E) Effective Realized Energy Price ($/MWh) $33.50 $42.50 $8.50 $42.50 $11.50
(F) Reference Price ($/MWh) $33.70 $42.75 $6.47 $42.14 $8.95
(G=E-F) Difference ($/MWh) $(0.20) $(0.25) $2.03 $0.36 $2.55
(H=D*G) Mark-to-market value of hedges ($ million)(1) $(15) million $(15) million $30 million $5 million $15 million
(I=A+H) Hedged Gross Margin ($ million) $6,750 million
(J) Power New Business / To Go ($ million) $400 million
(K) Non-Power Margins Executed ($ million) $100 million
(L) Non- Power New Business / To Go ($ million) $300 million
(N=I+J+K+L) Total Gross Margin(2) $7,550 million
Generation
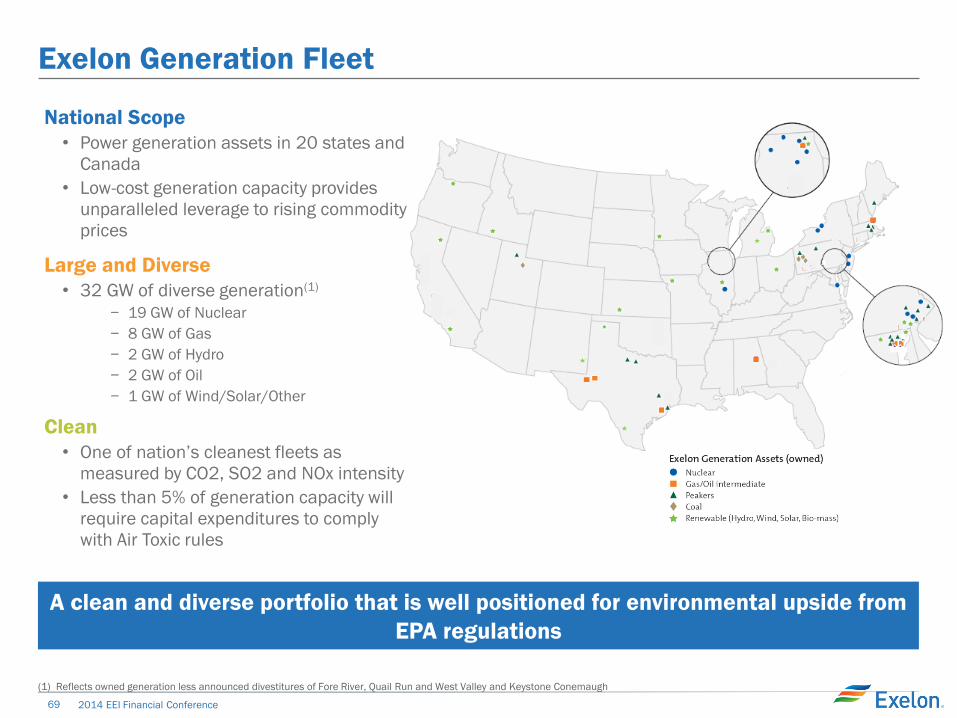
69 2014 EEI Financial Conference
Exelon Generation Fleet
A clean and diverse portfolio that is well positioned for environmental upside from
EPA regulations
(1) Reflects owned generation less announced divestitures of Fore River, Quail Run and West Valley and Keystone Conemaugh
National Scope
• Power generation assets in 20 states and
Canada
• Low-cost generation capacity provides
unparalleled leverage to rising commodity
prices
Large and Diverse
• 32 GW of diverse generation(1)
− 19 GW of Nuclear
− 8 GW of Gas
− 2 GW of Hydro
− 2 GW of Oil
− 1 GW of Wind/Solar/Other
Clean
• One of nation’s cleanest fleets as
measured by CO2, SO2 and NOx intensity
• Less than 5% of generation capacity will
require capital expenditures to comply
with Air Toxic rules
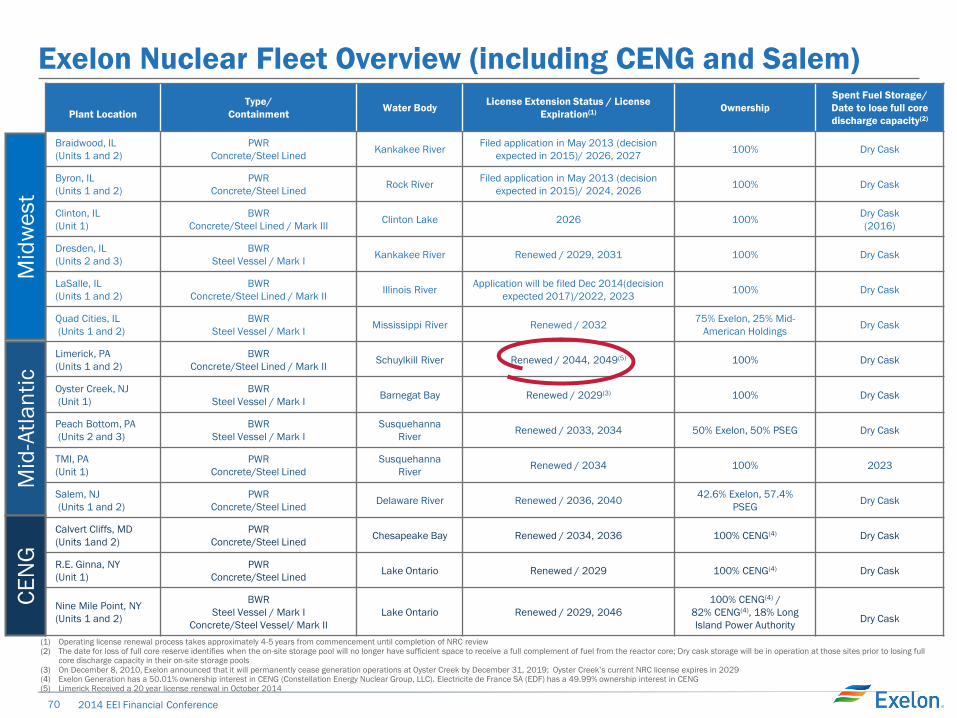
70 2014 EEI Financial Conference
Exelon Nuclear Fleet Overview (including CENG and Salem)
Plant Location
Type/
Containment Water Body
License Extension Status / License
Expiration(1) Ownership
Spent Fuel Storage/
Date to lose full core
discharge capacity(2)
Braidwood, IL
(Units 1 and 2)
PWR
Concrete/Steel Lined Kankakee River
Filed application in May 2013 (decision
expected in 2015)/ 2026, 2027 100% Dry Cask
Byron, IL
(Units 1 and 2)
PWR
Concrete/Steel Lined Rock River
Filed application in May 2013 (decision
expected in 2015)/ 2024, 2026 100% Dry Cask
Clinton, IL
(Unit 1)
BWR
Concrete/Steel Lined / Mark III Clinton Lake 2026 100%
Dry Cask
(2016)
Dresden, IL
(Units 2 and 3)
BWR
Steel Vessel / Mark I Kankakee River Renewed / 2029, 2031 100% Dry Cask
LaSalle, IL
(Units 1 and 2)
BWR
Concrete/Steel Lined / Mark II Illinois River
Application will be filed Dec 2014(decision
expected 2017)/2022, 2023 100% Dry Cask
Quad Cities, IL
(Units 1 and 2)
BWR
Steel Vessel / Mark I Mississippi River Renewed / 2032
75% Exelon, 25% Mid-
American Holdings Dry Cask
Limerick, PA
(Units 1 and 2)
BWR
Concrete/Steel Lined / Mark II Schuylkill River Renewed / 2044, 2049(5) 100% Dry Cask
Oyster Creek, NJ
(Unit 1)
BWR
Steel Vessel / Mark I Barnegat Bay Renewed / 2029(3) 100% Dry Cask
Peach Bottom, PA
(Units 2 and 3)
BWR
Steel Vessel / Mark I
Susquehanna
River Renewed / 2033, 2034 50% Exelon, 50% PSEG Dry Cask
TMI, PA
(Unit 1)
PWR
Concrete/Steel Lined
Susquehanna
River Renewed / 2034 100% 2023
Salem, NJ
(Units 1 and 2)
PWR
Concrete/Steel Lined Delaware River Renewed / 2036, 2040
42.6% Exelon, 57.4%
PSEG Dry Cask
Calvert Cliffs, MD
(Units 1and 2)
PWR
Concrete/Steel Lined Chesapeake Bay Renewed / 2034, 2036 100% CENG(4) Dry Cask
R.E. Ginna, NY
(Unit 1)
PWR
Concrete/Steel Lined Lake Ontario Renewed / 2029 100% CENG(4) Dry Cask
Nine Mile Point, NY
(Units 1 and 2)
BWR
Steel Vessel / Mark I
Concrete/Steel Vessel/ Mark II
Lake Ontario Renewed / 2029, 2046
100% CENG(4) /
82% CENG(4), 18% Long
Island Power Authority
Dry Cask
(1) Operating license renewal process takes approximately 4-5 years from commencement until completion of NRC review (2) The date for loss of full core reserve identifies when the on-site storage pool will no longer have sufficient space to receive a full complement of fuel from the reactor core; Dry cask storage will be in operation at those sites prior to losing full
core discharge capacity in their on-site storage pools (3) On December 8, 2010, Exelon announced that it will permanently cease generation operations at Oyster Creek by December 31, 2019; Oyster Creek’s current NRC license expires in 2029 (4) Exelon Generation has a 50.01% ownership interest in CENG (Constellation Energy Nuclear Group, LLC). Electricite de France SA (EDF) has a 49.99% ownership interest in CENG (5) Limerick Received a 20 year license renewal in October 2014
Mid
we
st
Mid
-Atl
an
tic
CE
NG
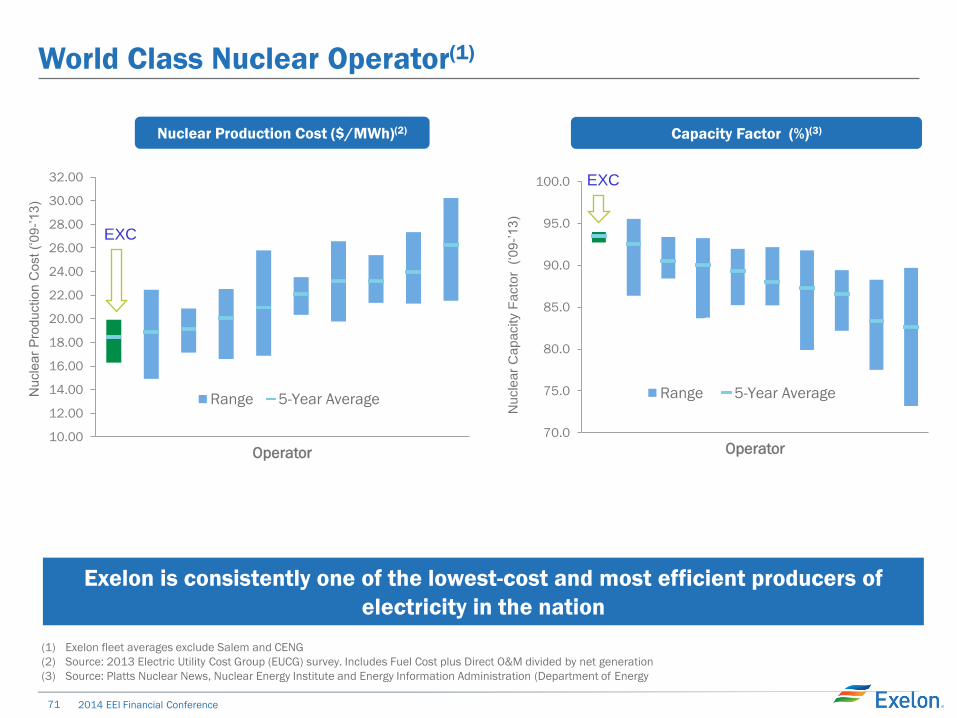
71 2014 EEI Financial Conference
World Class Nuclear Operator(1)
10.00
12.00
14.00
16.00
18.00
20.00
22.00
24.00
26.00
28.00
30.00
32.00
Operator
Range 5-Year Average
70.0
75.0
80.0
85.0
90.0
95.0
100.0
Operator
Range 5-Year Average
31%
36%
14%
14%
1,208 1,169 1,104
(1) Exelon fleet averages exclude Salem and CENG
(2) Source: 2013 Electric Utility Cost Group (EUCG) survey. Includes Fuel Cost plus Direct O&M divided by net generation
(3) Source: Platts Nuclear News, Nuclear Energy Institute and Energy Information Administration (Department of Energy
Nuclear Production Cost ($/MWh)(2) Capacity Factor (%)(3)
Nucle
ar
Pro
duction C
ost (‘
09-’13)
EXC
Nucle
ar
Capacity F
acto
r (
‘09-’13)
EXC
Exelon is consistently one of the lowest-cost and most efficient producers of
electricity in the nation
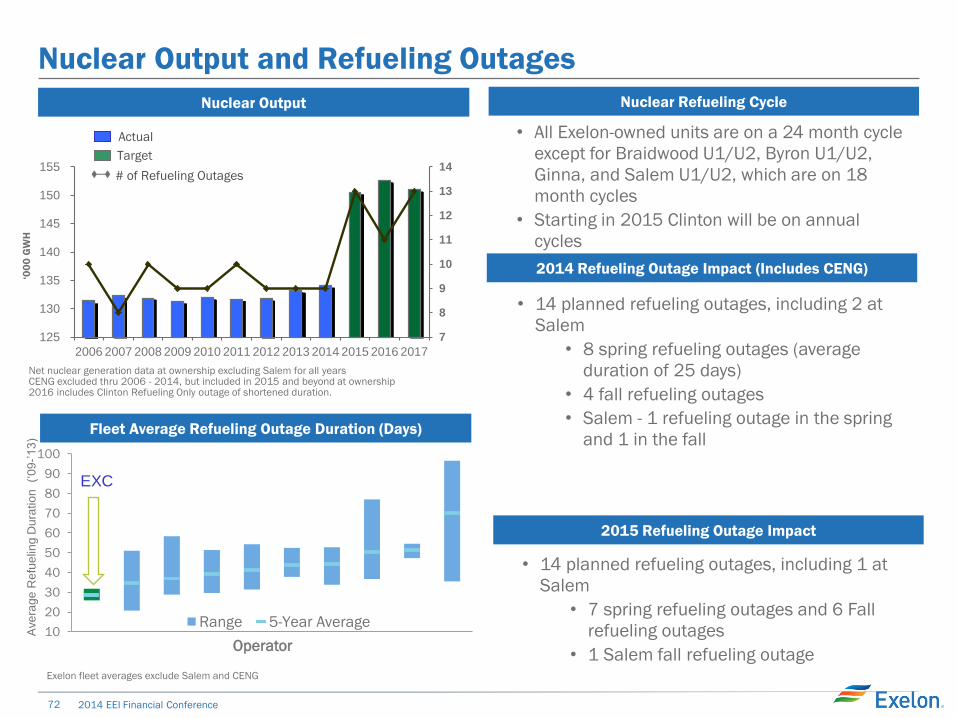
72 2014 EEI Financial Conference
Net nuclear generation data at ownership excluding Salem for all years CENG excluded thru 2006 - 2014, but included in 2015 and beyond at ownership 2016 includes Clinton Refueling Only outage of shortened duration.
10
20
30
40
50
60
70
80
90
100
Operator
Range 5-Year Average
Nuclear Output and Refueling Outages
Fleet Average Refueling Outage Duration (Days)
31%
36%
14%
14%
Nuclear Output
‘00
0 G
WH
1,208 1,169 1,104
Nuclear Refueling Cycle
• All Exelon-owned units are on a 24 month cycle
except for Braidwood U1/U2, Byron U1/U2,
Ginna, and Salem U1/U2, which are on 18
month cycles
• Starting in 2015 Clinton will be on annual
cycles
7
8
9
10
11
12
13
14
125
130
135
140
145
150
155
2006 2007 2008 2009 2010 2011 2012 2013 2014 2015 2016 2017
Actual
Target
# of Refueling Outages
2014 Refueling Outage Impact (Includes CENG)
• 14 planned refueling outages, including 2 at
Salem
• 8 spring refueling outages (average
duration of 25 days)
• 4 fall refueling outages
• Salem - 1 refueling outage in the spring
and 1 in the fall
2015 Refueling Outage Impact
• 14 planned refueling outages, including 1 at
Salem
• 7 spring refueling outages and 6 Fall
refueling outages
• 1 Salem fall refueling outage
Ave
rag
e R
efu
elin
g D
ura
tio
n
(‘0
9-’
13
)
Exelon fleet averages exclude Salem and CENG
EXC
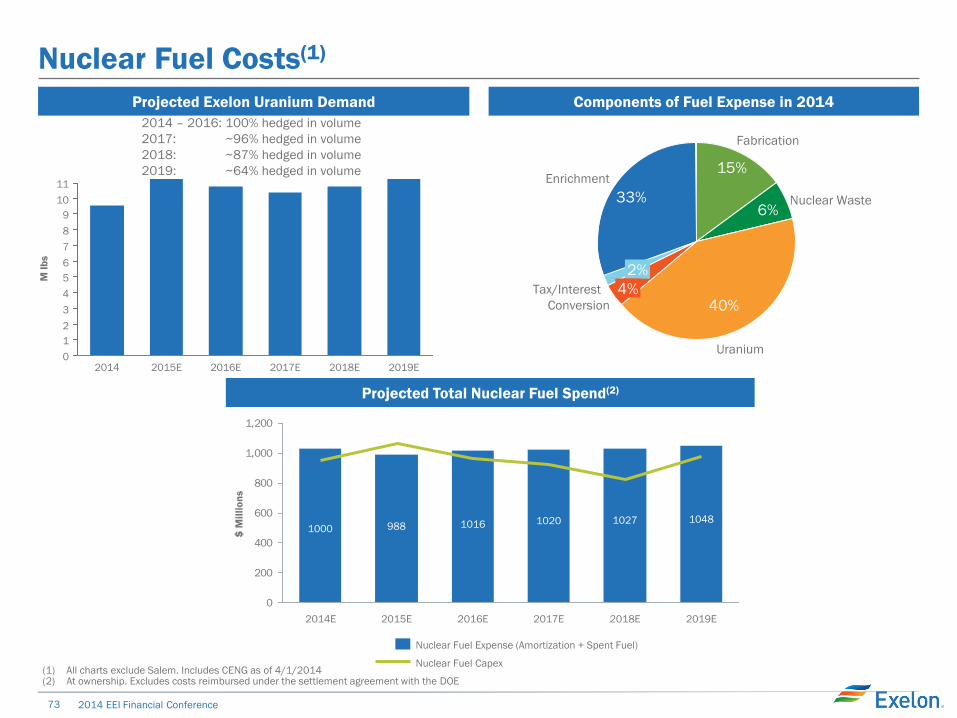
73 2014 EEI Financial Conference
Nuclear Fuel Costs(1)
Projected Exelon Uranium Demand Components of Fuel Expense in 2014
2014 – 2016: 100% hedged in volume
2017: ~96% hedged in volume
2018: ~87% hedged in volume
2019: ~64% hedged in volume
2
1
0
11
10
9
8
7
6
5
4
3
2019E 2018E 2017E 2016E 2015E 2014
M l
bs
Enrichment
33%
Tax/Interest
2%
Conversion
4%
Uranium
40%
Nuclear Waste 6%
Fabrication
15%
Projected Exelon Average
Uranium Cost vs. Mar
(1) All charts exclude Salem. Includes CENG as of 4/1/2014 (2) At ownership. Excludes costs reimbursed under the settlement agreement with the DOE
Projected Total Nuclear Fuel Spend(2)
0
200
400
600
800
1,000
1,200
2019E
1048
2018E
1027
2017E
1020
2016E
1016
2015E
988
2014E
1000
Nuclear Fuel Capex
Nuclear Fuel Expense (Amortization + Spent Fuel)
$ M
illi
on
s
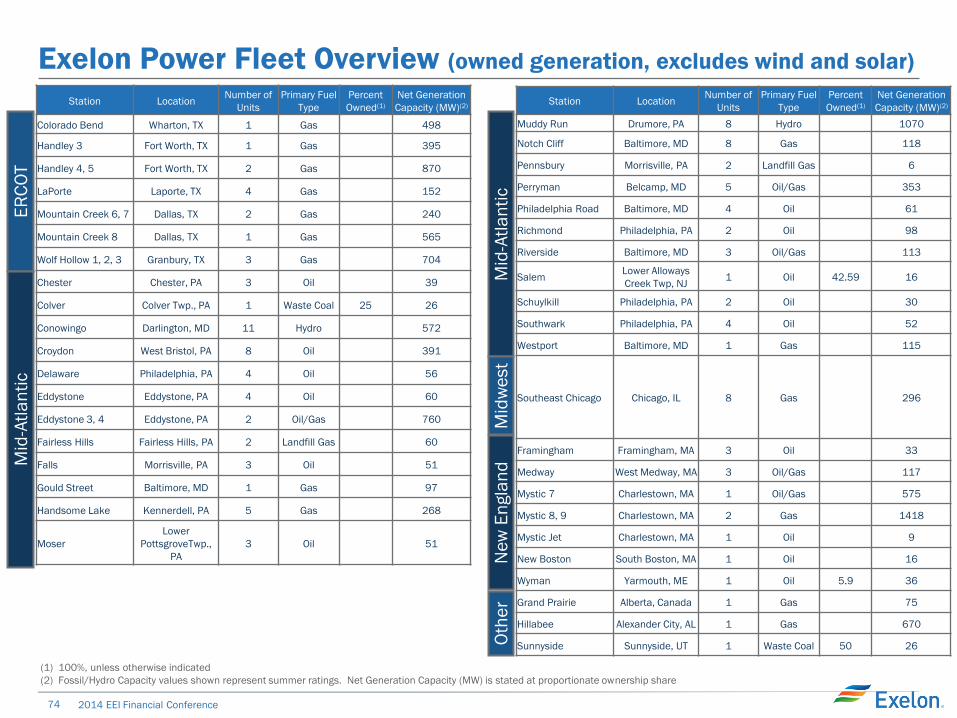
74 2014 EEI Financial Conference
Exelon Power Fleet Overview (owned generation, excludes wind and solar)
(1) 100%, unless otherwise indicated
(2) Fossil/Hydro Capacity values shown represent summer ratings. Net Generation Capacity (MW) is stated at proportionate ownership share
ER
CO
T
Mid
-Atl
an
tic
Station Location Number of
Units
Primary Fuel
Type
Percent
Owned(1)
Net Generation
Capacity (MW)(2)
Muddy Run Drumore, PA 8 Hydro 1070
Notch Cliff Baltimore, MD 8 Gas 118
Pennsbury Morrisville, PA 2 Landfill Gas 6
Perryman Belcamp, MD 5 Oil/Gas 353
Philadelphia Road Baltimore, MD 4 Oil 61
Richmond Philadelphia, PA 2 Oil 98
Riverside Baltimore, MD 3 Oil/Gas 113
Salem Lower Alloways
Creek Twp, NJ 1 Oil 42.59 16
Schuylkill Philadelphia, PA 2 Oil 30
Southwark Philadelphia, PA 4 Oil 52
Westport Baltimore, MD 1 Gas 115
Southeast Chicago Chicago, IL 8 Gas 296
Framingham Framingham, MA 3 Oil 33
Medway West Medway, MA 3 Oil/Gas 117
Mystic 7 Charlestown, MA 1 Oil/Gas 575
Mystic 8, 9 Charlestown, MA 2 Gas 1418
Mystic Jet Charlestown, MA 1 Oil 9
New Boston South Boston, MA 1 Oil 16
Wyman Yarmouth, ME 1 Oil 5.9 36
Grand Prairie Alberta, Canada 1 Gas 75
Hillabee Alexander City, AL 1 Gas 670
Sunnyside Sunnyside, UT 1 Waste Coal 50 26
Mid
-Atl
an
tic
Ne
w E
ngla
nd
O
the
r M
idw
est
Station Location Number of
Units
Primary Fuel
Type
Percent
Owned(1)
Net Generation
Capacity (MW)(2)
Colorado Bend Wharton, TX 1 Gas 498
Handley 3 Fort Worth, TX 1 Gas 395
Handley 4, 5 Fort Worth, TX 2 Gas 870
LaPorte Laporte, TX 4 Gas 152
Mountain Creek 6, 7 Dallas, TX 2 Gas 240
Mountain Creek 8 Dallas, TX 1 Gas 565
Wolf Hollow 1, 2, 3 Granbury, TX 3 Gas 704
Chester Chester, PA 3 Oil 39
Colver Colver Twp., PA 1 Waste Coal 25 26
Conowingo Darlington, MD 11 Hydro 572
Croydon West Bristol, PA 8 Oil 391
Delaware Philadelphia, PA 4 Oil 56
Eddystone Eddystone, PA 4 Oil 60
Eddystone 3, 4 Eddystone, PA 2 Oil/Gas 760
Fairless Hills Fairless Hills, PA 2 Landfill Gas 60
Falls Morrisville, PA 3 Oil 51
Gould Street Baltimore, MD 1 Gas 97
Handsome Lake Kennerdell, PA 5 Gas 268
Moser
Lower
PottsgroveTwp.,
PA
3 Oil 51
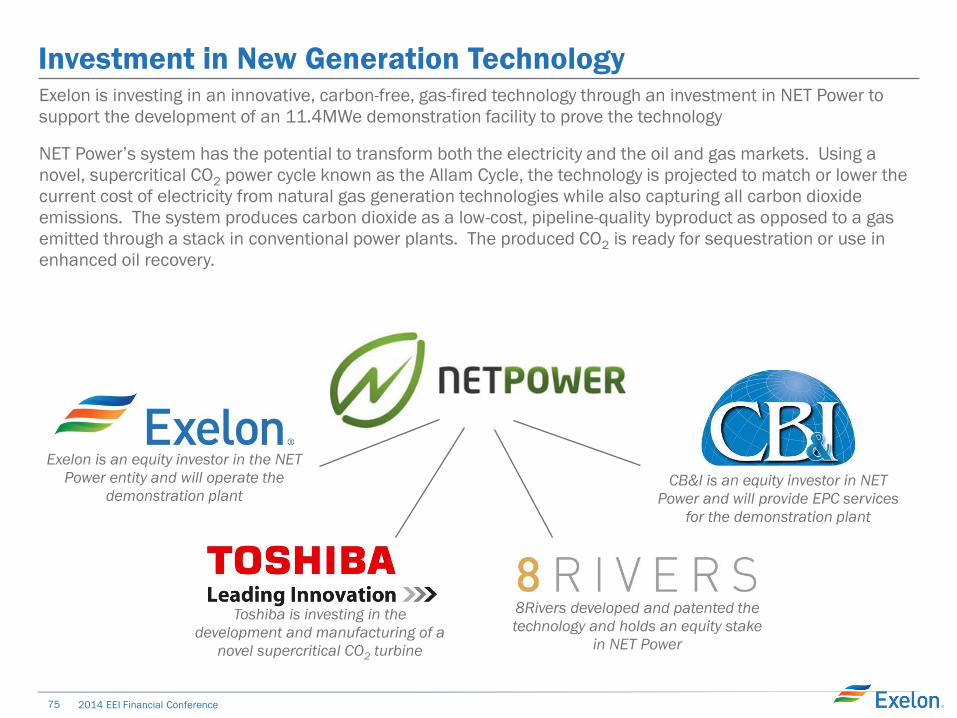
75 2014 EEI Financial Conference
Investment in New Generation Technology Exelon is investing in an innovative, carbon-free, gas-fired technology through an investment in NET Power to
support the development of an 11.4MWe demonstration facility to prove the technology
NET Power’s system has the potential to transform both the electricity and the oil and gas markets. Using a
novel, supercritical CO2 power cycle known as the Allam Cycle, the technology is projected to match or lower the
current cost of electricity from natural gas generation technologies while also capturing all carbon dioxide
emissions. The system produces carbon dioxide as a low-cost, pipeline-quality byproduct as opposed to a gas
emitted through a stack in conventional power plants. The produced CO2 is ready for sequestration or use in
enhanced oil recovery.
Exelon is an equity investor in the NET
Power entity and will operate the
demonstration plant
8Rivers developed and patented the
technology and holds an equity stake
in NET Power
CB&I is an equity investor in NET
Power and will provide EPC services
for the demonstration plant
Toshiba is investing in the
development and manufacturing of a
novel supercritical CO2 turbine


![Report on Comments — Copyright, NFPA NFPA 2001 · Clifford R. Sinopoli, II, Secretary Exelon Corporation, PA [U] Rep. Edison Electric Institute Douglas J. Barylski, U.S. Department](https://img.pdfslide.net/doc/110x75/5ac503e97f8b9ae06c8d8970/report-on-comments-copyright-nfpa-nfpa-2001-r-sinopoli-ii-secretary-exelon.jpg)