Embed Size (px)
Citation preview

EDITED BY
Masahiro Kawai Peter J. MorganPradumna B. Rana
New Global Economic Architecture
The Asian Perspective
New Global Economic Architecture
ADBI SERIES ON ASIAN ECONOMIC INTEGRATION AND COOPERATION
Previous titles published in association with ADBI include:
Infrastructure and Trade in Asia Edited by Douglas H. Brooks and Jayant Menon
Infrastructure’s Role in Lowering Asia’s Trade Costs Building for Trade Edited by Douglas H. Brooks and David Hummels
Trade Facilitation and Regional Cooperation in Asia Edited by Douglas H. Brooks and Susan F. Stone
Managing Capital Flows The Search for a Framework Edited by Masahiro Kawai and Mario B. Lamberte
The Asian Tsunami Aid and Reconstruction after a Disaster Edited by Sisira Jayasuriya and Peter McCawley
Asia’s Free Trade Agreements How is Business Responding? Edited by Masahiro Kawai and Ganeshan Wignaraja
Monetary and Currency Policy Management in Asia Edited by Masahiro Kawai, Peter J. Morgan and Shinji Takagi
Implications of the Global Financial Crisis for Financial Reform and Regulation in Asia Edited by Masahiro Kawai, David G. Mayes and Peter J. Morgan
Infrastructure for Asian Connectivity Edited by Biswa Nath Bhattacharyay, Masahiro Kawai and Rajat M. Nag
A World Trade Organization for the 21st Century The Asian Perspective Edited by Richard Baldwin, Masahiro Kawai and Ganeshan Wignaraja
New Global Economic Architecture The Asian Perspective Edited by Masahiro Kawai, Peter J. Morgan and Pradumna B. Rana
The Asian Development Bank Institute (ADBI), located in Tokyo, is the think tank of the Asian Development Bank (ADB). ADBI’s mission is to identify effec-tive development strategies and improve development management in ADB’s developing member countries. ADBI has an extensive network of partners in the Asia and Pacific region and globally. ADBI’s activities are aligned with ADB’s strategic focus, which includes poverty reduction and inclusive economic growth, the environment, regional cooperation and integration, infrastructure development, middle-income countries, and private sector development and operations.
New Global Economic
ArchitectureThe Asian Perspective
Edited by
Masahiro Kawai
Project Professor, Graduate School of Public Policy, University
of Tokyo, Japan
Peter J. Morgan
Senior Consultant for Research, Asian Development Bank
Institute, Japan
Pradumna B. Rana
Associate Professor, S. Rajaratnam School of International
Studies, Nanyang Technological University, Singapore
Edward ElgarCheltenham, UK • Northampton, MA, USA
© Asian Development Bank Institute 2014
All rights reserved. No part of this publication may be reproduced, stored in a retrieval system or transmitted in any form or by any means, electronic, mechanical or photocopying, recording, or otherwise without the prior permission of the publisher.
Published byEdward Elgar Publishing LimitedThe Lypiatts15 Lansdown RoadCheltenhamGlos GL50 2JAUK
Edward Elgar Publishing, Inc.William Pratt House9 Dewey CourtNorthamptonMassachusetts 01060USA
A catalogue record for this bookis available from the British Library
Library of Congress Control Number: 2014941550
This book is available electronically in the ElgarOnline.com Economics Subject Collection, E-ISBN 978 1 78347 220 8
ISBN 978 1 78347 219 2
Typeset by Servis Filmsetting Ltd, Stockport, CheshirePrinted and bound in Great Britain by T.J. International Ltd, Padstow
v
Contents
List of contributors vii
Preface ix
List of abbreviations xii
1 Asian perspectives on the evolving global architecture 1
Masahiro Kawai, Peter J. Morgan and Pradumna B. Rana
2 From a centralized to a decentralized global economic
architecture: an overview 11
Pradumna B. Rana
3 The Group of Twenty: input and output legitimacy, reforms
and agenda 27
Andrew F. Cooper
4 Enhancing the effectiveness of CMIM and AMRO: challenges
and tasks 55
Reza Siregar and Akkharaphol Chabchitrchaidol
5 Financial safety nets in Asia: genesis, evolution, adequacy and
way forward 83
Hal Hill and Jayant Menon
6 Regional financial regulation in Asia 112
Masahiro Kawai and Peter J. Morgan
7 Evolving trade policy architecture and FTAs in Asia 148
Masahiro Kawai and Ganeshan Wignaraja
8 The emerging “post- Doha” agenda and the new regionalism
in the Asia- Pacific 172
Michael G. Plummer
9 The World Bank and the Asian Development Bank: should
Asia have both? 197
Vikram Nehru
vi New global economic architecture
10 World Bank, Inter- American Development Bank, and
subregional development banks in Latin America: dynamics of
a system of multilateral development banks 215
Fernando Prada
Index 249
vii
Contributors
Akkharaphol Chabchitrchaidol is Economist, ASEAN+3 Macroeconomic
Research Office (AMRO) in Singapore.
Andrew F. Cooper is Professor, Balsillie School of International Affairs
and Department of Political Science at the University of Waterloo,
Canada. He is also Distinguished Fellow at the Centre for International
Governance Innovation.
Hal Hill is H.W. Arndt Professor of Southeast Asian Economies in the
Arndt– Corden Department of Economics, Crawford School, College of
Asia and the Pacific, The Australian National University.
Masahiro Kawai is Project Professor, Graduate School of Public
Policy, University of Tokyo. He was formerly Dean and CEO, Asian
Development Bank Institute, Tokyo, Japan.
Jayant Menon is Lead Economist, Asian Development Bank, Manila,
Philippines.
Peter J. Morgan is Senior Consultant for Research, Asian Development
Bank Institute. He was formerly Chief Economist, HSBC, Hong Kong,
China.
Vikram Nehru is Senior Associate and Bakrie Chair in Southeast Asian
Studies, Carnegie Endowment for International Peace, Washington, DC,
USA. He was previously Chief Economist for East Asia and the Pacific at
the World Bank.
Michael G. Plummer is Director, SAIS Europe, and ENI Professor of
International Economics, Johns Hopkins University, Bologna, Italy and
(non-resident) Senior Fellow, East- West Center, Honolulu, USA.
Fernando Prada is Associate Researcher at FORO Nacional Internacional,
Lima, Peru.
Pradumna B. Rana is Associate Professor, International Political
Economy, S. Rajaratnam School of International Studies, Nanyang
Technological University, Singapore. He was formerly Senior Advisor of
viii New global economic architecture
the Office of Regional Economic Integration, Asian Development Bank,
Manila, Philippines.
Reza Siregar is Group Head and Lead Economist, ASEAN+3
Macroeconomic Research Office (AMRO) in Singapore.
Ganeshan Wignaraja is Director for Research, Asian Development Bank
Institute, Tokyo, Japan. He was formerly Principal Economist, Asian
Development Bank, Manila, Philippines.
ix
Preface
In the postwar period, the global economic architecture was dominated
by the advanced economies in the West. They designed the international
monetary system, international development financing frameworks and
global trade liberalization schemes. They also dominated the leadership of
key global institutions, such as the International Monetary Fund (IMF),
the World Bank and the World Trade Organization (WTO). They were
successful in sustaining long- term economic growth through the provision
of global public goods to promote international economic and financial
stability, economic reconstruction and development, and open, non-
discriminatory trade. The so- called Washington consensus was the sup-
porting philosophy behind these efforts.
Today, however, the balance of economic and financial power is shift-
ing toward the emerging economies, especially those in Asia, and both
global governance and economic policy thinking are beginning to reflect
this shift. One notable example is the move away from the G7 to the G20
as the premier forum for international policy cooperation. Another is the
recent recognition by the IMF that free capital flows may not be always
desirable for developing and emerging economies, and by the World
Bank that the role of the state is essential in facilitating sustainable and
inclusive economic development. Perhaps the most striking develop-
ment was the appeal from European countries for financial assistance
from major emerging economies, such as the People’s Republic of China
(PRC), to help ease the eurozone sovereign debt and banking sector crisis.
Another development has been the rise of aid flows from major emerging
economies, such as the PRC, Brazil and India, to lower- income developing
economies.
In addition to this shift in economic balance, the recent global financial
crisis and the eurozone financial crisis have highlighted the shortcomings
of the current global economic architecture and international monetary
system, and have sparked an international debate about possible remedies
for them. Significantly, the global financial crisis began in the United
States, which is the largest and most central economy in the world and
home to the world’s most sophisticated and developed financial system
and the most dominant global reserve currency – the dollar. It is still the
x New global economic architecture
home of the theories of self- regulating financial markets and free capital
flows even though they have fallen into disrepute.
This book addresses the important question of how a regional archi-
tecture can induce a supply of regional public goods that can comple-
ment and strengthen the global public goods supplied through the global
architecture. A related question is how much global and regional public
goods Asian emerging economies will be able to provide in order to help
maintain global financial stability, open trading regimes, and sustainable
economic development. A further question is what and how much intel-
lectual input these economies can offer to influence the global debate on
these issues.
The global financial crisis and the eurozone sovereign debt and banking
crisis highlighted the risks that emerging economies, including those in
Asia, face even if their own macroeconomic and financial fundamentals
are sound. The awareness of this risk is stimulating the search for poli-
cies and arrangements to reduce these economies’ vulnerability to such
external shocks. The eurozone crisis also raised important policy questions
about regional financial cooperation and architecture. Although Asia is
much less integrated than Europe, one important lesson is that regional
cooperation can play a critical role in achieving macroeconomic and
financial stability. This includes: improving the effectiveness of regional
macroeconomic and financial surveillance; creating a macroeconomic
and financial policy coordination mechanism; and strengthening regional
financial safety nets.
One area of current debate surrounds the issue of how the IMF as a
provider of global financial safety nets can work with regional financing
arrangements. Several Asian emerging economies, such as the Republic
of Korea and Indonesia, faced shortages of US dollar liquidity in the
aftermath of the Lehman collapse in the fall of 2008 even though they
had pursued sound economic and financial policies. The Republic of
Korea and Singapore were able to secure international liquidity from the
US Federal Reserve in the form of currency swap arrangements, but not
all countries were able to enjoy such a privilege. At the same time, the
problem of the so- called IMF “stigma” remains a major barrier to the acti-
vation of an IMF safety net in emerging Asia. The Chiang Mai Initiative
Multilateralization has emerged as the financial safety net in Asia, but
many issues remain in terms of how it can coordinate its activities with
those of the IMF.
Other areas covered in this book include the interplay of global and
regional financial regulation, the role of the World Trade Organization
versus those of bilateral and regional trade agreements, and finally the
parts to be played by the World Bank and regional development banks.
Preface xi
The chapters in this book were originally presented at the conference on
“The Evolving Global Architecture: From a Centralized to a Decentralized
System”, which was jointly sponsored by the Asian Development Bank
Institute (ADBI) and the S. Rajaratnam School of International Studies,
Nanyang Technological University in Singapore on 26–27 March 2012.
The papers have been updated to reflect recent changes and developments.
We hope that they can contribute in a significant way to the debate about
how to reform the global economic architecture and to develop an infra-
structure for creating regional public goods.
Masahiro Kawai
Peter J. Morgan
Pradumna B. Rana
xii
Abbreviations
ACMF ASEAN Capital Markets Forum
ADB Asian Development Bank
AEC ASEAN Economic Community
AFAS ASEAN Framework Agreement on Services
AFC Asian Financial Crisis
AfDB African Development Bank
AFMGM+3 ASEAN+3 Finance Ministers and Central Bank
Governors’ Meeting
AFMM+3 ASEAN+3 Finance Ministers’ Meeting
AFSB Asian Financial Stability Board
AFSD Asian financial stability dialogue
AMF Asian Monetary Fund
AMRO ASEAN+3 Macroeconomic Research Office
APEC Asia- Pacific Economic Cooperation
AREM ASEAN+3 Regional Economic Monitoring
ASA ASEAN Swap Arrangement
ASEAN Association of Southeast Asian Nations
AU African Union
BFSN bilateral financial safety net
BIS Bank for International Settlements
BOP balance of payments
BRICS Brazil, Russian Federation, India, People’s Republic of
China, South Africa
CABEI Central American Bank for Economic Integration
CAF Andean Corporation of Finance
CAF Development Bank of Latin America
CAFTA Central American Free Trade Agreement
CDB Caribbean Development Bank
CEPEA Comprehensive Economic Partnership for East Asia
CMI Chiang Mai Initiative
CMIM Chiang Mai Initiative Multilateralization
DDA Doha Development Agenda
EAFTA East Asian Free Trade Area
EBA European Banking Authority
Abbreviations xiii
ECB European Central Bank
EFSF European Financial Stability Facility
EFSM European Financial Stabilization Mechanism
EFTA European Free Trade Association
EIOPA European Insurance and Occupational Pensions
Authority
ELDMB Executive Level Decision Making Body
EMEAP Executives’ Meeting of East Asia-Pacific Central Banks
ERPD Economic Review and Policy Dialogue
ESA European Supervisory Authority
ESFS European System of Financial Supervision
ESM European Stability Mechanism
ESMA European Securities and Markets Authority
ESRB European Systemic Risk Board
EU European Union
FCL Flexible Credit Line
FOMIN Multilateral Investment Fund
FONPLATA Financial Fund for the Development of the River Plate
Basin
FSB Financial Stability Board
FSF Financial Stability Forum
FTA free trade agreement
G20 Group of Twenty
GATS General Agreement on Trade in Services
GATT General Agreement on Tariffs and Trade
GCC Gulf Cooperation Council
GDP gross domestic product
GEA global economic architecture
GEC global economic crisis
GECC Global Economic Coordination Council
GFC global financial crisis
GPA Government Procurement Agreement
GSM Global Stabilization Mechanism
IBRD International Bank for Reconstruction and
Development
IDA International Development Association
IDB Inter- American Development Bank
IEI international economic institution
IFC International Finance Corporation
IIC Inter- American Investment Corporation
IMF International Monetary Fund
IOSCO International Organization of Securities Commissions
xiv New global economic architecture
IPR intellectual property rights
ITA Information Technology Agreement
Lao PDR Lao People’s Democratic Republic
MDB multilateral development bank
MERCOSUR Mercado Comun del Sur (Southern Common Market)
MFN most- favored nation
NAFA North American Framework Agreement
NAFTA North American Free Trade Agreement
NBW New Bretton Woods
NEPAD New Partnership for Africa’s Development
OECD Organisation for Economic Co- operation and
Development
OFC offshore financial center
PCL Precautionary Credit Line
PLL Precautionary and Liquidity Line
PRC People’s Republic of China
RCEP Regional Comprehensive Economic Partnership
RFI Rapid Financing Instrument
ROO rules of origin
RTA regional trading agreement
SBA Stand- By Arrangement
SEACEN South East Asian Central Banks
SME small and medium- sized enterprise
SRDB subregional development bank
TPP Trans- Pacific Partnership
UN United Nations
WFO World Finance Organization
WTO World Trade Organization
1
1. Asian perspectives on the evolving global architecture
Masahiro Kawai, Peter J. Morgan and
Pradumna B. Rana
1.1 INTRODUCTION AND SUMMARY
The global economic architecture which evolved out of the historic 1944
Bretton Woods Conference comprised various international economic
institutions (IEIs): the International Monetary Fund (IMF) established to
promote macroeconomic stability; the General Agreement on Tariffs and
Trade (GATT) – the predecessor of the World Trade Organization (WTO)
– to ensure an open trading system; and the World Bank, to provide devel-
opment finance for poverty reduction. The G7/G8 was established in the
mid- 1970s to oversee the IEIs and subsequently the Financial Stability
Forum (FSF) was established in 1999 in response to the Asian Financial
Crisis to promote financial stability and develop best practices for finan-
cial regulation and supervision.
This relatively simple architecture, which worked well for a few decades,
has now come under severe strain. One important reason is that the gov-
ernance system of the old architecture does not reflect the move from a
uni- polar to a multi- polar world. This process accelerated after the global
financial crisis (GFC) of 2008–09, most notably the increased economic
power of Asia, especially the People’s Republic of China (PRC) and India.
Another is that policies of IEIs (e.g. charters, quotas and voting rights)
were designed in the interests of the like- minded members in 1944 and are
strongly protected by the original members. Third, the context in which
the IEIs operate has also changed dramatically, particularly in the area of
globalization of finance. Finally, many observers argued that the current
architecture actually contributed to the development of the GFC.
At the height of the global financial crisis, a number of academics and
politicians had made calls for a “New Bretton Woods (NBW)”, meaning
a comprehensive reform of the old architecture. While the recent upgrad-
ing of the Group of Twenty (G20) Finance Ministers process into a
2 New global economic architecture
G20 Summit of Leaders and the FSF into the Financial Stability Board
(FSB) are encouraging, those hoping for a NBW are likely to be disap-
pointed. This is mainly because the rebound from the GFC turned out to
be faster than expected: instead of a Global Depression we had a Great
Recession.
It is, therefore, likely that in the future we will not have a NBW. Instead
the global architecture will move incrementally towards a more network-
based decentralized/multi- layered system where national, bilateral and
regional institutions work closely with a “senior” global institution.
While the global architecture is moving towards a more decentral-
ized system, the G20, which has declared itself as the “premier forum
for international economic cooperation”, suffers from both “input”
legitimacy – its exclusive nature and lack of broader representation – and
“output” legitimacy – its ability to strengthen international cooperation
and come up with effective solutions. Its agenda is also quickly becoming
overcrowded. How can we make the G20 more effective? How can we
promote greater complementarity between global, regional and national
institutions? Is the world economy governable?
The objectives of this book are: (i) to review key issues in reforming the
global architecture including the roles of the oversight bodies such as the
G20; (ii) to identify evolving trends in the global architecture including
developments at the regional and the national levels; and (iii) to develop
ideas and principles to ensure that national and regional efforts com-
plement global institutions and do not try to supplant them. The book
focuses on the following five sub- topics and comprises ten chapters:
(i) G20 effectiveness and reforms;
(ii) global financial safety nets and regional safety nets;
(iii) global and regional financial architecture;
(iv) trade architecture: WTO and regionalism;
(v) World Bank and regional development banks.
1.2 G20 EFFECTIVENESS AND REFORMS
The first two chapters focus on the move from the G7/G8- led to the G20-
led architecture and how this architecture is becoming more decentralized.
Chapter 2 by Pradumna B. Rana sets the stage for the rest of the book, and
argues that the relatively simple architecture created at Bretton Woods
faces a number of challenges. First, the governance system of the old archi-
tecture does not reflect the move from a uni- polar to a multi- polar world:
it reflects the dominance of the US and Europe and does not reflect the
Asian perspectives on the evolving global architecture 3
economic rise and political power of emerging markets, particularly those
in Asia (PRC and India) and, therefore, it lacks legitimacy. Second, as
predicted by the theory of clubs, policies of IEIs (e.g. charters, quotas and
voting rights) were designed in the interests of the like- minded members
in 1944 and are strongly protected by the original members. Third, the
context in which the IEIs operate has also changed dramatically. Of par-
ticular note is globalization, especially financial globalization, which has
increased the incidence of financial crisis and the need for regional and
national actions to complement global ones (Kawai and Rana 2009).
Also, since the rebound from the GFC has turned out to be faster than
expected, Rana argues that complacency has set in and it is unlikely that
the calls for a NBW will be realized. It is, therefore, likely that in the future
the global architecture will move incrementally towards a more network-
based decentralized/multi- layered system where national, bilateral and
regional institutions work closely with a “senior” global institution.
A decentralized architecture is not hypothetical. It already exists in the
development architecture, where the World Bank is complemented by
four major regional development banks. Also the IMF has been working
fairly closely with the European Central Bank and the recently established
European Stability Mechanism (ESM) in trying to resolve the sovereign
debt crisis affecting the region.
Rana argues that at the present level of political will, an incremental and
a more decentralized process is what can be envisaged in terms of global
economic architecture (GEA) reform. If in the future, however, the inci-
dence of financial crises was to increase and political will among countries
and cooperation were to strengthen, one could then perhaps see a move
towards a more rules- based and centralized system. Rana concludes that
Asia could support this evolving architecture by building robust regional
institutions to complement global ones.
In Chapter 3, Andrew Cooper argues that, in a break from past situa-
tions of crisis, a new form of collective action comprising an old elite of
states and a cluster of emerging powers, namely the G20, emerged from
the global financial crisis of 2008–09. While laudable, the G20 is still an
awkward institutional arrangement, with some innovative qualities and
some serious gaps in terms of efficiency and representation. He credits
this reformist model of governance to Paul Martin, successively Finance
Minister and Prime Minister of Canada.
Cooper observes that, in contrast to the BRICS, selected middle- income
powers have used the opportunity to take a leadership role in the G20: the
Republic of Korea had hosted the G20 in 2010, Mexico in 2012, Australia
in 2014, and Turkey will host it in 2015 and possibly Indonesia in 2016.
The Republic of Korea had been very active in the G20 from the very
4 New global economic architecture
outset and it had introduced two new agenda items in the Seoul summit: a
global financial safety net and development assistance for poor countries.
Despite its successes, the G20 continues to suffer from problems of
“output” and “input” legitimacy. Cooper argues that, in contrast to the
successes of initial summits, the Toronto summit of June 2010 and the
Seoul summit of November 2011 presented more mixed if not completely
pessimistic experiences. This loss of momentum does not mean the col-
lapse of the G20 project, argues Cooper. As a crisis committee, the G20
is still moving on a number of fronts including on issues related to global
imbalances.
In terms of “input legitimacy”, Cooper notes that there were two issues.
The first was the absence of the United Nations in the design. Hence,
there was a UN- oriented backlash against the G20 and Joseph Stiglitz was
requested to convene another panel. This backlash has now eased and the
UN has endorsed that the two institutions are different and complemen-
tary not competitive. The other criticism was from non- member countries.
This had also been addressed to some extent at the Seoul summit when
the G20 settled on a formula for non- member participation, enabling the
summit to invite up to five guests. Further efforts must be made to make
the G20 more inclusive.
1.3 GLOBAL FINANCIAL SAFETY NETS AND REGIONAL SAFETY NETS
As mentioned above, formation of an effective global financial safety net
to deal with global systemic crises has become an important agenda item of
the G20. In Chapter 4, Reza Siregar and Akkharaphol Chabchitrchaidol
make the case for further strengthening the Chiang Mai Initiative
Multilateralization (CMIM) and the ASEAN+3 Macroeconomic Research
Office (AMRO). The CMIM crisis fund of US$240 billion remains a mere
fraction of the amount committed to the European Stability Mechanism.
Complementarity between the regional and the global safety net should
also be promoted in order to ensure the CMIM’s success.
According to the authors, the CMIM faces a number of challenges.
First, should the CMIM package be part of the bilateral swap arrange-
ment among the ASEAN+3 economies or should these two approaches be
kept independent? Second, is there a need to develop conditionalities for
the CMIM to safeguard from moral hazard while providing flexible and
timely support? Third, is there a need to eventually de- link the CMIM from
IMF conditions, which would be contingent on the surveillance capacity of
AMRO?
Asian perspectives on the evolving global architecture 5
Siregar and Chabchitrchaidol highlight the major tasks of AMRO.
AMRO prepares quarterly reports on the macroeconomic situation of
ASEAN+3 countries collectively as well as individually. During crisis
periods, AMRO: (i) prepares an analysis of the economic and financial
situation of the swap- requesting country; (ii) monitors the use and impact
of the funds disbursed under the CMIM Agreement; and (iii) monitors the
compliance by the swap requesting country with any lending covenants to
the CMIM Agreement. They also mention that although AMRO is a new
institution, it has made good progress in recruiting staff and strengthening
its capacity.
In Chapter 5, Hal Hill and Jayant Menon note that the need for regional
safety nets (surveillance and financing arrangements) arose from the Asian
Financial Crisis of 1997–98 when there was some disillusionment with
IMF programs and policies. The three components of regional safety nets
in Asia were the regional economic review and policy dialogue process
(ERPD), the Chiang Mai Initiative (CMI), and the Asian Bond Markets
Initiative (ABMI). All three components were interrelated. Subsequently,
the CMI was upgraded to CMIM and the AMRO was established.
Hill and Menon then ask the question whether ASEAN+3 has all the
elements of a strong regional financial safety net. The answer is, not yet.
During the recent global financial crisis, the CMIM was not used. This
was perhaps because the size of the CMIM was too small and/or because
of the “stigma” attached to IMF conditions in the Asian region. They
recommend that the CMIM’s size be expanded and the linkage with IMF
be reduced.
1.4 GLOBAL AND REGIONAL FINANCIAL ARCHITECTURE
In the wake of the global financial crisis of 2007–09, the G20, together
with the FSB, has been at the forefront of global efforts to develop a
standard approach to financial reform, and to develop an international
architecture to deal with surveillance and regulation of global systemic
risks and global systemically important financial institutions (SIFIs).
Many nations have implemented financial reforms as well. However,
the authors in this part of the book argue that, in view of the progress of
regional financial integration, especially in Europe and Asia, there is a
significant role for regional cooperation to bridge the gap between global
and national initiatives.
In Chapter 6, Masahiro Kawai and Peter Morgan: (i) outline the case
for regional- level financial regulation in Asia; (ii) compare the experi-
6 New global economic architecture
ences of Europe and Asia; (iii) identify the challenges; and (iv) offer
recommendations for enhancing regional financial regulation in Asia.
They argue that the recent global financial crisis heightened the urgency
of financial regionalism in Asia – which had taken off in response to the
Asian Financial Crisis of 1997–98 – and that financial regionalism in the
region could benefit from increased regulatory harmonization and mutual
recognition. An increasingly economically and financially integrated Asia
needs more intensive financial cooperation, including harmonized finan-
cial regulation and supervision.
They observe that financial integration in Europe has been sup-
ported by a large number of supra- national institutions including the
three European Supervisory Authorities (ESAs) established for micro-
prudential supervision and the European Systemic Risk Board for macro-
prudential supervision. But still there is an absence of an EU- wide
framework for resolution of cross- border banks (although legislation for
this is now being considered) and national insolvency laws have not been
harmonized in the region.
Kawai and Morgan argue that Asia does not have an over- arching
political structure comparable to that of the EU. Nonetheless, progress
is being made in promoting financial cooperation under the auspices of
ASEAN Economic Community; ASEAN, ASEAN+3 and EMEAP sur-
veillance processes; CMIM and AMRO; and the Asian Bond Markets
Initiative. A weaker institutional arrangement in Asia requires a different
approach from that of Europe. They recommend a number of measures
to strengthen regional financial regulation in Asia, including: (i) acceler-
ating the ASEAN Economic Community process; (ii) strengthening the
CMIM and AMRO to eventually evolve into an Asian monetary fund; (iii)
embarking on an Asian Bond Fund- 3; and (iv) creating an Asian financial
stability dialogue to monitor regional financial markets, facilitate mac-
roeconomic and financial policy dialogue and cooperation, and secure
regional financial stability.
1.5 TRADE ARCHITECTURE: WTO AND REGIONALISM
Asian economies have benefited hugely from the liberalization of trade
in recent decades. Earlier, trade liberalization efforts had focused on
unilateral and various multilateral agreements achieved by the WTO.
However, with the failure to complete the Doha Round, attention has
shifted to bilateral or plurilateral free trade agreements (FTAs). This
shift has been criticized by Bhagwati and others as potentially trade
Asian perspectives on the evolving global architecture 7
diversionary, and the debate since then has focused on the issue of
whether such agreements are “building blocks” or “stumbling blocks” to
a new multilateral round.
Masahiro Kawai and Ganeshan Wignaraja in Chapter 7 observe that,
although Asia was a latecomer in developing FTAs, it has now emerged at
the forefront of global FTA activity. The number of FTAs concluded by
countries in the region has increased from just three in 2001 to 76 in 2013.
Amid slow progress in the Doha negotiations and the global and eurozone
crisis, they conclude that Asian regionalism is here to stay. Policymakers
should therefore focus on how to maximize the benefits of FTAs while
minimizing their costs. Their firm- level survey resulted in a more nuanced
view of FTAs.
Kawai and Wignaraja note that FTAs pose a number of challenges. The
first challenge is the limited coverage of agricultural goods and services
trade in Asian FTAs. They argue that WTO- plus provisions, such as com-
petition policy, investment provisions, trade facilitation and government
procurement, among others, must also be considered in future FTAs. A
second challenge is limited services trade liberalization in Asian FTAs.
Services account for more than half the GDP of most Asian countries and
trade in services has grown rapidly. Studies suggest that impediments to
trade in services, particularly regulatory restrictions on foreign services
and service providers, exist across Asia. Such impediments may occur
in ownership rules, technical regulations, licensing, and qualification
requirements.
A third challenge relates to insufficient coverage of Asian FTAs of
new issues which go beyond the WTO framework. The WTO system that
emerged from the Uruguay Round in the mid- 1990s consisted of substan-
tive agreements on goods and services. So- called “WTO- plus” elements
include liberalization in agricultural and non- agricultural market access,
competition policy, investment, trade facilitation, and government pro-
curement. WTO- plus agreements and “new age” FTAs, which are com-
prehensive and address the Singapore issues, are becoming more common
globally.
The fourth challenge is how to improve the utilization of FTAs. In
addition to the information gap, the provisions of FTAs were complex
and could not be fully understood by small and medium- sized enterprises
(SMEs). There was, therefore, a need to improve business support serv-
ices. The fifth challenge is tackling the “Noodle Bowl” effect, for example
overlapping rules of origin (ROOs) in FTAs which increased transaction
costs for firms. With the rapid spread of FTAs throughout Asia, multiple
ROOs in overlapping FTAs posed a serious burden on SMEs in particular.
Kawai and Wignaraja argue that these challenges require responses
8 New global economic architecture
at the national, regional and global levels. At the national level, policy-
makers need to increase efforts to address the above- mentioned challenges.
At the regional level, they identify two competing tracks that could lead
to an Asian region- wide FTA: the Regional Comprehensive Economic
Partnership (RCEP) among the ASEAN+6 countries (the 10 ASEAN
economies plus Australia, the PRC, India, Japan, the Republic of Korea
and New Zealand) and the Trans- Pacific Strategic Economic Partnership
(Trans- Pacific Partnership, or TPP). At the global level, important ini-
tiatives in areas such as global supply chains may be of greater use than
plurilateral agreements (which focus on rule making and liberalization on
a single trade issue) within the WTO framework.
In Chapter 8, Mike Plummer argues that although the WTO system
is functioning well, with the rule- based system being respected and an
improved dispute settlement mechanism in place, the multilateral liber-
alization process has stalled with the deadlock in the Doha Development
Agenda (DDA). The consensus view is that North–South economic ten-
sions were the main cause of the deadlock. Plummer believes that this view
is only partially correct: another important reason for the DDA deadlock
is intra- BRICS rivalry and competition. As intra- regional trade among
BRICS had steadily grown, political interests in these economies have
become sensitive to competition from fellow BRICS members and protec-
tionist policies were utilized.
Plummer then argues that, with the stalling of the DDA, regionalism
is the only way forward. After reviewing the “building bloc” vs. “stum-
bling bloc” aspects of FTAs, he concludes positively that regional trading
agreements in Asia are serving as the “building bloc” of multilateral trade
liberalization. First, regionalism could enhance the negotiating power of
smaller economies. The process of structural adjustment unleashed by a
regional trading arrangement could also make multilateral trade initia-
tives easier. Finally, regional integration could push member economies
to be more efficient, competitive and market friendly, preparing them to
effectively participate in multilateral trade agreements.
1.6 WORLD BANK AND REGIONAL DEVELOPMENT BANKS
The World Bank and various regional multilateral banks, including the
Asian Development Bank (ADB) and the Inter- American Development
Bank (IDB) have a long and complex relationship including both competi-
tive and cooperative aspects. The G20 has called on the multilateral banks
to increase their efforts to support the development objectives of emerging
Asian perspectives on the evolving global architecture 9
economies. At the same time, the proliferation of other aid- related organi-
zations calls for a re- examination of the role of the multilateral banks.
Vikram Nehru in Chapter 9 focuses on the World Bank–ADB relation-
ship. He observes that the “foreign aid architecture” has become a lot
more complicated in the present globalized environment. On the supply
side, there has been an explosion of bilateral and multilateral agencies,
and multiple new private donors. On the aid delivery side, the explosion
has become even more dramatic. There have been an increasing number
of international NGOs receiving money from bilateral agencies and
thousands of private sector groups involved in aid. Modalities of efficient
aid delivery had to be found and implemented. Also, the issue of donor
coordination had become more important so that donors did not work
at cross- purposes and add to the administrative burden of the recipients.
Implementation of the Paris Declaration on Aid Effectiveness had to
be accelerated and expanded to cover non- traditional donors. National
development agencies must also insist on rigorous evaluation methods to
identify successful projects.
Nehru then adds that there is a need to promote coordination between
the World Bank and ADB. In Asia, the World Bank and ADB face a
very challenging situation. First, the rapid growth of the Asian countries
means that many had moved from low- income status to middle- income
status and consequently needed fewer financial resources from the World
Bank and ADB. Consequently, there is a need to provide more knowledge
resources instead. The second issue is governance reform which is more
acute at the World Bank. The recent increase in shares of developing
countries, particularly the PRC, had raised the share of developing coun-
tries from 42.6 per cent to 47 per cent, but this was still short of what is
needed to obtain parity with the advanced countries. The third challenge
confronting the World Bank and ADB in Asia was their relationship with
each other in operational matters and in advising clients on development
policies and strategies.
Nehru argues that the two institutions need to coordinate on all these
issues in order to reduce the cost of operations and the burdens on client
countries. Where the two institutions have cooperated (for example, to
carve out “areas of primacy”), results have been encouraging, but there
remain areas of friction between the two institutions. He recommends
several modalities for enhancing coordination between the World Bank
and ADB. One is that the World Bank focus on global public goods –
trade, climate change, international migration, global financial stability
and disaster management – and ADB focus on regional public goods
and services such as regional integration, regional financial stability, and
regional infrastructure development. The other modality is to merge the
10 New global economic architecture
two institutions, with the center mobilizing resources, and operations
being decentralized at the regional level. The final modality is for the two
institutions to muddle along much as they have done in the past.
In Chapter 10, Fernando Prada focuses on the relationship between
the World Bank and the IDB. He argues that the IDB has been successful
in promoting sustainable growth in Latin America by striking a balance
between its three main functions, namely the provision of: (i) financial
assistance; (ii) capacity- building (institution building and knowledge
generation and dissemination); and (iii) international public goods (infra-
structure for regional integration).
Prada argues that the “aid architecture” in Latin America is already
fairly decentralized. While the World Bank and IDB have focused their
assistance on the social sector, public sector reform and capacity- building,
sub- regional development banks (such as the Corporacion Andina de
Fomento, Caribbean Development Bank and the Central American Bank
for Economic Integration) have focused on infrastructure, capital market
development and private sector operations. An important difference
between Asia and Latin America, he notes, is that, unlike the latter, the
former does not have sub- regional development banks. Asia can, there-
fore, benefit from Latin America’s experience with sub- regional develop-
ment banks.
REFERENCE
Kawai, M. and P.B. Rana. 2009. The Asian Financial Crisis revisited: Lessons, responses, and new challenges. In R. Carney (ed.) Lessons from the Asian Financial Crisis. New York: Routledge, pp. 155–97.
11
2. From a centralized to a decentralized global economic architecture: an overview
Pradumna B. Rana
2.1 INTRODUCTION
The Asian Financial Crisis of 1997–98 led to calls for a new international
financial architecture and discussions focused on crisis prevention, crisis
management and crisis resolution efforts (see Kawai and Rana, 2009). The
global economic crisis (GEC) of 2008–09, which was initially expected to
be the worst crisis since the Great Depression of the 1930s, likewise led
to calls for a New Bretton Woods (NBW) system – a wider and much
more comprehensive set of reforms of the global governance system and
international economic institutions (IEIs), similar to the remarkable 1944
Bretton Woods conference where the World Bank, the International
Monetary Fund (IMF) and the General Agreement on Tariffs and Trade
(GATT), the predecessor of the World Trade Organization (WTO), were
established.
In the post- global economic crisis (GEC) period, a number of academ-
ics and politicians have made calls for an NBW. These include Stiglitz
(cited in Bases 2008) and Sarkozy and Brown (cited in Kirkup and
Waterfield 2008). The central bank governor of the People’s Republic
of China (PRC), Zhou (2009), has also made a pitch for a new reserve
asset; and the World Bank President, Zoellick (2010), has called for a
return to a modified gold standard. Supporting the need to return to a
modified gold standard, Mohamad (2012) has called for an NBW with
poor countries well represented. So far, a number of proposals to reform
the global economic architecture (GEA) – the configuration of institu-
tions for global economic governance – have been implemented. These
include the upgrading of the Group of Twenty (G20) finance ministers
and central bank governors group to the G20 Summit of Leaders and des-
ignating it the “premier forum for our economic cooperation” (European
Commission 2009), and the upgrading of the Financial Stability Forum
12 New global economic architecture
to the Financial Stability Board by expanding membership. But could
post- GEC reforms of the GEA disappoint like those discussed under the
new international financial architecture? If so, cycles of crises, talk of
architecture reform, and complacency in reforms could continue without
significantly enhancing the resilience of the GEA. How could the global
economic architecture evolve?
The objectives of this chapter are to answer three questions:
(i) Will we have an NBW in the post- GEC period, as called for by
several academics and policymakers?
(ii) How has the GEA evolved and how could it look in the future? Will
it be more rules- based or informally network-based? Will it be more
centralized or decentralized?
(iii) What is the role of Asia in this new architecture and how can it
contribute?
Section 2.2 of the chapter argues that it may be too optimistic to expect
an NBW or a radical set of reforms of the GEA in the future. It argues that
reforms are expected to be more incremental. Section 2.3 reviews the pre-
GEC architecture, essentially the one established at Bretton Woods, which
was led by the G7 and G8, and highlights its shortcomings. Section 2.4
highlights the post- GEC G20- led architecture. Section 2.5 focuses on the
move to a more decentralized GEA where regional institutions are linked
together to a more senior global organization by rules and regulations.
Such a system would be more flexible in terms of membership, govern-
ance, representation and agenda. Section 2.6 argues that Asia can contrib-
ute to the evolving GEA by establishing institutions to enhance regional
economic integration and by trying to make sure that regional institutions
are complementary to global ones.
2.2 NEW BRETTON WOODS IN THE FUTURE?
Helleiner (2010) has argued that the creation of a new GEA is not an
outcome of a single event or meeting but a long- drawn- out process involv-
ing a legitimacy phase (thinking that the old regime needs to be replaced),
interregnum phase (experimental and discussion phase), and a constitutive
phase (formal negotiation phase). In this typology, as discussed later in
the chapter, it is appropriate to conclude that the GEC has led to a view
that the pre- GEC architecture needed to be changed and that the G20
has successfully implemented some of the changes. We are, therefore,
in the interregnum phase of a new architecture where various ideas for
From a centralized to a decentralized global economic architecture 13
reforms are being discussed. The question is whether we will ever go to
the constitutive phase and have an NBW. The answer is, probably not,
for two reasons. First, the application of the theory of clubs leads to
the conclusion that IEIs are relatively inflexible institutions that are dif-
ficult to reform in response to the demands of a rapidly changing world
because of the vested interests of the original members of the club (section
2.3). Second, as is usually the case, with the adverse impacts of the GEC
being less serious than expected – instead of the Great Depression II we
had the Great Recession – complacency has set in on the reform agenda,
and the commitment and urgency to reform IEIs seen during the crisis
has decreased. For example, representatives of the finance industry have
successfully resisted and diluted the reform agenda.1 Only if the euro area
were to collapse and the world were to experience the Great Depression
II, which it avoided in 2008 and 2009, could we expect the commitment to
reform to become urgent once again. This probably is the only chance for
those who call for an NBW.
2.3 PRE- GLOBAL ECONOMIC CRISIS G7 AND G8- LED GLOBAL ECONOMIC ARCHITECTURE
The pre- GEC economic architecture was very similar to the one created
in Bretton Woods, under which the IMF was to promote macroeconomic
and financial stability,2 the GATT was to ensure an open trading environ-
ment globally, and the World Bank and later the regional development
banks (e.g. the Asian Development Bank (ADB)) were to provide develop-
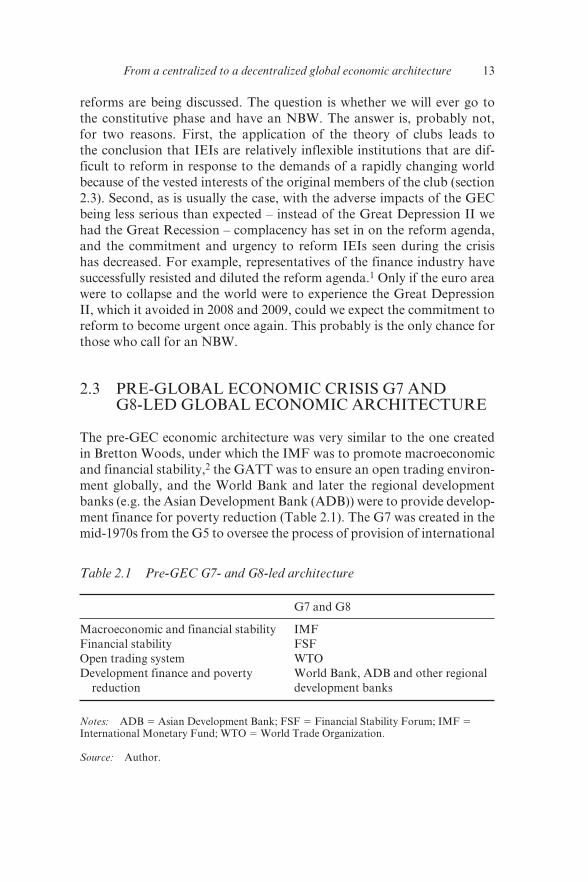
ment finance for poverty reduction (Table 2.1). The G7 was created in the
mid- 1970s from the G5 to oversee the process of provision of international
Table 2.1 Pre- GEC G7- and G8- led architecture
G7 and G8
Macroeconomic and financial stability IMF
Financial stability FSF
Open trading system WTO
Development finance and poverty
reduction
World Bank, ADB and other regional
development banks
Notes: ADB 5 Asian Development Bank; FSF 5 Financial Stability Forum; IMF 5
International Monetary Fund; WTO 5 World Trade Organization.
Source: Author.
14 New global economic architecture
public goods by various IEIs. The Russian Federation joined the group
in 1997 to form the G8. In response to the Asian Financial Crisis, the
Financial Stability Forum was established in 1999 with a small number
of staff to help coordinate the development of standards and codes and
best practices for policy and transparency, financial sector regulation and
supervision, and market integrity. Another institution established that
year was the G20 finance ministers and central bankers group, compris-
ing both G8 members and systemically important emerging markets; this
body had existed in the shadow of the G8 since its creation. In 1995, the
GATT was folded into the World Trade Organization (WTO) with a
proper organizational and staffing arrangement.
While the pre- GEC G7 and G8- led GEA worked well for a number of
decades, it had many shortcomings. First, its governance did not reflect the
move from a unipolar to a multipolar world. It represented the dominance
of the United States (US) and Europe, and did not reflect the economic
rise and political power of emerging markets, particularly those in Asia
(the PRC and India), so it lacked legitimacy. Emerging markets had no
representation at the G7 and their voice in the IEIs was limited. According
to long- term projections made by Goldman Sachs, emerging markets will
continue to grow rapidly over the next 40 years. In 2003, the three largest
economies in the world by 2050 were predicted to be the PRC, the US
and India (Wilson and Purushothaman 2003). In 2007, the 2003 ranking
was revised to the PRC, India and the US (Poddar and Yi 2007). More
recently, it has been projected that the 2007 ranking could be obtained
even earlier – within the next 30 years or so (ADB 2009). Despite their
economic dynamism, however, the PRC and India will be far behind the
US in terms of per capita incomes, poverty reduction and military power.
Kawai et al. (2009) have examined the evolution of the shares of devel-
oping and emerging markets in IMF quotas, and in global trade and gross
domestic product (GDP, in terms of purchasing power) – two rough indi-
cators of their importance in the world economy. They have found that
the trade shares of developing and emerging economies have risen more
rapidly than their share in IMF quotas. This contrast was even clearer for
their share of world GDP. Quotas that also determine voting power at
the IMF are especially low for rapidly growing emerging markets such as
Brazil, the PRC and India. Kelkar et al. (2005) found that these three coun-
tries had 19 per cent fewer votes than Belgium, Italy and the Netherlands
collectively, although they had 21 per cent more nominal GDP, 400 per
cent more purchasing power GDP, and 2800 per cent greater population.
On the other hand, Europe controls directly or indirectly 10 chairs out of
24 on the IMF Executive Board, even though it has a common monetary
policy and about 30 per cent of quota and voting rights.
From a centralized to a decentralized global economic architecture 15
Second, IEIs are relatively inflexible institutions and cannot change
even if they wish to. Kawai et al. (2009) have applied the theory of clubs
to explain this phenomenon. IEIs are clubs in the sense that they produce
goods that are at least partially non- rivalrous (more than one user can
consume) and at least partially excludable (users can be denied access to
them). Their most important services include order and predictability in
international trade and finance. The application of club theory to IEIs
leads to the conclusion that IEIs tend to be relatively inflexible institu-
tions: club charters are usually designed to maintain firm control in the
hands of founding members and those who share their preferences.
The charters, quotas and voting rights of IEIs were designed in the inter-
est of like- minded original core members in 1944 and are inflexible and diffi-
cult to change as membership expands. In comparison with the 44 countries
that participated in the Bretton Woods conference, membership of the IMF
and World Bank now stands at 188. This inflexibility has led to frictions
on various occasions. The membership of the WTO is more than 150 but
an additional 30 countries have applied to join or are in accession nego-
tiations. At a recent Asia- Pacific Economic Cooperation (APEC) Summit
in Honolulu, US President Obama demanded that the PRC “play by the
rules” of international trade (Nakamura 2011). The PRC reacted with
speed: “First, we have to know whose rules we are talking about. . .If the
rules are made collectively through agreement and China is a part of it, then
China will abide by them. If rules are decided by one or even several coun-
tries, China does not have the obligation to abide by that” (Eckert 2011).
Third, with globalization, especially financial globalization, the environ-
ment in which the IEIs have operated has also changed dramatically and
this has reduced their effectiveness. The number and types of global and
regional public goods have increased. Policymakers were wary of uncon-
trolled financial flows during the Bretton Woods era and permitted capital
controls. In the 1980s and 1990s, under the Washington Consensus,3 they
embraced financial liberalization and deregulation – ushering in an age of
highly integrated financial markets and capital flows that have dwarfed
the operations of IEIs. As early as the 1960s, the United Kingdom (UK)
was promoting financial globalization through its support of deregulated
Euromarkets for London. But the momentum accelerated when Thatcher
took political office in the UK in 1979 and Reagan in the US in 1980. IMF
management even launched an initiative in 1995 to overturn the commit-
ment to capital controls by amending its articles of agreement to gain a
liberalization mandate with respect to capital movement. This initiative
was only withdrawn after the recent global economic crisis.
With financial globalization, a new type of crisis called a capital account
crisis or “generation three” crisis (Dornbusch 2001) – associated with large
16 New global economic architecture
inflows and sudden reversals of capital flows, the bursting of asset bubbles,
and a banking crisis – has started to hit emerging markets. Such a crisis
tends to affect an economic entity’s balance sheets and solvency positions.
The costs of balance sheet recessions tend to be higher, and recovery from
such a crisis takes longer. They also tend to be systemic, affecting most or
all sectors of the economy, with strong contagion to neighboring countries
(which may be innocent bystanders). Based on their experience with the
Asian Financial Crisis, Kawai and Rana (2009) argued that efforts to
prevent and manage a capital account crisis required actions at the global,
regional and national levels or a multilayered global financial safety net.
Fourth, IEIs face a “governance trilemma” (Kawai et al. 2009, p. 13).
There is broad agreement that IEIs need to become: (i) more democratic;
(ii) more effective in delivering public goods; and (iii) universal by accept-
ing all countries that apply for membership. These requirements add up to
a trilemma; achieving any one or two objectives makes achieving the other
more difficult. For example, the United Nations (UN) is democratic and
universal, but suffers on effectiveness. Similarly, the IMF and World Bank
are universal and effective but not democratic.
2.4 POST- GLOBAL ECONOMIC CRISIS G20- LED GLOBAL ECONOMIC ARCHITECTURE
After the GEC, dominant powers moved quickly and created the G20
Summit by upgrading the G20 finance and central bank officials’ forum,
which started in 1999 but was kept under the shadow of the G7 and
G8. The leaders labeled the forum the “premier forum for our interna-
tional economic cooperation” and in September 2009 President Obama
categorically announced that G20 would replace the G7.4 The leaders
also upgraded the Financial Stability Forum into the Financial Stability
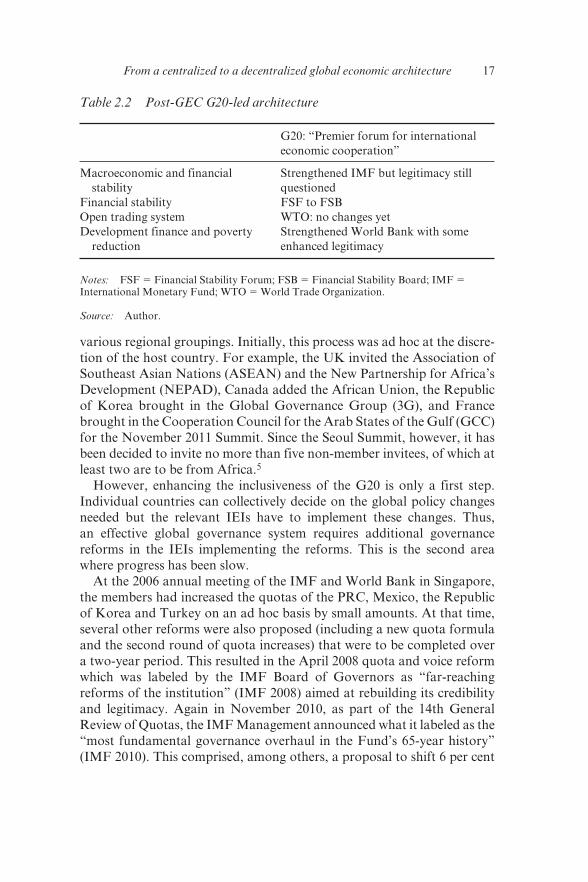
Board, with wider membership of all G20 members. The post- GEC G20-
led GEA is depicted in Table 2.2.
Raising the profile of the G20 to a leaders’ level forum was no doubt
enormously significant. For the first time, systemically important emerg-
ing markets were brought into the core of global economic governance.
It was an historic event that partially addressed the inclusiveness and
legitimacy problems of the pre- GEC G7 and G8- led architecture. But
problems remain. The G20 represents 4.2 billion people of the world but
not the other 2.6 billion people. How can their views be incorporated and
the legitimacy of the G20 enhanced?
The G20’s approach of making the grouping more inclusive beyond the
19 member countries and groupings has been to invite representatives of
From a centralized to a decentralized global economic architecture 17
various regional groupings. Initially, this process was ad hoc at the discre-
tion of the host country. For example, the UK invited the Association of
Southeast Asian Nations (ASEAN) and the New Partnership for Africa’s
Development (NEPAD), Canada added the African Union, the Republic
of Korea brought in the Global Governance Group (3G), and France
brought in the Cooperation Council for the Arab States of the Gulf (GCC)
for the November 2011 Summit. Since the Seoul Summit, however, it has
been decided to invite no more than five non- member invitees, of which at
least two are to be from Africa.5
However, enhancing the inclusiveness of the G20 is only a first step.
Individual countries can collectively decide on the global policy changes
needed but the relevant IEIs have to implement these changes. Thus,
an effective global governance system requires additional governance
reforms in the IEIs implementing the reforms. This is the second area
where progress has been slow.
At the 2006 annual meeting of the IMF and World Bank in Singapore,
the members had increased the quotas of the PRC, Mexico, the Republic
of Korea and Turkey on an ad hoc basis by small amounts. At that time,
several other reforms were also proposed (including a new quota formula
and the second round of quota increases) that were to be completed over
a two- year period. This resulted in the April 2008 quota and voice reform
which was labeled by the IMF Board of Governors as “far- reaching
reforms of the institution” (IMF 2008) aimed at rebuilding its credibility
and legitimacy. Again in November 2010, as part of the 14th General
Review of Quotas, the IMF Management announced what it labeled as the
“most fundamental governance overhaul in the Fund’s 65- year history”
(IMF 2010). This comprised, among others, a proposal to shift 6 per cent
Table 2.2 Post- GEC G20- led architecture
G20: “Premier forum for international
economic cooperation”
Macroeconomic and financial
stability
Strengthened IMF but legitimacy still
questioned
Financial stability FSF to FSB
Open trading system WTO: no changes yet
Development finance and poverty
reduction
Strengthened World Bank with some
enhanced legitimacy
Notes: FSF 5 Financial Stability Forum; FSB 5 Financial Stability Board; IMF 5
International Monetary Fund; WTO 5 World Trade Organization.
Source: Author.
18 New global economic architecture
of the quota to dynamic emerging markets and developing countries and
to reduce European representation at the IMF Board by two chairs. But
neither the 2008 reform nor the 2010 one have yet been ratified.6 Even
with their ratification, the shift in quotas to developing countries will be
relatively small and misalignments will remain.7
2.5 FUTURE GLOBAL ECONOMIC ARCHITECTURE: LIKELY SCENARIO
In this context, how could the post- GEC GEA evolve? A likely scenario is
a series of incremental moves to a more decentralized GEA where national,
bilateral and regional initiatives work closely with a senior global institu-
tion. This would mean complementing monolithic IEIs with a multilayered
decision- making structure along the lines of “functional federalism” advo-
cated at the national level (Kawai et al. 2010). It also involves the applica-
tion of the principle of subsidiarity, which means that decisions should
be made at the lowest possible administrative level. Decentralization
would make international decisions more flexible and accountable, making
them more like decisions within countries, which typically involve several
layers of government. The value of decentralization lies in its ability to
produce public goods that are important to some, but not for all, coun-
tries. Regionally decentralized decision- making also has the advantage of
inducing large emerging economies to take leadership in providing regional
public goods, even before they take leadership of global bodies.
Decentralized decisions create new challenges: regional decisions need
to be made globally coherent to act as building blocks of a global system.
This requires paying close attention to connections within a decentralized
system to make sure they complement each other and the global system.
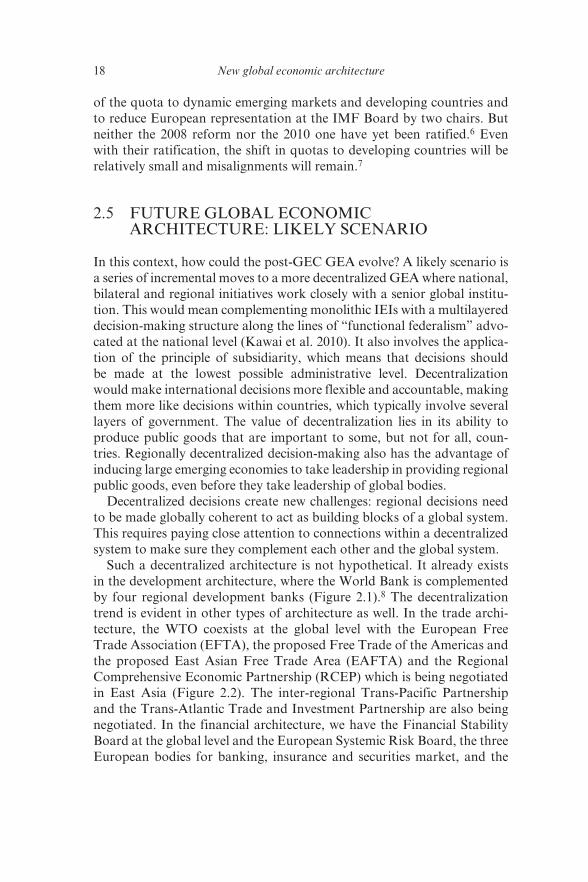
Such a decentralized architecture is not hypothetical. It already exists
in the development architecture, where the World Bank is complemented
by four regional development banks (Figure 2.1).8 The decentralization
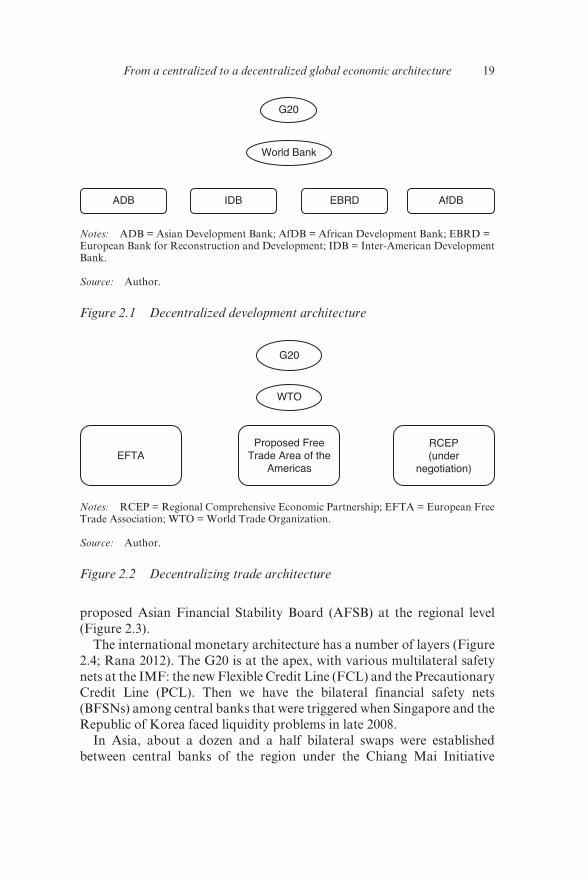
trend is evident in other types of architecture as well. In the trade archi-
tecture, the WTO coexists at the global level with the European Free
Trade Association (EFTA), the proposed Free Trade of the Americas and
the proposed East Asian Free Trade Area (EAFTA) and the Regional
Comprehensive Economic Partnership (RCEP) which is being negotiated
in East Asia (Figure 2.2). The inter-regional Trans-Pacific Partnership
and the Trans-Atlantic Trade and Investment Partnership are also being
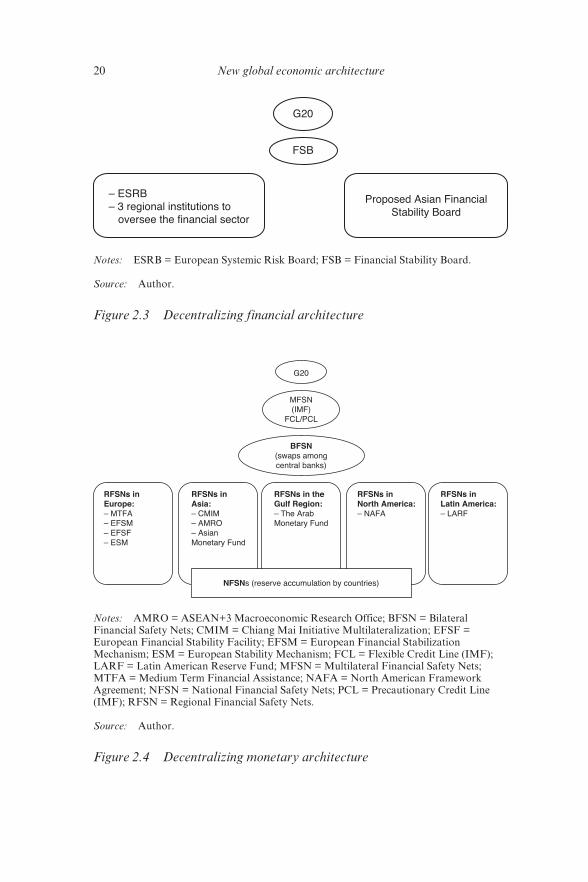
negotiated. In the financial architecture, we have the Financial Stability
Board at the global level and the European Systemic Risk Board, the three
European bodies for banking, insurance and securities market, and the
From a centralized to a decentralized global economic architecture 19
proposed Asian Financial Stability Board (AFSB) at the regional level
(Figure 2.3).
The international monetary architecture has a number of layers (Figure
2.4; Rana 2012). The G20 is at the apex, with various multilateral safety
nets at the IMF: the new Flexible Credit Line (FCL) and the Precautionary
Credit Line (PCL). Then we have the bilateral financial safety nets
(BFSNs) among central banks that were triggered when Singapore and the
Republic of Korea faced liquidity problems in late 2008.
In Asia, about a dozen and a half bilateral swaps were established
between central banks of the region under the Chiang Mai Initiative
G20
World Bank
ADB IDB EBRD AfDB
Notes: ADB = Asian Development Bank; AfDB = African Development Bank; EBRD =
European Bank for Reconstruction and Development; IDB = Inter- American Development
Bank.
Source: Author.
Figure 2.1 Decentralized development architecture
EFTAProposed Free
Trade Area of theAmericas
RCEP(under
negotiation)
G20
WTO
Notes: RCEP = Regional Comprehensive Economic Partnership; EFTA = European Free
Trade Association; WTO = World Trade Organization.
Source: Author.
Figure 2.2 Decentralizing trade architecture
20 New global economic architecture
– ESRB– 3 regional institutions to oversee the financial sector
Proposed Asian FinancialStability Board
G20
FSB
Notes: ESRB = European Systemic Risk Board; FSB = Financial Stability Board.
Source: Author.
Figure 2.3 Decentralizing financial architecture
G20
MFSN(IMF)
FCL/PCL
BFSN(swaps amongcentral banks)
RFSNs inEurope:– MTFA– EFSM– EFSF– ESM
RFSNs inAsia:– CMIM– AMRO– AsianMonetary Fund
RFSNs in theGulf Region:– The ArabMonetary Fund
RFSNs inNorth America:– NAFA
RFSNs inLatin America:– LARF
NFSNs (reserve accumulation by countries)
Notes: AMRO = ASEAN+3 Macroeconomic Research Office; BFSN = Bilateral
Financial Safety Nets; CMIM = Chiang Mai Initiative Multilateralization; EFSF =
European Financial Stability Facility; EFSM = European Financial Stabilization
Mechanism; ESM = European Stability Mechanism; FCL = Flexible Credit Line (IMF);
LARF = Latin American Reserve Fund; MFSN = Multilateral Financial Safety Nets;
MTFA = Medium Term Financial Assistance; NAFA = North American Framework
Agreement; NFSN = National Financial Safety Nets; PCL = Precautionary Credit Line
(IMF); RFSN = Regional Financial Safety Nets.
Source: Author.
Figure 2.4 Decentralizing monetary architecture
From a centralized to a decentralized global economic architecture 21
in the aftermath of the Asian Financial Crisis. In March 2010, these
were combined and expanded to become the Chiang Mai Initiative
Multilateralization (CMIM) or the US$120 billion “self- managed reserve
pooling arrangement”. All ASEAN+3 members9 (plus Hong Kong,
China) contribute to this fund and are eligible to borrow from it in case
they face payment problems. Under this arrangement, foreign exchange is
earmarked for crisis prevention but held in separate national accounts. The
CMIM retains the provision of the Chiang Mai Initiative (CMI) that only
20 per cent of the amounts can be withdrawn without an IMF program in
place. In May 2012, the size of the pool was doubled to US$240 billion and
the 20 per cent limit increased to 30 per cent. The IMF link and the lack of
an independent surveillance unit to conduct due diligence inhibited the use
of these arrangements during the recent global economic crisis. In April
2011, the ASEAN+3 Macroeconomic Research Office (AMRO), an inde-
pendent surveillance unit for the CMIM, was established in Singapore.
AMRO’s mandate is to “monitor and analyze regional economies, which
contributes to the early detection of risks, swift implementation of reme-
dial actions, and effective decision- making of the CMIM” (ASEAN+3
Finance Ministers Joint Media Statement 2 May 2010).10 AMRO became
fully operational in October 2011, with 10 staff, and more are being
recruited. AMRO is to produce quarterly reports and table them biannu-
ally for discussion by the ASEAN+3 finance and central bank deputies. In
the event that the CMIM is activated, AMRO will assume the key role of
providing an objective assessment of swap requesting countries and make
a recommendation to the CMIM parties. If the application is approved,
AMRO will then monitor the use and impact of swap funds.
At the present level of political will, an incremental and more decentral-
ized process is what we can envisage in terms of GEA reform. However,
if the incidence of financial crises were to increase and political will and
cooperation among countries were to strengthen in the future, one could
then perhaps see a move toward a more rules- based system. In such a
context, as discussed below, it is possible that the G20 could be replaced
by the Global Economic Coordination Council (GECC) and the Financial
Stability Board by a World Finance Organization (WFO).
Despite the plethora of IEIs, the Stiglitz Commission (UN 2009) recom-
mended the establishment of a globally representative forum to be called
the GECC at a level equivalent to the UN General Assembly and the
Security Council. The GECC could meet annually at the heads of state
and government level to assess developments and provide leadership in
economic, social and ecological issues. It would promote development,
secure consistency and coherence in the policy goals of the major interna-
tional organizations, and support consensus building among governments
22 New global economic architecture
on efficient and effective solutions for global economic governance issues.
Such a council could also promote the accountability of all IEIs, identify
gaps that need to be filled to ensure the efficient operation of the global
economic and financial system, and help set the agenda for global eco-
nomic and financial reforms.
The case for establishing a WFO analogous to the existing WTO has
also been made (Eichengreen 2009). In the same way that the WTO
establishes principles for trade policy without specifying outcomes, the
WFO would establish principles for prudential supervision (capital and
liquidity requirements, limits on portfolio concentrations and connected
lending, adequacy of risk measurement systems, and internal controls)
without attempting to prescribe the structure of regulation in detail. The
WFO would define obligations for its members, who would be obliged to
meet international standards for supervision and regulation of their finan-
cial markets. Membership would be mandatory for all countries seeking
access to foreign markets. The WFO would appoint an independent panel
of experts to determine whether countries were in compliance with those
obligations, failing which the authorities would be able to impose sanc-
tions against countries that fail to comply. The WFO would not dictate
regulatory conditions on countries.
2.6 THE ROLE OF ASIA
Although the pace of regional integration has picked up considerably after
the Asian Financial Crisis of 1997–98, Asia is very much behind Europe in
terms of building supranational institutions. What are the institutions that
Asia needs to develop to support such a decentralized architecture? In the
area of macroeconomic stability, as already mentioned, the region has the
CMIM and AMRO, the independent surveillance unit for the CMIM. In
the medium term, the two institutions should be merged to form the Asian
Monetary Fund (AMF). In a perception survey of ASEAN+3 opinion
makers conducted by a team from Nanyang Technological University
(NTU), two- thirds of the respondents felt that the AMF should be estab-
lished some time during 2016–20 and that the CMIM and AMRO should
be combined to form the AMF (Rana et al. 2012). In the meantime, a more
structured approach of promoting complementarity between CMIM/
AMRO/IMF, similar to the “troika” model being used in Europe, should
also be considered in Asia (Rana, 2014).
In the area of international trade, early steps are being taken to establish
an Asia- wide free trade agreement (FTA). With the implementation of the
ASEAN+1 FTAs between ASEAN and the PRC, Japan, the Republic of
From a centralized to a decentralized global economic architecture 23
Korea, India, Australia and New Zealand, the RCEP comprising 16 Asian
nations is being negotiated.
In the area of financial stability, less progress has been made. But
since the newly established Financial Stability Board does not include all
Asian countries, as in Europe, Asia could consider establishing the pro-
posed Asian Financial Stability Board (AFSB) by involving the region’s
regulators and supervisors. The AFSB would, among others, promote
capital market rules and regulations (micro- prudential monitoring)
and promote the stability of the financial system throughout the region
through early warning systems (macro- prudential monitoring). It could
also coordinate Asia’s participation in the Financial Stability Board and
represent the region in relevant international forums to ensure that the
Asian context is adequately understood in financial policies and regula-
tory reforms.
In addition to establishing the institutions mentioned above, in an
environment of decentralized architecture, Asian countries should strive
to make national and regional decisions coherent globally in order
to prevent races to the bottom and more generally to make national
and regional institutions and agreements complementary or the build-
ing blocks of an efficient global system. Regional institutions should
focus on regional public goods and global institutions on truly global
public goods. The G20 is also in the process of developing best practices
to promote complementarity between national, regional and global
institutions.
2.7 CONCLUSIONS
One of the questions this chapter sought to answer was: will we have
an NBW, as called for by academics and politicians, in the post- GEC
period? The chapter finds that, while the establishment of the G20
Summit is encouraging since for the first time systemically important
emerging markets have been given a voice in international economic
issues, those hoping for an NBW, like those hoping for a new interna-
tional financial architecture in the post- Asian Financial Crisis period,
will probably be disappointed. We are at an interregnum phase of the
NBW, but the constitutive phase could fizzle out. This is for two reasons.
First, as predicted by the theory of clubs (discussed in section 2.3), poli-
cies of IEIs have been relatively inflexible. In particular, the slow progress
in governance reforms of the IEIs or the so- called “chairs and shares”
(voting rights, management and Board representation) reform to give
greater voice to emerging markets – particularly those in Asia, the PRC
24 New global economic architecture
and India – commensurate with their growing economic and political
power has led to questions regarding their legitimacy. Second, the recov-
ery from the Asian Financial Crisis as well as the recovery from the GEC
turned out to be faster than expected. Faster- than- expected recovery has
led to complacency in implementing reforms and in some cases dilution
of the reform agenda.
It is, therefore, likely that in the future we will not have an NBW but
an architecture that will move incrementally toward a more decentral-
ized system where national and regional initiatives will work closely with
the existing IEIs. In this context, Asia has an important role to play in
this architecture by building institutions for regional integration (such as
the AMF, Asia- wide FTA, and AFSB). Asia also has to make sure that
regional initiatives complement global ones and that there is no duplica-
tion. Additionally, Asia needs to take various actions to enhance the legiti-
macy of the G20 process.
NOTES
1. For example, the implementation of Basel III has been adversely affected by the resist-
ance of the industry.
2. Originally, the IMF’s mandate was to promote macroeconomic stability. As the inci-
dence of financial crisis increased with financial globalization, it started to focus on
crisis prevention and crisis management as well.
3. The prevailing thinking at the time was that governments were the problem and
markets the solution.
4. The G7 continues to meet, albeit with much less fanfare. More recently, it has been
meeting to try to resolve the euro area crisis.
5. See Rana (2011 and 2012) on how the G20’s inclusiveness could be enhanced from the
Asian perspective.
6. As of 10 September 2012, 124 members having 73.38 per cent of the total quota had
ratified the 2010 reform (IMF, 2012). Although this meets the required threshold for
effectiveness (which is the consent of membership accounting for over 70 per cent
of the total quota), the quota increase cannot be effective until the Board Reform
Amendment – which, among others, proposes that Europeans give up two chairs at
the IMF Board – also enters into force. As of 10 September 2012, 105 members having
66.14 per cent of total quota had accepted the latter amendment, well short of the
required 85 per cent.
7. Even with the ratification of the April 2008 quota reform, the quota share of emerging
markets and developing countries will increase by only 1.1 per cent. Another 2.8 per
cent reallocation will occur when the 2010 agreement is ratified (Virmani and Patra
2011). Quota misalignments will therefore remain, but at a lower level.
8. The development architecture is quite complex, with over 200 multilateral agencies and
bilateral and private foundations (Kharas 2007).
9. ASEAN plus the PRC, Japan and the Republic of Korea.
10. AMRO’s purposes are to: (i) conduct macroeconomic and financial surveillance of
members; (ii) provide members with policy recommendations to mitigate economic and
financial crisis; and (iii) assist members if they are utilizing financial resources of CMIM
(The Economist, 10 December 2011, Job Description).
From a centralized to a decentralized global economic architecture 25
REFERENCES
Asian Development Bank (ADB). 2009. India 2039: An Affluent Society in One Generation. Manila: ADB.
Bases, D. 2008. World faces new Bretton Woods moment: Stiglitz. Reuters. 6 November, available at: http://www.reuters.com/article/2008/11/06/us- financial- stiglitz- interview- sb- idUSTRE4A58BI20081106 (accessed 28 October 2012).
Dornbusch, R. 2001. A primer on emerging market crises. National Bureau of Economic Research Working Paper 8326. Cambridge, MA: National Bureau of Economic Research.
Eckert, P. 2011. Obama’s Pacific aspirations strain US ties with China. Jakarta Globe. 14 November, available at: http://www.thejakartaglobe.com/world/obamas- pacific- aspirations- strain- us- ties- with- china/478474 (accessed 28 October 2012).
Eichengreen, B. 2009. Out of the box thoughts about the international financial architecture. International Monetary Fund Working Paper 09/116. Washington, DC: International Monetary Fund.
European Commission, 2009. Leaders’ statement: The Pittsburgh summit, available at: http://ec.europa.eu/commission_2010–2014/president/pdf/state-ment_20090826_en_2.pdf (accessed 28 October 2012).
Helleiner, E. 2010. A Bretton Woods moment? The 2007–2008 crisis and the future of global finance. International Affairs 86(3): 619–36.
International Monetary Fund (IMF). 2008. IMF Board of Governors adopts quota and voice reforms by large margin. Press release, available at: http://www.imf.org/external/np/sec/pr/2008/pr0893.htm (accessed 28 October 2012).
International Monetary Fund. 2010. Factsheet: IMF quotas. November 2010, available at: http://www.imf.org/external/np/sec/pr/2010/pr10418.htm (accessed 28 October 2012).
International Monetary Fund. 2012. Proposed amendment on the reform of the IMF Executive Board and the 14th general review of quotas: Status of accept-ances and consents. 10 September 2012, available at: http://www.imf.org/exter-nal/np/pp/eng/2012/091012.pdf (accessed 28 October 2012).
Kawai, M. and P.B. Rana. 2009. The Asian financial crisis revisited: Lessons, responses and new challenges. In R. Carney (ed.) Lessons from the Asian Financial Crisis. New York: Routledge, pp. 155–97.
Kawai, M., P. Petri and E. Sisli- Ciamarra. 2009. Asia in global governance: A case for decentralized institutions. Asian Development Bank Institute (ADBI) Working Paper 157. Tokyo: ADBI.
Kawai, M., P. Petri and E. Sisli- Ciamarra. 2010. Asia in global governance: A case for decentralized institutions. In M. Kawai, J.- W. Lee and P. Petri (eds) Asian Regionalism in the World Economy: Engine for Dynamism and Stability. Cheltenham, UK and Northampton, MA, USA: Edward Elgar Publishing.
Kelkar, V.L., P.K. Choudhry, M. Vanduzer- Snow and B. Bhaskar. 2005. The International Monetary Fund: Integration and democratization in the 21st century. Paper presented at the G24 Technical Group Meeting. Manila. 17–18 March.
Kharas, H. 2007. Trends and issues in development aid. Wolfensohn Center for Development Working Paper 1. Washington, DC: Brookings Global Economy and Development.
26 New global economic architecture
Kirkup, J. and B. Waterfield. 2008. Gordon Brown’s Bretton Woods summit call risks spat with Nicolas Sarkozy. The Telegraph. 15 October, available at: http://www.telegraph.co.uk / news / worldnews / europe / france / 3205033 / Gordon- Browns - Bretton - Woods - summit - call - risks - spat - with - Nicholas - Sarkozy.html (accessed 28 October 2012).
Mohamad, M. 2012. West needs to go back to the capitalist basics. Financial Times. 11 January, available at: http://www.ft.com/cms/s/0/9f60aff2–3ba8–11e1- bb39–00144feabdc0.html#axzz25hY5FsV4 (accessed 28 October 2012).
Nakamura, D. 2011. Obama at APEC summit: China must ‘play by the rules’. The Washington Post. 13 November, available at: http://www.washingtonpost.com / world / obama - at - apec - summit - china- must- play- by- the- rules/2011/11/12/gI QALRu2FN_story.html (accessed 28 October 2012).
Poddar, T. and E. Yi. 2007. India’s rising growth potential. Global Economics Paper 152, available at: http://www.usindiafriendship.net/viewpoints1/Indias_Rising_Growth_Potential.pdf (accessed 28 October 2012).
Rana, P.B. 2011. A proposal to enhance the G20’s ‘input’ legitimacy. VoxEU.org. 22 October, available at: http://www.voxeu.org/article/proposal- enhance- g20- s- input- legitimacy (accessed 28 October 2012).
Rana, P.B. 2012. The evolving multi- layered global financial safety net: Role of Asia. S. Rajaratnam School of International Studies (RSIS) Working Paper 238. Singapore: RSIS.
Rana, P.B. 2014. Conflict between US-led and China-led architecture. VoxEU.org, 5 August.
Rana, P.B., W.M. Chia and Y. Jinjarak. 2012. Monetary integration in ASEAN+3: A perception survey of opinion leaders. Journal of Asian Economics 23(1): 1–12.
United Nations. 2009. Report of the Commission of Experts of the President of the United Nations General Assembly on reforms of the international monetary and financial system. New York: United Nations (Stiglitz Commission Report).
Virmani, A. and M.D. Patra. 2011. IMF Reforms 2010: Do they mirror global economic realities? Economic and Political Weekly, XLVI(30), 23 July, available at: http://www.epw.in/special- articles/imf- reforms- 2010- do- they- mirror- global- economic- realities.html (accessed 28 October 2012).
Wilson, D. and R. Purushothaman. 2003. Dreaming with BRICs: The path to 2050. Global Economics Paper No. 99. New York: Goldman Sachs.
Zhou, X. 2009. Reform the international monetary system. BIS Review 41/2009, available at: http://www.bis.org/review/r090402c.pdf (accessed 28 October 2012).
Zoellick, R. 2010. The G20 must look beyond Bretton Woods II. Financial Times. 7 November.
27
3. The Group of Twenty: input and output legitimacy, reforms and agenda
Andrew F. Cooper
3.1 INTRODUCTION
The elevation of the Group of Twenty (G20) to the leaders’ level antici-
pated a new form of collective action at the apex of the global system.
In a break from past situations of economic stress, whether the 1930s or
early 1980s, key countries from both the old elite of states and a cluster of
emerging powers were able to act together within a multilateral crisis com-
mittee process via the G20 and attendant institutions. In terms of form,
speed and scope of agenda this process allowed an unprecedented degree of
cooperation. Yet shared anxiety about a massive rupture of the system did
not translate into an embedded set of shared interests or norms (Rachman
2010). Cooperation even in a concentrated forum via the G20 is not the
same as consensus. Hanging together in a sustained fashion still faces enor-
mous obstacles due not only to differences over outputs in terms of policy
delivery but some serious gaps in terms of input legitimacy as well. The
result is an awkward institutional arrangement, with some important inno-
vative qualities (including an extension of insider status to an enhanced
cluster of Asian countries including not only the People’s Republic of
China (PRC) and India but also the Republic of Korea and Indonesia) but
also some serious gaps in terms of efficiency and representation.
It should be recognized at the outset that such flaws have a paradoxi-
cal flavor to them given that the push for the G20 in the first place was
to enhance the legitimacy of an expanded summit at the center of power
beyond the institutional status quo with lessons learnt from previous
crises. The recognized champion of this reformist model was Paul Martin,
successively Finance Minister and Prime Minister of Canada between
1993 and 2006. In an April 2004 speech, at the Woodrow Wilson Center
in Washington DC, Prime Minister Martin articulated the genesis and the
framework he had in mind:
28 New global economic architecture
an approach I believe to be worthwhile would be to look at the lessons learned from the G- 20 Finance Ministers that was formed in the wake of the Asian Financial Crisis that began in 1997. We foresaw an informal gathering of finance ministers, representing established and emerging centres of influence, and coming from very different political, economic, cultural and religious tra-ditions. We wanted to bridge the ‘us’ versus ‘them’ mentality that bedevils so many international meetings, and it has worked remarkably well – because peer pressure is often a very effective way to force decisions. We believe a similar approach among leaders could help crack some of the toughest issues facing the world. (Martin 2004)
Ideally, therefore, the G20 contained elements of advances towards a
cosmopolitan order, in which countries from most of the major regions
and cultures would obtain representation. Not only could the G20 offer
instrumental delivery, it could do so explicitly as a forum of “un- like”
actors, fully reflective of a diversity of voices. Instrumentally, although
continuing to come up against serious barriers pertaining to competitive
national interest, the G20 could be situated in the wider conceptual lit-
erature as a forum in which participants possessed the potential to make
a genuine effort to find solutions that could be accepted by others on the
basis of openness to learning and deliberation (Woods 2010; Koenig-
Archibugi 2010). The logic of bringing in emerging economic powers to
the “high table” of international affairs seemed unassailable. In the words
of Timothy Garton Ash in January, 2008, prior to the financial crisis:
The dangers of climate change, nuclear proliferation, disease and poverty – not to mention the fragile state of globalized capitalism – demand a more credible and representative cast at the annual intergovernmental summit. As Asia rises, it is ever more absurd that the world’s unofficial top table has a seat for Italy but not for China. (Garton Ash 2008)
As the G20 moved from concept to practice, galvanized by the financial
shocks of late 2008, many of these claims became embedded in the project.
As David Held has signified, the G20 featured “an unprecedented success-
ful attempt by developing countries to extend their participation in key
institutions of global governance” (Held 2010, p. 204).
This cosmopolitan image was strengthened by the presence of key
regional drivers within the G20. All members of NAFTA were included,
each of the European Union (EU) 4 (the United Kingdom, France,
Germany and Italy), plus Japan and the BRICs (Brazil, Russian
Federation, India, and the PRC). Additional space was made available for
Turkey, Saudi Arabia, South Africa, Australia, as well as Indonesia and
the Republic of Korea, making the forum global in its reach.
Such a diverse membership also opened the way for connections of
The Group of Twenty 29
different forums with a wide number of regional organizations – the
Association of Southeast Asian Nations (ASEAN) as well as the African
Union (AU) and MERCOSUR, the Gulf Cooperation Council (GCC)
and the Economic Cooperation Organization (ECO). To give just one
example of how this connection was made at the level of declaratory lan-
guage, Saudi Arabia defended its position in the G20 not by referencing its
leadership position in the Middle East but because of its role in the GCC
(Zawya 2009).
Yet, over time, it is clearly the contested nature of the G20 that has
come to the fore. One type of criticism is that the G20 is an explicitly
top- down, executive mode of institutional reform. Not only is the initia-
tive state- centric in origin, it is leader- centric with a sharp differentiation
between the role of heads of government and ministers and/or bureau-
crats. From another angle the G20 appears to constitute an extended form
of insider–outsider discrimination via a self- selected club. Such criticisms,
although justified to some considerable extent, also require some nuancing
in order to privilege both the sources of reform and status quo orientation
in the G20.
3.2 RE- FRAMING THE G20 AS BOTH A SOURCE OF REFORM AND STATUS QUO ORIENTATION
The first component of reform orientation that must be showcased is the
degree of institutional engagement with challengers – or potential rivals –
located in the G20. Traditionally, concerts have been formed with “like-
minded” countries as in 1919 or (in terms of an anti- revolutionary ethos)
in 1814–15. In cases of concerts formed with “unlike- minded” countries,
most notably at the end of World War II, their existence has been limited
in terms of time period and agenda. The more common approach of the
relationship between ascending and dominant powers has been conflict
oriented, not cooperative practices, featuring a mix of balance of power
and unilateral strategies. Prussia under Bismarck/Kaiser Wilhelm per-
formed as a classic realist power, with the goal of enhancing national inter-
est and national capabilities through the acquisition of territory (Kennedy
1987). The Soviet Union’s behavior was quite similar, with an emphasis
on bipolarity and proxies on a regional basis. Concert power as played out
in the United Nations (UN) was secondary to the great game, and usually
centered on the use or non- use of veto power in the UN Security Council.
Moreover, the United States (US) operated in much the same manner
with a low priority on cooperation in the international system before
World War II. As a result of congressional objections, the US walked
30 New global economic architecture
away from the League of Nations post- World War I. During the inter- war
period, the US adopted a spoiler role in times of crisis – as witnessed by its
willingness to torpedo the 1933 World Economic Conference in London
(Foss and Austin 1933).
But the US’s ambivalence towards multilateral cooperation resurfaced
during its moment of US uni- polarity in the post- Cold War period, as
featured by the American reliance on informal “coalitions of the willing”
as opposed to formal institutions such as the UN or the North Atlantic
Treaty Organization (NATO). Situated in this version of a hub and spoke
matrix the US as the central pivot is accorded full power of agency with an
enormous amount of autonomy provided for its commitments and capa-
bilities (Cooper 2008).
The collective challenge of the “Third World” in the 1970s and early
1980s provided a different lens to the cooperative/conflict dynamic. As
opposed to individual rising states the G77/Non- Aligned Movement
(NAM)/UN Conference on Trade and Development (UNCTAD) chal-
lenge of the “Third World” put a heavy emphasis on solidarity by coun-
tries from the global South. This challenge was cast in an oppositional,
or even counter- hegemonic, framework with the aim of transforming the
system (Cox 1979; Ruggie 1983).
This approach had a potentially constructive element, the trade union
oriented approach for a more equitable deal on commodity sales, for
example. But it also contributed to an ossification of diplomacy, with a
sharp division between North and the global South. There was little or no
space for mixed coalitions.
The established powers were challenged explicitly due to their privi-
leged role in systemic terms, as expressed in their veto status inside the
UN, the directorate role assumed by the G7/8, the longstanding debate
over votes and shares in the International Financial Institutions, the
globally- directed initiatives (such as those dealing with Offshore Financial
Centers or OFCs) from the Organisation for Economic Co- operation and
Development (OECD), and the existence of exclusive small groups such as
the “green room” process through the World Trade Organization (WTO).
The intensity of the challenge was magnified by a psychological sense of
being outsiders in the multilateral system, kept away from these privileges.
The only redress was therefore through solidarity, maximizing the use of
weight of numbers. Attempts to negotiate around these differences (and
images of bias in the system) met with repeated failure. The classic case
of this dilemma was the 1981 Cancun conference, a creative attempt to
break out of the North/South standoff inspired by the Brandt Commission
report under the leadership of Mexico, Canada and Austria.
However, notwithstanding the record of conflict, a strong case can be

The Group of Twenty 31
made that cooperation has been on an upward trajectory since the eco-
nomic ruptures in 2008. Key multilateral forums are opening up in a more
equitable fashion. As highlighted by the pivotal institutional response –
the G20 – to the financial crisis there is some considerable recognition at
the heart of the system that the G7/8 or any other small exclusive club is
not a legitimate or effective means of problem solving.
The dynamics – and the context – around the G20 are very different.
Even with the flaws of “output” and “input” legitimacy that will be dis-
cussed in this chapter the fundamental claim that cooperation is overtak-
ing competition as the dominant mode of behavior in the aftermath of
the 2008 financial crisis must be taken seriously. Although some com-
mentators do make analogies to historical patterns of behavior, present-
ing the image of a rising PRC as the twenty- first century equivalent of
Prussia (Goldstein 2003), the structural rationale for viewing cooperation
rather than competition as the dominant trend at the apex of the inter-
national system is substantial. The PRC and the US have certainly built
up a deep and intricate form of interdependence, dubbed Chimerica by
Niall Ferguson (Ferguson 2007). Although not without controversy and
stress, the PRC has massive holdings of US treasuries. US multinationals
have invested heavily in the PRC, and companies such as Walmart and
Costco (and American consumers) continue to rely heavily on made- in-
PRC goods. Statistics collected by the US– PRC Business Council (2011)
highlight the measure of interdependence, with PRC exports to the US
amounting to a US$1 billion a day in 2010 (just under 25 per cent of PRC
exports) (see Table 3.1).
Diplomatically, both the symbolic and instrumental advantages for
emerging/ascending powers participating in new forums with the old
Table 3.1 The PRC’s trade with the United States, 2001–10 (US$
billion)
01 02 03 04 05 06 07 08 09 10
US exports 19.2 22.1 28.4 34.7 41.8 55.2 65.2 71.5 69.6 91.9
% change* 18.3 14.7 28.9 22.2 20.5 32.0 18.1 9.5 −2.6 32.1
US imports 102.3 125.2 152.4 196.7 243.5 287.8 321.5 337.8 296.4 364.9
% change* 2.2 22.4 21.7 29.1 23.8 18.2 11.7 5.1 −12.3 23.1
Total* 121.5 147.2 180.8 231.4 285.3 343.0 386.7 409.2 366.0 456.8
% change* 4.5 21.2 22.8 28.0 23.3 20.2 12.8 5.8 −10.6 24.8
US balance −83.0 −103.1 −124.0 −162.0 −201.6 −232.5 −256.3 −266.3 −226.8 −273.1
Notes: * Calculated by the United States–China Business Council (USCBC).
Source: US Department of Commerce; US International Trade Commission (ITC).
32 New global economic architecture
establishment were confirmed by the experience of the G20 finance in
the late 1990s in the aftermath of the Asian/International Monetary
Fund (IMF) crisis. The extent of this institutional advance on non- G20
countries generally and key Asian economies – being at the table on an
equal basis – should not be minimized. The establishment of the G20 set
a precedent by opening up membership on a procedural basis to pivotal
countries in the global South. Not only did a large group of countries from
all quadrants of the globe enter the G20, these countries gained some sig-
nificant forms of ownership of the forum. The distribution of the hosting
function showed that the G8 was willing to share elements of power. The
scope and magnitude of the GFC also illustrated that a nuclear, G7-
centric governance response was not sufficient: liquidity was needed from
high- savings countries. The functional option was to enact a G20 leaders’
economic summit.
To highlight the similarities between the two crises that created the G20
finance and the G20 at the leaders’ level is not to exaggerate the parallels
to an unwarranted degree. The shocks triggering the G20 finance became
largely identified with a specific region as witnessed by the common
usage of the label, the “Asian” crisis. And even this label is misleading as
the crisis hit hardest a particular cluster of countries, namely Thailand,
Republic of Korea, Indonesia and Malaysia (Wade 1998). The strong
reaction at the global institutional level was generated not by the Asia (or
more precisely an East Asian or ASEAN plus) crisis per se, but by the fear
that the symptoms would spread via a contagion effect.
By contrast the 2008 crisis was an authentic global phenomenon.
Although a school of thought had developed that the big rising states and/
or emerging markets were decoupled from the reverse contagion (with the
economic shocks spreading from the established industrial countries to
the global South) (Oakley 2009), the dominant scenario was considered a
return to the global or great depression of the 1930s. It was this scenario
that concentrated the minds of policymakers in the PRC, India and Brazil
as well as the Group of Eight (G8) countries, in other words those outside
the G8 but in the G20 finance.
Because of these differences in scope the academic responses from a
critical perspective to the two episodes of institution building have been
very different. Given the magnitude of the crisis, there was little in the way
of immediate negative reaction about the intensity of the response. The
main source of disagreement was about the cause of the crisis (Cooper and
Subacchi 2010), and the implications in terms of concert power (Åslund
2009).
Alternatively the reform process animated through the G20 finance
was interpreted by its critics as a consolidation – not a loosening – of
The Group of Twenty 33
power by the G8 and by the ideology of neo- liberalism more generally.
Notwithstanding the signs that the G20 was operated through a culture
of formal equality, and that the non- G8 members developed an enhanced
comfort zone within this ambit, this forum was commonly portrayed as
a process not signifying a new mode of global governance but a more
concerted form of discipline emanating from the traditional core of the
international system (Beeson and Bell 2009; Bailin 2005).
Yet, notwithstanding this critical perspective, the creation of the G20
finance had attractions, especially for a country such as the PRC, without
having many defects. It allowed “an informal mechanism for dialogue
among systematically important countries” but did so “within the frame-
work of the Bretton Woods institutional system”, a theme that has con-
tinued to be emphasized. The PRC thus received greater status and access
without moving away from the rest of the rising states/emerging countries
on its own. As one prominent PRC economist commented: “Broader
representation is crucial. The G20 is designated to fulfill this need for rep-
resentation from emerging countries” (Yu 2005, p. 6).
Without a catalyst, however, the reform project designed to bring
about an expanded forum at the apex of power could not overcome the
formidable obstacles of political/diplomatic interests. The status quo
remained more attractive to most of the G7/8 members than a leap into
the unknown. The US, under George W. Bush, was reluctant to share
power unless there was a fundamental rationale for doing so. Reinforcing
these instincts, there were concerns that such a revamped summit could be
used to “gang up” on the US. Smaller members of the G8 worried about
a possible loss of status.
3.3 MOVING BEYOND THE BRICS
Another source of reform orientation – often overlooked in the focus on
the BRICS – is the space for additional countries, including those from
Asia. Through the dominant lens, associated with the image of concert
power, global affairs are moving towards an accentuated form of multipo-
larity, in which power coalesces around a small number of dominant
poles (the established G7/8 and BRICS). Such a perception is consistent
with past eras in which a group of big, dominant countries would come
together at the time of decisive ruptures, as witnessed in 1814/15, 1919 and
1945.
Notwithstanding these signs of commonality with past eras, though,
there are other scenarios that point to a very distinctive alternatively
framed environment. At odds with the impression of a new concert of
34 New global economic architecture
powers is the relatively large number of countries involved in the G20, as
featured both in the late 1990s with the establishment of the G20 finance
and in the elevated G20 at the leaders’ level. In 1814/15 the concert was
made up of five core countries – Britain, Prussia, Russia and Austria plus
France. Although other countries participated, unlike at the G20, there
was no illusion of equality. The same basic formula was utilized at the
1919 Paris Treaty negotiations, where there was a “Big Four”, or argu-
ably a “Big Three” with the United Kingdom (UK), the US and France.
Moreover, in similar fashion, there was a Big Three at Yalta and Potsdam,
although of course five countries received permanent veto- bearing seats at
the UN. By way of contrast, the members of the G20 are quite numerous
and diverse. There is neither the image of allies or victors in war, nor is
there the sense of ideological uniformity or anti- revolutionary ethos. In
the G20, as the hub of the new order, there are countries from every quad-
rant of the globe plus some implicit (although not initially formalized)
regional representation.
Under such conditions there is space for different – although perhaps
not mutually exclusive – components to form within the G20 at the
leaders’ level. As rehearsed, most of the attention here focuses on the
interaction between the established G7/G8 and the rising BRICS group
(Cooper 2010). What provides the BRICS with its distinct character is the
impressive economic performance by the entire cluster of countries that
can be considered emerging or rising states. All of the original BRIC coun-
tries – Brazil, Russian Federation, India and the PRC – have their annual
gross domestic product (GDP) at over US$1 trillion each.
Yet beyond the core trilateral G8 countries and the BRICS is another
key, albeit largely unanticipated, component within the G20. The gap
between the largest of the BRIC states and middle powers comes out
clearly in terms of nominal GDP. As compiled by the IMF (2011) the com-
parative data for 2011 put the PRC’s economy at US$6988.470 billion,
the highest amongst the BRIC states, followed by Brazil at US$2517.927
billion, and India at US$1843.382 billion. By way of comparison, the GDP
of middle powers, while impressive, lag behind. The Republic of Korea’s
GDP is calculated at US$1163.847 billion and Indonesia at US$834.335
billion (IMF 2011).
If in a different economic category, however, some of these middle
powers have a combination of resources, diplomatic opportunities and
skills that mark them out as a privileged cluster. This opportunity has
been reinforced by a number of factors. The first major opening was the
choice to take the G20 model “off the shelf” from the G20 finance as
opposed to alternative designs around a smaller group such as a G12/G13/
G14 favored by many EU states, including President Nicolas Sarkozy of
The Group of Twenty 35
France. At a meeting held in Washington on 18 October 2008, President
Sarkozy (accompanied by President of the European Commission José
Manuel Barroso and the French Finance Minister Christine Lagarde)
tried to move President Bush towards an enlarged G8 with pivotal emerg-
ing states, albeit significantly not a fully- fledged G20. President Bush
might have been a “lame duck”, but on this issue he did not act as one.
Fearful that the Sarkozy approach would gain traction, he made it clear
that he wanted the summit to be bigger and more inclusive than the G7/
G8- plus model. Significantly, the Treasury Secretary Hank Paulson writes
in his memoirs that he had proposed a G20 meeting before Sarkozy’s
visit in an effort to deflect the French approach which the “White House
suspected [was an effort] to pull off a publicity coup on our home turf”
(Paulson 2010, p. 373).
The second opening for reform came as a result of the attitude of the
BRICS to the G20. By way of contrast there was an enormous buy- in
from the emerging powers for the G20, at least in the initial stages. When
the call came for the G20, all of the ascending states not only took part
but energetically participated in the preparation. As the Brazilian Finance
Minister (Mantega 2008) indicated, the call from these countries was for a
new form of institutional improvisation:
there is no agile structure prepared to deal with emergency economic prob-lems. That is what we have seen at this time. . .We have to turn this G20 into a forum or a tool of some kind that can provide answers to immediate problems and coordinate its actions better amongst many countries. We are facing the most serious financial crisis perhaps since the crisis of 1929, and as this crisis is getting more serious it demands quick answers, immediate answers. It must be monitored day by day, hour by hour, so that the necessary measures can be taken to handle the problems that arise. So, there must be very agile instru-ments available for that to happen.
Further, all the emerging powers bought into the coordinated approach,
as can be seen most emphatically in the manner by which the PRC and
other countries embraced the stimulus program both individually and col-
lectively. To be sure, this buy- in was facilitated by the way that the G20
finance evolved as a problem- solving forum. However, this image was
reinforced in turn by the opening up of other institutions to the ascend-
ing states, the prime example being the reform of the Financial Stability
Forum into the Financial Stability Board. In so doing, a number of the
traditional anomalies disappeared, most notably the presence of Hong
Kong, China and not the PRC in this institution.
Up to the June 2010 Toronto G20 summit there were ample signs of
success in terms of the building of “input” legitimacy. Momentum built
36 New global economic architecture
up through the initial Washington summit in November 2008, London in
April 2009, and especially Pittsburgh in September 2009. The dominant
message through this process was that governments needed to “finish the
job” by implementing the stimulus measures they promised before putting
on the brakes, which if done too abruptly or sharply, could push many
economies back into recession.
Diplomatically, this concentrated approach also had the advantage
of not going too far in disturbing the consensus established through the
G20 process. At the time of Pittsburgh in late September 2009, there did
appear to be the prospect that the agenda could open up in a more ambi-
tious manner. Most notably, the issue of global “imbalances” was placed
on the agenda along with a renewal of the drive for IFI reform (Nelson
2010, p. 10)
Since Pittsburgh, any such prospects for an enlarged consensus have
eroded considerably. The relationship between the PRC and the US has
been severely tested amidst charges of heightened protectionism and cur-
rency manipulation. More generally, the G20’s willingness and/or ability
to expand its mandate have been curtailed by the immobilization of issues
such as finance for climate change.
More specifically, the opening for middle powers came about through
gaps in alternative forms of leadership via the BRICS. Certainly, the extent to
which the BRICS want to embrace this institutional main game, as opposed
to national self- insurance and/or alternative global/regional institutional
options in which they have more autonomy, is still unclear (Barma et al.
2007). Put another way, it is unclear whether the preference of the big rising
states from the global South is to work through core inter- governmental
forums or to utilize other parallel forms of international coordination. One
argument points towards the emergence of “an ambiguous new order . . . in
which multilateral institutions . . . have only a limited role to play alongside
emerging national and regional strategies” (Woods 2010).
Signs of this parallelism were further accentuated by the move to for-
malize the BRICs/BRICS as a grouping with a concern with equity and
justice for the less powerful and those intended to curtail the restrictive
unilateral or plurilateral/coalitional activity by the most powerful. The
Yekaterinburg Joint Communiqué declared that:
We are committed to advance the reform of international financial institutions, so as to reflect changes in the world economy. The emerging and developing economies must have greater voice and representation in international financial institutions, and their heads and senior leadership should be appointed through an open, transparent, and merit- based selection process. We also believe that there is a strong need for a stable, predictable and more diversified interna-tional monetary system. (Yekaterinburg Joint Communiqué 2009)
The Group of Twenty 37
By way of contrast, select middle powers have grabbed the opportunity
to take a leadership role within the G20. In overall terms, it must be appre-
ciated that a middle power hosted the G20 in 2010 (Republic of Korea),
2012 (Mexico), and 2014 (Australia), and will host it in 2015 (Turkey),
and 2016 (possibly Indonesia). In specific terms, much of the credit for
maintaining the output legitimacy amid policy differences must go to the
Republic of Korea and Australia. The Republic of Korea and Australia
both worked hard after the London summit to institutionalize the G20.
A joint op- ed column that the leaders of the Republic of Korea and
Australia, Lee Myung- bak and Kevin Rudd, contributed to the Financial
Times urging the G20 leaders to agree on a framework for macroeconomic
policy coordination in Pittsburgh was one of the highlights of their joint
action (Lee and Rudd 2009). Both countries felt that their efforts paid
off when G20 leaders in Pittsburgh decided to designate the G20 as the
premier forum for international economic cooperation and to make it an
annual meeting.
The Republic of Korea, as the 2010 chair country, took the forum
through two G20 summits in 2010, Toronto in June and Seoul in
November. As The Economist points out, the Republic of Korea’s ener-
getic leadership helped turn the G20 into “a talking- shop worth having”
(The Economist 2010). The Republic of Korea has been active at the G20
from the very beginning. President Lee Myung- bak decided early on to
contribute to global discussions on ways to fight the global financial crisis
as the Republic of Korea was one of the hardest hit victims in the 1990s
Asian Financial Crisis. He called for a standstill on trade protectionism
at the first G20 summit in Washington in November 2008. The Republic
of Korea’s contributions have been particularly noteworthy in the areas
of common interests both for the emerging and developed countries, as
it defines its role as a bridging power between the two camps. Korean
initiatives at the Seoul summit included global financial safety nets and
development assistance for poor countries.
The idea of the financial safety net attracted strong interest from emerg-
ing market economies that are vulnerable to sudden changes in interna-
tional capital flows. Before the 2008 crisis, emerging markets in need did
not want to turn to the IMF for help because an IMF bailout brought a
stigma effect, destroying the credibility of borrowers. What they needed
in the IMF was a pre- crisis prevention insurer, not just a post- crisis
bailout fund. During the Seoul summit, the G20 decided to strengthen
the IMF’s crisis prevention role by expanding the IMF’s Flexible Credit
Line and introducing a new Precautionary Credit Line. G20 leaders hoped
that these new sources of funding would reduce the need for emerging
countries to accumulate foreign reserves as self- insurance against volatile
38 New global economic architecture
global capital flows. The Republic of Korea also sought ways for the IMF
lending facilities to link up with various regional arrangements such as the
Chiang Mai Initiative (CMI) in Asia.
The Republic of Korea’s presidency of the G20 also presented an
opportunity to bring development issues to the table. With its vivid memo-
ries both of development successes and failures, the Republic of Korea
pushed for a development agenda and multi- year action plan, including a
pledge for duty- free, quota- free market access for low- income countries.
The initiatives could make the G20 summit a much more inclusive and rel-
evant event for the entire world as it can bring more than 173 non- member
countries into the G20’s sphere of influence.
The Seoul summit also aimed to achieve macroeconomic coordina-
tion with detailed policy recommendations for each individual member
country to develop the Framework for Strong, Sustainable and Balanced
Growth. The uneven and slowing global economic recovery sparked a cur-
rency war, with the US, the PRC and Japan beefing up the battle to grow
through exports. The PRC’s currency policy in particular was the target
of major concern among its trading partners. Believing that the PRC
government keeps its currency undervalued, the US and others called for
the appreciation of the PRC currency at the Seoul summit. Identification
and correction of macroeconomic imbalances were another thorny issue.
The US wanted to set numerical targets on current account surpluses
and deficits but major surplus countries such as Germany and the PRC
strongly opposed proposals to quantify limits on them. In the end, no
breakthrough on currency and imbalance issues was reached at the Seoul
summit. But the Republic of Korea managed to broker significant agree-
ments. On currency levels, the leaders agreed to move toward market-
determined exchange systems, and on macroeconomic imbalances they
set the deadline of June 2011 for coming up with “indicative guidelines”
of what constitutes an over- the- top deficit or surplus. There are media
reports that President Lee threatened not to end the meeting until the PRC
and other opponents agreed to the deadline (Mo and Seo 2010).
Another key agenda was to overhaul the IMF, especially the shift of 6
per cent in quota to under- represented members from the over- represented
countries. The Republic of Korea as the chair worked hard to hammer out
agreements on most of the controversial issues by the November 2010
summit. Most agree that the apparent breakthrough in the reform of IMF
governance, even subsequent stalling, counts as a major achievement of
the G20.
In addition to agenda- setting and coordination, the Korean government
in Seoul demonstrated its commitment to input legitimacy by way of effec-
tive consensus- building and global communication in the run- up to the
The Group of Twenty 39
G20 Seoul summit. It hosted the World Bank and IMF conferences along-
side the meetings of finance ministers and central bank governors in the
Republic of Korea and invited most top government officials from Africa
to hear their opinions about the G20 agenda and build up a consensus on
the development issue. The Seoul Development Consensus was advanced
as a means that integrated countries from the global South into the global
economy, while retaining an emphasis on political autonomy. The Republic
of Korea also organized a gathering of more than 100 chief executive
officers from Fortune 250 companies during the Seoul Summit in a bid to
reflect private- sector views when political leaders discuss global issues and
concerns. Indeed the “business summit” has become a regular event as wit-
nessed through the 2011 Cannes summit and subsequent meetings.
3.4 ONGOING PROBLEMS OF “OUTPUT” AND “INPUT” LEGITIMACY
Notwithstanding the infusion of the G20 with middle power diplomatic
creativity and commitment, the constraints on the G20 have become
enormous. In contrast to the successes of the initial summits, the Toronto
summit in June 2010 and the Seoul summit in November 2010 present
more mixed if not completely pessimistic experiences. As the urgency of
the economic crisis diminished, the sense of common purpose that united
the G20 leaders seemed less present. As noted above, at the time of the
Seoul summit in particular, the G20 became caught up in a number of
bitter disputes such as those over the “currency war”, both in terms of US
charges of PRC manipulation of the yuan and US quantitative easing,
and global imbalances and the debate over current account targets. With
the erosion of urgency, due to perceptions that the global crisis was
easing, these policy differences became embedded in the G20 process. The
media increasingly adopted a much more skeptical view than their earlier
glowing reviews of the G20’s role as a crisis committee. The new mood was
summed up by the Financial Times, which concluded that the Seoul G20
demonstrated “how not to run the world” (Financial Times 2010).
At Cannes, in November 2011, the impact of the euro- crisis situation
was palpable. Instead of being able to move forward to the function of
steering group, the G20 crisis reverted to the role of crisis committee. The
dominant theme was a concern with firewalls and buffers against conta-
gion and the need for a sustainable path of economic development for
Europe.
Such a restricted outcome was exacerbated by the tensions in French
leadership. In style the real deficiency was due to over- promising by
40 New global economic architecture
President Sarkozy. Instead of concentrating on a manageable agenda,
President Sarkozy declared that progress could be garnered on a wide
number of fronts: an ambition that combined state- centrism with elements
of innovative networking with non- state actors. The most notable illustra-
tion of the trajectory towards the network approach was the elevation of
Bill Gates to a privileged position within the G20 as a powerful champion
for a financial transaction tax. Although provided with insider status, nev-
ertheless, Mr Gates was marginalized at Cannes amid the preoccupations
with the euro area crisis.
In terms of agenda, this loss of momentum does not translate into a
collapse of the entire G20 project. And these constraints should not be
exaggerated to the point where the G20 is viewed as having lost its capac-
ity to act as a hub of global governance. As a crisis committee the G20 is
still moving forward on a number of points. One is to put emphasis on
IMF surveillance inside Europe itself, with the push to have Italy accept
“voluntary” oversight over its austerity measures. Such a move is designed
to create an effective instrument that would allow these austerity measures
to be implemented to a clear timetable without any slippage. The fact that
the final declaration says that this surveillance will be carried out with
public verification with respect to policy implementation on a quarterly
basis shows the extent of the anxiety.
As a nascent steering committee, there is also progress toward an
agenda beyond the immediate ambit of the financial crisis. One illustration
emerged at the 2013 Russian G20 with the engagement of foreign ministers
on the Syrian issue.
Yet the formidable constraints on the G20 should not be ignored. Due to
the embedded constraints of collective action, as Stephen Krasner predicted,
the Seoul G20 “stumbled” over a wide number of the impediments that it
faced (Asian Institute for Policy Studies 2010). In the face of such impedi-
ments there is a need to look at the G20 not only as the hub of a new mode
of cooperation but alternatively as both an accommodative/ functionally
cooperative and a political/conflict- oriented institutional design.
In terms of “input” legitimacy two flaws in the original G20 design
stand out. The first flaw was the absence of the UN in the design.
Although Secretary- General Ban Ki- moon did attend the Washington
G20, some considerable distance appeared between the UN and the G20
approach on the eve of the initial summit. In a news conference on 11
November (the G20 being on 14–15 November), Ban focused his attention
on the need for “inclusive multilateralism”, with a focus on protecting the
well- being of the developing countries, as well as major UN development
goals, including climate change, food crisis issues and financing for devel-
opment. Ideationally, the main source of contest came from the move by
The Group of Twenty 41
the GA President to convene a panel of experts, chaired by Joseph Stiglitz,
in contradistinction to the G20. Organizationally, the main alternative
focal point became the UN Conference on the Global Economic Crisis at
the end of June 2009.
Having grabbed the spotlight as the dominant site of criticism during
the formative stages of the G20 at the leaders’ level, however, the UN-
oriented backlash against the G20 has eased. As the G20 has expanded its
agenda the UN has endorsed the credo that the two institutions are differ-
ent and complementary, not competing and contradictory (Kim 2010b).
UN Secretary- General Ban Ki- moon has accepted de facto a subordinate
role, in which he attends the G20 summit as the world’s top civil servant
but plays a secondary role to the leaders seated at the world’s top table.
The other criticism is from a non- member perspective. While acknowl-
edging the innovative design for global governance through the establish-
ment of the G20 for new multilateralism, the self- selective nature of the
G20 (and the bias toward bigness) exposes the Achilles heel of the G20 in
terms of its representational gaps. The G20 in principle and in practice has
been animated by an instrumental – with attendant “output” legitimacy –
purpose. In the rush to find solutions, nonetheless, there is a need to catch
up in terms of “input” legitimacy about the balance between member and
non- member countries and the regions they come from. If cognizant of
the forum’s strengths, sophisticated observer- participants of the Korean
summit recognized “membership composition” as the G20’s glaring weak-
ness (Lee 2010, p. 43).
The regional/smaller state criticism of the G20 can be put into three
broad categories. The first is the group of countries that reject the G20 in
an outright fashion, most notably the ALBA (Bolivarian Alliance for the
Americas) countries. Due to India’s presence in the G20, Pakistan is the
one Asian country that falls squarely into this category. It is interesting
from this perspective, therefore, that at least one task force (chaired by
Richard Armitage and Samuel Berger, top aides to Presidents George W.
Bush and Bill Clinton) proposed that Pakistan be given at least observer
status in the G20 (Iqbal, 2010). Still, such overtures have not blunted
Pakistan’s opposition, cast not in a regional- representation but defense of
universal multilateralism mode. This view was made explicit in the run- up
to the Toronto G20 summit, when Pakistan’s UN ambassador, Abdullah
Hussain Haroon, warned against any formal relationship of the UN with
the G20:
Frankly, what we do not want to see, is for the UN Secretary- General or the UN and by implication, its membership to own or be associated with any decisions in whose finalization it has no voice or participation. . . Any global
42 New global economic architecture
economic architecture must, in our view, ensure inclusiveness, transparency and full representation of all developing countries and promote full comple-mentarities and coherence. (The Nation 2010)
A second category is the cluster of countries that are potential additional
members of the G20 if the design expanded in one way or another. Some
of these countries have been quite vocal in their demands. In Europe, the
early position of Norway stands out in this category. Norwegian Foreign
Minister Jonas Gahr Støre offered a robust critique of the G20, labeling it
as “a grouping without international legitimacy” or without a “mandate”
concerning “its functions” (Der Spiegel 2010). Yet the focus of his instru-
mental proposals was directed at broadening the G20, not replacing it. His
prime objective was that the members of the Nordic Council – Norway,
Sweden, Denmark, Finland and Iceland – should share a rotating seat
together with the Baltic States. Extending this line of thought, the sug-
gestion was also made that similar arrangements could be made for
other under- represented groups, such as African and Arab countries
(Government of Norway 2009).
In the African context, Nigeria used regional gatherings to exert its own
candidacy for entry into the “high table” of the G20. Having been left out
at the summit, Nigeria reasserted its claims for membership at a meeting
of African finance ministers (on the sidelines of the IMF annual meeting),
with its own Finance Minister, Mansur Muhtar, arguing that: “We have
been clamouring for a greater role . . . For us the key concern is to see that
the principle [of enhanced representation] gets accepted” (Reuters 2009).
Here the lack of a visible campaign by Asian countries, notably Malaysia
and Thailand, is salient. Both of these countries had been members of the
G22 that also emerged from the Asian/IMF crisis in 1998, and had been
considered for membership for the G20 finance. But in neither case did
these countries make a high- profile public claim to a seat at the top table
on a national basis.
The third group of “outsider” countries expressed concern that deci-
sions were being taken within the G20 without their representation or
consent, but rather than outright rejection, the preference has been a
pursuit for inclusion. The G20 is viewed as having some positive features
but remains in need of refinement in order to maximize its benefits to a
greater range of countries.
This orientation is showcased above all in the Asian context through
ASEAN. This was a robust claim at the outset with ASEAN advocat-
ing for a formal seat at the table of the G20, as opposed to simply rep-
resentation by its chair. This way forward was advocated at Davos in
January 2010 by the Vietnamese Prime Minister, Nguyen Tan Dung
The Group of Twenty 43
(ASEAN Secretariat 2010), as he pushed the notion that there should
be an “increase [in] the representation of G20”, stating “I think that it is
important to institutionalise the participation of regional organisations
like ASEAN”. Over time, however, ASEAN demonstrated considerable
flexibility. The leaders’ statement from the 2010 ASEAN summit declared:
“ASEAN strongly believes that it can contribute to the deliberations of
the G20 through the continued participation of the ASEAN Chair and the
ASEAN Secretary- General” (Rana 2010; 2011).
3.5 REGIONALISM AS A CATALYST FOR FURTHER REFORMS
It is the dynamic surrounding the G20 as an elevated form of new multi-
lateralism that continues to be subject to scrutiny. Although the coordina-
tion problems have become more difficult as its agenda has evolved, the
quality of the G20 entrepreneurship and technical readiness continues
to stand out. Taking account of the fundamental power change taking
place in the global economy (Alexandroff and Cooper 2010; Chin 2010),
the G20 serves as the hallmark signal that the multilateral system can not
only adapt but serve as a catalytic agent for other forms of institutional
reform, notably in the transition from the Financial Stability Forum to
the Financial Stability Board and the redistribution of voting rights and
seats in the IMF.
However, notwithstanding its framing as an innovative diplomatic
project, it is still a stretch to argue that the G20 broadened out composi-
tion and expansive agenda can be equated with the democratization of
global governance (Asian Institute for Policy Studies 2010). With the
G20’s institutional embeddedness has come an intensity of sentiment that
the organizational format necessary for a pivotal crisis committee is not
the construct appropriate for its elevation to a global steering committee.
Some of the ingredients essential for this modification center on effi-
ciency goals, with the aim of making the G20 work more smoothly. With
respect to the G20 preparation process, the main focus has been on the
pros and cons with respect to the establishment of a secretariat in order to
“provide institutional memory, continuity for monitoring and follow- up
of commitments, as well as to support outreach and consultation” (Carin
2010). Champions of the “leaders are different” school resist any big
move to over- bureaucratize the forum. Yet both the Republic of Korea
and France have expressed support for institutionalizing the G20 forum
through the creation of a Secretariat.
The positive image of the G20, nonetheless, lies not only in getting things
44 New global economic architecture
done but in legitimacy. If the loss of the lifeboat ethos makes it more dif-
ficult to maintain institutional coherence on an issue- specific basis it makes
it more contingent to address the G20’s governance deficiencies. Looking
inwards, the priority is on introducing order to the G20 hosting functions.
As a crisis committee, the G20 as a leaders’ summit broke with the sequenc-
ing established by the G20 finance. Rather than choosing hosts according
to a group or bucket system, these duties were distributed on an ad hoc
basis, with the US up to the Pittsburgh G20 doing most of the orchestra-
tion. Confirmed by the selection of Mexico to host in 2012, however, the
G20 appears to be moving back to the legacy model of the G20 finance.
Looking outwards, the focus concerns the closing of the regional rep-
resentation gap largely on behalf of small countries. Some significant
progress has already been made, albeit in an ad hoc fashion. In terms of
substance, the main attraction offered for non- members via the evolving
G20 agenda has been on the Republic of Korea’s proposals on the Global
Financial Safety Net and Development Issues. According to Dr Junkyu
Lee, senior advisor to the Korean Ministry of Strategy and Finance, in
talks with the Vietnamese Ministry of Finance officials (as host of the G20
and the Presidency of ASEAN 2010 respectively), in the near term, the G20
could set up a regional- scale cooperation regime or mutual agreement on
financial safety assistance (Vietnam Business News 2010) that would help
insulate developing countries from the ill- effects of global economic crises.
As witnessed by this type of interaction, ASEAN has proved receptive to
greater inclusion in the G20 process. Outreach efforts to regional organi-
zations such as ASEAN in turn offer the G20 an opportunity to enhance
inclusion and address legitimacy concerns (Bhattacharya 2010). ASEAN
participation at the June 2010 summit in Toronto (Xinhua 2010) followed
this model, via the participation of the ASEAN Chair and Secretary-
General. This approach bolstered both the G20’s input and output legiti-
macy function along with its capacity of the forum to act as a network hub.
The big remaining question rests on whether these types of fluid adjust-
ment reach the boundary of what is viable, or whether they provide a
staging ground for further reforms. At the Seoul summit the G20 settled
on a formula for non- member participation, enabling the summit host to
invite up to five guests. On the face of it this went a long way to settling
the regional representation, as it was reported at the time that the Sherpas
“set a tradition that the invitations should be made on a consensus of G20
members, not in the host country’s own desire” (Cho 2010). On closer
look, though, this formula does not end the debate.
The most ambitious means of meshing efficiency with legitimacy is to
temper the original model for a G20. Rather than allowing further EU
representation, as has happened through the presence of Spain and to
The Group of Twenty 45
some extent the Netherlands, a process of rollback and contraction should
be implemented. This single big move will help build legitimacy for the
G20 outside the EU. But just as importantly, it will encourage more inno-
vative forms of coordination inside the EU, the instrumental rationale for
which has been revitalized by the difficulties with addressing the euro area
crisis. As highlighted by a Brookings Institution publication, therefore,
the ongoing governance stalemate in Europe is creating gridlock for wider
global governance reform (Bhattacharya et al. 2010).
To be sure, the political and diplomatic pressures to add, not sub-
tract, will continue to be intense. A case in point is the treatment of the
Netherlands at the Toronto G20. Having initially signaled that the Dutch
would not be invited, Canada relented (not just out of a sense of like-
mindedness, but as a result of good personal chemistry at the leadership
level) and allowed the Netherlands in with a cluster of other countries
(Ethiopia, Malawi and Viet Nam) implicitly under the banner of regional
representatives. Whatever political or diplomatic advantage gained by this
supplementary move, nonetheless, was offset by the problematic logic of
letting in another EU claimant. Instead of lending credence to the notion
that the G20 represented a shift of global governance for a world that was
realigning its power and normative foundations, it reinforced the image of
the G20 as having an arbitrary “club” design (MacCharles 2010).
Yet the logic of balancing EU representation with other forms of
regional representation has been acknowledged by the Republic of Korea
as the host of the November 2010 G20 summit. With the formula negoti-
ated by the G20 Sherpas in place, the door opened to Ethiopia, Malawi,
Viet Nam and Singapore as the representatives of alternative organiza-
tions, but closed to further EU representation beyond the case of Spain (in
its anomalous position as a permanent guest). In justifying the introduc-
tion of the “G20 plus five” approach, the Korean preparatory committee
explicitly stated that this decision had been made because “we finally
agreed that we needed to have a better geographical balance” (Cho 2010).
Moreover, as witnessed by the mode of the engagement of both France
and Mexico with small countries, this culture is becoming ingrained in the
G20. Before the formation of the G20, France pushed the idea of a Group
of 14 (G14) privileging the PRC, India, Brazil, Mexico and South Africa
along with Egypt. For the Cannes G20 in November 2011, by way of con-
trast, France invited another group of countries, all but one of which fits
into the category of small states: Ethiopia as chair of NEPAD, the UAE as
chair of the Gulf Cooperation Council, and Equatorial Guinea as chair of
the AU, along with Spain and Singapore, representing the 3 Group (3G).
Mexico invited Chile, a key member of the 3G, and Colombia along with
Spain with the explicit representation of the 3G still open.
46 New global economic architecture
3.6 MOVING THE ENGAGEMENT OF SMALL STATES BEYOND REGIONAL REPRESENTATION
The role of the 3G and the specific role of Singapore merit special atten-
tion in an analysis of the push to facilitate greater legitimacy of the G20
by integrating it more closely with small and medium states as well as
the UN. This initiative featured a specific form of entrepreneurial and
technical leadership and a diverse coalition of 28 small and medium-
sized economies around the world: six from Southeast Asia and Asia-
Pacific (Singapore, Malaysia, Brunei Darussalam, the Philippines, New
Zealand and Viet Nam); three from the Middle East (Bahrain, Qatar
and the United Arab Emirates); three from Africa (Rwanda, Senegal and
Botswana); eight from Europe (Sweden, Belgium, Ireland, Luxembourg,
Switzerland, Liechtenstein, Monaco and San Marino); two from Latin
America (Uruguay and Chile); and six from Central America and the
Caribbean (Costa Rica, Guatemala, Panama, Jamaica, Barbados and
Bahamas). Instead of a rejectionist stance, the 3G was oriented towards a
bridging and integrationist effort in world politics.
As with other small countries there was a strong element of instrumen-
tal self- help attached to this effort, especially on the issue of Offshore
Financial Centers (OFCs). The US become far less tolerant of OFCs in the
wake of the UBS scandal, in which Swiss banking officials stood accused of
facilitating tax evasion by US citizens. During the presidential campaign,
President Obama often cited frustration on “tax havens”, often refer-
ring to a single office building in the Cayman Islands that houses 12 000
US- based corporations. The UK – facing a marked decline in the role of
London as a financial hub – is trying to repatriate some of the big pools
of money, not only from tax evaders but from tax avoiders (with Labour
Prime Minister Gordon Brown pledging to have Britons pay the “right
amount of tax”). Germany mounted a concerted drive against the culture
of secrecy found in Liechtenstein, especially when so many rich Germans
have taken advantage of that secrecy. And French President Sarkozy has
stated a successful outcome relating to the regulation of “tax havens”, one
of his “red lines” in which the G20 summit must deliver results.
The issue of OFCs as viewed through the lens of efficiency has become
one of the unanticipated markers of the success of the G20. At the first
Washington DC summit in November 2008, Sarkozy lamented the lack of
success in this agenda area. Yet, as pushed by the Paris- based OECD, the
G20 has moved to send a strong signal to those OFCs that have refused to
sign tax information exchange deals.
If a sign of efficient action, however, the issue of OFCs raises the ques-
The Group of Twenty 47
tion of input legitimacy to a very different level. Can the G20 not only
speak for the rest of the world but impose its will on countries that do not
belong to the group? This issue of fairness of representation came to the
fore in some of the declaratory statements by the organizers of the 3G.
As Singapore’s Foreign Minister George Yeo put it very bluntly in one
interview:
At the London meeting [of G20], financial centers became a major issue and countries like Singapore and Switzerland unexpectedly found themselves in the grey list and came under some pressure to alter the way we operate. This was without prior consultation with us, we were not involved in the discussions but we had to react to the decision taken by the G20 and we have reacted. That doesn’t seem to me to be the right way to get things done. Hong Kong [,China] which had a situation very similar to Singapore, had [the PRC] to look after its interests so it is not on the grey list but Singapore was, and other countries too. So I think it is important that on issues that concern others, those who have major interest, should also be brought into the discussion. That is a matter of process; it would improve legitimacy and the sense of fairness. (Chowdhury 2010)
Still, if a catalyst for action, the 3G could not have extended its scope of
membership if it was only directed to a single issue. What the 3G did was
to tap into the same sense of exclusion driving the regional critics but to re-
configure this resentment into a larger campaign directed at engagement
with the G20 under the banner of variable geometry. Using this device, the
3G could make the argument that small countries should have access to
the G20 on a functional basis – very much the same argument that middle
powers have made throughout the post- 1945 era.
A full analysis of the 3G – especially in terms of impact as opposed to
process – lies beyond the ambit of this chapter. However, some key points
can be made. First, the 3G allowed a solid platform for those countries
that sought inclusion, not resistance to the G20. Second, the 3G offers a
means by which the UN can be brought back into the debate about finan-
cial decision- making. Indeed much of the mobilization work for the G20
was conducted at UN HQ in New York by Ambassador Vanu Gopala
Menon of Singapore.
3.7 EXPANDING THE G20 AGENDA IN ORDER TO MAXIMIZE LEGITIMACY
The most ambitious means of meshing efficiency with legitimacy is to
temper the original model for a G20 with some element of the model to
“regionalize” the forum. This search is not entirely novel. Just as former
48 New global economic architecture
Prime Minister Paul Martin of Canada advocated a shift from the G8 to
the G20 as the pivotal forum for dealing with global problems, former
Belgian Prime Minister Guy Verhofstadt has been a champion to “region-
alize” the G8: the core of his idea being that this traditional “club of the
rich” could be converted into a “network of the big regional continental
organizations”. In that framework Prime Minister Verhofstadt concep-
tualized a forum made up of regional groupings such as the European
Union, MERCOSUR, ASEAN, NAFTA and the African Union – all
with equal weighting (Van Langenhove 2004).
If more ambition is needed to translate this idea from the G8 to the G20,
such thinking goes to the core of the G20’s problematique. On the one
hand, this approach acknowledges the G20’s highly innovative attributes.
Far more than an un- reformed UN, or an un- representative G8, the G20
offers a viable organizational update – dealing with the paradoxical situa-
tion where “the policy authority for tackling global problems still belongs
to the states, while the sources of the problems and potential solutions
are situated at transnational, regional or global level” (Thakur and Van
Langenhove 2006) – in order to be in tune with twenty- first century reali-
ties. On the other hand, it offers one further way of dealing with the G20’s
legitimacy gaps, with a greater balance between member and non- member
countries and the regions they come from.
In instrumental terms a network (as opposed to simply a “club”)
approach jumps out even on the agenda item that has done most to put
a brake on the G20’s activities, the euro area crisis. Although the core
responsibility for dealing with the euro area crisis will remain with the
European economies themselves, the G20 still has an important role in
terms of the use of peer pressure. Such techniques in some ways at least
can be connected with the culture of peer pressure embedded in other
regional forums, above all ASEAN, but only if there is built- in regional
representation.
Secondly, the move by the Republic of Korea to embrace a form of
host/regional institutional mode of outreach (or to break with G8 ter-
minology, consultation) should be refined and institutionalized. Such a
process of consultation could be enhanced by implementing this form
of activity through more varied means; for example, in addition to the
initiatives taken by the host country, moves along these lines could be
taken via a G20 Secretariat (if one is established as proposed by President
Sarkozy and the Republic of Korea) or more loosely via a team of Sherpas
(in either a troika format or a more ad hoc fashion). In accordance with
the principle of variable geometry, the focus would be on select groups of
the excluded with a functional orientation being engaged with particular
agenda items of the G20.
The Group of Twenty 49
In terms of the policy agenda the concern of Singapore, in an enhanced
position given its leadership role in the 3G and its selection to chair the
IMF Monetary and Financial Committee in March 2011, will continue
to focus on the G20’s main game in terms of financial regulation both
directly and indirectly via the Financial Stability Board and the Basel
committee on banking supervision. Yet if it can consolidate its place
in the G20 via the 3G, there are a variety of other issues that it could
contribute to as well: the integrated version of Global Green Growth
giving primacy to economic policy measures leading to investment- led
and innovation- driven growth, as well as the new agenda item of Livable
Cities.
In terms of process, the work of ASEAN could be supplemented by
borrowing the approach initiated by South Africa in the African context,
a further form of indirect representation in the G20 via a regional com-
mittee of finance ministers and governors of central banks under the
auspices of the Asian Development Bank and/or other bodies. This initia-
tive has worked well. The scope of the membership for this committee is
impressive, including as it does some countries that sought membership
(Egypt and Nigeria) in a reformed G8 themselves (C10 2010; All Business
2010).
Although states will retain their primacy within the G20 context, it will
also be advantageous if participation could be stretched on a functional
basis. A regional dimension could be built into the G20 Business forum,
the structure that has become a major embedded constituency for the
G20 (Kim 2010a) as has taken place in the International Chamber of
Commerce’s G20 Advisory Group.
With some supplementary innovative reforms along these lines, it may
be suggested, therefore, that the regional dynamics surrounding the G20
could move from a weakness to a source of strength. As emphasized
throughout this chapter the “rejectionists” of the G20 have not been many
in number, with most regional bodies wanting to find ways to work within
the summit process. Moreover, formalistic recipes of dealing with the
regional dimension (such as regional elections) have not gained traction
beyond the realm of conceptual thinking (Wade and Vestergaard 2010).
The feature that inculcates the G20 with so many of its institutional flaws,
its ad hoc improvised nature, also provides the trait that allows the forum
to move beyond these deficiencies. The G20 can make ample assertions
about its position as a model of global governance. To fully justify these
claims, however, the forum must be more than a flexible and purposeful
diplomatic space for multilateral innovation. It must attend to its most
glaring source of contestation, the G20’s lack of inclusiveness undermin-
ing its legitimacy.
50 New global economic architecture
3.8 CONCLUSIONS: IMPERATIVES AND CONSTRAINTS WITH RESPECT TO FUTURE G20 REFORM
The institutionalization of the G20 at the leaders’ level, in a similar fashion
to the original G20 finance, was “shock activated” (Kirton 2013) in that
the forum was erected to carry out a governance response to a serious
crisis. This intense, unanticipated nature of the shocks placed the onus on
delivery rather than legitimacy for the forum. It was only after the imme-
diacy of the crisis activation eased that legitimacy concerns rose to the top
of the policy/diplomatic debate.
As the G20 gains a greater role in the governance architecture, primarily
through an expanding “steering group” agenda, the legitimacy concerns of
the forum necessarily become more pressing. Accommodating the design
issues of legitimacy is a longer- term project that differs from the instanta-
neous, ad hoc experience of the G20 in terms of the governance agenda.
That is to say, legitimacy is a theme that will be accorded greater attention
when the forum moves further into the post- crisis period. If legitimacy is
deemed to be the advancement of governance by those directly impacted
by policy decisions and deliberations, then the G20 in the wake of the
current crisis was lacking legitimacy in that the governance decisions were
made by and for the very countries that were at the core of the global
financial crisis. In contrast to other potential formulas (G7/G8, G8 plus
into a G12/13/14) the decision to enact the G20 as the forum for crisis
response may even be said to have overcompensated on the legitimacy
side.
In answering the important questions about both objective and expec-
tations of G20 reform, it is necessary to ask how we should evaluate the
G20 on the whole. As the discussion above articulates, the legitimacy of
the G20 must be considered with respect to the G20’s stages of develop-
ment. A clear demarcation must be made between the G20’s role as a crisis
committee and as a potential global steering committee, as part of a wider
transitional phase toward longer- term governance (Angeloni and Pisani-
Ferry 2012). As a crisis committee the G20 remains dominated by the big
global players, whether in the G7/G8 or BRICS. The summit’s role as a
steering committee, however, raises very different possibilities about the
objective of the reform. Should we hope to see ambitious institutional-
ized advances in the future, as suggested by the Stiglitz Report, to replace
the G20 by a Global Economic Cooperation Council (Stiglitz 2010)? Or,
should we just take the current situation for granted, since it is only a self-
selected forum and will continue to be a self- selected forum.
In terms of its “input” and “output” legitimacy, there is a dilemma
The Group of Twenty 51
with G20. If it becomes more representative in the future, that is, covering
more states, it might be less productive and effective. Determining whether
the G20 should sacrifice some legitimacy for greater efficiency, or vice
versa, will largely depend on the vision of the forum with respect to the
overall constellation of global governance. It can be persuasively argued
that regionalization of G20 is a good idea and could be a solution to the
dilemma. But the precondition is that each regional body is highly efficient
in unifying their policy stances and then making productive proposals.
With the deepening impact of the euro area crisis, it is increasingly difficult
to see that this is not an easy task even in the EU, so it will inevitably take
a long time to realize this goal.
At the macro- structural level of world politics, the G20, as the newest
institutional innovation in multilateralism, is a reflection of wider trends
taking place within the international system. If, as some observers indicate
(Woods 2010; Chin 2010), regionalism and decentralization in the interna-
tional system are indicative of the trajectory of the international system,
then mirroring this trend within the governance structure of the G20 is
reasonable.
The main challenge is to preserve the fluidity of the G20, which is
underwritten by its informal design. This fluidity, despite some policy
disagreements, is among the forum’s most significant features for weaving
its approaches to core economic governance challenges; whether, for
example, on the issues of financial regulation, global imbalances, the
possibility of a financial transaction tax, trade and development finance.
Informality has worked to facilitate mixed coalitions of established and
emerging states within the G20 via ad hoc groupings. It is thus impera-
tive that this institutional design issue not be treated in a fixed manner. If
and when the G20 moves beyond its crisis committee orientation, a stage
projected most seriously by the euro area dilemmas, and the protracted
spillover effect in other regions of the world, a revisiting of the G20’s role
in global governance will be a vital necessity.
REFERENCES
Alexandroff, A.S. and A.F. Cooper, eds. 2010. Rising States, Rising Institutions: Challenges for Global Governance. Washington, DC: Brookings Institution.
All Business. 2010. African Development Bank Group: C- 10 to Discuss Development Agenda for G20 Summit in Seoul. 4 October.
Angeloni, I. and J. Pisani- Ferry. 2012. The G20: Characters in search of an author. Bruegel Working Paper 2012/04.
ASEAN Secretariat. 2010. Views of ASEAN Sought for G20 Agenda. Press Release. Jakarta. 10 February.
52 New global economic architecture
Asian Institute for Policy Studies. 2010. The G20 and Global Governance Reform. Seoul: Yonsei University.
Åslund, A. 2009. The G20 must be stopped. The Financial Times. 26 November.Bailin, A. 2005. From Traditional to Group Hegemony: The G7, the Liberal
Economic Order and the Core- periphery Gap. London: Ashgate.Barma, N., E. Ratner and S. Weber. 2007. A world without the West. The National
Interest, 90(July–August): 23–30.Beeson, M. and S. Bell. 2009. The G- 20 and international economic governance:
Hegemony, collectivism, or both? Following the East Asian crisis of 1997–1998. Global Governance 15(1): 67–86.
Bhattacharya, A. 2010. Enhancing the G20’s inclusion and outreach. East- West Dialogue: Shaping the G20 Agenda in Asia – The 2010 Seoul Summit. 5 April.
Bhattacharya, A., C. Bradford and J. Linn. 2010. Europe’s governance causes gridlock for global governance reform. Brookings Institution. 23 April, avail-able at: http://www.brookings.edu/opinions/2010/0424_ governance_linn.aspx.
C10. 2010. Communiqué of the meeting of the committee of African ministers of finance and planning and Governors of Central Banks. Cape Town: Committee of Ten. 21 February.
Carin, B. 2010. A G20 ‘Non- Secretariat’. In: C. Bradford and W. Lim (eds) The New Dynamics of Summitry: Institutional Innovations for G20 Summits, Issue and Essays, Seoul: Korea Development Institute: pp. 383–91.
Chin, G. 2010. The emerging countries and China in the G20: Reshaping global economic governance. Studia Diplomatica. LXIII(2–3): 105–24.
Cho, J.- S. 2010. 5 non- G20 nations invited to Seoul summit. Korea Times. 24 October.
Chowdhury, I.A. 2010. The Global Governance Group (‘3G’) and Singaporean leadership: Can small be significant? Singapore: ISAS Working Paper No. 108. 19 May.
Cooper, A.F. 2008. Stretching the model of ‘coalitions of the willing’. In: A.F. Cooper, B. Hocking and W. Maley (eds) Global Governance and Diplomacy: Worlds Apart? Basingstoke, UK: Palgrave.
Cooper, A.F. 2010. The G20 as an improvised crisis committee and/or a contested ‘steering committee’ for the world. International Affairs. 86(3): 741–57.
Cooper, A.F. and P. Subacchi. 2010. Overview: Global economic governance in transition. International Affairs. 86(3): 607–17.
Cox, R. 1979. Ideologies and the NIEO. International Organization. 33(2): 280–302.
The Economist. 2010. Running the world economy: Finally, a talking- shop worth having. 4 November.
Ferguson, N. 2007. Not two countries, but one: Chimerica. The Telegraph. 4 March.
Financial Times. 2010. G20 show how not to run the world. 12 November.Foss, W. and A.B. Austin. 1933. The World Economic Conference, London 1933.
London: Soncino Press.Garton Ash, T. 2008. One practical way to improve the state of the world: Turn G8
into G14. The Guardian. 24 January.Goldstein, A. 2003. An emerging China’s emerging grand strategy. In: G. John
Ikenberry and M. Mastanduno (eds) International Relations Theory and the Asia- Pacific, New York: Columbia University Press.
Government of Norway. 2009. Norwegian call for Nordic membership in the
The Group of Twenty 53
G20. Press Release. Oslo: Ministry of Foreign Affairs, available at: http://www.regjeringen.no/en/dep/ud/selected- topics/Trade- policy/membership_G20.html?id=587984&epslanguage=en- GB>.
Held, D. 2010. Cosmopolitanism: Ideals, Realities and Deficiencies. Cambridge, UK: Polity Press.
International Monetary Fund. 2011. World Economic Outlook Database, September 2011.
Iqbal, A. 2010. US panel calls for Pakistan membership of G- 20. Dawn. 28 November.
Kennedy, P. 1987. The Rise and Fall of the Great Powers: Economic Change and Military Conflict from 1500 to 2000. New York: Random House.
Kim, J.- H. 2010a. Seoul Business Summit starts to take shape. Korea Herald, 22 August.
Kim, J.- H. 2010b. UN, G20 to work in mutually reinforcing ways. Korea Herald, 15 November.
Kirton, J. 2013. G- 20 Governance for a Globalized World. Aldershot, UK: Ashgate.
Koenig- Archibugi, M. 2010. Understanding the global dimensions of policy. Global Policy. 1(1): 16–28.
Lee, D.- H. 2010. From Toronto to Seoul: Evolution of the G- 20 process. Studia Diplomatica. LXIII(2–3): 35–52.
Lee, M.- B. and K. Rudd. 2009. The G20 can lead the way to balanced growth, Financial Times. 2 September.
MacCharles, T. 2010. The expanding G8 adds up to a G20 in Huntsville, while Toronto’s G20 will be a G33 or 34. Toronto Star. 14 June.
Mantega, G. 2008. Transcript of press briefing, available at: www.imf.org/exter nal/np/tr/2008/tr081011.htm.
Martin, P. 2004. Address by Prime Minister Paul Martin on the occasion of his visit to Washington, DC. 29 April.
Mo, J. and E. Seo. 2010. The Korean G20 Presidency and evolving global govern-ance. HGCY Working Paper Series. Seoul. October.
The Nation. 2010. Pakistan voices opposition to UN yielding economic decisions to G- 20. 19 June.
Nelson, R.M. 2010. The G- 20 and international economic cooperation: Background and implications for Congress. Washington: Congressional Research Service. 10 August.
Oakley, D. 2009. Decoupling gains new group of cheerleaders. Financial Times. June 2011.
Paulson, H. 2010. On the brink: Inside the Race to Stop the Collapse of the Global Financial System. New York: Business Plus.
Rachman, G. 2010. America is losing the free world. Financial Times, 4 January.Rana, P.R. 2010. Reform of the international financial architecture: How can Asia
have a greater impact in the G20? Singapore: RISI Working Paper No. 201. 9 June.
Rana, P.R. 2011. Make G20- plus transparent. China Daily. 1 November.Reuters. 2009. African FinMins call for G20 voice, more support. 5 October.Ruggie, J. 1983. Political structure and change in the international economic
order: The North–South dimension. In: The Antinomies of Interdependence. New York: Columbia University Press, pp. 423–87.
Der Spiegel. 2010. Norway takes aim at G20. 22 June.
54 New global economic architecture
Stiglitz, J.E. 2010. The Stiglitz Report. 2010. New York: The New Press.Thakur, R. and L. Van Langenhove. 2006. Enhancing global governance through
regional integration. Global Governance. 12(3): 233–40.US–China Business Council. 2011. US–China trade statistics and China’s world
trade statistics, available at: https://www.uschina.org/statistics/tradetable.html.Van Langenhove, L. 2004. Regional integration and global governance. UNU-
CRIS Occasional Papers.Vietnam Business News. 2010. ASEAN’s position towards the G20 Seoul summit.
5 September.Wade, R. 1998. From miracle to cronyism. Cambridge Journal of Economics. 22(6):
693–706.Wade, R. and J. Vestergaard. 2010. Overhaul the G20 for the sake of the G172.
Financial Times. 21 October.Woods, N. 2010. Global governance after the financial crisis: A new multilateral-
ism or the last gasp of the great powers? Global Policy. 1(1): 51–63.Xinhua. 2010. ASEAN to attend G20 Summit in Toronto. china.org.cn. 22 June,
available at: http://www.the PRC.org.cn/world/2010–06/22/content_20322748.htm.
Yekaterinburg Joint Communiqué. 2009. Meeting of the Foreign Ministers of the People’s Republic of China, the Russian Federation, the Republic of India and the Federative Republic of Brazil. 16 May.
Yu, Y. 2005. China’s evolving global view. In: J. English, R. Thakur and A.F. Cooper (eds) Reforming from the Top: A Leaders’ 20 Summit, Tokyo: UNUP.
Zawya, M.A.- H. 2009. AMF Chairman: SA not over represented in G20. Dow Jones. 4 October.
55
4. Enhancing the effectiveness of CMIM and AMRO: challenges and tasks
Reza Siregar and Akkharaphol
Chabchitrchaidol
4.1 INTRODUCTION
Recent crises, particularly the sovereign debt crisis in the euro area econo-
mies, have provided momentum to greater regional financial coopera-
tion in the region. This is particularly evident among the Association of
Southeast Asian Nations (ASEAN)+3 economies.1 Through the establish-
ment of the Chiang Mai Initiative Multilateralization (CMIM) and the
ASEAN+3 Macroeconomic Research Office (AMRO) in March 2010 and
May 2011, respectively, substantial headway has been made in this regard.
Despite the advance of regional cooperation among the ASEAN+3
economies, a series of fundamental questions have been raised, above all
about the size of the CMIM facility. Although the CMIM was doubled
in size to US$240 billion with effect from May 2012, the amount has fre-
quently been criticized as insufficient. The European Financial Stability
Facility (EFSF) of 750 billion euros in 2011, for instance, amounted to
about 8 per cent of the total gross domestic product (GDP) of the euro
area, while the CMIM amounted to only about 1.5 per cent of the total
GDP of the ASEAN+3 economies. The question, therefore, is whether the
CMIM can be an effective and relevant part of regional financial coopera-
tion given its limited financial resources.
Another fundamental issue is the role of the CMIM and its relation to
other available facilities, including bilateral swap lines, as well as global
facilities – most notably those provided by the International Monetary
Fund (IMF). During the 2008 global financial crisis and the 2011 euro
area sovereign debt crisis, some ASEAN+3 member economies had access
to bilateral swap facilities from both the major ASEAN+3 economies (the
People’s Republic of China [PRC] and Japan) and their traditional global
trading partner (the United States [US]). Given the availability of other
56 New global economic architecture
sources of liquidity support, should access to and disbursement of the
CMIM’s facilities be more precisely defined, and should it play a more sys-
tematic role in the region’s financial architecture? In addition, the issue of
accessibility frequently centers upon the types of conditionality attached
to the facility. In order to add value to existing global and regional finan-
cial arrangements, many have argued that the CMIM facility must at least
be complementary to those arrangements and provide greater flexibility
and accessibility for ASEAN+3 member economies. Yet the conditionali-
ties which could be related to potential CMIM lending remained vague,
even in mid- 2012.
The role of AMRO as a surveillance office for the CMIM is vital to
the overall success of regional financial cooperation: without a credible
and qualified surveillance capacity, it is difficult to envision an effec-
tive CMIM. Yet numerous obstacles face the surveillance work of even
well- established global multilateral institutions, such as the International
Monetary Fund (IMF), which AMRO will need to overcome going
forward. Strengthening AMRO’s capacity to fulfill its primary responsi-
bility has been passionately debated by CMIM members at the meetings
of the deputies of ASEAN+3 Finance Ministries and Central Banks.
Typical discussions centered on key concerns, including how AMRO’s
regional surveillance work would provide value- added to the surveillance
work carried out by the IMF, the Asian Development Bank (ADB), and
those prepared by the member economies themselves. Other concerns were
about how AMRO surveillance could be distinguished from that of exist-
ing global and regional surveillance, as well as the minimum infrastructure
and set- up requirements that AMRO would need to be in a position to
become a credible surveillance unit for the CMIM.
This chapter makes no attempt to present a comprehensive discus-
sion on the CMIM and AMRO. A number of studies have dwelled upon
the rationale and motivation behind the introduction of the CMIM and
regional financial cooperation (Sussangkarn 2011; Jomo 2011). Others
have also deliberated on various possible frameworks that CMIM and
AMRO could adopt based on the experience of other regional and global
arrangements (Takagi 2010). The primary task of this chapter is to return
to and provide constructive responses to the set of issues and challenges
discussed above. In particular, we focus our discussion on two issues con-
cerning the CMIM: its role in the context of global and regional financial
cooperation, and the design of the facility’s conditionality. Moreover,
we will also consider several aspects relating to the surveillance activities
of AMRO. In short, the primary aim of this chapter is to suggest pos-
sible areas in which the effectiveness of the CMIM and AMRO may be
increased, despite numerous constraints and limitations.
Enhancing the effectiveness of CMIM and AMRO 57
The outline of the chapter is as follows. The next section presents a brief
history and highlights some of the recent developments and commitments
of the CMIM and AMRO. In section 4.3, we discuss the set of latent
challenges mentioned above and suggest responses to overcome them. In
section 4.4, we briefly discuss the conditionalities espoused by the IMF.
In section 4.5, we discuss AMRO’s current work and process of economic
surveillance and provide suggestions on how to improve AMRO’s surveil-
lance capacity. A brief concluding remarks section ends the chapter.
4.2 RECENT COMMITMENTS
4.2.1 The CMIM
Arguably, the most significant outcome of the ASEAN+3 Finance and
Central Bank Deputies’ Meeting in May 2012 was the enhancement of the
ASEAN+3 Finance Ministers’ Meeting (AFMM+3) to the ASEAN+3
Finance Ministers and Central Bank Governors’ Meeting (AFMGM+3),
whereby the central bank governors of the 13 member countries (plus Hong
Kong, China) would henceforth be invited to participate in this annual
senior- level meeting of the ASEAN+3 economies. In past AFMM+3
meetings, central banks were represented at the deputy governor level,
so held a lower- level position in the overall decision- making process.
The inclusion of central bank governors marked the beginning of a more
comprehensive and integrated approach to the management of regional
financial cooperation, whereby both fiscal and monetary policy officials
jointly oversee and decide on CMIM matters. Participation of central
bank governors in the annual ASEAN+3 Finance Ministers and Central
Bank Governors’ Meeting would also allow a more meaningful and in-
depth discussion on the challenges and vulnerabilities of each economy,
and further potential avenues for cooperation. As frequently stressed in
past works, such as Takagi (2010), surveillance activities must reach audi-
ences at the highest levels of policymaking to be relevant and effective.
During the Annual AFMGM+3 Meeting in May 2012, several other
major new commitments were announced (Table 4.1). Responding to the
potential need for a larger swap facility, the CMIM Executive Committee
announced the doubling of the swap facility to US$240 billion in May
2012. Given the adjusted contributions, while keeping the “purchasing
multiples” unchanged, major ASEAN economies (Indonesia, Malaysia,
Philippines, Thailand and Singapore) now have access to approximately
US$22.76 billion each, an increase from US$4.55 billion previously
(Table 4.2). At the same meeting, an increase in the IMF de- linked
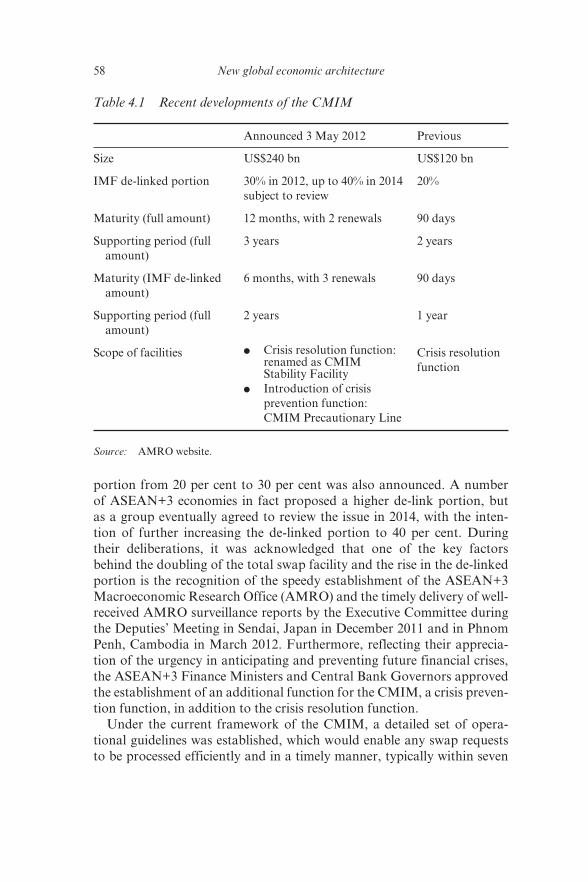
58 New global economic architecture
portion from 20 per cent to 30 per cent was also announced. A number
of ASEAN+3 economies in fact proposed a higher de- link portion, but
as a group eventually agreed to review the issue in 2014, with the inten-
tion of further increasing the de- linked portion to 40 per cent. During
their deliberations, it was acknowledged that one of the key factors
behind the doubling of the total swap facility and the rise in the de- linked
portion is the recognition of the speedy establishment of the ASEAN+3
Macroeconomic Research Office (AMRO) and the timely delivery of well-
received AMRO surveillance reports by the Executive Committee during
the Deputies’ Meeting in Sendai, Japan in December 2011 and in Phnom
Penh, Cambodia in March 2012. Furthermore, reflecting their apprecia-
tion of the urgency in anticipating and preventing future financial crises,
the ASEAN+3 Finance Ministers and Central Bank Governors approved
the establishment of an additional function for the CMIM, a crisis preven-
tion function, in addition to the crisis resolution function.
Under the current framework of the CMIM, a detailed set of opera-
tional guidelines was established, which would enable any swap requests
to be processed efficiently and in a timely manner, typically within seven
Table 4.1 Recent developments of the CMIM
Announced 3 May 2012 Previous
Size US$240 bn US$120 bn
IMF de- linked portion 30% in 2012, up to 40% in 2014
subject to review
20%
Maturity (full amount) 12 months, with 2 renewals 90 days
Supporting period (full
amount)
3 years 2 years
Maturity (IMF de- linked
amount)
6 months, with 3 renewals 90 days
Supporting period (full
amount)
2 years 1 year
Scope of facilities ● Crisis resolution function: renamed as CMIM Stability Facility
● Introduction of crisis
prevention function:
CMIM Precautionary Line
Crisis resolution
function
Source: AMRO website.
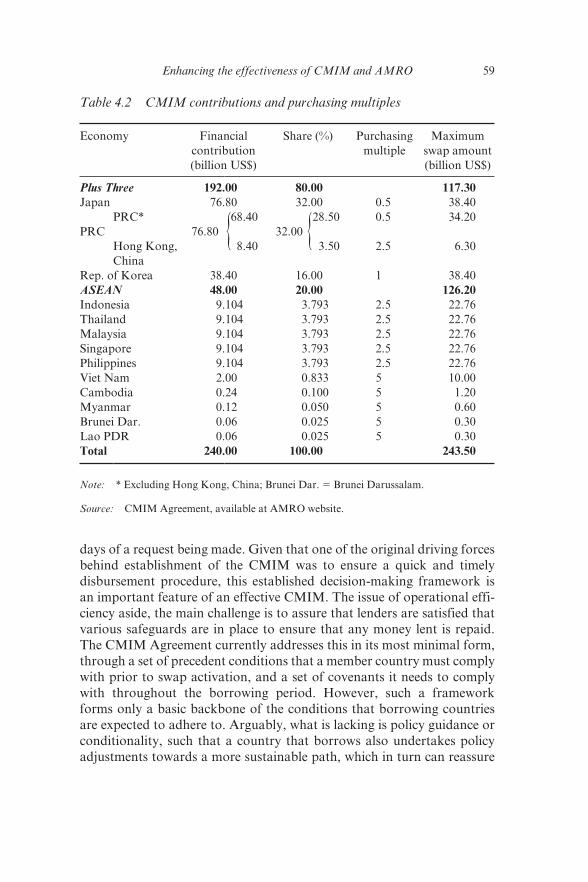
Enhancing the effectiveness of CMIM and AMRO 59
days of a request being made. Given that one of the original driving forces
behind establishment of the CMIM was to ensure a quick and timely
disbursement procedure, this established decision- making framework is
an important feature of an effective CMIM. The issue of operational effi-
ciency aside, the main challenge is to assure that lenders are satisfied that
various safeguards are in place to ensure that any money lent is repaid.
The CMIM Agreement currently addresses this in its most minimal form,
through a set of precedent conditions that a member country must comply
with prior to swap activation, and a set of covenants it needs to comply
with throughout the borrowing period. However, such a framework
forms only a basic backbone of the conditions that borrowing countries
are expected to adhere to. Arguably, what is lacking is policy guidance or
conditionality, such that a country that borrows also undertakes policy
adjustments towards a more sustainable path, which in turn can reassure
Table 4.2 CMIM contributions and purchasing multiples
Economy Financial
contribution
(billion US$)
Share (%) Purchasing
multiple
Maximum
swap amount
(billion US$)
Plus Three 192.00 80.00 117.30
Japan 76.80 32.00 0.5 38.40
PRC* 68.40 28.50 0.5 34.20
PRC 76.80 32.00
Hong Kong,
China
8.40 3.50 2.5 6.30
Rep. of Korea 38.40 16.00 1 38.40
ASEAN 48.00 20.00 126.20
Indonesia 9.104 3.793 2.5 22.76
Thailand 9.104 3.793 2.5 22.76
Malaysia 9.104 3.793 2.5 22.76
Singapore 9.104 3.793 2.5 22.76
Philippines 9.104 3.793 2.5 22.76
Viet Nam 2.00 0.833 5 10.00
Cambodia 0.24 0.100 5 1.20
Myanmar 0.12 0.050 5 0.60
Brunei Dar. 0.06 0.025 5 0.30
Lao PDR 0.06 0.025 5 0.30
Total 240.00 100.00 243.50
Note: * Excluding Hong Kong, China; Brunei Dar. 5 Brunei Darussalam.
Source: CMIM Agreement, available at AMRO website.
{ {
60 New global economic architecture
lenders of a capacity to repay. In this regard, it is important that a credible
framework for conditionality is established early on, preferably during
non- crisis periods. More in- depth discussions on these vital and sensitive
matters will be elaborated in section 4.3 of this chapter.
4.2.2 The ASEAN+3 Macroeconomic Research Office (AMRO)
In late May 2012, AMRO welcomed its new director, Yoichi Nemoto,
a senior official from the Ministry of Finance of Japan, who became the
second director of AMRO, replacing Benhua Wei, a senior official who
had previously worked at the State Administration of Foreign Exchange
of the People’s Republic of China. The transition was a smooth one, as
Mr Nemoto had worked with Mr Wei since AMRO’s establishment as
a counselor. Within less than a year of Mr Wei’s appointment, a team of
about 20 full- time staff had been assembled. In the process, three teams
of economists, each headed by a senior economist, were relocated to
AMRO’s Singapore office from various ASEAN+3 economies. Each team
was assigned and mandated to conduct macroeconomic surveillance on a
set of ASEAN+3 economies.
Depending on their past work experience, each economist and senior
economist was also assigned to one of three area- focused study units,
covering fiscal matters; monetary and exchange rate matters; and finan-
cial markets. Each unit was tasked with the responsibility to evaluate and
assess each particular area across different ASEAN+3 economies. The
fiscal team, for instance, was tasked to study various issues on budget and
fiscal policy of each ASEAN+3 economy, and carry out cross- country
analyses within the ASEAN+3 economies and, if necessary, with other
groups of economies around the world. Ultimately, each group aims to
identify a set of key indicators to assess the strengths and weaknesses
facing each member economy.2
Since December 2011, AMRO has submitted a set of surveillance
reports on a quarterly basis.3 The first set comprises individual economy
(bilateral) surveillance reports on all 14 economies of the ASEAN+3
(including Hong Kong, China). In addition, the ASEAN+3 Regional
Economic Monitoring (AREM) report is produced quarterly to assess and
monitor developments in the global economic environment and its impact
on ASEAN+3 economies (multilateral- surveillance perspective). In each
of these country surveillance and AREM reports, the emphasis is more on
short- term potential risks and vulnerabilities, and less on medium to long-
term structural challenges.
In addition to the core team of economists, a team of administrative
staff managing financial matters, human resources, and other day- to- day
Enhancing the effectiveness of CMIM and AMRO 61
office matters, a legal expert, and a senior official to deal especially with
CMIM and ASEAN+3- related matters are also in place. A six- person
Advisory Panel, with three persons nominated jointly by the ASEAN
countries and three from each Plus- 3 country,4 meets with the AMRO
director and senior economists on a quarterly basis. The role of the panel
includes providing strategic guidance on AMRO’s role and activities,
and technical guidance on AMRO’s economic and financial surveillance,
assessments and analysis.
4.3 SELECTED CHALLENGES AND SCOPE FOR AN EFFECTIVE CMIM FACILITY
Despite the current limitation in size of the available swap facility at
US$240 billion, a number of measures can be adopted to enhance the
effectiveness of the CMIM framework. This section focuses on two key
areas. The first area is the relationship between bilateral and multilateral
swap facility arrangements. A number of possible avenues for cooperation
between a multilateral swap facility such as the CMIM and other available
bilateral swap arrangements could complement each other, and therefore
boost their capacity and effectiveness. The second focus is on the design of
CMIM disbursement, including some aspects of possible conditionalities
attached to the CMIM facility, with particular emphasis on timely dis-
bursement, while at the same time safeguarding against potential moral
hazard.5
4.3.1 Coordination between Bilateral and Multilateral Swap Facility
Arrangements
Over the past few years, numerous bilateral swap arrangements have been
established amongst the ASEAN+3 economies (Table 4.3). The PRC and
Japan, for instance, have extended swap facilities to Indonesia, Malaysia,
Thailand and the Republic of Korea over the years to mitigate potential
liquidity concerns facing recipient economies, and also to safeguard and
promote bilateral trade activities. It is also interesting to note that in some
cases the size of the bilateral swap facilities is well above the maximum
swap facility extended by the CMIM. Malaysia, for instance, secured a
RMB180 billion (or about US$30 billion) bilateral swap arrangement
with the People’s Bank of China in February 2012 for a period of three
years (until February 2015). This swap facility is indeed larger than the
US$22.76 billion maximum swap facility that Malaysia is entitled to from
the CMIM facility.
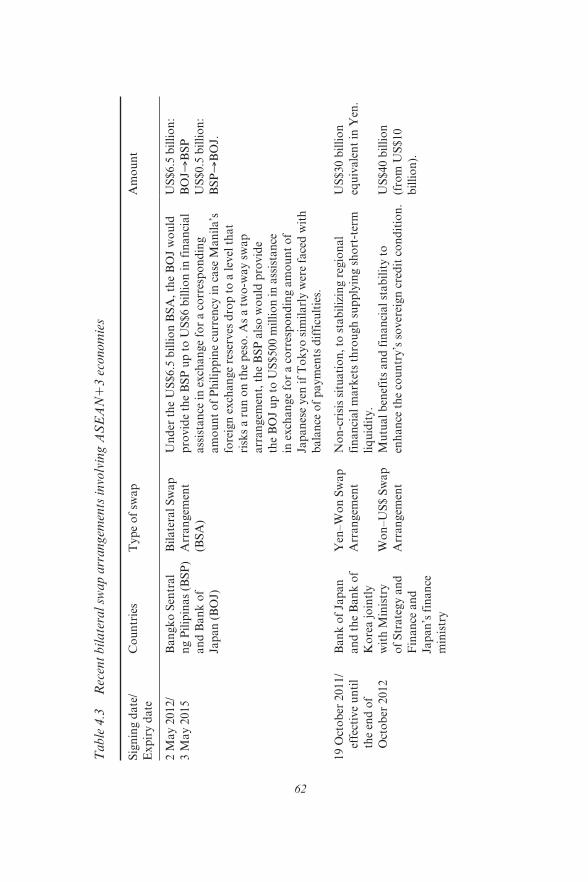
62
Table
4.3
R
ecen
t bil
ate
ral
swap a
rrang
emen
ts i
nvo
lvin
g A
SE
AN1
3 e
conom
ies
Sig
nin
g d
ate
/
Exp
iry d
ate
Co
un
trie
sT
yp
e o
f sw
ap
Am
ou
nt
2 M
ay 2
012/
3 M
ay 2
015
Ban
gk
o S
entr
al
ng P
ilip
inas
(BS
P)
an
d B
an
k o
f
Jap
an
(B
OJ)
Bil
ate
ral
Sw
ap
Arr
an
gem
ent
(BS
A)
Un
der
th
e U
S$6.5
bil
lio
n B
SA
, th
e B
OJ
wo
uld
pro
vid
e th
e B
SP
up
to
US
$6 b
illi
on
in
fin
an
cial
ass
ista
nce
in
exch
an
ge
for
a c
orr
esp
on
din
g
am
ou
nt
of
Ph
ilip
pin
e cu
rren
cy i
n c
ase
Man
ila’s
fore
ign
exch
an
ge
rese
rves
dro
p t
o a
lev
el t
hat
risk
s a r
un
on
th
e p
eso
. A
s a t
wo
- way s
wap
arr
an
gem
ent,
th
e B
SP
als
o w
ou
ld p
rovid
e
the
BO
J u
p t
o U
S$500 m
illi
on
in
ass
ista
nce
in e
xch
an
ge
for
a c
orr
esp
on
din
g a
mo
un
t o
f
Jap
an
ese
yen
if
To
kyo
sim
ilarl
y w
ere
face
d w
ith
bala
nce
of
paym
ents
dif
ficu
ltie
s.
US
$6.5
bil
lio
n:
BO
JB
SP
US
$0.5
bil
lio
n:
BS
PB
OJ.
19 O
cto
ber
2011/
ef
fect
ive
un
til
the
end
of
Oct
ob
er 2
012
Ban
k o
f Ja
pan
an
d t
he
Ban
k o
f
Ko
rea j
oin
tly
wit
h M
inis
try
of
Str
ate
gy a
nd
Fin
an
ce a
nd
Jap
an
’s f
inan
ce
min
istr
y
Yen
–W
on
Sw
ap
Arr
an
gem
ent
No
n- c
risi
s si
tuati
on
, to
sta
bil
izin
g r
egio
nal
fin
an
cial
mark
ets
thro
ugh
su
pp
lyin
g s
ho
rt- t
erm
liq
uid
ity.
US
$30 b
illi
on
equ
ivale
nt
in Y
en.
Wo
n–U
S$ S
wap
Arr
an
gem
ent
Mu
tual
ben
efit
s an
d f
inan
cial
stab
ilit
y t
o
enh
an
ce t
he
cou
ntr
y’s
so
ver
eign
cre
dit
co
nd
itio
n.
US
$40 b
illi
on
(fro
m U
S$10
bil
lio
n).
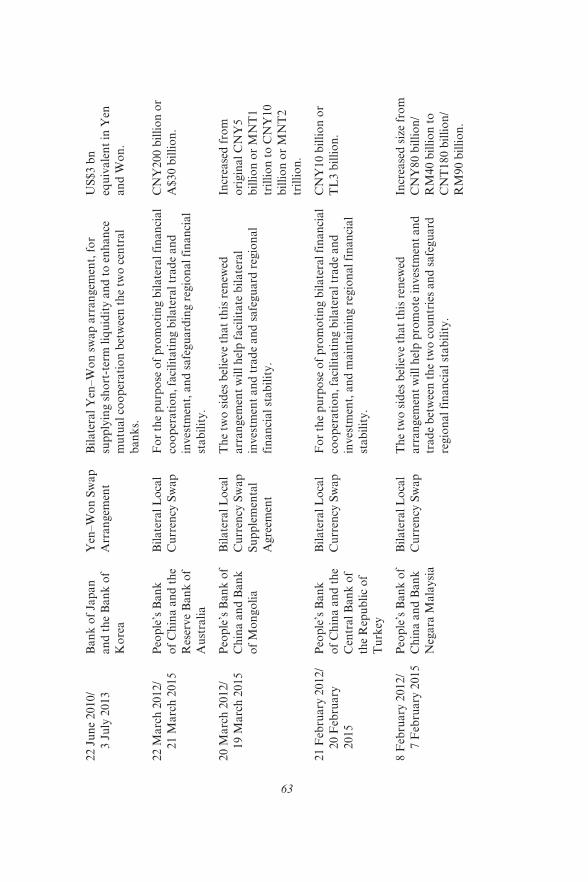
63
22 J
un
e 2010/
3 J
uly
2013
Ban
k o
f Ja
pan
an
d t
he
Ban
k o
f
Ko
rea
Yen
–W
on
Sw
ap
Arr
an
gem
ent
Bil
ate
ral
Yen
–W
on
sw
ap
arr
an
gem
ent,
fo
r
sup
ply
ing s
ho
rt- t
erm
liq
uid
ity a
nd
to
en
han
ce
mu
tual
coo
per
ati
on
bet
wee
n t
he
two
cen
tral
ban
ks.
US
$3 b
n
equ
ivale
nt
in Y
en
an
d W
on
.
22 M
arc
h 2
012/
21 M
arc
h 2
015
Peo
ple
’s B
an
k
of
Ch
ina a
nd
th
e
Res
erve
Ban
k o
f
Au
stra
lia
Bil
ate
ral
Lo
cal
Cu
rren
cy S
wap
Fo
r th
e p
urp
ose
of
pro
mo
tin
g b
ilate
ral
fin
an
cial
coo
per
ati
on
, fa
cili
tati
ng b
ilate
ral
trad
e an
d
inves
tmen
t, a
nd
safe
gu
ard
ing r
egio
nal
fin
an
cial
stab
ilit
y.
CN
Y200 b
illi
on
or
A$30 b
illi
on
.
20 M
arc
h 2
012/
19 M
arc
h 2
015
Peo
ple
’s B
an
k o
f
Ch
ina a
nd
Ban
k
of
Mo
ngo
lia
Bil
ate
ral
Lo
cal
Cu
rren
cy S
wap
Su
pp
lem
enta
l
Agre
emen
t
Th
e tw
o s
ides
bel
ieve
that
this
ren
ewed
arr
an
gem
ent
wil
l h
elp
faci
lita
te b
ilate
ral
inves
tmen
t an
d t
rad
e an
d s
afe
gu
ard
reg
ion
al
fin
an
cial
stab
ilit
y.
Incr
ease
d f
rom
ori
gin
al
CN
Y5
bil
lio
n o
r M
NT
1
tril
lio
n t
o C
NY
10
bil
lio
n o
r M
NT
2
tril
lio
n.
21 F
ebru
ary
2012/
20 F
ebru
ary
2015
Peo
ple
’s B
an
k
of
Ch
ina a
nd
th
e
Cen
tral
Ban
k o
f
the
Rep
ub
lic
of
Tu
rkey
Bil
ate
ral
Lo
cal
Cu
rren
cy S
wap
Fo
r th
e p
urp
ose
of
pro
mo
tin
g b
ilate
ral
fin
an
cial
coo
per
ati
on
, fa
cili
tati
ng b
ilate
ral
trad
e an
d
inves
tmen
t, a
nd
main
tain
ing r
egio
nal
fin
an
cial
stab
ilit
y.
CN
Y10 b
illi
on
or
TL
3 b
illi
on
.
8 F
ebru
ary
2012/
7 F
ebru
ary
2015
Peo
ple
’s B
an
k o
f
Ch
ina a
nd
Ban
k
Neg
ara
Mala
ysi
a
Bil
ate
ral
Lo
cal
Cu
rren
cy S
wap
Th
e tw
o s
ides
bel
ieve
that
this
ren
ewed
arr
an
gem
ent
wil
l h
elp
pro
mo
te i
nves
tmen
t an
d
trad
e b
etw
een
th
e tw
o c
ou
ntr
ies
an
d s
afe
gu
ard
regio
nal
fin
an
cial
stab
ilit
y.
Incr
ease
d s
ize
fro
m
CN
Y80 b
illi
on
/
RM
40 b
illi
on
to
CN
T180 b
illi
on
/
RM
90 b
illi
on
.
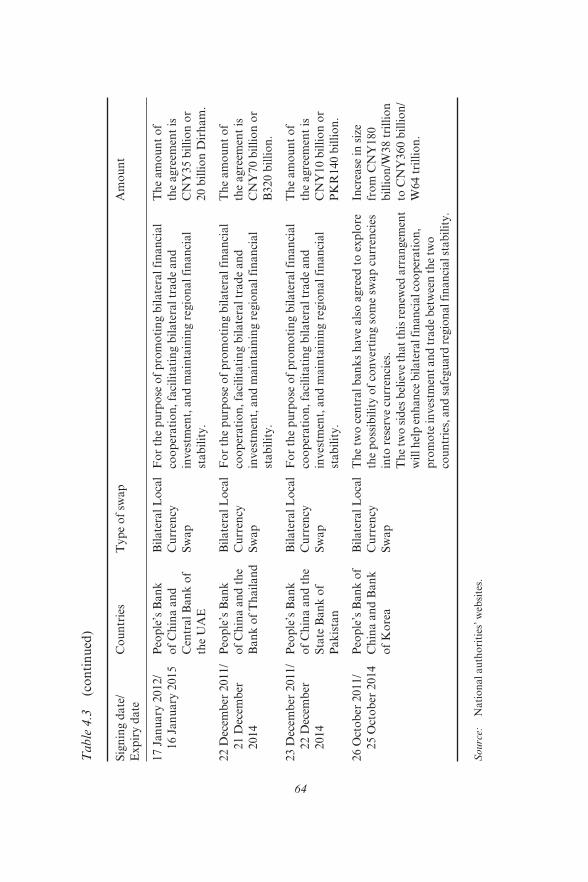
64
Table
4.3
(c
on
tin
ued
)
Sig
nin
g d
ate
/
Exp
iry d
ate
Co
un
trie
sT
yp
e o
f sw
ap
Am
ou
nt
17 J
an
uary
2012/
16 J
an
uary
2015
Peo
ple
’s B
an
k
of
Ch
ina a
nd
Cen
tral
Ban
k o
f
the
UA
E
Bil
ate
ral
Lo
cal
Cu
rren
cy
Sw
ap
Fo
r th
e p
urp
ose
of
pro
mo
tin
g b
ilate
ral
fin
an
cial
coo
per
ati
on
, fa
cili
tati
ng b
ilate
ral
trad
e an
d
inves
tmen
t, a
nd
main
tain
ing r
egio
nal
fin
an
cial
stab
ilit
y.
Th
e am
ou
nt
of
the
agre
emen
t is
CN
Y35 b
illi
on
or
20 b
illi
on
Dir
ham
.
22 D
ecem
ber
2011/
21 D
ecem
ber
2014
Peo
ple
’s B
an
k
of
Ch
ina a
nd
th
e
Ban
k o
f T
hail
an
d
Bil
ate
ral
Lo
cal
Cu
rren
cy
Sw
ap
Fo
r th
e p
urp
ose
of
pro
mo
tin
g b
ilate
ral
fin
an
cial
coo
per
ati
on
, fa
cili
tati
ng b
ilate
ral
trad
e an
d
inves
tmen
t, a
nd
main
tain
ing r
egio
nal
fin
an
cial
stab
ilit
y.
Th
e am
ou
nt
of
the
agre
emen
t is
CN
Y70 b
illi
on
or
B320 b
illi
on
.
23 D
ecem
ber
2011/
22 D
ecem
ber
2014
Peo
ple
’s B
an
k
of
Ch
ina a
nd
th
e
Sta
te B
an
k o
f
Pak
ista
n
Bil
ate
ral
Lo
cal
Cu
rren
cy
Sw
ap
Fo
r th
e p
urp
ose
of
pro
mo
tin
g b
ilate
ral
fin
an
cial
coo
per
ati
on
, fa
cili
tati
ng b
ilate
ral
trad
e an
d
inves
tmen
t, a
nd
main
tain
ing r
egio
nal
fin
an
cial
stab
ilit
y.
Th
e am
ou
nt
of
the
agre
emen
t is
CN
Y10 b
illi
on
or
PK
R140 b
illi
on
.
26 O
cto
ber
2011/
25 O
cto
ber
2014
Peo
ple
’s B
an
k o
f
Ch
ina a
nd
Ban
k
of
Ko
rea
Bil
ate
ral
Lo
cal
Cu
rren
cy
Sw
ap
Th
e tw
o c
entr
al
ban
ks
have
als
o a
gre
ed t
o e
xp
lore
the
po
ssib
ilit
y o
f co
nver
tin
g s
om
e sw
ap
cu
rren
cies
into
res
erve
curr
enci
es.
Th
e tw
o s
ides
bel
ieve
that
this
ren
ewed
arr
an
gem
ent
wil
l h
elp
en
han
ce b
ilate
ral fi
nan
cial co
op
erati
on
,
pro
mo
te in
ves
tmen
t an
d t
rad
e b
etw
een
th
e tw
o
cou
ntr
ies,
an
d s
afe
gu
ard
reg
ion
al fi
nan
cial st
ab
ilit
y.
Incr
ease
in
siz
e
fro
m C
NY
180
bil
lio
n/W
38 t
rill
ion
to C
NY
360 b
illi
on
/
W64 t
rill
ion
.
Sourc
e:
Nati
on
al
au
tho
riti
es’
web
site
s.
Enhancing the effectiveness of CMIM and AMRO 65
With the multilateralization of the Chiang Mai Initiative, the current
challenge is not only to avoid potential conflicts between these two
approaches, but also to find ways to create synergy between these two
types of facilities. Without concrete coordination there is a real risk
that the CMIM is undermined by the bilateral facilities, and vice versa.
After all, what would be the incentive for an ASEAN+3 economy to
apply for the CMIM facility, especially given the size limitation? How
can a multilateral swap facility like the CMIM become an attractive
facility given a choice of bilateral swap facilities and IMF funding
facilities, without leading to moral hazard, while preventing “facility
shopping”?
Bilateral and CMIM swap arrangements can indeed complement each
other if they are well coordinated. More importantly, decisions to extend
both bilateral and CMIM swap facilities should be taken consistently
and, as much as possible, under one general framework. In particular, a
common framework for bilateral and CMIM swap facilities among the
ASEAN+3 economies can be agreed upon in a joint memorandum of
understanding. As part of broad guidelines, any request from a member
of the ASEAN+3 economies for a bilateral swap facility from another
member of the ASEAN+3 should first be submitted to the CMIM facil-
ity for consideration. In other words, the request should go through an
evaluation and decision process under the CMIM framework. Should the
request be approved by the CMIM’s Executive Committee, the requesting
member economy will then be entitled to receive its available maximum
swap amount listed in Table 4.2. In the event that the available CMIM
swap amount is less than the amount requested or needed, the bilateral
swap can supplement or top up the difference.
Both parties – the recipient and the lender – can benefit from this pro-
posal. The eligible recipient economy is in a position to receive a swap
amount larger than its maximum swap amount under the CMIM; the swap
provider can take comfort in the due process of surveillance and approval
under the CMIM facility, before having to extend the funds. Without
this arrangement, the swap- providing economy would have to rely on its
own surveillance process, before the swap takes place and afterwards, to
decide on the request. Furthermore, the swap- providing economy must
bear the whole amount of the swap requested under the non- cooperative
framework. However, under a single contract of multilateral swap facility,
the swap provider does not have to shoulder the risk of the full amount,
as some of the funds fall under the multilateral facility (see Figure 4.1).
Naturally, designing appropriate conditionalities attached to the facility
is critical. The viewpoint on conditionalities will be discussed in a greater
detail in the next sub- section.
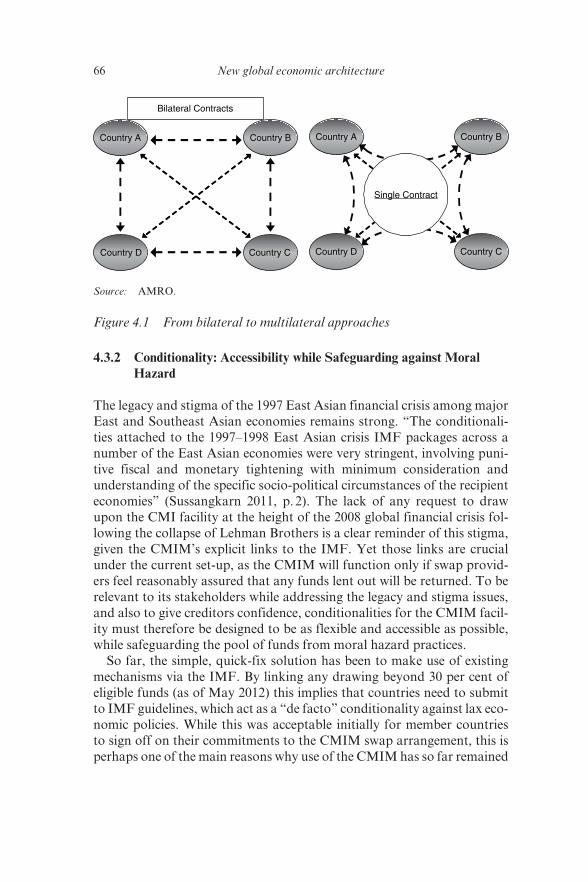
66 New global economic architecture
4.3.2 Conditionality: Accessibility while Safeguarding against Moral
Hazard
The legacy and stigma of the 1997 East Asian financial crisis among major
East and Southeast Asian economies remains strong. “The conditionali-
ties attached to the 1997–1998 East Asian crisis IMF packages across a
number of the East Asian economies were very stringent, involving puni-
tive fiscal and monetary tightening with minimum consideration and
understanding of the specific socio- political circumstances of the recipient
economies” (Sussangkarn 2011, p. 2). The lack of any request to draw
upon the CMI facility at the height of the 2008 global financial crisis fol-
lowing the collapse of Lehman Brothers is a clear reminder of this stigma,
given the CMIM’s explicit links to the IMF. Yet those links are crucial
under the current set- up, as the CMIM will function only if swap provid-
ers feel reasonably assured that any funds lent out will be returned. To be
relevant to its stakeholders while addressing the legacy and stigma issues,
and also to give creditors confidence, conditionalities for the CMIM facil-
ity must therefore be designed to be as flexible and accessible as possible,
while safeguarding the pool of funds from moral hazard practices.
So far, the simple, quick- fix solution has been to make use of existing
mechanisms via the IMF. By linking any drawing beyond 30 per cent of
eligible funds (as of May 2012) this implies that countries need to submit
to IMF guidelines, which act as a “de facto” conditionality against lax eco-
nomic policies. While this was acceptable initially for member countries
to sign off on their commitments to the CMIM swap arrangement, this is
perhaps one of the main reasons why use of the CMIM has so far remained
Country A
Country D Country C
Country B Country A
Country D Country C
Country B
Single Contract
Bilateral Contracts
Source: AMRO.
Figure 4.1 From bilateral to multilateral approaches
Enhancing the effectiveness of CMIM and AMRO 67
off- limits to its members. This suggests a good case can be made for estab-
lishing a framework for conditionality with full CMIM ownership. How
then should such a framework be established to make it more flexible and
effective, while at the same time not repeating the shortcomings of global
lending frameworks? Borrowing the views of Jomo (2011), successful and
effective regional arrangements must be flexible but credible, and capable
of effective counter- cyclical macroeconomic management as well as crisis
prevention management. In other words, facilities under regional financial
arrangements must be large enough to be useful, with related condition-
alities that are balanced between being strict enough to protect lenders’
interests and supporting borrowing countries’ economies. Furthermore,
such conditionalities would require policy adjustments on the part of the
borrowers, which will need to be specified at the outset.
It is useful to draw upon existing models of conditionalities as espoused
by the IMF and enhanced over the years. Key characteristics include both
the design of the macroeconomic and structural policy recommendations,
as well as the tools used to monitor progress towards the goals outlined
in those recommendations and plans (IEO 2007). According to the IEO
Report, conditionalities should be as streamlined as possible, focus on
addressing the cause of crisis, and ensure that lent funds will eventually
be repaid. In the case of the CMIM, conditionalities may need to focus on
macroeconomic stabilization and balance of payments issues, for instance.
Conditionalities may also relate to performance criteria which need to be
met, in order for funds to be rolled over once they mature. In cases where
conditions are unpopular, mechanisms to lock governments into reform
programs may be required, although a balance between enforcement and
program ownership by the country in question is also crucial.
Why then, would any conditionality be substantially different from the
tried- and- tested IMF conditionality? The CMIM is intended to deal with
short- term shocks to the economy and the balance of payments. This is
reflected in the nature of the CMIM’s facilities, such as shorter activation
times and loan maturity. In fact, the CMIM’s maturity and supporting
period for the IMF de- linked portion is for six months and two years,
respectively, or for one year and three years, respectively,6 for the IMF-
linked portion.
Let us briefly consider some of the IMF’s lending instruments that
share similar objectives to the CMIM facilities, in order to draw lessons
from how they are set up and from the experience of their use. The IMF
maintains an array of facilities, including concessional lending, as well
as a whole range of facilities to address an actual or potential balance
of payments need. We consider two types of facilities which correspond
most closely to the CMIM’s IMF- de- linked portion and the CMIM’s
68 New global economic architecture
IMF- linked portion: the Rapid Financing Instrument (RFI) and the
Precautionary and Liquidity Line (PLL).
The Rapid Financing Instrument is meant to provide rapid financial
assistance, with limited conditionality, to any member facing an urgent
balance of payments need. The rapid nature of disbursement and limited
conditionality means that amounts provided are small; access under the
RFI is subject to an annual limit of 50 per cent of quota and a cumulative
limit of 100 per cent of quota. In fact, for the IMF’s rapid access compo-
nent (i.e. small emergency loans), low conditionality is the norm, whereas
for the high access component (i.e. the bulk of the funds), related condi-
tionalities are needed to focus policies on tackling the underlying shock
(Bird 2009), which typically can be resolved only over the medium term.
The similarity of the RFI to the CMIM’s IMF de- linked portion, both in
terms of purpose and characteristics such as maturity, therefore, make
the RFI a suitable candidate for comparison. Both facilities are meant to
provide rapid financial assistance to members that face an urgent balance
of payments need. Table 4.4 compares the available amounts under RFI
and the 30 per cent IMF de- linked portion. Taking the case of Indonesia,
for example, 100 per cent of IMF quota is equivalent to around US$3.14
billion. If we look at the CMIM’s IMF de- linked portion (30 per cent), this
amounts to US$6.83 billion. In the case of Thailand, the corresponding
numbers are US$2.17 billion and US$6.82 billion, respectively. While the
size of the CMIM’s IMF- de- linked portion is double the amount of the
IMF RFI, it would still only be useful for emergency- situation assistance.
Therefore, the conditionalities for the CMIM’s de- linked tranche should
be no more stringent than the IMF’s RFI.7
It may be useful to compare a request for disbursement of the full
amount of the CMIM swap facility with the IMF’s recently revamped
Precautionary and Liquidity Line (PLL),8 rather than the IMF’s Stand- By
Arrangements (SBAs). Objectives and time horizons of the CMIM and
the IMF’s SBA are different, with the CMIM focusing on shorter- term
adjustments than the SBA. The CMIM was designed to be different from
the SBA, to avoid the complex SBA programs that had non- core struc-
tural components, which added to perceptions that the programs were too
cumbersome and implementation lacked even- handedness. The IMF PLL,
on the other hand, attempts not only to address the shortcomings of previ-
ous programs, but also to address the inaccessibility of the more recently
established FCL – its qualifying criteria being too strict to allow it to be
widely utilized. The PLL also has a wider use, that is, for actual and poten-
tial balance of payment (BOP) needs. As the PLL is similar to the CMIM
in terms of the flexibility and accessibility of its programs, this makes it a
useful starting point for designing CMIM conditionality.
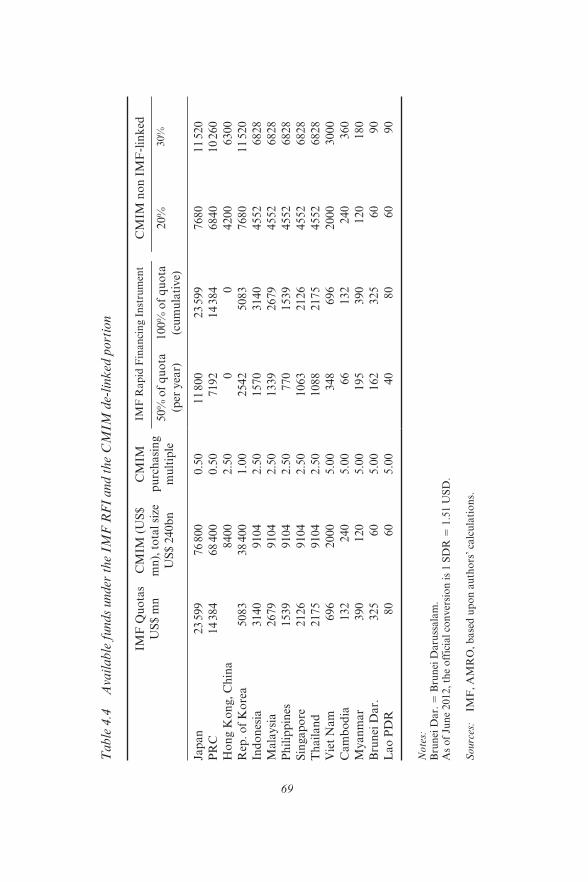
69
Table
4.4
A
vail
able
funds
under
the
IMF
RF
I and t
he
CM
IM d
e- li
nk
ed p
ort
ion
IMF
Qu
ota
s
US
$ m
n
CM
IM (
US
$
mn
), t
ota
l si
ze
US
$ 2
40b
n
CM
IM
pu
rch
asi
ng
mu
ltip
le
IMF
Rap
id F
inan
cin
g I
nst
rum
ent
CM
IM n
on
IM
F- l
ink
ed
50%
of
qu
ota
(per
yea
r)
100%
of
qu
ota
(cu
mu
lati
ve)
20%
30%
Jap
an
23 5
99
76 8
00
0.5
011 8
00
23 5
99
7680
11 5
20
PR
C14 3
84
68 4
00
0.5
07192
14 3
84
6840
10 2
60
Ho
ng K
on
g,
Ch
ina
8400
2.5
00
04200
6300
Rep
. o
f K
ore
a5083
38 4
00
1.0
02542
5083
7680
11 5
20
Ind
on
esia
3140
9104
2.5
01570
3140
4552
6828
Mala
ysi
a2679
9104
2.5
01339
2679
4552
6828
Ph
ilip
pin
es1539
9104
2.5
0770
1539
4552
6828
Sin
gap
ore
2126
91
04
2.5
01063
2126
4552
6828
Th
ail
an
d2175
9104
2.5
01088
2175
4552
6828
Vie
t N
am
696
2000
5.0
0348
696
2000
3000
Cam
bo
dia
132
240
5.0
066
132
240
360
Myan
mar
390
120
5.0
0195
390
120
180
Bru
nei
Dar.
325
60
5.0
0162
325
60
90
Lao
PD
R80
60
5.0
040
80
60
90
Note
s:
Bru
nei
Dar.
5 B
run
ei D
aru
ssala
m.
As
of
Jun
e 2012,
the
off
icia
l co
nver
sio
n i
s 1 S
DR
5 1
.51 U
SD
.
Sourc
es:
IMF
, A
MR
O,
base
d u
po
n a
uth
ors
’ ca
lcu
lati
on
s.
70 New global economic architecture
The PLL uses both ex- ante and ex- post conditionalities, which are
similar to the CMIM’s original concept, based on the need for condi-
tions that were specified in the Chiang Mai Initiative Multilateralization
Agreement, as well as the need for monitoring criteria for ex- post condi-
tions. Furthermore, PLL qualification hinges upon an assessment that
the economy has sound economic fundamentals and institutional policy
frameworks; is implementing (and has a track record of implement-
ing) sound policies; and is committed to sound policies in the future.
Assessment of qualification for the PLL covers five broad areas: (1) exter-
nal position and market access; (2) fiscal policy; (3) monetary policy; (4)
financial sector soundness and supervision; and (5) data adequacy. It is no
coincidence that the CMIM’s decision- making board recently announced
that qualification criteria for the CMIM’s own crisis prevention function
is to be assessed in these five areas as well. But more importantly, this
concept can also be usefully applied to the Crisis Resolution Function of
the CMIM.
Having a fixed set of ex- ante criteria (in the five areas listed, for
instance) can help improve the timeliness of approval for use of facili-
ties and their disbursement. Setting looser ex- ante criteria in these five
areas, with gradually tighter conditionalities, can help a larger number
of members qualify initially and thus enable them to make use of the
CMIM, preventing their exclusion from the beginning. Criteria will need
to be economy- and case- specific, given huge divergences in the level of
economic development among members. In the case of the PLL, the IMF
indicates that in cases where not all criteria are met ex- ante, there is a case
for using that area of vulnerability in guiding the member’s ex- post condi-
tions. Furthermore, limiting conditionalities to these five areas would help
them to remain focused and streamlined, and more likely to be relevant
to the shocks in question, as these are probably the likely sources of BOP
problems. However, as far as the potential use of the CMIM is concerned,
the source of shocks can come from other problems as well.
However, there are clear conditions where the PLL will not apply,
effectively precluding certain situations. Such conditions are: (1) a sus-
tained inability to access international capital markets; (2) a need for large
macro economic or structural policy adjustment; (3) a public debt position
that is likely to be unsustainable in the medium- term; or (4) widespread
bank insolvencies. In the case of the CMIM, while specific conditions
may need to be waived in the case of crisis resolution functions, such as
the need for sustained access to international capital markets, other situ-
ations such as public debt issues may need to be retained. This would be
necessary to prevent the facilities from being used beyond their specified
mandate of tackling BOP difficulties.
Enhancing the effectiveness of CMIM and AMRO 71
A mix of both ex- ante and ex- post conditions should be used together
in designing the conditionality structure in a holistic and streamlined way.
In this case, using ex- ante conditionality in the form of pre- qualification
criteria can help play a role in reducing potentially complex and unnec-
essary ex- post conditionality. This is one aspect of speeding up the
decision- making process, as well as facilitating the follow- up process.
The pre- qualification criteria will focus on dealing with the most likely
problems and shocks, which by nature should be short- term. These would
include conventional macroeconomic conditionalities, as well as other
short- term indicators involving financial markets, for instance. As in the
IMF PLL, structural targets and structural performance criteria have no
role to play in such conditionalities; if they do (requirements for financial
sector reform being a case in point), the sources of the problems are likely
to be beyond what the CMIM can effectively tackle.
A degree of flexibility in the conditionalities, which can be adjusted
according to country performance, should be more conducive to promot-
ing national ownership of strong and effective policies. The argument is
that only with national ownership will such reforms be implemented. In
the light of concerns about whether the ASEAN+3 community would be
able to coerce peers into difficult reforms, national ownership of such poli-
cies is vital. To further streamline the process and improve efficiency, the
IMF’s Independent Evaluation Office (IEO) in its review of IMF condi-
tionalities recommended that a notional cap on the number of condition-
alities could be set, at four to five per year, and these should be restricted
to areas of core competency (IEO, 2007). This can perhaps be considered
in the CMIM context to minimize the number of conditionalities that an
economy will need to observe. However, this provision can be subject to
caveats that more conditionalities may be added, if required, on a case- by-
case basis.
4.4 AMRO: CONDUCTING INTEGRATED SURVEILLANCE
The attainment of an effective CMIM strongly depends on the credible
surveillance work of AMRO. This message has been repeatedly pointed
out at the numerous semi- annual meetings of deputies. AMRO can learn
from other institutions that undertake surveillance, such as the IMF, with
its vast experience in global economic and financial surveillance. In this
section, we discuss AMRO’s current work process on economic surveil-
lance, and make suggestions about how to improve AMRO’s surveillance
capacity. Takagi (2010) proposes a set of features and characteristics
72 New global economic architecture
underpinning sound surveillance work. One of them, and arguably the
most urgent one for AMRO, is the necessity to establish a centralized
and integrated surveillance approach. However, before moving into a
detailed discussion on the infrastructure needed to carry out integrated
surveillance work at AMRO, the next sub- section presents some of the
key features of the ASEAN+3 economies, highlighting their openness and
interconnectedness with other economies.
4.4.1 Trade and Financially Integrated Economies
Trade integration of the ASEAN+3 economies with their global partners
may vary, but it is clearly significant. On average, between 13 and 14 per
cent of total exports of individual ASEAN+3 economies were shipped to
traditional markets such as the United States (US) in 2011 (Table 4.5).9 The
emergence of the PRC as a major hub of the production networks in Asia
contributed significantly to the rapid rise of intra- regional trade among
the ASEAN+3 economies. Major ASEAN economies, such as Indonesia,
Malaysia, Thailand and Singapore, sent more of their exports to the PRC
than to the US and the European Union (EU) in 2011. Furthermore, Japan
continued to be an important trading partner for the emerging markets of
the ASEAN+3 economies. In 2011, a resilient intra- regional export per-
formance cushioned the impact of falling exports to Europe and the US on
the overall export activities of the ASEAN+3 economies.
Following the intensification of trade integration in the 1980s and
1990s and with the liberalization of the financial sectors in many parts of
the ASEAN economies, financial market integration has deepened and
widened. There has been an increasing complementarity between foreign
direct investment (FDI) and trade, especially as the result of growing
fragmentation of production combined with the creation of distribution
networks spanning within the ASEAN economies and across to other
parts of Asia and the world. As in the case of trade activities, total FDI
into the ASEAN economies dropped in 2009, but recovered strongly and
grew at a rate of around 100 per cent in 2010 (Table 4.6). A large portion
of total FDI came from outside the region. In fact, extra- ASEAN direct
investment was nearly five times as high as intra- ASEAN investment.
However, intra- ASEAN investment was only second to total investment
from the EU, contributing to about 16 per cent of total FDI to the region
in 2010 (Table 4.7). This highlights the importance of direct investment
between economies within the region. It is also worth highlighting that
investment from the Asian economies (ASEAN, Japan, the Republic of
Korea, the PRC and India) made up close to 40 per cent of total FDI to
the region in 2010.
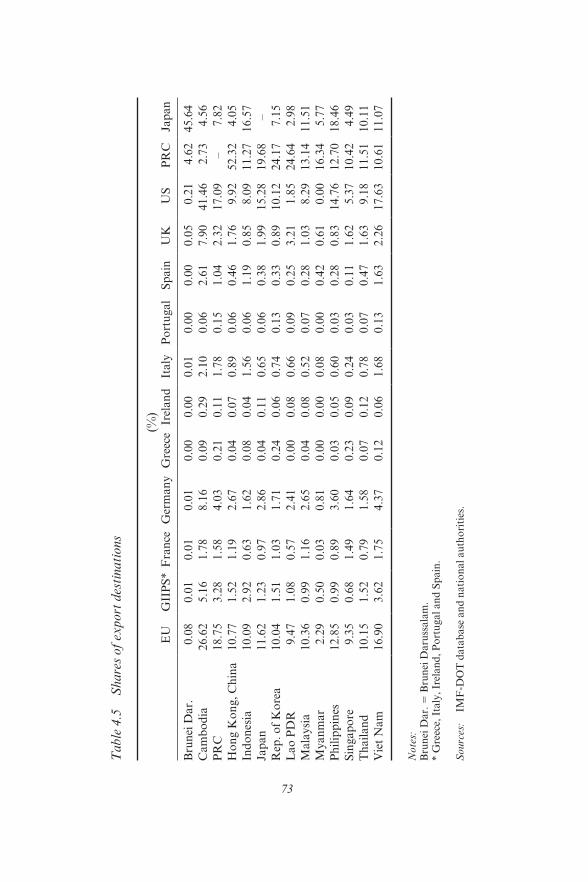
73
Table
4.5
S
hare
s of
export
des
tinati
ons
(%)
EU
GII
PS
*F
ran
ceG
erm
an
yG
reec
eIr
elan
dIt
aly
Po
rtu
gal
Sp
ain
UK
US
PR
CJa
pan
Bru
nei
Dar.
0.0
80.0
10.0
10.0
10.0
00.0
00.0
10.0
00.0
00.0
50.2
14.6
245.6
4
Cam
bo
dia
26.6
25.1
61.7
88.1
60.0
90.2
92.1
00.0
62.6
17.9
041.4
62.7
34.5
6
PR
C18.7
53.2
81.5
84.0
30.2
10.1
11.7
80.1
51.0
42.3
217.0
9–
7.8
2
Ho
ng K
on
g,
Ch
ina
10.7
71.5
21.1
92.6
70.0
40.0
70.8
90.0
60.4
61.7
69.9
252.3
24.0
5
Ind
on
esia
10.0
92.9
20.6
31.6
20.0
80.0
41.5
60.0
61.1
90.8
58.0
911.2
716.5
7
Jap
an
11.6
21.2
30.9
72.8
60.0
40.1
10.6
50.0
60.3
81.9
915.2
819.6
8–
Rep
. o
f K
ore
a10.0
41.5
11.0
31.7
10.2
40.0
60.7
40.1
30.3
30.8
910.1
224.1
77.1
5
Lao
PD
R9.4
71.0
80.5
72.4
10.0
00.0
80.6
60.0
90.2
53.2
11.8
524.6
42.9
8
Mala
ysi
a10.3
60.9
91.1
62.6
50.0
40.0
80.5
20.0
70.2
81.0
38
.29
13.1
411.5
1
Myan
mar
2.2
90.5
00.0
30.8
10.0
00.0
00.0
80.0
00.4
20.6
10.0
016.3
45.7
7
Ph
ilip
pin
es12.8
50.9
90.8
93.6
00.0
30.0
50.6
00.0
30.2
80.8
314
.76
12.7
018.4
6
Sin
gap
ore
9.3
50.6
81.4
91.6
40.2
30.0
90.2
40.0
30.1
11.6
25
.37
10.4
24.4
9
Th
ail
an
d10.1
51.5
20.7
91.5
80.0
70.1
20.7
80.0
70.4
71.6
39
.18
11.5
110.1
1
Vie
t N
am
16.9
03.6
21.7
54.3
70.1
20.0
61.6
80.1
31.6
32.2
617.6
310.6
111.0
7
Note
s:
Bru
nei
Dar.
5 B
run
ei D
aru
ssala
m.
* G
reec
e, I
taly
, Ir
elan
d,
Po
rtu
gal
an
d S
pain
.
Sourc
es:
IMF
- DO
T d
ata
base
an
d n
ati
on
al
au
tho
riti
es.
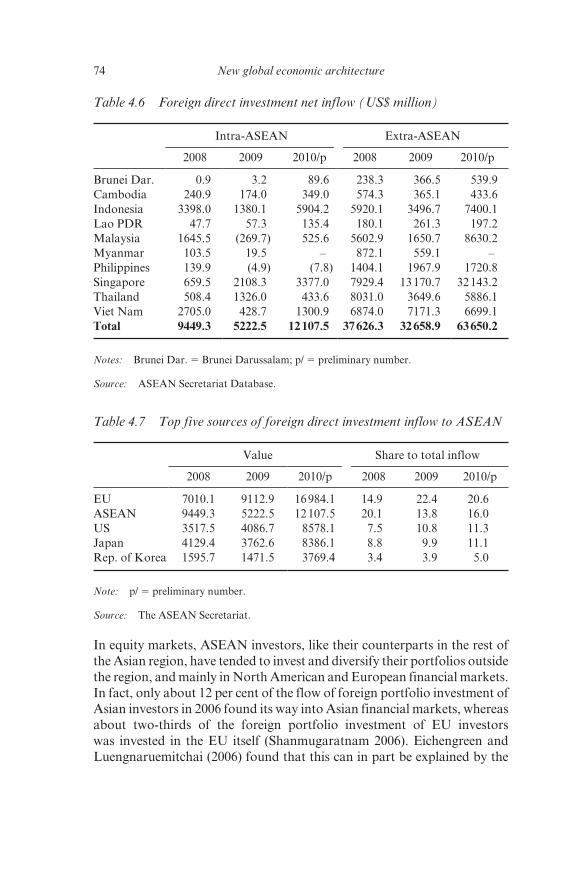
74 New global economic architecture
In equity markets, ASEAN investors, like their counterparts in the rest of
the Asian region, have tended to invest and diversify their portfolios outside
the region, and mainly in North American and European financial markets.
In fact, only about 12 per cent of the flow of foreign portfolio investment of
Asian investors in 2006 found its way into Asian financial markets, whereas
about two- thirds of the foreign portfolio investment of EU investors
was invested in the EU itself (Shanmugaratnam 2006). Eichengreen and
Luengnaruemitchai (2006) found that this can in part be explained by the
Table 4.6 Foreign direct investment net inflow (US$ million)
Intra- ASEAN Extra- ASEAN
2008 2009 2010/p 2008 2009 2010/p
Brunei Dar. 0.9 3.2 89.6 238.3 366.5 539.9
Cambodia 240.9 174.0 349.0 574.3 365.1 433.6
Indonesia 3398.0 1380.1 5904.2 5920.1 3496.7 7400.1
Lao PDR 47.7 57.3 135.4 180.1 261.3 197.2
Malaysia 1645.5 (269.7) 525.6 5602.9 1650.7 8630.2
Myanmar 103.5 19.5 – 872.1 559.1 –
Philippines 139.9 (4.9) (7.8) 1404.1 1967.9 1720.8
Singapore 659.5 2108.3 3377.0 7929.4 13 170.7 32 143.2
Thailand 508.4 1326.0 433.6 8031.0 3649.6 5886.1
Viet Nam 2705.0 428.7 1300.9 6874.0 7171.3 6699.1
Total 9449.3 5222.5 12 107.5 37 626.3 32 658.9 63 650.2
Notes: Brunei Dar. 5 Brunei Darussalam; p/ 5 preliminary number.
Source: ASEAN Secretariat Database.
Table 4.7 Top five sources of foreign direct investment inflow to ASEAN
Value Share to total inflow
2008 2009 2010/p 2008 2009 2010/p
EU 7010.1 9112.9 16 984.1 14.9 22.4 20.6
ASEAN 9449.3 5222.5 12 107.5 20.1 13.8 16.0
US 3517.5 4086.7 8578.1 7.5 10.8 11.3
Japan 4129.4 3762.6 8386.1 8.8 9.9 11.1
Rep. of Korea 1595.7 1471.5 3769.4 3.4 3.9 5.0
Note: p/ 5 preliminary number.
Source: The ASEAN Secretariat.
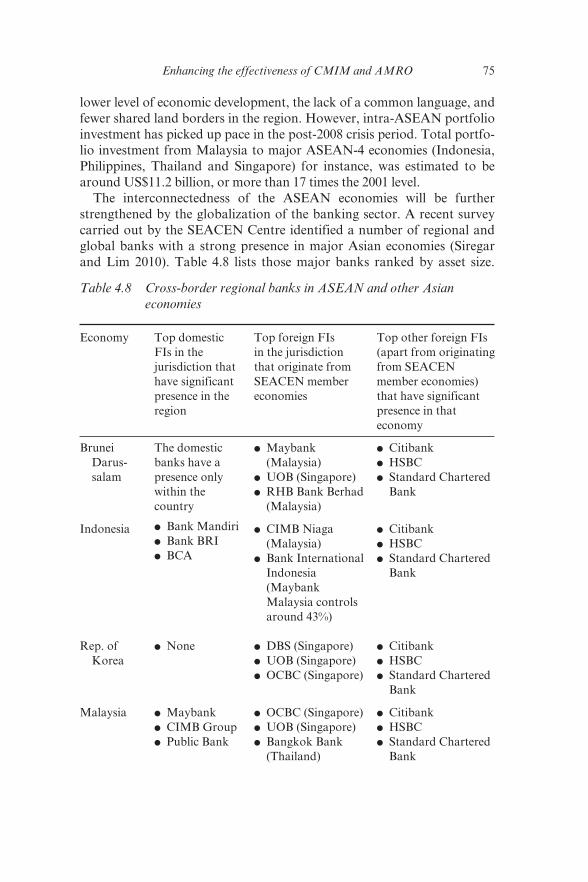
Enhancing the effectiveness of CMIM and AMRO 75
lower level of economic development, the lack of a common language, and
fewer shared land borders in the region. However, intra- ASEAN portfolio
investment has picked up pace in the post- 2008 crisis period. Total portfo-
lio investment from Malaysia to major ASEAN- 4 economies (Indonesia,
Philippines, Thailand and Singapore) for instance, was estimated to be
around US$11.2 billion, or more than 17 times the 2001 level.
The interconnectedness of the ASEAN economies will be further
strengthened by the globalization of the banking sector. A recent survey
carried out by the SEACEN Centre identified a number of regional and
global banks with a strong presence in major Asian economies (Siregar
and Lim 2010). Table 4.8 lists those major banks ranked by asset size.
Table 4.8 Cross- border regional banks in ASEAN and other Asian
economies
Economy Top domestic
FIs in the
jurisdiction that
have significant
presence in the
region
Top foreign FIs
in the jurisdiction
that originate from
SEACEN member
economies
Top other foreign FIs
(apart from originating
from SEACEN
member economies)
that have significant
presence in that
economy
Brunei
Darus-
salam
The domestic
banks have a
presence only
within the
country
● Maybank
(Malaysia)
● UOB (Singapore)
● RHB Bank Berhad
(Malaysia)
● Citibank
● HSBC
● Standard Chartered
Bank
Indonesia ● Bank Mandiri
● Bank BRI
● BCA
● CIMB Niaga
(Malaysia)
● Bank International
Indonesia
(Maybank
Malaysia controls
around 43%)
● Citibank
● HSBC
● Standard Chartered
Bank
Rep. of
Korea
● None ● DBS (Singapore)
● UOB (Singapore)
● OCBC (Singapore)
● Citibank
● HSBC
● Standard Chartered
Bank
Malaysia ● Maybank
● CIMB Group
● Public Bank
● OCBC (Singapore)
● UOB (Singapore)
● Bangkok Bank
(Thailand)
● Citibank
● HSBC
● Standard Chartered
Bank
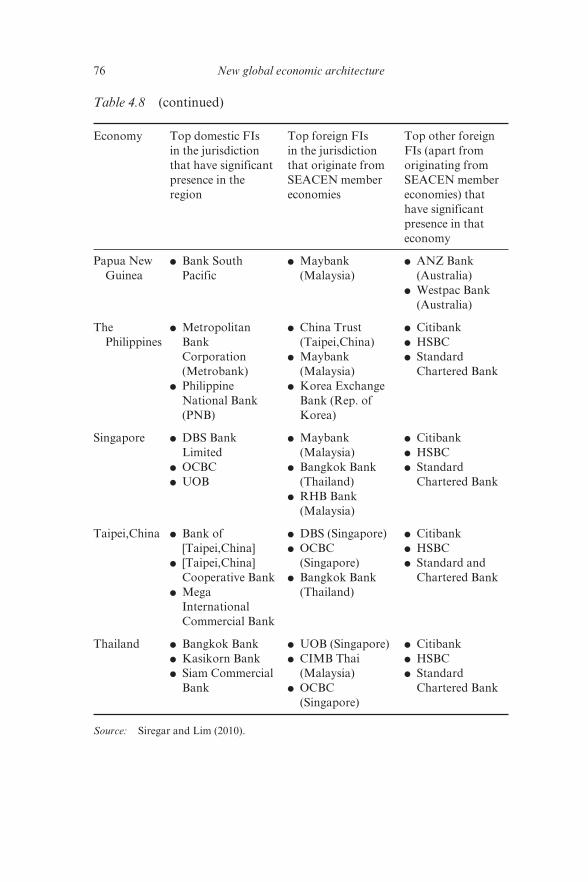
76 New global economic architecture
Table 4.8 (continued)
Economy Top domestic FIs
in the jurisdiction
that have significant
presence in the
region
Top foreign FIs
in the jurisdiction
that originate from
SEACEN member
economies
Top other foreign
FIs (apart from
originating from
SEACEN member
economies) that
have significant
presence in that
economy
Papua New
Guinea
● Bank South
Pacific
● Maybank
(Malaysia)
● ANZ Bank
(Australia)
● Westpac Bank
(Australia)
The
Philippines
● Metropolitan
Bank
Corporation
(Metrobank)
● Philippine
National Bank
(PNB)
● China Trust
(Taipei,China)
● Maybank
(Malaysia)
● Korea Exchange
Bank (Rep. of
Korea)
● Citibank
● HSBC
● Standard
Chartered Bank
Singapore ● DBS Bank
Limited
● OCBC
● UOB
● Maybank
(Malaysia)
● Bangkok Bank
(Thailand)
● RHB Bank
(Malaysia)
● Citibank
● HSBC
● Standard
Chartered Bank
Taipei,China ● Bank of
[Taipei,China]
● [Taipei,China]
Cooperative Bank
● Mega
International
Commercial Bank
● DBS (Singapore)
● OCBC
(Singapore)
● Bangkok Bank
(Thailand)
● Citibank
● HSBC
● Standard and
Chartered Bank
Thailand ● Bangkok Bank
● Kasikorn Bank
● Siam Commercial
Bank
● UOB (Singapore)
● CIMB Thai
(Malaysia)
● OCBC
(Singapore)
● Citibank
● HSBC
● Standard
Chartered Bank
Source: Siregar and Lim (2010).
Enhancing the effectiveness of CMIM and AMRO 77
The Hong Kong Shanghai Banking Corporation (HSBC), Citibank and
Standard Chartered Bank are the three major international banks that
have wide and extensive branch networks in the Asian region. In addition
to these three international powerhouses, the region has also witnessed
the emergence of its own multinational banks. Malaysian banks such
as the Malayan Banking Berhad (Maybank), Commerce International
Merchant Bankers Berhad (CIMB), and Rashid Hussain Berhad (RHB)
have expanded their networks into the Southeast Asian economies and
beyond. A number of Singaporean banks, namely the Development Bank
of Singapore (DBS), the United Overseas Bank (UOB) and the Overseas
Chinese Bank Corporation (OCBC), have achieved similar success in their
efforts to become regional banks.
4.4.2 Capacity Building towards an Integrated Surveillance Office
Given the openness and interconnectedness of the trade sectors and the
financial sectors of the ASEAN+3 economies, well- integrated surveillance
work at AMRO must encompass two areas of coverage: (a) bilateral and
multilateral surveillance; and (b) macroeconomic and financial sector sur-
veillance. By a simple definition, bilateral surveillance focuses more on an
individual economy, whereas multilateral surveillance takes more global
and regional perspectives. The importance of such an integrative approach
to surveillance has become more apparent especially following the recent
2007/2008 global financial crisis, where strong linkages between these areas
of coverage were seen. The G20 Summit in November 2008, for instance,
strongly urged the IMF to give “greater attention to . . . the financial
sector” and better integrate “the reviews with the joint IMF/World Bank
financial sector assessment programs [with a view to strengthening] the role
of the IMF in providing macro- financial policy advice”.10
Given AMRO’s relatively small size and budget compared with other
multilateral surveillance offices, AMRO needs to carefully leverage upon
the benefits and synergies of being a small office in close contact with
regional policymakers. Under the present arrangement, whereby AMRO
economists are involved in the production of all major reports of the
institution, namely the AMRO Regional Economic Monitoring (AREM)
report (covering cross- country economic outlook and multilateral surveil-
lance), individual economic surveillance reports (often referred to as bilat-
eral surveillance) and thematic research reports under each area study unit,
an integrated surveillance process has naturally been established. Despite
its small size, AMRO benefits from a collaborative working arrangement
among economists with a free flow of knowledge across different areas of
expertise and interaction between multilateral and bilateral surveillance.11
78 New global economic architecture
Another advantage of the present set- up derives from the direct access
AMRO has to senior officials in member countries. While critics are quick
to criticize the non- public nature of the current peer- review process, it
yields several benefits when compared to a completely public process.
Providing confidential advice and constructive criticism of policies at the
highest official levels throughout the year, rather than making criticism
publicly, avoids the creation of barriers to effective communication and
cooperation with country authorities. This has benefited AMRO’s surveil-
lance work, with authorities being more receptive to its analysis and more
frank in discussions.
Furthermore, AMRO’s surveillance process has tried to address the
shortcomings of policy dialogue processes of the past. First, AMRO’s
surveillance reports are submitted on a quarterly basis directly to senior
officials of the ministries of finance and the central banks. Twice a year,
in March and December, these reports are presented and discussed during
the meetings of vice ministers of the Ministries of Finance and deputy
governors of the central banks of the ASEAN+3 economies. The surveil-
lance reports are submitted only a week ahead of these high- level official
meetings. Such a practice allows a frank discussion of issues without the
usual revision and pre- screening of controversial issues, which has been
common in regional and international policy dialogue, and a hindrance to
effective policy dialogue in the past. Second, AMRO surveillance reports
and analysis are presented directly to the high- level policymakers in charge
of relevant areas. Third, not publishing reports and surveillance results
can foster an environment more conducive to an exchange of views and
perspectives between the AMRO team and the members’ policymakers in
a setting where authorities are more receptive and open to frank discus-
sions and criticism, an often overlooked particularity of Asian culture.
Fourth, the non- publication process also facilitates timely dissemina-
tion of the reports to all member countries’ officials, and prevents delays
arising from requests for revision by the relevant country’s authorities.
A number of improvements should be considered to further strengthen
the vital surveillance work at AMRO. The most urgent one is to strengthen
research capacities to support the surveillance team. As briefly discussed
and shown in Figure 4.2, three teams of economists were established at
AMRO in the first half of 2012. The focus of each team was largely on
bilateral macroeconomic surveillance. Each economist is assigned to either
one or two economies and his or her main day- to- day duty is to closely
monitor developments in those economies, focusing especially on areas
of potential risks and vulnerabilities. Each economist is also assigned an
area study unit on fiscal matters, monetary and exchange rate matters,
or financial markets. So there are two units of economists at AMRO: the
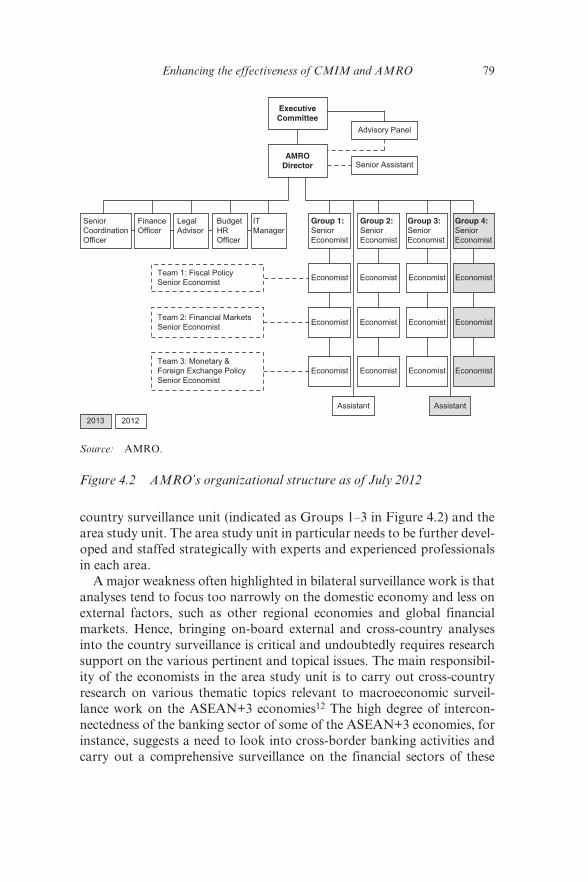
Enhancing the effectiveness of CMIM and AMRO 79
country surveillance unit (indicated as Groups 1–3 in Figure 4.2) and the
area study unit. The area study unit in particular needs to be further devel-
oped and staffed strategically with experts and experienced professionals
in each area.
A major weakness often highlighted in bilateral surveillance work is that
analyses tend to focus too narrowly on the domestic economy and less on
external factors, such as other regional economies and global financial
markets. Hence, bringing on- board external and cross- country analyses
into the country surveillance is critical and undoubtedly requires research
support on the various pertinent and topical issues. The main responsibil-
ity of the economists in the area study unit is to carry out cross- country
research on various thematic topics relevant to macroeconomic surveil-
lance work on the ASEAN+3 economies12 The high degree of intercon-
nectedness of the banking sector of some of the ASEAN+3 economies, for
instance, suggests a need to look into cross- border banking activities and
carry out a comprehensive surveillance on the financial sectors of these
Team 3: Monetary &
Foreign Exchange Policy
Senior Economist
Team 2: Financial Markets
Senior Economist
Team 1: Fiscal Policy
Senior Economist
ExecutiveCommittee
AMRODirector
Advisory Panel
Senior Assistant
Senior
Coordination
Officer
Finance
Officer
Legal
Advisor
Budget
HR
Officer
IT
Manager
Group 1:Senior
Economist
Economist
Economist
Economist
Economist
Economist
Economist
Group 2:Senior
Economist
Economist
Economist
Economist
Group 3:Senior Economist
Economist
Economist
Economist
Group 4:Senior
Economist
Assistant Assistant
2013 2012
Source: AMRO.
Figure 4.2 AMRO’s organizational structure as of July 2012
80 New global economic architecture
economies. In this case, the primary responsibility of the area study unit
would be to prepare an in- depth study of these globalized banking sectors
to map, in particular, potential transmission channels of financial shocks
from the banking sector arising from the activities of the global banks and
regional ASEAN+3 banks. Recognizing the importance of financial stabil-
ity risk, around 25 per cent of the content of AMRO Regional Economic
Monitoring (AREM) reports has dealt with this issue. Moreover, the first
thematic research carried out by the AMRO team was on the topic of a
financial stress index. Acknowledging that the financial sectors of most
ASEAN+3 economies are still dominated by banking, AMRO’s second
thematic study assessed the features, characteristics and implications of the
globally interconnected banking sectors of these economies.
Given resource constraints, particularly in terms of personnel, as discussed
earlier, it has been frequently suggested that AMRO should rely a lot more
on the research and surveillance works carried out by global and national
agencies, especially in the areas of multilateral surveillance (cross- country
issues). Since the beginning of AMRO’s surveillance work, there has been
continuous engagement between AMRO’s team of economists and their
counterparts in multilateral agencies (e.g. IMF, ADB, World Bank, OECD),
investment banks, universities and research institutions. During their con-
sultation visits to the ASEAN+3 economies, AMRO’s team visits repre-
sentative offices of the global and regional multilaterals. AMRO economists
have also hosted members of the IMF Article IV teams in their Singapore
office and compared notes on the relevant economies. Such engagement,
however, has been undertaken on a cooperative and unofficial basis; more
official interaction which would entail joint- surveillance work, for instance,
would need to be approved by the CMIM Executive Committee. Despite
such interaction, AMRO must build its own research and expertise capaci-
ties. One challenge relates to the timeliness of information. Surveillance
reports from other agencies tend to become available when they are already
out of date for surveillance purposes. This has been especially true since the
turbulent times the world economy has experienced from 2007–08, with the
economic and financial landscape changing on a daily basis.
4.5 BRIEF CONCLUDING REMARKS
The 2007–08 global financial crisis has undoubtedly been a catalyst for
the transformation of the CMI into the CMIM and the establishment of
the ASEAN+3 Macroeconomic Research Office (AMRO). Considering
that the CMIM was only established in 2010, the progress achieved within
a period of only two years is testimony to the strong commitment of the
Enhancing the effectiveness of CMIM and AMRO 81
ASEAN+3 governments to strengthening regional financial cooperation.
Alongside these accomplishments, however, significant questions on how
to improve the effectiveness of the CMIM and AMRO remain, particu-
larly on their capacities to become a regional financial safety net and cred-
ible surveillance unit for the ASEAN+3 economies.
Critics of the CMIM often dwell on the limited size of the available
swap facility of only US$240 billion and other potential impediments to its
effectiveness, such as limited resources for surveillance and limited experi-
ence with conditionalities. This chapter discussed some of these potential
weaknesses and offers concrete solutions to overcome them. In particular
the chapter underlines the need and the route to integrate the CMIM’s
multilateral swap facility with those of the bilateral facilities. The impor-
tant issue of ex- ante and ex- post conditionalities has also been deliberated
upon and lessons from the global experiences on designing conditionalities
are considered for the disbursement of the CMIM facility. Regarding the
surveillance work at AMRO, creating an integrated surveillance process
takes center stage of discussion in the chapter.
In a nutshell, the CMIM has the strong support of ASEAN+3 govern-
ments and is the manifestation of these governments’ pragmatic views on
the need to build stronger regional financial cooperation, as much as pos-
sible to ring- fence their economies from shocks originating globally and
from within the region. This commitment has provided a solid base for the
early and future development of AMRO. While the resources at AMRO
will not be as large as those of the regional and global multilateral surveil-
lance offices such as the Asian Development Bank and the International
Monetary Fund, this chapter touches on a number of advantages that
AMRO can exploit to add value to the surveillance works on the econo-
mies of the region. Nevertheless, the CMIM and AMRO have to optimize
the present momentum and opportunities to strengthen institutional
capacities and thus to realize the visions of their founding fathers.
NOTES
1. Here ASEAN+3 includes the ASEAN economies (Brunei Darussalam, Cambodia,
Indonesia, Lao PDR, Malaysia, Myanmar, Philippines, Thailand, Singapore, Viet Nam)
and the Plus- 3 (the PRC, Japan and the Republic of Korea), as well as Hong Kong, China.
2. The set of indicators is compiled to generate scorecards for each individual economy of
the ASEAN+3.
3. The reports are submitted in March, June, September and November to early
December every year.
4. Current members of AMRO’s Advisory Panel include Dr Kang Jia, President, Research
Institute for Fiscal Finance, People’s Republic of China; Mr Shigeo Katsu, President,
Nazarbayev University, Kazakhstan; Dr Junkyu Lee, senior international economic
82 New global economic architecture
advisor, Ministry of Strategy and Finance, Republic of Korea; Dato’ Ooi Sang Kuang,
special advisor, Bank Negara Malaysia; Dr Vincente B. Valdepenas Jr, consultant,
Bangko Sentral ng Pilipinas; and Dr Chalongphob Sussangkarn, distinguished fellow,
Thailand Development Research Institute (Advisory Panel chair).
5. There is a concern that a regional safety net mechanism such as the CMIM could poten-
tially induce moral hazard within its own facility and also vis- à- vis global mechanisms
such as the IMF (Sussangkarn 2011).
6. This was increased in May 2012, from a maturity and supporting period of 90 days and
1 year for the non- IMF- linked portion, and 90 days and 2 years for the IMF- linked
portion, previously.
7. In fact, CMIM may be slightly stricter, as there are a number of ex- ante conditions and
conditions precedents which need to be applied to all borrowers, while RFIs are emer-
gency financing and thus condition-free.
8. The IMF’s Precautionary and Liquidity Line (PLL), launched in November 2011,
replaced the Precautionary Credit Line (PCL), and provided greater flexibility in its use
than the PCL.
9. This average excludes Brunei Darussalam and Myanmar.
10. G- 20 Summit Declaration on Financial Markets and the World Economy, Washington,
DC, 15 November 2008.
11. As discussed in Takagi (2010), the area departments of the IMF work on individual
country (bilateral) surveillance, whereas the research department focuses on multilat-
eral surveillance.
12. Such an area study unit does not need to be large. At the early stage, three to four expe-
rienced economists should be the minimum size and as AMRO continues to grow the
number should be increased.
REFERENCES
Bird, G. 2009. Reforming IMF conditionality: From ‘streamlining’ to ‘major over-haul’. World Economics, 10(3): July–September.
Eichengreen, B. and P. Luengnaruemitchai. 2006. Why doesn’t Asia have bigger bond markets? BIS Papers chapters. In: Asian Bond Markets: Issues and Prospects. Vol. 30. Bank for International Settlements, pp. 40–77.
Independent Evaluation Office (IEO). 2007. Structural conditionality in IMF- supported programs. Evaluation Report. International Monetary Fund.
Jomo, K.S. 2011. Regional financial co- operation in East Asia. In: U. Volz and A. Caliari (eds) Regional and Global Liquidity Arrangements. Bonn, Germany: German Development Institute.
Shanmugaratnam, T. 2006. Asian monetary integration: Will it ever happen? Paper delivered for the Per Jacobsson Lecture.
Siregar, R.Y. and C.S.V. Lim. 2010. The role of central banks in sustaining eco-nomic recovery and in achieving financial stability. Journal of Advanced Studies in Finance, 1: Summer.
Sussangkarn, C. 2011. Institutional building for macroeconomic and financial cooperation in East Asia. Mimeo.
Takagi, S. 2010. Regional surveillance for East Asia: How can it be designed to complement global surveillance? ADB Working Paper Series on Regional Economic Integration No. 50. Manila: Asian Development Bank.
83
5. Financial safety nets in Asia: genesis, evolution, adequacy and way forward*
Hal Hill and Jayant Menon
5.1 INTRODUCTION
The impetus for strengthening regional financial safety nets among
Association of Southeast Asian Nations (ASEAN) countries came fol-
lowing the Asian Financial Crisis (AFC) of 1997–98, when the existing
insurance mechanism in the form of the ASEAN Swap Arrangement
(ASA) proved miserably inadequate. Forced to turn to the International
Monetary Fund (IMF) for the massive bailouts required, and the resent-
ment that ensued following the bitter medicine prescribed, a decision was
taken to pursue a regional safety net that could provide a real alternative.
The initial step was taken with the creation of the Chiang Mai Initiative
(CMI) in 2000, which expanded the bilateral swaps of the ASA both in size
and membership to include the People’s Republic of China (PRC), Japan
and the Republic of Korea. The CMI’s first test came in September 2008
when, following the Lehman Brothers’ collapse, short- term capital quickly
exited emerging economies. However, members of the CMI that required
liquidity support did not turn to it but instead rushed to secure bilateral
swaps with the United States (US), the PRC, Japan, Australia and the
multilaterals.
Once again, the regional financial safety net had failed its members.
This brought about another significant change when in 2009, the CMI was
multilateralized to become the Chiang Mai Initiative Multilateralization
(CMIM), with the many swap lines now governed by a single agreement.
This was soon followed by a number of other important changes, includ-
ing the doubling in size to US$240 billion, increasing the share avail-
able without an IMF program to 30 per cent, and the setting up of its
independent surveillance unit, the ASEAN+3 Macroeconomic Research
Office (AMRO), in 2011. These are impressive developments, but are they
enough to ensure that the CMIM will be called upon when the next crisis
84 New global economic architecture
strikes? This is the key question that this chapter attempts to answer. And
if it is not, what are the issues that still need to be addressed to make it
viable, either as a co- financing facility with the IMF or as a stand- alone
alternative?
The remainder of the chapter is in six sections. Section 5.2 looks at
history, and traces the evolution of the ASA from its early beginnings to
the CMI and its expansion. In section 5.3, we describe the basic structure
and features of the CMIM and the AMRO. Some of the most significant
developments to the CMIM have taken place recently, in the aftermath of
the GFC, and these are discussed in section 5.4. Section 5.5 addresses the
key question of the chapter as to whether these changes are sufficient to
make the CMIM operationally viable. Since we find that it is still unlikely
to be used, we canvass areas that need to be reformed, separating what is
needed for it to work as a complement to the IMF from what more needs to
be done for it to serve as a real alternative. Section 5.6 discusses the poten-
tial of CMIM as a complement to the IMF. Section 5.7 explores the viabil-
ity of the CMIM as a stand- alone option and a final section concludes.
5.2 EARLY BEGINNINGS: FROM THE ASA TO THE CMI AND ITS EXPANSION
Although the impetus for strengthening regional financial safety nets
among ASEAN countries came following the AFC, they have an even
longer history than often recognized. Going back some three and a half
decades to August 1977, the first step was taken when central banks and
monetary authorities of the original five ASEAN5 – Indonesia, Malaysia,
Philippines, Singapore and Thailand – agreed to establish reciprocal cur-
rency or swap arrangements. The ASEAN Swap Arrangement (ASA)
was created primarily to provide liquidity support for those experiencing
balance of payments difficulties. Originally intended to be in effect for
just one year, the arrangement has been extended incrementally, while
coverage and amounts involved have expanded significantly. The initial
maximum total amount available for swap transactions under the ASA
was initially a meager US$100 million, with the maximum total outstand-
ing amount provided by each participant limited to US$20 million, but
this was subsequently increased to US$200 million in 1978.
Nothing much happened with the ASA for about the next two decades
and when the AFC struck, the amounts available were nowhere near ade-
quate. The ASA was basically useless, but the AFC highlighted the need
to revisit the issue to see what needed to be done in order to have an effec-
tive regional insurance scheme. This was driven in large part by the way
Financial safety nets in Asia 85
in which the IMF managed the rescue programs. Three of the four crisis-
affected countries, Indonesia, the Republic of Korea and Thailand, had to
accept an IMF program, the quid pro quo for international support – the
fourth, Malaysia, went it alone. The IMF grew extremely unpopular, not
just for the prescribed bitter medicine, but because it had misdiagnosed the
problems – a fact that it later acknowledged.
There was a resurgence of nationalist sentiment that quickly grew
regional. The Japanese government proposed an alternative “Asian
Monetary Fund” but, neglecting to consult the PRC first, there was
insufficient regional support to counter predictable US opposition.
Notwithstanding this, the first step was taken soon after in May 2000
with the launch of the CMI. Announced at the ASEAN+3 Finance
Ministers’ Meeting (AFMM+3) in the Thai city after which it is named,
it initially expanded ASA to all ASEAN members. In November 2000,
the total amount available for swap transactions was increased from
US$200 million to US$1 billion. After expanding the ASA to include the
new ASEAN economies, bilateral swap agreements (BSAs) were initiated
in 2002 between the original ASEAN5 countries and the “plus 3” of the
PRC, Japan and the Republic of Korea. The BSAs grew from US$17
billion in 2002 to US$31.5 billion in 2003 and US$36.4 billion in 2004. In
May 2005, during the 8th AFMM+3, the amount of the ASA was doubled
to US$2 billion.
But the action continued to center around the BSAs rather than the
ASA, and the number of BSAs and the amounts involved continued to
grow over time. By the time of the AFMM+3 in Madrid in May 2008, the
size of the BSA had increased to US$84 billion (Table 5.1).
5.3 CMIM AND AMRO: BASIC STRUCTURE AND SALIENT FEATURES
If the AFC lit the fuse for the need to transform the ASA into the CMI,
then the Global Financial Crisis (GFC) of 2008 highlighted the continued
inefficacy of that transformation. As with the AFC, the regional safety
net was inadequate when the GFC hit. Given the CMI’s small size and
absence of rapid- response mechanisms, affected countries resorted to
bilateral swaps with the US, Japan, Australia and multilateral agencies.
The meetings of the AFMM+3 that followed agreed to radically trans-
form the CMI in other ways. First, the finance ministers decided to expe-
dite the multilateralization of the CMI. They agreed that funds available
under the multilateralized CMI (CMIM) should be a self- managed reserve
pooling arrangement, governed by a single contract, reducing costly and
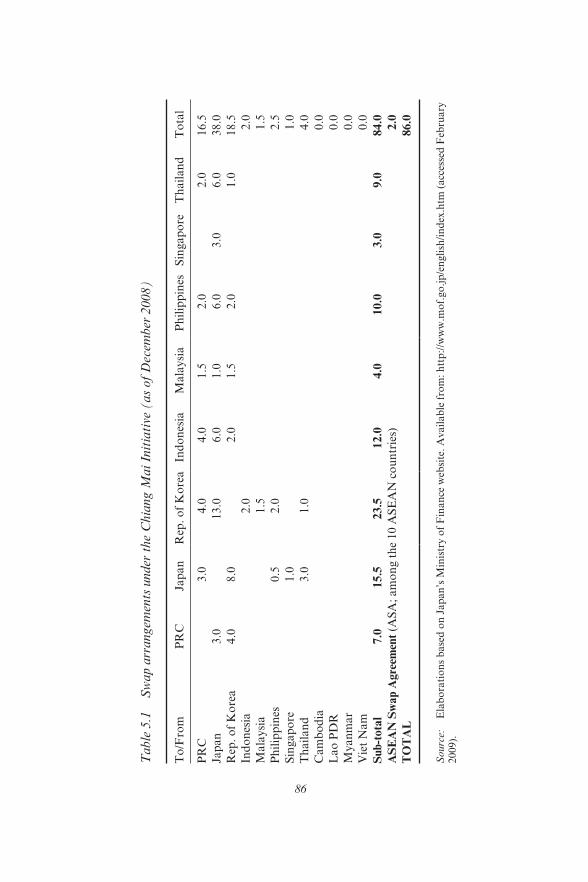
86
Table
5.1
S
wap a
rrangem
ents
under
the
Chia
ng M
ai
Init
iati
ve (
as
of
Dec
ember
2008)
To
/Fro
mP
RC
Jap
an
Rep
. o
f K
ore
aIn
do
nes
iaM
ala
ysi
aP
hil
ipp
ines
Sin
gap
ore
Th
ail
an
dT
ota
l
PR
C3.0
4.0
4.0
1.5
2.0
2.0
16.5
Jap
an
3.0
13.0
6.0
1.0
6.0
3.0
6.0
38.0
Rep
. o
f K
ore
a4.0
8.0
2.0
1.5
2.0
1.0
18.5
Ind
on
esia
2.0
2.0
Mala
ysi
a1.5
1.5
Ph
ilip
pin
es0.5
2.0
2.5
Sin
gap
ore
1.0
1.0
Th
ail
an
d3.0
1.0
4.0
Cam
bo
dia
0.0
Lao
PD
R0.0
Myan
mar
0.0
Vie
t N
am
0.0
Sub- t
ota
l7.0
15.5
23.5
12.0
4.0
10.0
3.0
9.0
84.0
AS
EA
N S
wap A
gre
emen
t (A
SA
; am
on
g t
he
10 A
SE
AN
co
un
trie
s)2.0
TO
TA
L86.0
Sourc
e:
Ela
bo
rati
on
s b
ase
d o
n J
ap
an
’s M
inis
try o
f F
inan
ce w
ebsi
te.
Avail
ab
le f
rom
: h
ttp
://w
ww
.mo
f.go
.jp
/en
gli
sh/i
nd
ex.h
tm (
acc
esse
d F
ebru
ary
2009).
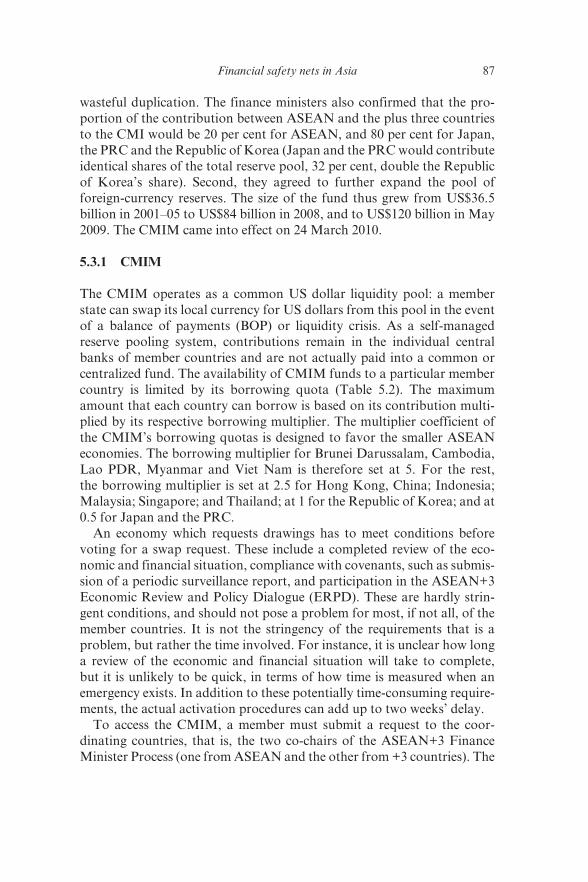
Financial safety nets in Asia 87
wasteful duplication. The finance ministers also confirmed that the pro-
portion of the contribution between ASEAN and the plus three countries
to the CMI would be 20 per cent for ASEAN, and 80 per cent for Japan,
the PRC and the Republic of Korea (Japan and the PRC would contribute
identical shares of the total reserve pool, 32 per cent, double the Republic
of Korea’s share). Second, they agreed to further expand the pool of
foreign- currency reserves. The size of the fund thus grew from US$36.5
billion in 2001–05 to US$84 billion in 2008, and to US$120 billion in May
2009. The CMIM came into effect on 24 March 2010.
5.3.1 CMIM
The CMIM operates as a common US dollar liquidity pool: a member
state can swap its local currency for US dollars from this pool in the event
of a balance of payments (BOP) or liquidity crisis. As a self- managed
reserve pooling system, contributions remain in the individual central
banks of member countries and are not actually paid into a common or
centralized fund. The availability of CMIM funds to a particular member
country is limited by its borrowing quota (Table 5.2). The maximum
amount that each country can borrow is based on its contribution multi-
plied by its respective borrowing multiplier. The multiplier coefficient of
the CMIM’s borrowing quotas is designed to favor the smaller ASEAN
economies. The borrowing multiplier for Brunei Darussalam, Cambodia,
Lao PDR, Myanmar and Viet Nam is therefore set at 5. For the rest,
the borrowing multiplier is set at 2.5 for Hong Kong, China; Indonesia;
Malaysia; Singapore; and Thailand; at 1 for the Republic of Korea; and at
0.5 for Japan and the PRC.
An economy which requests drawings has to meet conditions before
voting for a swap request. These include a completed review of the eco-
nomic and financial situation, compliance with covenants, such as submis-
sion of a periodic surveillance report, and participation in the ASEAN+3
Economic Review and Policy Dialogue (ERPD). These are hardly strin-
gent conditions, and should not pose a problem for most, if not all, of the
member countries. It is not the stringency of the requirements that is a
problem, but rather the time involved. For instance, it is unclear how long
a review of the economic and financial situation will take to complete,
but it is unlikely to be quick, in terms of how time is measured when an
emergency exists. In addition to these potentially time- consuming require-
ments, the actual activation procedures can add up to two weeks’ delay.
To access the CMIM, a member must submit a request to the coor-
dinating countries, that is, the two co- chairs of the ASEAN+3 Finance
Minister Process (one from ASEAN and the other from +3 countries). The
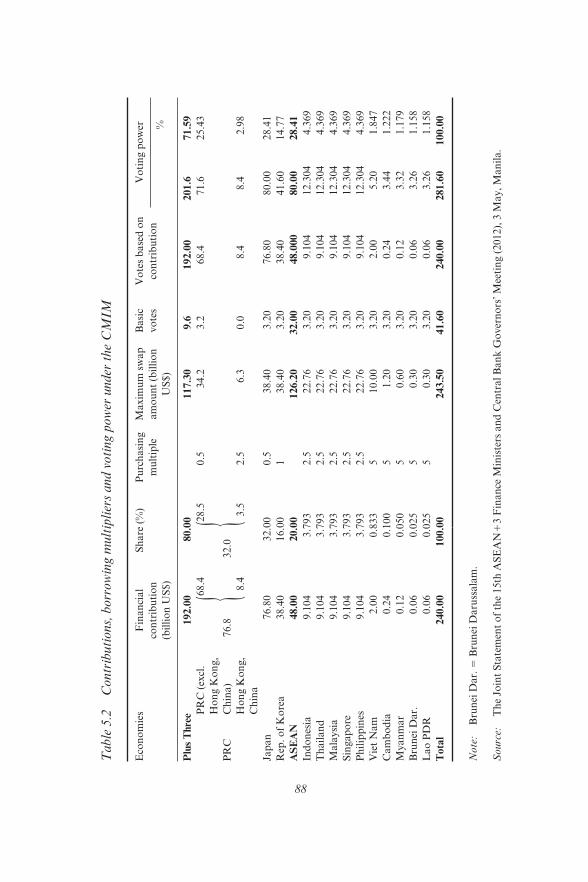
88
Table
5.2
C
ontr
ibuti
ons,
borr
ow
ing m
ult
ipli
ers
and v
oti
ng p
ow
er u
nder
the
CM
IM
Eco
no
mie
sF
inan
cial
con
trib
uti
on
(bil
lio
n U
S$)
Sh
are
(%
)P
urc
hasi
ng
mu
ltip
le
Maxim
um
sw
ap
am
ou
nt
(bil
lio
n
US
$)
Basi
c
vo
tes
Vo
tes
base
d o
n
con
trib
uti
on
Vo
tin
g p
ow
er %
Plu
s T
hre
e192.0
080.0
0117.3
09.6
192.0
0201.6
71.5
9
PR
C
PR
C (
excl
.
Ho
ng K
on
g,
Ch
ina)
76.8
68.4
32.0
28.5
0.5
34.2
3.2
68.4
71.6
25.4
3
Ho
ng K
on
g,
Ch
ina
8.4
3.5
2.5
6.3
0.0
8.4
8.4
2.9
8
Jap
an
76.8
032.0
00.5
38.4
03.2
076.8
080.0
028.4
1
Rep
. o
f K
ore
a38.4
016.0
01
38.4
03.2
038.4
041.6
014.7
7
AS
EA
N48.0
020.0
0126.2
032.0
048.0
00
80.0
028.4
1
Ind
on
esia
9.1
04
3.7
93
2.5
22.7
63.2
09.1
04
12.3
04
4.3
69
Th
ail
an
d9.1
04
3.7
93
2.5
22.7
63.2
09.1
04
12.3
04
4.3
69
Mala
ysi
a9.1
04
3.7
93
2.5
22.7
63.2
09.1
04
12.3
04
4.3
69
Sin
gap
ore
9.1
04
3.7
93
2.5
22.7
63.2
09.1
04
12.3
04
4.3
69
Ph
ilip
pin
es9.1
04
3.7
93
2.5
22.7
63.2
09.1
04
12.3
04
4.3
69
Vie
t N
am
2.0
00.8
33
510.0
03.2
02.0
05.2
01.8
47
Cam
bo
dia
0.2
40.1
00
51.2
03.2
00.2
43.4
41.2
22
Myan
mar
0.1
20.0
50
50.6
03.2
00.1
23.3
21.1
79
Bru
nei
Dar.
0.0
60.0
25
50.3
03.2
00.0
63.2
61.1
58
Lao
PD
R0.0
60.0
25
50.3
03.2
00.0
63.2
61.1
58
Tota
l240.0
010
0.0
0243.5
041.6
0240.0
0281.6
0100.0
0
Note
: B
run
ei D
ar.
5 B
run
ei D
aru
ssala
m.
Sourc
e:
Th
e Jo
int
Sta
tem
ent
of
the
15th
AS
EA
N1
3 F
inan
ce M
inis
ters
an
d C
entr
al
Ban
k G
over
no
rs’
Mee
tin
g (
2012),
3 M
ay,
Man
ila.
{{
Financial safety nets in Asia 89
coordinating countries deliver the swap request notice and other relevant
information to the Executive Level Decision Making Body (ELDMB), a
non- resident body. They then need to convene a meeting to decide on the
swap request. The ELDMB must respond to the swap request within two
weeks of receipt of the swap request notice. Decisions on drawings are
made by a two- thirds majority (weighted voting system linked to contribu-
tions) of the ELDMB. Once the request is approved, the swap- providing
countries transfer the funds to the account of the swap- requesting party,
who in turn transfers the equivalent amount in local currencies to the
accounts of swap- providing countries (AMRO 2012; BSP 2012; ASEAN
Secretariat 2010).
In a comparison with other regional safety nets, Henning (2004, p. 61)
concluded that “the Chiang Mai Initiative is more sensitive to preserving
the central position of the IMF and not undercutting the IMF in negotia-
tions with borrowing countries than these other arrangements”. Although
there have been changes since, the basic central relationship with the IMF
remains. Up until recently, a country could draw up to 20 per cent of its
quota without being subject to IMF conditionality. Should a country avail
of its full quota, the remainder of the amount to be disbursed would be
tied to an IMF program. This link was intended to address moral hazard
issues, and to make up for the lack of an independent surveillance unit
that could oversee the CMI’s operations. The eventual establishment of
AMRO in 2011 has led to a reconsideration of this link.
5.3.2 AMRO
During its May 2009 meeting in Bali, the AFMM+3 agreed to establish
an ancillary institution in the form of an independent regional surveillance
unit, AMRO. AMRO was incorporated on 20 April 2011 as a company
limited by guarantee under the Companies Act, Cap. 50, of the Republic
of Singapore. It commenced operations one month after, in May 2011.
The need for an independent surveillance unit was predicated on the mul-
tilateralization of the CMI. In a multilateralized setting, monitoring and
surveillance had to be enhanced to detect emerging vulnerabilities. CMIM
decision- making also had to be supported by an independent unit with a due
diligence function, so that the borrowing countries’ capacity to meet repay-
ment conditions of lending countries could be assessed. Unconditional
financing when there is a need for policy correction could create moral
hazard, both for potential borrowers and for international investors, even
when it does not adversely affect the prospect for timely repayment.
AMRO’s activities are divided into functions during so- called peace
time and crisis time. During peace or non- crisis periods, AMRO’s main
90 New global economic architecture
responsibility is to prepare quarterly consolidated reports on the overall
macroeconomic assessment of the ASEAN+3 region as well as on individual
ASEAN+3 countries. Should a crisis occur, however, its role and responsi-
bilities multiply. During crisis time, AMRO is tasked to: (a) provide an anal-
ysis of the economic and financial situation of the CMIM swap- requesting
country; (b) monitor the use and impact of the funds disbursed under the
CMIM Agreement; and (c) monitor the compliance by the CMIM swap-
requesting country with any lending covenants to the CMIM Agreement.
AMRO is governed by an Executive Committee (EC) comprised of
deputy finance ministers and deputy central bank governors of member
countries. The EC oversees AMRO and is responsible for providing guid-
ance, setting broad policy direction for the management of AMRO, and
appointing the AMRO director and advisory panel members. An advisory
panel consisting of six members provides strategic, technical and profes-
sional guidance to AMRO. The panel is independent from the director
and staff of AMRO, and is accountable to the EC.
At present, AMRO is being run by a small complement of 12 profes-
sional staff, led by the AMRO director. There are plans to expand the
complement of professional staff initially to 16 in the near future. Since
its establishment in 2011, AMRO has initiated a secondment scheme,
and created linkages with international financial institutions and various
authorities in CMIM member countries. AMRO has also conducted a
number of surveillance visits in the region, and presented economic review
and policy dialogue reports at recent meetings of ASEAN+3 Finance and
Central Bank Deputies.
5.4 POST- CMIM DEVELOPMENTS
The ongoing uncertainty over the recovery in the US and the crisis in the
euro area have highlighted the need to further strengthen the CMIM’s
capacity to act as a regional financial safety net (Azis 2012). To address
this need, the 15th Meeting of ASEAN+3, held on the sidelines of the
Asian Development Bank (ADB)’s Annual Meeting in Manila in May
2012, agreed to do the following: (a) double the total size of the CMIM
from US$120 billion to US$240 billion; (b) increase the IMF de- linked
portion to 30 per cent in 2012 with a view to increasing it to 40 per cent
in 2014, subject to review should conditions warrant; and (c) introduce a
crisis prevention facility.
These three outcomes were the key decisions announced at this meeting.
Another change of an institutional nature that occurred there was the
upgrading of the AFMM+3 to the ASEAN+3 Finance Ministers and
Financial safety nets in Asia 91
Central Bank Governors’ Meeting (AFMGM+3). For the first time, the
central bank governors of the 13 member countries and the head of the
Monetary Authority of Hong Kong, China were invited to participate in
this forum. This was an important development in that it brought together
officials responsible for tax and expenditure programs with those han-
dling monetary and exchange rate policies. The crisis prevention facility
was introduced in response to calls for ex- ante liquidity support similar to
those of the IMF – the Flexible Credit Line (FCL) and the Precautionary
Credit Line (PCL) – introduced in the wake of the global financial crisis.1
As such, the CMIM will now have two separate instruments: a short-
term liquidity support facility to address sudden but temporary liquidity
shortages, and a crisis resolution facility to address more medium- term
liquidity and structural problems. The crisis prevention mechanism will be
called the CMIM Precautionary Line (CMIM- PL), while the crisis resolu-
tion mechanism will be called the CMIM Stability Facility (CMIM- SF).
To be able to access the CMIM- PL, the requesting country must meet the
following criteria as ex- ante qualifications and ex- post conditionality: (i)
external position and market access; (ii) fiscal policy; (iii) monetary policy;
(iv) financial sector soundness and supervision; and (v) data adequacy.2
The total amount that can be drawn by each member country, either
for prevention or resolution purposes, shall be within the maximum swap
amount set aside for that country. Dual- drawing from both CMIM- SF
and CMIM- PL shall be restricted, with the CMIM- SF replacing the
CMIM- PL if the recipient party is hit by a crisis and needs additional
support. For the CMIM- PL, the duration of access is six months with
three renewals, totaling two years in arrangement period. Maturity is
at six months for the IMF- de- linked portion and one year for the IMF-
linked portion. Monitoring will be conducted on a biannual basis. For
the CMIM- SF, the maturity of the IMF de- linked portion is set at six
months with three renewals allowed, totaling up to two years in support-
ing period. Maturity of the IMF- linked portion is set at one year with two
renewals possible, totaling up to three years in supporting period. As with
the CMIM- PL, monitoring is also to be conducted on a biannual basis.3
5.5 THE WAY FORWARD: FILLING IN THE REMAINING GAPS IN THE REGIONAL SAFETY NET
The agreements reached at the recently concluded 15th Meeting of ASEAN+3
Finance Ministers and Central Bank Governors represent a significant step
towards transforming the CMIM into a more formidable regional financial
92 New global economic architecture
safety net. This notwithstanding, the key question remains as to whether
these changes, however significant, are actually sufficient to make the
CMIM an option that members are likely to turn to in the event of a liquidity
crisis. And as of now, it only makes sense to think of the CMIM as catering
for a liquidity crisis, and not a fiscal one requiring a structural adjustment
program. So, the question is, have these changes made the CMIM useable
to counter a liquidity crisis? And if so, useable in what way? There are two
options. At the moment, the CMIM is set up to act as a co- financing mecha-
nism with the IMF. This is not to downplay its role but rather to recognize
that the bulk of its resources are tied to an IMF program. From Table 5.3,
which describes and compares the salient features of the other regional
financial mechanisms that exist around the world, we can see that most also
operate in a somewhat similar fashion. This is the first and current prospect.
The other option is for it to operate as an independent mechanism, serving as
an alternative to the IMF. It is worth noting that “alternative” in this context
does not necessarily mean excluding any role for the IMF, but rather one
where the CMIM plays the lead or dominant role.
Despite the significant changes made, it appears that the CMIM, as it
currently stands, can do neither. In its current configuration, it is unlikely
that the regional safety net will be called upon at all, as evidenced by the
fact that it has never been used despite the need for liquidity by several
members during the GFC. At the moment, it is neither a complement nor
an alternative to the IMF. We now examine what is required in terms of
operationalizing each of these two options.
For the CMIM to serve its immediate function as a complement to
the IMF, a number of issues relating to operating procedures need to be
resolved. Fixing these procedural problems is also necessary for making it
viable as an alternative to the IMF, but not sufficient. For it to evolve into
an alternative to the IMF some longer- term issues relating to size, mem-
bership and surveillance capacity need consideration as well.
5.6 CMIM AS A COMPLEMENT TO THE IMF
Irrespective of whether the CMIM is to be a complement or an alterna-
tive to the IMF, it needs to urgently address the speed and efficiency
with which requests for assistance can be activated. As noted earlier, a
request for emergency support could take up to two weeks to process.
There is also some uncertainty over the steps involved, precise informa-
tion to be provided and the like (Azis 2012). Part of the problem lies with
the fact that the CMIM is not a fund, but rather a reserve pooling system
whereby country contributions remain with the respective central banks
Financial safety nets in Asia 93
or monetary authority. The fact that the decision also rests with a high-
level, non- resident body further increases the risk of delay. The EC as the
decision- making body is after all comprised of deputy finance ministers
and deputy central bank governors of member countries.
The real competitor to the CMIM- IMF option is bilateral swaps, and
other similar standby arrangements. These are not only fast- disbursing
but also come without explicit conditionalities as they are adequately col-
lateralized, in most cases. Although the introduction of the CMIM- PL was
supposed to help improve the flexibility and timeliness of liquidity support
to address short- term liquidity problems, the procedural issues mentioned
earlier combined with its continued linkage to an IMF program may very
well undermine its actual usefulness. As noted earlier, countries have been
reluctant to apply for financing under the IMF’s own crisis prevention
facilities for fear of adverse signaling effects (Pickford 2011).
It has been suggested that linkage to a standard IMF program should
not be required in the case of temporary, short- term liquidity problems.
Sussangkarn (2011) argues that an IMF program should only be invoked
if a country needs to roll over the swap more than a certain predetermined
number of times, with the IMF joining the battle only if the problem
becomes a more medium- term structural problem. Under the CMIM’s
current arrangements, this would mean that the linkage would only apply
to financing under the CMIM- SF. By not invoking an IMF link immedi-
ately, countries with temporary liquidity problems will be more willing to
use the CMIM if they feel that the funds would be available without delay.
At the same time, knowing that an IMF link will be required after a certain
period will encourage the country to take appropriate corrective actions
to avoid having to be under an IMF program. This could go a long way
towards making the CMIM- IMF option viable as a liquidity support mech-
anism. But the largest contributors, Japan and the PRC, who are in essence
“creditors” because they can withdraw less than the amount they have put
in (multiplier of 0.5) must feel that their contributions are secure under such
an arrangement. With AMRO still in its infancy, it is likely that they will
continue to seek “cover” from IMF involvement to ensure that their funds
are safeguarded, even when used for short- term liquidity support.
5.7 CMIM AS AN ALTERNATIVE TO THE IMF
Next we turn to the viability of the CMIM as a stand- alone option, or one
without IMF involvement. At present, this applies only if a country avails
itself of up to 30 per cent of its quota. There are basically three outstanding
issues that need to be addressed in order to further strengthen the viability
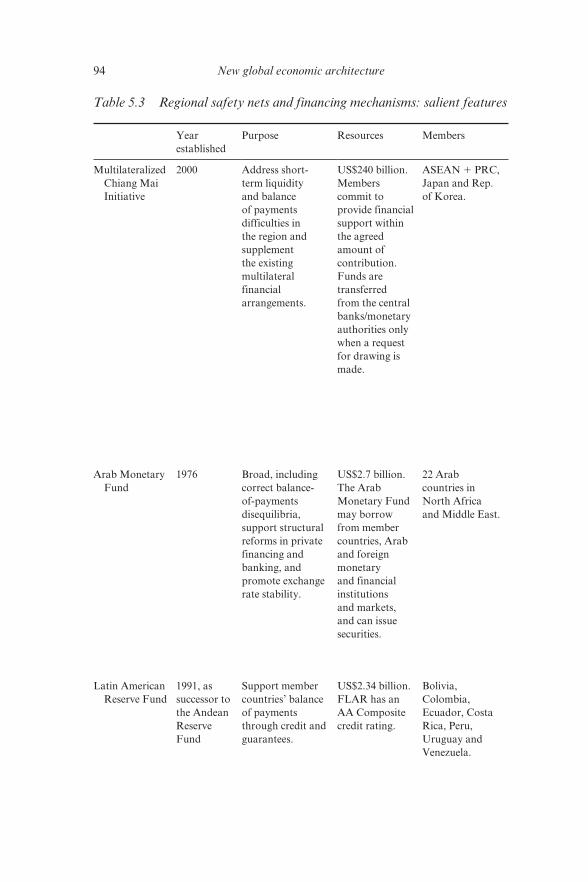
94 New global economic architecture
Table 5.3 Regional safety nets and financing mechanisms: salient features
Year
established
Purpose Resources Members
Multilateralized
Chiang Mai
Initiative
2000 Address short-
term liquidity
and balance
of payments
difficulties in
the region and
supplement
the existing
multilateral
financial
arrangements.
US$240 billion.
Members
commit to
provide financial
support within
the agreed
amount of
contribution.
Funds are
transferred
from the central
banks/monetary
authorities only
when a request
for drawing is
made.
ASEAN 1 PRC,
Japan and Rep.
of Korea.
Arab Monetary
Fund
1976 Broad, including
correct balance-
of- payments
disequilibria,
support structural
reforms in private
financing and
banking, and
promote exchange
rate stability.
US$2.7 billion.
The Arab
Monetary Fund
may borrow
from member
countries, Arab
and foreign
monetary
and financial
institutions
and markets,
and can issue
securities.
22 Arab
countries in
North Africa
and Middle East.
Latin American
Reserve Fund
1991, as
successor to
the Andean
Reserve
Fund
Support member
countries’ balance
of payments
through credit and
guarantees.
US$2.34 billion.
FLAR has an
AA Composite
credit rating.
Bolivia,
Colombia,
Ecuador, Costa
Rica, Peru,
Uruguay and
Venezuela.
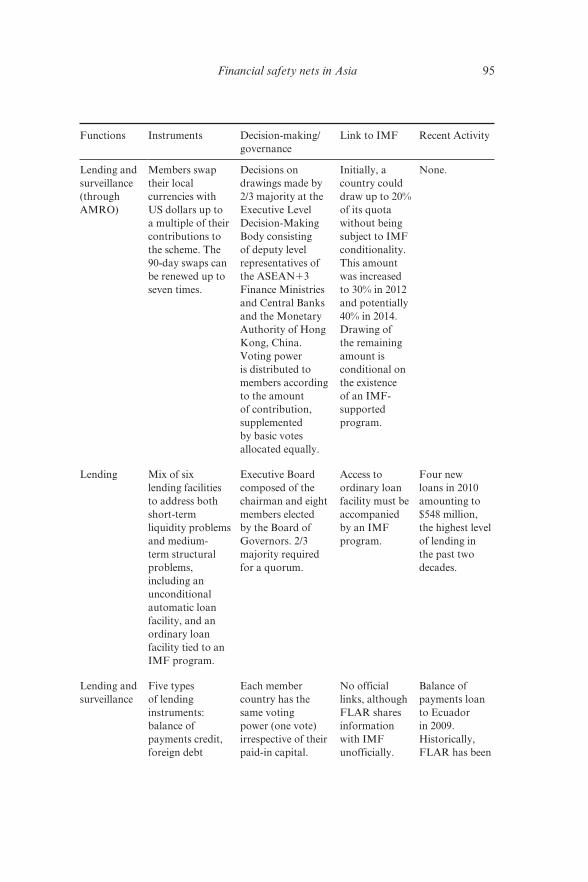
Financial safety nets in Asia 95
Functions Instruments Decision-making/
governance
Link to IMF Recent Activity
Lending and
surveillance
(through
AMRO)
Members swap
their local
currencies with
US dollars up to
a multiple of their
contributions to
the scheme. The
90- day swaps can
be renewed up to
seven times.
Decisions on
drawings made by
2/3 majority at the
Executive Level
Decision- Making
Body consisting
of deputy level
representatives of
the ASEAN13
Finance Ministries
and Central Banks
and the Monetary
Authority of Hong
Kong, China.
Voting power
is distributed to
members according
to the amount
of contribution,
supplemented
by basic votes
allocated equally.
Initially, a
country could
draw up to 20%
of its quota
without being
subject to IMF
conditionality.
This amount
was increased
to 30% in 2012
and potentially
40% in 2014.
Drawing of
the remaining
amount is
conditional on
the existence
of an IMF-
supported
program.
None.
Lending Mix of six
lending facilities
to address both
short- term
liquidity problems
and medium-
term structural
problems,
including an
unconditional
automatic loan
facility, and an
ordinary loan
facility tied to an
IMF program.
Executive Board
composed of the
chairman and eight
members elected
by the Board of
Governors. 2/3
majority required
for a quorum.
Access to
ordinary loan
facility must be
accompanied
by an IMF
program.
Four new
loans in 2010
amounting to
$548 million,
the highest level
of lending in
the past two
decades.
Lending and
surveillance
Five types
of lending
instruments:
balance of
payments credit,
foreign debt
Each member
country has the
same voting
power (one vote)
irrespective of their
paid- in capital.
No official
links, although
FLAR shares
information
with IMF
unofficially.
Balance of
payments loan
to Ecuador
in 2009.
Historically,
FLAR has been
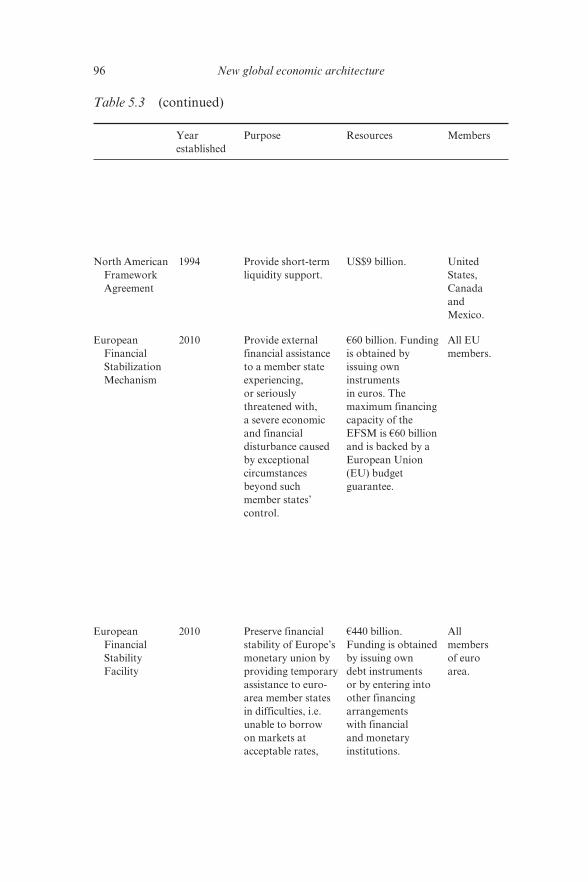
96 New global economic architecture
Table 5.3 (continued)
Year
established
Purpose Resources Members
North American
Framework
Agreement
1994 Provide short- term
liquidity support.
US$9 billion. United
States,
Canada
and
Mexico.
European
Financial
Stabilization
Mechanism
2010 Provide external
financial assistance
to a member state
experiencing,
or seriously
threatened with,
a severe economic
and financial
disturbance caused
by exceptional
circumstances
beyond such
member states’
control.
€60 billion. Funding
is obtained by
issuing own
instruments
in euros. The
maximum financing
capacity of the
EFSM is €60 billion
and is backed by a
European Union
(EU) budget
guarantee.
All EU
members.
European
Financial
Stability
Facility
2010 Preserve financial
stability of Europe’s
monetary union by
providing temporary
assistance to euro-
area member states
in difficulties, i.e.
unable to borrow
on markets at
acceptable rates,
€440 billion.
Funding is obtained
by issuing own
debt instruments
or by entering into
other financing
arrangements
with financial
and monetary
institutions.
All
members
of euro
area.
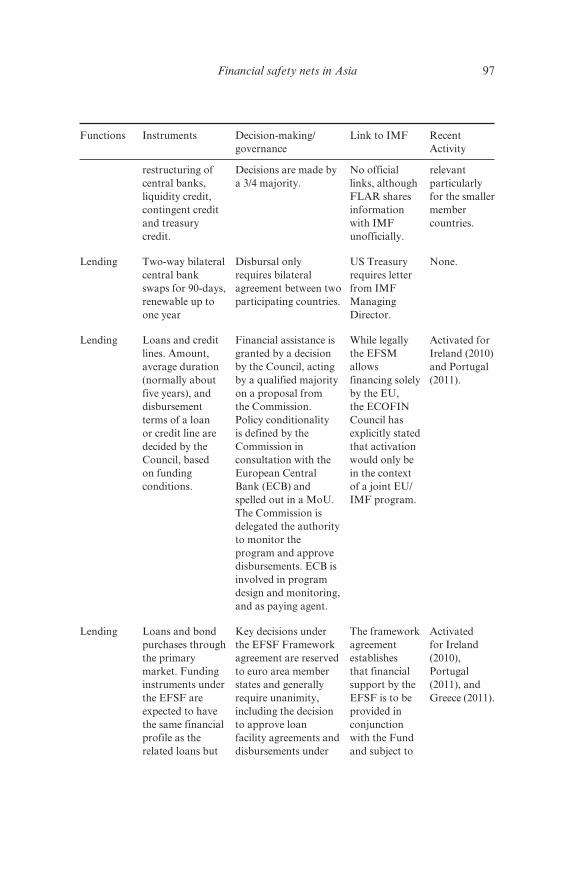
Financial safety nets in Asia 97
Functions Instruments Decision-making/
governance
Link to IMF Recent
Activity
restructuring of
central banks,
liquidity credit,
contingent credit
and treasury
credit.
Decisions are made by
a 3/4 majority.
No official
links, although
FLAR shares
information
with IMF
unofficially.
relevant
particularly
for the smaller
member
countries.
Lending Two- way bilateral
central bank
swaps for 90- days,
renewable up to
one year
Disbursal only
requires bilateral
agreement between two
participating countries.
US Treasury
requires letter
from IMF
Managing
Director.
None.
Lending Loans and credit
lines. Amount,
average duration
(normally about
five years), and
disbursement
terms of a loan
or credit line are
decided by the
Council, based
on funding
conditions.
Financial assistance is
granted by a decision
by the Council, acting
by a qualified majority
on a proposal from
the Commission.
Policy conditionality
is defined by the
Commission in
consultation with the
European Central
Bank (ECB) and
spelled out in a MoU.
The Commission is
delegated the authority
to monitor the
program and approve
disbursements. ECB is
involved in program
design and monitoring,
and as paying agent.
While legally
the EFSM
allows
financing solely
by the EU,
the ECOFIN
Council has
explicitly stated
that activation
would only be
in the context
of a joint EU/
IMF program.
Activated for
Ireland (2010)
and Portugal
(2011).
Lending Loans and bond
purchases through
the primary
market. Funding
instruments under
the EFSF are
expected to have
the same financial
profile as the
related loans but
Key decisions under
the EFSF Framework
agreement are reserved
to euro area member
states and generally
require unanimity,
including the decision
to approve loan
facility agreements and
disbursements under
The framework
agreement
establishes
that financial
support by the
EFSF is to be
provided in
conjunction
with the Fund
and subject to
Activated
for Ireland
(2010),
Portugal
(2011), and
Greece (2011).
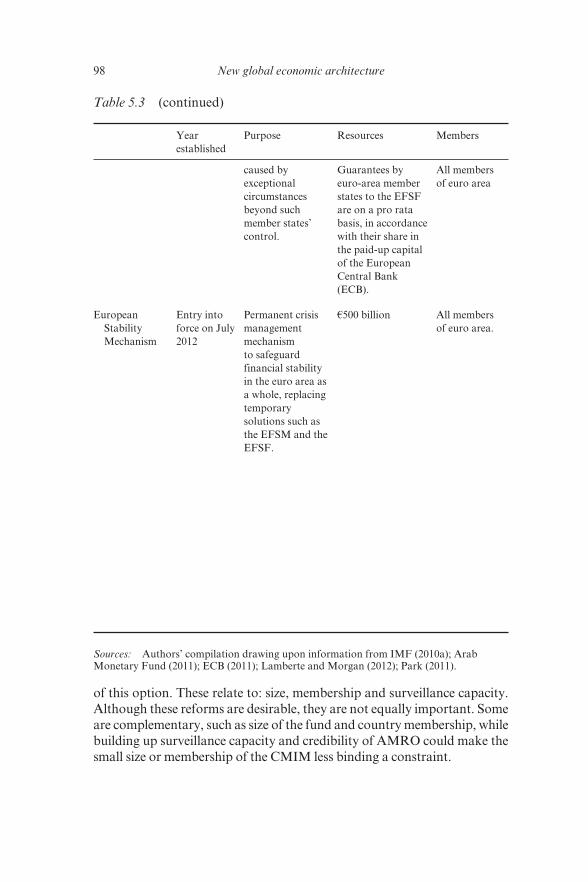
98 New global economic architecture
of this option. These relate to: size, membership and surveillance capacity.
Although these reforms are desirable, they are not equally important. Some
are complementary, such as size of the fund and country membership, while
building up surveillance capacity and credibility of AMRO could make the
small size or membership of the CMIM less binding a constraint.
Table 5.3 (continued)
Year
established
Purpose Resources Members
caused by
exceptional
circumstances
beyond such
member states’
control.
Guarantees by
euro- area member
states to the EFSF
are on a pro rata
basis, in accordance
with their share in
the paid- up capital
of the European
Central Bank
(ECB).
All members
of euro area
European
Stability
Mechanism
Entry into
force on July
2012
Permanent crisis
management
mechanism
to safeguard
financial stability
in the euro area as
a whole, replacing
temporary
solutions such as
the EFSM and the
EFSF.
€500 billion All members
of euro area.
Sources: Authors’ compilation drawing upon information from IMF (2010a); Arab
Monetary Fund (2011); ECB (2011); Lamberte and Morgan (2012); Park (2011).
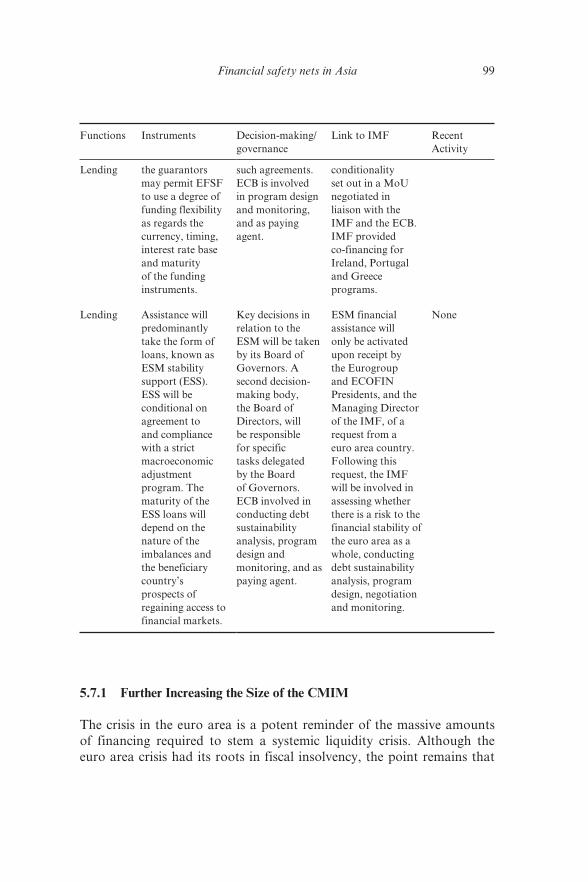
Financial safety nets in Asia 99
5.7.1 Further Increasing the Size of the CMIM
The crisis in the euro area is a potent reminder of the massive amounts
of financing required to stem a systemic liquidity crisis. Although the
euro area crisis had its roots in fiscal insolvency, the point remains that
Functions Instruments Decision-making/
governance
Link to IMF Recent
Activity
Lending the guarantors
may permit EFSF
to use a degree of
funding flexibility
as regards the
currency, timing,
interest rate base
and maturity
of the funding
instruments.
such agreements.
ECB is involved
in program design
and monitoring,
and as paying
agent.
conditionality
set out in a MoU
negotiated in
liaison with the
IMF and the ECB.
IMF provided
co- financing for
Ireland, Portugal
and Greece
programs.
Lending Assistance will
predominantly
take the form of
loans, known as
ESM stability
support (ESS).
ESS will be
conditional on
agreement to
and compliance
with a strict
macroeconomic
adjustment
program. The
maturity of the
ESS loans will
depend on the
nature of the
imbalances and
the beneficiary
country’s
prospects of
regaining access to
financial markets.
Key decisions in
relation to the
ESM will be taken
by its Board of
Governors. A
second decision-
making body,
the Board of
Directors, will
be responsible
for specific
tasks delegated
by the Board
of Governors.
ECB involved in
conducting debt
sustainability
analysis, program
design and
monitoring, and as
paying agent.
ESM financial
assistance will
only be activated
upon receipt by
the Eurogroup
and ECOFIN
Presidents, and the
Managing Director
of the IMF, of a
request from a
euro area country.
Following this
request, the IMF
will be involved in
assessing whether
there is a risk to the
financial stability of
the euro area as a
whole, conducting
debt sustainability
analysis, program
design, negotiation
and monitoring.
None
100 New global economic architecture
the sums involved in a bailout for any kind of crisis that spreads across
regional countries is likely to be massive. Although the CMIM’s size
has been increased substantially since 2008 to currently stand at US$240
billion, it is unlikely to be sufficient if there is a full- blown systemic crisis
in East Asia, especially if it spreads across several members. During the
AFC, Thailand received over US$17 billion in emergency liquidity. Yet
Thailand (and the other original ASEAN members) can access only a
fraction of this amount, about US$7 billion in today’s dollars, from the
CMIM without an IMF program. Indonesia received almost six times
(US$40 billion) of what is its de- linked portion of the CMIM, or an even
greater multiple if converted into today’s dollars. The Republic of Korea
was the other crisis- hit country that availed itself of an IMF- led program
that totaled US$57 billion, when today its full quota with the CMIM is
about US$38 billion.
For the CMIM to be a viable stand- alone option, either the size of
the overall fund or the percentage of the de- linked portion needs to be
increased substantially before it is attractive to the original ASEAN5
members. These countries have bilateral swaps that they are more likely
to call upon should a crisis hit, as recent experience has shown. From
Table 5.4, we can see that the Philippines has bilateral swaps with the
PRC, Japan and the Republic of Korea; Indonesia has them with the PRC
and Japan; while Singapore, Thailand and Malaysia each have swaps
with the PRC. These are the ones that are currently in force, but others
are up for renegotiation, as listed in Table 5.5. If national reserves are the
first line of defense in the event of a liquidity crisis, bilateral swaps are
designed to supplement them. But these bilateral swaps themselves might
be insurance against a regional insurance scheme like the CMIM when it
is perceived to be unusable.
It is apparent that the CMIM was never intended for use by the Republic
of Korea or its two other biggest contributors, the PRC and Japan. This
point has been reinforced by the bilateral swaps between these three coun-
tries announced virtually in tandem with the doubling of the Initiative.
The Plus Three countries have also agreed to promote investment by the
foreign reserve authorities in one another’s government bonds.
So if the CMIM was never intended for use by its largest contributors,
and if country quotas of the original five ASEAN countries are insufficient
when judged by the experience of the AFC, could the CMIM be used by
ASEAN’s newer, smaller members? After all, for these countries, their full
quotas are a quite substantial share of their individual reserves (Table 5.6).
Nevertheless, they may still be insufficient for a bailout. For example,
Cambodia’s contribution of US$240 million enables it to borrow up to
five times that amount but only US$360 million if it wants to avoid signing
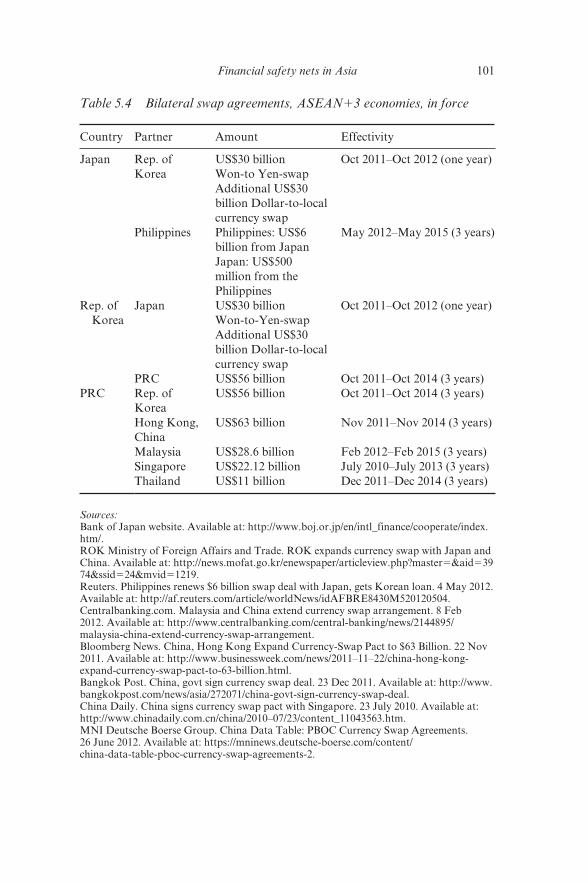
Financial safety nets in Asia 101
Table 5.4 Bilateral swap agreements, ASEAN13 economies, in force
Country Partner Amount Effectivity
Japan Rep. of
Korea
US$30 billion
Won- to Yen- swap
Additional US$30
billion Dollar- to- local
currency swap
Oct 2011–Oct 2012 (one year)
Philippines Philippines: US$6
billion from Japan
Japan: US$500
million from the
Philippines
May 2012–May 2015 (3 years)
Rep. of
Korea
Japan US$30 billion
Won- to- Yen- swap
Additional US$30
billion Dollar- to- local
currency swap
Oct 2011–Oct 2012 (one year)
PRC US$56 billion Oct 2011–Oct 2014 (3 years)
PRC Rep. of
Korea
US$56 billion Oct 2011–Oct 2014 (3 years)
Hong Kong,
China
US$63 billion Nov 2011–Nov 2014 (3 years)
Malaysia US$28.6 billion Feb 2012–Feb 2015 (3 years)
Singapore US$22.12 billion July 2010–July 2013 (3 years)
Thailand US$11 billion Dec 2011–Dec 2014 (3 years)
Sources:
Bank of Japan website. Available at: http://www.boj.or.jp/en/intl_finance/cooperate/index.
htm/.
ROK Ministry of Foreign Affairs and Trade. ROK expands currency swap with Japan and
China. Available at: http://news.mofat.go.kr/enewspaper/articleview.php?master5&aid539
74&ssid524&mvid51219.
Reuters. Philippines renews $6 billion swap deal with Japan, gets Korean loan. 4 May 2012.
Available at: http://af.reuters.com/article/worldNews/idAFBRE8430M520120504.
Centralbanking.com. Malaysia and China extend currency swap arrangement. 8 Feb
2012. Available at: http://www.centralbanking.com/central- banking/news/2144895/
malaysia- china- extend- currency- swap- arrangement.
Bloomberg News. China, Hong Kong Expand Currency- Swap Pact to $63 Billion. 22 Nov
2011. Available at: http://www.businessweek.com/news/2011–11–22/china- hong- kong-
expand- currency- swap- pact- to- 63- billion.html.
Bangkok Post. China, govt sign currency swap deal. 23 Dec 2011. Available at: http://www.
bangkokpost.com/news/asia/272071/china- govt- sign- currency- swap- deal.
China Daily. China signs currency swap pact with Singapore. 23 July 2010. Available at:
http://www.chinadaily.com.cn/china/2010–07/23/content_11043563.htm.
MNI Deutsche Boerse Group. China Data Table: PBOC Currency Swap Agreements.
26 June 2012. Available at: https://mninews.deutsche- boerse.com/content/
china- data- table- pboc- currency- swap- agreements- 2.
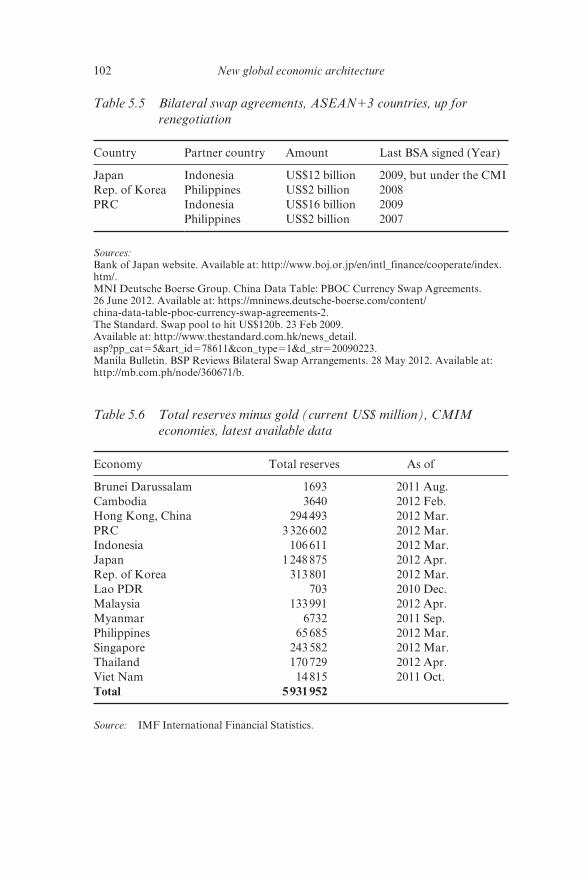
102 New global economic architecture
Table 5.5 Bilateral swap agreements, ASEAN13 countries, up for
renegotiation
Country Partner country Amount Last BSA signed (Year)
Japan Indonesia US$12 billion 2009, but under the CMI
Rep. of Korea Philippines US$2 billion 2008
PRC Indonesia US$16 billion 2009
Philippines US$2 billion 2007
Sources:
Bank of Japan website. Available at: http://www.boj.or.jp/en/intl_finance/cooperate/index.
htm/.
MNI Deutsche Boerse Group. China Data Table: PBOC Currency Swap Agreements.
26 June 2012. Available at: https://mninews.deutsche- boerse.com/content/
china- data- table- pboc- currency- swap- agreements- 2.
The Standard. Swap pool to hit US$120b. 23 Feb 2009.
Available at: http://www.thestandard.com.hk/news_detail.
asp?pp_cat55&art_id578611&con_type51&d_str520090223.
Manila Bulletin. BSP Reviews Bilateral Swap Arrangements. 28 May 2012. Available at:
http://mb.com.ph/node/360671/b.
Table 5.6 Total reserves minus gold (current US$ million), CMIM
economies, latest available data
Economy Total reserves As of
Brunei Darussalam 1693 2011 Aug.
Cambodia 3640 2012 Feb.
Hong Kong, China 294 493 2012 Mar.
PRC 3 326 602 2012 Mar.
Indonesia 106 611 2012 Mar.
Japan 1 248 875 2012 Apr.
Rep. of Korea 313 801 2012 Mar.
Lao PDR 703 2010 Dec.
Malaysia 133 991 2012 Apr.
Myanmar 6732 2011 Sep.
Philippines 65 685 2012 Mar.
Singapore 243 582 2012 Mar.
Thailand 170 729 2012 Apr.
Viet Nam 14 815 2011 Oct.
Total 5 931 952
Source: IMF International Financial Statistics.
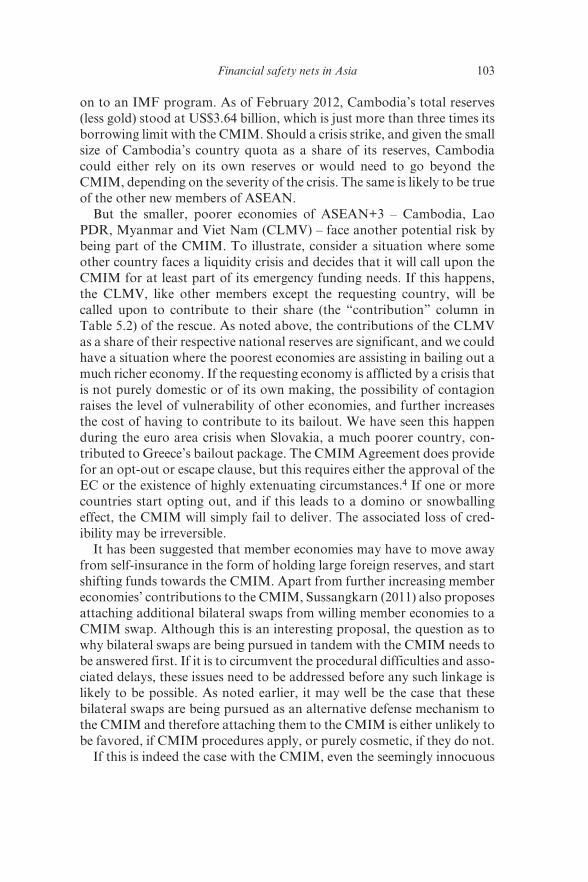
Financial safety nets in Asia 103
on to an IMF program. As of February 2012, Cambodia’s total reserves
(less gold) stood at US$3.64 billion, which is just more than three times its
borrowing limit with the CMIM. Should a crisis strike, and given the small
size of Cambodia’s country quota as a share of its reserves, Cambodia
could either rely on its own reserves or would need to go beyond the
CMIM, depending on the severity of the crisis. The same is likely to be true
of the other new members of ASEAN.
But the smaller, poorer economies of ASEAN+3 – Cambodia, Lao
PDR, Myanmar and Viet Nam (CLMV) – face another potential risk by
being part of the CMIM. To illustrate, consider a situation where some
other country faces a liquidity crisis and decides that it will call upon the
CMIM for at least part of its emergency funding needs. If this happens,
the CLMV, like other members except the requesting country, will be
called upon to contribute to their share (the “contribution” column in
Table 5.2) of the rescue. As noted above, the contributions of the CLMV
as a share of their respective national reserves are significant, and we could
have a situation where the poorest economies are assisting in bailing out a
much richer economy. If the requesting economy is afflicted by a crisis that
is not purely domestic or of its own making, the possibility of contagion
raises the level of vulnerability of other economies, and further increases
the cost of having to contribute to its bailout. We have seen this happen
during the euro area crisis when Slovakia, a much poorer country, con-
tributed to Greece’s bailout package. The CMIM Agreement does provide
for an opt- out or escape clause, but this requires either the approval of the
EC or the existence of highly extenuating circumstances.4 If one or more
countries start opting out, and if this leads to a domino or snowballing
effect, the CMIM will simply fail to deliver. The associated loss of cred-
ibility may be irreversible.
It has been suggested that member economies may have to move away
from self- insurance in the form of holding large foreign reserves, and start
shifting funds towards the CMIM. Apart from further increasing member
economies’ contributions to the CMIM, Sussangkarn (2011) also proposes
attaching additional bilateral swaps from willing member economies to a
CMIM swap. Although this is an interesting proposal, the question as to
why bilateral swaps are being pursued in tandem with the CMIM needs to
be answered first. If it is to circumvent the procedural difficulties and asso-
ciated delays, these issues need to be addressed before any such linkage is
likely to be possible. As noted earlier, it may well be the case that these
bilateral swaps are being pursued as an alternative defense mechanism to
the CMIM and therefore attaching them to the CMIM is either unlikely to
be favored, if CMIM procedures apply, or purely cosmetic, if they do not.
If this is indeed the case with the CMIM, even the seemingly innocuous
104 New global economic architecture
statement by Takehiko Nakao, Japan’s Vice Finance Minister for
International Affairs, that “having this kind of mechanism is better than
having nothing”, may have been more than just generous, but also pos-
sibly wrong.5 If the CMIM is unusable for one or more members, it can
actually reduce the capacity of these members to stave off a liquidity crisis
by reducing their uncommitted national reserves – an economy’s first line
of defense. How can an unusable CMIM increase the vulnerability of
members to crisis? Consider what happened during the GFC – Indonesia,
the Republic of Korea and Singapore were forced to pursue bilateral
swaps when capital started rapidly exiting their economies. The fact that
they had to pursue this option itself suggests that national reserves were
considered “insufficient”: “insufficient” in the sense that a country would
not want to completely or even severely deplete its reserves in times of
a crisis whose full magnitude is still unknown. In times of potential or
impending crisis, perceptions matter even more – a view underlined by the
fact that bilateral swaps are often negotiated before, rather than during
or after, a liquidity shortfall. At the margin, however, it could be that the
commitment that a country without plentiful reserves such as Indonesia,
for instance, had made to the CMIM could have made the difference
in terms of such perceptions of sufficiency. The problem only grows in
magnitude as the CMIM is expanded in size but continues to be unusable,
for whatever reason. But the effects will vary by economy, depending on
how abundant their reserves are to begin with; again, the smaller, poorer
economies will be most at risk, while the bigger, richer ones will be least
affected.
Members also cannot operate by ignoring the amount of their reserves
committed or promised to the CMIM, or the system will break down. For
instance, consider again the case of the CLMV. Since these are economies
without the ability to secure a bilateral swap given the low collateral value
of their domestically- issued currencies, they may have to resort to the
CMIM (and/or IMF) in times of crisis. If other members are also fearing
or fighting their own liquidity crises, and therefore ignore their commit-
ment, there is a real possibility that the CMIM may not be able to deliver
on one or more requests from the CLMV. As with a domino effect with
opt- out requests, this too would mark the end of the CMIM, both in
theory and in practice.
It also remains to be seen whether the recent increase in bilateral cur-
rency swap arrangements among the Plus Three countries will be extended
to other CMIM members to bolster existing swap lines with these coun-
tries. And even if they did, it is unclear if the Plus Three countries would
be amenable to managing these bilateral swaps under the same conditions
as the CMIM swap, unless of course they did not want them to be used.
Financial safety nets in Asia 105
The IMF has already raised the possibility of establishing a Multi-
Country Swap Line (MSL) mechanism that would enable it to offer liquid-
ity lines to a limited set of countries with sound policies and track records
(IMF 2010b). This would form part of a broader Global Stabilization
Mechanism (GSM), a framework that would allow proactive provision of
financing during a systemic crisis to stem contagion. The GSM also envi-
sions a multipolar liquidity safety network, involving national monetary
authorities and regional RFMs, with the IMF at the center. The establish-
ment of such a mechanism, and its involvement with the CMIM, would
provide more avenues for increasing the size of liquidity support available
to the region beyond the CMIM pool. Even this option for expansion,
however, is contingent on the CMIM cleaning up and streamlining its
operational procedures.
5.7.2 Expanding Membership of the CMIM
If the CMIM is to become a stand- alone option, or if it is to evolve into
an Asian Monetary Fund type institution someday, then the issue of
membership needs to be considered. Expanding the membership of the
CMIM has less to do with potentially increasing the size of the fund than
it does with diversifying it. More than just increasing membership, there
is a need to broaden it to include economies that are less directly or imme-
diately connected to East Asian business cycles. This would increase the
ability of the fund to cater for the liquidity needs of a clutch of countries
requiring support in the event of a contagious crisis if a sufficient number
of contributors are unaffected by it. There is no denying that the process
of trying to expand membership is likely to be a complicated and sensitive
one. But, however difficult, the discussion needs to be started if the CMIM
is to survive and prosper as a viable financial safety net, let alone evolve
into a de facto Asian Monetary Fund.
The obvious candidates for the first enlargement would be those origi-
nally joining ASEAN+3 in the East Asian Summit: Australia, New Zealand
and India. India already has a bilateral swap with Japan, while Australia is
a contributor to the recent standby arrangement with Indonesia, managed
by ADB. Although this expansion makes sense regionally, it is unlikely to
diversify the fund to any significant extent given that Australia’s economic
fortunes are very closely linked to the PRC’s, and India’s are increasingly
becoming so. Even New Zealand’s economic fortunes are indirectly linked
through its strong ties to Australia and growing ties with the PRC. But
the larger the number of contributing members, the greater the likelihood
that some will be largely immune from a contagious regional crisis. This is
perhaps best illustrated by the fact that Australia was the only advanced
106 New global economic architecture
country that did not undergo a recession when the GFC hit. Like any risk
diversification exercise, the number usually matters.
Candidates for any subsequent enlargement are less obvious, although
it is quite unlikely that either the US or the Russian Federation, the newest
members of the ASEAN+8 grouping, are likely to want to participate.
Should Timor- Leste accede to ASEAN, this small island state will almost
certainly also sign up for most of ASEAN’s protocols, including presum-
ably the CMIM. Should India join the CMIM, the possibility of other
South Asian nations joining will also be significantly enhanced. There
could be a snowballing effect following initial enlargement of membership
of the CMIM.
5.7.3 Strengthening AMRO’s Credibility
Although these reforms are desirable, they are not equally important. If
AMRO could gain credibility as an independent surveillance unit, the
small size or membership of the CMIM would be less binding constraints.
After all, even the IMF relied upon other partners to fund the bail- out in
Asia in 1997–98 and now Europe. But the IMF led the rescue and set the
terms in Asia, and this is what matters. AMRO needs to be able to do the
same. In short, the amount of funds available need not be a constraint if
the capacity to lead a rescue exists; in fact, even if the funds were sufficient,
they may be of merit in a joint rescue program involving collaboration
amongst other regional and/or non- regional partners. In this respect, it is
also worth emphasizing that leading a rescue does not entail excluding the
IMF, for instance, from participating in setting the terms either; it means
having the final say, but not the only say.
Ultimately, the CMIM must rely more on its own independent assess-
ment to make lending decisions – including both in the amount of loans
and any conditionality. At present, AMRO still lacks the research capac-
ity, human resources, experience and the institutional set- up to serve effec-
tively as a professional secretariat to the CMIM. Although AMRO has
come a long way as a relatively new institution, it still functions mostly as
a research office for the CMIM, and undertakes a basic surveillance func-
tion producing macroeconomic and financial monitoring assessments.
The current ERPD process6 at which these assessments are presented is
still largely a venue for information- sharing at best, and a beauty contest
at worst, with weak peer review or policy coordination (Menon 2012).
Unless there is a commitment from member countries to significantly
increase the resourcing of AMRO so that it may strengthen and expand
its functions, it is unlikely that it will be able to perform its role as an
Financial safety nets in Asia 107
independent and credible surveillance unit, let alone a full functioning
secretariat for the CMIM.
Although the Joint Statement of the 15th AFMM re- emphasized the
importance of strengthening AMRO’s role as an “independent regional
surveillance unit in contributing to effective monitoring and analysis
of regional economies, early detection of risks, swift implementation of
remedial actions, and effective decision- making of the CMIM”, they could
propose little more than further collaboration and cooperation with the
IMF, ADB and World Bank. Although they asked the deputies to find
out how AMRO’s organizational capacity could be strengthened by the
November 2012 deputies’ meeting, the fact that they never even alluded to
the possibility of any increase in funding is telling.
If these are the things that the CMIM and AMRO need to do in order
to become effective, there is also at least one thing that it should not do
in order to achieve the same. It should avoid the temptation to give in
to mission creep and focus on core functions, particularly surveillance
activities. For instance, recent suggestions that AMRO should introduce
a Regional Monetary Unit (Kawai 2010; Rana et al. 2012) are premature
and could derail the building of core competencies. There is room for spe-
cialization and collaboration, and more specialized functions such as these
should be left to other institutions.
Although the CMIM was established with the aim of supplementing
existing international financial arrangements, ultimately its goal should
be to be able to lead any rescue package in the region. As Henning (2011)
and ADB (2011) correctly note, the IMF is still unique among crisis-
fighting facilities in the universality and diversity of its membership, its
resources and its experience with designing rescue packages, and remains
the final resort in efforts to combat regional contagion. In its current
incarnation, it also seems unlikely that the CMIM alone will be adequate
to address region- wide systemic financial crises. An optimistic scenario
would see the CMIM evolve towards a regime in which the roles are
reversed over time, with the CMIM defining conditionality and the IMF
being a complementary source of funds. If this optimism is to be justi-
fied, then ASEAN+3 must commit to AMRO’s development through a
substantial increase in its resources. So far, there is little evidence of any
such real commitment.
5.8 CONCLUSIONS
Financial safety nets in Asia take four forms. The first line of defense has
always been national holdings of foreign exchange reserves. The second,
108 New global economic architecture
and most popular of late, is bilateral foreign currency swap arrange-
ments. The third is regional safety nets, and the one most discussed in
this chapter is the expanded CMIM. Finally, we have the global lender
of last resort, the International Monetary Fund (IMF). The importance
of strengthening regional financial safety nets grew from the Asian
Financial Crisis (AFC) of 1997–98. When the AFC struck, the ASEAN
Swap Arrangement (ASA) was basically too small (US$200 million) to
be of any use. There was no alternative but to turn to the IMF for the
massive bailouts required. The IMF grew extremely unpopular, however,
not just for the prescribed bitter medicine, but because it misdiagnosed the
problems – a fact that it later acknowledged. There was a resurgence of
nationalist sentiment that quickly grew regional.
This led to the birth of the Chiang Mai Initiative (CMI) in 2000, which
expanded the bilateral swaps of the ASA both in size and membership
to include the PRC, Japan and the Republic of Korea. The CMI’s first
test came in September 2008 when, following the Lehman Brothers’ col-
lapse, short- term capital quickly exited emerging economies. But when
the Global Financial Crisis (GFC) hit, members of the CMI that required
liquidity support did not turn to it but instead rushed to secure bilateral
swaps with the US, the PRC, Japan, Australia and the multilaterals.
Once again, the regional financial safety net had failed its members. This
brought about another significant change when in 2009 the CMI was
multilateralized to become the CMIM, with the many swap lines now gov-
erned by a single agreement.
More recently, the CMIM has been doubled to US$240 billion, the
share available without an IMF program increased to 30 per cent (and
maybe 40 per cent in 2014), and the introduction of a precautionary line
of credit similar to that of the IMF. Its surveillance unit, the ASEAN+3
Macroeconomic Research Office (AMRO), has also been up and running
in Singapore since 2011. All of this is impressive, and does reflect how far
financial safety nets in Asia have come, but is it enough? Is it likely that
the CMIM will be called upon when the next crisis strikes? Unfortunately,
the CMIM still appears unusable, either as a co- financing facility with the
IMF or as a stand- alone alternative. There are a number of reasons, and
therefore an equal number of issues, that need to be addressed to make it
viable.
First, as a reserve- pooling arrangement, there is no fund but a series of
promises; this is not a problem per se but it is when there are no rapid-
response procedures to handle a fast- developing financial emergency.
Unless these procedures are streamlined, the CMIM is unlikely to be
called upon even as a co- financing facility when bilateral swaps or even
the IMF may be able to deliver the needed liquidity in the required time.
Financial safety nets in Asia 109
If the CMIM is to be a real substitute for the IMF and serve its role
as a true regional alternative, then the size of the fund, or the portion
de- linked from an IMF program, also needs to be increased substantially.
Membership would also need to increase beyond ASEAN+3, not just to
bolster the size of the fund, but to diversify it. But if AMRO could gain
sufficient credibility, then the small size or membership of the CMIM
would be less binding constraints. After all, even the IMF relied upon
other partners to fund the bailout in Asia in 1997–98. But the IMF led the
rescue and set the terms, and this is what matters. AMRO needs to be able
to do the same.
Without these changes, and still wary of the IMF stigma, ASEAN+3
is unlikely to turn to the CMIM as a co- financier or a substitute – which
explains why countries continue to take the high- cost mercantilist
route of self- insurance through excessive holdings of foreign exchange
reserves, or why they continue to pursue bilateral swaps separately, often
with other CMIM members. In fact, bilateral swaps are quickly becom-
ing the main instrument in Asia’s financial safety net. Furthermore,
shifting national reserves to a regional fund that is unlikely to be used
could actually be counter- productive as it weakens a country’s first line
of defense. Although ASEAN+3 may appear to have a co- financing
facility with the IMF in the CMIM, it is not a useable one. If it wants
its own regional safety net, it has a long way to go. How long is still
unclear, but hopefully it can be made workable before, rather than
because of, the next crisis.
NOTES
* We are grateful to Charles Adams and Chia Wai Mun for written comments, and to
Anna Cassandra Melendez for excellent research assistance. Parts of this paper draw
upon Hill and Menon (2014). Any remaining errors are our own.
1. The ASEAN+3 Finance Ministers had commented on the desirability of such a facility
even at their 2011 Hanoi meeting, noting that “we instructed the Deputies to initiate a
study on the design of a possible crisis prevention function for CMIM, including the size,
further collaboration with the IMF, and the role of AMRO”.
2. The Joint Statement of the 15th ASEAN+3 Finance Ministers and Central Bank
Governors’ Meeting (2012).
3. Ibid.
4. The escape clause states: “In principle, each of the CMIM parties may only escape from
contributing to a swap request by obtaining an approval of the Executive Level Decision
Making Body. In exceptional cases such as an extraordinary event or instance of force
majeure and domestic legal limitations, escape is possible without obtaining ELDMB
approval.”
5. Quoted in Anthony Rowley, Sid Verma and Mark Townsend (2012), “New fund
seen as Asia’s own IMF”, Emerging Markets, 4 May. Available at: http://www.emerg
110 New global economic architecture
ingmarkets.org/Article/3023530/New- fund- seen- as- Asias- own- IMF.html?LS=EMS64
8101.
6. The ERPD is carried out in two stages. The first stage is an unofficial forum where
surveillance reports (from AMRO, ADB and IMF) are presented to the AFDM+3 held
biannually in March or April and November. The second stage focuses more on issues
related to policy involving the AFMM+3, and is conducted once a year on the sidelines
of the ADB Annual Meeting.
REFERENCES
Arab Monetary Fund. 2011. Arab Monetary Fund Annual Report, 2010. Available at: http://www.amf.org.ae/annualrep.
ASEAN Secretariat. 2010. Financial Integration Factsheet.ASEAN+3 Macroeconomic Research Office (AMRO). 2012. Key points of
CMI Multilateralization Agreement. Available at: http://www.amro- asia.org/wp- content/uploads/2011/12/Key- Points- of- CMIM.pdf.
Asian Development Bank (ADB). 2011. Reshaping Global Economic Governance and the Role of Asia in the Group of Twenty (G20). Manila: ADB.
Azis, I. 2012. Asian regional financial safety nets? Don’t hold your breath. Public Policy Review 8(330) (July): 357–76. Policy Research Institute. Ministry of Finance. Japan.
Bangko Sentral ng Pilipinas (BSP). 2012. Chiang Mai Initiative Multilateralization FAQ.
ECB. 2011. The European Stability Mechanism. ECB Monthly Bulletin. July. Available at: http://www.ecb.int/pub/pdf/other/art2_mb201107en_pp71–84en.pdf.
Henning, R.C. 2004. East Asian Financial Cooperation. Washington, DC: Institute for International Economics.
Henning, R.C. 2011. Coordinating regional and multilateral financial institu-tions. Working Paper No. WP11–9. Washington, DC: Peterson Institute for International Economics. Paper commissioned by ADB through Research and Development Technical Assistance Project 7501, Asia’s Strategic Participation in the Group of Twenty for Global Economic Governance Reform, Available at: http://www.www.piie.com/publications/wp/wp11–9.pdf
Hill, H. and J. Menon. 2014. Does East Asia have a working financial safety net? Asian Economic Journal 28(1): 1–17.
International Monetary Fund (IMF). 2010a. Seminar on Regional Financial Safety Nets: Background Information on Participating RFAs. 8 October.
International Monetary Fund. 2010b. The fund’s mandate: Future financing role. Public Information Notice (PIN) No. 10/51. 22 April. Available at: http://www.imf.org/external/np/sec/pn/2010/pn1051.htm.
Kawai, M. 2010. Reform of the international financial architecture: An Asian perspective. Singapore Economic Review 53: 207–92.
Lamberte, M. and P. Morgan. 2012. Regional and global monetary cooperation. ADBI Working Paper No. 346. Tokyo: ADBI.
Menon, J. 2012. Regional and global financial safety nets. Presentation to the Conference on The Evolving Global Architecture: From a Centralized to a Decentralized System, Nanyang Technological University and ADB Institute, Singapore, 26–27 March.
Financial safety nets in Asia 111
Park, S. 2011. Global financial safety net and regional financial arrangement: IMF cooperation. Korea Institute of Finance Weekly Economic Review 20: 30.
Pickford, S. 2011. Global financial safety nets. Chatham House International Economics Briefing Paper. October 2011. Available at: http://www. chathamhouse.org/sites/default/files/public/Research/International%20Econom ics/1011bp_pickford.pdf.
Rana, P.B., W.M. Chia and Y. Jinjarak. 2012. ASEAN+3 monetary integration: Perception survey of opinion leaders. Journal of Asian Economics 23: 1–12.
Sussangkarn, C. 2011. Institution building for macroeconomic and financial cooperation in East Asia. Available at: http://www.amro- asia.org/wp- content/uploads/2011/11/CS- CMIM- AMRO.pdf.
The Joint Statement of the 15th ASEAN+3 Finance Ministers and Central Bank Governors’ Meeting. 2012. 3 May. Manila, Philippines.
112
6. Regional financial regulation in Asia
Masahiro Kawai and Peter J. Morgan
6.1 INTRODUCTION
This chapter examines the potential roles and institutional implementa-
tion of regional financial regulation in Asia. National- level financial sur-
veillance and regulation continue to be the workhorse and the first line of
action for preserving financial stability. Under the auspices of the Group
of Twenty (G20) following the global financial crisis of 2007–09, there has
been an attempt to forge a global consensus on financial reform measures
based on proposals made by the Financial Stability Board (FSB) and to
strengthen the role of the International Monetary Fund (IMF) both as a
surveillance unit and as a global financial safety net. In this chapter we
argue that there is a mediating role for regional- level institutions of finan-
cial regulation in Asia. This role includes: (i) monitoring financial markets
and capital flows to identify regional systemic risks such as capital flows;
(ii) coordinating financial sector surveillance and regulation to promote
regional financial stability; and (iii) cooperating with global- level institu-
tions in rule formulation, surveillance and crisis management.
The Asian Financial Crisis of 1997–98 highlighted the potential value of
financial regionalism, that is, regional- level cooperation in economic and
financial policy. Many economies in the region found themselves subject
to similar shocks and contagion, leading to volatile capital movements and
the risk of “sudden stops” and reversals of capital flows. The move of the
Association of Southeast Asian Nations (ASEAN) member states toward
economic and financial integration, known as the ASEAN Economic
Community (AEC) is one manifestation of this.1 Another important
development was the creation of the Chiang Mai Initiative (CMI) in 2000
as a regional financial safety net based on bilateral currency swap arrange-
ments, which was eventually transformed into a multilateralized form: the
Chiang Mai Initiative Multilateralization (CMIM). The Economic Review
and Policy Dialogue (ERPD), established in 1999 under the auspices of the
ASEAN+3 Finance Ministers’ Meeting,2 provided a forum for discussing
regional economic and financial policy issues.
Regional financial regulation in Asia 113
The global financial crisis of 2007–09 and the subsequent eurozone sov-
ereign debt and banking sector crisis of 2011–12 added to the urgency for
greater financial cooperation by providing reminders of the vulnerability
of Asian economies to shocks emanating from the global financial market.
Moreover, one of the key lessons of the eurozone crisis is that greater
financial market integration requires greater integration of financial
regulation and supervision as well. These developments led to the creation
of the ASEAN+3 Macroeconomic Research Office (AMRO) under the
process of the ASEAN+3 finance ministers and central bank governors
monitoring economic and financial risks in the region.
Other factors contributed as well. First, the rising regional economic and
financial interdependence in Asia, including ASEAN, the People’s Republic
of China (PRC), Japan and the Republic of Korea, as a result of the estab-
lishment of supply chain networks and financial liberalization, raised syn-
chronization of economic and financial activity in the region. Second, the
presence of large global or regional financial firms in the region increases the
risk of spillovers and contagion, and calls for a more coordinated approach
to supervision, including the establishment of supervisory colleges.3 Third,
although the global financial crisis stimulated a wave of new financial
regulation under the auspices of the G20, the agenda was still very much
driven by issues in developed economies. A global regulatory approach of
“one size fits all” may not be appropriate for Asia, which increases the need
for Asian economies to articulate their viewpoints in global forums such
as the FSB and the G20. Finally, a large body of literature suggests that
financial development and integration can benefit economic growth,4 and
increased regional regulatory harmonization and mutual recognition can
both support this process and reduce systemic risks associated with it.
Financial regulation encompasses three broad aspects: ensuring that all
market participants understand the risks they face and take on only those
they are capable of coping with in order to promote efficient allocation
of credit; protecting consumers from unfair and fraudulent practices; and
maintaining systemic stability by monitoring common risk exposures, the
solvency of individual financial firms, the proper functioning of markets,
the operation of the payment and settlement structures, and the levels of
a variety of buffers that provide comfort to participants (Fullenkamp and
Sharma 2012). The experience of the global financial crisis showed that
maintaining systemic stability requires both microprudential and macro-
prudential regulatory approaches. This chapter focuses mostly on the sys-
temic stability aspects, since this is arguably where regional cooperation
can probably make the largest contribution.
Although financial integration efforts in Asia, even in ASEAN, are
much more modest than those in Europe, the basic goal of increased
114 New global economic architecture
integration has been well established, especially among ASEAN countries
under the AEC. This points fundamentally to the need for greater regional
regulatory cooperation between ASEAN and ASEAN+3 economies to
reduce risks associated with greater integration.5 Since regional financial
integration is most advanced in Europe, its experience should provide
valuable lessons (both positive and negative) for Asia. Nonetheless, the
levels of economic and financial development and financial integration
in Europe and Asia are very different. Asian economies encompass much
greater diversity in terms of economic development, institutional capacity,
and financial market depth and openness than do European economies.
This suggests that the European experience represents an important refer-
ence point, but not a template or a benchmark, and that the appropriate
level of financial regulatory cooperation and kinds of regional institutions
will differ substantially from those that have developed in Europe.
This chapter is organized as follows. Section 6.2 compares and con-
trasts economic and financial development and financial integration in
Europe and Asia. Section 6.3 examines the experience of regional financial
regulation, focusing on that of Europe, the region where economic and
financial integration has progressed most. Section 6.4 discusses the experi-
ence of regional financial cooperation and regulation in Asia. Section 6.5
identifies various challenges of regional financial regulation and provides
recommendations for strengthening institutions of regional financial regu-
lation. Section 6.6 concludes.
6.2 COMPARISON OF ECONOMIC AND FINANCIAL DEVELOPMENT IN EUROPE AND ASIA
This section compares the levels of economic and financial development,
financial integration and institutional quality in Europe and Asia. The aim
is to provide perspectives about the relevance of Europe’s experience to that
of Asia, and to identify where different approaches may be desirable. The
trend to financial integration in Europe accelerated around 1990, includ-
ing the deregulation of capital movements within the European Monetary
System (EMS) economies in 1988 and the adoption of the Maastricht
Treaty and the decision in 1992 to establish the Economic and Monetary
Union (EMU). Therefore, we believe it is appropriate to compare condi-
tions in Europe at that time with conditions in Asia currently, to gauge the
potential for regional financial integration and regulatory cooperation.
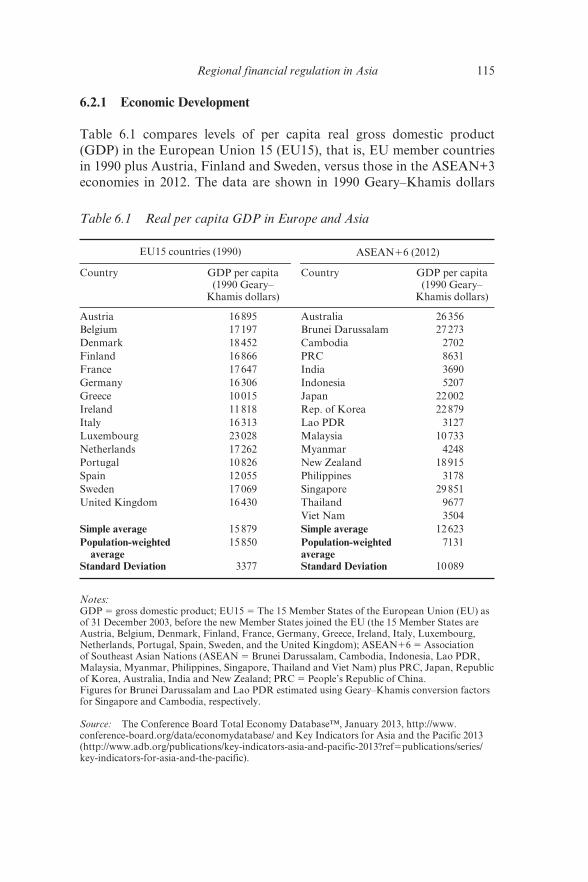
Regional financial regulation in Asia 115
6.2.1 Economic Development
Table 6.1 compares levels of per capita real gross domestic product
(GDP) in the European Union 15 (EU15), that is, EU member countries
in 1990 plus Austria, Finland and Sweden, versus those in the ASEAN+3
economies in 2012. The data are shown in 1990 Geary–Khamis dollars
Table 6.1 Real per capita GDP in Europe and Asia
EU15 countries (1990) ASEAN16 (2012)
Country GDP per capita
(1990 Geary–
Khamis dollars)
Country GDP per capita
(1990 Geary–
Khamis dollars)
Austria 16 895 Australia 26 356
Belgium 17 197 Brunei Darussalam 27 273
Denmark 18 452 Cambodia 2702
Finland 16 866 PRC 8631
France 17 647 India 3690
Germany 16 306 Indonesia 5207
Greece 10 015 Japan 22 002
Ireland 11 818 Rep. of Korea 22 879
Italy 16 313 Lao PDR 3127
Luxembourg 23 028 Malaysia 10 733
Netherlands 17 262 Myanmar 4248
Portugal 10 826 New Zealand 18 915
Spain 12 055 Philippines 3178
Sweden 17 069 Singapore 29 851
United Kingdom 16 430 Thailand 9677
Viet Nam 3504
Simple average 15 879 Simple average 12 623
Population- weighted
average
15 850 Population- weighted
average
7131
Standard Deviation 3377 Standard Deviation 10 089
Notes:GDP 5 gross domestic product; EU15 5 The 15 Member States of the European Union (EU) as
of 31 December 2003, before the new Member States joined the EU (the 15 Member States are
Austria, Belgium, Denmark, Finland, France, Germany, Greece, Ireland, Italy, Luxembourg,
Netherlands, Portugal, Spain, Sweden, and the United Kingdom); ASEAN16 5 Association
of Southeast Asian Nations (ASEAN 5 Brunei Darussalam, Cambodia, Indonesia, Lao PDR,
Malaysia, Myanmar, Philippines, Singapore, Thailand and Viet Nam) plus PRC, Japan, Republic
of Korea, Australia, India and New Zealand; PRC 5 People’s Republic of China.
Figures for Brunei Darussalam and Lao PDR estimated using Geary–Khamis conversion factors
for Singapore and Cambodia, respectively.
Source: The Conference Board Total Economy Database™, January 2013, http://www.
conference- board.org/data/economydatabase/ and Key Indicators for Asia and the Pacific 2013
(http://www.adb.org/publications/key- indicators- asia- and- pacific- 2013?ref5publications/series/
key- indicators- for- asia- and- the- pacific).

116 New global economic architecture
to make them comparable.6 Clearly, economic conditions were much
more uniform in Europe in 1990 than in Asia in 2012. Interestingly, the
unweighted average real income levels were not that different – US$15 900
for Europe versus US$12 600 for Asia – but the population- weighted
average is less than half in Asia, reflecting the large population weights
of the PRC and India. Also, the dispersion in Europe was much less, with
a standard deviation of US$3400 versus US$10 100 for the Asian econo-
mies. The minimum income level in Europe was US$10 000 versus only
US$2700 for Asia.
6.2.2 Financial Development
Financial development is frequently measured by the ratio of total finan-
cial assets to GDP, since capital deepening generally accompanies eco-
nomic development. Table 6.2 shows the levels and standard deviations of
the ratios of private bank credit to GDP for the two regions. The average
ratio for Europe in 1990 was actually lower than in Asia in 2011 – 69 per
cent versus 75 per cent – and the gap in the GDP- weighted averages was
even larger. However, the standard deviation was much lower – 25 per
cent versus 45 per cent – indicating a smaller diversity of development.
Table 6.3 shows total bond issues outstanding as ratios of GDP for the
two regions, including both domestic and international issues. The simple
average level was somewhat higher in Europe – 69 per cent versus 59 per
cent – but the GDP- weighted average was much lower. Again, the stand-
ard deviation was only about half of that in Asia. Viet Nam and Myanmar
in particular stand out with a ratio of only 2–3 per cent.
Table 6.4 shows the ratio of stock market capitalization to GDP. The
average ratio for the European countries in 1990 was only about half of the
Asian level in 2011 in both unweighted and weighted terms, but the stand-
ard deviation was also much lower. Interestingly, Greece, Austria, Portugal
and Italy had lower stock market levels in 1990 than did Viet Nam in 2011.
Overall, the average level of financial development of Asia currently
compares favorably with that of Europe in 1990. Nonetheless, the much
higher variance of financial development in Asia does indicate obstacles to
financial integration, although they do not appear to be as great as those
for income levels.
6.2.3 Financial Integration
Financial openness and financial integration are not quite the same thing,
but clearly an economy must be financially open to make integration pos-
sible, especially on the capital account. Capital account openness has been
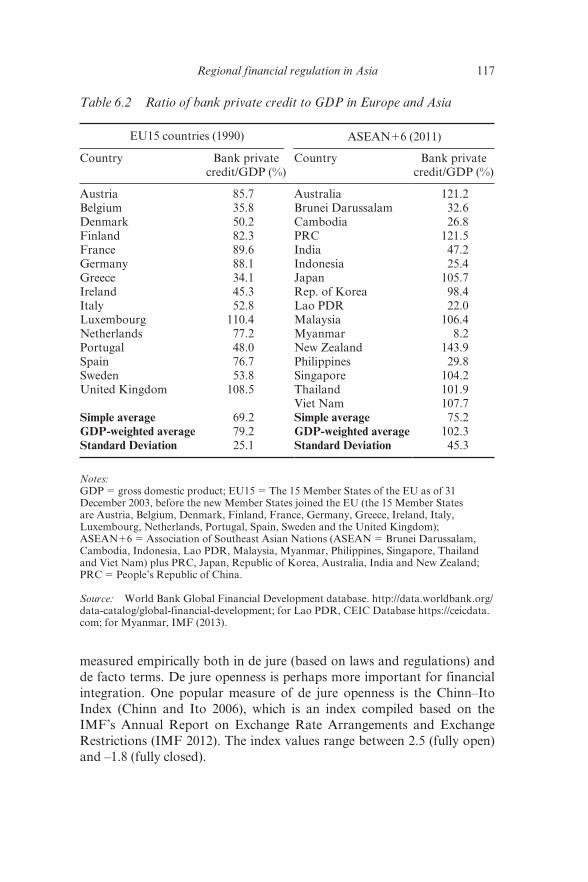
Regional financial regulation in Asia 117
measured empirically both in de jure (based on laws and regulations) and
de facto terms. De jure openness is perhaps more important for financial
integration. One popular measure of de jure openness is the Chinn–Ito
Index (Chinn and Ito 2006), which is an index compiled based on the
IMF’s Annual Report on Exchange Rate Arrangements and Exchange
Restrictions (IMF 2012). The index values range between 2.5 (fully open)
and –1.8 (fully closed).
Table 6.2 Ratio of bank private credit to GDP in Europe and Asia
EU15 countries (1990) ASEAN16 (2011)
Country Bank private
credit/GDP (%)
Country Bank private
credit/GDP (%)
Austria 85.7 Australia 121.2
Belgium 35.8 Brunei Darussalam 32.6
Denmark 50.2 Cambodia 26.8
Finland 82.3 PRC 121.5
France 89.6 India 47.2
Germany 88.1 Indonesia 25.4
Greece 34.1 Japan 105.7
Ireland 45.3 Rep. of Korea 98.4
Italy 52.8 Lao PDR 22.0
Luxembourg 110.4 Malaysia 106.4
Netherlands 77.2 Myanmar 8.2
Portugal 48.0 New Zealand 143.9
Spain 76.7 Philippines 29.8
Sweden 53.8 Singapore 104.2
United Kingdom 108.5 Thailand 101.9
Viet Nam 107.7
Simple average 69.2 Simple average 75.2
GDP- weighted average 79.2 GDP- weighted average 102.3
Standard Deviation 25.1 Standard Deviation 45.3
Notes:
GDP 5 gross domestic product; EU15 5 The 15 Member States of the EU as of 31
December 2003, before the new Member States joined the EU (the 15 Member States
are Austria, Belgium, Denmark, Finland, France, Germany, Greece, Ireland, Italy,
Luxembourg, Netherlands, Portugal, Spain, Sweden and the United Kingdom);
ASEAN16 5 Association of Southeast Asian Nations (ASEAN 5 Brunei Darussalam,
Cambodia, Indonesia, Lao PDR, Malaysia, Myanmar, Philippines, Singapore, Thailand
and Viet Nam) plus PRC, Japan, Republic of Korea, Australia, India and New Zealand;
PRC 5 People’s Republic of China.
Source: World Bank Global Financial Development database. http://data.worldbank.org/
data- catalog/global- financial- development; for Lao PDR, CEIC Database https://ceicdata.
com; for Myanmar, IMF (2013).
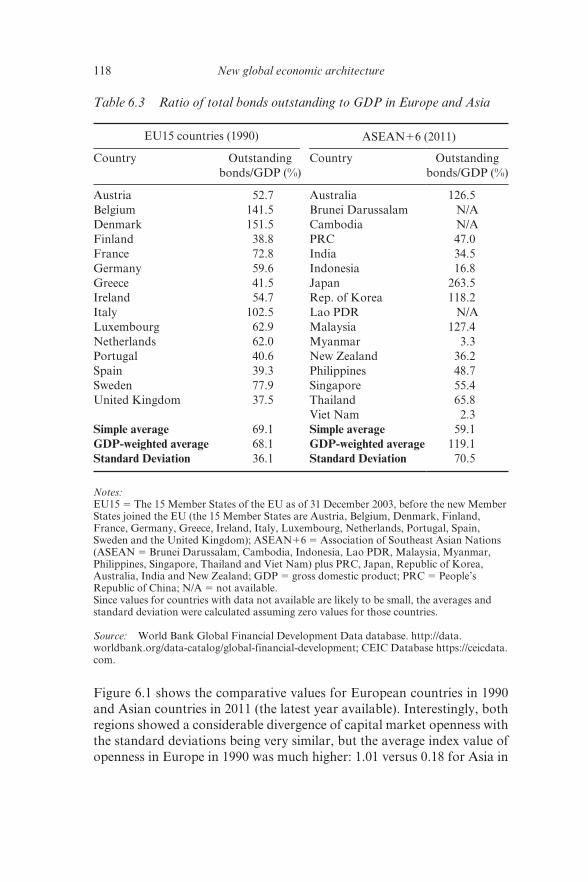
118 New global economic architecture
Figure 6.1 shows the comparative values for European countries in 1990
and Asian countries in 2011 (the latest year available). Interestingly, both
regions showed a considerable divergence of capital market openness with
the standard deviations being very similar, but the average index value of
openness in Europe in 1990 was much higher: 1.01 versus 0.18 for Asia in
Table 6.3 Ratio of total bonds outstanding to GDP in Europe and Asia
EU15 countries (1990) ASEAN16 (2011)
Country Outstanding
bonds/GDP (%)
Country Outstanding
bonds/GDP (%)
Austria 52.7 Australia 126.5
Belgium 141.5 Brunei Darussalam N/A
Denmark 151.5 Cambodia N/A
Finland 38.8 PRC 47.0
France 72.8 India 34.5
Germany 59.6 Indonesia 16.8
Greece 41.5 Japan 263.5
Ireland 54.7 Rep. of Korea 118.2
Italy 102.5 Lao PDR N/A
Luxembourg 62.9 Malaysia 127.4
Netherlands 62.0 Myanmar 3.3
Portugal 40.6 New Zealand 36.2
Spain 39.3 Philippines 48.7
Sweden 77.9 Singapore 55.4
United Kingdom 37.5 Thailand 65.8
Viet Nam 2.3
Simple average 69.1 Simple average 59.1
GDP- weighted average 68.1 GDP- weighted average 119.1
Standard Deviation 36.1 Standard Deviation 70.5
Notes:
EU15 5 The 15 Member States of the EU as of 31 December 2003, before the new Member
States joined the EU (the 15 Member States are Austria, Belgium, Denmark, Finland,
France, Germany, Greece, Ireland, Italy, Luxembourg, Netherlands, Portugal, Spain,
Sweden and the United Kingdom); ASEAN16 5 Association of Southeast Asian Nations
(ASEAN 5 Brunei Darussalam, Cambodia, Indonesia, Lao PDR, Malaysia, Myanmar,
Philippines, Singapore, Thailand and Viet Nam) plus PRC, Japan, Republic of Korea,
Australia, India and New Zealand; GDP 5 gross domestic product; PRC 5 People’s
Republic of China; N/A 5 not available.
Since values for countries with data not available are likely to be small, the averages and
standard deviation were calculated assuming zero values for those countries.
Source: World Bank Global Financial Development Data database. http://data.
worldbank.org/data- catalog/global- financial- development; CEIC Database https://ceicdata.
com.
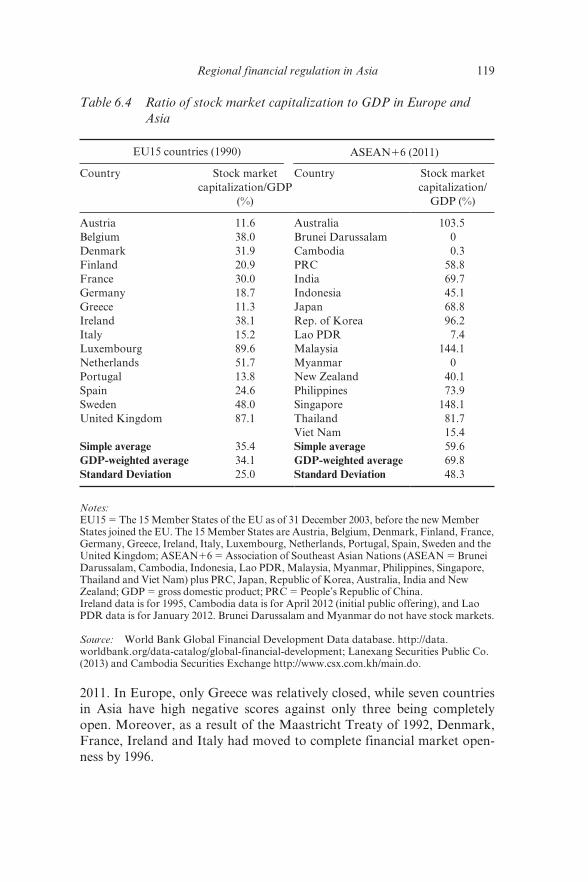
Regional financial regulation in Asia 119
2011. In Europe, only Greece was relatively closed, while seven countries
in Asia have high negative scores against only three being completely
open. Moreover, as a result of the Maastricht Treaty of 1992, Denmark,
France, Ireland and Italy had moved to complete financial market open-
ness by 1996.
Table 6.4 Ratio of stock market capitalization to GDP in Europe and
Asia
EU15 countries (1990) ASEAN16 (2011)
Country Stock market
capitalization/GDP
(%)
Country Stock market
capitalization/
GDP (%)
Austria 11.6 Australia 103.5
Belgium 38.0 Brunei Darussalam 0
Denmark 31.9 Cambodia 0.3
Finland 20.9 PRC 58.8
France 30.0 India 69.7
Germany 18.7 Indonesia 45.1
Greece 11.3 Japan 68.8
Ireland 38.1 Rep. of Korea 96.2
Italy 15.2 Lao PDR 7.4
Luxembourg 89.6 Malaysia 144.1
Netherlands 51.7 Myanmar 0
Portugal 13.8 New Zealand 40.1
Spain 24.6 Philippines 73.9
Sweden 48.0 Singapore 148.1
United Kingdom 87.1 Thailand 81.7
Viet Nam 15.4
Simple average 35.4 Simple average 59.6
GDP- weighted average 34.1 GDP- weighted average 69.8
Standard Deviation 25.0 Standard Deviation 48.3
Notes:
EU15 5 The 15 Member States of the EU as of 31 December 2003, before the new Member
States joined the EU. The 15 Member States are Austria, Belgium, Denmark, Finland, France,
Germany, Greece, Ireland, Italy, Luxembourg, Netherlands, Portugal, Spain, Sweden and the
United Kingdom; ASEAN16 5 Association of Southeast Asian Nations (ASEAN 5 Brunei
Darussalam, Cambodia, Indonesia, Lao PDR, Malaysia, Myanmar, Philippines, Singapore,
Thailand and Viet Nam) plus PRC, Japan, Republic of Korea, Australia, India and New
Zealand; GDP 5 gross domestic product; PRC 5 People’s Republic of China.
Ireland data is for 1995, Cambodia data is for April 2012 (initial public offering), and Lao
PDR data is for January 2012. Brunei Darussalam and Myanmar do not have stock markets.
Source: World Bank Global Financial Development Data database. http://data.
worldbank.org/data- catalog/global- financial- development; Lanexang Securities Public Co.
(2013) and Cambodia Securities Exchange http://www.csx.com.kh/main.do.
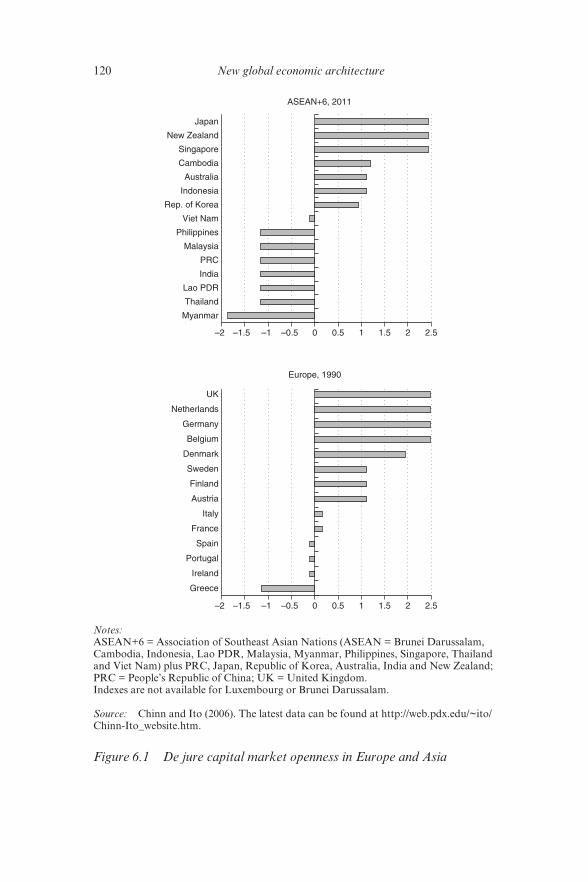
120 New global economic architecture
–2 –1.5 –1 –0.5 0 0.5 1 1.5 2 2.5
Myanmar
Thailand
Lao PDR
India
PRC
Malaysia
Philippines
Viet Nam
Rep. of Korea
Indonesia
Australia
Cambodia
Singapore
New Zealand
Japan
ASEAN+6, 2011
–2 –1.5 –1 –0.5 0 0.5 1 1.5 2 2.5
Greece
Ireland
Portugal
Spain
France
Italy
Austria
Finland
Sweden
Denmark
Belgium
Germany
Netherlands
UK
Europe, 1990
Notes:
ASEAN+6 = Association of Southeast Asian Nations (ASEAN = Brunei Darussalam,
Cambodia, Indonesia, Lao PDR, Malaysia, Myanmar, Philippines, Singapore, Thailand
and Viet Nam) plus PRC, Japan, Republic of Korea, Australia, India and New Zealand;
PRC = People’s Republic of China; UK = United Kingdom.
Indexes are not available for Luxembourg or Brunei Darussalam.
Source: Chinn and Ito (2006). The latest data can be found at http://web.pdx.edu/~ito/
Chinn- Ito_website.htm.
Figure 6.1 De jure capital market openness in Europe and Asia
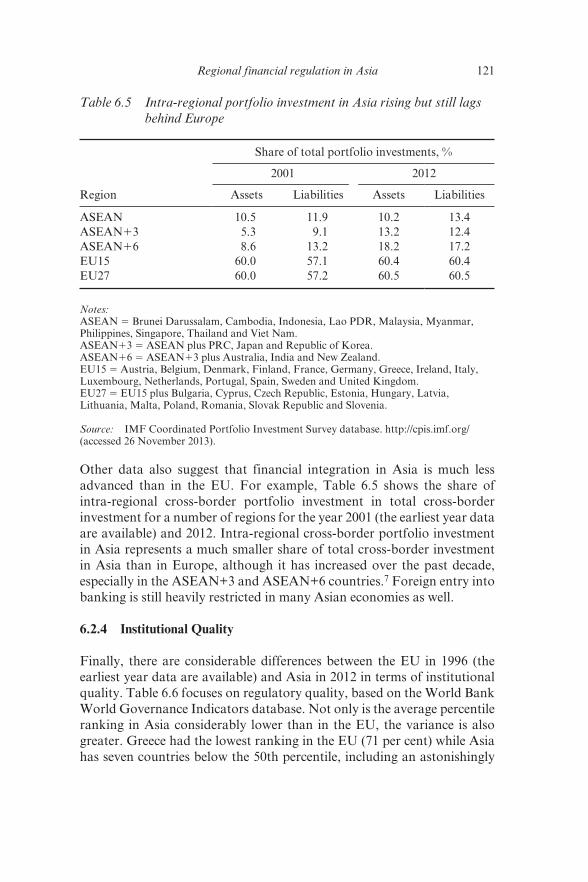
Regional financial regulation in Asia 121
Other data also suggest that financial integration in Asia is much less
advanced than in the EU. For example, Table 6.5 shows the share of
intra- regional cross- border portfolio investment in total cross- border
investment for a number of regions for the year 2001 (the earliest year data
are available) and 2012. Intra-regional cross- border portfolio investment
in Asia represents a much smaller share of total cross- border investment
in Asia than in Europe, although it has increased over the past decade,
especially in the ASEAN+3 and ASEAN+6 countries.7 Foreign entry into
banking is still heavily restricted in many Asian economies as well.
6.2.4 Institutional Quality
Finally, there are considerable differences between the EU in 1996 (the
earliest year data are available) and Asia in 2012 in terms of institutional
quality. Table 6.6 focuses on regulatory quality, based on the World Bank
World Governance Indicators database. Not only is the average percentile
ranking in Asia considerably lower than in the EU, the variance is also
greater. Greece had the lowest ranking in the EU (71 per cent) while Asia
has seven countries below the 50th percentile, including an astonishingly
Table 6.5 Intra- regional portfolio investment in Asia rising but still lags
behind Europe
Region
Share of total portfolio investments, %
2001 2012
Assets Liabilities Assets Liabilities
ASEAN 10.5 11.9 10.2 13.4
ASEAN13 5.3 9.1 13.2 12.4
ASEAN16 8.6 13.2 18.2 17.2
EU15 60.0 57.1 60.4 60.4
EU27 60.0 57.2 60.5 60.5
Notes:
ASEAN 5 Brunei Darussalam, Cambodia, Indonesia, Lao PDR, Malaysia, Myanmar,
Philippines, Singapore, Thailand and Viet Nam.
ASEAN13 5 ASEAN plus PRC, Japan and Republic of Korea.
ASEAN16 5 ASEAN13 plus Australia, India and New Zealand.
EU15 5 Austria, Belgium, Denmark, Finland, France, Germany, Greece, Ireland, Italy,
Luxembourg, Netherlands, Portugal, Spain, Sweden and United Kingdom.
EU27 5 EU15 plus Bulgaria, Cyprus, Czech Republic, Estonia, Hungary, Latvia,
Lithuania, Malta, Poland, Romania, Slovak Republic and Slovenia.
Source: IMF Coordinated Portfolio Investment Survey database. http://cpis.imf.org/
(accessed 26 November 2013).
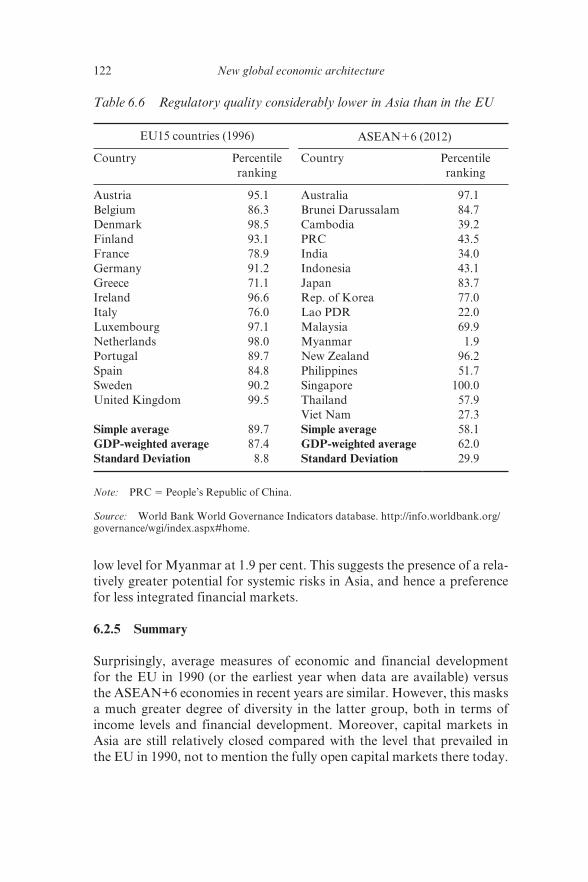
122 New global economic architecture
low level for Myanmar at 1.9 per cent. This suggests the presence of a rela-
tively greater potential for systemic risks in Asia, and hence a preference
for less integrated financial markets.
6.2.5 Summary
Surprisingly, average measures of economic and financial development
for the EU in 1990 (or the earliest year when data are available) versus
the ASEAN+6 economies in recent years are similar. However, this masks
a much greater degree of diversity in the latter group, both in terms of
income levels and financial development. Moreover, capital markets in
Asia are still relatively closed compared with the level that prevailed in
the EU in 1990, not to mention the fully open capital markets there today.
Table 6.6 Regulatory quality considerably lower in Asia than in the EU
EU15 countries (1996) ASEAN16 (2012)
Country Percentile
ranking
Country Percentile
ranking
Austria 95.1 Australia 97.1
Belgium 86.3 Brunei Darussalam 84.7
Denmark 98.5 Cambodia 39.2
Finland 93.1 PRC 43.5
France 78.9 India 34.0
Germany 91.2 Indonesia 43.1
Greece 71.1 Japan 83.7
Ireland 96.6 Rep. of Korea 77.0
Italy 76.0 Lao PDR 22.0
Luxembourg 97.1 Malaysia 69.9
Netherlands 98.0 Myanmar 1.9
Portugal 89.7 New Zealand 96.2
Spain 84.8 Philippines 51.7
Sweden 90.2 Singapore 100.0
United Kingdom 99.5 Thailand 57.9
Viet Nam 27.3
Simple average 89.7 Simple average 58.1
GDP- weighted average 87.4 GDP- weighted average 62.0
Standard Deviation 8.8 Standard Deviation 29.9
Note: PRC 5 People’s Republic of China.
Source: World Bank World Governance Indicators database. http://info.worldbank.org/
governance/wgi/index.aspx#home.
Regional financial regulation in Asia 123
This may partly reflect the substantially lower level of regulatory quality in
developing countries in Asia today than in Europe in the mid- 1990s. Thus
Asia needs a more modest and measured approach to regional financial
surveillance and regulation compared with what has been seen in the EU
over the past two decades.
Although the EU experience provides many valuable lessons for Asian
financial integration, it should only be regarded as a comparison point,
not a benchmark or a template. Nonetheless, Asia will inevitably experi-
ence progressive, but most likely gradual, capital account liberalization
and consequent financial integration. Greater financial integration entails
risks as well as benefits, particularly the easier transmission of financial
shocks. This highlights the need over time for regional regulatory coopera-
tion to help reduce such risks in Asia.
6.3 EXPERIENCE OF REGIONAL FINANCIAL SECTOR POLICY IN THE EUROPEAN UNION
This section describes and analyzes lessons from existing experiences of
regional financial sector policy, focusing on the EU.
The EU provides by far the richest source of information and experience
about regional financial sector policy. The EU has the tightest regional
political, economic and financial structure with the longest history, and also
has faced some of the most difficult challenges as a result of the eurozone
sovereign debt and banking sector crisis in recent years. Although financial
integration in Asia is far less advanced than in Europe, Asian economies
can still learn valuable lessons from the European experience. This section
examines four aspects of European financial regulation: microprudential
supervision; macroprudential supervision; resolution capacity and deposit
insurance; and financial safety net for liquidity support.
Legislation in the EU has evolved substantially since the creation of the
three European Supervisory Authorities (ESAs) – the European Banking
Authority (EBA), the European Securities and Markets Authority (ESMA)
and the European Insurance and Occupational Pensions Authority
(EIOPA). Since then, the main divide has been between EU legislation
and delegated acts. Most delegated acts are adopted by the European
Commission on the basis of proposals by the ESAs, though this is still
largely a work in progress. Not surprisingly, it has been found difficult to
implement in practice such a complex and cumbersome process.
The main challenge seems to be substance, because there is no agreed
benchmark to guide regulatory and supervisory convergence (Winkler
2012). These difficulties are compounded by two asymmetries within the
124 New global economic architecture
EU: the presence of some countries (such as Ireland, Luxembourg and the
United Kingdom) operating international financial centers that often have
a vested interest in light regulation; and the integration process between
home and host country member states, as regards regulation and supervi-
sion of cross- border financial institutions. Finally, even if principles are
the same, actual implementation may still vary by country depending on
local laws, institutions, practices and specific exceptions, so inconsisten-
cies are bound to occur. Wymeersch (2010, p. 205) concluded that “the
European financial regulatory system is far from effectively harmonized
and not fully conducive to the creation of an internal financial market.”
For example, implicit and explicit national guarantees were a major dis-
torting factor of the single market, as widely evidenced in the crisis.
Recent reforms strengthened the abilities of the EU institutions to
adopt legislation that is binding on member countries, a shift generally sig-
naled by reference to a “single rulebook” (De Larosière Report, European
Commission 2009). However, member nations can introduce their own
legislation as well, sometimes before relevant EU directives emerge. A
notable example is financial regulation in the United Kingdom, which
follows recommendations made by the Vickers Report (ICB 2011). As
will be discussed below, special resolution regimes have been developed
in an uncoordinated manner at the national level, for example, Germany,
United Kingdom, Ireland, Belgium and Sweden, although the resolution
issue is now being addressed in a coordinated way.
6.3.1 Microprudential Supervision
The area of microprudential supervision – the monitoring of individual
financial firms – has seen (and continues to see) major changes in response
to the eurozone sovereign debt and banking sector crisis, which has high-
lighted the weaknesses of the previous system of essentially national- level
supervision of cross-border banks. First, in January 2011, legislative
changes created the three ESAs and granted them a coordinating role over
microprudential supervision. Increased powers of the ESAs related to
microprudential supervision included: (i) resolving cases of disagreement
between national supervisors, where legislation requires them to cooper-
ate or to agree; (ii) promoting coherent functioning of supervisory col-
leges;8 and (iii) coordinating policies in emergency situations (EU 2011).
Nevertheless, the extent and effectiveness of these new powers is still
unclear. Supervision is still primarily at the national level.
As a result, the EU has committed itself to creating a banking union –
comprising EU- wide bank supervision, resolution and deposit insurance –
under the supervision of the European Central Bank (ECB). This was
Regional financial regulation in Asia 125
crystallized by the decision taken at the European Summit in June 2012
to create a Single Supervisory Mechanism (SSM). In addition to the single
rulebook, an integrated financial framework for the EU is seen to require
three central elements: single European banking supervision; a common
deposit insurance; and a common resolution framework (van Rompuy
2012). Also, introducing the SSM is directly related to the decision to
allow the possibility of direct recapitalization of banks by the European
Stability Mechanism (ESM). To this end, the summit leaders called for
the Council to develop proposals for the SSM by the end of 2012, and
the European Council meeting later in the year called for the “legislative
framework” to be completed by that time (European Council 2012b). The
leaders specifically referred to the need to “break the vicious circle between
banks and sovereigns” (European Council 2012a, p. 1).
The European Commission’s draft proposal of September 2012 calls
for the ECB to take responsibility for supervision of all credit institutions
in the euro member countries, “with the objective to promote the safety
and soundness of credit institutions and the stability of the financial
system” (European Commission 2012, p. 3). The ECB is charged to carry
out its tasks within the framework of the European System of Financial
Supervision (ESFS) and to cooperate closely with national supervisors
and the EBA.9 Specific proposed supervisory tasks for the ECB include:
authority for licensing and authorizing credit institutions, assessing qualifying holdings, ensuring compliance with the minimum capital requirements, ensur-ing the adequacy of internal capital in relation to the risk profile of a credit institution (Pillar 2 measures), conducting supervision on a consolidated basis, and supervisory tasks in relation to financial conglomerates. Furthermore, the ECB will also ensure compliance with provisions on leverage and liquidity, apply capital buffers and carry out, in coordination with resolution authorities, early intervention measures when a bank is in breach of, or is about to breach, regulatory capital requirements. (European Commission 2012, p. 4)
Also, the ECB will have all necessary investigatory powers to be able
to carry out its tasks. However, it is expected that most day- to- day veri-
fications and other supervisory activities would be exercised by national
supervisors operating as an integral part of the SSM. The precise alloca-
tion of responsibilities between the ECB and national supervisors remains
a controversial issue.
An innovation of this magnitude has major implications for the regula-
tory structure in the EU, including the relationships of the ECB with the
EBA and non- euro- member states, but these have not yet been resolved.
The proposal states that “the ECB should therefore be required to coop-
erate closely with the EBA, the [ESMA] and the [EIOPA], within the
126 New global economic architecture
framework of the EFSF” (European Commission 2012, p. 13). Regarding
the EBA, the Commission proposal notes that “the EBA will keep its
powers and tasks to further develop the single rulebook and ensure con-
vergence and consistency of supervisory practice” (European Commission
2012, p. 4). Most of the ECB’s increased responsibilities will be shifted
from national supervisors, not the EBA. However, it seems likely that the
EBA’s role will need to be modified gradually over time (Véron 2012b).
Regarding the non- euro- member states wishing to enter the banking
union, the Commission proposal notes that they “will be able to enter into
a close supervisory cooperation with the ECB subject to meeting specific
conditions” (European Commission 2012, p. 6). One of these conditions is
that those member states abide by and implement relevant ECB acts. This
area also remains controversial.
The proposal notes that the new ECB role does not affect in any way
the position of non- euro- member states in existing colleges of supervisors
for EU financial firms. Until now, the primary vehicles for cross- border
supervisory cooperation are memorandums of understanding (MOUs)
among national supervisors. However, these are not legally binding and
can be fragile. As noted above, the ESAs supposedly have powers to
resolve disputes within colleges of supervisors, but these have not been
tested much yet. Moreover, the proliferation of MOUs creates a complex
environment in which to operate. Finally, such MOUs have tended to be
supplanted in times of crisis by ad hoc measures, for example, the case
of the Fortis financial group in 2008 (Véron 2012a). However, this issue
should be largely resolved, at least for financial firms within the region,
with the transfer of supervisory authority to the ECB.
6.3.2 Macroprudential Supervision
As mentioned above, EU- wide macroprudential regulation was intro-
duced in 2011 with the creation of the European Systemic Risk Board
(ESRB). The ESRB has a mandate to study macroprudential, or sys-
temwide, risks to stability. It is chaired by the President of the ECB, and
members include the ECB, national central banks, the three ESAs, one
high- level representative per Member State of the competent national
supervisory authorities, the European Council, and the Economic and
Financial Committee (EFC) – 61 members in all (ESRB 2012a). Notably,
however, the national supervisory authorities do not have voting rights,
which leaves the voting membership very much dominated by the ECB
and national central banks. It does not appear that the change in the
ECB’s supervisory role described in the previous section will affect its role
in macroprudential supervision, since that role is already quite large.
Regional financial regulation in Asia 127
The ESRB has a surveillance function but no binding powers. It can
issue risk warnings that should prompt early responses to avoid a build- up
of systemic problems and the risk of a future crisis, and it may also recom-
mend specific actions to address any identified risks. The ESRB cannot
impose measures on member states or national authorities, but can expect
replies to its assessments. It also has the ability, along with the ESAs, to
identify emergency situations, and has responsibility for coordinating its
actions with those of international financial organizations, particularly
the IMF and the FSB, as well as the relevant bodies in third countries on
matters related to macroprudential oversight (ESRB 2012b).
The Commission report on the proposed expansion of the ECB’s super-
visory role calls for strict separation from the ECB’s monetary policy tasks
to eliminate potential conflicts of interest between the objectives of mon-
etary policy and prudential supervision. However, it remains to be seen
whether or not such a strict separation is practical. Experience suggests that
its monetary and macroprudential policy tools cannot be operated totally
independently. For example, if monetary conditions are easy, borrowers
will find ways to evade various macroprudential restrictions on lending.
6.3.3 Resolution Capacity and Deposit Insurance
A weak link in the EU’s region- wide financial regulatory capacity is the
lack of an EU- wide framework for resolution of cross- border banks and
other financial firms and for deposit insurance. The approach to cross-
border bank resolution is still based on MOUs – which may prove fragile
– and insolvency laws are not harmonized. Moreover, national fiscal
authorities are not included in such MOUs, even though they must make
the critical decision of whether or not to inject public funds into an institu-
tion. To be sure, the EU has also created crisis resolution groups, in which
treasuries are members, precisely to address this weakness.
Deposit insurance in the EU is currently implemented only at the
national level. While there have been waves of harmonization – for
instance in 2009 a uniform minimum coverage of 100 000 euros was intro-
duced – they still display significant national differences across the EU. As
such, they are not well equipped to deal with the failure of cross- border
banks within the EU. Moreover, deposit guarantee schemes are unfunded
in many countries, which means that their fiscal position could be affected
significantly by the failure of a large bank. Although they have been
recently strengthened by various measures, they do not substitute for an
EU- wide scheme.
This situation will change dramatically following the commitment
to create a banking union, including EU- wide supervision, resolution
128 New global economic architecture
arrangements and a deposit insurance scheme. The latter two are needed
together, and van Rompuy (2012, p. 5) has noted that “the deposit insur-
ance scheme and the resolution fund could be set up under the control of
a common resolution authority.” Constâncio (2012) has suggested that
the US Federal Deposit Insurance Corporation could be a model. The
European Commission was charged with developing such a resolution and
deposit insurance framework.
Progress is being made on the establishment of an EU- wide resolu-
tion mechanism. European Commission (2013b) proposed a legislative
framework for a new Single Resolution Mechanism (SRM). The SRM
will apply a single rulebook on bank resolution for ailing banks from the
participating member states in this mechanism. The SRM will consist
of uniform rules and procedures to be applied by the Single Resolution
Board (SRB), together with the Commission and the resolution authori-
ties of the participating member states. The SRB, made up of repre-
sentatives from the ECB, the European Commission and the relevant
national authorities, would prepare the resolution of a bank. It would
have broad powers to analyze and define the approach for resolving
a bank: which tools to use, and how the European Resolution Fund
should be involved. A Single Bank Resolution Fund would be set up
under the control of the SRB to ensure the availability of medium- term
funding support during the restructuring process. It would be funded by
contributions from the banking sector, replacing the national resolution
funds of the euro area member states and those non- euro states partici-
pating in the banking union. The law was approved by the European
Parliament in 2014.
However, not much progress has been observed on the deposit insur-
ance scheme even in 2013. If this is implemented successfully, it will rep-
resent a marked improvement over the current system, which is carried
out mostly at the national level, and augmented only by relatively weak
MOUs and ad hoc responses. Van Rompuy (2012) has argued that a
European deposit insurance scheme would strengthen the credibility of the
existing arrangements and serve as an important assurance that eligible
deposits of all credit institutions are sufficiently insured.
6.3.4 Financial Safety Net
The European financial safety net also evolved over time in response to
the sovereign debt and banking crisis. In June 2010, the European Council
created the European Financial Stability Facility (EFSF) by which euro
member states provided a mainly credit- funded facility to lend to small
countries that had lost access to capital markets. However, when the finan-
Regional financial regulation in Asia 129
cial crisis contagion spilled over into large member states, especially Italy,
the original EFSF bailout fund was insufficient and the European Council
increased the fund’s resources from the initial amount of 440 billion euros
to 780 billion euros in July 2011. However, when Italy had to refinance
approximately 350 billion euros in 2012 and there were large liquidity
risks for lenders, the European Council in October 2011 agreed to leverage
the EFSF up to 1 trillion euros, but even this measure failed to calm the
markets. In October 2012, this temporary facility was transformed into a
permanent European Stability Mechanism (ESM).
A more lasting solution to the crisis was found through the development
of the “troika” financial safety net, comprising the EFSF (afterward the
ESM), the ECB and the IMF. The troika’s first project was the bailout for
Ireland in November 2011, followed by that for Portugal in May 2012,
and the second Greek bailout in September 2012 (European Commission
2013a). These measures finally stabilized markets and allowed sovereign
bond yields to decline substantially in the crisis countries. Nevertheless,
the earlier lack of a regional financial safety net led to virtual shut- off of
intraregional capital flows, which in turn hampered the transmission of
monetary policy throughout the region.
6.3.5 Summary
The EU has created by far the most highly developed regional institutions
for financial supervision, regulation and resolution, and has achieved
by far the highest regional financial integration and harmonization of
rules, standards, procedures and so on. Nonetheless, it is still very much
a work in progress. Significant differences in national practices and insti-
tutions remain, and have proven a substantial barrier to fully harmoniz-
ing financial regulations, tax systems, corporate law and other systemic
aspects. The role of regional supervisory agencies has been strengthened,
but microprudential supervision is still carried out mainly at the national
level, while regional macroprudential institutions appear cumbersome
and lack enforcement powers. Information- sharing by national supervi-
sors remains inadequate, and MOUs underlying supervisory colleges and
deposit insurance schemes are still fragile.
The eurozone crisis has revealed a number of shortcomings in the pre-
vious architecture, as essentially national- level regulation could not cope
with the high degree of financial integration in the region, and the “doom
loop” mechanism could not be avoided. The decision to create a full-
fledged banking union in coming years will dramatically alter this situa-
tion, and should mark a major improvement. The imminent establishment
of the SSM marks the first step in this process, and the agreement on an
130 New global economic architecture
EU- wide resolution mechanism is another step forward, but a full union
will also require establishing a unified deposit insurance scheme with EU-
wide fiscal backing.
6.4 EXPERIENCE FROM REGIONAL FINANCIAL COOPERATION AND REGULATION IN ASIA
Regional financial cooperation and regulation in Asia is much less devel-
oped than in the EU, but some significant developments have emerged,
including economic and financial surveillance; financial regulatory har-
monization; and a regional financial safety net. This section describes
these developments.
6.4.1 Economic and Financial Surveillance
A number of regional forums have emerged for the purposes of informa-
tion exchange, economic monitoring, policy dialogue and peer pressure
for better policies. The ASEAN finance ministers established the ASEAN
Surveillance Process in 1998. Its objective is to strengthen cooperation by:
(i) exchanging information and discussing economic and financial devel-
opment of member states in the region; (ii) providing an early warning
system and a peer review process to enhance macroeconomic and financial
stability in the region; (iii) highlighting possible policy options and encour-
aging early unilateral or collective actions to prevent a crisis; and (iv) mon-
itoring and discussing global economic and financial developments which
could have implications for the region and propose possible regional and
national level actions. The ASEAN Surveillance Process includes the
ASEAN Finance Ministers’ Meeting and the ASEAN Select Committee,
comprising the members of the ASEAN Senior Finance Officials’ Meeting
and the ASEAN Central Bank Forum (IIMA 2005).
The ASEAN+3 Finance Ministers’ Meeting process has the Economic
Review and Policy Dialogue (ERPD), which meets once a year mainly to
discuss macroeconomic and financial issues in East Asia. Starting in 2012,
the members’ central bank governors joined this forum, which conse-
quently has been renamed the ASEAN+3 Finance Ministers and Central
Bank Governors’ Meeting. The ERPD receives inputs from the Asian
Development Bank (ADB). In addition, the ASEAN+3 finance deputies
meet twice a year. Other meetings of Asian finance ministers include Asia-
Pacific Economic Cooperation (APEC) and the Asia- Europe Meeting
(ASEM). The policy dialogue and surveillance process among ASEAN+3
members is in transition from the “information sharing” stage to the “peer
Regional financial regulation in Asia 131
review and peer pressure” stage, while the “due diligence” process has yet
to start in a serious manner (Kawai and Houser 2008).
Another key forum is the Executives’ Meeting of East Asia- Pacific
Central Banks (EMEAP), a cooperative group of central banks and
monetary authorities in the East Asia and Pacific region.10 Its primary
objective is to strengthen the cooperative relationship among its members.
The EMEAP has activities at three levels: Governors’ Meetings, Deputies’
Meetings, and working groups. Another organization is the South East
Asian Central Banks (SEACEN) Research and Training Centre in Kuala
Lumpur, Malaysia, which now has 19 member central banks.11 As part of
it, the SEACEN Expert Group (SEG) on Capital Flows was established
by the SEACEN Centre in May 2000, in response to the need to manage
capital flows to ensure stability in regional financial markets. In addition
to the 19 SEACEN central bank members, it includes as observers the
Reserve Bank of Australia, Hong Kong Monetary Authority, and Bank
of Japan (IIMA 2005).
Finally, the ASEAN+3 Macroeconomic Research Office (AMRO) was
established in 2011 in Singapore as the surveillance arm of the Chiang Mai
Initiative Multilateralization (CMIM). Its staff resources are still quite
small – about twenty economists currently – but it has been tasked with
conducting full- fledged surveillance of the ASEAN+3 member countries.
This distinguishes it from the other forums described above, which do not
have their own full- time staff. It is expected that the AMRO will grow over
time in terms of staff numbers and will become an international organiza-
tion, although it will be a long time before it can achieve a size and depth
commensurate with that of the IMF.
6.4.2 Financial Regulatory Harmonization
The ASEAN Economic Community (AEC) offers the most advanced
regional framework for financial regulatory harmonization in Asia. The
AEC project is summarized in the AEC blueprint, ratified by ASEAN
leaders in 2007 (ASEAN Secretariat 2007). The ambitious target of the
AEC is to create its Economic Community by 2015 as a region with free
movement of goods, services, investment, skilled labor and “freer” flow of
capital. The broad aims of the project are both to enjoy the scale econo-
mies of a unified market and to reduce the development gap among its
member countries. To be sure, the blueprint recognizes in practice that
some countries will progress faster than others, and liberalization will be
done on a voluntary basis, which it characterizes as the “ASEAN minus
X” formula. This is a necessary aspect of the voluntary nature of ASEAN
cooperation. Regarding the financial services sector, the blueprint aims
132 New global economic architecture
for a first round of liberalization by 2015, with other subsectors or modes
being liberalized by 2020 (ASEAN Secretariat 2007).
Important components of the AEC include the ASEAN Framework
Agreement on Services (AFAS) and ASEAN capital market integration.
The aims of the AFAS are to: (i) enhance cooperation in services amongst
member states in order to improve the efficiency and competitiveness, and
to diversify production capacity and services supply and distribution by
their service providers within and outside ASEAN; (ii) eliminate substan-
tially restrictions to trade in services amongst member states; and (iii) lib-
eralize trade in services by expanding the depth and scope of liberalization
beyond those undertaken by member states under the GATS with the aim
of realizing a free trade area in services (ASEAN Secretariat, 1995, p. 1).
The ASEAN capital market integration program aims at developing a
unified pan- ASEAN market for financial services and capital flows under
the ASEAN Capital Markets Forum (ACMF).12 In order to strengthen
ASEAN capital market development and integration, the blueprint calls
for the following actions (ASEAN Secretariat 2007, p. 17):
● achieve greater harmonization in capital market standards in
ASEAN in the areas of offering rules for debt securities, disclosure
requirements and distribution rules;
● facilitate mutual recognition arrangement or agreement for the
cross- border recognition of qualification and education and experi-
ence of market professionals;
● achieve greater flexibility in language and governing law require-
ments for securities issuance;
● enhance withholding tax structure, where possible, to promote the
broadening of investor base in ASEAN debt issuance; and
● facilitate market- driven efforts to establish exchange and debt
market linkages, including cross- border capital- raising activities.
It further notes that the liberalization of capital movements is to be
guided by the following principles: (i) promoting an orderly capital account
liberalization consistent with member countries’ national agenda and read-
iness of the economy; (ii) allowing adequate safeguard against potential
macroeconomic instability and systemic risk that may arise from the liber-
alization process, including the right to adopt necessary measures to ensure
macroeconomic stability; and (iii) ensuring the benefits of liberalization
are to be shared by all ASEAN countries (ASEAN Secretariat 2007, p. 17).
An overall assessment of the achievements of the AEC is difficult to
make, as many country scorecards have not yet been released publicly.
Clearly, progress has been slower than desired. One recent development
Regional financial regulation in Asia 133
is that the ACMF devised the ASEAN and Plus Standards Scheme, a
framework for information disclosure standards that apply to regional
cross- border securities issuance (equities and bonds). ASEAN Standards
are common to all ASEAN member countries and conform to the
International Organization of Securities Commissions (IOSCO) interna-
tional standards, and the associated accounting and auditing standards
are identical to international standards. On the other hand, the Plus
Standards are an additional set of standards necessitated by the accepted
practices, laws and regulations of individual countries. In June 2009, secu-
rities market regulators in Malaysia, Singapore and Thailand announced
their decision to adopt this framework. Other countries are planning to
join the framework, but have not yet specified any dates (The 21st Century
Public Policy Institute 2011). Harmonization in the EU was driven to
a large extent by market liberalization and adoption of international
standards (see, for example, Posner and Véron 2010), but, in the current
environment and taking into account the diverse levels of economic and
financial development within the region, this force is weaker in ASEAN.
Nonetheless, given the essentially voluntary nature of ASEAN coopera-
tion, strong peer pressure is needed to produce more effective results.
6.4.3 Financial Safety Net
Following dissatisfaction with the role played by the IMF during the Asian
Financial Crisis of 1997–98, a regional cooperative financing arrangement
to supplement IMF resources was agreed in May 2000 at the ASEAN+3
Finance Ministers’ Meeting in Chiang Mai, which was referred to as the
“Chiang Mai Initiative”. It initially took the form of a network of bilateral
currency swap agreements, but in May 2007 the member countries agreed
to convert the bilateral schemes of the CMI into a multilateralized self-
managed reserve pooling scheme governed by a single contractual agree-
ment, or the Chiang Mai Initiative Multilateralization (CMIM). The
size of the agreement was set at US$120 billion, and the amount of the
allocation that would be withdrawn without triggering an IMF program
was raised from 10 per cent to 20 per cent (so- called “IMF conditionality”
or “IMF linkage”) (Sussangkarn 2010). As mentioned above, the AMRO
was established in May 2011 to provide surveillance capability within the
region.
However, the CMI (later CMIM) was never used, even during the
global financial crisis of 2007–09. The link to IMF conditionality was
one problem,13 due to the “IMF stigma” in the region, but the process for
releasing funds was also considered cumbersome and untested. The CMI
(or CMIM) needed various other improvements to make it more effective
134 New global economic architecture
as well. First, the CMI (or CMIM) borrowing quota was not likely to be
enough if more than one economy got into serious problems. Second,
instead of just borrowing from the CMI (or CMIM), economies could
arrange bilateral currency swap facilities with CMI (or CMIM) members
or other authorities – such as Australia and New Zealand. Finally, the
AMRO needed to have sufficient resources and staffing to support the
capabilities of an Asian monetary fund (AMF) (Sussangkarn 2010).
To address these issues, the ASEAN+3 Finance Ministers and Central
Bank Governors announced a number of reforms in May 2012, including:
doubling the CMIM resources to US$240 billion; increasing the IMF- de-
linked portion to 30 per cent with a view to increasing it to 40 per cent in
2014; lengthening the maturity and supporting period for the IMF- linked
portion from 90 days to 1 year and from 2 years to 3 years, respectively;
lengthening the maturity and supporting period of the IMF- de- linked
portion from 90 days to 6 months and from 1 year to 2 years, respectively;
and introducing a crisis prevention facility called CMIM Precautionary
Line (CMIM- PL) (ASEAN Secretariat 2012). The last would correspond
to the Flexible Credit Line and Precautionary Credit Line facilities of the
IMF. These improvements should enable the CMIM to move closer to
becoming a full- fledged AMF.
6.5 CHALLENGES FOR REGULATORY COOPERATION AND POLICY RECOMMENDATIONS
This section discusses challenges for cooperation in financial regulation in
the EU and Asia, highlights the differences between regional regulatory
approaches in the EU and ASEAN, and describes some of the challenges
in extending the ASEAN model to the rest of Asia. It then describes policy
recommendations for strengthening regional financial regulation in Asia.
6.5.1 Cooperation Challenges in the EU
As discussed in sections 6.2 and 6.3, even with elaborate regional legal and
political structures and integrated economic and financial systems, the
EU still faces many obstacles to effective regional regulation, including:
continued diversity of financial systems, laws and regulatory structures
and practices; a complex system, with a large number of players with
overlapping responsibilities and potential conflicts of interest; continued
evolution of EU- wide supervisory agencies with largely untested powers;
large size, potential cumbersomeness, and lack of strong authority of
Regional financial regulation in Asia 135
the ESRB; national resistance to an expanded EU- wide authority and a
tendency to protect domestic financial industries; inadequate information
sharing; weak cross- border supervisory cooperation based on MOUs
lacking legal force and tending to be overridden in crisis; and lack of a
legal framework for resolution and deposit insurance of cross- border
financial firms.14
These shortcomings demonstrate that the institutional frameworks for
the single financial market in the single currency area are seriously inade-
quate, and they indeed directly contributed to the severity of the eurozone
sovereign debt and banking sector crisis. First, the lack of a regional finan-
cial safety net allowed the development of the “doom loop” between sov-
ereigns and banks at the national and regional levels. Second, regulation at
the national level substantially lagged monetary and financial integration
in the region. In the presence of such a lag, the close interconnectedness
of European banks led to the easy transmission of financial shocks across
borders, tended to create negative externalities for other countries, and
contributed to the build- up of macroeconomic imbalances within Europe.
Third, the lack of a region- wide financial safety net led to a fragmenta-
tion of European financial markets via a virtual shut- off of intraregional
capital flows, which in turn hampered the transmission of monetary policy
easing throughout the region. These developments partly reflected the
inadequacies of national- level home- host supervisor arrangements in the
presence of high financial integration.
The direction of the solution is clear: financial regulatory functions –
including supervision, resolution and deposit insurance – need to be
elevated to the regional level. First, regulation needs to be consistent with
the cross- border activities of European financial firms, especially those
within the euro member countries. Second, introducing the SSM is directly
related to the decision to allow the possibility of direct recapitalization of
banks by the ESM, the European financial safety net. Third, it is necessary
to promote financial integration in Europe to enhance the transmission of
monetary policy.
The commitment of the EU to create a banking union – including super-
vision, resolution and deposit insurance – means that implementation
now represents the major challenge for the EU. Issues include how to deal
with the non- euro- member countries, how to enforce a sufficient degree of
regulatory harmonization, and how to establish the EU- wide resolution
and deposit insurance scheme. The latter also requires a commitment to a
fiscal union, which in turn implies success in establishing a political union,
since otherwise the fiscal union will lack political legitimacy. As noted
above, the establishment of the SSM is only the first step in a lengthy
process, and many difficult political decisions remain to be made.
136 New global economic architecture
6.5.2 Cooperation Challenges in Asia
Asia has no over- arching political structure comparable to the EU, and
there is little willingness in the region to concede national sovereignty in
these areas. The AEC provides a possible model for wider Asian coop-
eration, but progress even within ASEAN has been slow, and institutions
weak. Barriers to stronger regionalization of political and economic insti-
tutions in Asia include: the lack of an overall agreement on the definition
of “Asian” membership; great diversity in terms of economic and financial
development, financial and economic systems, institutional quality, capital
account openness and regulatory regimes; weak and under- developed
regional institutions, with no legal authority; and the voluntary nature of
cooperation even within ASEAN.
The weaker structure of regional institutions and greater diversity in
financial development and capital market openness in ASEAN (and even
more so in ASEAN+6 as a whole) require a different approach than in the
EU. The EU approach in principle has been to fully harmonize laws and
regulations, mainly in accordance with international standards, while only
small, unharmonized parts are addressed through mutual recognition, and
it has completely liberalized controls on cross- border capital transactions.
In contrast, ASEAN is aiming for general harmonization, coupled with
mutual recognition given for complementary purposes. It aims to attain
increased levels of capital flows within the region, but stops well short of
calling for complete deregulation of capital flows. This difference points
to a key role for mutual recognition in the financial integration process in
ASEAN, as discussed in greater detail above.
Within ASEAN, perhaps the first challenge is to promote financial
development in those countries that are lagging behind, mainly the
“CLMV” countries (Cambodia, Lao PDR, Myanmar and Viet Nam).
Only stronger convergence within the region can set the stage for achiev-
ing the targets of financial integration and regulatory harmonization laid
out in the AEC as described in section 6.4. Until such convergence is
achieved, ASEAN member countries will need to pursue a multi- track
approach, with those countries that have achieved the relevant mile-
stones of financial development committing to further steps of financial
opening. Along with this, ASEAN economies need to strengthen insti-
tutions for regional cooperation to promote regional harmonization of
regulations, taxation and so on, using the ASEAN finance ministers’
surveillance process as the starting point. This is particularly important
in view of the great divergence of regulatory performance and capac-
ity within the region. One beneficial step would be to include financial
regulators and deposit insurance corporations in at least some delib-
Regional financial regulation in Asia 137
erations so that the monitoring of regional financial stability could be
strengthened.
Institutions for regulatory cooperation need to be strengthened at the
level of the ASEAN+3 countries as well. One challenge is to strengthen
the CMIM and the AMRO to fulfill their functions as a regional financial
safety net and surveillance unit, respectively. Monitoring and exchanging
information about potential economic imbalances and volatile capital flows
can reduce the threat to economic and financial stability presented by them.
6.5.3 Recommendations for Regional Financial Regulation in Asia:
Improving the ASEAN Economic Community Process
The AEC process can be improved through promoting mutual recogni-
tion, increasing regulatory harmonization and enhancing cross- border
supervisory cooperation via MOUs. Recommended steps to promote
mutual recognition include:
● ensuring conformity to IOSCO principles to the extent possible,
including expanding the scope of the ASEAN and Plus Standards
Scheme;
● expanding mutual recognition to the maximum extent possible by
preserving domestic market soundness while securing investor pro-
tection and ensuring proper management of systemic risk; and
● strengthening cooperation and information exchange among differ-
ent regulatory authorities.
Mutual fund passporting is one example of an area that could benefit
substantially from mutual recognition.
Major ways to increase regulatory harmonization include:
● standardizing and integrating direct market infrastructures (trading
platforms, clearing/settlement systems);
● harmonizing indirect infrastructures (laws and regulations, credit
rating agencies, accounting/auditing standards, tax systems); and
● harmonizing foreign exchange regulations.
Studies have identified tax withholding rules as a major hurdle to par-
ticipation in regional bond markets by international investors (The 21st
Century Public Policy Institute 2011).
Enhancing cross- border supervisory cooperation via MOUs has the
potential to improve the effectiveness of monitoring globally or regionally
systemically important financial institutions (SIFIs), although experience
138 New global economic architecture
shows that MOUs can be relatively ineffective, especially in a crisis. The
AMRO has already begun regional monitoring, but this effort needs to
involve national supervisory bodies as well. One key problem is dealing
with global SIFIs whose headquarters are outside the region. In this case,
supervisory colleges with a global reach are the appropriate institution,
but they could still prove problematic if home country authorities are
distant from Asia – such as in the US and Europe – and not knowledge-
able about conditions there. In that case, requiring Asian branches of
these global SIFIs to become subsidiaries may be a desirable option.
However, the pros and cons of requiring Asian branches of global SIFIs to
become subsidiaries would need to be carefully assessed, both in terms of
financial stability and the costs and impacts such ring- fencing would entail
for cross- border capital allocation.
Next steps for ERPD, CMIM and AMRO
The ERPD so far has been mostly a beauty contest. The policy dialogue
among the finance ministers and central bank governors needs to be
strengthened. The inclusion of the central bank governors in the ASEAN+3
finance ministers’ process in 2012 was a positive first step. Important further
steps include: developing a “peer review” methodology and practice; and
regularly monitoring capital flows and exchange rate movements.
As mentioned above, a number of steps were taken over the past several
years to significantly strengthen the CMIM, including doubling the size of
its resources, increasing the portion of the quota that can be tapped without
an IMF program, and introducing precautionary lending instruments. The
size of the facility that each member can borrow should be further enlarged
either through an additional increase in the total resources or through
a change in the formula to define the maximum amount each member
economy can borrow. The ASEAN+3 authorities should also consider
extending CMIM membership to Australia, New Zealand and India, and
should encourage the development of a financial safety net in South Asia
as well. In the future, the CMIM should aim to reduce its link with the
IMF over time, ultimately to zero, by providing sufficient resources for the
AMRO and improving its surveillance capacity. It also needs to operation-
alize its financial safety net functions, which have not yet been tested. At
the same time, it needs to develop a framework for cooperation with the
IMF in the event that a widespread systemic shock occurs involving multi-
ple countries. With these, a de facto AMF will have emerged.
Creating an Asian financial stability dialogue
To make substantial progress in improving regional financial stability,
there needs to be a suitable driving force. Kawai (2011), Plummer (2012),
Regional financial regulation in Asia 139
and others support the idea of an Asian financial stability dialogue
(AFSD), which was first suggested by Kuroda (2008). The AFSD would
provide a forum for broader information sharing in the areas of macroeco-
nomic and financial stability, including financial regulators and deposit
insurance corporations, as well as finance ministries and central banks.
The AFSD could discuss regional financial vulnerabilities, regional capital
flows, common issues for financial sector supervision and regulation, and
common efforts at financial integration.
There is currently an Asian regional forum led by the Bank for
International Settlements (BIS), but such a forum should be led by Asian
countries (in the form of an AFSD), and they may invite the BIS to partici-
pate. This entity could build on existing institutions in the region, including
the ERPD and the EMEAP. The body should include the participation of
finance ministries, central banks, financial market regulators and supervi-
sors, and deposit insurance corporations, that is, a wider scope than that
of the ERPD, which focuses on macroeconomic policy issues. Its objective
would be to monitor factors affecting regional financial stability, includ-
ing national financial market conditions and capital flows, and to induce
appropriate policy actions including macroprudential policy and coordina-
tion of capital flow management.
For example, policy spillovers (e.g. cross- border impacts of blanket
guarantees of deposit insurance, capital control measures, or adoption of
macroprudential policies) are likely to have side- effects on capital flows
that could be destabilizing for other economies in the region, and call for
concerted action at the regional level. Table 6.7 summarizes recent meas-
ures affecting capital inflows introduced in Asian economies. The AFSD
could identify regional SIFIs and discuss how the national authorities in
the region can improve cross- border supervision over them. It could also
provide a regional counterpart to the FSB, an element of regional institu-
tional architecture that is currently missing. In particular, the AFSD could
liaise with the FSB for Asia’s non- FSB member countries.15
In the early stages, such an arrangement could focus on issues that would
help advance the areas of common interest that have already been identi-
fied and that are largely being dealt with under separate initiatives, such as
the management of volatile short- term capital flows. Plummer (2012) sees
it initially focusing on improving early warning systems, being able to assist
in negotiations on common exchange rate changes, and, perhaps, helping
in crisis management. The principal question is how far an AFSD might
proceed beyond simply monitoring, diagnosing potential threats and sug-
gesting remedies. One of the problems revealed in the run- up to the global
financial crisis was that some organizations, particularly the BIS, did diag-
nose various sources of fragility, but they had no powers to act upon them.
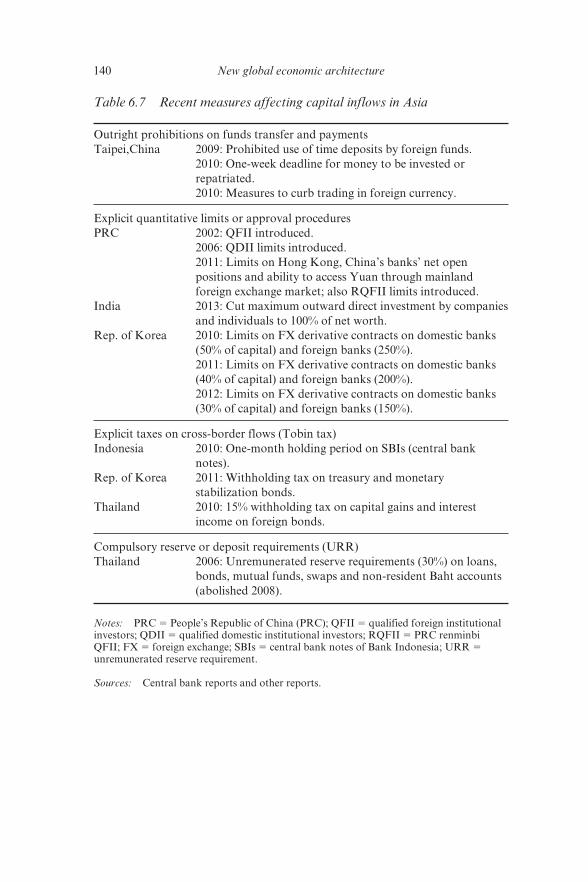
140 New global economic architecture
Table 6.7 Recent measures affecting capital inflows in Asia
Outright prohibitions on funds transfer and payments
Taipei,China 2009: Prohibited use of time deposits by foreign funds.
2010: One- week deadline for money to be invested or
repatriated.
2010: Measures to curb trading in foreign currency.
Explicit quantitative limits or approval procedures
PRC 2002: QFII introduced.
2006: QDII limits introduced.
2011: Limits on Hong Kong, China’s banks’ net open
positions and ability to access Yuan through mainland
foreign exchange market; also RQFII limits introduced.
India 2013: Cut maximum outward direct investment by companies
and individuals to 100% of net worth.
Rep. of Korea 2010: Limits on FX derivative contracts on domestic banks
(50% of capital) and foreign banks (250%).
2011: Limits on FX derivative contracts on domestic banks
(40% of capital) and foreign banks (200%).
2012: Limits on FX derivative contracts on domestic banks
(30% of capital) and foreign banks (150%).
Explicit taxes on cross- border flows (Tobin tax)
Indonesia 2010: One- month holding period on SBIs (central bank
notes).
Rep. of Korea 2011: Withholding tax on treasury and monetary
stabilization bonds.
Thailand 2010: 15% withholding tax on capital gains and interest
income on foreign bonds.
Compulsory reserve or deposit requirements (URR)
Thailand 2006: Unremunerated reserve requirements (30%) on loans,
bonds, mutual funds, swaps and non- resident Baht accounts
(abolished 2008).
Notes: PRC 5 People’s Republic of China (PRC); QFII 5 qualified foreign institutional
investors; QDII 5 qualified domestic institutional investors; RQFII 5 PRC renminbi
QFII; FX 5 foreign exchange; SBIs 5 central bank notes of Bank Indonesia; URR 5
unremunerated reserve requirement.
Sources: Central bank reports and other reports.
Regional financial regulation in Asia 141
To maximize its effectiveness, the AFSD should complement and
coordinate with existing regional entities, including the ERPD, EMEAP
and AMRO. For example, the AMRO and ERPD could focus mainly on
macroeconomic policies and surveillance, so the AFSD could focus more
on financial stability issues. Since not all Asian economies are members
of the FSB or the Basel Committee on Banking Supervision, the AFSD
could help to consolidate the viewpoints of Asian economies so they could
be delivered in global forums such as the FSB and the BIS. One question
is whether the AFSD would have its own secretariat or whether it would
be dependent on other institutions such as the AMRO for macroeconomic
and financial sector surveillance.
6.6 CONCLUSIONS
An increasingly financially integrated Asia will need more intensive finan-
cial cooperation, including greater efforts to harmonize and coordinate
financial supervision and regulation. In particular, greater financial open-
ness increases the potential vulnerability of Asian economies to the vicis-
situdes of volatile capital flows, underlining the needs for regional efforts
to improve financial stability. Increased economic integration as a result
of trade liberalization and the development of supply chain networks has
also increased the value of policy coordination, including stabilizing intra-
regional exchange rates. Finally, a gap has opened up between national
regulation efforts and global regulatory cooperation centered on the G20,
the IMF and the FSB, especially for non- G20 economies. Establishing a
regional regulatory architecture can help to fill that gap.
The EU represents the most advanced stage of regional financial
integration and regulation in the world today, and can provide valu-
able lessons for Asia, although it is by no means a benchmark or a
template. The eurozone sovereign debt and banking sector crisis has high-
lighted many weaknesses in the EU regional architecture that need to be
addressed. Fundamentally, the largely national- level regulatory structure
was ill- equipped to deal with the high level of financial integration in the
EU. Supervisory colleges based on voluntary MOUs have proved to be
weak reeds, and have tended to be supplanted by ad hoc arrangements in
an emergency. EU- wide supervisory institutions have been strengthened
recently, but their new powers are largely untested, and most power still
rests with national- level supervisors. Regulatory harmonization has made
great progress, but continued national variations make full harmonization
elusive. Regimes for resolution and deposit insurance in particular remain
unharmonized.
142 New global economic architecture
In response to these perceived inadequacies, the EU has committed
itself to shifting financial regulation from the national to the regional
level by establishing a banking union. This regionwide regulatory frame-
work will include the Single Supervisory Mechanism headed by the ECB
(launched in 2013) and regionwide resolution and deposit insurance
structures. These measures will have to be supported by fiscal union and
greater political union as well. This means that the implications of the
single market and the single currency are at last being followed to their
necessary conclusions. Without these developments, there can be no
lasting solution to the eurozone sovereign debt and banking sector crisis.
Asia has not reached the EU’s stage of having regional political and
legal institutions and integrated financial markets, let alone a single cur-
rency, so it is not feasible or necessary to emulate EU- wide policy arrange-
ments at this stage. Despite rather high average levels of economic and
financial development, financial openness and institutional regulatory
capacity vary much more widely in Asia than in the EU. Moreover, while
harmonization in the EU was driven to a large extent by market liber-
alization and adoption of international standards, this force is weaker in
ASEAN, reflecting both the current economic environment and varying
levels of economic and financial development within the region.
Despite its shortcomings and slow pace, the ASEAN Economic
Community process probably provides the most feasible and relevant
model for regulatory cooperation on a voluntary basis. It would be
desirable to extend this framework further within Asia, say to the
ASEAN+3 countries for a start. This approach will require a greater tol-
erance for different timetables of liberalization and harmonization. Only
those member countries that have achieved the requisite development
milestones should move on to higher stages of integration and regula-
tory harmonization. The AEC can be strengthened further by taking
steps to implement best practice regulation, promote mutual recognition
in areas such as fund management, harmonize market infrastructure
and promote cross- border supervisory MOUs. Use and publication of
country “scorecards” should be increased to incentivize harmonization
efforts.
Even within this less ambitious framework, Asian economies can
strengthen regional financial cooperation in various ways. They can
strengthen the ERPD by giving greater teeth to the surveillance process.
They can enhance and diversify the resources, functions and membership
of the CMIM and AMRO for surveillance and provision of a financial
safety net which may eventually develop into an Asian monetary fund.
They can create an AFSD to monitor regional financial markets, facilitate
policy dialogue and cooperation, and secure regional financial stability.
Regional financial regulation in Asia 143
These regional regulatory institutions can also strengthen ties with their
respective global institutions, primarily the IMF and the FSB.
NOTES
1. ASEAN includes: Brunei Darussalam, Cambodia, Indonesia, Lao People’s
Democratic Republic, Malaysia, Myanmar, Philippines, Singapore, Thailand and Viet
Nam.
2. ASEAN+3 includes the 10 ASEAN member countries plus the People’s Republic of
China (PRC), Japan and the Republic of Korea.
3. The eurozone sovereign debt and banking sector crisis has led to increased calls for EU-
wide supervision of major financial institutions, e.g. Barroso (2012).
4. See, for example, King and Levine (1993); Cecchetti and Kharroubi (2012); Levine
(2005); Beck et al. (2000); and Rajan and Zingales (1998). Whether this effect is causal
or not remains controversial, especially in light of the role of financial innovation
(Rodrik 2008; Schularick and Steger 2010).
5. Such efforts could eventually be extended to other parts of Asia as well.
6. The Geary–Khamis dollar is a hypothetical unit of currency that has the same purchas-
ing power parity that the United States (US) dollar has in the US at a given point in
time. The data are obtained from The Conference Board Total Economy Database™,
January 2013, http://www.conference- board.org/data/economydatabase/.
7. ASEAN+6 includes ASEAN+3 plus Australia, India and New Zealand.
8. “Supervisory colleges” refer to multilateral working groups of relevant supervisors
that are formed for the purpose of enhancing effective coordinated supervision of an
international banking group on an ongoing basis. EU authorities have developed a
framework of cooperation which is legally binding for all supervisory authorities from
the European Economic Area (in particular the Capital Requirement Directive- CRD
no. 2006/48/EC7) (Basel Committee on Banking Supervision 2010).
9. The ESFS includes the three ESAs and national financial supervisors in the EU.
10. It comprises the central banks of eleven economies: Reserve Bank of Australia, People’s
Bank of China, Hong Kong Monetary Authority, Bank Indonesia, Bank of Japan,
the Bank of Korea, Bank Negara Malaysia, Reserve Bank of New Zealand, Bangko
Sentral ng Pilipinas, Monetary Authority of Singapore and Bank of Thailand (IIMA
2005).
11. These include: Autoriti Monetari Brunei Darussalam; National Bank of Cambodia;
People’s Bank of China; Reserve Bank of Fiji; Reserve Bank of India; Bank Indonesia;
Bank of Korea; Bank of the Lao PDR; Bank Negara Malaysia; Bank of Mongolia;
Central Bank of Myanmar; Nepal Rastra Bank; Bank of Papua New Guinea; Bangko
Sentral ng Pilipinas; Monetary Authority of Singapore; Central Bank of Sri Lanka;
central bank of Taipei,China; Bank of Thailand; and State Bank of Vietnam.
12. Established in 2004 under the auspices of the ASEAN Finance Ministers, the ACMF
focuses on strategic issues to achieve greater integration of the region’s capital markets
under the AEC Blueprint 2015. Members include the relevant capital market supervi-
sory agencies in ASEAN member countries.
13. Previously, members needed to have an IMF program to be able to tap more than 20
per cent of their borrowing quota. This was raised to 30 per cent in May 2012. In view of
the negative perception of the IMF that developed during and after the Asian Financial
Crisis, going to the IMF has become anathema in much of Asia since then.
14. As mentioned above, the Single Resolution Mechanism was approved in 2014.
15. To be sure, the FSB established in 2011 the Regional Consultative Group for Asia (and
similar groups in other regions) with the specific intention of communicating with non-
FSB- member countries in Asia (FSB 2012). However, it still seems likely that an AFSD
144 New global economic architecture
would have greater ownership by Asian members and could speak for them with more
authority.
REFERENCES
ASEAN Secretariat. 1995. ASEAN Framework Agreement on Services. Jakarta: ASEAN Secretariat. Available at: http://www.aseansec.org/6628.htm (accessed 11 June 2012).
ASEAN Secretariat. 2007. ASEAN Economic Community Blueprint. Jakarta: ASEAN Secretariat. Available at: http://www.aseansec.org/21083.pdf (accessed 18 April 2012).
ASEAN Secretariat. 2008. Joint Statement of the 11th ASEAN Plus Three Finance Ministers’ Meeting. Madrid, 4 May. Available at: http://www.mof.go.jp/english/if/as3_080504.htm (accessed 12 April 2012).
ASEAN Secretariat. 2012. Joint Statement of the 15th ASEAN+3 Finance Ministers and Central Bank Governors’ Meeting. Manila, 3 May. Available at: http://www.aseansec.org/Joint%20Media%20Statement%20of%20the%20 15th % 20ASEAN+3 % 20Finance % 20Ministers % 20and % 20Centra l % 20Bank% 20Governors’%20Meeting.pdf (accessed 16 May 2012).
Barroso, J.M. 2012. State of the Union 2012 Address. Brussels: European Commission. 12 September. Available at: http://europa.eu/rapid/press- release_SPEECH- 12–596_en.htm?locale=en (accessed 8 December 2013).
Basel Committee on Banking Supervision. 2010. Good practice princi-ples on supervisory colleges. Basel, Switzerland: Bank for International Settlements. Available at: http://www.bis.org/publ/bcbs177.pdf (accessed 18 April 2012).
Beck, T., R. Levine and N.V. Loayza. 2000. Finance and the sources of growth. Journal of Financial Economics 58(1–2): 261–300.
Cecchetti, S. and E. Kharroubi. 2012. Reassessing the impact of finance on growth. BIS Working Papers No. 381. Basel, Switzerland: Bank for International Settlements. Available at: http://www.bis.org/publ/work381.pdf (accessed 30 July 2012).
Chinn, M. and H. Ito. 2006. What matters for financial development? Capital controls, institutions, and interactions. Journal of Development Economics 81(1): 163–92.
Constâncio, V. 2012. Towards a European Banking Union. Lecture held at the start of the academic year of the Duisenberg School of Finance, Amsterdam, 7 September. Available at: http://www.ecb.int/press/key/date/2012/html/sp120907.en.html (accessed 3 December 2012).
European Commission. 2009. The High- Level Group of Financial Supervision in the EU. Brussels: European Commission.
European Commission. 2012. Proposal for a Council Regulation conferring spe-cific tasks on the European Central Bank concerning policies relating to the prudential supervision of credit institutions. Brussels: European Commission. 12 September.
European Commission. 2013a. EFSF Lending Operations. Brussels: European Commission. Available at: http://www.efsf.europa.eu/about/operations/index.htm (accessed 8 January 2013).
Regional financial regulation in Asia 145
European Commission. 2013b. Proposal for a Regulation of the European Parliament and of the Council establishing uniform rules and a uniform proce-dure for the resolution of credit institutions and certain investment firms in the framework of a Single Resolution Mechanism and a Single Bank Resolution Fund and amending Regulation (EU) No. 1093/2010 of the European Parliament and of the Council. Brussels: European Commission. Available at: http://eur- lex.europa.eu / LexUriServ / LexUriServ.do?uri = COM:2013:0520:FIN:EN:PDF (accessed 10 January 2014).
European Council. 2012a. Euro Area Summit Statement. Brussels: European Council. 29 June. Available at: http://www.european- council.europa.eu/council- meetings.aspx (accessed 4 July 2012).
European Council. 2012b. European Council Conclusions on Completing EMU. Brussels: European Council. 18 October.
European Systemic Risk Board. 2012a. Organisation and Structure. Available at: http://www.esrb.europa.eu/about/orga/board/html/index.en.html (accessed 18 April 2012).
European Systemic Risk Board. 2012b. Mission, Objectives and Tasks. Brussels: European Commission. Available at: http://www.esrb.europa.eu/about/tasks/html/index.en.html (accessed 18 April 2012).
European Union. 2011. Financial services: Additional legislative proposal to complete the framework for financial supervision in Europe. Press release. 19 January. Available at: http://europa.eu/rapid/pressReleasesAction.do?referen ce=IP/11/49&format=HTML&aged=0&language=EN&guiLanguage=en (acc-essed 17 April 2012).
Financial Stability Board (FSB). 2012. Press release: Second Meeting of the Financial Stability Board Regional Consultative Group for Asia. Basel, Switzerland: Bank for International Settlements. 14 May. Available at: http://www.financialstabilityboard.org/press/pr_120514.pdf (accessed 4 July 2012).
Fullenkamp, C. and S. Sharma. 2012. Good Financial Regulation: Changing the Process is Crucial. London: International Centre for Financial Regulation and Financial Times. Available at: http://www.icffr.org/assets/pdfs/February- 2012/ ICFR- - - Financial- Times- Research- Prize- 2011 / C - Fullenkamp - and - S - Sharma- - - Good- Financial- Regulat.aspx (accessed 13 June 2012).
Independent Commission on Banking (ICB). 2011. Final Report Recommendations. London: Independent Commission on Banking.
Institute for International Monetary Affairs. 2005. Economic Surveillance and Policy Dialogue in East Asia. Jakarta, Indonesia: ASEAN Secretariat. Available at: http://www.aseansec.org/17890.pdf (accessed 20 April 2012).
International Monetary Fund (IMF). 2012. Annual Report on Exchange Arrangements and Exchange Restrictions. Washington, DC: International Monetary Fund.
International Monetary Fund (IMF). 2013. Myanmar 2013 Article IV Consultation and First Review Under the Staff- Monitored Program. IMF Country Report No. 13/240. Washington, DC: International Monetary Fund.
Kawai, M. 2011. G- 20 financial reforms and emerging Asia’s challenges. In K. Dervis, M. Kawai and D. Lombardi (eds) Asia and Policymaking for the Global Economy. Washington, DC: The Brookings Institution.
Kawai, M. and C. Houser. 2008. Evolving ASEAN+3 ERPD: Toward peer reviews or due diligence? In OECD (eds) Shaping Policy Reform and Peer Review
146 New global economic architecture
in Southeast Asia: Integrating Economies amid Diversity. Paris: Organisation for Economic Co- operation and Development.
King, R.G. and R. Levine. 1993. Finance and growth: Schumpeter might be right. Policy Research Working Paper Series No. 1083. Washington, DC: The World Bank.
Kuroda, H. 2008. Asia’s contribution to global development and stability. Closing remarks presented at the ADBI Annual Conference. Tokyo, 5 December. Available at: http://www.adbi.org/speeches/2008/12/05/2760.closing.remarks.kuroda.asia.global.financial.crisis.conference/
Lanexang Securities Public Company. 2013. Lao Investment Guide. Vientiane: Lanexang Securities Public Company. Available at: http://www.lxs.com.la/files/ Lao % 20Investment % 20Guide/Lao % 20Investment % 20Guide % 20 % 5BEnglish- Version%5D%20- %20October%202013.pdf (accessed 9 January 2014).
Levine, R. 2005. Finance and growth: Theory and evidence. In P. Aghion and S. Durlauf (eds) Handbook of Economic Growth. Amsterdam: Elsevier Science.
Plummer, M. 2012. Regional monitoring of capital flows and coordination of financial regulation: Stakes and options for Asia. In M. Kawai, D. Mayes and P. Morgan (eds) Implications of the Global Financial Crisis for Financial Reform and Regulation in Asia. Cheltenham, UK and Northampton, MA, USA: Edward Elgar Publishing.
Posner, E. and N. Véron. 2010. The EU and financial regulation: Power without purpose? Journal of European Public Policy 17(3): 400–15.
Rajan, R. and L. Zingales. 1998. Financial dependence and growth. American Economic Review 88(3): 559–86.
Rodrik, D. 2008. A practical approach to formulating growth strategies. In J. Stiglitz and N. Serra (eds) The Washington Consensus Reconsidered: Towards a New Global Governance. New York: Oxford University Press.
Rompuy, H. van. 2012. Towards a genuine economic and monetary union. Report by President of the European Council. Brussels: European Council. 26 June.
Schularick, M. and T. Steger. 2010. Financial integration, investment, and eco-nomic growth: Evidence from two eras of financial globalization. Review of Economics and Statistics 92(4): 756–68.
Sussangkarn, C. 2010. The Chiang Mai Initiative Multilateralization: Origin, Development and Outlook. ADBI Working Paper No. 230. Tokyo: Asian Development Bank Institute. Available at: http://www.adbi.org/files/2010.07.13.wp230.chiang.mai.initiative.multilateralisation.pdf (accessed 13 March 2012).
The 21st Century Public Policy Institute. 2011. Asian Bond Markets Development and Regional Financial Cooperation. Tokyo: The 21st Century Public Policy Institute. Available at: http://asianbondsonline.adb.org/publications/exter nal/2011/Asian _ Bond _ Markets _ Development _ and_Regional_Financial_Coop eration.pdf (accessed 2 March 2012).
Véron, N. 2012a. Financial reform after the crisis: An early assessment. PIIE Working Paper WP 2–12. Washington, DC: Peterson Institute for International Economics. Available at: http://www.piie.com/publications/wp/wp12–2.pdf (accessed 15 May 2012).
Véron, N. 2012b. Europe’s Single Supervisory Mechanism and the Long Journey towards a Banking Union. Brussels: Directorate General for Internal Policies, European Parliament.
Winkler, A. 2012. The financial crisis: A wake- up call for strengthening regional monitoring of financial markets and regional coordination of financial sector
Regional financial regulation in Asia 147
policies? In M. Kawai, D. Mayes and P. Morgan (eds) Implications of the Global Financial Crisis for Financial Reform and Regulation in Asia. Cheltenham, UK and Northampton, MA, USA: Edward Elgar Publishing.
Wymeersch, E. 2010. Global and regional financial regulation: The viewpoint of a European securities regulator. Global Policy 1(2): 201–08.
148
7. Evolving trade policy architecture and FTAs in Asia
Masahiro Kawai and Ganeshan Wignaraja*
7.1 INTRODUCTION
Asia’s trade policy architecture is witnessing a proliferation of free trade
agreements (FTAs) with significant implications for economies and firms
alike. This marks a break with past trade policy in the region. Asia’s
famous economic rise as the “global factory” over several decades was
facilitated by outward- oriented development strategies and a multilateral
approach based initially on the General Agreement on Tariffs and Trade
(GATT) and then its successor, the World Trade Organization (WTO).
Free trade agreements (FTAs), as trade- policy instruments in Asia, were
largely absent in the region’s trade policy architecture during Asia’s eco-
nomic rise.1
Today, the region is a leader in global FTA activity with about 76
concluded FTAs in 2013 (up from only 3 in 2000). Its largest econo-
mies (People’s Republic of China [PRC], India and Japan) as well as a
few advanced ASEAN economies (e.g. Singapore and Thailand) have
become key players in FTA activity (see Appendix Table 7A.1). Reflecting
the growth of FTAs, the importance of FTAs to Asia’s trade has also
increased. Several reasons seem to underlie the spread in Asian FTAs,
including market access for goods trade, the need to remove impediments
to deepening regional production networks and supply chains, the intensi-
fication of FTA activity in Europe and the Americas, and slow progress in
WTO Doha Round trade talks.
Various concerns over Asia’s evolving FTA- centric trade policy archi-
tecture have been raised in a growing body of literature on Asian FTAs
(e.g. Banda and Whalley 2005; Manchin and Pelkmans- Balaoing 2007;
Bhagwati 2008; Drysdale and Armstrong 2010). Issues highlighted in this
literature include: shallow coverage of agricultural trade, limited services
trade liberalization, insufficient WTO- plus elements, low use of FTA
preferences, and an Asian noodle bowl of multiple rules of origin (ROO).
This chapter examines these concerns on the role of FTAs in Asia’s
Evolving trade policy architecture and FTAs in Asia 149
trade policy architecture from a pragmatic perspective, with a view to
providing better informed policy decisions. These topics are the front
line of contemporary Asian trade negotiations and of interest to policy-
makers. This chapter scrutinizes these concerns using new data on the
contents of existing FTAs and business impacts of FTAs. It also explores
policy implications from the growth of Asian FTAs including competi-
tion among the Asia- led Regional Comprehensive Economic Partnership
(RCEP) and the US- led Trans- Pacific Strategic Economic Partnership
(TPP) as the future basis for a region- wide FTA as well as the role of the
WTO.
The remainder of the chapter is structured as follows. Sections 7.2–7.6
discuss the concerns; section 7.7 explores policy implications at national,
regional and multilateral levels. Section 7.8 concludes.
7.2 SHALLOW COVERAGE OF AGRICULTURAL TRADE
A major concern about Asian FTAs may be the extent of coverage of agri-
cultural goods trade. The literature shows that the coverage of agricultural
trade differs markedly among current Asian FTAs (Feridhanusetyawan
2005). Agricultural trade tended to be excluded from most of the early
agreements due to pressure from powerful farm lobbies or social concerns
regarding poverty in rural areas.
Two problems have hampered empirical research on the coverage of
agricultural goods trade in Asian FTAs. First, little systematic data and
analysis have been available on the treatment of agricultural products
across Asian FTAs. Second, clear criteria for the “substantially all trade”
rule do not seem to exist. With the development of new databases on
Asian FTAs – for example, the Asian Development Bank’s (ADB) Asia
Regional Integration Center database – new sources of FTA data are now
available. Furthermore, tariff lines for agricultural products can be used as
a basis to gauge the criteria of the majority of all trade.
A simple three- fold classification system was used to categorize Asian
FTAs according to tariff line coverage of agricultural products. Given
the complexity of provisions for agriculture in many agreements, and
the availability of tariff schedules and exclusion lists at the product level,
a combination of coverage of product lines and exclusions was used to
assess each agreement. The classifications are as follows:
1. Comprehensive coverage: at least 85 per cent of all agricultural
product lines in a given agreement are covered, or not more than 150
150 New global economic architecture
product lines are excluded. FTAs with these features for agricultural
products are taken as covering the majority of all trade.
2. No, or limited, coverage: agricultural products are completely
excluded in the agreement, or less than 100 product lines are included.
3. Some coverage: more agricultural products are included in FTAs
than “no or limited coverage”, but fewer products are covered than
“comprehensive coverage”. Agreements with such coverage typically
include more than 100 agricultural product lines, but less than 85 per
cent of agricultural product lines. These agreements may also exclude
over 150 agricultural product lines.
It was possible to apply this classification system to examine the agricul-
tural coverage of concluded Asian FTAs during 2000–13 and the results are
provided in Table 7.1. The first part of the table suggests Asian FTAs have
become more comprehensive in their coverage of agricultural products
over time. AFTA, for instance, was originally proposed for only 10 manu-
facturing sectors, and included agriculture at a later stage. The three con-
cluded FTAs in 2000 had no or limited coverage of agriculture. Concluded
FTA numbers grew to 22 in 2005. Of these 8 (36 per cent) were regarded
as comprehensive in coverage of agriculture, 5 (23 per cent) had some cov-
erage and 9 (41 per cent) had no or limited coverage. Further expansion
of FTAs occurred thereafter. Of the 77 agreements for which texts2 were
available in December 2013, 40 (52 per cent) have comprehensive coverage
of agriculture while another 19 (25 per cent) have some coverage of these
items. The remaining 18 (23 per cent) have limited or no coverage.
The Republic of Korea has comprehensive coverage of agriculture in
its FTAs. For instance, under the Republic of Korea–United States FTA
(KORUS), the Republic of Korea will eliminate tariffs on almost two-
thirds of current US agricultural exports upon entry into force, including
wheat, corn and cotton. Tariffs and import quotas on most other agricul-
tural goods will be phased out within 10 years. The Republic of Korea
even agreed to eliminate its 40 per cent tariff on beef muscle meats over a
15- year period.3
7.3 LIMITED SERVICES TRADE LIBERALIZATION
A second concern is limited services trade liberalization in Asian FTAs.
Services account for more than half the GDP of most Asian countries
and trade in services has grown rapidly (Hoekman and Mattoo 2011).
Studies suggest that impediments to trade in services, particularly regula-
tory restrictions on foreign services and service providers, exist across Asia
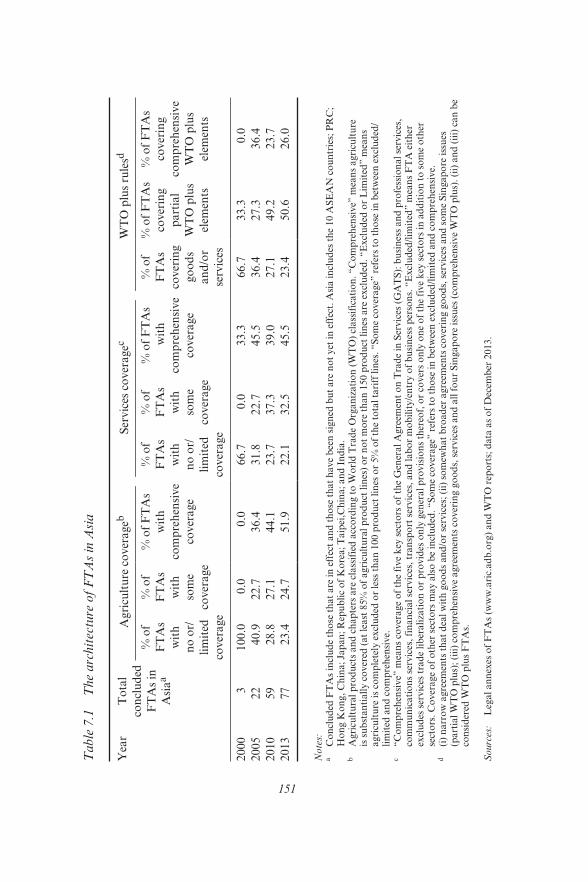
151
Table
7.1
T
he
arc
hit
ectu
re o
f F
TA
s in
Asi
a
Yea
rT
ota
l
con
clu
ded
FT
As
in
Asi
aa
Agri
cult
ure
co
ver
ageb
Ser
vic
es c
over
agec
WT
O p
lus
rule
sd
% o
f
FT
As
wit
h
no
or/
lim
ited
cover
age
% o
f
FT
As
wit
h
som
e
cover
age
% o
f F
TA
s
wit
h
com
pre
hen
sive
cover
age
% o
f
FT
As
wit
h
no
or/
lim
ited
cover
age
% o
f
FT
As
wit
h
som
e
cover
age
% o
f F
TA
s
wit
h
com
pre
hen
sive
cover
age
% o
f
FT
As
cover
ing
go
od
s
an
d/o
r
serv
ices
% o
f F
TA
s
cover
ing
part
ial
WT
O p
lus
elem
ents
% o
f F
TA
s
cover
ing
com
pre
hen
sive
WT
O p
lus
elem
ents
2000
3100.0
0.0
0.0
66.7
0.0
33.3
66.7
33.3
0.0
2005
22
40.9
22.7
36.4
31.8
22.7
45.5
36.4
27.3
36.4
2010
59
28.8
27.1
44.1
23.7
37.3
39.0
27.1
49.2
23.7
2013
77
23.4
24.7
51.9
22.1
32.5
45.5
23.4
50.6
26.0
Note
s:a
Co
ncl
ud
ed F
TA
s in
clu
de
tho
se t
hat
are
in
eff
ect
an
d t
ho
se t
hat
have
bee
n s
ign
ed b
ut
are
no
t yet
in
eff
ect.
Asi
a i
ncl
ud
es t
he
10 A
SE
AN
co
un
trie
s; P
RC
;
Ho
ng K
on
g,
Ch
ina;
Jap
an
; R
epu
bli
c o
f K
ore
a;
Taip
ei,C
hin
a;
an
d I
nd
ia.
b
Agri
cult
ura
l p
rod
uct
s an
d c
hap
ters
are
cla
ssif
ied
acc
ord
ing t
o W
orl
d T
rad
e O
rgan
izati
on
(W
TO
) cl
ass
ific
ati
on
. “C
om
pre
hen
sive”
mea
ns
agri
cult
ure
is s
ub
stan
tiall
y c
over
ed (
at
least
85%
of
agri
cult
ura
l p
rod
uct
lin
es)
or
no
t m
ore
th
an
150 p
rod
uct
lin
es a
re e
xcl
ud
ed.
“E
xcl
ud
ed o
r L
imit
ed” m
ean
s
agri
cult
ure
is
com
ple
tely
excl
ud
ed o
r le
ss t
han
10
0 p
rod
uct
lin
es o
r 5%
of
the
tota
l ta
riff
lin
es.
“S
om
e co
ver
age”
ref
ers
to t
ho
se i
n b
etw
een
excl
ud
ed/
lim
ited
an
d c
om
pre
hen
sive.
c “C
om
pre
hen
sive”
mea
ns
cover
age
of
the
five
key
sec
tors
of
the
Gen
eral
Agre
emen
t o
n T
rad
e in
Ser
vic
es (
GA
TS
): b
usi
nes
s an
d p
rofe
ssio
nal
serv
ices
,
com
mu
nic
ati
on
s se
rvic
es,
fin
an
cial
serv
ices
, tr
an
spo
rt s
ervic
es,
an
d l
ab
or
mo
bil
ity/e
ntr
y o
f b
usi
nes
s p
erso
ns.
“E
xcl
ud
ed/l
imit
ed” m
ean
s F
TA
eit
her
excl
ud
es s
ervic
es t
rad
e li
ber
ali
zati
on
or
pro
vid
es o
nly
gen
eral
pro
vis
ion
s th
ereo
f, o
r co
ver
s o
nly
on
e o
f th
e fi
ve
key
sec
tors
in
ad
dit
ion
to
so
me
oth
er
sect
ors
. C
over
age
of
oth
er s
ecto
rs m
ay a
lso
be
incl
ud
ed.
“S
om
e co
ver
age”
ref
ers
to t
ho
se i
n b
etw
een
excl
ud
ed/l
imit
ed a
nd
co
mp
reh
ensi
ve.
d
(i)
narr
ow
agre
emen
ts t
hat
dea
l w
ith
go
od
s an
d/o
r se
rvic
es;
(ii)
so
mew
hat
bro
ad
er a
gre
emen
ts c
over
ing g
oo
ds,
ser
vic
es a
nd
so
me
Sin
gap
ore
iss
ues
(part
ial
WT
O p
lus)
; (i
ii)
com
pre
hen
sive
agre
emen
ts c
over
ing g
oo
ds,
ser
vic
es a
nd
all
fo
ur
Sin
gap
ore
iss
ues
(co
mp
reh
ensi
ve
WT
O p
lus)
. (i
i) a
nd
(ii
i) c
an
be
con
sid
ered
WT
O p
lus
FT
As.
Sourc
es:
Leg
al
an
nex
es o
f F
TA
s (w
ww
.ari
c.ad
b.o
rg)
an
d W
TO
rep
ort
s; d
ata
as
of
Dec
emb
er 2
013.
152 New global economic architecture
(Findlay et al. 2009). Such impediments may occur in ownership rules,
technical regulations, licensing and qualification requirements.
A lack of data on trade in services makes it hard to estimate the value
of the services trade covered by an FTA. There also seems to be limited
consensus on the meaning of “substantial sectoral coverage” in the serv-
ices trade and an assessment of “national treatment” requires detailed
subsectoral analysis. Furthermore, varying liberalization approaches to
services (e.g. positive, negative or hybrid approaches to negotiations on
the General Agreement on Trade in Services, or GATS) and an absence
of disaggregated data on trade in services makes it difficult to quantify
substantial sector coverage.
A practical way forward is to focus on requirement (i) of the GATS and
to interpret “substantial sectoral coverage” to mean that a high- quality
FTA should cover key service sectors.4 The GATS classification list of 12
service sectors is a useful input for creating a simple three- fold classifica-
tion of Asian FTAs as follows:
1. Comprehensive coverage of services: FTA covers the five key sectors
of the GATS: business and professional services, communications
services, financial services, transport services, and labor mobility/
entry of business persons. Coverage of other sectors may also be
included. The five sectors were chosen as the yardstick because they
are the main sectors in terms of the value of services trade in Asia and
also subject to multiple regulatory barriers on foreign services and
service providers.
2. Excluded or limited coverage of services: FTA either excludes ser-
vices trade liberalization or provides only general provisions thereof,
or covers only one of the five key sectors in addition to some other
sectors.
3. Some coverage of services: FTA is not otherwise classified as com-
prehensive, excluded or limited. Such an FTA would typically cover
between two and four key sectors of the GATS and some minor
sectors.
A sector is considered as covered if at least one party includes its GATS
and GATS- plus commitments, regardless of the number of sub- sectors,
volume of trade affected, or the four modes of supply.5 This classification
system was applied to Asian FTAs during 2000–13 (see the second part
of Table 7.1). The evidence indicates a trend in Asian FTAs towards pro-
gressively liberalizing the service sectors of participants and providing for
deeper regulatory cooperation in services over time. In the early 2000s, the
majority of FTAs had limited or some coverage of services. By 2005, 10
Evolving trade policy architecture and FTAs in Asia 153
FTAs6 (45 per cent) were deemed to be comprehensive in covering at least
five key services, 5 (23 per cent) provided coverage of between two and
four key sectors, and 7 (32 per cent) had little or no coverage. Thereafter,
most new FTAs typically incorporated either comprehensive or some
coverage of services. Of the 77 FTAs in 2013, 35 (45 per cent) were com-
prehensive and another 25 (33 per cent) had some coverage. Only 17 (22
per cent) had no or limited coverage.
Many Asian FTAs adhere to key GATS principles such as market
access (quota elimination); national treatment (equal treatment of local
and foreign service providers); MFN treatment (service suppliers of an
FTA member will automatically receive benefits given to other future
FTA parties); reasonable, impartial and objective domestic regulations;
transparency; and mutual recognition agreements (MRAs). MRAs enable
the qualifications of professional services suppliers to be mutually recog-
nized by signatory member states, thereby facilitating the easier movement
of professional service providers among the member countries.
Several Asian FTAs also provide for GATS- plus commitments,
meaning that the FTA liberalization goes beyond WTO commitments in
relation to subsectors or regulations. The Japan–Singapore agreement is
particularly comprehensive, with each side expanding its commitments
in more than 130 sectors focusing on national treatment (i.e. treating
service suppliers from the FTA partner country as nationals). Additional
comprehensive disciplines for financial and telecommunications serv-
ices are imposed through two separate annexes. In the EU–Republic of
Korea FTA, the Republic of Korea commits to liberalize more than 100
sectors, including telecommunications, environmental, transport, con-
struction, financial, postal and express delivery, professional services such
as legal, accounting, engineering and architectural services. Finally, in
the ASEAN–Australia–New Zealand FTA (AANZFTA), the six original
ASEAN members expanded the liberalization of their telecommunication
services to additional subsectors, while four others (Indonesia, Malaysia,
Philippines and Singapore) went even further with their commitments in
financial services. Australia and New Zealand have also made GATS- plus
commitments covering modes 1–3 (refer to note 5) in a number of sectors,
including business and financial services.
Although there is variation across Asian FTAs in terms of coverage of
services, more emphasis is being placed on services trade liberalization
than before. Newer agreements, particularly those between developed
and developing countries, typically encompass the five key sectors of
the GATS (business and professional services, communications services,
financial services, transport services, and labor mobility/entry of business
persons).
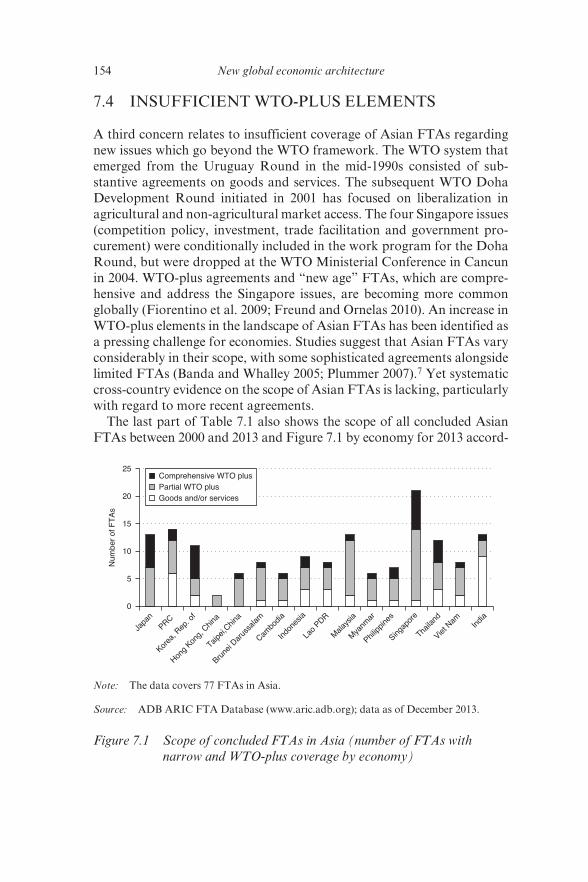
154 New global economic architecture
7.4 INSUFFICIENT WTO- PLUS ELEMENTS
A third concern relates to insufficient coverage of Asian FTAs regarding
new issues which go beyond the WTO framework. The WTO system that
emerged from the Uruguay Round in the mid- 1990s consisted of sub-
stantive agreements on goods and services. The subsequent WTO Doha
Development Round initiated in 2001 has focused on liberalization in
agricultural and non- agricultural market access. The four Singapore issues
(competition policy, investment, trade facilitation and government pro-
curement) were conditionally included in the work program for the Doha
Round, but were dropped at the WTO Ministerial Conference in Cancun
in 2004. WTO- plus agreements and “new age” FTAs, which are compre-
hensive and address the Singapore issues, are becoming more common
globally (Fiorentino et al. 2009; Freund and Ornelas 2010). An increase in
WTO- plus elements in the landscape of Asian FTAs has been identified as
a pressing challenge for economies. Studies suggest that Asian FTAs vary
considerably in their scope, with some sophisticated agreements alongside
limited FTAs (Banda and Whalley 2005; Plummer 2007).7 Yet systematic
cross- country evidence on the scope of Asian FTAs is lacking, particularly
with regard to more recent agreements.
The last part of Table 7.1 also shows the scope of all concluded Asian
FTAs between 2000 and 2013 and Figure 7.1 by economy for 2013 accord-
0
5
10
15
20
25
Num
ber
of F
TA
s
Comprehensive WTO plusPartial WTO plusGoods and/or services
Japa
nPRC
Korea
, Rep
. of
Hong
Kong,
Chin
a
Taipei,
China
Brune
i Dar
ussa
lam
Cambo
dia
Indo
nesia
Lao
PDR
Mala
ysia
Mya
nmar
Philipp
ines
Singap
ore
Thaila
nd
Viet N
am India
Note: The data covers 77 FTAs in Asia.
Source: ADB ARIC FTA Database (www.aric.adb.org); data as of December 2013.
Figure 7.1 Scope of concluded FTAs in Asia (number of FTAs with
narrow and WTO- plus coverage by economy)
Evolving trade policy architecture and FTAs in Asia 155
ing to (i) narrow agreements that deal with goods and/or services; (ii) some-
what broader agreements covering goods, services and some Singapore
issues (partial WTO- plus); (iii) comprehensive agreements covering
goods, services and all four Singapore issues (comprehensive WTO- plus).
Agreements (ii) and (iii) can be considered WTO- plus FTAs. The scope of
concluded agreements reflects a combination of economic interests, eco-
nomic strength and negotiation capacity. The pattern is striking. The early
Asian FTAs seemed to be concerned largely with goods and services. From
the mid- 2000s onwards, however, significantly more emphasis was given to
broad agreements with many WTO- plus elements. By 2013, 20 (26 per cent)
were goods and/or services only FTAs, 39 (51 per cent) were partial WTO-
plus FTAs, and 18 (23 per cent) were comprehensive WTO- plus FTAs.
Three leading participants in Asian FTAs – Japan, Singapore and
Republic of Korea – strongly favor a WTO- plus approach to FTAs and
are increasingly emphasizing comprehensive agreements. All of Japan’s
agreements and most of Singapore’s and the Republic of Korea’s are
WTO- plus. Likewise, Thailand, Malaysia, Brunei Darussalam, Indonesia,
Philippines and Viet Nam largely follow a WTO- plus format.
7.5 LOW USE OF FTA PREFERENCES
Low preference use at the firm level is a fourth concern associated with
Asian FTAs. Well designed and comprehensive FTAs provide numerous
benefits, including preferential tariffs, market access and new business
opportunities. One might assume that firms would desire to avail them-
selves of such benefits once a given FTA is in effect. Previous studies at the
country and industry levels, however, suggest that FTA preference utiliza-
tion rates – based on shares of export value enjoying preferences – are low
in Asian countries and that FTAs are underutilized (Baldwin 2006; World
Bank 2007; Drysdale and Armstrong 2010; Ravenhill 2010). This is mainly
due to the increasing number of zero MFN tariff lines. Accordingly, Asian
FTAs are often viewed as discriminatory and a drain on scarce trade nego-
tiation capacity in developing countries (Bhagwati 2008).
Information on certificates of origin, based on databases of customs
authorities or business associations, covers all the users of FTA prefer-
ences in a given country. One of the difficulties in investigating the evo-
lution of FTA preferences is that most Asian countries do not publish
official information. Fortunately, Thailand is an exception and publishes
official FTA use information in the Thai language which was obtained
from secondary sources (JETRO 2010, 2012). Data for the Republic of
Korea, Malaysia and Viet Nam are not published but were obtained from
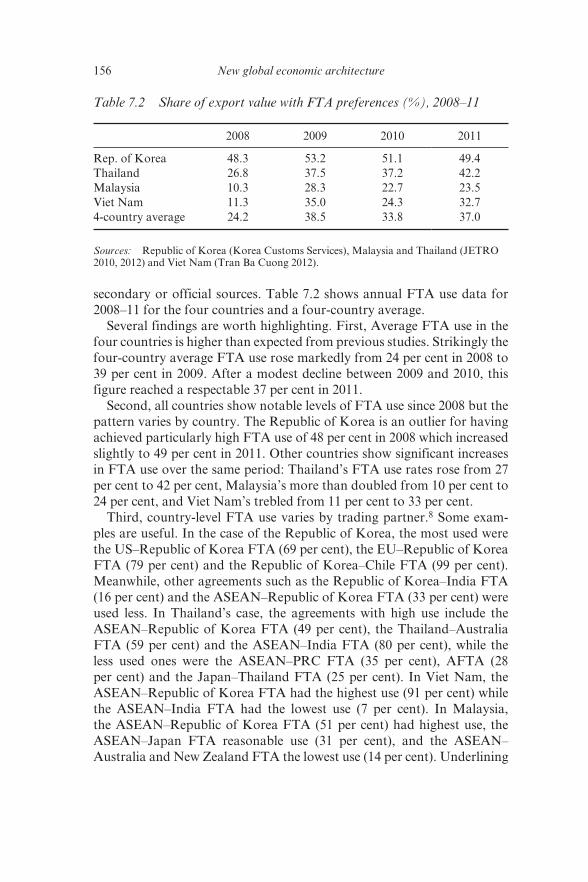
156 New global economic architecture
secondary or official sources. Table 7.2 shows annual FTA use data for
2008–11 for the four countries and a four- country average.
Several findings are worth highlighting. First, Average FTA use in the
four countries is higher than expected from previous studies. Strikingly the
four- country average FTA use rose markedly from 24 per cent in 2008 to
39 per cent in 2009. After a modest decline between 2009 and 2010, this
figure reached a respectable 37 per cent in 2011.
Second, all countries show notable levels of FTA use since 2008 but the
pattern varies by country. The Republic of Korea is an outlier for having
achieved particularly high FTA use of 48 per cent in 2008 which increased
slightly to 49 per cent in 2011. Other countries show significant increases
in FTA use over the same period: Thailand’s FTA use rates rose from 27
per cent to 42 per cent, Malaysia’s more than doubled from 10 per cent to
24 per cent, and Viet Nam’s trebled from 11 per cent to 33 per cent.
Third, country- level FTA use varies by trading partner.8 Some exam-
ples are useful. In the case of the Republic of Korea, the most used were
the US–Republic of Korea FTA (69 per cent), the EU–Republic of Korea
FTA (79 per cent) and the Republic of Korea–Chile FTA (99 per cent).
Meanwhile, other agreements such as the Republic of Korea–India FTA
(16 per cent) and the ASEAN–Republic of Korea FTA (33 per cent) were
used less. In Thailand’s case, the agreements with high use include the
ASEAN–Republic of Korea FTA (49 per cent), the Thailand–Australia
FTA (59 per cent) and the ASEAN–India FTA (80 per cent), while the
less used ones were the ASEAN–PRC FTA (35 per cent), AFTA (28
per cent) and the Japan–Thailand FTA (25 per cent). In Viet Nam, the
ASEAN–Republic of Korea FTA had the highest use (91 per cent) while
the ASEAN–India FTA had the lowest use (7 per cent). In Malaysia,
the ASEAN–Republic of Korea FTA (51 per cent) had highest use, the
ASEAN–Japan FTA reasonable use (31 per cent), and the ASEAN–
Australia and New Zealand FTA the lowest use (14 per cent). Underlining
Table 7.2 Share of export value with FTA preferences (%), 2008–11
2008 2009 2010 2011
Rep. of Korea 48.3 53.2 51.1 49.4
Thailand 26.8 37.5 37.2 42.2
Malaysia 10.3 28.3 22.7 23.5
Viet Nam 11.3 35.0 24.3 32.7
4- country average 24.2 38.5 33.8 37.0
Sources: Republic of Korea (Korea Customs Services), Malaysia and Thailand (JETRO
2010, 2012) and Viet Nam (Tran Ba Cuong 2012).
Evolving trade policy architecture and FTAs in Asia 157
the role of FTAs in facilitating market access, some agreements with
major markets appear to have higher FTA use (e.g. the US–Republic of
Korea FTA and EU–Republic of Korea FTA) than others. More attrac-
tive tariff preferences for key products and more simplified rules of origin
may help explain why some FTAs are often more attractive to firms than
other agreements.
While certificate of origin data comprehensively cover FTA users,
they do not highlight the characteristics of FTA users nor impedi-
ments to using FTAs. Accordingly, more micro- level analysis using firm
surveys in several countries are required to highlight these issues. Six
comprehensive surveys of manufacturing exporting firms conducted in
2007–08 by ADB, the Asian Development Bank Institute (ADBI) and
several partner researchers in Japan, PRC, Republic of Korea, Singapore,
Thailand and Philippines shed light on the use of FTA preferences (see
Kawai and Wignaraja 2011b; Wignaraja 2010). In addition, surveys of
Indonesia and Malaysia were conducted by ADB and ADBI in 2011 and
2012 respectively (see Wignaraja 2013). The surveys yielded 1281 Asian
sample firms and the details of the firm survey methodology are provided
in Kawai and Wignaraja (2011b).9
The reasons that the majority of Asian sample firms do not currently use
FTA preferences are not widely known. The ADB/ADBI surveys generated
responses on the reasons for non- use of FTA preferences and some of these
results are shown in Table 7.3. Surprisingly, a lack of information on FTAs
was the most significant reason for non- use of preferences as reported by
56 per cent of firms surveyed in the Philippines, 51 per cent in Malaysia, 45
per cent in PRC, 40 per cent in Indonesia and 34 per cent in the Republic
of Korea. Low margins of preference and delays and administrative costs
associated with rules of origin were the second and third most common
reasons cited. Other reasons for non- use included: not interested in trading
with FTA partners; use of other schemes such as export processing zones
and the Information Technology Agreement for exporters, which also
provide incentives for exporters; and non- tariff measures in partner coun-
tries that inhibit exports and, hence, use of FTA preferences.
7.6 AN ASIAN “NOODLE BOWL” OF MULTIPLE RULES OF ORIGIN (ROOS)
ROOs are another potential concern for Asian FTAs. These are devices
to determine which goods will enjoy preferential tariffs in order to prevent
trade deflection among FTA members. An influential strand of literature
argues that Asian FTAs have complicated ROOs, sparking concerns about
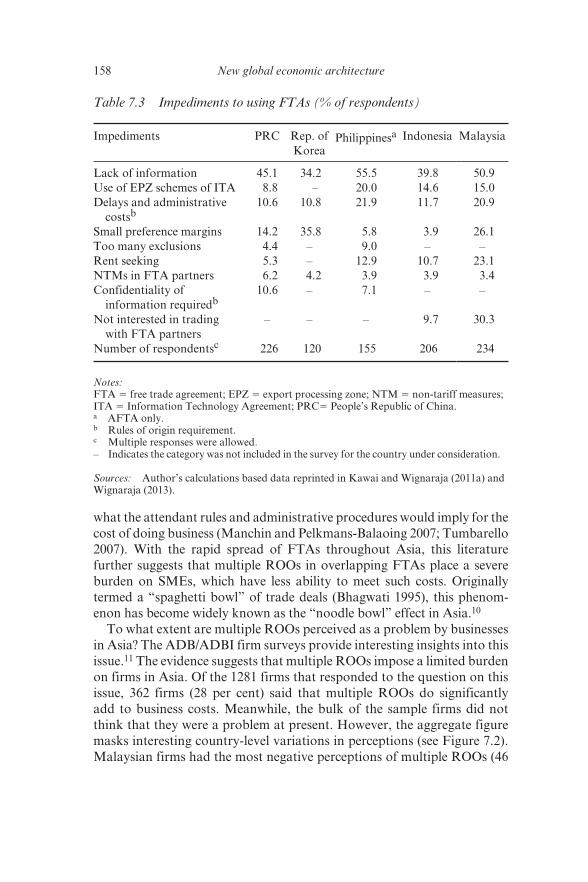
158 New global economic architecture
what the attendant rules and administrative procedures would imply for the
cost of doing business (Manchin and Pelkmans- Balaoing 2007; Tumbarello
2007). With the rapid spread of FTAs throughout Asia, this literature
further suggests that multiple ROOs in overlapping FTAs place a severe
burden on SMEs, which have less ability to meet such costs. Originally
termed a “spaghetti bowl” of trade deals (Bhagwati 1995), this phenom-
enon has become widely known as the “noodle bowl” effect in Asia.10
To what extent are multiple ROOs perceived as a problem by businesses
in Asia? The ADB/ADBI firm surveys provide interesting insights into this
issue.11 The evidence suggests that multiple ROOs impose a limited burden
on firms in Asia. Of the 1281 firms that responded to the question on this
issue, 362 firms (28 per cent) said that multiple ROOs do significantly
add to business costs. Meanwhile, the bulk of the sample firms did not
think that they were a problem at present. However, the aggregate figure
masks interesting country- level variations in perceptions (see Figure 7.2).
Malaysian firms had the most negative perceptions of multiple ROOs (46
Table 7.3 Impediments to using FTAs (% of respondents)
Impediments PRC Rep. of
KoreaPhilippinesa Indonesia Malaysia
Lack of information 45.1 34.2 55.5 39.8 50.9
Use of EPZ schemes of ITA 8.8 – 20.0 14.6 15.0
Delays and administrative
costsb10.6 10.8 21.9 11.7 20.9
Small preference margins 14.2 35.8 5.8 3.9 26.1
Too many exclusions 4.4 – 9.0 – –
Rent seeking 5.3 – 12.9 10.7 23.1
NTMs in FTA partners 6.2 4.2 3.9 3.9 3.4
Confidentiality of
information requiredb10.6 – 7.1 – –
Not interested in trading
with FTA partners
– – – 9.7 30.3
Number of respondentsc 226 120 155 206 234
Notes:
FTA 5 free trade agreement; EPZ 5 export processing zone; NTM 5 non- tariff measures;
ITA 5 Information Technology Agreement; PRC5 People’s Republic of China.a AFTA only.b Rules of origin requirement.c Multiple responses were allowed.
– Indicates the category was not included in the survey for the country under consideration.
Sources: Author’s calculations based data reprinted in Kawai and Wignaraja (2011a) and
Wignaraja (2013).
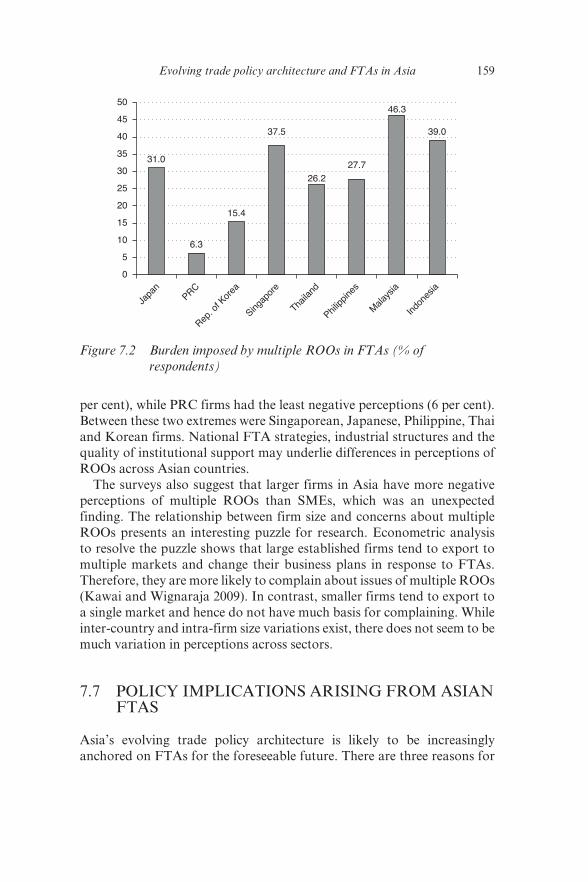
Evolving trade policy architecture and FTAs in Asia 159
per cent), while PRC firms had the least negative perceptions (6 per cent).
Between these two extremes were Singaporean, Japanese, Philippine, Thai
and Korean firms. National FTA strategies, industrial structures and the
quality of institutional support may underlie differences in perceptions of
ROOs across Asian countries.
The surveys also suggest that larger firms in Asia have more negative
perceptions of multiple ROOs than SMEs, which was an unexpected
finding. The relationship between firm size and concerns about multiple
ROOs presents an interesting puzzle for research. Econometric analysis
to resolve the puzzle shows that large established firms tend to export to
multiple markets and change their business plans in response to FTAs.
Therefore, they are more likely to complain about issues of multiple ROOs
(Kawai and Wignaraja 2009). In contrast, smaller firms tend to export to
a single market and hence do not have much basis for complaining. While
inter- country and intra- firm size variations exist, there does not seem to be
much variation in perceptions across sectors.
7.7 POLICY IMPLICATIONS ARISING FROM ASIAN FTAS
Asia’s evolving trade policy architecture is likely to be increasingly
anchored on FTAs for the foreseeable future. There are three reasons for
31.0
6.3
15.4
37.5
26.2
27.7
46.3
39.0
0
5
10
15
20
25
30
35
40
45
50
Japa
nPRC
Rep. o
f Kor
ea
Singap
ore
Thaila
nd
Philipp
ines
Mala
ysia
Indo
nesia
Figure 7.2 Burden imposed by multiple ROOs in FTAs (% of
respondents)
160 New global economic architecture
this prediction. First, the multilateral negotiating function at the WTO
seems broken as there is little end in sight for the longstanding WTO Doha
Round trade talks.12 Second, the momentum for further unilateral liberali-
zation in Asia seems to have run out of steam, with import tariffs reaching
historic lows by the early 2000s. Third, almost all Asian economies are
currently pursuing FTAs to sustain the momentum for liberalization and
to attempt to reduce more difficult behind- the- border regulatory barriers.
As the numbers of FTAs grow and business increasingly uses FTA
preferences, we may expect more concerns about Asian FTAs to arise in
the future. As with all economic policy choices, however, there are costs
and benefits associated with the formation of FTAs. Accordingly, a real-
istic and pragmatic approach would be to encourage Asian economies to
design and implement FTAs in such a way as to maximize benefits and
minimize potential costs. This would involve complementary actions at
the national, regional and global level.
7.7.1 National Level
Important elements of a realistic and pragmatic approach at the national
level include the actions below.
Promoting comprehensive coverage of agricultural trade
Liberalizing agriculture through FTAs is a key element of the continua-
tion of the liberalization agenda for trade in goods including encouraging
greater coverage of agricultural products in Asian FTAs and supporting
gradual increases in liberalizing agricultural- trade policies. Including
some provisions on agricultural products in all prospective FTAs would
serve as a signal for producers to adjust to competition and improve pro-
ductivity. Over time, coverage could be extended to at least 85 per cent of
agricultural product lines in a given agreement and exclusions minimized
to no more than 150 product lines. Issues for the future would include a
realistic tariff elimination schedule, a transparent sanitary and phytosani-
tary regime and subsidy reform.
Facilitating services trade liberalization
Radical liberalization of trade in services via the WTO or Asian FTAs
seems unlikely in the foreseeable future for political economy reasons.
With limited appetite for multilateral service trade liberalization, a modest
way forward is for all future Asian FTAs to cover the five key sectors of
the GATS (business and professional services, communications services,
financial services, transport services, labor mobility/entry of business
persons). Furthermore, such coverage should adhere at least to GATS
Evolving trade policy architecture and FTAs in Asia 161
principles (such as market access, national treatment, transparency and
mutual recognition agreements) and contain only limited exemptions.
Over time, sectoral coverage can be extended and further GATS- plus
commitments can be considered particularly in agreements encompassing
more developed economies.
Increasing WTO- plus elements
The inclusion of WTO- plus provisions – particularly the four Singapore
issues – would be desirable in all future Asian FTAs. For example, compe-
tition policy and investment provisions are integral ingredients in facilitat-
ing FDI inflows and the development of production networks. Inclusion
of provisions on trade facilitation and logistics development would help
lower transaction costs in conducting trade. Cooperation provisions
– along the lines of the APEC economic and technical cooperation
(ECOTECH) agenda – would stimulate technology transfer and indus-
trial competitiveness. In their FTA negotiations, the US and EU prefer
a single undertaking and the inclusion of these WTO- plus provisions.
The US–Singapore, US–Republic of Korea and EU–Republic of Korea
agreements are cases in point. The ASEAN Comprehensive Investment
Agreement, which came into effect in March 2012, is in line with the goal
of achieving an ASEAN Economic Community by 2015.
Improving use of FTA preferences
Use of FTA preferences can be encouraged by raising awareness of: (i)
FTA provisions, including the phasing out of tariff schedules; (ii) margins
of preference at the product level; and (iii) administrative procedures for
rules of origin (ROOs). Business associations and governments could
make information available on how to use FTAs more transparent, par-
ticularly for SMEs. Practical ideas include frequent seminars with SMEs,
television programs directed at businesses, and dedicated websites and
telephone helplines. More generally, institutional support systems for
businesses, particularly for SMEs, need to be improved. Existing support
systems for exporting under FTAs are of varying quality and take- up rates
are inconsistent. Significant public and private investment is required in
Asia to improve coverage of support services, upgrade service quality and
reduce bureaucratic impediments to service use. Business and industry
associations will have to play a greater role in providing members with
support services for exporting under FTAs. Upgrading SME technical
standards, quality and productivity could be useful so that they can par-
ticipate more fully in regional production networks driven by large firms.
Furthermore, a region- wide database on FTA use needs to be established
and maintained so that FTA use can be tracked over time.
162 New global economic architecture
Tackling the Asian noodle bowl of ROOs
The finding of a limited burden imposed by multiple ROOs does not mean
that policymakers should be complacent about the issue. As the number of
concluded FTAs increases, it is possible that multiple ROOs may become
more of a problem for firms. Supportive measures – such as encouraging
rationalization of ROOs and upgrading their administration – are needed
to mitigate the negative effects of the Asian noodle bowl in the future.
Widespread gains are possible from pursuing a simplified approach to
ROOs in Asia involving harmonized ROOs, cumulation of value contents
and coequality of ROOs.13 Likewise, it would be useful to adopt interna-
tional best practices in ROO administration. These may include introduc-
ing a trusted trader program, as is the case with NAFTA, which would
allow successful applicants to self- certify their own certificates of origin,
switching to business associations issuing certificates of origin for a fee,
increasing use of information technology- based systems of ROO adminis-
tration, and training SMEs to enhance their capacity to use FTAs.
7.7.2 Regional Level
Multilateralization of regional FTAs – through liberal cumulation rules
and eventually a merger of various overlapping FTAs in Asia into a large
region- wide agreement – would provide notable economic benefits (Chia
2010; Baldwin and Kawai 2013). These include: greater market access
for goods, services, skills and technology; larger market size permitting
increased specialization and realization of economies of scale; easier
foreign direct investment and technology transfer by multinational corpo-
rations and SMEs; simpler trade and investment rules; inclusion of small,
low- income economies in the region’s wider trade agreement; and insur-
ance against protectionist sentiments.
A region- wide FTA in Asia could arise from a series of linked agree-
ments covering varied issues and participants (Cheong and Tongzon 2013;
Kawai and Wignaraja 2013). Two competing processes are emerging as the
future basis for a region- wide FTA: a Regional Comprehensive Economic
Partnership (RCEP) among the ASEAN+6 countries (the 10 ASEAN
economies plus Australia, the PRC, India, Japan, Republic of Korea and
New Zealand); and the Trans- Pacific Strategic Economic Partnership
(Trans- Pacific Partnership, or TPP) agreement among the 12 economies
(Australia, Brunei Darussalam, Canada, Chile, Japan, Malaysia, Mexico,
New Zealand, Peru, Singapore, United States and Viet Nam) currently in
negotiations.
To realize the RCEP, a trilateral FTA among the PRC, Japan and
Republic of Korea should first be concluded and then connected with the
Evolving trade policy architecture and FTAs in Asia 163
existing ASEAN+1 FTAs – that is, ASEAN’s five FTAs with Australia–
New Zealand, the PRC, India, Japan and Republic of Korea. The TPP
aims to achieve a high- quality agreement and includes four ASEAN
members and Australia, Japan and New Zealand, from Asia. These two
mega FTAs are key processes in creating a larger Asia- Pacific FTA,
which, however, would require the difficult task of forging a US–PRC
agreement to be successfully addressed.
These two processes are not mutually exclusive and will probably prove to
be complementary. The changing center of global economic gravity – given
the rapid economic rise of the PRC and India – suggests that a RCEP is
attractive to many Asian economies, including developing ones. Countries
that are ready to accept the high standards required for the TPP, and that
wish to strengthen existing ties with the US, are likely to join the TPP.
Whichever path or paths may be taken, it will be important to acceler-
ate the liberalization of goods and services trade and of investment, reduce
behind- the- border barriers, and pursue domestic reforms. A harmonious
Asia and Pacific region would be likely to see a convergence of the two
processes being considered. This would be a win–win solution for the Asia
and the Pacific community.
Asia’s next step would be to strengthen its trade relationships with
other parts of the world, starting with Europe. A mega Asia–Europe FTA
would be an important building bock, along with the Asia–Pacific FTA,
to connect Asia with the global economy and support global trade integra-
tion in a way to complement the WTO Doha Round trade talks.
7.7.3 Global Level
International trade rules and institutions can have profound effects on the
shifts of trade relationships in Asia and globally. The responsibility for
global trade governance has rested with the WTO since its creation in 1995
and its membership had grown to 159 countries by early 2013. The WTO’s
central function is to provide a forum for international trade negotiations
which results in WTO agreements. The WTO’s other functions include
administering WTO agreements, monitoring national trade policies, and
providing technical assistance and training for developing countries.
The slow progress in the WTO Doha Round trade talks means that
new multilateral trading rules will take time to evolve amid calls for WTO
reforms. Successful conclusion of comprehensive global trade talks would
be an invaluable contribution to global, including Asian, prosperity (see
Hoekman et al. 2009; Bhagwati and Sutherland 2011; and WTO 2011).
The small Bali Package agreed in December 2013 is a useful step towards
restoring the credibility of the WTO as a trade rule- making institution.
164 New global economic architecture
However, the outcome of the current Doha Round trade talks remains
uncertain and the eventual result may be a significantly limited agreement.
The narrow negotiating agenda and slow progress of the WTO Doha
Round may be partly due to the nature of the WTO’s decision- making
mechanism and its underlying principles of consensus and single undertak-
ing. In this vein, an important initiative at the global level may be greater
use of plurilateral agreements (which focus on rule making and liberaliza-
tion on a single trade issue) within the WTO framework. An example is the
Information Technology Agreement (ITA) with an open accession clause.
Plurilateral agreements permit interested parties to freely choose the issue for
an agreement and voluntarily participate in the negotiations. Well- designed
issue- based plurilateral agreements can serve the needs of like- minded devel-
oped and developing countries, enhance the spread of foreign direct invest-
ment (FDI) driven by global supply chains, and complement WTO and FTA
rule- making. Services, trade facilitation and electronic commerce may be
candidates for future issue- based plurilateral agreements.
In the medium term, a WTO agenda on supply chains and FTAs would
be necessary to encourage convergence of regional and global trading
rules. Such a WTO agenda would tackle behind- the- border issues rel-
evant to fragmented production systems and supply chains, particularly
trade facilitation, investment policy and non- tariff barriers. It would
also encompass relevant rules in FTAs, particularly those relating to the
Singapore issues (investment, trade facilitation, competition, and govern-
ment procurement). It has been argued that the WTO has not kept up with
the need for new rules governing the intertwining of trade, investment,
intellectual property and services (Baldwin 2011). Bringing these rules to
the global level needs the creation of a new international organization – a
“WTO 2.0”.
7.8 CONCLUSIONS
This chapter has addressed important concerns associated with the spread
of Asian FTAs. It has provided new evidence on the impacts of Asian
FTAs on the region’s evolving trade policy architecture through the analy-
sis of such agreements and insights from enterprise- level surveys. Policy
implications from the research were also explored at the national, regional
and global level.
FTAs are assuming greater importance as tools of Asian commercial
policy than ever before. The region’s largest economies and Singapore are
key to the growing Asian FTA activity while ASEAN, as an organization,
is emerging as an integration hub for such efforts. The trade coverage of
Evolving trade policy architecture and FTAs in Asia 165
Asian FTAs has increased, and broader issues than simply trade liberaliza-
tion have been addressed.
With the large number of FTAs concluded and under negotiation, Asian
FTAs are here to stay. Maximizing the benefits of these Asian FTAs while
minimizing their costs would be highly pragmatic. Given the observations
of this study, this chapter suggests a coherent approach to concordance of
national, regional and global trade rules.
Some key elements of pragmatic responses to Asian FTAs at the
national and regional levels may include:
● encouraging greater coverage of agricultural products in Asian
FTAs and supporting gradual increases in liberalizing agricultural-
trade policies;
● facilitating gradual increases in liberalizing services- trade policies
through emphasis on key GATS sectors;
● including WTO- plus provisions – particularly the four Singapore
issues – in all future Asian FTAs;
● increasing the use of FTAs through improved awareness and
strengthened institutional support, particularly for SMEs, and cre-
ating a regional database on FTA use;
● addressing the Asian noodle bowl through greater rationalization
of ROO and upgrading ROO administration to best- practice levels;
and
● facilitating the creation of a region- wide agreement in Asia – through
an eventual convergence of RCEP and TPP – with appropriate sub-
sequencing and support for development gaps among members.
To strengthen global trade governance, such national and regional level
actions might be accompanied by actions at the global level including:
● Building on the Bali small package, eventually concluding the WTO
global trade talks would be a useful step towards restoring the cred-
ibility of the WTO as a trade rule- making institution. However, the
outcome of the current Doha Round trade talks remains uncertain
and the eventual result may be a limited agreement.
● Additional key actions for the WTO are enhancing surveillance of
non- tariff measures to reduce tendencies towards protectionism in
the global economy and a WTO agenda on supply chains and FTAs
to foster convergence of global and regional trading rules.
Actual developments may well not be as orderly, neat or rational as those
described above. The reality could easily become substantially more
166 New global economic architecture
complex. The convergence between national, regional and global trade
rules will take some time. Nonetheless, how Asia thinks and acts on these
issues is likely to influence the world economy. As Pascal Lamy (former
Director- General of the WTO) reminded us recently:
Asia has been a successful model of development through trade, which has inspired many others around the world. There is no doubt that the region will continue to inspire the trade community in the next decades to come. With its significant economic and trade weight in the global economy, Asia is expected to shoulder more responsibilities and take the lead in the global trading system in the future. (Lamy 2013, p.18)
NOTES
* We are most grateful to Menaka Arudchelvan for efficient research assistance.
1. The Asia- Pacific Trade Agreement (APTA) of 1976 was the region’s first agreement
and the Association of Southeast Asian Nations (ASEAN) Free Trade Agreement
(1993) was another prominent one among a very small number of Asia’s early FTAs.
2. The data set excludes FTAs involving the Pakistan–Indonesia and Viet Nam–Chile
FTAs for which texts were not available.
3. However, rice (a key sensitive sector) was excluded from the KORUS agreement.
4. This approach, which draws on Wignaraja and Lazaro (2010) and Baldwin et al. (2013),
can be readily applied to a large proportion of Asian FTAs. Future research can extend
Fink and Molinuevo’s (2008) more detailed review of key architectural choices in East
Asian FTAs with a services component (e.g. scheduling commitments, treatment of
investment, movement of natural persons and dispute settlement) to analyzing the 69
Asian FTAs.
5. Namely, cross- border trade in services (Mode 1); consumption abroad (Mode 2); com-
mercial presence (Mode 3); and temporary movement of natural persons (Mode 4).
6. Six FTAs involved Singapore, which typically covered the five key services in its FTAs.
A similar approach was followed in the Taipei,China–Panama FTA, the Japan–Mexico
FTA, and the Thailand–Australia FTA. The ASEAN Framework Agreement on
Services (AFAS) was signed in 1995/96 and the protocol to amend AFAS was launched
in 2003. Thereafter, several rounds of negotiations have aimed at deepening AFAS.
7. An early review of 11 Asian agreements concluded that “modern FTAs in Asia, some of
which are the most sophisticated in the world, have tended to be more comprehensive
in terms of coverage and of the “building bloc” rather than the “stumbling bloc” type,
though there are some (minor) exceptions in terms of certain components” (Plummer
2007, p. 1795). The study suggested a set of best practices to guide future FTAs.
8. Data for the Republic of Korea–US FTA and Republic of Korea–EU FTA are for
2012. The rest are for 2011.
9. In essence, experienced teams of researchers used a common questionnaire and random
sampling methods to collect the firm- level data. The firm surveys of each country
contained a mix of firms of different ownership (foreign and local) and size classes
(large firms and SMEs), which were broadly representative of national industrial struc-
tures. The firms were drawn from the region’s largest industries (such as electronics,
automotives, textiles and garments) as well as an industry of national importance in
each country (such as metals and machinery in the Republic of Korea and food in the
Philippines).
10. Others suggest that the depiction of Asian FTAs as a complicated noodle bowl is
misleading. On the other hand, it has been argued that Asian FTAs may be creating
Evolving trade policy architecture and FTAs in Asia 167
an order of a different sort by building the foundation for a stronger regional trading
system (Petri 2008; Chia 2010).
11. Data for Malaysia and Indonesia were from the ADB/ADBI firm surveys, while data
for other countries can be found in Kawai and Wignaraja (2011b).
12. A mini Doha Development Round deal called the Bali Package was reached in Bali in
December 2013, covering trade facilitation, agriculture, and development issues. This is
far smaller a deal than the one envisaged under the Doha Development Agenda. Even
this modest deal may not be fully implemented due to concerns raised by India about
food security.
13. Harmonized ROOs means the same ROO is applied across FTAs. Co- equal ROOs
means alternative ROOs for the same product are available in an FTA and firms are
free to choose between them. Cumulation allows the use of non- domestic inputs from a
specific country or group of countries (with such inputs taken as originating in the FTA
partner country claiming origin) as determining the product’s origin. See Kawai and
Wignaraja (2011b) and Baldwin and Kawai (2013).
REFERENCES
Baldwin, R. 2006. ‘Multilateralizing Regionalism: Spaghetti Bowls as Building Blocks on the Path to Global Free Trade’. World Economy 29(11): 1451–518.
Baldwin, R. 2011. ‘21st Century Regionalism, Filling the Gap between 21st Century Trade and 20th Century Trade Rules’. Center for Economic Policy Research (CEPR) Insights No. 56. London Center for Economic Policy Research.
Baldwin, R. and M. Kawai. 2013. ‘Multilateralizing Asian Regionalism’. ADBI Working Paper Series No. 431 (August). Tokyo: Asian Development Bank Institute.
Baldwin, R., M. Kawai and G. Wignaraja (eds). 2013. The Future of the World Trading System: Asian Perspectives, London and Tokyo: Center for Economic Policy Research (CEPR) and Asian Development Bank Institute.
Banda, O.G.D. and J. Whalley. 2005. ‘Beyond Goods and Services: Competition Policy, Investment, Mutual Recognition, Movement of Persons, and Broader Cooperation Provisions of Recent FTAs involving ASEAN Countries’. NBER Working Paper Series 11232 (March). Cambridge: National Bureau of Economic Research.
Bhagwati, J.N. 1995. ‘US Trade Policy: The Infatuation with FTAs’. Columbia University Discussion Paper Series 726. New York: Columbia University.
Bhagwati, J.N. 2008. Termites in the Trading System: How Preferential Agreements Undermine Free Trade. Oxford: Oxford University Press.
Bhagwati, J.N. and P. Sutherland. 2011. ‘The Doha Round: Setting a Deadline, Defining a Final Deal’. High Level Experts Group, Interim Report, Co- Chairs Jagdish Bhagwati and Peter Sutherland. Available at: www.number10.gov.uk/wp- content/uploads/doha- round- jan- 2011.pdf.
Cheong, I. and J. Tongzon. 2013. ‘Comparing the Economic Impact of the Trans- Pacific Partnership and the Regional Comprehensive Economic Partnership’. Asian Economic Papers 12(2): 144–64.
Chia, S.Y. 2010. ‘Regional Trade Policy Cooperation and Architecture in East Asia’. ADBI Working Paper Series No. 191 (September). Tokyo: Asian Development Bank Institute.
168 New global economic architecture
Drysdale, P. and S. Armstrong. 2010. ‘International and Regional Cooperation: Asia’s Role and Responsibilities’. Asian Economic Policy Review 5(2): 157–73.
Feridhanusetyawan, T. 2005. ‘Preferential Trade Agreements in the Asia- Pacific Region’. IMF Working Paper WP/05/149 (July). Washington, DC: International Monetary Fund.
Findlay, C., R. Ochiai and P. Dee. 2009. ‘Integrating Services Market’. In J. François, P.B. Rana and G. Wignaraja (eds) Pan- Asian Integration: Linking East and South Asia. Basingstoke, UK: Palgrave Macmillan. pp. 245–350.
Fink, C. and M. Molinuevo. 2008. ‘East Asian Free Trade Agreements in Services: Key Architectural Elements’. Journal of International Economic Law 11(2): 263–311.
Fiorentino, R.V., J. Crawford and C. Toqueboeuf. 2009. ‘The Landscape of Regional Trade Agreements and WTO Surveillance’. In R. Baldwin and P. Low (eds) Multilateralizing Regionalism: Challenges for the Global Trading System. Cambridge: Cambridge University Press.
Freund, C. and E. Ornelas. 2010. ‘Regional Trade Agreements’. World Bank Policy Research Working Papers 5314. Washington, DC: World Bank.
Hoekman, B. and A. Mattoo. 2011. ‘Services Trade Liberalization and Regulatory Reform: Re- invigorating International Cooperation’. World Bank Policy Research Working Papers 5517. Washington, DC: World Bank.
Hoekman, B., W. Martin and A. Mattoo. 2009. ‘Conclude Doha: It Matters’. World Bank Policy Research Working Papers 5135. Washington, DC: World Bank.
JETRO. 2010 and 2012. Global Trade and Investment Report 2010 and 2012. Tokyo: Japan External Trade Organization.
Kawai, M. and G. Wignaraja. 2009. ‘The Asian Noodle Bowl: Is it Serious for Business?’ ADBI Working Paper Series No. 136 (April). Tokyo: Asian Development Bank Institute.
Kawai, M. and G. Wignaraja. 2011a. ‘Asian FTAs: Trends, Prospects and Challenges’. Journal of Asian Economics 22: 1–22.
Kawai, M. and G. Wignaraja. 2011b. Asia’s Free Trade Agreements: How Is Business Responding? Cheltenham, UK and Northampton, MA, USA: Edward Elgar Publishing.
Kawai, M. and G. Wignaraja. 2013. ‘Patterns of Free Trade Areas in Asia’, Policy Studies No. 65. East- West Center: Honolulu.
Lamy, P. 2013. ‘The future of the world trade system: Asian perspectives’. In R. Baldwin, M. Kawai and G. Wignaraja (eds) The Future of the World Trading System: Asian Perspectives, VoxEu e- book, available at: http://www.voxeu.org/sites/default/files/Future_World_Trading_System.pdf.
Manchin, M. and A.O. Pelkmans- Balaoing. 2007. ‘Rules of Origin and the Web of East Asian Free Trade Agreements’. World Bank Policy Research Working Papers 4273 (July). Washington, DC: World Bank.
Petri, P.A. 2008. ‘Multitrack Integration in East Asian Trade: Noodle Bowl or Matrix?’ Asia Pacific Issues No. 86. Honolulu: East- West Center.
Plummer, M. 2007. ‘Best Practices in Regional Trade Agreements: An Application to Asia’. World Economy 30(12): 1771–96.
Ravenhill, J. 2010. ‘The New East Asian Regionalism: A Political Domino Effect’, Review of International Political Economy 17(2): 178–208.
Tran Ba Cuong, 2012. ‘FTA Utilization and How to Support SMEs: Vietnam’. Powerpoint presentation made at APEC Workshop on Increasing FTA Utilization by SMES, 7 August. Tokyo, Japan.
Evolving trade policy architecture and FTAs in Asia 169
Tumbarello, P. 2007. ‘Are Regional Trade Agreements in Asia Stumbling Blocks or Building Blocks? Implications for Mekong- 3 Countries’. IMF Working Paper WP/07/53 (March). Washington, DC: International Monetary Fund.
Wignaraja, G. 2010. ‘Are ASEAN FTAs Used for Exporting?’ In P. Gugler and J. Chaisse (eds) Competitiveness of the ASEAN Countries: Corporate and Regulatory Drivers. Cheltenham, UK and Northampton, MA, USA: Edward Elgar Publishing.
Wignaraja, G. 2013. ‘Regional Trade Agreements and Enterprises in Southeast Asia’, ADBI Working Paper Series No. 442 (October). Tokyo: Asian Development Bank Institute.
Wignaraja, G. and D. Lazaro. 2010. ‘North–South vs. South–South Asian FTAs: Trends, Compatibilities, and Ways Forward’. UNU- CRIS Working Paper W- 2010/3. Bruges, Belgium: UNU- CRIS.
World Bank. 2007. ‘Trade Issues in East Asia: Preferential Rules of Origin’. Policy Research Report. East Asia and Pacific Region (Poverty Reduction and Economic Management). Washington, DC: World Bank.
World Trade Organization. 2011. The WTO and Preferential Trade Agreements: From Co- existence to Coherence. Geneva: World Trade Organization.
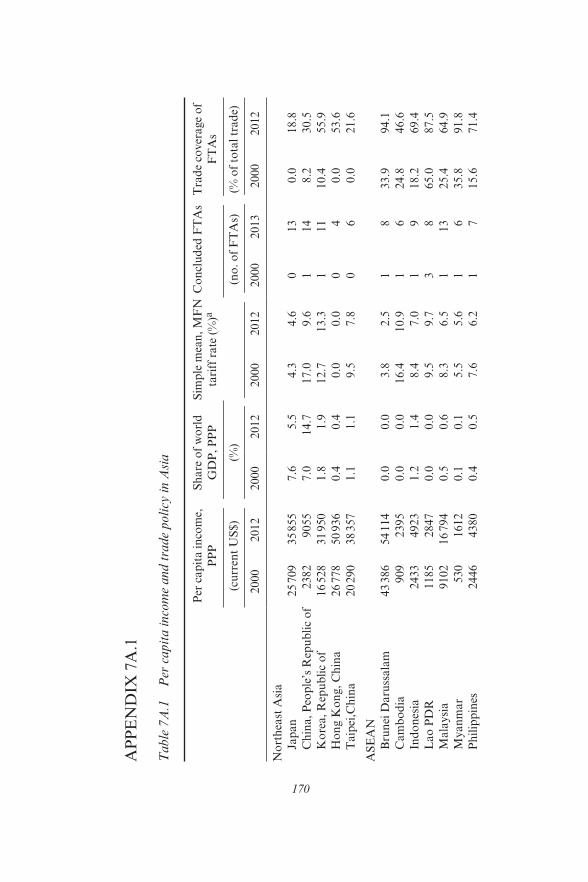
170
AP
PE
ND
IX 7
A.1
Table
7A
.1
Per
capit
a i
nco
me
and t
rade
poli
cy i
n A
sia
Per
cap
ita i
nco
me,
PP
P
Sh
are
of
wo
rld
GD
P,
PP
P
Sim
ple
mea
n,
MF
N
tari
ff r
ate
(%
)aC
on
clu
ded
FT
As
Tra
de
cover
age
of
FT
As
(cu
rren
t U
S$)
(%)
(no
. o
f F
TA
s)(%
of
tota
l tr
ad
e)
2000
2012
2000
2012
2000
2012
2000
2013
2000
2012
No
rth
east
Asi
a
Ja
pan
25 7
09
35 8
55
7.6
5.5
4.3
4.6
013
0.0
18.8
C
hin
a,
Peo
ple
’s R
epu
bli
c o
f2382
9055
7.0
14.7
17.0
9.6
114
8.2
30.5
K
ore
a,
Rep
ub
lic
of
16 5
28
31 9
50
1.8
1.9
12.7
13.3
111
10.4
55.9
H
on
g K
on
g,
Ch
ina
26 7
78
50 9
36
0.4
0.4
0.0
0.0
04
0.0
53.6
T
aip
ei,C
hin
a20 2
90
38 3
57
1.1
1.1
9.5
7.8
06
0.0
21.6
AS
EA
N
B
run
ei D
aru
ssala
m43 3
86
54 1
14
0.0
0.0
3.8
2.5
18
33.9
94.1
C
am
bo
dia
909
2395
0.0
0.0
16.4
10.9
16
24.8
46.6
In
do
nes
ia2433
4923
1.2
1.4
8.4
7.0
19
18.2
69.4
L
ao
PD
R1185
2847
0.0
0.0
9.5
9.7
38
65.0
87.5
M
ala
ysi
a9102
16 7
94
0.5
0.6
8.3
6.5
113
25.4
64.9
M
yan
mar
530
1612
0.1
0.1
5.5
5.6
16
35.8
91.8
P
hil
ipp
ines
2446
4380
0.4
0.5
7.6
6.2
17
15.6
71.4
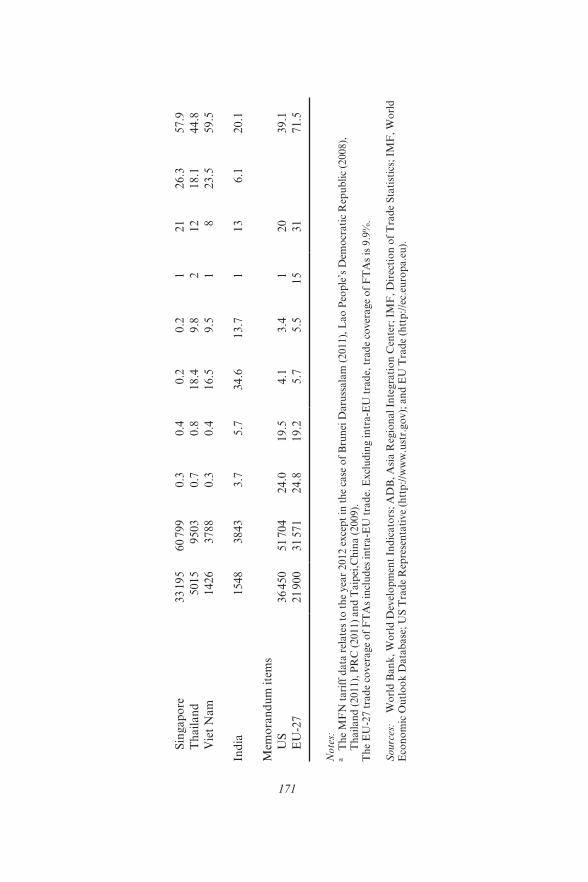
171
S
ingap
ore
33 1
95
60 7
99
0.3
0.4
0.2
0.2
121
26.3
57.9
T
hail
an
d5015
9503
0.7
0.8
18.4
9.8
212
18.1
44.8
V
iet
Nam
1426
3788
0.3
0.4
16.5
9.5
18
23.5
59.5
Ind
ia
1548
3843
3.7
5.7
34.6
13.7
113
6.1
20.1
Mem
ora
nd
um
ite
ms
U
S36 4
50
51
704
24.0
19.5
4.1
3.4
120
39.1
E
U- 2
721 9
00
31
571
24.8
19.2
5.7
5.5
15
31
71.5
Note
s:a
T
he
MF
N t
ari
ff d
ata
rel
ate
s to
th
e yea
r 2012 e
xce
pt
in t
he
case
of
Bru
nei
Daru
ssala
m (
2011),
Lao
Peo
ple
’s D
emo
crati
c R
epu
bli
c (2
008),
Th
ail
an
d (
2011),
PR
C (
2011)
an
d T
aip
ei,C
hin
a (
2009).
Th
e E
U- 2
7 t
rad
e co
ver
age
of
FT
As
incl
ud
es i
ntr
a- E
U t
rad
e. E
xcl
ud
ing i
ntr
a- E
U t
rad
e, t
rad
e co
ver
age
of
FT
As
is 9
.9%
.
Sourc
es:
Wo
rld
Ban
k,
Wo
rld
Dev
elo
pm
ent
Ind
icato
rs;
AD
B,
Asi
a R
egio
nal
Inte
gra
tio
n C
ente
r; I
MF
, D
irec
tio
n o
f T
rad
e S
tati
stic
s; I
MF
, W
orl
d
Eco
no
mic
Ou
tlo
ok
Data
base
; U
S T
rad
e R
epre
sen
tati
ve
(htt
p:/
/ww
w.u
str.
go
v);
an
d E
U T
rad
e (h
ttp
://e
c.eu
rop
a.e
u).
172
8. The emerging “post- Doha” agenda and the new regionalism in the Asia- Pacific
Michael G. Plummer
8.1 INTRODUCTION
As of 31 January 2014, the World Trade Organization (WTO) reports
that, counting goods and services separately, it has received 583 notifica-
tions of regional trading arrangements (RTAs, defined by the WTO to be
a reciprocal trading agreement between two or more countries), with 377
in force.1 This number is up from 300 at the end of 2005 and 130 at the
beginning of 1995 (Plummer 2007). Asia has been a major participant in
this rapid increase in RTAs; in fact, apart from the ASEAN Free Trade
Area (AFTA) in 1992, no Asian country had a significant RTA in place
prior to 2000, whereas at the end of 2013 there were 113 Asia- related
RTAs signed and in effect, and another 261 at various stages of nego-
tiation.2 Many of these arrangements are intra- regional; Appendix Table
8A.1 gives an inventory of these arrangements for the East Asian summit
(ASEAN+8) economies. Clearly, Asia has embraced regionalism in a big
way.
At the multilateral level, however, the situation is mixed. On the one
hand, the WTO system itself is functioning well, with the rule- based
system being respected, a much- improved dispute settlement mechanism
(over the General Agreement on Tariffs and Trade, or GATT) in place,
and rising membership (with the Russian Federation joining in 2012). The
WTO continues to be the pre- eminent institution of global governance
of trade. On the other hand, the multilateral liberalization process has
borne little fruit, with any “single undertaking” agreement under Doha
Development Agenda (DDA) negotiations still a long way off, despite
some success at the 9th WTO Ministerial Meeting in Bali in December
2013, which produced a “mini- package” including trade facilitation and
some development- and agriculture- related measures. Moreover, the
WTO agreement itself has been criticized for not including (or covering
The emerging “post- Doha” agenda 173
insufficiently) a number of trade- related issues that, some argue, need
to be addressed at the multilateral level in the twenty- first century, for
example export restrictions, competition policy (“competitive neutral-
ity”), environmental- related measures (e.g. “environmental” dumping),
and, of course, issues related to exchange- rate “manipulation”.
On the positive side, perhaps the Bali “mini- package” will breathe new
life into multilateral liberalization, either under the form of a rejuvenated
DDA or in other ways, but much will have to change (and some pro-
posals could be problematic). We discuss these problems in section 8.2.
Nevertheless, regionalism is the most important force in international
commercial policy today and it will likely continue to be so in the foresee-
able future. Hence, we consider whether regionalism is an inherent threat
to the multilateral system (section 8.3) and anticipate what we believe will
be the “new regionalism” in Asia and the Pacific (section 8.4). Section 8.5
offers some concluding remarks.
8.2 MULTILATERALISM AFTER THE 9TH WTO MINISTERIAL CONFERENCE
Relative to previous negotiating rounds, the DDA has been characterized
by far greater participation of developing countries, which have raised
their expectations as to what they hope to receive from developed coun-
tries in terms of liberalization of certain labor- intensive, but especially
agricultural, goods.3 Developed countries, on the other hand, pressed,
inter alia, for deeper cuts in industrial tariffs in developing economies. This
has given the impression of “North–South” tension at the DDA and has
been blamed for the 2011 impasse, which continues to date.
No doubt the differences between the negotiating stances of the “North”
and the “South” were in evidence throughout the entire DDA negotia-
tions. This is, perhaps, quite predictable: negotiators focus on improving
market access and facilitating the development of comparative advantage
industries. For the North, this means concentrating on higher- value added
manufactures; financial and other services; protection of intellectual prop-
erty; and investment and trade facilitation, which facilitate foreign direct
investment (FDI) flows. The South, on the other hand, naturally focuses
on labor- intensive manufactures and resists liberalization of its most sen-
sitive areas, as well as behind- the- border measures that may infringe on
national sovereignty.
However, the situation is far more complex: negotiating stances are not
completely dictated by North–South differences. Developing countries
have become more active at Doha because most have now embraced an
174 New global economic architecture
outward- oriented development strategy and depend on the international
marketplace to enhance growth and development. In the past, these coun-
tries were not active at GATT rounds, as they generally chose to “free-
ride” on commitments between developed countries from which they also
received most- favored nation (MFN) benefits. The cost of this approach
became evident in time: the sectors that were being liberalized were of
principal interest to developed, rather than developing, countries. In order
to include comparative- advantage sectors of the developing world, a
proactive stance at the WTO was necessary, and these economies did have
an overlap of interests vis- à- vis developed economies.
Still, the world is changing rapidly, and it is too simplistic to evaluate
trends in commercial policy based on this traditional North–South divide.
The share of emerging markets in global economic activity has been rising
significantly; for example, Asian economies constituted 28 per cent of
the global economy in 2010, up from 8 per cent in 1980, and this share
is projected to rise to 40 per cent in 2030 and 52 per cent in 2050 (ADB
2011). Other key emerging markets, such as Brazil, Russian Federation
and South Africa, have also been experiencing a much greater presence
in global markets. Whereas in the past GATT rounds were dominated by
Northern initiatives without a large role for the South, this is certainly no
longer the case. In this sense, one might say that the impasse at the DDA
has been a sign of maturity of the organization, with a more symmetric
distribution of power – and responsibility.
In fact, there are also tensions across emerging market economies.
Trade across the “BRICS” (Brazil, Russian Federation, India, the People’s
Republic of China [PRC] and South Africa) has been rising considerably
and productive and export structures between most of them (in particular,
Brazil, India and the PRC) are far more similar than, say, those of the key
developed countries at the negotiating table at the DDA. Ceteris paribus,
we would expect that political interests in these economies would be at
least as sensitive (but, most likely, more sensitive) to competition due to
liberalization under the DDA from fellow BRICS than from developed
economies. A textile- producing country fears competition from another
textile- producing country more than from a country that produces auto-
mobiles. Arguably, trade patterns are reinforcing these sensitivities. For
example, the PRC’s trade with other developing economies has been
growing by leaps and bounds in recent years; indeed, the share of its trade
with non- Asian developing economies is the most dynamic in its trade
portfolio (ADB 2012). This trade tends to be dominated by the PRC’s
exporting manufactures in exchange for natural- resource- related goods.
The reaction in other BRICS has at times been negative, with some fearing
that this could be a new manifestation of “dependencia”, which in turn has
The emerging “post- Doha” agenda 175
given wind to the sails of some domestic protectionist interests. Coupled
with the fact that the BRICS are cast as leaders of the developing world
and that standing up to developed economies may be perceived as a mani-
festation of leadership credentials, the DDA may have been facing more
than just headwinds from economic issues.
If indeed these political- economy issues are important determinants
of the emerging market negotiating stance, we might have to wait a long
time for the DDA (or any other single- undertaking under the WTO) to be
completed.4 Perhaps recognizing this, policymakers have been exploring
opportunities outside the single- undertaking, for example, in the area of
“plurilaterals”, or more modest practices such as the accord reached in
Bali.
Currently, there are two prominent, quite successful plurilaterals under
the auspices of the WTO: the Information Technology Agreement (ITA)
and the Government Procurement Agreement (GPA).5 The ITA has 70
participating parties that constitute 97 per cent of the pooled markets
of WTO membership in included products. The ITA focuses exclusively
on tariffs, which are bound at zero, and benefits are applied on an MFN
basis. The GPA includes 15 economies (taking the European Union [EU]
as only one member) and its benefits are not applied on a MFN basis but
rather are only accorded to its membership, though any WTO member
has a right to join (there are currently 22 observers, with nine currently
negotiating accession, including the PRC).
As a single- undertaking has proven so difficult, it is only natural that
policymakers are considering less ambitious approaches by focusing on
sectors. To the extent that these accords grant MFN to all parties, there
is no reason to believe that they could potentially damage the multilateral
system. I note “potentially” because, arguably, an agreement such as the
GPA does not create distortions related to “trade diversion”; prior to the
agreement, preferences generally were given to domestic producers and,
hence, the GPA increased competition between domestic firms and foreign
(GPA- member) firms, rather than across foreign competitors (who were
previously discriminated against anyway). However, to the extent that
such a plurilateral could lead to new discrimination across members, it
could create some serious problems.
To begin, if a plurilateral does not include substantially all goods (as
required for the Article XXIV or the General Agreement on Trade in
Services [GATS] Article V exceptions), it would violate Article I of the
WTO. For example, there has been some talk of proposing an “ITA II”,
which would expand significantly product coverage, making it reciprocal
without the 90 per cent minimum as required with the first ITA agreement.
If the developed economies were to table an expansive list of additional
176 New global economic architecture
products that would be considered excessive from the viewpoint of India
and the PRC, a reciprocal ITA II would simply exclude them, with poten-
tial for trade diversion and arguably a violation of MFN. Some might note
that they could join later if they wished, but an exception under Article
XXIV does not allow for this. Moreover, these kinds of single- sector
accords could have significant negative implications for effective rates of
protection.
Another plurilateral approach would be to require reciprocity but to
meet the “substantially all goods” requirement. Such an idea was tabled at
the 8th WTO Ministerial in the area of service, where the GATS Article V
would also require that most services sectors be included in any accord. In
theory, this would be a very interesting approach; in practice, it could create
problems. First, “substantially all goods” has never been appropriately
defined. The GATT saw, for example, a number of FTAs in manufactures
alone (arguably not “substantially all goods”) and even bilateral free trade
in one sector between the US and Canada: the 1965 agreement on auto
parts. A limited set of services included in such an agreement would have
the potential for negative, “second- best” ramifications and reflect poorly
on the WTO itself. Second, who will join such an agreement? If it is only
the Organisation for Economic Co- operation and Development (OECD)
countries, it could exacerbate the impression of a North–South divide in the
WTO. Currently, the momentum for a services plurilateral is coming from
the 18 “Really Good Friends of Services”, comprised mostly of OECD
economies and including none from the BRIC group (Geneva Watch 2012).
In sum, the DDA is likely to be stalled for some time, and more modest
approaches to multilateral liberalization will themselves probably be
limited (and could, and least in principle, create worrying precedents). As
the regionalism trend emerged in full force in the early 2000s side- by- side
with DDA negotiations, we can expect that it will be the only game in
town for at least the next few years (and, most likely, longer).
8.3 ON BUILDING BLOCS AND STUMBLING BLOCS
Disillusionment with progress at the DDA may be one reason for the
proliferation of regional agreements in Asia and the rest of the world. The
ambitious agenda of Doha, from both developed- and developing- country
viewpoints, could be more easily managed bilaterally or between a small
group of countries than in an organization of 160 highly- divergent econo-
mies. Hence, it is no mystery as to why many of the new regional agree-
ments are between developed and developing countries: what is needed to
The emerging “post- Doha” agenda 177
integrate global markets further, from non- tariff barriers to behind- the-
border issues, may be too much to handle at the WTO.
The WTO is cognizant of the regionalism trend and understands the
problems that it could potentially entail for the global trading system
(see, for example, WTO 2011). Indeed, the challenges of regionalism to
the WTO are many, but two in particular stand out. First, the GATT/
WTO was created with MFN treatment as its overriding principle, and
Article XXIV was to be a conditional exception to this rule. With so many
accords in place and every major economy participating in at least one
FTA (and most in many), what happens when the exception becomes
the rule? How valid is the coveted MFN, a birthright of WTO member-
ship, when regional trading arrangements erode it and, in essence, force
countries into regional trading arrangements in order to retain MFN
status? Second, as we will argue below, regionalism is not necessarily in
conflict with multilateralism, subject to the principle of openness and the
minimization of the inefficiencies and potential discrimination inherent in
regional agreements.
In this section, I will first discuss some of the problems associated with
the “regionalism debate”, beginning with some introductory observations
and followed by a summary of the “building blocs versus stumbling blocs”
debate itself.6
8.3.1 Introductory Comments Regarding Regionalism versus
Multilateralism
It is important to note first of all that, while WTO accords do impose a
certain symmetry, they do not guarantee it. For example, the WTO sets
out rules of behavior in terms of anti- dumping that are no doubt superior
to a system void of rules. But they do not harmonize all anti- dumping
practices. Member states continue to have a great deal of flexibility in
this regard (and probably always will have, at least in the context of the
WTO). Moreover, the lack of across- the- board inclusion of sectors and
asymmetric liberalization within the context of GATT/WTO liberalization
could create distortions that exacerbate effective rates of protection; that
is, while regionalism discriminates across countries, the GATT/WTO dis-
criminates across sectors, and, to the extent that this is the case, both are
second- best. The existence of a WTO Valuation Agreement on customs
is extremely useful but there continues to be considerable variation in
terms of adopted practices across WTO member- states. The same can
generally be true of “Singapore issue”- related topics, intellectual property
rights (IPR) protection, and the like, in which the WTO often has little
or incomplete jurisdiction. A salient disadvantage of the multilateral
178 New global economic architecture
approach under the WTO is that harmonization of such rules and policies
has proven to be extremely difficult, and progress highly limited, due to
the diversity of its membership, as well as disagreements as to how com-
prehensive the mission of the WTO should be. Given that the organization
of the international economy (e.g. via production networks) has become
more complicated and reaches ever- deeper into the very fabric of domestic
policy and legislation, behind- the- border issues are becoming increasingly
important. These, though, are even more difficult to include in negotia-
tions among a membership with widely- diverging interests and positions
regarding an outward- oriented development strategy.
The usefulness of regional agreements – and certainly one reason for
their popularity (see World Bank 2005; Kreinin and Plummer 2002;
Frankel 1998) – lies in their ability to drive integration and cooperation in
areas that have hitherto been neglected by the WTO, for example in terms
of sensitive tariff, non- tariff and behind- the- border measures. Thus, while
it is true that a multilateral approach would dominate a bilateral/regional
strategy if all the same measures are included and harmonized/liberalized
to the same extent, it is not a dominant strategy once we relax this (unreal-
istic) assumption of symmetry in liberalization and coverage.
In fact, critiques of FTAs relative to free trade can easily fall into
“straw man” analysis. For example, the rules of origin constraints under
North American Free Trade Agreement (NAFTA) in automobiles (62.5
per cent) and certain textile products (effectively 100 per cent) do not
fit the criteria for “open regionalism” under any definition of this term.
However, these are probably among the most obvious out of relatively
few such divergences in what is in reality a liberal agreement. Besides, for
NAFTA, the effective benchmark should be the status quo, not free trade.
Would auto and textile imports to the US have been much less restrictive
without NAFTA? Not necessarily. In fact, certainly trade diversion does
have costs, but we cannot say that NAFTA closed those markets, since
failure to meet NAFTA rules of origin meant recourse to the status quo.
The status quo did not become more protective; in textiles and apparel,
the US market has become more open with the expiration of global import
quotas on 1 January 2005 (under Uruguay Round commitments). Again,
Mexican textiles receive preferential treatment and, hence, trade diversion
is a cost to be borne by non- partners and US consumers, but there still is
an associated trade creation effect that would have not occurred had there
been no NAFTA. Net gains have been estimated to have been positive.7
Many American economists supported NAFTA not for general support
for regionalism per se or their belief that it would have great effects on
allocative efficiency in North America through the liberalization of tariff
and non- tariff barriers, which were, after all, low in the aggregate.8 Effects
The emerging “post- Doha” agenda 179
on the US and, especially, Canada, were estimated to be positive but small.
Rather, it was supported in the main because it would lock in the Mexican
economic reforms leading up to NAFTA and would set the stage for
further liberalization. Given the history of economic volatility in Mexico,
NAFTA as a “policy anchor” was deemed to be extremely useful. Once
NAFTA began to be implemented in full force (i.e., after the Mexican
crisis in December 1994, which had little or nothing to do with NAFTA
directly), the net effect on macro performance in Mexico has been very
positive (Kose and Rebucci 2005). In 2005, the US government gave a
high priority to an FTA with Central America (“CAFTA”) in hopes
that it would have the same stabilizing effect.9 And while the percentage
of total Mexican trade has risen to somewhat over three- quarters (from
two- thirds) in the wake of NAFTA, a result of both trade creation and
diversion, one cannot say that Mexico has been “captive” in NAFTA. In
fact, Mexico now has negotiated 44 FTAs.10 Moreover, the openness of
the Mexican economy has allowed non- partner countries to benefit; the
financial sector in Mexico, for example, is characterized by a consider-
able European presence. Again, this is not to argue that restrictive rules
of origin and other inward- looking clauses in regional trading arrange-
ments do not constitute a problematic aspect of RTA. A consistent,
liberal, across- the- board rules- of- origin policy is the least distortionary
in a second- best world (Plummer 2007). But we should not exaggerate its
absolute importance in the regionalism debate.
Moreover, time and depth matter. Many protagonists of a purely mul-
tilateral approach to economic cooperation tend to present arguments
without a well- defined time horizon. But time is important when consider-
ing the present discounted value to national welfare of a regional trading
accord compared to multilateral free trade. A heuristic example may help
underscore this point. Suppose Indonesia has an option to create an FTA
with the US, but its leaders know that this will have some costs in terms
of trade diversion. The “first- best” (global free trade) policy, its leaders
might reckon, would ultimately be the best deal for Indonesia, as non-
discriminatory free trade would have no trade diversion and could maxi-
mize trade creation. But since Indonesia is unable to benefit from global
free- trade (no such option exists at present), timing becomes an essential
factor in the policy decision. If global free trade were an option in the very
short term, then, ceteris paribus, free trade would be better than the deal
with the US. But what if the FTA with the US were possible today, and
yet global free trade would take five more years? Which would be better?
It would depend on what the Indonesia–US deal would look like (relative
to the global deal), but nevertheless, it could be that free trade would still
be worth the wait. But what if free trade were to take more like 20, 30 or 40
180 New global economic architecture
years? After all, the GATT/WTO has existed for over a half century, and
global free trade is nowhere in sight. Of course, this type of analysis will be a
function of the type of regional accord, in particular if it is inward- looking
or outward- looking. If it were the former, the deal with the US could end
up being very much to the detriment of Indonesia. As we shall see in terms
of the “building bloc versus stumbling bloc” debate, the type of agreement
is of the essence. But it would also be important to know what the multilat-
eral deal would be. If a regional accord entailed far more reforms vis- à- vis
market- friendly, efficient policies at macro and micro levels whereas global
free trade meant merely the abolition of tariff barriers, the former could
still potentially be as good as, or better than, the latter.
Herein lies the attraction and, in many ways, advantage that regionalism
holds over multilateralism: it allows like- minded countries to address far
more issues and in a shorter period of time. By choosing one or several like-
minded partners, countries are able to make more progress in terms of deep
integration than they could in the extremely diverse WTO context. Rising
interest in regionalism on the part of OECD countries that traditionally
had shunned them (the US, Japan, the Republic of Korea) derives from
their desire to address these many issues and their understanding that they
cannot accomplish them in the context of the WTO, or at least not in the
short/medium run. A successful conclusion to DDA would, perhaps, have
had an impact on the momentum behind the regionalism movement, but
this is not guaranteed: the incentives for new bilateral/plurilateral accords,
as well as for deepening existing ones, would remain. Besides, the DDA is
stalled and, as noted above, may well be so for some time in the future.
What is guaranteed through successful multilateralism is a reduction in
the potential negative effects of these regional agreements and overall less
risk to the integrity of the international trading system. Moreover, to the
extent that a multilateral accord can, indeed, make Article XXIV more
effective in ensuring that these new regional agreements will be outward-
looking and consistent with a WTO approach, the risks associated with
regionalism could be significantly mitigated (Plummer 2007). Economists
should continue to support a “deep” DDA.
Hence, the obvious question emerges as to how regional agreements
themselves can work in favor of global free trade. The traditional
approach is to view it from the “building blocs versus stumbling blocs”
lens, which we do below.
8.3.2 Building Blocs versus Stumbling Blocs: Theoretical Considerations
Does regionalism support unilateral/multilateral reform goals, or does the
discrimination inherent in a trade bloc lead to a “second best” outcome at
The emerging “post- Doha” agenda 181
best, or an inward- looking one at worst? This is the essence of the “build-
ing blocs” versus “stumbling blocs” debate. The literature would suggest
that several possible negative policy consequences could emerge from an
FTA, that is, inherent “stumbling bloc” tendencies, while other tendencies
would be consistent with multilateral goals and market- friendly domestic
liberalization and could actually facilitate multilateral liberalization, that
is, “building blocs”. Briefly, these would include the following.11
8.3.2.1 Stumbling blocs
1. Maximizing terms of trade. Regional integration, particularly customs
unions, increases the size of an economic zone and, as such, increases
market power. The potential benefits of exploiting such an advantage by
imposing an “optimal tariff” (i.e. maximizing the difference between the
terms of trade gains from a tariff regime against its costs in terms of effi-
ciency) are familiar from the international trade literature. Moreover,
FTAs and customs unions, by “virtue” of the trade diversion effect,
improve their terms of trade relative to the rest of the world; the larger
the grouping, the larger the potential improvement in the terms of trade.
In reality, the first effect is probably not particularly relevant, as
even tariff regimes in the context of a customs union are not erected
according to optimum tariff rules.12 Moreover, in the cases of both
customs unions and FTAs, changes in the external tariff regime
cannot on average be more protective than the pre- integration status
quo, according to Article XXIV. This does not mean that there will
not be any potentially negative sectoral effects, but in this case GATT/
WTO members are able to sue for compensation. The most famous
case in this regard is, perhaps, “Turkey: Restrictions on Imports of
Textile Products”, in which India initiated a GATT panel against
Turkey in the wake of the harmonization of its external tariff with the
EU when it formed a customs union in manufactures (Herzstein and
Whitlock 2005).13 Of course, this effect would be even less important
with improved rules within the context of Article XXIV.
With respect to the terms of trade effect, since trade diversion
undeniably results from preferential trading arrangements, it is cer-
tainly a concern. But trade diversion is actually a one- time price effect
and, hence, static in nature. In fact, it is the static cost of preferential
trading accords.
2. Manipulation of the contents and scope of the agreement by special
interests. This concern obviously also manifests itself in the context
of domestic policy formation. Deardorff (2003) stresses that this is
especially a problem in the context of developed–developing country
182 New global economic architecture
accords, in which the former obviously have the upper hand, as special
interests tend to be far better organized and funded. The lack of rigor
and coverage in Article XXIV makes this a particular problem, as
the flexibility allowed in an FTA tends to give considerable liberty to
special- interest influences. Of course, this could also have a positive
effect: special interest groups in developed countries no doubt push
for better IPR protection, competition policy, treatment of FDI and
better trade and investment facilitation, but these arguably could have
important positive effects on efficiency and policy formation in devel-
oping countries.14
3. Waste of scarce negotiating resources. Particularly (but not exclusively)
in the case of developing countries, the scarcity of well- trained and
well- experienced experts on trade negotiations imply that the oppor-
tunity cost of resources devoted to regional agreements is the alloca-
tion of less talent to multilateral deals. Critics of regionalism suggest
that such a capacity constraint can only be detrimental to multilateral
liberalization, and even well- developed domestic policy reform. For
example, after Viet Nam joined the Association of Southeast Asian
Nations (ASEAN) in 1995, it worked not only to enter into AFTA
(due for completion in 2006) but also to implement a number of other
accords, including an extensive Bilateral Trade Agreement with the
US in 2001. On top of that, it was working on ASEAN+3 initiatives
and, eventually, the AEC. Given its human- capital capacity con-
straints, this could very well have delayed its drive to join the WTO.
Or, perhaps, not. A counter- argument would be that Viet Nam has
been able to ready its economy for the WTO through the outward-
oriented policies adopted because of its membership in ASEAN, and
the Bilateral Trade Agreement itself was essentially a means of pre-
paring Viet Nam for WTO entry, including legal and administrative
reforms that would in any event be necessary. The agreement is replete
with references to WTO protocols and WTO- consistent reforms, from
services liberalization to TRIPs- plus. These negotiations have also
sharpened the expertise of Vietnamese negotiating authorities. The
US also allocated a relatively large project (the “STAR Project”) to
assist Viet Nam in reforming its legal system to be more compatible
with international norms, as well as to train officials.
8.3.2.2 Building blocs
1. Lock in policy change. We have referred to this effect fairly fre-
quently in previous sections, using in particular the case of Mexico in
NAFTA. But there are many others, including the case of Viet Nam,
The emerging “post- Doha” agenda 183
mentioned above, which has been able to use regional integration as
a blueprint for market- friendly reform to become more competitive
in the international marketplace. Without ASEAN (and eventually
the Bilateral Trade Agreement), one can easily argue that Viet Nam
would not have made as much progress (and its joining the WTO
would no doubt have been further delayed).
2. Improve negotiating power for smaller units. Traditionally, the possi-
bility of small countries joining together and working as one cohesive
unit in trade negotiations has always been recognized: even Harry
Johnson, who was an avid critic of regionalism, acknowledged this
potential benefit. This would apply both to smaller countries as well
as larger units, such as the EU. Hence, in theory, ASEAN should be
able to have much more power in influencing WTO negotiations, or
bilateral/regional/plurilateral deals in general, as a group: the whole
could be greater than the sum of its parts.
The EU has certainly been effective in this regard from its beginning
as the European Economic Community. But it began as a customs
union, not merely an FTA, in which national commercial policy vis- à-
vis third countries can differ (often substantially). ASEAN, however,
has never been very effective at projecting its power as a unified group,
even after AFTA. In the past, the region was just too diverse and the
interests of individual countries diverged too much, something that
should change with the AEC. Thus, we could probably conclude
that this potential “building bloc” is theoretically a possibility, but
in practice can be somewhat difficult, being a function of the type of
accord (FTA or customs union) and the interests of the component
states. The move toward greater “ASEAN Centrality”, for example
in the context of the Regional Comprehensive Economic Partnership
(RCEP, discussed below) is an attempt to augment the regional influ-
ence of ASEAN (Petri and Plummer 2014).
3. A dynamic weeding process as a first step toward free trade. It could
very well be that the process of structural adjustment unleashed by a
regional trading arrangement through trade creation could, in effect,
make multilateral accords easier. As the weakest (and, hence, more
resistant to any international competition) are weeded out due to, say,
an FTA, the stock of opposition to trade falls in importance, thereby
making multilateral initiatives easier.
Perhaps an example would illustrate the point. Suppose that
the trade policies of a country (let’s call it “home”) are determined
by domestic firms, and “home” trades with two other countries:
“partner” (i.e. the country that would ultimately form an FTA with
“home”) and “rest of world”. Furthermore, assume that, in autarky,
184 New global economic architecture
there are six industries, with linear cost structures of the firms in the
home country being such that two are globally competitive (goods
A and B), two (goods C and D) are competitive only regionally (in a
potential FTA with “partner”), and two would never be competitive
with trade (goods E and F). Now, assume that the “home” govern-
ment puts to vote whether or not the country should move to free
trade. Firms producing A and B will vote yes, as they would benefit
from a larger market, but the other four firms would vote against it,
as they would be put out of business. We remain in an autarkic equi-
librium. But suppose now that the home country votes on whether or
not it should have an FTA with “partner”. Goods A, B, C and D will
vote in favor, and E and F against. The FTA would pass. Eventually,
competition from the partner country will force out production of
goods E and F in the home country (trade creation), and there will be
no trade diversion (as we began in autarky). The remaining firms in
the home country will, therefore, eventually only produce A, B, C and
D. Next, assume that the home country votes once again on whether
or not it should have free trade. The votes will now be two in favor
(A and B) and two against (C and D). Assuming that consumers have
even a little say would be sufficient to usher in free trade, and this
would be due to the FTA “stepping stone” process.
4. Competitive liberalization to attract international capital, as well as
a positive “threat”. Regional integration can be used as a means of
rendering the component economies more efficient, competitive and
market friendly. While a grouping may or may not adopt global “best
practices” in regulatory, legal and other issues, it can reduce the stock
of divergences across countries (thereby making it easier to integrate
globally). By reducing transaction costs across countries, an FTA can
enhance its attractiveness to multinationals. As policy externalities
become increasingly important as an FTA “deepens”, the incentive to
internalize them through monitoring, sharing information and closer
cooperation increases. Because trade and financial links are becom-
ing increasingly appreciated, countries within an FTA soon find it
useful – or even necessary – to further financial and macroeconomic
cooperation.
It may also be true that regional agreements can be used as implicit
and explicit “threats”, particularly since FTAs seem to have a tendency
to grow over time. An obvious example was the boost that President
Clinton gave to Asia- Pacific Economic Cooperation (APEC) in 1993,
when it invited leaders to Blake Island, Washington, for the first
APEC Heads of State summit. Strengthening the organization was
supported at Blake Island, and the political will to move forward on
The emerging “post- Doha” agenda 185
economic cooperation, especially in trade, was obviously in evidence
(in the following year, in Indonesia, this would manifest itself in the
“Bogor Vision” goals of open trade and investment by 2010 for devel-
oped economies and 2020 for developing economies). Prior to Blake
Island, the Uruguay Round had failed to be approved twice (in 2000
and again in 2002) essentially because the EU and the US, backed
by the Cairns Group, could not reach an agreement on agriculture.
After the Blake Island summit, the Europeans decided to sign the
agreement. Some experts have stressed that Clinton deliberately used
APEC as a “threat” to Europe, that is, if the Uruguay Round didn’t
go through, the US was perfectly willing to move forward on free
trade with Asia. Rather than face trade diversion in the world’s most
rapidly growing market by far, the EU opted for the GATT.
Each of these arguments has theoretical merits. But in practice, the incli-
nation of the regional accord tends to be extremely important. Clearly,
if the group is being formed as a means of enhancing inward- looking
development strategies or as a way of isolating the region from global
competition, this initial policy thrust would set in motion many of the
problems discussed above. In fact, this approach has led to the down-
fall of many regional trading agreements in the past, especially in Latin
American (e.g. the Latin American Free Trade Area).15 Yet, if outward-
looking economies form a regional grouping, it is likely that regionalism
will serve to promote the goals of domestic policy reform and multilateral
liberalization. This is due to at least four factors: (1) it is unlikely that a
country wishing to promote outward- looking policies, including extensive
unilateral liberalization and active participation at the WTO, would con-
tradict this stance in favor of a regionally- closed system; (2) reductions
in trade barriers within a preferential trading arrangement make it more
attractive for a country to reduce external barriers, in effect “MFN- izing”
regional concessions, because the most important cost of regionalism is
trade diversion and lower external barriers will reduce associated costs;
(3) the “weeding out” of least competitive industries (discussed above)
and making the political economy of trade liberalization more favor-
able over time seems to have been important empirically;16 and (4) the
membership of RTAs tends to expand and to become more diverse over
time, thereby reducing regional sources of support for protectionism in
a particular country and industry, as well as reducing the overall poten-
tial for trade diversion. One might add to this the list of non- traditional
benefits for developing countries in regional trading agreements such as
enhanced macroeconomic stability via cooperation, greater FDI inflows
and attendant technology transfer, structural policy change and reform,
186 New global economic architecture
and state- of- the- art harmonization. The lion’s share of empirical estimates
of the economic effects of regional trading agreements in East Asia, for
example, using either computable general equilibrium (CGE) modeling or
econometric methods, reveals net trade creation.
In sum, while the risks of regionalism are real and, as with any real-
world second- best policies, costs exist, it would appear that what is driving
the regionalism movement since the early 2000s, particularly in Asia, is
based on an outward- looking approach to integration and that the impli-
cations have been positive for the region. AFTA and other expressions of
ASEAN integration are exemplary of this. Still, minimizing costs is of the
essence. In Plummer (2007), I suggest a framework under which this might
be done; additional ideas are found in WTO (2011) and “multilateralising
regionalism” work forthcoming from the OECD.
8.4 THE NEW REGIONALISM IN THE ASIA- PACIFIC
There have been many excellent surveys of regional economic integration
in Asia (e.g. ADB 2008, 2012; Kawai 2005). Several factors influencing
the regionalism trend in East Asia stem directly from the Asian Financial
Crisis, including: (1) the obvious contagion relationships, which demon-
strated the policy externalities across countries in ASEAN and the NIEs;
(2) major disappointment with respect to the Western reaction to the
crisis, leaving the feeling of “being in it alone together”; (3) disappointing
progress in APEC in achieving closer trade and financial cooperation, as
well as development assistance cooperation; (4) Japan’s offer to create an
Asian Monetary Fund during the crisis – opposed by the IMF and the
US – gave the impression that Japan wanted to be proactive in the region;
(5) arguably, the PRC’s decision not to devalue during this period also
created a sense of solidarity; (6) the “New Miyazawa Plan”, launched in
October 1998 which dedicated US$30 billion to help spur recovery in East
Asia (and deemed highly successful) (Kawai 2005); and (7) the policies
promulgated by the IMF to solve the crisis were deemed inappropriate,
giving greater credibility to the “Asian approach”.
Hence, the crisis itself set the stage for serious and durable East Asian
regionalism. There are many other internal and external forces at work
that have expedited the process, such as the rise of regionalism globally
and its potential negative effects on the region; the successful example of
the Single Market Program in Europe; general pessimism regarding what
can be achieved at the WTO in light of failure to move forward at the
Seattle and Cancun WTO Ministerials; and the potential inherent benefits
The emerging “post- Doha” agenda 187
of FTAs. Importantly, bringing down barriers to economic interaction in
order to lure FDI and promote production networks has certainly been
a key factor in the ever- expanding intra- regional (Appendix Table 8A.1)
and extra- regional (www.aric.adb.org) agreements. Nevertheless, I would
suggest that the next wave of regionalism will be in favor of regional
accords, rather than the plethora of bilateral FTAs that constitute the
“Asian noodle bowl”.
A strong majority of the RTAs concluded or initiated by Asian econo-
mies were bilateral FTAs, which tend to be easier to negotiate than, say,
larger memberships or deeper accords such as customs unions. Moreover,
a majority of these FTAs are with economies outside of Asia. Thus, when
Asian governments consider bilateral accords, they think globally, rather
than just regionally. These priorities reflect the driving forces behind
regionalism in Asia, which tend to be economic rather than political,
though obviously the political context is always important. Indeed, this
might distinguish Asia from bilateral and regional accords elsewhere,
which tend to be politically dominated. For example, early integration
initiatives in Europe, beginning with the Coal and Steel Community
and the European Economic Community, had strong political backing
(integrating France and Germany after the World War II, Cold War
exigencies), even though the economics were somewhat dubious at the
time. Even monetary union in the EU was made possible due to political
reasons, that is, post- Cold War incentives and, in particular, facilitating
the political integration of East and West Germany. In fact, the need to
support economic integration in Asia is even helping to overcome some
of the most difficult obstacles to cooperation in the region; a decade ago
few, if anyone, could have foreseen that the PRC, the Republic of Korea,
and Japan would be able to improve relations sufficiently to sit down and
negotiate an FTA. Yet that is exactly what was agreed to at their May
2012 summit. Recent political disputes have put the trilateral FTA nego-
tiations on hold; however, they did sign an investment agreement and are
negotiating partners in RCEP.
If this thesis that Asian regionalism is based on economics is correct,
then the creation of regional accords would certainly emerge as a more
efficient approach than bilateral FTAs. While the vast majority of empiri-
cal studies on bilateral FTAs in Asia would suggest that these accords
have had (or will have) a positive effect on the welfare of their member-
states, with small negative effects on the rest of the world in terms of trade
diversion, they clearly have important shortcomings (as noted above).
But most importantly: if the driving force behind regionalism in Asia per-
tains to international and regional production networks, bilateral FTAs will
tend to fall short. Regional FTAs would be needed to optimize regional
188 New global economic architecture
production networks and lower costs associated with, for example, rules
of origin (via cumulation), and outward- oriented regional FTAs that
minimize discrimination against non- partners and have open membership
clauses would facilitate international production networks.
We might call the realization of the need to create regional FTAs the
“new regionalism” in Asia. Creating these regional institutions that will
facilitate the integration of the region over the medium to long term will
no doubt be high on the agenda of most Asian policymakers in years to
come. We might consider two “pathways” in this regard: one East Asian,
the other Pacific Rim.
To begin, in 2004 the ASEAN+3 Economic Ministers commissioned
a study of the feasibility of an East Asia FTA, and the idea of an Asia-
wide FTA gained momentum particularly when negotiations for the
Trans- Pacific Partnership (TPP) began in 2008. Ultimately, the chosen
unit of cooperation became RCEP, which was launched in November
2012 with “ASEAN centrality” explicitly at its core; indeed, members of
RCEP must have an FTA in place with ASEAN (in addition to the 10
ASEAN members, this includes PRC, Japan, Republic of Korea, India
and Australia–New Zealand). While it is not yet clear what form RCEP
will take, it is intended to be “ambitious”, covering, inter alia, trade in
goods and services, investment, intellectual property and competition
policy, as well as flexibility for least- developed members. The Third
Round of RCEP negotiations took place in Kuala Lumpur in January
2014.
The TPP builds on a high- quality FTA between four small, open econo-
mies (Brunei Darussalam, Singapore, New Zealand and Chile), known
as the “P4”, and in addition to these negotiators the TPP includes the
US, Australia, Malaysia, Viet Nam and Peru (the “TPP”), later joined by
Mexico, Canada and Japan in 2012 and 2013, with the Republic of Korea
currently undergoing preliminary negotiations with the view to possibly
joining the talks. The TPP negotiators had hoped to come to an agreement
by the end of 2013 but negotiations have continued into 2014.
The TPP is distinct not only in terms of the large differences in levels
of development (from low- middle- income developing countries such as
Peru and Viet Nam to high- income, advanced OECD members such as
the US and Japan) but in terms of its ambitions to become a “twenty- first
century” agreement that would embrace a wide- variety of areas, from
trade in goods and services to science and technology and small- and
medium- sized enterprises, including many difficult- to- negotiate behind-
the- border measures. Its membership is technically open to any APEC
member; indeed, its ultimate goal is the creation of a “Free- Trade Area of
the Asia Pacific” (FTAAP) that would include all APEC members. Both
The emerging “post- Doha” agenda 189
the RCEP and TPP “tracks” were cited by APEC at its 2010 summit in
Yokohama as paths to the creation of an FTAAP. Clearly, there is a good
deal of membership overlap between the RCEP and TPP economies.
Petri et al. (2011) use an advanced CGE modeling approach to estimate
the economic impact of the “Asian track” and the “Trans- Pacific track”
(TPP) as pathways to the FTAAP. The Asian track assumes a PRC,
Japan, Republic of Korea FTA in 2012 and then an ASEAN+3 FTA
in 2015; for the Trans- Pacific track, they assume a TPP9 agreement in
2012 and an expansion in 2015 to include Japan, the Republic of Korea,
Canada and Mexico. They assume that both tracks eventually lead to an
FTAAP that would begin in 2020. They estimate fairly large gains for
both tracks: the effects on the world economy would be small initially
but by 2025 the annual welfare gains would rise to US$104 billion on the
TPP track, US$303 billion on both tracks, and US$862 billion with an
FTAAP.17 Interestingly, the biggest gains accrue when the two tracks are
consolidated; in effect, this results from both the PRC and the US being
included in the same agreement.
As of this writing, the outlook for the RCEP and TPP agreements in
the near future is mixed, with the latter having progressed further than the
former. Should each of these tracks begin implementation in the short run,
the medium- term goal of an FTAAP would seem much more within reach.
The literature is replete with arguments as to why the FTAAP will not be
reached for various reasons, prominent among them being US–PRC trade
relations. But it is worth underscoring that the PRC and the US are big
economic winners in the FTAAP scenario in Petri et al. (2011). Success in
this regard would be consistent with the diplomatic and political goals of
both countries, and eight years is a long time in trade policy.
8.5 CONCLUSIONS
We can summarize the main conclusions of this chapter as follows:
1. A strong, vibrant WTO is essential to the prosperity of the inter-
national trading system.
2. Still, it is important to note that the prospects for significant liberali-
zation scenarios under the WTO in the near future are not bright. The
decade- plus DDA single- undertaking is on hold (again) and at present
there are no plans to restart negotiations; other possible liberalization
approaches (e.g. “plurilaterals”) are possible but, again, difficult and
fraught with potential problems, depending on how they develop.
190 New global economic architecture
3. While a multilateral approach to trade policy is best ceteris paribus,
regionalism does have a number of advantages in that it is able to
achieve more progress in a shorter period of time within the context
of a group of like- minded countries. Global free- trade is not an
option at present (or likely in my lifetime, and I hope to live a long
time), and even if it were what could be tackled at the multilateral
level with 160 (and growing) diverse economies in the WTO context
would be far less than what can be achieved within a regional
grouping.
4. Of course, if regionalism is “closed” it will be detrimental to the global
trading system. We survey the issues related to the “stumbling bloc
versus building bloc” debate and suggest that, while FTAs do have
potential drawbacks and that the essence of the agreement will be a
key determinant, FTAs can, indeed, be building blocs, particularly
if the orientation of the integrating economies is outward in nature,
as in the case of Asia. A continued emphasis on outward orientation,
minimizing discrimination, inclusiveness and embracing the first- best
needs to be made in order to ensure that regionalism in Asia (and
elsewhere) serves to enhance competitiveness and support global free
markets, rather than detract from them.
Finally, we also note that while regionalism is usually compared to
multilateralism in the literature, insufficient attention is, perhaps, placed
on the inefficiencies of bilateral FTAs relative to regional ones. We stress
that regional arrangements are of the essence in the Asia- Pacific region
for economic (e.g., regional production networks) as well as diplomatic
political goals. This “new regionalism”, which has been supported by
APEC, will lead to significant reductions in the costs associated with
bilateral FTAs (e.g. lower costs associated with rules of origin, improved
utilization rates) and seems to (rightly) be receiving a good deal more
attention.
A successful conclusion to the TPP negotiations will be likely to increase
the incentives to push forward in the RCEP. If both of these Asian and
Asia- Pacific tracks are concluded, the Asia- Pacific region will be well on
its way to a Free- Trade Area of the Asia Pacific (FTAAP) beginning in
2020, which was articulated at the November 2010 Yokohama APEC
summit as the ultimate goal of the region’s trade cooperation. This process
could also potentially draw in other economies, for example in South Asia
(India) and in Latin America.
Now, an APEC- only FTAAP itself, with over 60 per cent of global
GDP – let alone an FTAAP that includes additional members – would be
sufficient to create concerns as to the future of the global trading system.
The emerging “post- Doha” agenda 191
Such concerns need to be allayed by emphasizing in word and deed that
Asia- Pacific cooperation is about open regionalism and supporting the
global system, rather than creating a competitor to it. That might take
some doing. But in the meantime, it could well be that, as in the case of
the Uruguay Round and the Blake Island summit of APEC in 1993, the
successful Asia- Pacific integration process could revitalize global negotia-
tions well before 2020. All that is certain is that trade policy over the next
decade will be interesting.
NOTES
1. WTO website, www.wto.org, accessed 19 March 2014.
2. www.aric.adb.org, accessed 19 March 2014.
3. Part of this section draws from Plummer (2012).
4. Hufbauer and Schott (2012) are also skeptical of future progress at the DDA and
propose moving away from a single- undertaking toward a “Grand Bargain” as a more
effective way of moving the process forward.
5. The third WTO plurilateral relates to trade in civil aircraft.
6. Some of this discussion is adapted from Plummer (2006).
7. See, for example, Hufbauer and Schott (2005).
8. These were higher in the case of Mexico, but as Mexico is a small economy compared
to the US and Canada, the net effects could not be large.
9. It is interesting to note that CAFTA was passed in the US only after personal lobbying
by the President himself, and then the pact passed by only a two- vote margin in the
House of Representatives. But Congressional opposition was not due to a dislike of
regionalism per se but rather a dislike of trade liberalization, that is, it was generally
opposed on traditional protectionist grounds.
10. The NAFTA office of Mexico in Canada, http://www.nafta- mexico.org/ls23al.
php?s=501&p=3&l=2, accessed 19 March 2014.
11. See the classic piece by Frankel (1997), from which some of these topics are adopted.
12. Nor are they at the country- level. While the optimum tariff argument is one of the three
classic economic arguments in favor of protection (the others being the infant- industry
argument and strategic trade policy), it is well recognized to be a theoretical argument.
Tariffs are generally implemented for political and political- economy- related reasons,
not as a means of trying to extract terms of trade gains.
13. The Turkey case may be the most famous but there are others. For example, while
Spain’s external tariff regime became more liberal after it joined the EC, the country
did raise protection on agricultural imports in order to harmonize its policies with the
EC’s Common Agricultural Policy. The US was able to extract compensation from the
EC in the feed- grains sectors in compensation for the associated trade diversion.
14. It should be noted that IPR is probably the most controversial in terms of the ultimate
effect on economic efficiency.
15. It is not clear that much has changed in Latin America: MERCOSUR, which is a
customs union between Brazil, Argentina, Paraguay and Uruguay, has often been
reluctant to open certain markets domestically (e.g. automobiles) and the customs
union itself has over 1000 exemptions.
16. Perhaps it would be more accurate to say “anecdotally”, as the empirical literature on
this subject is not well developed.
17. For additional cooperative scenarios see www.asiapacifictrade.org.
192 New global economic architecture
REFERENCES
Asian Development Bank (ADB). 2008. Emerging Asian Regionalism. Manila: ADB.
Asian Development Bank. 2011. Asia 2050: Realizing the Asian Century. Manila: ADB. Available at: http://www.adb.org/publications/asia- 2050- real izing- asian- century.
Asian Development Bank. 2012. Asian Economic Integration Monitor. Manila: ADB.
Deardorff, A.V. 2003. What might globalisation’s critics believe? The World Economy 26(5): 639–58.
Frankel, J.A. 1997. Regional Trading Blocs in the World Trading System. Washington, DC: Institute for International Economics.
Frankel, J. (ed.). 1998. The Regionalization of the World Economy, Chicago: University of Chicago Press.
Geneva Watch. 2012. Pursuing an ambitious services plurilateral agreement. Geneva Watch 12(19), June: 1. Available at: http://www.chep- poic.ca/pdf/Geneva_Watch/2012/Geneva%20Watch_June%201%202012.pdf, accessed 18 July, 2012.
Herzstein, R.E. and J.P. Whitlock. 2005. Regulating regional trade agreements: A legal analysis. In: P.J. Macrory, A.E. Appleton and M.G. Plummer (eds) The World Trade Organization: Legal, Economic and Political Analysis. New York: Springer.
Hufbauer, G.C. and J.J. Schott. 2005. NAFTA Revisited: Achievements and Challenges. Peterson Institute for International Economics. October.
Hufbauer, G.C. and J.J. Schott. 2012. Will the World Trade Organization enjoy a bright future? Peterson Institute for International Economics Policy Brief No. PB12–11. May.
Kawai, M. 2005. East Asian economic regionalism: Progress and challenges. Journal of Asian Economics 16(1).
Kose, M.A. and A. Rebucci. 2005. How might CAFTA change macroeconomic fluctuations in Central America? Lessons from NAFTA. Journal of Asian Economics 16(1): 77–104.
Kreinin, M.E. and M.G. Plummer. 2002. Economic Integration and Development: Has Regionalism Delivered for Developing Countries? Cheltenham, UK and Northampton, MA, USA: Edward Elgar Publishing.
Petri, P.A. and M.G. Plummer. 2014. ASEAN centrality and the ASEAN- US eco-nomic relationship. Policy Studies No. 69. Honolulu: East- West Center.
Petri, P.A., M.G. Plummer and F. Zhai. 2011. The trans- Pacific partnership and Asia- Pacific integration: A quantitative assessment. Working Paper. Peterson Institute for International Economics and the East- West Center. October.
Plummer, M. 2006. Toward win–win regionalism in Asia: Issues and challenges in forming efficient free- trade agreements, ADB Working Paper on Regional Economic Integration No. 5. Manila: ADB. Available at: http://aric.adb.org/publications/workingpaperseries.
Plummer, M.G. 2007. Best practices in regional trading agreements: An applica-tion to Asia. The World Economy 30(12): 1771–96.
Plummer, M.G. 2012. Transatlantic economic relations in a changing global
The emerging “post- Doha” agenda 193
environment. Invited paper prepared for the European Parliament and pre-sented 30 May in Brussels. Mimeo.
World Bank. 2005. Global Economic Prospects: Trade, Regionalism, and Development. Washington, DC: The World Bank.
World Trade Organization (WTO). 2011. World Trade Report: The WTO and Preferential Trading Agreements: From Co- Existence to Coherence. Geneva, Switzerland: WTO.
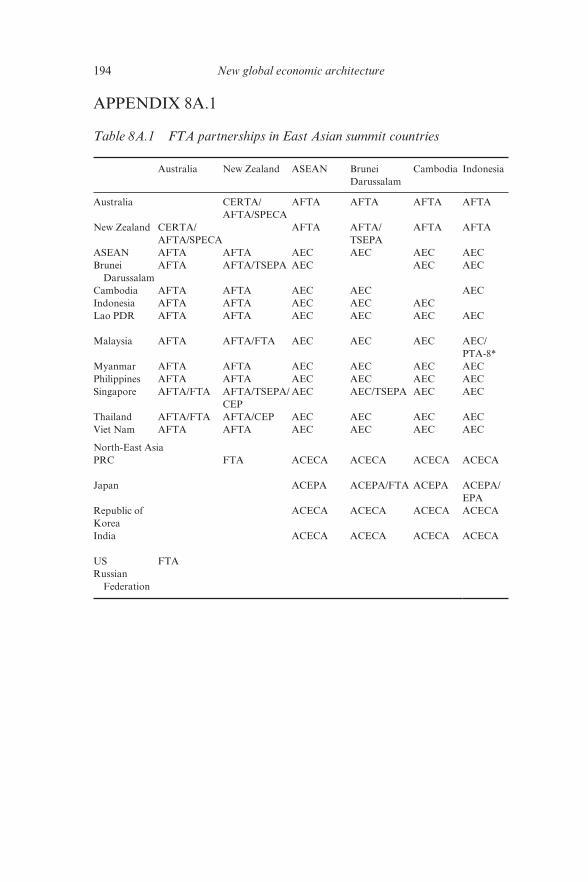
194 New global economic architecture
APPENDIX 8A.1
Table 8A.1 FTA partnerships in East Asian summit countries
Australia New Zealand ASEAN Brunei
Darussalam
Cambodia Indonesia
Australia CERTA/
AFTA/SPECA
AFTA AFTA AFTA AFTA
New Zealand CERTA/
AFTA/SPECA
AFTA AFTA/
TSEPA
AFTA AFTA
ASEAN AFTA AFTA AEC AEC AEC AEC
Brunei
Darussalam
AFTA AFTA/TSEPA AEC AEC AEC
Cambodia AFTA AFTA AEC AEC AEC
Indonesia AFTA AFTA AEC AEC AEC
Lao PDR AFTA AFTA AEC AEC AEC AEC
Malaysia AFTA AFTA/FTA AEC AEC AEC AEC/
PTA- 8*
Myanmar AFTA AFTA AEC AEC AEC AEC
Philippines AFTA AFTA AEC AEC AEC AEC
Singapore AFTA/FTA AFTA/TSEPA/
CEP
AEC AEC/TSEPA AEC AEC
Thailand AFTA/FTA AFTA/CEP AEC AEC AEC AEC
Viet Nam AFTA AFTA AEC AEC AEC AEC
North- East Asia
PRC FTA ACECA ACECA ACECA ACECA
Japan ACEPA ACEPA/FTA ACEPA ACEPA/
EPA
Republic of
Korea
ACECA ACECA ACECA ACECA
India ACECA ACECA ACECA ACECA
US FTA
Russian
Federation
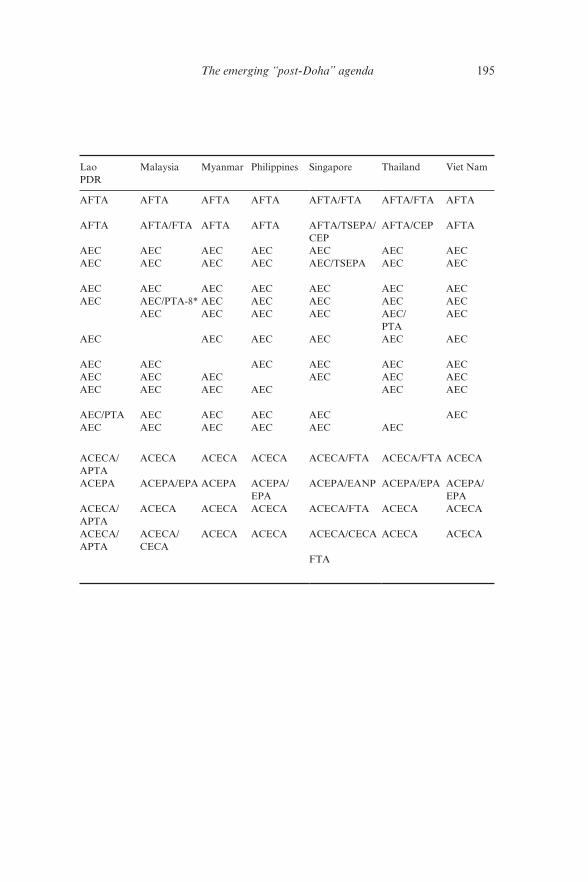
The emerging “post- Doha” agenda 195
Lao
PDR
Malaysia Myanmar Philippines Singapore Thailand Viet Nam
AFTA AFTA AFTA AFTA AFTA/FTA AFTA/FTA AFTA
AFTA AFTA/FTA AFTA AFTA AFTA/TSEPA/
CEP
AFTA/CEP AFTA
AEC AEC AEC AEC AEC AEC AEC
AEC AEC AEC AEC AEC/TSEPA AEC AEC
AEC AEC AEC AEC AEC AEC AEC
AEC AEC/PTA- 8* AEC AEC AEC AEC AEC
AEC AEC AEC AEC AEC/
PTA
AEC
AEC AEC AEC AEC AEC AEC
AEC AEC AEC AEC AEC AEC
AEC AEC AEC AEC AEC AEC
AEC AEC AEC AEC AEC AEC
AEC/PTA AEC AEC AEC AEC AEC
AEC AEC AEC AEC AEC AEC
ACECA/
APTA
ACECA ACECA ACECA ACECA/FTA ACECA/FTA ACECA
ACEPA ACEPA/EPA ACEPA ACEPA/
EPA
ACEPA/EANP ACEPA/EPA ACEPA/
EPA
ACECA/
APTA
ACECA ACECA ACECA ACECA/FTA ACECA ACECA
ACECA/
APTA
ACECA/
CECA
ACECA ACECA ACECA/CECA ACECA ACECA
FTA
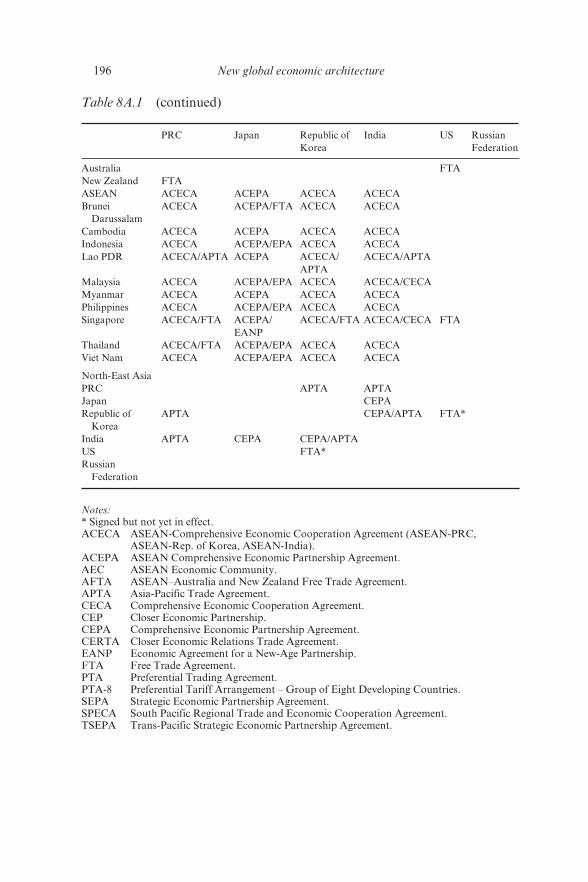
196 New global economic architecture
Table 8A.1 (continued)
PRC Japan Republic of
Korea
India US Russian
Federation
Australia FTA
New Zealand FTA
ASEAN ACECA ACEPA ACECA ACECA
Brunei
Darussalam
ACECA ACEPA/FTA ACECA ACECA
Cambodia ACECA ACEPA ACECA ACECA
Indonesia ACECA ACEPA/EPA ACECA ACECA
Lao PDR ACECA/APTA ACEPA ACECA/
APTA
ACECA/APTA
Malaysia ACECA ACEPA/EPA ACECA ACECA/CECA
Myanmar ACECA ACEPA ACECA ACECA
Philippines ACECA ACEPA/EPA ACECA ACECA
Singapore ACECA/FTA ACEPA/
EANP
ACECA/FTA ACECA/CECA FTA
Thailand ACECA/FTA ACEPA/EPA ACECA ACECA
Viet Nam ACECA ACEPA/EPA ACECA ACECA
North- East Asia
PRC APTA APTA
Japan CEPA
Republic of
Korea
APTA CEPA/APTA FTA*
India APTA CEPA CEPA/APTA
US FTA*
Russian
Federation
Notes:
* Signed but not yet in effect.
ACECA ASEAN- Comprehensive Economic Cooperation Agreement (ASEAN- PRC,
ASEAN- Rep. of Korea, ASEAN- India).
ACEPA ASEAN Comprehensive Economic Partnership Agreement.
AEC ASEAN Economic Community.
AFTA ASEAN–Australia and New Zealand Free Trade Agreement.
APTA Asia- Pacific Trade Agreement.
CECA Comprehensive Economic Cooperation Agreement.
CEP Closer Economic Partnership.
CEPA Comprehensive Economic Partnership Agreement.
CERTA Closer Economic Relations Trade Agreement.
EANP Economic Agreement for a New- Age Partnership.
FTA Free Trade Agreement.
PTA Preferential Trading Agreement.
PTA- 8 Preferential Tariff Arrangement – Group of Eight Developing Countries.
SEPA Strategic Economic Partnership Agreement.
SPECA South Pacific Regional Trade and Economic Cooperation Agreement.
TSEPA Trans- Pacific Strategic Economic Partnership Agreement.
197
9. The World Bank and the Asian Development Bank: should Asia have both?
Vikram Nehru
9.1 INTRODUCTION
The World Bank and the Asian Development Bank (ADB) face three sets
of challenges: those that are common to others in the official development
finance community; those that are common to the World Bank’s relations
with other multilateral regional development banks (the European Bank
for Reconstruction and Development, the African Development Bank and
the Inter- American Development Bank), several multilateral subregional
development banks, and multilateral financial institutions (MFIs);1 and
finally, those related to operating as multilateral development banks in the
most dynamic region in the world: Asia.
This chapter examines all three challenges and asks whether it may be
an opportune time to rethink the configuration of the world’s multilateral
development banking system. The current configuration – like the rest of
the global aid architecture – has grown organically, responding to emerg-
ing challenges with new institutional and procedural “fixes”. The result is
a complex and unwieldy set of institutions that, despite their best efforts
at coordination and cooperation, sometimes work against each other and
often add to the administrative burden of the member governments they
serve.
The chapter begins with an overview of how a rapidly changing world
is altering development priorities and giving rise to new development chal-
lenges that are stretching the capabilities of the development community,
including development finance institutions. Section 9.3 describes the roles
of the World Bank and ADB in Asia, provides some comparisons, notes
their overlapping responsibilities, and explains current approaches to
coordination and cooperation. Section 9.4 examines the issues and options
confronting the two institutions, and Section 9.5 concludes by asking if
Asia can afford both.
198 New global economic architecture
9.2 THE WORLD OF – AND AROUND – DEVELOPMENT FINANCE IS CHANGING
Output, Trade and Finance
The global economic landscape is undergoing a profound transformation.
The structure of world output, trade and finance is shifting rapidly. The
rise of Asia, especially the People’s Republic of China (PRC) and to a
lesser extent India, is inexorably shifting the global economy’s center of
gravity away from Europe and the United States. This trend was clearly
visible in the 1990s, accelerated in the 2000s, and has been amplified by
the 2008–09 global financial crisis. As a result, emerging economies have
become an influential force in the global economy. The share of develop-
ing countries in global trade has climbed from 30 per cent in 1995 to 45
per cent in 2010. Much of this increased trade has been among developing
countries. Similarly, over a third of foreign direct investment in develop-
ing countries now comes from other developing countries. Indeed, since
the global financial crisis, the investment risk premium in many emerging
economies is below that in some European countries. Reflecting the strong
external payments position in many developing countries, international
reserves held by emerging economies reached US$7.4 trillion in 2010, well
over three times the US$2.1 trillion in reserves held by advanced econo-
mies (World Bank 2011).
Capital Flows
Another dimension of change in the global economic landscape has been
the level and volatility of capital flows. International trade in financial
assets has grown much more rapidly than international trade in goods
and services. Indeed, the volume of assets traded internationally climbed
over 15- fold in the two decades prior to the financial crisis – with bank
loans, bonds and portfolio flows growing at roughly the same pace as
each other while derivatives grew much faster. This growth is likely to
accelerate as global savings is expected to rise rapidly because savings will
rise in advanced countries and there will be little corresponding decline in
savings in developing countries. The size of the foreign asset market has
already significantly complicated macroeconomic management, especially
in emerging market economies where capital inflows and outflows tend to
be particularly volatile – and the size and volatility of such flows is only
likely to increase.
The World Bank and the Asian Development Bank 199
Multiple Growth Poles and Global Governance Mechanisms
Going forward, emerging economies are expected to outperform advanced
countries and become important drivers of global growth and trade. By
2030, global economic projections show emerging economies are likely to
contribute two- thirds of global growth, half of global output, and will be
the main destinations of world trade. Just as the rise of the United States
in the late nineteenth century altered the balance of power and influenced
the course of events in the twentieth century, so too will the rise of emerg-
ing economies affect the distribution of global economic and geopolitical
power in the twenty- first century.
The emergence of multiple growth poles and centers of economic power
will need to be reflected in global governance mechanisms responsible for
the management of global economic affairs including global economic and
financial stability, economic development and global trade in goods and
services. While there has been considerable discussion on how these shifts
should be reflected in the world’s governance arrangements, agreement
has been difficult to reach and progress has been slow.
Global Public Goods
Notwithstanding the global financial crisis and the increased risk of
protectionism, especially in developed countries, the forces of globaliza-
tion will remain irresistible. As a result, global public goods – a global
agreement for trade of goods and services, climate change mitigation,
international financial stability, anti- money laundering and countering
the financing of terrorism, food and energy security, intellectual property
rights, a legal framework for commercialization of space and the sea bed,
among others – are only going to increase in value. There is little doubt
that the world’s demand for these global public goods will increase. The
major question is whether there is sufficient global will for collective action
that will ensure their supply.
International Aid Architecture
It is within this global context that the current international aid architec-
ture will need to evolve. Official aid flows to developing countries peaked
in 1991, driven in large part by bilateral aid. Multilateral aid grew only
modestly, at about 4 per cent a year in the two decades before 1991. Aid
flows slowed after 1991, again largely owing to bilateral aid, falling by as
much as 22 per cent by 1997. But this period also saw increased poverty
in sub- Saharan Africa and an expanding group of fragile states. In 2002,
200 New global economic architecture
spurred by the Millennium Development Goals, the international com-
munity committed to doubling aid by 2010. Actual aid flows have since
climbed by more than 50 per cent, but the amount of aid that recipients
can actually use is barely above the level of 1991 (Kharas 2007).2
While multilateral aid has climbed steadily in nominal terms, its com-
position shifted in two ways. First, the share of IDA and regional banks
fell from 47 per cent of total multilateral aid in 1995 to 36 per cent in 2005,
while the share of UN agencies fell from 25 per cent to 17 per cent over
the same period. The European Commission, which became the largest
source of multilateral aid in 1997, largely filled the gap (Kharas 2007).
Second, the last two decades have seen the birth of an increasing number
of vertical funds – such as the Global Environmental Facility (GEF), the
Global Vaccines Alliance (GAVI) and the Global Fund to Fight AIDS,
Tuberculosis, and Malaria (GFATM) – some of which have themselves
become bewilderingly complex.
Perhaps the most significant development in recent years has been
the rise of non- traditional donors: non- DAC (Development Assistance
Committee of the Organisation for Economic Co- operation and
Development) bilateral donors, foundations, non- government organiza-
tions (NGOs), religious organizations and private voluntary organiza-
tions. Non- traditional donors are the fastest growing component of
aid flows. Of these, private giving (by foundations, NGOs, religious
organizations and private voluntary organizations) is by far the most
significant, surpassing official aid flows in recent years. Non- DAC bilat-
eral donors include Brazil; the People’s Republic of China (PRC); India;
Taipei,China; Turkey; and Thailand. Of these, aid from the PRC has
grown the fastest.3
In summary, the international aid architecture has become a complex
behemoth. Some 37 bilateral donor countries report their aid to DAC and
many others do not; there are 233 multilateral agencies, more than there
are bilateral donors and recipient countries (155) combined. Dozens of
international NGOs receive funds from bilateral donors, and thousands of
private organizations have joined the aid community, some of them, such
as the Gates Foundation, rivaling the largest bilateral and multilateral
organizations in size and reach.
More donors have meant greater fragmentation of aid. In 1996, DAC
bilateral donors financed 15 750 new aid activities with an average size of
almost US$3 million. By 2008, this had climbed to 84 764 activities, and
the average size had shrunk to US$1.35 million – with a median size of
only US$87 499 (Kharas and Fengler 2011).
Notwithstanding the rapid growth in aid from private givers, the pre-
vailing view is that overall official development assistance (ODA) flows
The World Bank and the Asian Development Bank 201
fall significantly short of what is desirable. But there are differing views
on how much incremental ODA should flow to developing countries.
Estimates range from US$50 billion (United Nations 2002) to US$200
billion (by those who argue that aid should reach the 0.7 per cent of GDP
target of developed countries). Detractors, however, respond that further
aid will only spawn additional corruption, and unless aid effectiveness is
increased, channeling additional aid will do little for promoting sustain-
able and inclusive development.
The challenge for the international aid community is to improve the
current system (starting from a clean slate is not an option) and configure
it in a way that channels aid through the most efficient organizations,
ensures that it is provided for optimal- sized programs, projects and activi-
ties with high development impact, and to deliver it to countries where
need is greatest.
One way to do this would be to tailor aid in accordance with a country’s
circumstances. To achieve this will require country ownership of aid-
financed projects and the discipline of supporting country priorities and
strategies. Another way is to better coordinate aid so donors don’t work at
cross- purposes or add to the administrative burden of the recipients. This
will require acceleration in implementing the Paris Declaration on Aid
Effectiveness and expansion of it to cover non- traditional donors. Finally,
national development agencies should insist on rigorous evaluations that
identify successful projects for scaling up and delivering systemic change,
while ensuring unsuccessful ones are discontinued or redesigned.
9.3 ADB AND THE WORLD BANK: FUNCTIONS, STRUCTURES, ROLES AND RESPONSIBILITIES
The previous section showed that ADB and the World Bank operate
within a rapidly evolving and increasingly complicated global aid architec-
ture. This section examines the institutions in greater detail and compares
them along different dimensions.
ADB was established in 1966 “to foster economic growth and co-
operation in the region of Asia and the Far East . . . and to contribute to
the acceleration of the process of economic development of the developing
member countries in the region, collectively and individually” (ADB 1966,
p. 4). Its initial focus was on food and rural development projects but it
quickly diversified its operations to include education, health and infra-
structure development. During the 1970s oil crisis, ADB began financing
energy projects to increase energy security in the region. It financed its first
equity investment in the 1980s and was a major player, together with the
202 New global economic architecture
International Monetary Fund (IMF) and the World Bank, in responding
to the Asian Financial Crisis in the late 1990s by supporting financial
sector development and strengthening social safety nets. It was during this
period that ADB made poverty reduction its key objective. Starting with
31 members in 1966, ADB now has 67 members, of which 48 are from Asia
and the Pacific and 19 are from outside this region (ADB Annual Reports,
various issues).
The World Bank was created in 1944 to extend finance for the recon-
struction of Europe following World War II and subsequently to over-
come obstacles facing developing countries trying to access international
capital for development purposes. It now consists of five separate entities:
the International Bank for Reconstruction and Development (IBRD);
the International Development Association (IDA); the International
Finance Corporation (IFC); the Multilateral Investment Guarantee
Agency (MIGA); and the International Centre for Settlement of Investment
Disputes (ICSID). IBRD and IDA constitute the core of the World Bank
Group and provide financial and technical assistance for development in
low- and middle- income countries through a suite of loans and grants across
the entire range of development challenges facing poor countries – including
health, education, infrastructure, agriculture, public administration, macr-
oeconomic management, institutional development, governance, financial
and private- sector development, environmental protection, and natural
resource management (World Bank Annual Reports, various issues).
Both the World Bank and ADB are actively involved in every low- and
middle- income country in Asia and the Pacific, except the Democratic
People’s Republic of Korea. There is a similar overlap in sectoral
involvement.
Coordination is therefore a key issue. At the Group of Twenty (G20)
summit in Pittsburgh in September 2009, leaders called for greater coor-
dination and a clearer division of labor between the World Bank and the
regional development banks. They further stated that the World Bank and
regional development banks take into account their comparative advan-
tage, while improving coordination and efficiency and minimizing overlap
with other international financial institutions and private financial institu-
tions (World Bank 2010).
Notwithstanding this, coordination between the World Bank and ADB
in Asia has not been a simple matter. ADB has to coordinate country strat-
egies with three different regional vice presidents of the World Bank (East
Asia and the Pacific, South Asia, and Europe and Central Asia) as well as
the country directors in each country. Previously it also had to coordinate
sector strategies with the World Bank’s three major networks: poverty
reduction and economic management; sustainable development; and
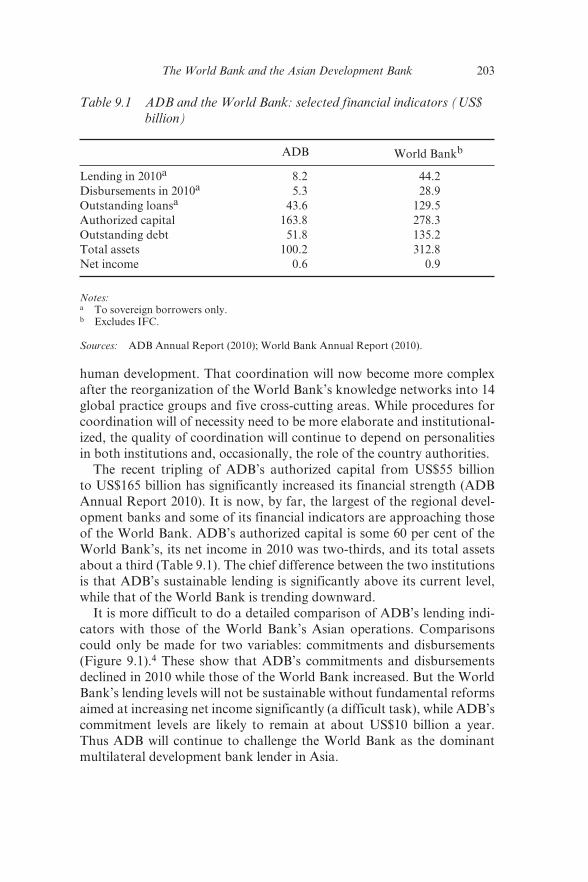
The World Bank and the Asian Development Bank 203
human development. That coordination will now become more complex
after the reorganization of the World Bank’s knowledge networks into 14
global practice groups and five cross-cutting areas. While procedures for
coordination will of necessity need to be more elaborate and institutional-
ized, the quality of coordination will continue to depend on personalities
in both institutions and, occasionally, the role of the country authorities.
The recent tripling of ADB’s authorized capital from US$55 billion
to US$165 billion has significantly increased its financial strength (ADB
Annual Report 2010). It is now, by far, the largest of the regional devel-
opment banks and some of its financial indicators are approaching those
of the World Bank. ADB’s authorized capital is some 60 per cent of the
World Bank’s, its net income in 2010 was two- thirds, and its total assets
about a third (Table 9.1). The chief difference between the two institutions
is that ADB’s sustainable lending is significantly above its current level,
while that of the World Bank is trending downward.
It is more difficult to do a detailed comparison of ADB’s lending indi-
cators with those of the World Bank’s Asian operations. Comparisons
could only be made for two variables: commitments and disbursements
(Figure 9.1).4 These show that ADB’s commitments and disbursements
declined in 2010 while those of the World Bank increased. But the World
Bank’s lending levels will not be sustainable without fundamental reforms
aimed at increasing net income significantly (a difficult task), while ADB’s
commitment levels are likely to remain at about US$10 billion a year.
Thus ADB will continue to challenge the World Bank as the dominant
multilateral development bank lender in Asia.
Table 9.1 ADB and the World Bank: selected financial indicators (US$
billion)
ADB World Bankb
Lending in 2010a 8.2 44.2
Disbursements in 2010a 5.3 28.9
Outstanding loansa 43.6 129.5
Authorized capital 163.8 278.3
Outstanding debt 51.8 135.2
Total assets 100.2 312.8
Net income 0.6 0.9
Notes:a To sovereign borrowers only.b Excludes IFC.
Sources: ADB Annual Report (2010); World Bank Annual Report (2010).
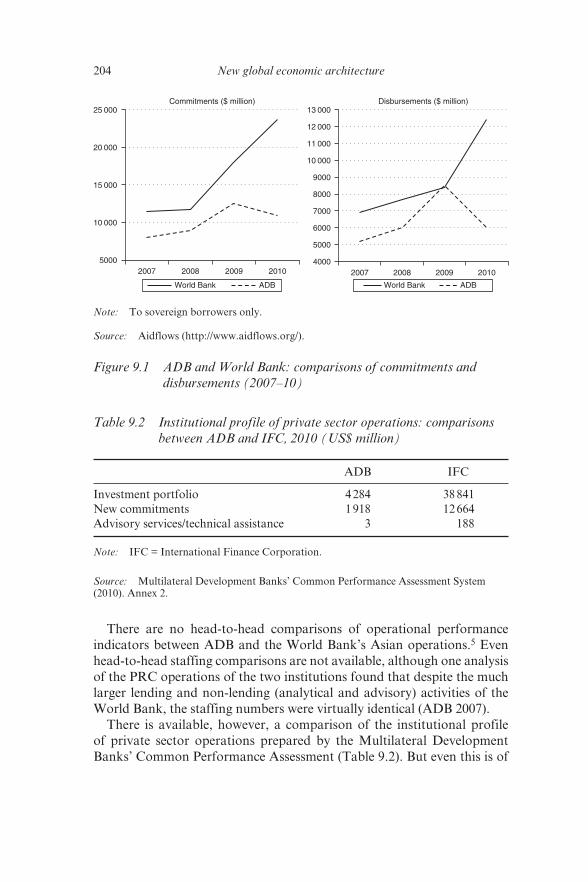
204 New global economic architecture
There are no head- to- head comparisons of operational performance
indicators between ADB and the World Bank’s Asian operations.5 Even
head- to- head staffing comparisons are not available, although one analysis
of the PRC operations of the two institutions found that despite the much
larger lending and non- lending (analytical and advisory) activities of the
World Bank, the staffing numbers were virtually identical (ADB 2007).
There is available, however, a comparison of the institutional profile
of private sector operations prepared by the Multilateral Development
Banks’ Common Performance Assessment (Table 9.2). But even this is of
Commitments ($ million) Disbursements ($ million)
5000
10 000
15 000
20 000
25 000
2007 2008 2009 2010
World Bank ADB
4000
5000
6000
7000
8000
9000
10 000
11 000
12 000
13 000
2007 2008 2009 2010
World Bank ADB
Note: To sovereign borrowers only.
Source: Aidflows (http://www.aidflows.org/).
Figure 9.1 ADB and World Bank: comparisons of commitments and
disbursements (2007–10)
Table 9.2 Institutional profile of private sector operations: comparisons
between ADB and IFC, 2010 (US$ million)
ADB IFC
Investment portfolio 4 284 38 841
New commitments 1 918 12 664
Advisory services/technical assistance 3 188
Note: IFC = International Finance Corporation.
Source: Multilateral Development Banks’ Common Performance Assessment System
(2010). Annex 2.
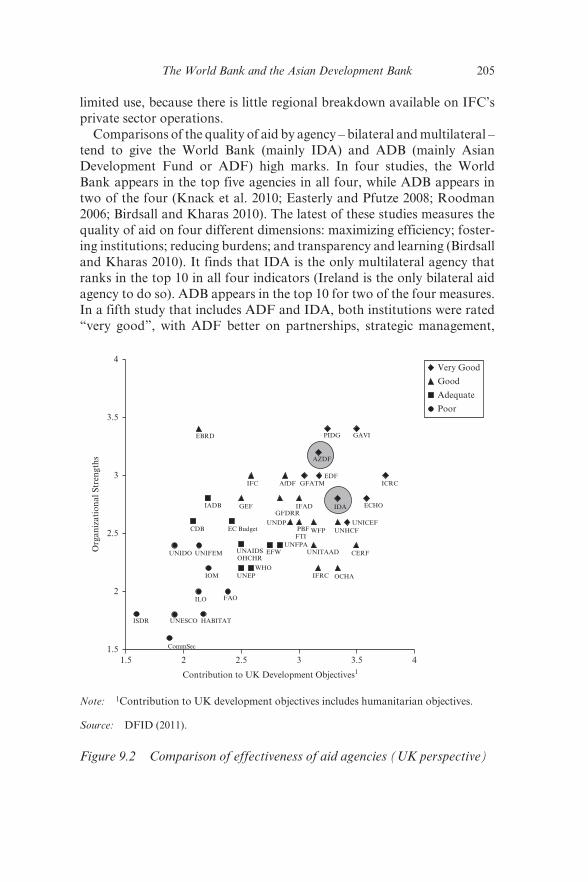
The World Bank and the Asian Development Bank 205
limited use, because there is little regional breakdown available on IFC’s
private sector operations.
Comparisons of the quality of aid by agency – bilateral and multilateral –
tend to give the World Bank (mainly IDA) and ADB (mainly Asian
Development Fund or ADF) high marks. In four studies, the World
Bank appears in the top five agencies in all four, while ADB appears in
two of the four (Knack et al. 2010; Easterly and Pfutze 2008; Roodman
2006; Birdsall and Kharas 2010). The latest of these studies measures the
quality of aid on four different dimensions: maximizing efficiency; foster-
ing institutions; reducing burdens; and transparency and learning (Birdsall
and Kharas 2010). It finds that IDA is the only multilateral agency that
ranks in the top 10 in all four indicators (Ireland is the only bilateral aid
agency to do so). ADB appears in the top 10 for two of the four measures.
In a fifth study that includes ADF and IDA, both institutions were rated
“very good”, with ADF better on partnerships, strategic management,
1.5
1.5 2 2.5 3 3.5 4
2
2.5
3
3.5
4
Org
an
izati
on
al
Str
ength
s
Contribution to UK Development Objectives1
CommSec
ISDR UNESCO HABITAT
ILO FAO
IOM UNEP
UNIDO UNIFEM
CDB
IADB GEF
IFC AfDF GFATM
EDF
AZDF
PIDG GAVI
ICRC
ECHO
UNICEF
UNHCF
CERF
OCHAIFRC
WHO
EFW
UNFPA
UNDPPBF
FTIWFP
IFADGFDRR
UNITAAD
EC Budget
UNAIDS
OHCHR
IDA
EBRD
Very Good
Good
Adequate
Poor
Note: 1Contribution to UK development objectives includes humanitarian objectives.
Source: DFID (2011).
Figure 9.2 Comparison of effectiveness of aid agencies (UK perspective)
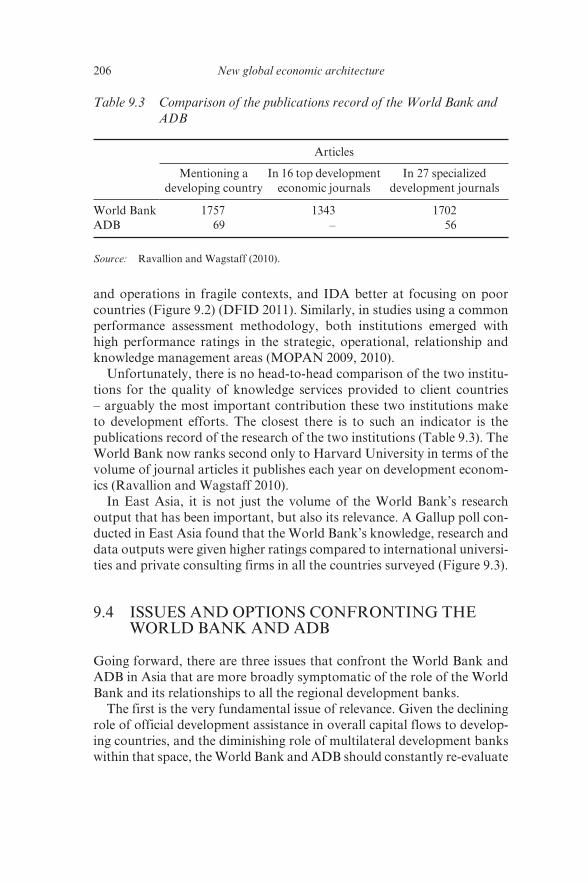
206 New global economic architecture
and operations in fragile contexts, and IDA better at focusing on poor
countries (Figure 9.2) (DFID 2011). Similarly, in studies using a common
performance assessment methodology, both institutions emerged with
high performance ratings in the strategic, operational, relationship and
knowledge management areas (MOPAN 2009, 2010).
Unfortunately, there is no head- to- head comparison of the two institu-
tions for the quality of knowledge services provided to client countries
– arguably the most important contribution these two institutions make
to development efforts. The closest there is to such an indicator is the
publications record of the research of the two institutions (Table 9.3). The
World Bank now ranks second only to Harvard University in terms of the
volume of journal articles it publishes each year on development econom-
ics (Ravallion and Wagstaff 2010).
In East Asia, it is not just the volume of the World Bank’s research
output that has been important, but also its relevance. A Gallup poll con-
ducted in East Asia found that the World Bank’s knowledge, research and
data outputs were given higher ratings compared to international universi-
ties and private consulting firms in all the countries surveyed (Figure 9.3).
9.4 ISSUES AND OPTIONS CONFRONTING THE WORLD BANK AND ADB
Going forward, there are three issues that confront the World Bank and
ADB in Asia that are more broadly symptomatic of the role of the World
Bank and its relationships to all the regional development banks.
The first is the very fundamental issue of relevance. Given the declining
role of official development assistance in overall capital flows to develop-
ing countries, and the diminishing role of multilateral development banks
within that space, the World Bank and ADB should constantly re- evaluate
Table 9.3 Comparison of the publications record of the World Bank and
ADB
Articles
Mentioning a
developing country
In 16 top development
economic journals
In 27 specialized
development journals
World Bank 1757 1343 1702
ADB 69 – 56
Source: Ravallion and Wagstaff (2010).
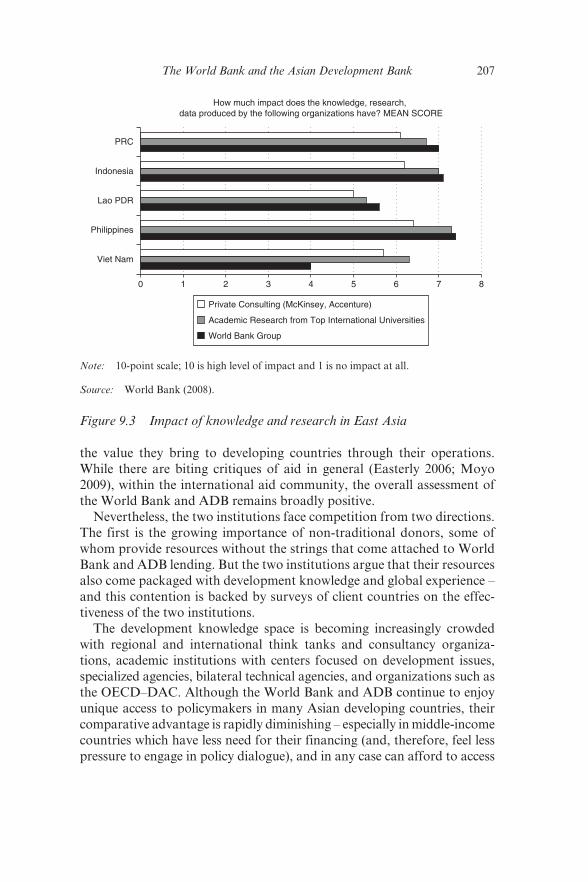
The World Bank and the Asian Development Bank 207
the value they bring to developing countries through their operations.
While there are biting critiques of aid in general (Easterly 2006; Moyo
2009), within the international aid community, the overall assessment of
the World Bank and ADB remains broadly positive.
Nevertheless, the two institutions face competition from two directions.
The first is the growing importance of non- traditional donors, some of
whom provide resources without the strings that come attached to World
Bank and ADB lending. But the two institutions argue that their resources
also come packaged with development knowledge and global experience –
and this contention is backed by surveys of client countries on the effec-
tiveness of the two institutions.
The development knowledge space is becoming increasingly crowded
with regional and international think tanks and consultancy organiza-
tions, academic institutions with centers focused on development issues,
specialized agencies, bilateral technical agencies, and organizations such as
the OECD–DAC. Although the World Bank and ADB continue to enjoy
unique access to policymakers in many Asian developing countries, their
comparative advantage is rapidly diminishing – especially in middle- income
countries which have less need for their financing (and, therefore, feel less
pressure to engage in policy dialogue), and in any case can afford to access
0 1 2 3 4 5 6 7 8
Viet Nam
Philippines
Lao PDR
Indonesia
PRC
Private Consulting (McKinsey, Accenture)
Academic Research from Top International Universities
World Bank Group
How much impact does the knowledge, research, data produced by the following organizations have? MEAN SCORE
Note: 10- point scale; 10 is high level of impact and 1 is no impact at all.
Source: World Bank (2008).
Figure 9.3 Impact of knowledge and research in East Asia
208 New global economic architecture
the best technical knowledge available in the world wherever it may reside.
Sometimes, this knowledge may reside in the World Bank and ADB, but
often it does not. Moreover, increasingly Asian policymakers and their staff
are just as qualified as their World Bank or ADB counterparts, sometimes
more so, and often with more hands- on experience of policy issues and
policy implementation.
In Asia, the World Bank and ADB face a particularly challenging situa-
tion. The rapid economic growth of Asian countries has meant that many
have moved from low- income to middle- income status and consequently
need fewer resources from the World Bank and ADB while demanding more
responsive and more sophisticated knowledge inputs. In many instances,
policymakers in these countries look to examples and experience of the devel-
oped countries, not just in policy formulation but also in policy implementa-
tion. But such expertise is less likely to reside in ADB and the World Bank
and is more likely to be found in government departments and implementing
agencies of developed countries. True, ADB and the World Bank could act
as conveners, matching demand for knowledge with those who have the best
expertise available on the subject. But this space is highly contestable too,
and other agencies – private and public – are increasingly providing these
services, sometimes more efficiently than the World Bank or ADB.
The second key issue confronting both institutions is governance. This
is perhaps more keenly felt in the World Bank, where there has been con-
siderable concern that the voting structure does not represent the increas-
ing influence of developing countries. Recent increases in the voting rights
of some developing countries, particularly the PRC, have raised the com-
bined voting share of developing countries from 42.6 per cent to 44.1 per
cent in 2008 and then to 47 per cent in 2011, still short of parity with the
developed (Part I) countries.6 In addition, African countries were given
an additional seat at the World Bank’s Executive Board to bring the total
number to 25.
The reality remains, however, that the voting power in the World Bank
does not truly reflect the relative importance of member countries in the
global economy. To boost its legitimacy, the World Bank will need to
further revise its voting shares to bring the share of developing countries
closer to their contribution to the global gross domestic product (GDP).
A study has shown that whether a country has a seat on IBRD’s board
of directors appears to be important not just because it confers prestige
but also because it increases its normal loan allocation by nearly US$60
million on average (Kaja and Werker 2010). The analysis shows that this
does not stem from voting rights but could result more from the informal
powers that executive directors and their alternate directors exert on the
institution’s staff and management. Interestingly, the same result does not
The World Bank and the Asian Development Bank 209
hold for IDA, suggesting that less discretionary mechanisms for allocating
resources could overcome such governance problems.
Interestingly, ADB seems to face fewer criticisms on account of
governance – even though the economy of the largest shareholder of the
institution, Japan, is now smaller than that of the PRC, which has far
fewer voting rights.
Moreover, in the selection of the heads of the two institutions, the
United States has come under considerable criticism for continuing to
push for its nominee to become the President of the World Bank even
when the United States is both the largest economy in the world and is the
World Bank’s largest shareholder. Yet Japan has not been subjected to
similar criticism, even though it is no longer the largest economy in Asia
and yet remains the largest Asian shareholder, and the President of ADB
has always been a Japanese national.7
The third challenge confronting the World Bank and ADB in Asia is
their relationship with each other in operational matters and in advising
their Asian clients on development policies and strategies. Some would
suggest that the comparative advantage of the World Bank and ADB
differs. The former has a clear comparative advantage of working on
global public goods (climate change, global trade negotiations, global
migration, among others). The latter has an advantage in delivering
regional public goods, such as the development of the Greater Mekong
Subregion, the Chiang Mai Initiative, and support for the formation of the
ASEAN Economic Community.
Clearly, the two institutions can and must coordinate on all these issues,
in part to reduce the cost of operations and the burdens of Asian clients,
and to increase their development impact. The G20 made this point at the
2009 Pittsburgh summit. To achieve better coordination, both institutions
can leverage each other, make sure their support for Asian client countries is
aligned and mutually reinforcing, and ensure they do not duplicate services.
In reality, however, coordination and cooperation between the two insti-
tutions masks a hidden and unrecognized subtext of competition. Where
the two have coordinated, the results have been impressive – such as when
they worked together with the IMF during the 1997–98 Asian Financial
Crisis. Indeed, in all East Asian countries, ADB and the World Bank have
agreed to carve out “areas of primacy” in which one or the other institu-
tion takes the lead in crafting a country sector strategy jointly with the
client government and the other institution accepts the policy framework
in its future operations. But friction remains between the two institutions,
especially if they take different positions on the adequacy (or lack thereof)
of policy reforms sufficient to meet tranche conditions for budget support
operations, or when they have differences on sector strategies. But such
210 New global economic architecture
differences are healthy if they are acknowledged openly and there are
mechanisms in place to resolve them amicably. Unfortunately, there is a
tendency to mask such differences in the interest of showing a common
front vis- à- vis the client and in ensuring that shareholders – most of whom
are the same in both institutions – see the two institutions as working
closely together.
9.5 CAN ASIA AFFORD BOTH INSTITUTIONS?
Notwithstanding Asia’s rapid economic progress, its growing access to
capital markets and development expertise, and its own rapidly evolv-
ing capabilities, the reality is that the region still needs the presence of
one – or more – multilateral development banks. For Asia’s low- income
countries, these banks will continue to be an important source of long-
term finance, implementation know- how, and development knowledge
based on global experience. In addition, middle- income countries have
constantly expressed their appreciation for the objective policy advice
and analytical insight the two institutions provide and continue to use
their services even though they may have increased access to development
knowledge from other sources.
The challenge is how the two institutions can offer these services in the
most efficient manner so that there is genuine value added in development
support and that the burden for Asian client countries of dealing with
these institutions is minimized.
So what would be the optimal configuration of multilateral develop-
ment banks supporting Asia? There are a number of ways to approach
this question: through the theory of clubs, the theory of fiscal federalism,
or through the theory of cooperatives (Kawai and Petri 2010; Casella and
Frey 1992). All of them broadly lead to the same conclusion. The World
Bank and ADB should provide critical public goods that are partially (or
wholly) non- excludable and non- rivalrous in nature.8 As such, the services
they provide must not be replicable by private sector organizations. At the
same time, these institutions, being cooperatives (formed by members to
serve members and thereby achieve economies of scale), need to function
in accordance with rules that ensure that the governance arrangements are
acceptable to all members. The larger the number of members, the greater
the economies of scale become, but also the greater is the likelihood of
divergent interests among the membership and the greater the difficulty in
fashioning a consensus.
In the case of the World Bank and other regional development banks
such as ADB, the natural specialization would be for the World Bank to
The World Bank and the Asian Development Bank 211
focus on removing barriers to global agreements on the most important
global issues – such as trade, climate change, international migration,
global financial stability, disaster management (including health pandem-
ics and natural hazards) – working in tandem with the specialized global
agencies responsible for each of these areas. At the same time, the World
Bank, using the advantages of economies of scale could also be responsible
for development research and global knowledge management, as well as
mobilization of development resources for itself and the family of regional
development banks. ADB, on the other hand, could focus on crafting
regional agreements on public goods and services, such as support for
the ASEAN Economic Community, regional infrastructure corridors, the
Asian Bond Markets Initiative, and the Chiang Mai Initiative.
But such a division of labor has a fundamental problem. It is silent on
financing operations in countries and responsibility for the policy dia-
logue. Clearly, neither one nor the other institution could become solely
responsible for this important role. If ADB were responsible, then coun-
tries would be deprived of the global knowledge and research findings
of the World Bank. But if the World Bank were to be made responsible,
then countries would be deprived of ADB’s regional expertise and its
understanding of the relationship between regional initiatives and country
development strategies.
Furthermore, the reality is that without lending operations, neither
institution has the business model to pay for its non- lending activities.
Yet it is in this area where the greatest duplication and overlaps exist. The
World Bank has for many years expressed its intentions of becoming a
“knowledge bank”, but it continues to be a “lending bank” because it has
been unable to find a business model that could financially support knowl-
edge activities in the absence of lending.
There are two possible business models that would permit the World
Bank to specialize in being the world’s premier development research
agency and the key agency to push through global agreements on the
delivery of global public goods and services. The first would be if the
World Bank were to receive a financial endowment, the investment returns
on which would finance knowledge activities. While this approach may
sound appealing, it is impractical. There is, after all, the problem of mobi-
lizing such an endowment and the probability of success in the current
(and likely future) fiscal and financial environment appears next to neg-
ligible. Moreover, without development operations in its client countries,
the World Bank would merely become like any other think tank with no
direct involvement in development operations where it could draw insights
into development constraints and opportunities and apply proposed solu-
tions in country settings.
212 New global economic architecture
The second possible business model would be to formalize the links
between the World Bank and ADB, effectively making them one
decentralized bank in which the headquarters would be responsible for
addressing global issues, knowledge management and research, and
financial mobilization and allocation; while the regional “hub” would be
responsible for lending operations and crafting regional agreements on
regional public goods and services. Such an arrangement would follow an
organizational structure of successful cooperative associations where the
center uses economies of scale in providing overarching financial, research
and knowledge support, while individual cooperatives provide retail serv-
ices to their members.
While such an arrangement may appear optimal from a theoretical
perspective, its practical and political economy objections in the current
global economic environment appear prohibitive. First, there is the pos-
sible concern that the resulting World Bank – which would be a com-
bination of the current World Bank and all the regional development
banks – would be too large and could exhibit diseconomies of scale.
Second, it has proven to be very difficult to engineer minor adjustments
in the voting structure of the World Bank (and the IMF); it is hard to
believe that there is sufficient political appetite or collective will among
either Part I or Part II countries to push through a wholesale merger of the
World Bank and the regional development banks. Third, it is unclear if the
benefit–cost ratio of a merger would be worthwhile, but this will require
further empirical analysis. Fourth, some observers may argue that healthy
competition between the World Bank and ADB (and other regional
banks) actually improves the services of both.
There is, of course, a third way forward which is that the two institu-
tions will continue to “muddle through” under the current arrangement
while tinkering at the margins to sharpen specialization and reduce
overlap. This is the most likely scenario to unfold. Vested interests that
have accumulated behind the existing institutional configuration in the
developing regions and in the developed countries will almost certainly be
in favor of inertia. The current system, while imperfect, seems to satisfy
a variety of stakeholder interests and there appears little urgency among
the membership of either ADB or the World Bank to change the current
order. Moreover, performance assessments rate both institutions highly,
suggesting that both are providing value to their stakeholders, giving cre-
dence to the view that “if it isn’t broken, don’t fix it”. Within the broader
perspective of the global financial system, there is a more urgent priority
to focus attention on global financial stability and develop global financial
institutions that encourage sound financial management and apply effec-
tive measures to minimize contagion. Next to these daunting challenges,
The World Bank and the Asian Development Bank 213
the task of improving the multilateral development banking system, while
important, pales in comparison.
NOTES
1. The multilateral development bank system is composed of the World Bank, the multilat-
eral regional development banks, and the multilateral sub- regional development banks.
Multilateral sub- regional development banks include Corporación Andina de Fomento;
Caribbean Development Bank; Central American Bank for Economic Integration; East
African Development Bank and West African Development Bank. Multilateral financial
institutions include the European Commission and the European Investment Bank,
International Fund for Agricultural Development, the Islamic Development Bank,
the Nordic Development Fund, the Nordic Investment Bank, and the OPEC Fund for
International Development.
2. A significant amount of aid is composed of administrative costs of aid agencies, humani-
tarian and emergency relief, food aid, and technical cooperation, none of which is a
transfer of resources to recipient governments for development purposes.
3. Recent press reports noted that the PRC’s foreign aid had surpassed that of the World
Bank, but the PRC does not issue a definitive estimate of foreign aid and some PRC
“aid” projects, executed as turnkey investments by the PRC state enterprises, have char-
acteristics more akin to foreign direct investment.
4. I am grateful to Raymond Lu (Junior Fellow, Carnegie Endowment for International
Peace) for putting together some of the numbers for this graph. The data include all
Asian countries (East Asia, South Asia and Central Asia) and cover all commitments of
grants and loans by the two institutions. Lending to the Pacific island economies has not
been included.
5. Conducting fresh research for the purposes of this chapter was not possible, given time
constraints.
6. The World Bank Part I and Part II countries are defined at: http://web.worldbank.
org / WBSITE / EXTERNAL / EXTABOUTUS / EXTANNREP / EXTANNREP2K7/0,,co
ntentMDK:21508940 ~ menuPK:4245276 ~ pagePK:64168445 ~ piPK:64168309 ~ theSite
PK:4077916,00.html.
7. Some observers argue that Japan’s leadership of ADB is unquestioned because it is the
largest contributor to the Asian Development Fund. By this measure, the US leadership
of the World Bank should also be unquestioned as it is the largest contributor to IDA.
8. Non- excludability of a good or service implies that the property rights on them cannot
be enforced, such as fish in the sea; non- rivalrous implies that consumption of the good
or service does not diminish its availability to others (such as knowledge or clean air).
REFERENCES
Asian Development Bank (ADB). 1966. Agreement Establishing the Asian Development Bank. Available at: http://www.adb.org/Documents/Reports/Charter/charter.pdf#page=4.
Asian Development Bank. 2007. Country Assistance Performance Evaluation: The People’s Republic of China: Success Drives Demand for More Innovative and Responsive Services. Manila: ADB.
Asian Development Bank. Various issues. ADB Annual Report. Manila: ADB.Birdsall, N. and H. Kharas. 2010. Quality of Official Development Assistance.
214 New global economic architecture
Washington, DC: Brookings Institution and the Center for Global Development.
Casella, A. and B. Frey. 1992. Federalism and Clubs: Toward a Theory of Overlapping Jurisdictions. European Economic Review. 36: 639–46.
Department of International Development of the United Kingdom (DFID). 2011. Multilateral Aid Review. Available at: http://www.dfid.gov.uk/Documents/pub-lications1/mar/multilateral_aid_review.pdf.
Easterly, W. 2006. The White Man’s Burden: Why the West’s Efforts to Aid the Rest Have Done So Much Ill and So Little Good. New York: Penguin.
Easterly, W. and T. Pfutze. 2008. Where Does the Money Go? Best and Worst Practices in Foreign Aid. Journal of Economic Perspectives. 22(2): 29–52.
Kaja, A. and E. Werker. 2010. Corporate Governance at the World Bank and the Dilemma of Global Governance. The World Bank Economic Review. 24(2): 171–98.
Kawai, M. and P. Petri 2010. Asia’s Role in the International Financial Architecture. ADBI Working Paper 235. Tokyo: Asian Development Bank Institute.
Kharas, H. 2007. Trends and Issues in Development Aid. Wolfensohn Center for Development at the Brookings Institution. Working Paper No. 1.
Kharas, H. and W. Fengler. 2011. Delivering Aid Differently: Lessons from the Field. Economic Premise No. 49, Poverty Reduction and Economic Management Network. World Bank. February.
Knack, S., H. Rogers and N. Eubank. 2010. Aid Quality and Donor Rankings. World Bank Policy Research Working Paper 5290. May.
MOPAN. 2009. MOPAN Common Approach: World Bank 2009. Available at: http://www.mopanonline.org/upload/documents/World_Bank_Final_February_19_issued.pdf.
MOPAN. 2010. MOPAN Common Approach: Asian Development Bank 2010. Available at: http://www.mopanonline.org/upload/documents/ADB_Final- Vol- I_January_17_Issued1.pdf.
Moyo, D. 2009. Dead Aid: Why Aid Is Not Working and How There Is a Better Way for Africa. New York: Farrar, Straus and Giroux.
Overseas Development Institute. 2011. Climate Finance Fundamentals. The Evolving Global Climate Finance Architecture. London: Overseas Development Institute.
Ravallion, M. and A. Wagstaff. 2010. The World Bank’s Publication Record. World Bank Policy Research Working Paper No. 5374. July.
Roodman, D. 2006. An Index of Donor Performance. Center for Global Development Working Paper Number 67. Data set updated 2009.
United Nations. 2002. Recommendations of the High- level Panel on Financing for Development. Available at: http://www.un.org/esa/ffd/a55–1000.pdf.
World Bank. 2008. 2008 World Bank Group Global Poll. East Asia/Pacific: Full Results (data provided by Gallup Consulting).
World Bank. 2010. New World, New World Bank Group: Post- Crisis Directions. Paper prepared for the Development Committee of the World Bank. 20 April.
World Bank. 2011. Global Development Horizons 2011. Washington, DC: World Bank.
World Bank. Various issues. The World Bank Annual Report. Washington, DC: World Bank.
215
10. World Bank, Inter- American Development Bank, and subregional development banks in Latin America: dynamics of a system of multilateral development banks
Fernando Prada
10.1 INTRODUCTION
This chapter is a summary of the working hypothesis and main conclu-
sions of an ongoing research program at FORO Nacional Internacional.
The main objective of the program is to identify long- term trends and
dynamics of the system of international development finance (Bezanson
et al. 2005).
Among the actors that participate in this system, the multilateral devel-
opment banks (MDBs) are an innovative institutional model to channel
finance and knowledge to developing countries. They are international
financial intermediaries whose shareholders include both borrowing devel-
oping countries and non- borrowing donor countries. MDBs have three
functions: (i) to mobilize resources from private capital markets and from
official sources to make loans to developing countries on better- than-
market terms; (ii) to generate knowledge on and provide technical assist-
ance and advice for economic and social development; and (iii) to furnish
a range of complementary services, such as international public goods, to
developing countries and to the international development community
(Sagasti with the contribution of Prada 2002; Sagasti and Bezanson 2000).
MDBs operating in the Latin America and Caribbean (LAC) region
have formed a dense network of institutions, where competition and com-
plementation have been the main drivers of their evolution during the last
50 years. In a previous document (Sagasti and Prada 2006), we argued that
the LAC region has great potential for decentralization compared to other
216 New global economic architecture
regions because of the strength of its regional and subregional institutions.
Certain dynamics contribute to realizing this potential: (i) the interaction
between MDBs and other sources of development financing; (ii) the divi-
sion of labor between MDBs and their search for comparative advantages;
(iii) an improved financial situation and capacity to mobilize financial
resources; (iv) innovation in financial instruments and customization of
their interventions; and (v) patterns of allocating net income in concord-
ance with negotiations among stakeholders and institutional decisions.
This chapter focuses on the analysis of statistical data from MDBs
to describe these trends in the LAC region. In general we prioritize the
dynamics between the World Bank and the Inter- American Development
Bank (IDB), but recognize the growing importance of three subregional
institutions: the Andean Corporation of Finance (CAF); the Central
American Bank for Economic Integration (CABEI); and the Caribbean
Development Bank (CDB), as facilitators of South–South cooperation
and platforms for triangular cooperation (Prada et al. 2010). The chapter
is organized as follows:
● The first section presents the relative position of MDBs in the LAC
region regarding their financial role and how they offer a set of
instruments to channel resources and knowledge to countries in the
region.
● The next section analyzes the dynamics that are contributing to
deepening the process of decentralization, with three questions in
mind: (i) what are the main trends identified from observable varia-
bles? (ii) How have the most relevant institutional guidelines evolved
recently? (iii) What are the main areas for future research?
● The third section presents recommendations and conclusions about
MDBs in the LAC region, and how they can increase collaboration
and promote collective action.
10.2 THE RELATIVE POSITION OF MULTILATERAL DEVELOPMENT BANKS IN LATIN AMERICA AND THE CARIBBEAN
Financing development in the LAC region has radically changed in the
last forty years and, as Figure 10.1 suggests, the importance of official
flows has decreased relative to other sources of financing. First, net private
flows now represent more than 90 per cent of total financial flows. Despite
periods of upsurge of official flows in the wake of financial crises – the
debt crisis in the mid- 1980s, the United States rescue after the Mexican
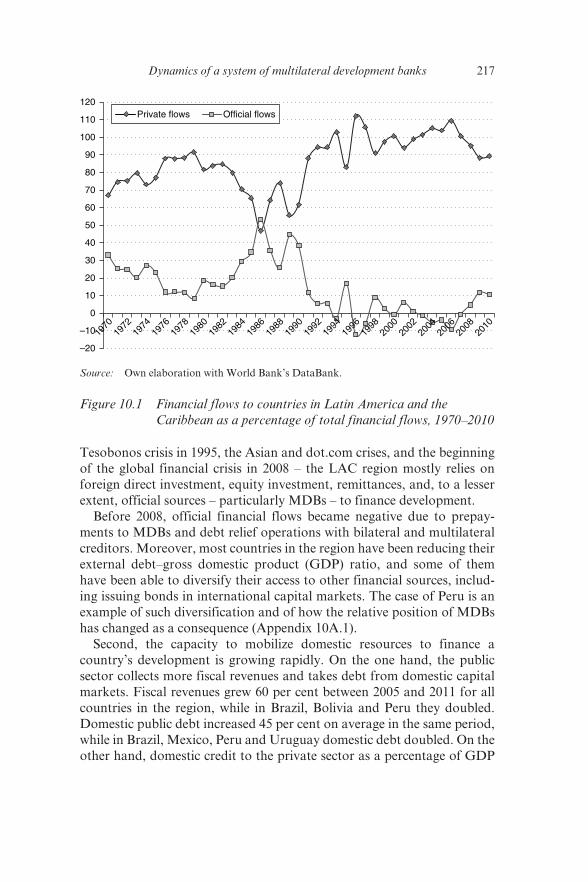
Dynamics of a system of multilateral development banks 217
Tesobonos crisis in 1995, the Asian and dot.com crises, and the beginning
of the global financial crisis in 2008 – the LAC region mostly relies on
foreign direct investment, equity investment, remittances, and, to a lesser
extent, official sources – particularly MDBs – to finance development.
Before 2008, official financial flows became negative due to prepay-
ments to MDBs and debt relief operations with bilateral and multilateral
creditors. Moreover, most countries in the region have been reducing their
external debt–gross domestic product (GDP) ratio, and some of them
have been able to diversify their access to other financial sources, includ-
ing issuing bonds in international capital markets. The case of Peru is an
example of such diversification and of how the relative position of MDBs
has changed as a consequence (Appendix 10A.1).
Second, the capacity to mobilize domestic resources to finance a
country’s development is growing rapidly. On the one hand, the public
sector collects more fiscal revenues and takes debt from domestic capital
markets. Fiscal revenues grew 60 per cent between 2005 and 2011 for all
countries in the region, while in Brazil, Bolivia and Peru they doubled.
Domestic public debt increased 45 per cent on average in the same period,
while in Brazil, Mexico, Peru and Uruguay domestic debt doubled. On the
other hand, domestic credit to the private sector as a percentage of GDP
–20
–10
0
10
20
30
40
50
60
70
80
90
100
110
120
1970
1972
1974
1976
1978
1980
1982
1984
1986
1988
1990
1992
1996
1998
2000
2002
2006
2008
2010
Official flowsPrivate flows
2004
1994
Source: Own elaboration with World Bank’s DataBank.
Figure 10.1 Financial flows to countries in Latin America and the
Caribbean as a percentage of total financial flows, 1970–2010
218 New global economic architecture
increased from 27 per cent in 2000 to 42 per cent in 2010, mainly due to a
40 per cent growth in domestic credit to the private sector in Brazil, Chile,
Colombia and Mexico between 2000 and 2010.
With more financial sources and domestic resources available, financial
flows from MDBs to LAC countries have declined. Net flows from the
World Bank and IDB became negative after 2003 (Figure 10.2a), partially
as a consequence of prepayments from countries such as Argentina, Brazil
and Mexico. This trend reversed after the global financial crisis as these
two banks increased their lending to the region. Although there is no
comparable data of net financial flows from all subregional development
banks (SRDBs), the CDB increased net flows to Caribbean countries from
US$50 million in 2007 to US$240 million in 2010, while IDB net flows to
the same countries grew seven times to US$700 million in the same period
(Figure 10.2b). The CAF has also increased its lending and thus contrib-
uted to the surge of MDB flows to the region after the global financial
crisis. As Figure 10.3 indicates, commitments to the region increased
during 2008 and 2009 as a consequence of the financial crisis, and then fell
slightly in 2010. Preliminary data for 2011 and the first quarter of 2012
suggest that commitments will be lower than 2008–09 levels.
A paradoxical situation emerges for the next 10 years regarding the
position of MDBs in financing development in the LAC region. On the
one hand, most LAC countries have been able to diversify their access to
financial sources. Moreover, financial needs have eased as the fiscal and
current account positions of most LAC countries have remained strong
throughout the global financial crisis. On the other hand, MDBs are
increasing their capacity to serve the region; most MDBs operating in the
region – the Central American Bank for Economic Integration (CABEI),
CAF, CDB and IDB – have increased their lending capacity, and the
World Bank board authorized capital increases in the five years to 2012.
This new capacity is not only about taking the precaution of having addi-
tional funding in case the international context worsens; we argue it is also
about real confidence in the region’s long- term prospects and the ability
of the MDBs to find niches to continue supporting the region through a
sustainable business model.1
The innovation capacity of MDBs and the growth prospects of the region
have the potential to generate a virtuous circle in the coming years in favor
of LAC countries. The global financial crisis only temporarily moderated
the trends regarding the relative position of the MDBs in the region, and,
as a consequence, several questions and debates that took place in a pre-
crisis context are back in 2012. The first group of questions relates to what
precisely to do with increased MDB lending capacity in relation to coun-
tries’ absorptive capacity and access to other financial sources; the second
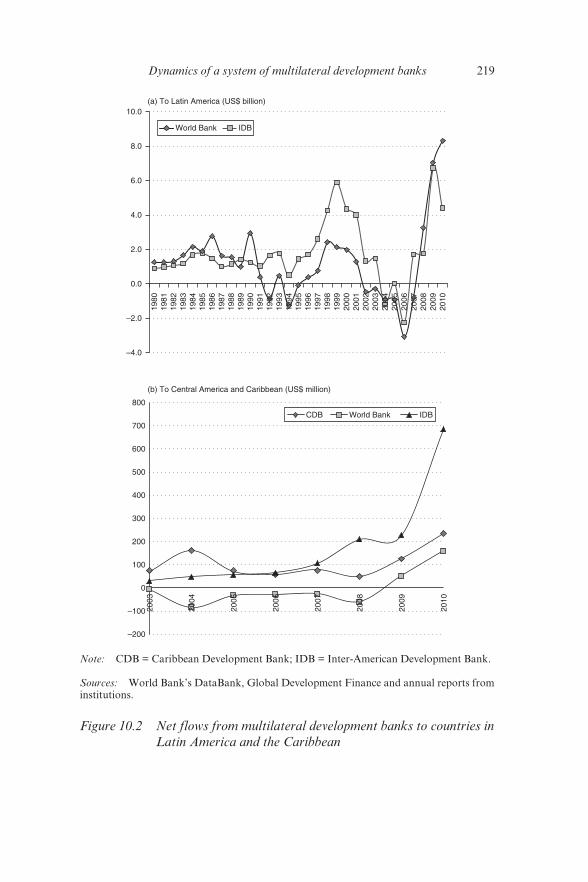
Dynamics of a system of multilateral development banks 219
IDBWorld Bank
(a) To Latin America (US$ billion)
–4.0
–2.0
0.0
2.0
4.0
6.0
8.0
10.0
1980
1981
1982
1983
1984
1985
1986
1987
1988
1989
1990
1991
1992
1993
1994
1995
1996
1997
1998
1999
2000
2001
2002
2003
2004
2005
2006
2007
2008
2009
2010
(b) To Central America and Caribbean (US$ million)
–200
–100
0
100
200
300
400
500
600
700
800
2003
2004
2005
2006
2007
2008
2009
2010
CDB World Bank IDB
Note: CDB = Caribbean Development Bank; IDB = Inter- American Development Bank.
Sources: World Bank’s DataBank, Global Development Finance and annual reports from
institutions.
Figure 10.2 Net flows from multilateral development banks to countries in
Latin America and the Caribbean
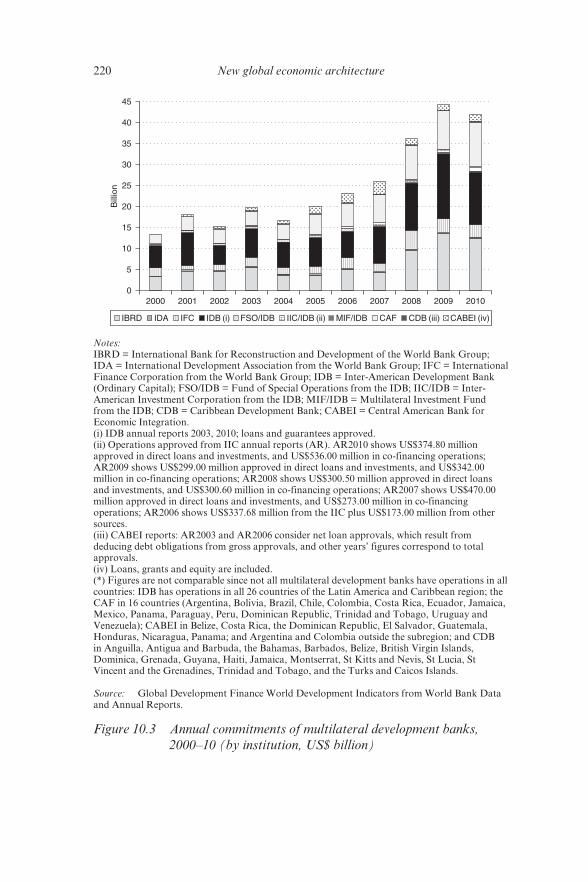
220 New global economic architecture
0
5
10
15
20
25
30
35
40
45
2000 2001 2002 2003 2004 2005 2006 2007 2008 2009 2010
Bill
ion
IBRD IDA IFC IDB (i) FSO/IDB IIC/IDB (ii) MIF/IDB CAF CDB (iii) CABEI (iv)
Notes:
IBRD = International Bank for Reconstruction and Development of the World Bank Group;
IDA = International Development Association from the World Bank Group; IFC = International
Finance Corporation from the World Bank Group; IDB = Inter- American Development Bank
(Ordinary Capital); FSO/IDB = Fund of Special Operations from the IDB; IIC/IDB = Inter-
American Investment Corporation from the IDB; MIF/IDB = Multilateral Investment Fund
from the IDB; CDB = Caribbean Development Bank; CABEI = Central American Bank for
Economic Integration.
(i) IDB annual reports 2003, 2010; loans and guarantees approved.
(ii) Operations approved from IIC annual reports (AR). AR2010 shows US$374.80 million
approved in direct loans and investments, and US$536.00 million in co- financing operations;
AR2009 shows US$299.00 million approved in direct loans and investments, and US$342.00
million in co- financing operations; AR2008 shows US$300.50 million approved in direct loans
and investments, and US$300.60 million in co- financing operations; AR2007 shows US$470.00
million approved in direct loans and investments, and US$273.00 million in co- financing
operations; AR2006 shows US$337.68 million from the IIC plus US$173.00 million from other
sources.
(iii) CABEI reports: AR2003 and AR2006 consider net loan approvals, which result from
deducing debt obligations from gross approvals, and other years’ figures correspond to total
approvals.
(iv) Loans, grants and equity are included.
(*) Figures are not comparable since not all multilateral development banks have operations in all
countries: IDB has operations in all 26 countries of the Latin America and Caribbean region; the
CAF in 16 countries (Argentina, Bolivia, Brazil, Chile, Colombia, Costa Rica, Ecuador, Jamaica,
Mexico, Panama, Paraguay, Peru, Dominican Republic, Trinidad and Tobago, Uruguay and
Venezuela); CABEI in Belize, Costa Rica, the Dominican Republic, El Salvador, Guatemala,
Honduras, Nicaragua, Panama; and Argentina and Colombia outside the subregion; and CDB
in Anguilla, Antigua and Barbuda, the Bahamas, Barbados, Belize, British Virgin Islands,
Dominica, Grenada, Guyana, Haiti, Jamaica, Montserrat, St Kitts and Nevis, St Lucia, St
Vincent and the Grenadines, Trinidad and Tobago, and the Turks and Caicos Islands.
Source: Global Development Finance World Development Indicators from World Bank Data
and Annual Reports.
Figure 10.3 Annual commitments of multilateral development banks,
2000–10 (by institution, US$ billion)
Dynamics of a system of multilateral development banks 221
group of questions relates to what is an adequate balance between the three
MDB functions for the region, and whether MDBs can offer financial and
non- financial services to perform these functions. Our response to both
questions is that having a decentralized and financially healthy network of
MDBs that compete and collaborate at different levels gives the region a
comparative advantage to deal with these issues.
The number of MDBs operating in the LAC region is higher than in
any other global region, and most of them have been operating there since
before 1980 (Figure 10.4). Along with the World Bank and IDB groups
of institutions, which are on a regional scale and serve all countries in the
region, there is a group of SRDBs and extra- regional MDBs that cover
only a limited number of countries. Combined, these institutions form an
MDB system that serves a variety of clients from the private and public
sector. All developing countries in the region, except Cuba, work in par-
allel with the World Bank, the IDB and at least one SRDB. This feature
gives the system competition at the country level: MDBs need to find com-
parative advantages and differentiation from other MDBs, other sources
of financing (e.g. domestic and international capital markets), and other
development institutions (e.g. bilateral donors, private foundations, and
social responsibility and non- government institutions).
This system of MDBs has been slowly consolidating in the LAC region,
while successful but isolated cases of collaboration and collective action
between MDBs are emerging and becoming more frequent. Nevertheless,
a description of such a system 10 years ago is still accurate:
far from functioning as an integrated system, it must be said that the MDBs cur-rently behave more like a dysfunctional family, primarily in the field. Relations between the World Bank and the regional development banks are strained in several regions and in many countries, while most sub- regional MDBs have little interaction with the World Bank. Differences in management styles, extent of field presence, relations with borrowers, technical competence, knowledge of the region and countries, among others, combine to create sources of tension that could and should be reduced by taking a more systemic approach to the operations of MDBs. (Sagasti and Bezanson 2000, p. 68)
As we indicate in the next section, the system of MDBs in the LAC
region has benefited from subregional dynamism and strength – a unique
feature of the LAC region compared to other regions. This generates
forces for competition, particularly at the country level, but at the same
time also generates opportunities for regional collaboration. On the one
hand, there are more and more cases of pool- funding and shared projects
between MDBs throughout the region (e.g., pool- funding for Haiti recon-
struction, where the IDB had a lead role in catalyzing additional financ-
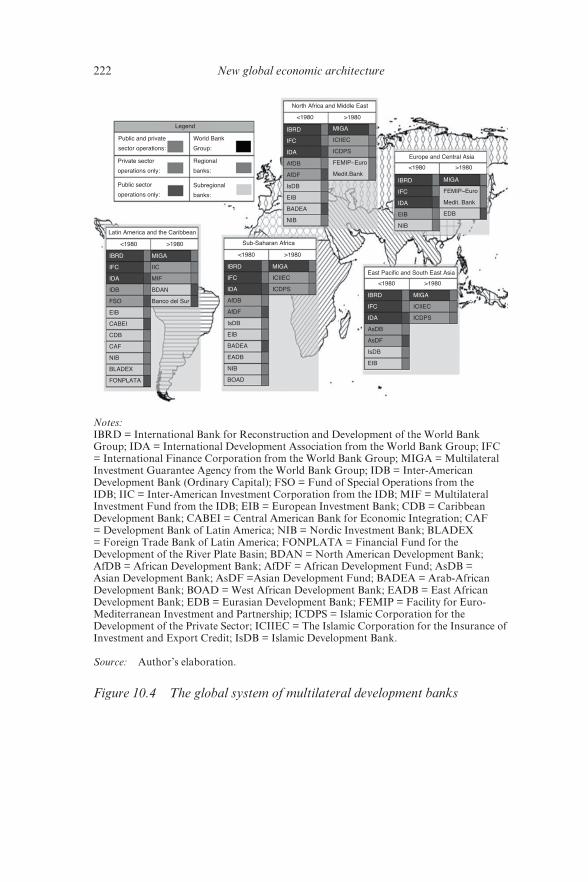
222 New global economic architecture
Latin America and the Caribbean
<1980
IBRD
IFC
IDA
IDB
FSO
EIB
CABEI
CDB
CAF
NIB
BLADEX
FONPLATA
MIGA
IIC
MIF
BDAN
Banco del Sur
North Africa and Middle East
Legend
Public and private
sector operations:
Public sector
operations only:
Private sector
operations only:
World Bank
Group:
Subregional
banks:
Regional
banks:
<1980
IBRD
IFC
IDA
AfDB
AfDF
IsDB
EIB
BADEA
NIB
MIGA
ICIIEC
ICDPS
FEMIP–Euro
Medit.Bank
>1980 Sub-Saharan Africa
East Pacific and South East Asia
Europe and Central Asia
<1980
IBRD
IFC
IDA
AfDB
AfDF
IsDB
EIB
BADEA
EADB
NIB
BOAD
IBRD
IFC
IDA
AsDB
AsDF
IsDB
EIB
IBRD
IFC
IDA
EIB
NIB
MIGA
ICIIEC
ICDPSMIGA
ICIIEC
ICDPS
MIGA
FEMIP–Euro
Medit. Bank
EDB
>1980
<1980
<1980
>1980
>1980
>1980
Notes:
IBRD = International Bank for Reconstruction and Development of the World Bank
Group; IDA = International Development Association from the World Bank Group; IFC
= International Finance Corporation from the World Bank Group; MIGA = Multilateral
Investment Guarantee Agency from the World Bank Group; IDB = Inter- American
Development Bank (Ordinary Capital); FSO = Fund of Special Operations from the
IDB; IIC = Inter- American Investment Corporation from the IDB; MIF = Multilateral
Investment Fund from the IDB; EIB = European Investment Bank; CDB = Caribbean
Development Bank; CABEI = Central American Bank for Economic Integration; CAF
= Development Bank of Latin America; NIB = Nordic Investment Bank; BLADEX
= Foreign Trade Bank of Latin America; FONPLATA = Financial Fund for the
Development of the River Plate Basin; BDAN = North American Development Bank;
AfDB = African Development Bank; AfDF = African Development Fund; AsDB =
Asian Development Bank; AsDF =Asian Development Fund; BADEA = Arab- African
Development Bank; BOAD = West African Development Bank; EADB = East African
Development Bank; EDB = Eurasian Development Bank; FEMIP = Facility for Euro-
Mediterranean Investment and Partnership; ICDPS = Islamic Corporation for the
Development of the Private Sector; ICIIEC = The Islamic Corporation for the Insurance of
Investment and Export Credit; IsDB = Islamic Development Bank.
Source: Author’s elaboration.
Figure 10.4 The global system of multilateral development banks
Dynamics of a system of multilateral development banks 223
ing from a large variety of development institutions). On the other hand,
the IDB has also taken a proactive approach to supporting development
banks at the subregional level. For example, it supported the CDB with
institutional credit of US$20 million in 1996 for capital strengthening,
and it has recently provided technical assistance to the Financial Fund
for the Development of the River Plate Basin (FONPLATA), which
has resumed its credits to the common market of the Southern South
American region (MERCOSUR). However, how countries benefit from
these dynamics of collaboration and competition between MDBs depends
on specific country cases.
Using a systemic approach, we indicate that the diversity of MDBs
is positive, given the diversity of countries in the region. The fact that
almost every country in the region is a middle- income country according
to World Bank categorization hides deep differences between them. We
have recently updated our index of capacity to mobilize external and
domestic resources (Figure 10.5), which is an alternative to income- based
rankings.2 Most LAC countries are well positioned among the top, but
some groups of countries can be distinguished: Argentina, Brazil and
Mexico (due to the size of their economies); Caribbean islands such as
Dominica; other South American countries; and Central America (except
Mexico).
MDBs in the LAC region are becoming more responsive to these
signals and are moving towards customizing their interventions on a
country- by- country basis, thus enforcing a client- oriented culture of
MDBs in the region. The World Bank’s updated strategy for the region
(World Bank 2011) is clustering different sets of interventions and serv-
ices to four groups of countries according to income and additional
dimensions such as the size of economy and particular vulnerabilities.
The IDB has made significant investments to decentralize operations
during its “realignment” process, and nowadays its country offices have
more responsibilities, resources and personnel. Having strong SRDBs
also allows for a degree of specialization and a diversity of approaches at
the country level.
A working hypothesis of our research program indicates a strong rela-
tionship between the capacity to mobilize domestic and external resources,
and the structure of sources of development financing that countries
choose. Our case study on Peru (Appendix 10A.1) presents evidence on
how the capacity to mobilize external resources has evolved, and how
the related financial structure of its capital account has changed over 40
years.3 Therefore, the position of MDBs relative to other financial sources
changes as countries increase their capacity to mobilize domestic and
external resources to finance development.
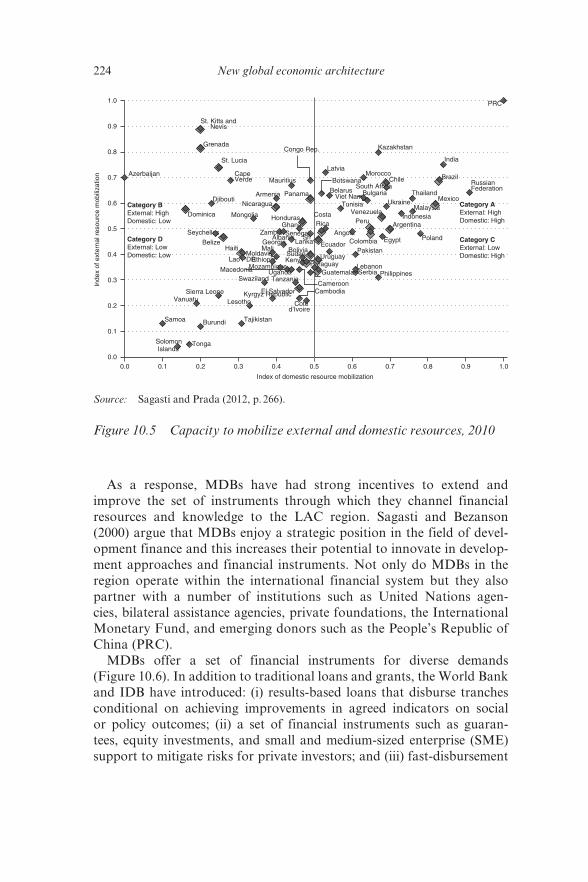
224 New global economic architecture
As a response, MDBs have had strong incentives to extend and
improve the set of instruments through which they channel financial
resources and knowledge to the LAC region. Sagasti and Bezanson
(2000) argue that MDBs enjoy a strategic position in the field of devel-
opment finance and this increases their potential to innovate in develop-
ment approaches and financial instruments. Not only do MDBs in the
region operate within the international financial system but they also
partner with a number of institutions such as United Nations agen-
cies, bilateral assistance agencies, private foundations, the International
Monetary Fund, and emerging donors such as the People’s Republic of
China (PRC).
MDBs offer a set of financial instruments for diverse demands
(Figure 10.6). In addition to traditional loans and grants, the World Bank
and IDB have introduced: (i) results- based loans that disburse tranches
conditional on achieving improvements in agreed indicators on social
or policy outcomes; (ii) a set of financial instruments such as guaran-
tees, equity investments, and small and medium- sized enterprise (SME)
support to mitigate risks for private investors; and (iii) fast- disbursement
0.0
0.1
0.2
0.3
0.4
0.5
0.6
0.7
0.8
0.9
1.0
0.0 0.1 0.2 0.3 0.4 0.5 0.6 0.7 0.8 0.9 1.0
Category BExternal: HighDomestic: Low
Category AExternal: HighDomestic: High
Category CExternal: LowDomestic: High
Category DExternal: LowDomestic: Low
PRC
Tonga Solomon Islands
Index of domestic resource mobilization
Inde
x of
ext
erna
l res
ourc
e m
obili
zatio
n
Serbia
Kazakhstan
India Latvia
Azerbaijan
Ethiopia
Morocco Cape Verde
Congo Rep.
Mauritius South Africa
Botswana RussianFederation Belarus
Armenia Bulgaria Thailand Viet Nam Djibouti Ukraine Tunisia Malaysia Indonesia Mongolia
Ghana
Kenya
Angola Senegal Zambia Poland
Seychelles Sri
Lanka Egypt Albania Georgia Mali Pakistan
Lao PDR Moldavia Sudan
Cameroon
Mozambique Lebanon Macedonia Uganda Philippines Swaziland Tanzania
Sierra Leone Cambodia Kyrgyz Republic Cote
d’Ivoire
Vanuatu Lesotho
Tajikistan Burundi Samoa
St. Kitts and Nevis
St. Lucia
Grenada
Brazil Chile
Panama Mexico
Nicaragua
Dominica VenezuelaHonduras
ArgentinaPeru
Colombia
Costa Rica
Belize Ecuador Haiti Bolivia Uruguay
Paraguay Guatemala
El Salvador
Source: Sagasti and Prada (2012, p. 266).
Figure 10.5 Capacity to mobilize external and domestic resources, 2010
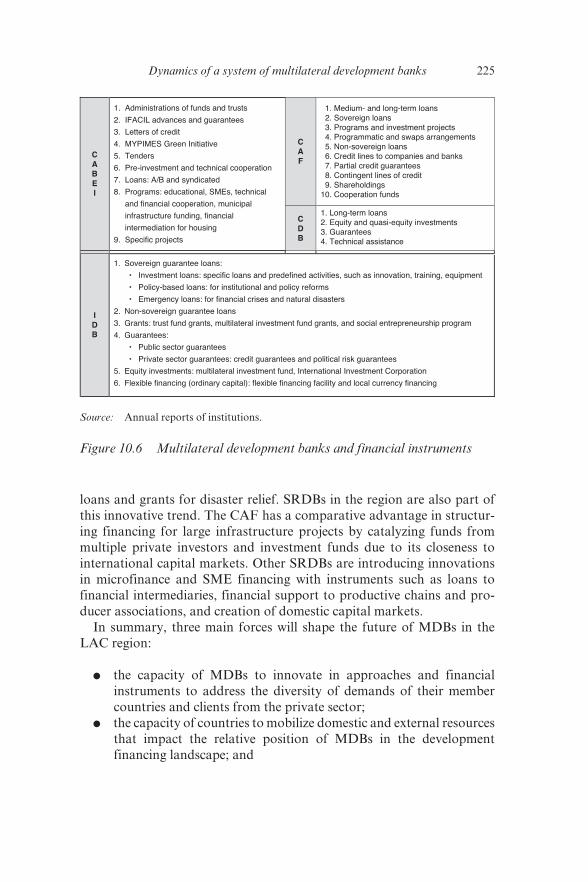
Dynamics of a system of multilateral development banks 225
loans and grants for disaster relief. SRDBs in the region are also part of
this innovative trend. The CAF has a comparative advantage in structur-
ing financing for large infrastructure projects by catalyzing funds from
multiple private investors and investment funds due to its closeness to
international capital markets. Other SRDBs are introducing innovations
in microfinance and SME financing with instruments such as loans to
financial intermediaries, financial support to productive chains and pro-
ducer associations, and creation of domestic capital markets.
In summary, three main forces will shape the future of MDBs in the
LAC region:
● the capacity of MDBs to innovate in approaches and financial
instruments to address the diversity of demands of their member
countries and clients from the private sector;
● the capacity of countries to mobilize domestic and external resources
that impact the relative position of MDBs in the development
financing landscape; and
CABEI
1. Administrations of funds and trusts
2. IFACIL advances and guarantees
3. Letters of credit
4. MYPIMES Green Initiative
5. Tenders
6. Pre-investment and technical cooperation
7. Loans: A/B and syndicated
8. Programs: educational, SMEs, technical
and financial cooperation, municipal
infrastructure funding, financial
intermediation for housing
9. Specific projects
CAF
1. Medium- and long-term loans 2. Sovereign loans 3. Programs and investment projects 4. Programmatic and swaps arrangements 5. Non-sovereign loans 6. Credit lines to companies and banks 7. Partial credit guarantees 8. Contingent lines of credit 9. Shareholdings10. Cooperation funds
CDB
1. Long-term loans2. Equity and quasi-equity investments3. Guarantees4. Technical assistance
IDB
1. Sovereign guarantee loans:
• Investment loans: specific loans and predefined activities, such as innovation, training, equipment
• Policy-based loans: for institutional and policy reforms
• Emergency loans: for financial crises and natural disasters
2. Non-sovereign guarantee loans
3. Grants: trust fund grants, multilateral investment fund grants, and social entrepreneurship program
4. Guarantees:
• Public sector guarantees
• Private sector guarantees: credit guarantees and political risk guarantees
5. Equity investments: multilateral investment fund, International Investment Corporation
6. Flexible financing (ordinary capital): flexible financing facility and local currency financing
Source: Annual reports of institutions.
Figure 10.6 Multilateral development banks and financial instruments
226 New global economic architecture
● the balance between competition and collaboration among MDBs
in their quest to find niches and their comparative advantages.
10.3 THE DYNAMICS OF MULTILATERAL DEVELOPMENT BANKS IN LATIN AMERICA AND THE CARIBBEAN
There are no common metrics to assess the level of decentralization of
the MDB system in each region. Our hypothesis is that an MDB system
is more decentralized as it shows more strength and dynamism at the
subregional level in dimensions that are comparable across institutions
and regions. We are analyzing three dimensions in this section: (i) divi-
sion of labor; (ii) financial strength and institutional capacity to provide
services at affordable costs for countries and clients; and (iii) managing
net income to address specific needs of member countries, clients and
stakeholders.
10.3.1 Division of Labor: Finding Niches and Comparative Advantages
To provide services to member countries, MDBs need to acquire specific
skills, make available financial and human resources, and establish insti-
tutional guidelines that connect their mission with their activities at the
country and regional level. Most of the studies about this issue, particularly
those describing the operations of the World Bank and regional develop-
ment banks, coincide in two ideas: (i) that the individual institutional
missions are very broad and have tended to increase over time, a feature
known as “mission creep”; and (ii) a significant part of MDB missions is
shared with other MDBs, which tend to work in parallel with little coor-
dination or harmonization of their procedures at a country and regional
level. If this diagnostic is entirely correct, then the prospects of a division
of labor based on comparative advantages among MDBs within a region
are unpromising.
This framework has been popular at describing the relationship between
Bretton Woods system institutions, such as the World Bank and the
International Monetary Fund, and other institutions such as the organiza-
tions of the United Nations system and, to a lesser extent, regional devel-
opment banks – SRDBs have been generally excluded from this debate.
Nevertheless, we argue that a country- level perspective on division of
labor provides a more accurate picture of the forces that drive competition
and collaboration between MDBs in the LAC region.
During the 2000s, MDB operations were more concentrated in sover-
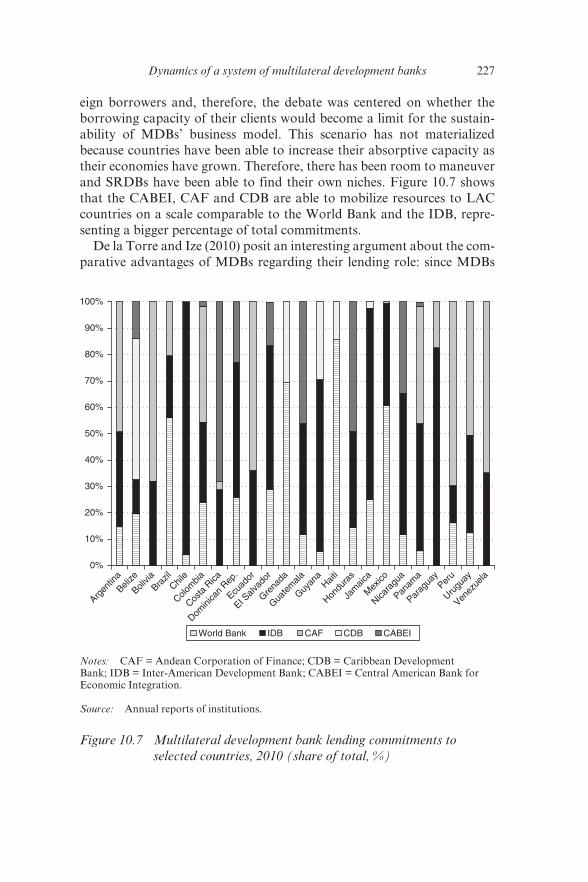
Dynamics of a system of multilateral development banks 227
eign borrowers and, therefore, the debate was centered on whether the
borrowing capacity of their clients would become a limit for the sustain-
ability of MDBs’ business model. This scenario has not materialized
because countries have been able to increase their absorptive capacity as
their economies have grown. Therefore, there has been room to maneuver
and SRDBs have been able to find their own niches. Figure 10.7 shows
that the CABEI, CAF and CDB are able to mobilize resources to LAC
countries on a scale comparable to the World Bank and the IDB, repre-
senting a bigger percentage of total commitments.
De la Torre and Ize (2010) posit an interesting argument about the com-
parative advantages of MDBs regarding their lending role: since MDBs
0%
10%
20%
30%
40%
50%
60%
70%
80%
90%
100%
World Bank IDB CAF CDB CABEI
Argen
tina
Belize
Bolivia
Brazil
Chile
Colom
bia
Costa
Rica
Domini
can
Rep.
Ecuad
or
EI Salv
ador
Grena
da
Guate
mala
Guyan
aHait
i
Hondu
ras
Jam
aica
Mex
ico
Nicara
gua
Panam
a
Parag
uay
Peru
Urugu
ay
Venez
uela
Notes: CAF = Andean Corporation of Finance; CDB = Caribbean Development
Bank; IDB = Inter- American Development Bank; CABEI = Central American Bank for
Economic Integration.
Source: Annual reports of institutions.
Figure 10.7 Multilateral development bank lending commitments to
selected countries, 2010 (share of total, %)
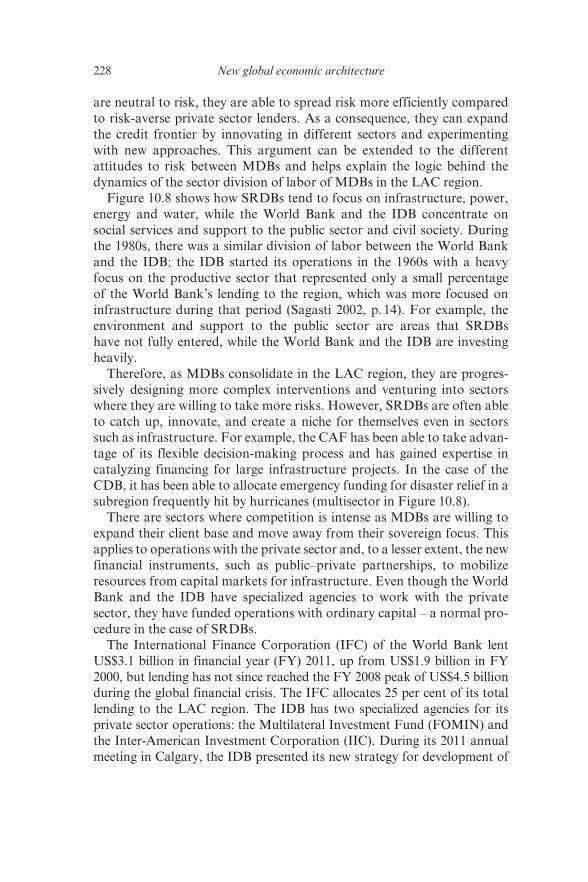
228 New global economic architecture
are neutral to risk, they are able to spread risk more efficiently compared
to risk- averse private sector lenders. As a consequence, they can expand
the credit frontier by innovating in different sectors and experimenting
with new approaches. This argument can be extended to the different
attitudes to risk between MDBs and helps explain the logic behind the
dynamics of the sector division of labor of MDBs in the LAC region.
Figure 10.8 shows how SRDBs tend to focus on infrastructure, power,
energy and water, while the World Bank and the IDB concentrate on
social services and support to the public sector and civil society. During
the 1980s, there was a similar division of labor between the World Bank
and the IDB: the IDB started its operations in the 1960s with a heavy
focus on the productive sector that represented only a small percentage
of the World Bank’s lending to the region, which was more focused on
infrastructure during that period (Sagasti 2002, p. 14). For example, the
environment and support to the public sector are areas that SRDBs
have not fully entered, while the World Bank and the IDB are investing
heavily.
Therefore, as MDBs consolidate in the LAC region, they are progres-
sively designing more complex interventions and venturing into sectors
where they are willing to take more risks. However, SRDBs are often able
to catch up, innovate, and create a niche for themselves even in sectors
such as infrastructure. For example, the CAF has been able to take advan-
tage of its flexible decision- making process and has gained expertise in
catalyzing financing for large infrastructure projects. In the case of the
CDB, it has been able to allocate emergency funding for disaster relief in a
subregion frequently hit by hurricanes (multisector in Figure 10.8).
There are sectors where competition is intense as MDBs are willing to
expand their client base and move away from their sovereign focus. This
applies to operations with the private sector and, to a lesser extent, the new
financial instruments, such as public–private partnerships, to mobilize
resources from capital markets for infrastructure. Even though the World
Bank and the IDB have specialized agencies to work with the private
sector, they have funded operations with ordinary capital – a normal pro-
cedure in the case of SRDBs.
The International Finance Corporation (IFC) of the World Bank lent
US$3.1 billion in financial year (FY) 2011, up from US$1.9 billion in FY
2000, but lending has not since reached the FY 2008 peak of US$4.5 billion
during the global financial crisis. The IFC allocates 25 per cent of its total
lending to the LAC region. The IDB has two specialized agencies for its
private sector operations: the Multilateral Investment Fund (FOMIN) and
the Inter- American Investment Corporation (IIC). During its 2011 annual
meeting in Calgary, the IDB presented its new strategy for development of
Dynamics of a system of multilateral development banks 229
0%
10%
20%
30%
40%
50%
60%
70%
80%
90%
100%
World Bank IDB CAF CDB CABEI
Infrastructure
Power, energy and water
Multi-sector and other
Public sector and civil society
Productive sectors
Education, health and social services
Financing and business
Environment
Notes:
CAF = Development Bank of Latin America; CDB = Caribbean Development Bank; IDB =
Inter- American Development Bank; CABEI = Central American Bank for Economic Integration.
(i) Classification for World Bank and IDB are based on CRS sectors: transport and storage and
communications are Infrastructure; agriculture, forestry, fishing, industry, mineral resources
and mining, trade policies and regulations, and tourism are Productive Sector; water supply
and sanitation and energy are Power, Energy and Water; education, health and population
policies and programs, and reproductive health are Education, Health and Social Services; other
multisector, reconstruction relief and rehabilitation, and disaster prevention and preparedness
are Multisector and Other; banking and financial services, and business and other services are
Financing and Business; and government and civil society – general and conflict, peace, and
security are Public Sector and Civil Society.
(ii) CAF: Agricultural infrastructure and transport, storage and communications are Infrastructure;
mining and quarrying and manufacturing are Productive Sector; development institutions and
other are Multisector and Other; and commercial banking is Financing and Business.
(iii) CDB: Transportation and communication are Infrastructure; agriculture, forestry, fishing,
manufacturing and tourism are Productive Sectors; social and personal services are Education,
Health and Social Services; and financial is Financing and Business.
(iv) CABEI: Infrastructure, municipal infrastructure, transport, storage, communications and
hotels are Infrastructure; trade, manufacturing, agriculture, ranching, fishing, hunting and
forestry, oil and gas, and productive sectors are Productive Sector; education, social services, and
health are Education, Health and Social Services; computing, other services, regional body and
multisector are Multisector and Other; real estate and financial intermediation are Financing and
Business; and public administration is Public Sector and Civil Society.
World Bank, IDB, FSO/IDB and CABEI amounts are commitments; CAF are loan portfolios;
and CDB are net loans, secondary mortgages, equity, and grants approved.
Source: Credit Reporting System (Organisation for Economic Co- operation and Development
(OECD)) and annual reports.
Figure 10.8 Division of labor by sector, 2000–10 (share of total, %)
230 New global economic architecture
the private sector, with the aim of streamlining its operations. The strategy
includes several programs to develop capital markets in less- developed coun-
tries, increase funding to SMEs, promote financial inclusion, finance “bottom
of the pyramid” initiatives, support microfinance and micro- insurance insti-
tutions, and help companies transition to a lower- carbon mode of produc-
tion. The IDB allocated US$2.9 billion to the private sector in 2011, the IIC
allocated US$465.0 million, and FOMIN allocated US$108.0 million.
SRDBs are also innovating and competing in these areas and comple-
menting the operations of other MDBs. The CAF has been very active
and is currently providing support to multilatinas,4 providing capital to
companies to initiate operations in other countries, and acquiring equi-
ties from companies to finance their expansion. In 2010, the support to
private sector operations was US$2.8 billion, representing 20 per cent
of the IDB’s total allocations. CABEI has been focusing on supporting
the private sector in Central America and promoting private investment,
and this now represents 25 per cent of its annual commitments (US$300
million). The CDB has a small Private Sector Development Division (5 per
cent of total commitments), which has been directed to support the devel-
opment of mortgage markets and loans to institutions to provide student
financing.
There is a strong case for collaboration between MDBs in specific areas.
First, their research on development issues is becoming an important
source of reference, but duplication of efforts in some areas should give
rise to more collaborative efforts, peer- reviewed studies, and joint publica-
tions and evaluations. Second, although there is only anecdotal evidence,
regional epistemic communities are emerging as a consequence of knowl-
edge exchange. Each MDB is making efforts to create capacities in the
public sector and support managers and consultants in organizing seminars
to exchange information and provide technical cooperation. Harmonizing
approaches and coordinating areas of support could increase the capacities
of public officers through a more efficient use of resources. Third, MDBs
are part of a financial innovation that is still strong, but the changes in the
international system of financing development are posing several threats
to their operations: they could be carrying out several exercises to think
together about their future and their position regarding topics such as
regional development, support to the private sector, and their countercycli-
cal role.
There are other relevant topics regarding division of labor that are
starting to become part of the debates about the future of MDBs. There
is anecdotal evidence that some countries have been able to take leader-
ship of their relationship with donors (Wood et al. 2011) and effectively
manage their negotiations with MDBs. However, this information has
Dynamics of a system of multilateral development banks 231
been poorly systematized, but it could provide interesting insights into
patterns of countries managing their relationship with MDBs and assess
how client- oriented the regional MDBs are. It is frequently claimed by
MDBs in the LAC region that competition from other international
financial institutions creates an environment conducive to a more client-
oriented behavior from these institutions; but again, this claim is only sup-
ported by anecdotal evidence and not by analytical studies.
Another area of research relates to epistemic communities that MDB
contributions are consolidating through technical assistance support. The
communities are important because they have contributed to generating
strong consensus in public policies in certain areas such as macroeco-
nomic management, and could be crucial in improving the skills of public
officers. Understanding this dynamic could provide insight into how to
improve the role of generating and providing knowledge to countries
through technical assistance.
A third area of research is the role of MDBs as platforms for regional
integration and international cooperation, particularly the case of South–
South cooperation and triangular cooperation. MDBs in the LAC region
are unclear about their specific role in this area, and are engaging in a
series of reflections on these topics. MDBs have advantages in channeling
cooperation between developing countries because of their networks and
presence in countries, and can contribute to advancing the agenda of the
Paris Declaration on Aid Effectiveness by helping new donors to design
and implement cooperation programs.
10.3.2 Delicate Balances: Financial Strength, Low- cost Lending and
Services, and Development Effectiveness
MDBs have been building a strong financial position, and years of respon-
sible management are reflected in their financial statements. Table 10.1
presents the risk- bearing capital ratios (RBCR)5 of MDBs and the World
Bank in the LAC region, and three trends emerge that point to a healthy
dynamism at the subregional level.
First, the IDB and SRDBs have expanded their net outstanding loans
to the region, but those of the SRDBs have grown at a faster pace. While
IDB net loans to the region grew 42 per cent between 2002 and 2010, net
loans from SRDBs grew steadily and more than doubled: the CAF’s loans
expanded by 145 per cent, CDB’s by 115 per cent, and CABEI’s by 108
per cent. The IDB experienced a slowdown after 2003, and its net loans to
the region only recovered after the global financial crisis. Second, retained
earnings have followed a similar trend: they are growing for all MDBs in
the region, but those of SRDBs are growing at a faster pace.
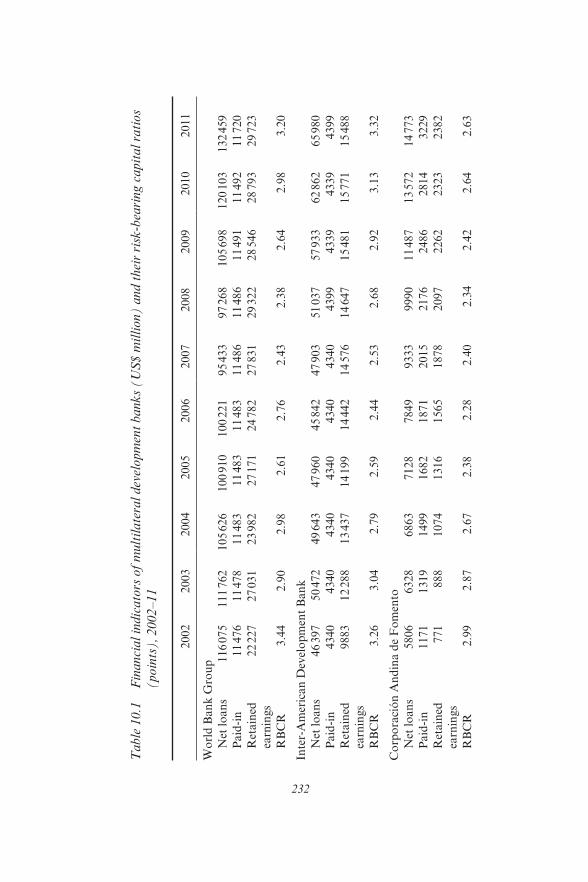
232
Table
10.1
F
inanci
al
indic
ato
rs o
f m
ult
ilate
ral
dev
elopm
ent
bank
s (U
S$ m
illi
on) a
nd t
hei
r ri
sk- b
eari
ng c
apit
al
rati
os
(poin
ts),
2002–11
2002
2003
2004
2005
2006
2007
2008
2009
2010
2011
Wo
rld
Ban
k G
rou
p
N
et l
oa
ns
116 0
75
111 7
62
105 6
26
100 9
10
100 2
21
95 4
33
97 2
68
105 6
98
120 1
03
132 4
59
P
aid
- in
11 4
76
11 4
78
11 4
83
11 4
83
11 4
83
11 4
86
11 4
86
11 4
91
11 4
92
11 7
20
R
etain
ed
earn
ings
22 2
27
27 0
31
23 9
82
27 1
71
24 7
82
27 8
31
29 3
22
28 5
46
28 7
93
29 7
23
R
BC
R3.4
42.9
02.9
82.6
12.7
62.4
32.3
82.6
42.9
83.2
0
Inte
r- A
mer
ican
Dev
elo
pm
ent
Ban
k
N
et l
oan
s46 3
97
50 4
72
49 6
43
47 9
60
45 8
42
47 9
03
51 0
37
57 9
33
62 8
62
65 9
80
P
aid
- in
4340
4340
4340
4340
4340
4340
4399
4339
4339
4399
R
etain
ed
earn
ing
s
9883
12 2
88
13 4
37
14 1
99
14 4
42
14 5
76
14 6
47
15 4
81
15 7
71
15 4
88
R
BC
R3.2
63.0
42.7
92.5
92.4
42.5
32.6
82.9
23.1
33.3
2
Co
rpo
raci
ón
An
din
a d
e F
om
ento
N
et l
oa
ns
5806
6328
6863
7128
7849
9333
9990
11 4
87
13 5
72
14 7
73
P
aid
- in
1171
1319
1499
1682
1871
2015
2176
2486
2814
3229
R
etain
ed
earn
ings
771
888
1074
1316
1565
1878
2097
2262
2323
2382
R
BC
R2.9
92.8
72.6
72.3
82.2
82.4
02.3
42.4
22.6
42.6
3
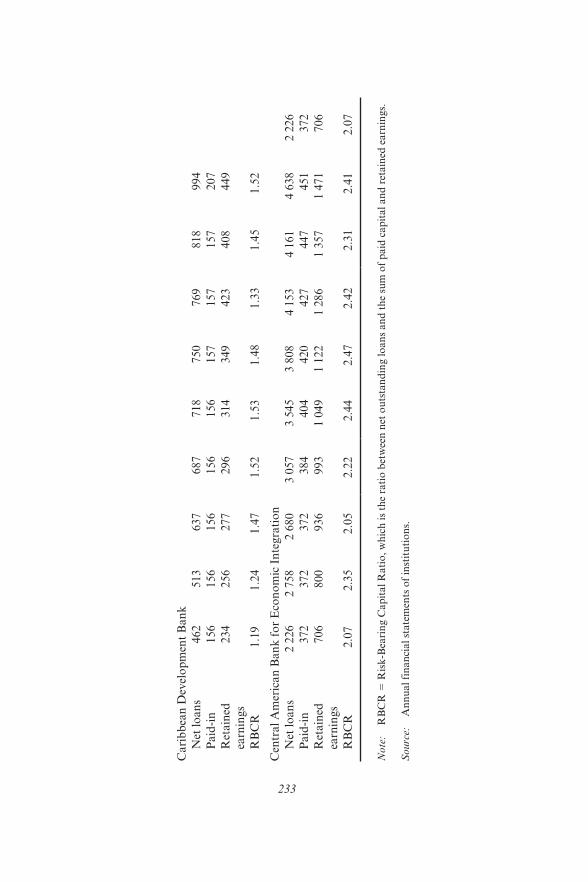
233
Cari
bb
ean
Dev
elo
pm
ent
Ban
k
N
et l
oan
s462
513
637
687
718
750
769
818
994
P
aid
- in
156
156
156
156
156
157
157
157
207
R
etain
ed
earn
ings
234
256
277
296
314
349
423
408
449
R
BC
R1.1
91.2
41.4
71.5
21.5
31.4
81.3
31.4
51.5
2
Cen
tral
Am
eric
an
Ban
k f
or
Eco
no
mic
In
tegra
tio
n
N
et l
oan
s2 2
26
2 7
58
2 6
80
3 0
57
3 5
45
3 8
08
4 1
53
4 1
61
4 6
38
2 2
26
P
aid
- in
372
372
372
384
404
420
427
447
451
372
R
etain
ed
earn
ings
706
800
936
993
1 0
49
1 1
22
1 2
86
1 3
57
1 4
71
706
R
BC
R2.0
72.3
52.0
52.2
22.4
42.4
72.4
22.3
12.4
12.0
7
Note
: R
BC
R 5
Ris
k- B
eari
ng C
ap
ital
Rati
o,
wh
ich
is
the
rati
o b
etw
een
net
ou
tsta
nd
ing l
oan
s an
d t
he
sum
of
paid
cap
ital
an
d r
etain
ed e
arn
ings.
Sourc
e:
An
nu
al
fin
an
cial
state
men
ts o
f in
stit
uti
on
s.
234 New global economic architecture
Third, the RBCR indicates that there is enough room for MDBs to
increase their lending without compromising the strength of their financial
ratios. A high RBCR indicates high leverage, and a low RBCR indicates
additional room to increase lending compared to levels of operating
capital. This ratio has followed a common pattern: RBCRs reached a
peak around 2002 for most MDBs and have not since regained that level,
even though MDBs increased lending due to the global financial crisis.
The CAF, for example, has been increasing leverage and rapidly catching
up to levels of the World Bank and the IDB. It is worth noting that com-
mercial lending institutions normally have RBCR levels of 5–10, which is
an indication of the prudential lending standards of MDBs.
Financial strength and prudential lending standards are key charac-
teristics of the MDBs’ model. Because of a combination of comfortable
financial levels in MDBs and a higher capacity to mobilize resources in
LAC countries, there is an opportunity to take more risks and experiment
and innovate with new approaches. An extra opportunity is presented by
historically low interest rates, and central banks such as the US Federal
Reserve have indicated their willingness to maintain rates at these levels as
the economies need additional support.
Figure 10.9 shows average lending rates of the World Bank and the
IDB during 2003–11. The global financial crisis caused a structural
change in the price of London interbank offered rate (LIBOR)- based
instruments for both banks, which have been stable at around 1 per cent
since 2008. In parallel, sovereign spreads (the difference between the
interest rate of sovereign bonds and US Treasury bonds) have returned
to pre- crisis levels, as has the Emerging Market Bond Index (EMBI+).
Although they are not strictly comparable, margins between the lending
interest rates of MDBs and the average cost of financing from interna-
tional capital markets have returned to pre- crisis levels. As was the case
before the financial crisis, some countries see no comparative advan-
tage in MDB lending interest rates because they have cheaper options.
Therefore this feature is also driving competition between MDBs and is
providing MDBs with incentives to enter into more complex operations
and expand their client base. SRDBs are experiencing similar pressures,
but more data is needed.
Interest rates from other financial sources and MDBs were converging
before the global financial crisis and most banks adjusted their internal
costs so they could offer lower prices to their clients, for example they have
adjusted front- end fees and lending spreads (Figure 10.9b shows these
changes for the IDB). Nevertheless, this is not a sustainable strategy in the
long term because development interventions tend to increase in cost as they
become more complex. For example, the World Bank performs periodic
Dynamics of a system of multilateral development banks 235
analysis of its internal costs of lending instruments, and there is evidence
that supervision costs for investment loans have increased over the years.6
Although there is no data to compare administrative costs between
MDBs, it is safe to affirm that administrative costs are higher as operations
become more complex and competition between institutions increases. For
example, decentralizing operations at the IDB after the process of realign-
ment has implied an important reallocation of personnel and, thus, higher
administrative costs, at least in the short term. But these investments are
crucial to improve operations. The challenge is whether smaller MDBs
are able to follow this trend. The CAF has been able to mobilize resources
from extra- regional partners such as the PRC and Brazil, and it is heavily
investing in creating capacities for research in development topics and new
approaches, attracting talent and decentralizing offices.
A similar argument for collaboration can be made in the case of the
focus on development effectiveness that most MDBs are implementing.
Having an impact on development indicators requires more complex
operations, a stronger focus on evaluation and monitoring, enhanced
institutional skills to measure internal operations, and trained person-
nel to carry out these tasks. It is clear that this focus relates to higher
administrative costs and, so far, only the World Bank and the IDB have
actively engaged in implementing these reforms (IDB 2012). Therefore,
increasing collaboration and utilizing cost- sharing schemes of MDBs in
this area, particularly at the country level, may contribute to reducing
costs of implementing operations with a stronger focus on development
effectiveness.
Some areas with strong potential for cost sharing to advance in the area of
development effectiveness are: (i) discussing a common framework to assess
development effectiveness at the country and institutional level to ensure
adequate benchmarking; (ii) engaging SRDBs in furthering the develop-
ment effectiveness agenda, such as agreeing on common country operation
frameworks under the leadership of borrowing countries; (iii) investing
resources in guaranteeing the “evaluability” of development projects; and
(iv) promoting knowledge and discussions to disseminate evidence- based
interventions that can be later implemented by several MDBs in their
respective subregions. The IDB and the World Bank are already implement-
ing periodic reviews of their development effectiveness role with adequate
resources and broad analysis of their operations. SRDBs need to catch up
and other banks can collaborate efficiently to achieve this aim.
Some areas of research emerge regarding the delicate balance that
MDBs need to find between financial strength, innovation capacity to
provide services at competitive costs, and their impact on development.
First, there is almost no work on comparing unitary costs of providing
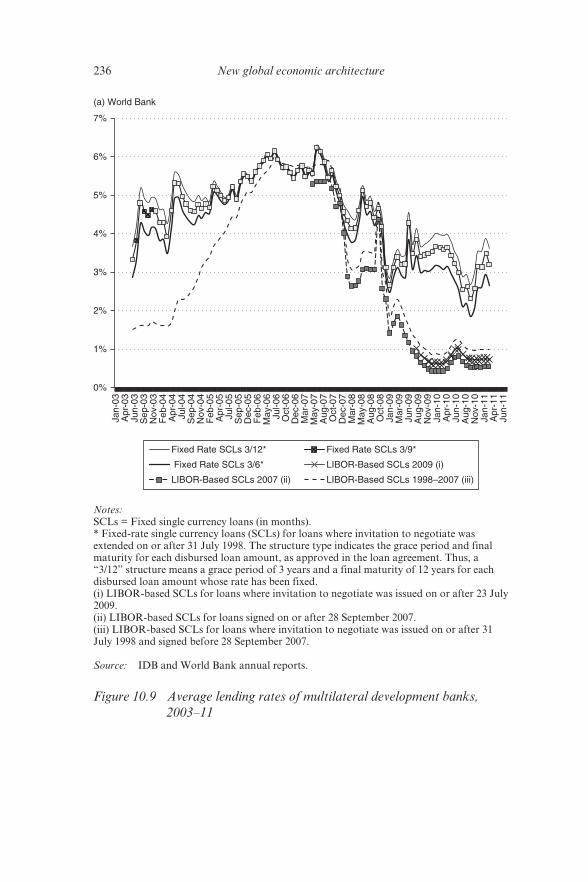
236 New global economic architecture
(a) World Bank
0%
1%
2%
3%
4%
5%
6%
7%Ja
n-03
Apr
-03
Jun-
03S
ep-0
3N
ov-0
3F
eb-0
4A
pr-0
4Ju
l-04
Sep
-04
Nov
-04
Feb
-05
Apr
-05
Jul-0
5S
ep-0
5D
ec-0
5F
eb-0
6M
ay-0
6Ju
l-06
Oct
-06
Dec
-06
Mar
-07
May
-07
Aug
-07
Oct
-07
Dec
-07
Mar
-08
May
-08
Aug
-08
Oct
-08
Jan-
09M
ar-0
9Ju
n-09
Aug
-09
Nov
-09
Jan-
10A
pr-1
0Ju
n-10
Aug
-10
Nov
-10
Jan-
11A
pr-1
1Ju
n-11
Fixed Rate SCLs 3/12*
Fixed Rate SCLs 3/6*
LIBOR-Based SCLs 2007 (ii)
Fixed Rate SCLs 3/9*
LIBOR-Based SCLs 2009 (i)
LIBOR-Based SCLs 1998–2007 (iii)
Notes:
SCLs = Fixed single currency loans (in months).
* Fixed- rate single currency loans (SCLs) for loans where invitation to negotiate was
extended on or after 31 July 1998. The structure type indicates the grace period and final
maturity for each disbursed loan amount, as approved in the loan agreement. Thus, a
“3/12” structure means a grace period of 3 years and a final maturity of 12 years for each
disbursed loan amount whose rate has been fixed.
(i) LIBOR- based SCLs for loans where invitation to negotiate was issued on or after 23 July
2009.
(ii) LIBOR- based SCLs for loans signed on or after 28 September 2007.
(iii) LIBOR- based SCLs for loans where invitation to negotiate was issued on or after 31
July 1998 and signed before 28 September 2007.
Source: IDB and World Bank annual reports.
Figure 10.9 Average lending rates of multilateral development banks,
2003–11
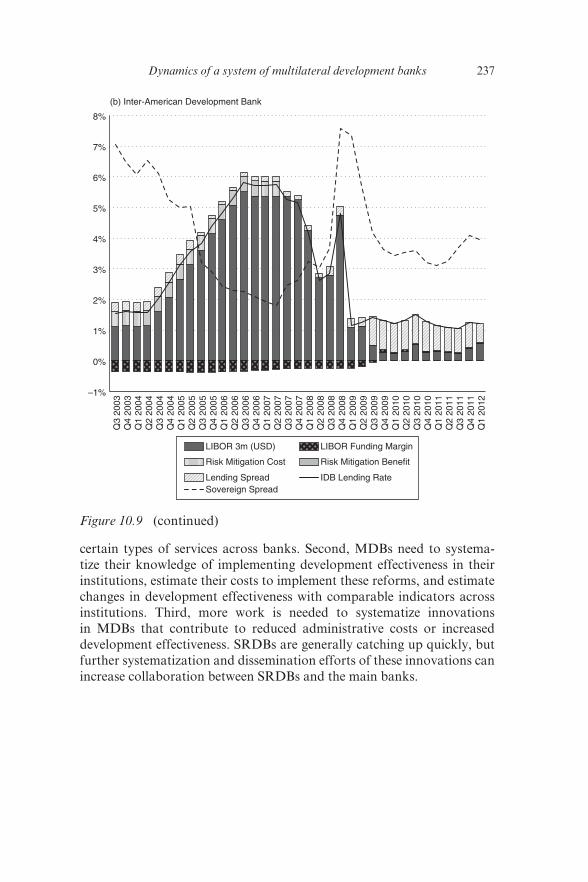
Dynamics of a system of multilateral development banks 237
certain types of services across banks. Second, MDBs need to systema-
tize their knowledge of implementing development effectiveness in their
institutions, estimate their costs to implement these reforms, and estimate
changes in development effectiveness with comparable indicators across
institutions. Third, more work is needed to systematize innovations
in MDBs that contribute to reduced administrative costs or increased
development effectiveness. SRDBs are generally catching up quickly, but
further systematization and dissemination efforts of these innovations can
increase collaboration between SRDBs and the main banks.
(b) Inter-American Development Bank
–1%
0%
1%
2%
3%
4%
5%
6%
7%
8%Q
3 20
03Q
4 20
03Q
1 20
04Q
2 20
04Q
3 20
04Q
4 20
04Q
1 20
05Q
2 20
05Q
3 20
05Q
4 20
05Q
1 20
06Q
2 20
06Q
3 20
06Q
4 20
06Q
1 20
07Q
2 20
07Q
3 20
07Q
4 20
07Q
1 20
08Q
2 20
08Q
3 20
08Q
4 20
08Q
1 20
09Q
2 20
09Q
3 20
09Q
4 20
09Q
1 20
10Q
2 20
10Q
3 20
10Q
4 20
10Q
1 20
11Q
2 20
11Q
3 20
11Q
4 20
11Q
1 20
12
LIBOR Funding Margin
Risk Mitigation Benefit
IDB Lending Rate
LIBOR 3m (USD)
Risk Mitigation Cost
Lending SpreadSovereign Spread
Figure 10.9 (continued)
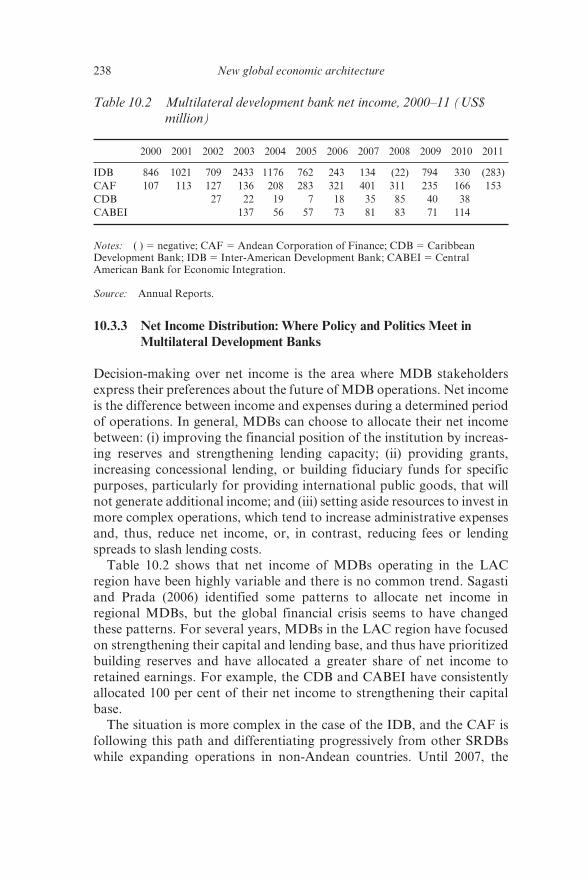
238 New global economic architecture
10.3.3 Net Income Distribution: Where Policy and Politics Meet in
Multilateral Development Banks
Decision- making over net income is the area where MDB stakeholders
express their preferences about the future of MDB operations. Net income
is the difference between income and expenses during a determined period
of operations. In general, MDBs can choose to allocate their net income
between: (i) improving the financial position of the institution by increas-
ing reserves and strengthening lending capacity; (ii) providing grants,
increasing concessional lending, or building fiduciary funds for specific
purposes, particularly for providing international public goods, that will
not generate additional income; and (iii) setting aside resources to invest in
more complex operations, which tend to increase administrative expenses
and, thus, reduce net income, or, in contrast, reducing fees or lending
spreads to slash lending costs.
Table 10.2 shows that net income of MDBs operating in the LAC
region have been highly variable and there is no common trend. Sagasti
and Prada (2006) identified some patterns to allocate net income in
regional MDBs, but the global financial crisis seems to have changed
these patterns. For several years, MDBs in the LAC region have focused
on strengthening their capital and lending base, and thus have prioritized
building reserves and have allocated a greater share of net income to
retained earnings. For example, the CDB and CABEI have consistently
allocated 100 per cent of their net income to strengthening their capital
base.
The situation is more complex in the case of the IDB, and the CAF is
following this path and differentiating progressively from other SRDBs
while expanding operations in non- Andean countries. Until 2007, the
Table 10.2 Multilateral development bank net income, 2000–11 (US$
million)
2000 2001 2002 2003 2004 2005 2006 2007 2008 2009 2010 2011
IDB 846 1021 709 2433 1176 762 243 134 (22) 794 330 (283)
CAF 107 113 127 136 208 283 321 401 311 235 166 153
CDB 27 22 19 7 18 35 85 40 38
CABEI 137 56 57 73 81 83 71 114
Notes: ( ) 5 negative; CAF 5 Andean Corporation of Finance; CDB 5 Caribbean
Development Bank; IDB 5 Inter- American Development Bank; CABEI 5 Central
American Bank for Economic Integration.
Source: Annual Reports.
Dynamics of a system of multilateral development banks 239
IDB was allocating a significant part of its net income to retained
earnings and a small percentage to increase resources of the Fund for
Special Operations, the IDB’s concessional lending window. This has
radically changed as a consequence of two related events: the creation
of the IDB Grant Facility in 2007; and the beginning of the IDB- 9
negotiation process in 2009, the ninth capital replenishment that seeks
to increase the IDB’s capital by 70 per cent when the process finishes by
2015.
As part of the IDB- 9 negotiation processes, the IDB board of gover-
nors has pledged a US$200 million per year allocation from the IDB’s
net income to strengthen the capital base of the Grant Facility until 2021.
Currently, only Haiti is receiving funding from this facility, but any other
poor country in the region under conditions of stress and vulnerability
can apply for funding through this window. Moreover, following the
catastrophic earthquake in Haiti in 2010, the IDB has mobilized extra
resources from its net income: it provided full debt relief to Haiti and made
a provision of US$484 million for this purpose.
For the IDB, these changes are an important sign of shifting roles and
changing balances between the three functions of MDBs. With additional
resources after the conclusion of IDB- 9, the IDB will have extra room to
expand lending without affecting its financial position. The IDB is now
investing resources to increase its capacity to provide grants to coun-
tries under financial stress, and has chosen not to strengthen its conces-
sional window. This extra capacity will add to several funds and special
programs under IDB administration on behalf of member countries for
specific purposes related to the production of international public goods
such as research, technical cooperation, pre- investment and triangular
cooperation.7
The CAF is also finding a balance between strengthening its financial
position, making its operations more complex, and increasing resources to
provide international public goods. The CAF’s Constitutive Agreement
requires that at least 10 per cent of net income should be allocated to
increase reserves, but it tended to allocate slightly more before the global
financial crisis. However, the CAF has been allocating almost half of
its net income to special programs and funds for technical cooperation,
research initiatives and the provision of grants. For example, in 2011
almost US$100 million was allocated for this from 2010 net income (55 per
cent of total net income); in 2010 it allocated US$105 million of 2009 net
income (45 per cent of total net income); and in 2009 it allocated US$70
million of 2008 net income (40 per cent of total net income).
Another area where politics and decision- making intersect is the deci-
sion to include non- regional partners in MDB operations. This can
240 New global economic architecture
provide additional financial resources and new approaches, but can
slightly alter the balance of power inside institutions. For example, the
PRC, which joined the IDB as a member country in 2009, has pledged
through its Eximbank a US$1 billion joint program to promote invest-
ment in the LAC region, but has committed 30 per cent of this to create
a fund to combat violence in the region. The PRC is already a member
country in SRDBs such as CABEI and CDB (Table 10.2), but it is also
working closely with the CAF through the Chinese Development Bank
and other PRC institutions to provide syndicated loans and support
investment in the LAC region. Both institutions have launched research
programs and joint initiatives to work more closely with the PRC, as this
country is becoming the main trading partner of several LAC countries.
Nevertheless, a growing influence of such an important player may add an
extra layer of complexity to MDBs’ affairs in the future.
The patterns of net income allocation contribute to understanding
future directions that MDBs are willing to take. While the IDB (and the
CAF to a lesser extent) is setting aside resources for more complex opera-
tions from its net income, other SRDBs are building their financial capac-
ity to focus on their financial role. The IDB is taking the lead in the region
to make resources available to countries in financial distress. It is thus
creating precautionary funding options, such as the IDB Grant Facility,
and working with multi- donor funds such as the Haiti Reconstruction
Fund and others for specific purposes, such as FOMIN, as well as techni-
cal cooperation funds under its administration. As the CAF is expanding
its original subregional focus and has started to provide financing to other
countries such as Argentina, Brazil, Costa Rica, Panama and Uruguay, it
is also investing heavily in creating additional capacity to work with new
clients and more countries.
10.4 CONCLUSIONS
Dynamism and strength at the regional and subregional levels suggest
that MDBs are part of a decentralized system in the LAC region. We have
gathered several indicators about their interactions with other MDBs and
other financial and development institutions, their relative position in the
development financing landscape, and how they benefit from their com-
parative advantages such as different willingness and capacities to take
risks. The evidence suggests that MDBs are actively looking for niches and
competing with each other for relevance, financing and influence, particu-
larly at the country level.
Most countries in the LAC region are benefiting from the competition
Dynamics of a system of multilateral development banks 241
between these institutions for two reasons. First, most of these countries
have been growing (despite the global financial crisis), have improved
their access to financial sources, and have comfortable room to maneuver
in case the international context worsens. Secondly, they benefit from
better services and customized interventions from MDBs, as well as addi-
tional insurance in case of a sudden reduction in financial flows due to a
more complicated international situation. Therefore, there is a window of
opportunity in the next 10 years to devote important resources to innovate
in development approaches, scale- up investment to create institutional
capacities in LAC countries, and improve the provision of regional public
goods. MDBs have a crucial role to play in providing knowledge and
mobilizing finance.
MDBs have traditionally prioritized their financial role and have built
strong reserves to operate in the LAC region, and now there are strong
signals that MDBs are investing in new approaches, increasing grant
resources, decentralizing, and scaling- up their operations. But financial
resources are scarce in the long term, and a rethink is required of how
to allocate the additional resources that are a product of the current
economic growth cycle. Here, a systemic approach could be important:
MDBs should think together on how to find a balance between the three
functions (providing that each MDB has space for specialization) and to
benefit from their own comparative advantages.
There is enough anecdotal and systematized evidence about how dys-
functional the MDB system in the LAC region can be. For each example
of collaboration between these institutions, there are several examples on
how they duplicate efforts, engage in costly and ineffective interventions,
and support initiatives and projects with politics in mind instead of apply-
ing an adequate project evaluation, among other valid concerns.
By taking a look at long- term dynamics and identifying patterns in
available data about MDBs, we conclude that there is more room for
collaboration between these institutions than the conventional wisdom
suggests. One reason for this is that they are facing similar threats in the
current international context and, thus, have incentives to find common
ideas to maintain their relevance in the future. Another reason is that
MDBs are important sources and promoters of knowledge and innova-
tion in development thinking and ideas for intervention, and they are
generating frequent (and poorly recognized) collaborations between their
staff, between public officers in developing countries, and with the aca-
demic community. There are significant gains in having a dense network
of MDBs that promote knowledge, provide technical cooperation, and
f unction as platforms for collaboration.
242 New global economic architecture
NOTES
1. MDBs have been rethinking their relative position in the region, and most conclude that
the current starting point offers great potential. For example, see Moreno (2012), CAF
(2010) and World Bank (2011, 2012) on how these institutions have reassessed actions
and strategies to support the region.
2. See Sagasti and Prada (2012, p. 266 and Appendix 2) for details of the index calculation.
3. Appendix 10A.1 presents partial results since we have only considered Peru’s capital
account data, that is, related only to its capacity to mobilize external resources. It is
clear though that the Peruvian public sector in the 2010s relies more on domestic capital
markets and public revenues to finance public investment, while before 1980 it relied on
MDBs or syndicated loans from private banks (later converted into Paris Club debt).
4. This term refers to the main transnational companies from LAC countries.
5. The RBCR is the ratio between net outstanding loans and the sum of paid- in capital and
retained earnings. It is an index to measure the leverage capacity of financial institutions.
6. World Bank (2009, p. 31) indicates that “between FY04 and FY09, expenditure on
supervision of the IBRD portfolio increased at around 3.6 per cent a year, effectively
flat in real terms; supervision costs for the IDA [International Development Association]
portfolio increased by 9.2% a year over the same period. The net effect was to increase
total supervision costs by $51.0 million”.
7. For more details, see http://www.iadb.org/aboutus/trustfunds/fundsearch.cfm.
REFERENCES
Bezanson, K., F. Sagasti and F. Prada. 2005. The Future of the Financing for Development System: Challenges, Scenarios and Strategic Choices. Oxford: Palgrave.
De la Torre, A. and A. Ize. 2010. El papel crediticio de la banca de desarrollo en la post- crisis. Presentation at the Conference La Banca de desarrollo y el entorno internacional in Mexico City on 12 June 2010 organized by the World Bank – LAC office.
Development Bank of Latin America (CAF). 2010. Visión para América Latina 2040: Hacia una sociedad más incluyente y próspera. Panama: CAF.
Inter- American Development Bank (IDB). 2012. Marco de resultados del Banco para 2012–2015. Annex 2 in: IDB. 2012. Panorama de la efectividad 2011. Washington, DC.
Ministry of Economy and Finance of Peru. 2012. Statistics National Government Debt and Guarantees. Available at: http://www.mef.gob.pe/.
Moreno, L.A. 2012. La década de América Latina y el Caribe: Una oportunidad real. 2nd edn. Washington, DC: IDB.
Prada, F., U. Casabonne and K. Bezanson. 2010. Development resources beyond the current reach of the Paris Declaration. Copenhagen: Danish Institute of International Studies. Available at: www.oecd.org/dataoecd/1/14/46486829.pdf.
Sagasti, F. and K. Bezanson. 2000. A Foresight and Policy Study of the Multilateral Development Banks. Stockholm: Ministry for Foreign Affairs of Sweden.
Sagasti, F. with the contribution of F. Prada. 2002. La Banca Multilateral de Desarrollo. Santiago de Chile: CEPALC, Serie Financiamiento del Desarrollo No. 119.
Dynamics of a system of multilateral development banks 243
Sagasti, F. and F. Prada. 2006. Regional development banks: A comparative per-spective. In J.A. Ocampo (ed.). Regional Financial Cooperation. Washington, DC: Brookings Institution Press and the Economic Commission for Latin America and the Caribbean (ECLAC).
Sagasti, F. and F. Prada. 2012. The new face of development cooperation: The role of south–south cooperation and corporate social responsibility. In J.A. Alonso and J.A. Ocampo (eds). Development Cooperation in Times of Crisis. New York: Columbia University Press, pp. 250–315.
Wood, B. et al. 2011. The evaluation of the Paris Declaration Phase 2 – Final Report. Copenhagen: Danish Institute for International Studies.
World Bank. 2009. Moving ahead on investment lending reform: Risk framework and implementation support. Washington, DC: World Bank.
World Bank. 2011. Regional Strategy Update 2011: Latin America and the Caribbean region. Washington, DC: World Bank.
World Bank. 2012. Latin America copes with volatility: The dark side of globaliza-tion. Washington, DC: World Bank.
ADDITIONAL DATA SOURCES
Caribbean Development Bank (CDB). Annual Reports 2003–2010. Available at: http://www.caribank.org/.
Central American Bank for Economic Integration (CABEI). Annual Reports 2002–2010. Available at: http://www.bcie.org/uploaded/content/category/827774422.pdf and http://www.cabei.org/english/publicaciones/memorias_09.php.
Central American Bank for Economic Integration (CABEI). Products and Services. Available at: http://www.bcie.org/?cat=8&title=Product%20and%20Services&lang=en (accessed: April 2012).
Credit Report System (CRS) – Organisation for Economic Co- operation and Development (OECD) StatExtracts. Available at: http://stats.oecd.org/Index.aspx?datasetcode=CRS1 (accessed: May 2012).
Development Bank of Latin America (CAF). Annual Reports 1990 and 2001–2011. Available at: http://publicaciones.caf.com/corporativo?page=0.
Development Bank of Latin America (CAF). Products and Services. Available at: http://www.caf.com/view/index.asp?ms=19&pageMs=61974 (accessed: April 2012).
Global Development Finance (GDF). World Bank Data Catalog. Available at: http://data.worldbank.org/data- catalog (accessed: April 2012).
Inter- American Development Bank (IDB). Annual Reports 2000–2011. Available at: http://www.iadb.org/en/about- us/annual- reports,6293.html.
Inter- American Development Bank (IDB). Financing Solutions. Available at: http://www.iadb.org/en/idb- finance/english/financing- solutions,1978.html (accessed: April 2012).
Inter- American Development Bank (IDB). Interest Rates and Charges. Available at: http://www.iadb.org/en/idb- finance/interest- rates- and- loan- charges,2331.html (accessed: April 2012).
Inter- American Investment Corporation (IIC) Annual Reports 2000–2010. Available at: http://www.iic.org/en/promotion/2011- annual- report.
International Finance Corporation (IFC) Annual Reports 2001–2011.
244 New global economic architecture
Available at: http://www1.ifc.org/wps/wcm/connect/CORP_EXT_Content/IFC_External_Corporate_Site/Annual+Report.
Ministry of Economy and Finance of Peru. 2012. Statistics National Government Debt and Guarantees: External Debt (Historical Series for 1970–2011 Funding Source and debt stock, disbursements and bond placements for 2000–2011). Available at: http://www.mef.gob.pe/index.php?option=com_content&view=article&id=273&Itemid=101338&lang=es (accessed: April–May 2012).
Superintendencia Nacional de Aduanas y de Administración Tributaria (SUNAT). 2012. Estadística y Estudios, Cuadro No.1: Ingresos del Gobierno Central Consolidado, 1998–2012 (Millones de nuevos soles). Available at: http://www.sunat.gob.pe/estadisticasestudios/.
World Bank Annual Reports 2000–2011. Available at: http://web.worldbank.org/ WBSITE/EXTERNAL/EXTABOUTUS/EXTANNREP/0,,menuPK:1397243~ pagePK:64168427~piPK:64168435~theSitePK:1397226,00.html.
World Bank Treasury. IBRD Lending Rates and Loan Charges. Available at:http://treasury.worldbank.org/bdm/htm/ibrd.html (accessed: April 2012).
Dynamics of a system of multilateral development banks 245
APPENDIX 10A.1 EXTERNAL FINANCIAL FLOWS TO THE GOVERNMENT OF PERU BY FERNANDO ROMERO1
Figure 10A.1 describes the evolution of net transfers to the government of
Peru from external creditors: new loans minus payments of interest and
principal of previous loans during the same period. The main trends can
be summarized as follows:
● Annual average net transfers were positive by US$420 million
during the 1970s and by US$150 million during the 1980s.
Bilateral debt from Paris Club and non- Paris Club members and
from other creditors (such as export credits, commercial banks
and credit from suppliers) maintained positive net transfers with
Peru during the 1970s. After the 1980s debt crisis, the financial
structure changes as debt from multilateral development banks
(MDBs) and Paris Club members increased to cope with the short-
age of foreign currency.
● Net transfers became negative during the 1990s to an annual average
of –US$670 million, and yet more negative and variable between
2000 and 2011: in 2007 they reached –US$3.7 billion due to large
payments to Paris Club creditors and MDBs. The 2000s also coin-
cided with sustained growth of fiscal revenues and a reduction of
the debt–gross domestic product (GDP) ratio to 25 per cent in 2011
from 45 per cent in 2000. Central government tax revenue went
from US$6.6 billion in 2000 to US$28.0 billion in 2011. Overall,
this implies a structural reduction of external financial needs of the
public budget.
The Peruvian debt profile has improved as a consequence and more
financial options opened during the 2000s. New loans reached an
average maturity of 13.4 years in 2010, while bonds reached 17.4 years.
Moreover, almost 80 per cent of total public debt has fixed interest
rates. This diversification of financial sources has allowed for better debt
management: in 2010 almost half of new disbursements were utilized to
prepay Paris Club and MDB debt. This debt replaces old and expensive
debt with new debt arising from issuing global bonds in international
capital markets; Peru has been issuing bonds at an average of US$1.5
billion per year during 2000–11. Meanwhile, Peru now relies more on
domestic debt (a great percentage denominated in local currency), which
currently represents almost half of the total liabilities of the central
government.
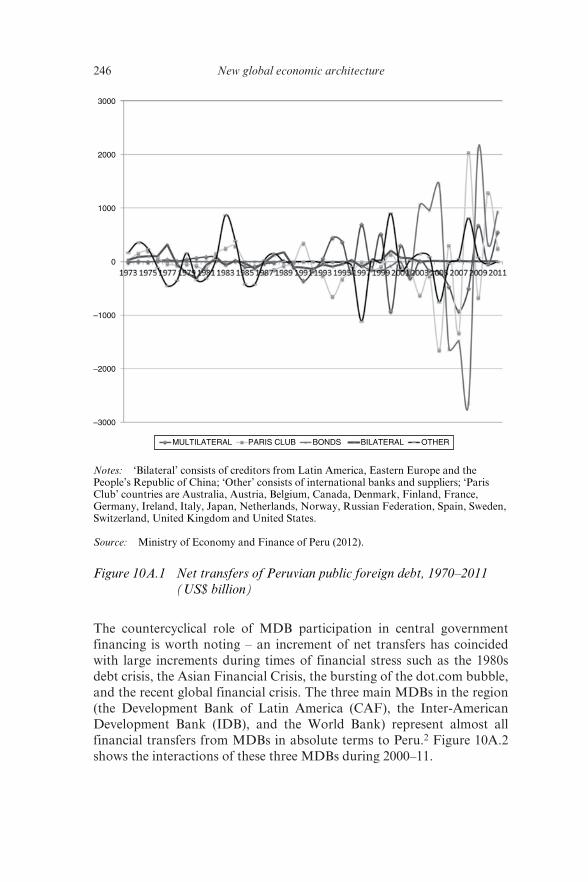
246 New global economic architecture
The countercyclical role of MDB participation in central government
financing is worth noting – an increment of net transfers has coincided
with large increments during times of financial stress such as the 1980s
debt crisis, the Asian Financial Crisis, the bursting of the dot.com bubble,
and the recent global financial crisis. The three main MDBs in the region
(the Development Bank of Latin America (CAF), the Inter- American
Development Bank (IDB), and the World Bank) represent almost all
financial transfers from MDBs in absolute terms to Peru.2 Figure 10A.2
shows the interactions of these three MDBs during 2000–11.
–3000
MULTILATERAL OTHERBILATERALBONDSPARIS CLUB
–2000
–1000
0
1000
2000
3000
Notes: ‘Bilateral’ consists of creditors from Latin America, Eastern Europe and the
People’s Republic of China; ‘Other’ consists of international banks and suppliers; ‘Paris
Club’ countries are Australia, Austria, Belgium, Canada, Denmark, Finland, France,
Germany, Ireland, Italy, Japan, Netherlands, Norway, Russian Federation, Spain, Sweden,
Switzerland, United Kingdom and United States.
Source: Ministry of Economy and Finance of Peru (2012).
Figure 10A.1 Net transfers of Peruvian public foreign debt, 1970–2011
(US$ billion)
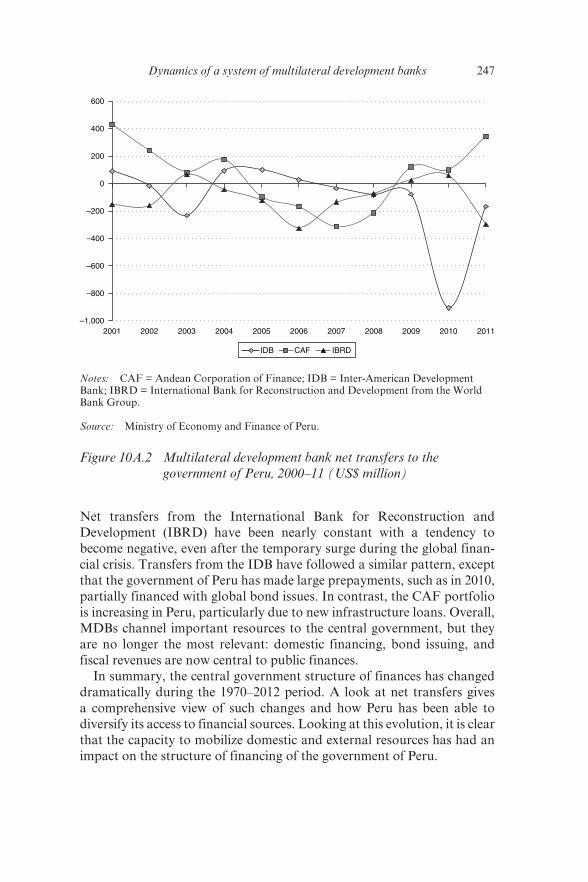
Dynamics of a system of multilateral development banks 247
Net transfers from the International Bank for Reconstruction and
Development (IBRD) have been nearly constant with a tendency to
become negative, even after the temporary surge during the global finan-
cial crisis. Transfers from the IDB have followed a similar pattern, except
that the government of Peru has made large prepayments, such as in 2010,
partially financed with global bond issues. In contrast, the CAF portfolio
is increasing in Peru, particularly due to new infrastructure loans. Overall,
MDBs channel important resources to the central government, but they
are no longer the most relevant: domestic financing, bond issuing, and
fiscal revenues are now central to public finances.
In summary, the central government structure of finances has changed
dramatically during the 1970–2012 period. A look at net transfers gives
a comprehensive view of such changes and how Peru has been able to
diversify its access to financial sources. Looking at this evolution, it is clear
that the capacity to mobilize domestic and external resources has had an
impact on the structure of financing of the government of Peru.
–1,000
–800
–600
–400
–200
0
200
400
600
2001 2002 2003 2004 2005 2006 2007 2008 2009 2010 2011
IBRDIDB CAF
Notes: CAF = Andean Corporation of Finance; IDB = Inter- American Development
Bank; IBRD = International Bank for Reconstruction and Development from the World
Bank Group.
Source: Ministry of Economy and Finance of Peru.
Figure 10A.2 Multilateral development bank net transfers to the
government of Peru, 2000–11 (US$ million)
248 New global economic architecture
Notes
1. Researcher of the Financing for Development program at FORO Nacional Internacional.
2. The European Investment Bank, International Fund for Agriculture Development,
Nordic Investment Bank, and Organization of the Petroleum Exporting Countries rep-
resent less than 1 per cent of these transfers and thus have been excluded.
249
Index
African Development Bank 197African Union (AU) 17, 29, 48
members of 45aid architecture 9–10, 197, 200–201,
206–7bilateral aid 199–200development support 209–10multilateral aid 199–200
sources of 200official development assistance
(ODA) flows 200–201Andean Corporation of Finance/
Corporacion Andina de Fomento (CAF) 10, 216, 234, 238
Constitutive Agreement 239financing provided for large
infrastructure projects 225lending capacity of 218mobilization of resources by 227–8,
235net flows from 218support for multilatinas 230
Argentina 218, 223, 240Armitage, Richard 41ASEAN+3 Macroeconomic Research
Office (AMRO) 4, 22, 56, 61, 77–9, 81, 89–90, 93, 98, 106, 108, 131, 137–8, 141
establishment of (2011) 21, 55, 58, 80–81, 83, 89, 113
Executive Committee (EC) 90offices of 60proposals for introduction of
Regional Monetary Unit 107Regional Economic Monitoring
(AREM) reports of 77, 80
regional surveillance activity of 56, 58, 71–2, 77–9, 90, 106, 142
reports of 5
ASEAN+3 Regional Economic Monitoring (AREM)
reports 60ASEAN–Australia–New Zealand FTA
(AANZFTA)provisions of 153
Ash, Timothy Garton 28Asia-Europe Meeting (ASEM) 130Asia-Pacific Economic Cooperation
(APEC) 130, 190Blake Island Summit (1993) 184–5,
191economic and technical cooperation
(ECOTECH) agenda 161members of 188Summit 15supporters of 184–5Yokohama Summit (2010) 189
Asian Bond Markets Initiative (ABMI) 5–6, 211
Asian Development Bank (ADB) 8–9, 13, 49, 56–7, 80–81, 107, 157–8, 197–8, 201–2, 205–9
Annual Meeting 90Asia Regional Integration Center
database 149authorized capital of 203coordination with World Bank
202–4establishment of (1966) 201members of 202potential development of 207–12support for ERPD 130
Asian Development Bank Institute (ADBI) 157–8
Asian Financial Crisis (AFC) (1997–98) 1, 5–6, 16, 21, 28, 106, 202, 217
IMF response to 66, 85, 109, 133, 209
political impact of 11, 14, 22–4, 32, 42, 66, 83–4, 108, 186
250 New global economic architecture
Asian Financial Stability Board (AFSB) 19, 24
members of 139proposals for 23
Asian Financial Stability Dialogue (AFSD) 139, 141
potential uses of 139proposals for creation of 6, 142–3
Asian Monetary Fund (AMF) 24, 105proposals for creation of 6, 22, 138,
186Association of Southeast Asian
Nations (ASEAN) 4, 6, 17, 21, 29, 32, 42, 48–9, 83, 87, 103, 113–14, 131–2, 134, 136, 142, 164–5, 182–3
+3 Economic Review and Policy Dialogue (ERPD) 87, 106, 130, 136, 138
establishment of (1999) 112support from ADB 130
+3 Finance Ministers’ Process 87, 89
+3 Finance Ministers and Central Bank Governors’ Meeting (AFMGM+3) 57–8, 90–92, 134
Meeting (2012) 57+3 Finance Ministers’ Meeting
(AFMM+3) 57, 85, 90–91, 107, 130
ASEAN Surveillance Process establishment of (1998) 130
Capital Markets Forum (ACMF) 132–3
Central Bank Forum 130Comprehensive Investment
Agreement 161Economic Community (AEC) 6,
112, 114, 131, 136, 142, 161, 182–3, 209, 211
Framework Agreement on Services (AFAS) 132
Free Trade Area (AFTA) (1992) 172FTAs of 22, 156, 163investment activity
FDI activity in 72, 74intra-investment activity of 72,
75members of 85, 104, 112, 133, 163,
188
+3 member economies/states 55–6, 58, 60–61, 65, 71–2, 77–81, 100, 105, 107, 109, 114–15, 121, 130–31, 137–8, 142, 182, 188
+6 member economies/states 121–2, 136, 162
CLMV 103–4, 136East Asian summit (ASEAN+8)
172personnel of 43–4Senior Finance Officials’ Meeting
130Summit (2010) 43Swap Arrangement (ASA) 83–5, 108
expansion of 85shortcomings of 84
Australia 6, 23, 28, 31, 37, 85, 105–6, 108, 134, 138, 162, 188
Brisbane 3economy of 105FTAs used by 163
Austria 34, 115stock market level of 116
Bahamas 46Bahrain 46balance of payments (BOP) 67–8, 84
crisis 87difficulties 70
Ban, Ki-Moonpresence at G20 Washington Summit
(2008) 40UN Secretary-General 40
Bank for International Settlements 141Bank of Japan 131Barbados 46Barroso, José Manuel
President of European Commission 35
visit to Washington DC (2008) 35Basel Committee on Banking
Supervision 49, 141Belgium 14, 46, 124Berger, Samuel 41bilateral financial safety nets (BFSNs)
19bilateral swap lines 55, 65, 85, 108
examples of 100, 103–5extension of 61
Index 251
Bismarck, Otto von 29Bolivia
fiscal revenues of 217Bolivarian Alliance for the Americas
(ALBA) 41Botswana 46Brandt Commission
Report of 30Brazil 14, 28, 32, 35, 174, 200, 218,
223, 235as member of G14 45domestic debt of 217economy of 34fiscal revenues of 217GDP per capita of 34
Bretton Woods Conference (1944) 1–2, 12, 33
participants in 15BRIC states/BRICs/BRICS 3, 8, 28,
33, 34, 35, 36, 50, 174–6GDP per capita of 34
Brookings Institution 45Brown, Gordon 11
economic policies of 46Brunei Darussalam 46, 155, 162
as member of ‘P4’ 188CMIM borrowing multiplier for 87
Bush, George W. 35administration of 41foreign policy of 33
Cambodia 100, 103, 136CMIM borrowing multiplier for 87Phnom Penh 58
Canada 3, 31, 162, 176, 188–9Toronto 4, 35, 37, 44
Cancún Conference (1981) 30capital account crisis
concept of 15–16capital flows 15, 112, 131, 198–9
global 38intraregional 129, 135reversals of 16volatility of 137, 141, 198
capital markets 10, 122, 128, 215, 228development of 132, 230domestic 217, 221international 70, 221, 225, 234openness of 118, 122, 136, 210regulation of 23
Caribbean Development Bank (CDB) 10, 216, 228
lending capacity of 218, 231mobilization of resources by 227–8net flows from 218, 238Private Sector Development Division
230technical assistance provided to
FONPLATA 223Cayman Islands
US-based corporations housed in 46
Central American Bank for Economic Integration (CABEI) 10, 216, 238
lending capacity of 218, 231mobilization of resources by 227–8support for private sector 230
Central American Free Trade Agreement (CAFTA)
proposals for 179Chiang Mai Initiative (CMI) 5, 19, 21,
38, 80, 85, 87, 89, 209, 211creation of (2000) 83, 108, 112members of 83Multilateralization (CMIM) 4, 21–2,
56–9, 61, 65, 67–8, 70–71, 81, 83–5, 91–2, 103–9, 131, 133, 137, 142
Agreement 90borrowing multiplier 87Crisis Resolution Function of 70establishment of (2010) 55, 59, 83,
87Executive Committee (EC) 57, 65,
80, 93, 103Executive Level Decision Making
Body (ELDMB) 89members of 56, 90, 109, 134, 138Precautionary Line (CMIM-PL)
91, 93, 134provisions of 5, 59relationship with IMF 66–8, 91–3,
98Stability Facility (CMIM-SF) 91,
93swap facilities 65–7, 81, 87, 89–90
Chile 46, 162, 218as member of ‘P4’ 188FTA used by 155–6, 188
252 New global economic architecture
China, People’s Republic of (PRC) 1, 3, 6, 9, 15, 17, 22–4, 27–8, 32–3, 55, 72, 83, 87, 93, 108, 113, 148, 159, 162, 174, 176, 186–9, 198, 200, 208, 224, 235
as member of G14 45bilateral swaps used by 100currency policy of 38–9economy of 34, 105, 209Eximbank 240exports of 31FDI activity of 72FTAs used by 162–3GDP per capita of 34population weight of 116State Administration of Foreign
Exchange 60trading activity of 174
Chinese Development Bank 240Citibank 77Clinton, Bill
administration of 41support for APEC (1993) 184–5
club theoryapplication of to IEIs 15
Cold War 30, 187Colombia 218Commerce International Merchant
Bankers Berhad (CIMB) 77computable general equilibrium (CGE)
modelling 186, 189cooperatives 8, 210
provision of retail services 212Costa Rica 46, 240Costco Wholesale Corporation 31credit 4, 93, 228
allocation of 113institutional 223institutions 125, 128domestic 217–18precautionary line of 108private bank 116
decentralization 18, 51, 215–16of MDBs 226
Denmark 42financial market openness in 119
deregulation 15Development Bank of Singapore
(DBS) 77
dot-com bubble (1997–2000) 217Dung, Nguyen Tan
support for expansion of G20 42–3
East Asian Free Trade Area (EAFTA) 18
Economic and Financial Committee (EFC) 126
Economic and Monetary Union (EMU)
Maastricht Treaty (1992) 114, 119Economic Cooperation Organization
(ECO) 29Economist, The 37Egypt 49
as member of G14 45Emerging Market Bond Index
(EMBI+) 234emerging markets
lack of representation of 14Equatorial Guinea 45Ethiopia 45EU–Republic of Korea FTA
provisions of 153European Bank for Reconstruction
and Development 197European Banking Authority (EBA)
126creation of 123
European Central Bank (ECB) 3, 124, 126, 142
European Commission draft proposals (2012) 125
personnel of 126Single Supervisory Mechanism
(SSM) 125, 129–30, 135, 142supervisory role of 125, 127
European Coal and Steel Community membership of 187
European Commission 123, 126, 128as source of multilateral aid 200draft proposals (2012) 125personnel of 35proposals for Single Resolution
Mechanism (2013) 128European Council 125–6, 129
creation of EFSF (2010) 128–9European Economic Community 183
members of 187
Index 253
European Financial Stability Facility (EFSF) 55
creation of (2010) 128–9shortcomings of 129
European Free Trade Association (EFTA) 18
European Insurance and Occupational Pensions Authority (EIOPA) 125
creation of 123European Monetary System (EMS)
114European Securities and Markets
Authority (ESMA) 125creation of 123
European Stability Mechanism (ESM) 4, 125
recapitalization efforts of 135European Supervisory Authorities
(ESAs) 6, 123–4European System of Financial
Supervision (ESFS) 125European Systemic Risk Board
(ESRB) 6, 18, 135creation of (2011) 126limitations of 127
European Union (EU) 6, 45, 48, 72, 74, 121–4, 127–8, 130, 134–6, 141–2, 181, 185, 187
FTAs used by 161harmonization of 133member states of 28, 34–5, 126, 129,
175EU15 115non-euro 125–6
Eurozone Crisis (2009–) 7, 55, 99, 113causes of 99–100political impact of 129–30, 141–2
Executives’ Meeting of East Asia-Pacific Central Banks (EMEAP) 131, 139, 141
Federal Republic of Germany (West Germany) 187
Ferguson, Niallconcept of ‘Chimerica’ 31
financial development 113–14, 122, 133, 142
diversity in 136measurement of 116
Financial Fund for the Development of the River Plate Basin (FONPLATA)
CDB technical assistance for 223financial integration 6, 112, 116–17,
121, 135–6, 139Asian 123capital account openness 117regional 5, 113–14, 129, 141
financial liberalization 15Financial Stability Board (FSB) 5, 21,
49, 112–13, 141, 143formerly FSF 2, 11–12, 16, 35, 43shortcomings of 23
Financial Stability Forum (FSF)as FSB 2, 11–12, 16, 35, 43establishment of (1999) 1, 14
Financial Times 37, 39financial transaction tax 40, 51Finland 42, 115First World War (1914–18) 30
Paris Peace Conference (1919) 34fiscal federalism 210foreign direct investment (FDI) 72,
173, 182, 187inflows 161, 185–6
FORO Nacional Internacional 215Fortune 250 39France 17, 28, 34, 39–40, 43, 45
Cannes 39, 45financial market openness in 119Paris 46proposal for creation of G14 45
free trade agreements (FTAs) 8, 22, 24, 148–50, 152, 156, 160, 162–3, 179, 181–4, 187, 189–90
Asian 7, 152–5, 159–61, 164–5criticisms of 155role in trade policy architecture
148–9ROOs in 157–9
bilateral 6, 157, 187, 190coverage of services by 152development of 7, 183–4, 187impact of GATT on 176liberalizing agriculture in 160limited 154national strategies 159preference utilization rates 155preferences 161
254 New global economic architecture
plurilateral 6regional 187–8WTO-plus format 155, 161
Free-Trade Area of the Asia Pacific (FTAAP)
proposed creation of 188–91Free Trade of the Americas 18
Gates, Bill 40Gates Foundation 200General Agreement on Tariffs and
Trade (GATT) 1, 148, 172, 174, 177, 180
as WTO 14establishment of 11impact on FTAs 176Uruguay Round (1986–94) 7, 154,
178, 185, 191General Agreement on Trade in
Services (GATS) 153, 161Article V 176Article XXIV 175–7, 180–82classification list of service sectors
152, 160–61German Democratic Republic (East
Germany) 187Germany 28Global Alliance for Vaccines and
Immunization (GAVI) 200global economic architecture (GEA) 1,
16, 18calls for reform of 3, 11–13, 21–2lack of representation of emerging
markets in 14Global Economic Coordination
Council (GECC)proposals for 21, 50
Global Economic Crisis (GEC) (2008–09) 1–3, 11, 13–14, 18, 31, 104, 123, 133–4, 141–2, 198–9, 238–9
G20 response to 31political impact of 85, 92, 106, 108,
113, 198, 218, 221, 234political response to 80, 108, 112recovery from 23–4
Global Environmental Facility (GEF) 200
Global Fund to Fight AIDS, Tuberculosis and Malaria (GFATM) 200
Global Governance Group (3G) 17, 46–7
aims of 46members of 49representatives of 45
global public goods 9, 23, 199, 209, 211Global Stabilization Mechanism
(GSM) 105globalization 199
financial 1, 3, 15impact on IEIs 15
of banking sector 75Goldman Sachs 14Great Depression 11, 32Greece
financial market openness in 119institutional quality of 121sovereign debt crisis (2009–) 103stock market level of 116troika bailout fund (2012) 129
Group of 14 (G14)proposals for creation of 45
Group of 77 (G77) 30Group of Eight (G8) 1–2, 14, 16, 30,
32–3, 48–9members of 14, 32–3proposals for development of 35, 48,
50Group of Five (G5) 13Group of Seven (G7) 1–2, 14, 16, 30
governance response methods of 32
members of 33Group of Twenty (G20) 1–2, 8–9, 11,
19, 21, 24, 27, 47–51, 112–13, 141Brisbane Summit (2014) 3, 37Cannes Summit (2011) 39, 45creation of 3, 16, 32–3critiques of 42, 44, 48–9
legitimacy of 49–51development of 28Framework for Strong, Sustainable
and Balanced Growth 38Istanbul Summit (2015) 3, 37legitimacy issues of 4, 16, 24, 27, 31,
40, 42, 44–6, 48–51London Summit (2009) 36–7Los Cabos Summit (2012) 3, 37, 39members of 3–4, 16, 27–9, 34, 37–8,
41, 44
Index 255
Pittsburgh Summit (2009) 36–7, 44, 202, 209
proposals of Global Financial Safety Net and Development Issues 44
proposed expansion of 16–17, 23, 36, 38, 42–4, 46, 50
regionalization of 51response to GEC 31Saint Petersburg Summit (2013) 40Seoul Summit (2010) 3–4, 17, 37–9,
41, 44–5Toronto Summit (2010) 4, 35–7,
44–5Washington Summit (2008) 36–7,
40–41, 46, 77Guatemala 46Gulf Cooperation Council (GCC) 17,
29members of 45
Haitiearthquake (2010) 239reconstruction efforts in 222
Haiti Reconstruction Fund 240harmonization 127, 129, 132–3, 136,
142, 178, 181, 186, 226influence of market liberalization on
133regulatory 6, 113, 130–31, 135–7,
141–2Haroon, Abdullah Hussain
Pakistani Ambassador to UN 41Harvard University 206Held, David 28Hong Kong, China 35, 57, 60, 91
CMIM borrowing multiplier for 87
Hong Kong Monetary Authority 131Hong Kong Shanghai Banking
Corporation (HSBC) 77
Iceland 42India 1, 3, 8, 14, 23, 28, 32, 105, 138,
148, 162, 174, 176, 181, 188, 198, 200
as member of G14 45bilateral swaps used by 105economy of 105FDI activity of 72FTAs used by 155–6, 163
GDP per capita of 34membership of G20population weight of 116
Indonesia 3, 27, 32, 37, 57, 61, 68, 84, 155, 157, 179
Bali 89bilateral swaps used by 100, 104CMIM borrowing multiplier for
87exports of 72FDI activity in 75IMF support provided to during
Asian Financial Crisis (1997–98) 85
intellectual property rights (IPRs)protection of 177–8, 182
Inter-American Development Bank (IDB) 8, 10, 197, 216, 221, 225, 228, 234, 238
board of governors 239Fund for Special Operations 239Grant Facility 240
creation of (2007) 239IDB-9 negotiations (2009–) 239lending capacity of 218, 231members of 240net flows from 218support provided for Haiti
reconstruction efforts 222International Chamber of Commerce
G20 Advisory Group 49international economic institutions
(IEIs) 1, 13–14, 17–18, 21–2application of club theory to 15impact of financial globalization on
15calls for reforms of 16, 23–4lack of representation of emerging
markets in 14policies of 3shortcomings of 13–16
international financial institutions (IFIs) 30
proposed reforms of 36International Monetary Fund (IMF) 1,
4–5, 17–19, 21–2, 32, 34, 38–9, 55–8, 65, 77, 80–81, 83–4, 89, 103, 107–9, 112, 138, 141, 143, 186, 202, 212, 224, 226
Annual Meeting (2006) 17
256 New global economic architecture
annual report on exchange rate arrangement and regulations 117
Article IV 80Board of Governors 17–18establishment of 11Executive Board 14Flexible Credit Line (FCL) 19, 37,
91, 134Independent Evaluation Office
(IEO) 67, 71Report 67
lack of voting power for emerging markets in 14
lending instruments of 67–8Rapid Financing Instrument
(RFI) 68Precautionary and Liquidity Line
(PLL) 68, 70–71members of 15, 49Monetary and Financial Committee
49Multi-Country Swap Line (MSL)
105Precautionary Credit Line (PCL) 19,
37, 91, 134relationship with CMIM 66–8, 91–3,
98shortcomings of 16Stand-By Arrangements (SBAs) 68support provided during Asian
Financial Crisis (1997–98) 66, 85, 109, 133, 209
Italy 14, 28financial market openness in 119stock market level of 116
Jamaica 46Japan 8, 22, 55, 83, 85, 87, 93, 104, 108,
113, 148, 155, 159, 162, 180, 187–9, 209
bilateral swaps used by 100, 105economy of 209FDI activity of 72FTAs used by 155–6, 162–3, 189government of 85Ministry of Finance 60Sendai 58trading activity of 72Yokohama 189
Korea, Democratic People’s Republic of 202
Korea, Republic of 3–4, 8, 17, 22–3, 27, 32, 37–9, 43–4, 48, 61, 83, 87, 108, 113, 150, 155–7, 159, 162, 174, 180, 187–9
bilateral swaps used by 100, 104FDI activity of 72FTAs used by 155–7, 161–3, 189GDP per capita of 34government of 38IMF support provided to during
Asian Financial Crisis (1997–98) 85
Seoul 3–4, 37–9, 41, 44–5trade tariffs of 150
Krasner, Stephen 40
Lagarde, ChristineFrench Finance Minister 35visit to Washington DC (2008) 35
Lamy, Pascalformer Director-General of WTO
166Lao People’s Democratic Republic
(Lao PDR) 103, 136Latin American Free Trade Area 185League of Nations 30Lee, Myung-bak 38
foreign policy of 37legitimacy 3, 12, 14, 16–17, 24, 42,
44–6, 48–50, 135, 208development of 45input 2, 4, 27, 31, 35, 37–8, 40–41,
47, 50–51issues of 4, 16, 24, 27, 31, 40, 42,
44–6, 48–51output 31, 37, 41, 50–51political 135undermining of
lack of inclusiveness 49Lehman Brothers
collapse of (2008) 66, 83, 108Liechtenstein
as German OFC 46liquidity 19, 22, 32, 61, 87, 108
crisis 92, 99–100, 103–4risks 129shortfall 104support 56, 83–4, 91–3, 105, 108, 123
Index 257
Livable Cities 49London Interbank Offered Rate
(LIBOR) 234Luxembourg 46, 124
macroeconomic 1, 5–6, 60, 67, 70–71, 77–9, 106, 130, 135, 139, 141, 184, 198, 202, 231
coordination 37–8instability 132stability 1, 13, 22, 139, 185
Malawi 45Malayan Banking Berhad (Maybank)
77Malaysia 32, 42, 46, 57, 61, 84–5, 133,
155–8, 162, 188bilateral swaps used by 100CMIM borrowing multiplier for 87exports of 72FDI activity in 75FTA used by 155–6Kuala Lumpur 131, 188
market liberalizationpolitical impact of 133, 142
Martin, Paul Canadian Finance Minister 3, 27Canadian Prime Minister 3, 27, 48speech at Woodrow Wilson Center
(2004) 27–8memorandums of understanding
(MOUs) 126, 129limitations of 127–8, 135use in cross-border supervision 135,
137, 142voluntary 141
Menon, Vanu GopalaSingaporean Ambassador to UN 47
MERCOSUR 29, 48, 223Mexico 17, 31, 37, 45, 162, 182, 188–9,
218, 223as member of G14 45domestic debt of 217economy of 179Los Cabos 3Tesobonos Crisis (1995) 216–17
Monaco 46most-favored nation (MFN) 153, 177,
185benefits 174granting of 175
tariff lines 155violations of 176
multilateral development banks (MDBs) 215, 217–18, 221, 224, 225–6, 227–8, 231, 234–6, 239–41
business model of 227client-oriented culture of 223Common Performance Assessment
204decentralization of 226division of labor among 216, 228,
230–31innovation capacity of 218, 221Latin America and Caribbean
(LAC) region 215–16, 221, 222–8, 231, 238, 240–41
prepayments to 217proposed development of 237regional 238stakeholders 238
multilateral financial institutions (MFIs) 197
multilateralism 43, 51, 172–3, 176–7, 180, 190
inclusivesupport for 40
universal 41Myanmar 103, 136, 202
bond issue levels of 116CMIM borrowing multiplier for 87institutional quality of 122
Nakao, TakehikoJapanese Vice Finance Minister for
International Affairs 104Nanyang Technological University
(NTU)personnel of 22
nationalism 85Nemoto, Yoichi
Director of AMRO 60Netherlands 14
treatment at G20 Toronto Summit (2010) 45
New Bretton Woods (NBW) 12, 23–4proposals for 1–3, 11, 13, 23
New Miyazawa Planprovisions of 186
New Partnership for Africa’s Development (NEPAD) 17, 45
258 New global economic architecture
New Zealand 23, 46, 105, 134, 138, 162, 188
as member of ‘P4’ 188economy of 105FTA used by 155–6, 188
Nigeria 42, 49Non-Aligned Movement (NAM) 30non-governmental organizations
(NGOs) 200international 9
Nordic Councilmembers of 42
North American Free Trade Agreement (NAFTA) 48, 162, 178–9, 182
members of 28provisions of 178
North Atlantic Treaty Organization (NATO) 30
Obama, Barack 15Offshore Financial Centers (OFCs) 30,
46–7examples of 46
oil shock crisis (1973) 201Organisation for Economic
Co-operation and Development (OECD) 30, 46, 80, 186
Development Assistance Committee (OECD-DAC) 200, 207
member states of 176, 180, 188Overseas Chinese Bank Corporation
(OCBC) 77
Pakistan 41Panama 46, 240Paris Declaration on Aid Effectiveness
201, 231implementation of 9
Paulson, HankUS Treasury Secretary 35
People’s Bank of China 61 personnel of 11
Peru 162, 188, 217, 223capital account of 223domestic debt of 217fiscal revenues of 217
Philippines 46, 57, 84, 155, 157, 159bilateral swaps used by 100
FDI activity in 75Manila 90
Portugalstock market level of 116troika bailout fund (2012) 129
povertystrategies for reduction of 13
Prussia 29, 31, 34
Qatar 46quantitative easing 39
Rashid Hussain Berhad (RHB) 77Reagan, Ronald
administration of 15Regional Comprehensive Economic
Partnership (RCEP) 8, 18, 19, 23, 149, 162–3, 165, 183, 190
creation of (2012) 188Kuala Lumpur Round (2014) 188members of 187–8
regional trading agreements (RTAs) 8, 177, 179, 185–7
concept of 172membership of 185
regionalism 2, 6, 8, 51, 112, 172–3, 176–7, 179–81, 185–6, 188, 190–91
Asian 6–7, 187–8East Asian 186
closure of 190criticisms of 182–3multilateralising 186open 178, 191
Republic of Ireland 46, 124, 205financial market openness in 119troika bailout fund (2011) 129
Republic of Korea–United States FTA (KORUS) 150
Reserve Bank of Australia 131risk bearing capital ratio (RBCR) 231,
234Rudd, Kevin 37rules of origin (ROOs)
concept of 157–8limited burden 158, 162overlapping 7proposed development of 161, 165use in Asian FTAs 157–9
Russian Empire 34
Index 259
Russian Federation 28, 106, 172, 174GDP per capita of 34membership of G8 14Saint Petersburg 40
Rwanda 46
San Marino 46Sarkozy, Nicolas 11, 34–5, 40
economic policies of 46, 48visit to Washington DC (2008) 35
Saudi Arabia 28–9SEACEN Centre 75Second World War (1939–45) 29–30,
187, 202Potsdam Conference (1945) 34Yalta Conference (1945) 34
Senegal 46Seoul Development Consensus
advancement of 39Singapore 17, 45–7, 57, 60, 84, 133,
148, 154–5, 162, 164, 177as member of ‘P4’ 188banking sector of 77bilateral swaps used by 104Chair of IMF Monetary and
Financial Committee 49CMIM borrowing multiplier for 87exports of 72FDI activity in 75FTAs used by 161, 188membership of 3G 49
Slovakia 103small and medium-sized enterprises
(SMEs) 7, 158–9, 162, 165, 225funding provided to 230technical standards 161training 162
South Africa 28, 174as member of G14 45
South East Asian Central Banks (SEACEN)
Expert Group (SEG) establishment of (2000) 131
Research and Training Centre 131Soviet Union (USSR) 29Spain 45Standard Chartered Bank 77Stiglitz, Joseph 4, 11, 41Stiglitz Commission 21
Stiglitz Report 50
Støre, Jonas Gahrcriticisms of G20 42Norwegian Foreign Minister 42
subregional development banks (SRDBs) 221, 223, 228, 233–5, 238–9
development of 225–7, 237membership of 240net financial flows from 218
Sweden 42, 46, 115, 124Switzerland 46
Davos 42systematically important financial
institutions (SIFIs) 137–8global (G-SIFIs) 5regional 137, 139
Taipei,China 200Thailand 32, 42, 57, 61, 68, 84, 133,
148, 155, 159, 200Chiang Mai 133CMIM borrowing multiplier for 87exports of 72FDI activity in 75FTA used by 155–6IMF support provided to during
Asian Financial Crisis (1997–98) 85
Thatcher, Margaretadministration of 15
Third World 30Timor-Leste 106trade liberalization 185
impact of 141liberalization 160limited services 150, 152multilateral 8services 7
trade unions 30Trans-Pacific Strategic Economic
Partnership (Trans-Pacific Partnership/TPP) 8, 18, 149, 165, 188–9
aims of 188–9negotiators for 188, 190requirements for 163signatories of 162
troika 48bailout funds of (2011–12) 129members of 129
260 New global economic architecture
Turkey 17, 28, 37, 200Istanbul 3
UBS AGUS tax evasion scandal 46
United Arab Emirates (UAE) 45–6United Kingdom (UK) 15, 17, 28, 34,
46, 124London 30, 36–7, 46
United Nations (UN) 4, 30, 40–42, 47, 224
Conference on the Global Economic Crisis 41
Conference on Trade and Development (UNCTAD) 30
General Assembly 21Millennium Development Goals 200personnel of 40–42Security Council 21, 29shortcomings of 16veto powers of members of 29–30,
34United Overseas Bank (UOB) 77United States of America 3, 14, 29–31,
34, 38, 55, 72, 85, 106, 108, 116, 162, 176, 178–9, 182, 186, 188–9, 198–9, 216–17
agricultural exports of 150Blake Island, WA 184–5Congress 29–30economy of 209Federal Deposit Insurance
Corporation 128Federal Reserve 234foreign policy of 29–31FTA used by 155–7, 179–80Honolulu, HI 15New York, NY 47Pittsburgh, PA 36, 44, 202Treasury Department 234Washington DC 27, 35–7, 40–41, 46
Uruguay 46, 240domestic debt of 217
US–PRC Business Council 31
Verhofstadt, Guysupport for development of G8 48
Viet Nam 45–6, 87, 103, 136, 155–6, 162, 182–3, 188
bond issue levels of 116
CMIM borrowing multiplier for 87FTA used by 155–6Ministry of Finance 44stock market level of 116
Walmart Stores, Inc. 31Washington Consensus 15Wei, Benhua
Director of AMRO 60Wilhelm II, Kaiser 29Woodrow Wilson Center 27World Bank 1–3, 9–10, 39, 80, 107,
197–8, 202, 206–8, 216, 221, 224–6, 228, 234–5
Annual Meeting (2006) 17coordination with ADB 202–4establishment of (1944) 11, 202Executive Board 208International Bank for
Reconstruction and Development (IBRD) 202
International Centre for Settlement of Investment Disputes (ICSID) 202
International Development Association (IDA) 202, 205, 208
International Finance Corporation (IFC) 202, 204, 228
Inter-American Investment Corporation (IIC) 229
Multilateral Investment Fund (FOMIN) 229, 240
net flows from 218personnel of 11potential development of 207–12regional strategies of 223shareholders of 209shortcomings of 16World Governors Indicators
database 121World Economic Conference (1933)
US interference in 30World Economic Forum (Davos)
attendees of 42–3World Finance Organization (WFO)
proposals for 21–2World Trade Organization (WTO) 1–2,
7, 11, 18, 22, 30, 148–9, 153, 163–6, 172–3, 175–6, 178, 180, 183, 186, 189–90
Index 261
Article I 175Bali Ministerial Meeting (2013)
172–3Bali Package (2013) 163Cancún Ministerial Conference
(2004) 154, 186creation of (1995) 154, 163Doha Development Agenda/Round
(DDA) (2001–) 6–8, 148, 154, 160, 163–5, 172–7, 180, 189
formerly GATT 14Government Procurement
Agreement (GPA) 175Information Technology Agreement
(ITA) 164, 175–6members of 15, 175, 177, 181,
185
Multilateral Investment Guarantee Agency (MIGA) 202
personnel of 166Seattle Ministerial Conference
(1999) 186Valuation Agreement 177
Yekaterinburg Joint Communiqué provisions of 36
Yeo, GeorgeSingaporean Foreign Minister 47
Zhou, XiaochuanGovernor of People’s Bank of China
11Zoellick, Robert
President of World Bank 11