Embed Size (px)
Citation preview
; _ Essentialsin "/
/t
Poster Presentation
5th Symposium of the Protein Society - June, 1991Poster # T63
Edman Protocols for High Yield Covalentand Adsorptive Sequence Analysis on
the ProSequencer TM
J.M. Coull, A.G. Bonner & J.D. Dixon
Millipore Corporation, MilllGen/Biosearch Division, %_186 Middlesex Turnpike, Burlington, MA. 01803 U.S.A._.
"-,3
MILLIPORE Milford,WatersChr°mat°graphy Divisi°n734MapleMAStreet01757508478-2000
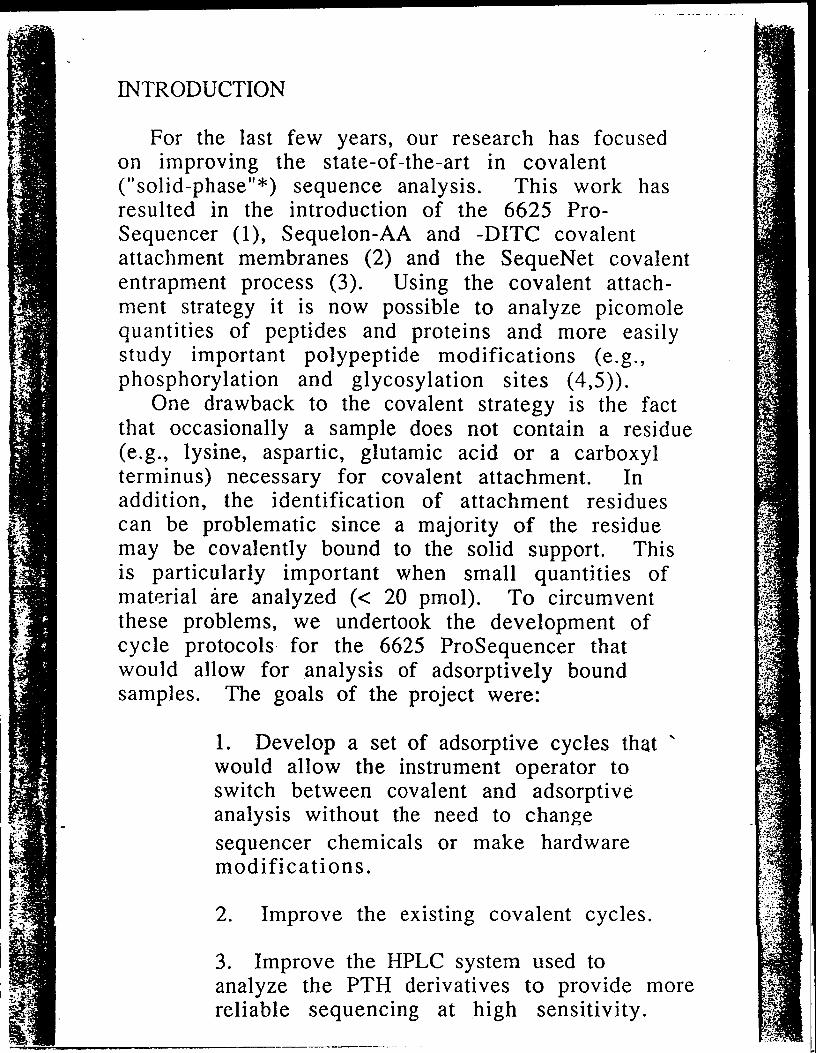
INTRODUCTION
For the last few years, our research has focusedon improving the state-of-the-art in covalent("solid-phase"*) sequence analysis. This work hasresulted in the introduction of the 6625 Pro-
Sequencer (1), Sequelon-AA and -DITC covalentattachment membranes (2) and the SequeNet covalententrapment process (3). Using the covalent attach-ment strategy it is now possible to analyze picomolequantities of peptides and proteins and more easilystudy important polypeptide modifications (e.g.,phosphorylation and glycosylation sites (4,5)).
One drawback to the covalent strategy is the factthat occasionally a sample does not contain a residue(e.g., lysine, aspartic, glutamic acid or a carboxylterminus) necessary for covalent attachment. Inaddition, the identification of attachment residuescan be problematic since a majority of the residuemay be covalently bound to the solid support. Thisis particularly important when small quantities ofmaterial fire analyzed (< 20 pmol). To circumventthese problems, we undertook the development ofcycle protocols for the 6625 ProSequencer thatwould allow for analysis of adsorptively boundsamples. The goals of the project were:
1. Develop a set of adsorptive cycles that "would allow the instrument operator toswitch between covalent and adsorptiveanalysis without the need to change
sequencer chemicals or make hardwaremodifications.
2. Improve the existing covalent cycles.
3. Improve the HPLC system used toanalyze the PTH derivatives to provide morereliable sequencing at high sensitivity.
r,
The result would be a versatile sequencer that couldbe used for analysis of virtually any type of sample.
*Note _about the terminology used in this posterAll modern sequencers use some type of sample support or "solid-phase"
(e.g. PVDF membrane or glass fiber disk). To more accurately describe themecharfism by which the sample is immobilized on the support, we have chosento emp]oy the terms covalent and adsorptive to reflect the presence or absence Iof a covalent bond between the polypeptide and the sample matrix. Use of theterms "solid-phase" and "gas-phase" is sometimes confusing since the formerindicates a covalent bond to the support while the latter actually describes themethod by which reagents are delivered to the sample support regardless ofhow thin sample is immobilized.
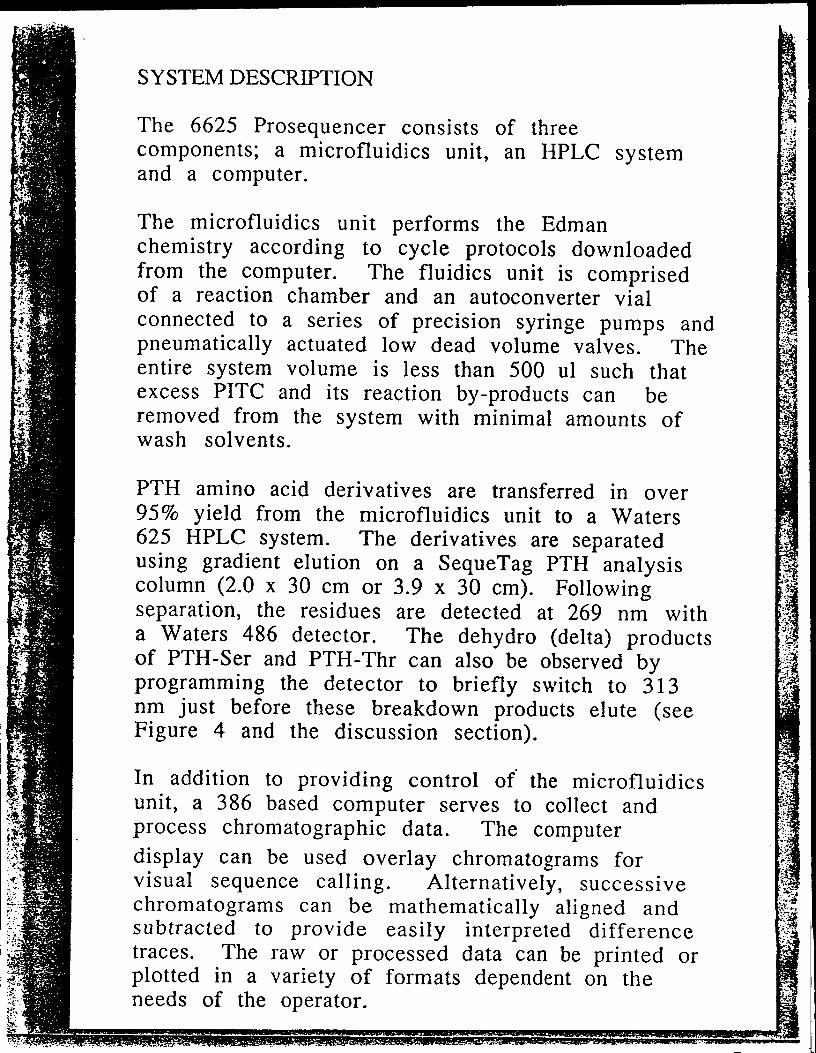
SYSTEM DESCRIPTION
The 6625 Prosequencer consists of threecomponents; a microfluidics unit, an HPLC systemand a computer.
The microfluidics unit performs the Edmanchemistry according to cycle protocols downloadedfrom the computer. The fluidics unit is comprisedof a reaction chamber and an autoconverter vialconnected to a series of precision syringe pumps andpneumatically actuated low dead volume valves. Theentire system volume is less than 500 ul such thatexcess PITC and its reaction by-products can beremoved from the system with minimal amounts ofwash solvents.
PTH amino acid derivatives are transferred in over
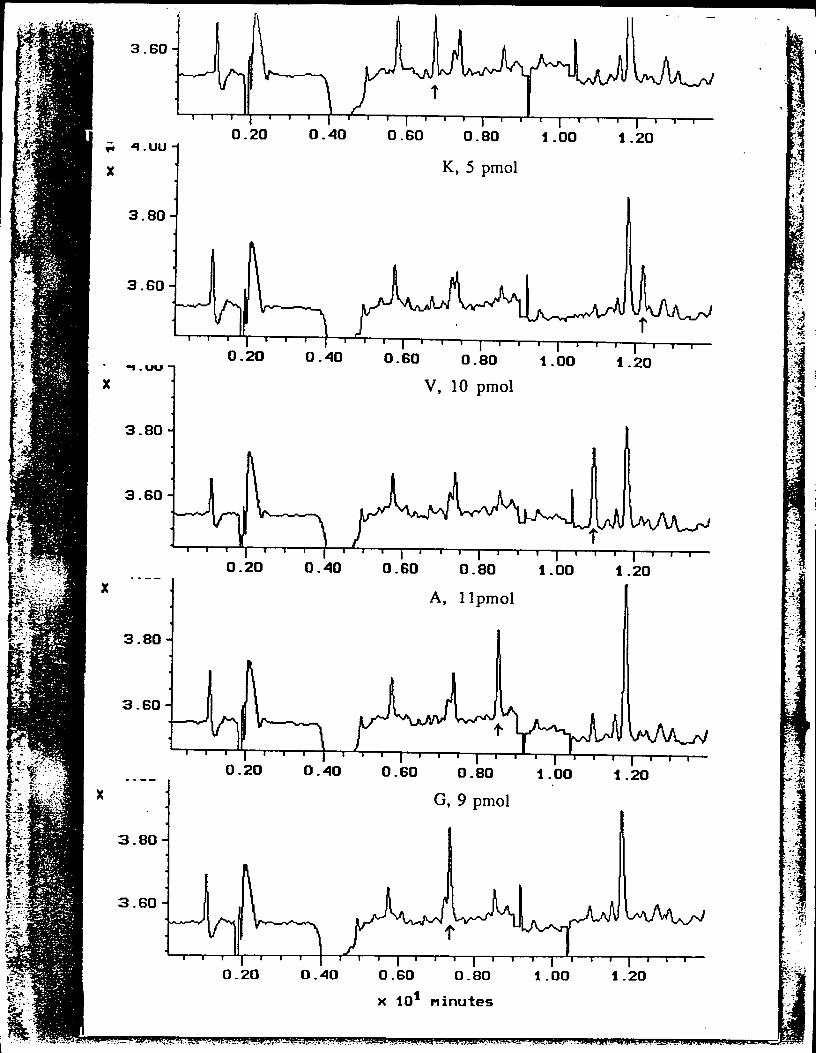
95% yield from the microfluidics unit to a Waters625 HPLC system. The derivatives are separatedusing gradient elution on a SequeTag PTH analysiscolumn (2.0 x 30 cm or 3.9 x 30 cm). Followingseparation, the residues are detected at 269 nm witha Waters 486 detector. The dehydro (delta) productsof PTH-Ser and PTH-Thr can also be observed byprogramming the detector to briefly switch to 313nm just before these breakdown products elute (seeFigure 4 and the discussion section).
In addition to providing control of' the microfluidicsunit, a 386 based computer serves to collect andprocess chromatographic data. The computer
display can be used overlay chromatograms forvisual sequence calling. Alternatively, successivechromatograms can be mathematically aligned andsubtracted to provide easily interpreted differencetraces. The raw or processed data can be printed orplotted in a variety of formats dependent on theneeds of the operator.
Adsorptive sequence analysis of b-Lactoglobulinelectroblotted onto Immobilon-P membrane
100
Initial Yield = 14 pmolRepetitive Yield = 96.0%
BB D
ra El
PTH._ ..Yield lo _ " " " []
tpmol) [] . _ [] . =[]
BB
m[]
_IVTQTMKGLDI QKVAGTWYSLAMAASDIS
Residue
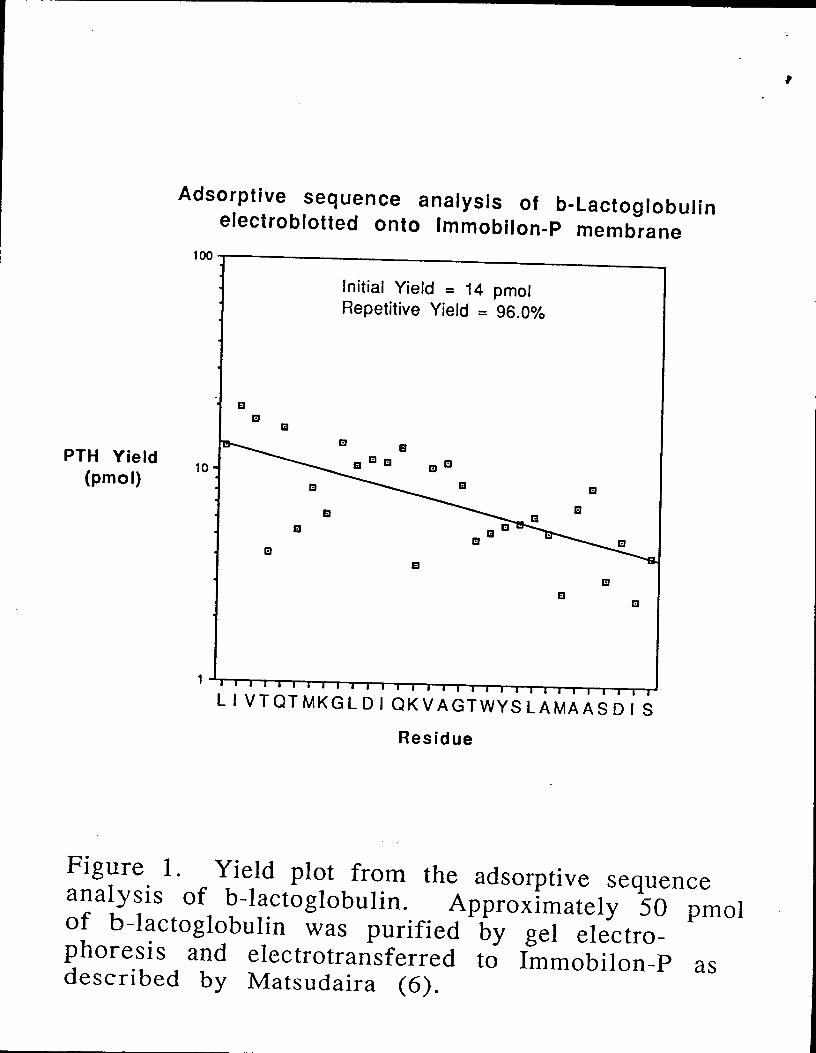
Figure 1. Yield plot from the adsorptive sequenceanalysis of b-lactoglobulin. Approximately 50 pmolof b-lactoglobulin was purified by gel electro-phoresis and electrotransferred to Immobilon-P asdescribed by Matsudaira (6).
Adsorptive sequence analysis of SOD electrobiottedonto Immobilon-P membrane
100
Initial Yield = 40 pmolRepetitive Yield = 94.5%
n []
r.I D
PTH Yield []10
(pmol)
[]
1 I I I i | I I I I i I I i I | I I I I i
VQAVAV L KGDAGVSGVVK F EQ
Residue
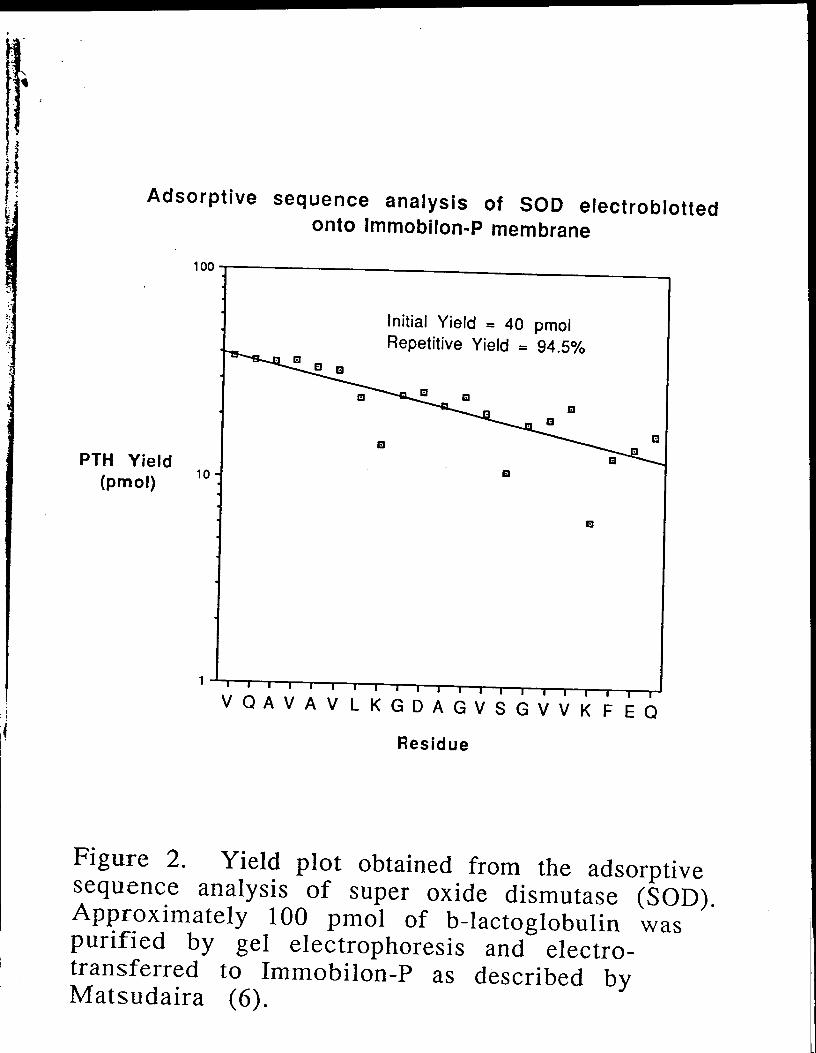
Figure 2. Yield plot obtained from the adsorptivesequence analysis of super oxide dismutase (SOD).Approximately 100 pmol of b-lactoglobulin waspurified by gel electrophoresis and electro-transferred to Immobilon-P as described byMatsudaira (6).
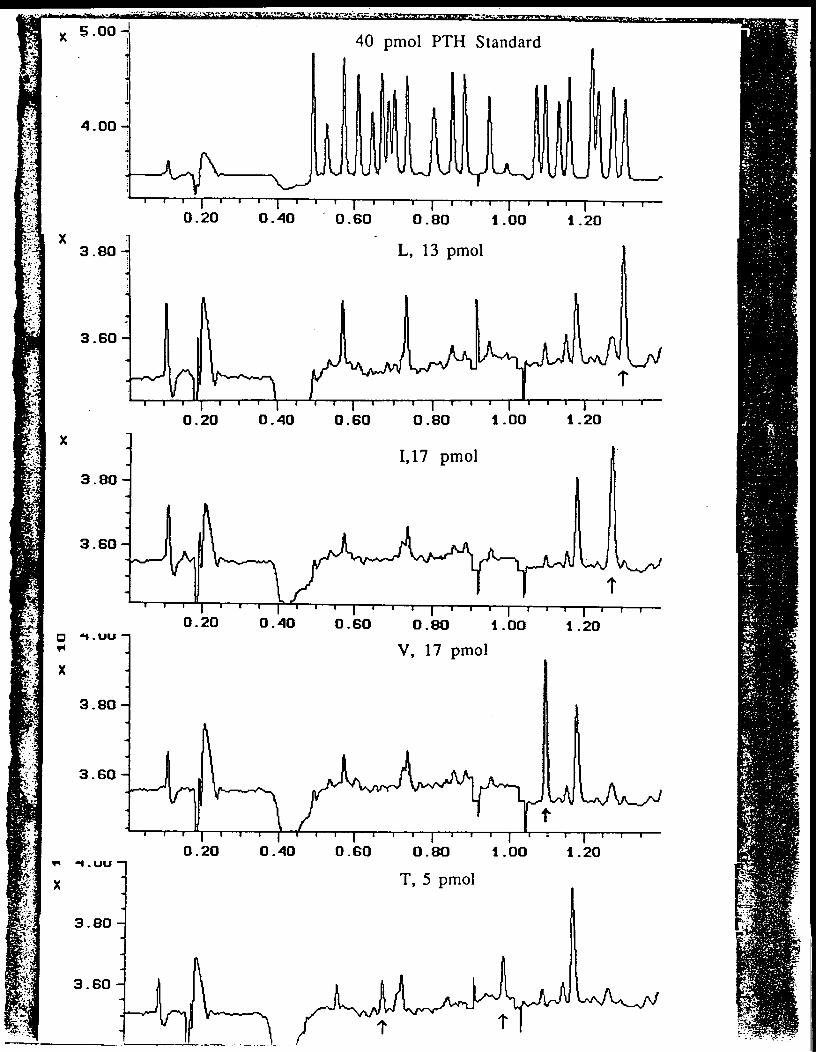
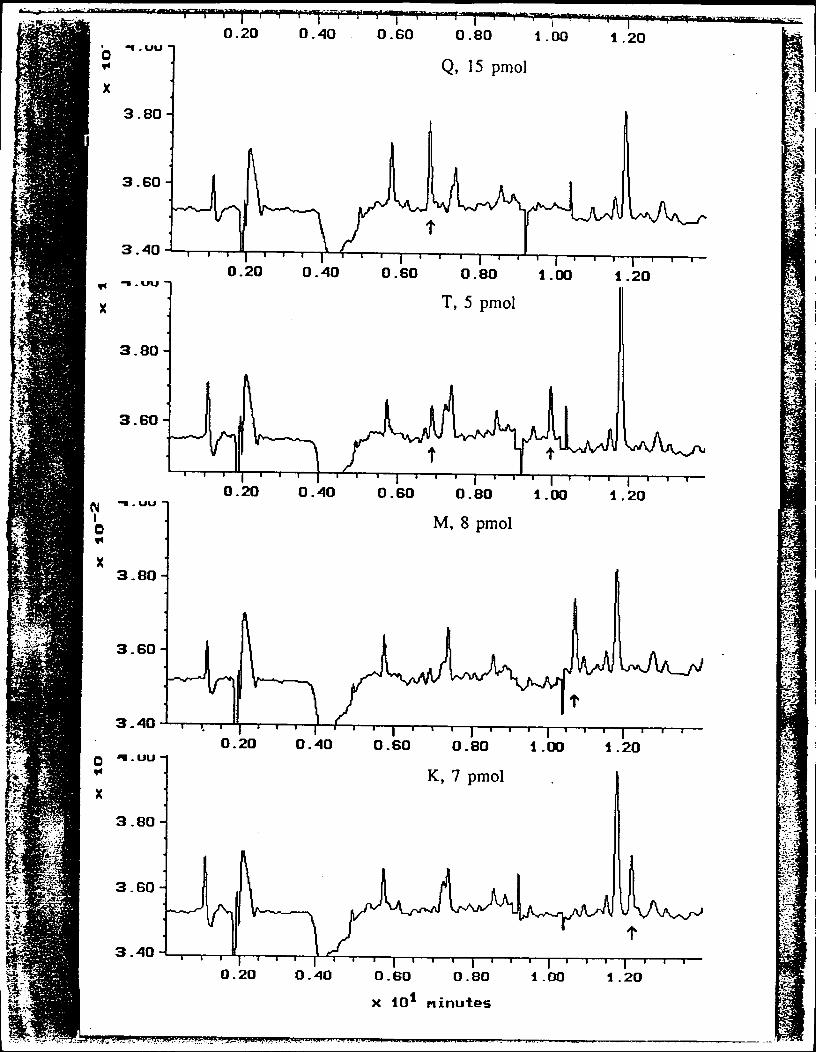
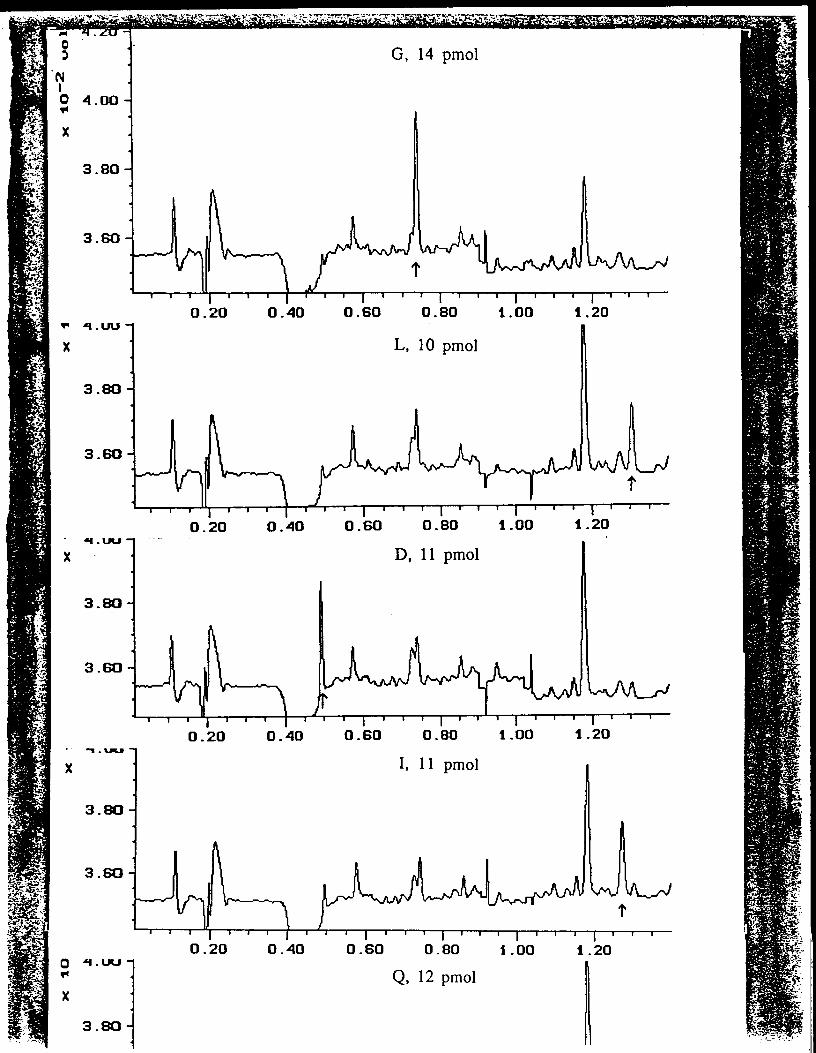
Figure 3. Raw data traces from the adsorptiveanalysis of b-lactoglobulin electroblotted ontoImmobilon-P. The yield plot for this sequence runis presented in Figure 1. Wavelength switching wasused to identify serine and threonine residues asshown in Figure 4.
x 5.00 40 pmol PTH Standard
' ' ' i ' ' ' I ' ' ' I ' ' ' I ' ' ' I ' ' ' I ' ' 'O. 20 O. 40 O. GO O. 80 t. O0 t. 20
X3.80. L, 13 pmol
I I I I I I I i ! I I
0.20 0.40 0.60 0.80 | .00 | .20
X
1,17 pmol3.80
O. 20 O. 40 O. GO O. 80 t. O0 t. 200 .,4.uu -
V, 17 pmolX
3.80
! I I | I _ ! I I
0.20 0.40 0 .GO 0.80 t .00 | .20
"l. UU 1
x T, 5 pmol
3.80
__ +:+_+._+?............... _-_--7-,--+_.r_ -[_---;,-_. -7 _-_ +_-_-. ,-_--_--.-:_ ,+._. i--= _-_ ................ +....0.20 0.40 0.60 0.80 I .00 I .20
_I.UU "
Q, 15 pmo]X
3.80
3.40 I ' ' '
. 0.20 O. 40 O. 60 O. 80 t. O0 t. 20
• ' " " oi
3.40 ' : .... I ' ' ' I ' ' '0.20 0.40 0.60 0.80 t .00 t .20
_ "'uu I
K, 7 pmolX
N .80
3.40 ...... I ' ' 'O. 20 O. 40 O. 60 O. BO t .00 _t.20
x t0 t Minutes
0:_ G, 14 pmol
I0 4.00
X
3.80
3.60
?
0.20 0.40 0.60 0.80 t.00 t 20
'=:1- tlnI-J 1
x L, 10 pmol
3.80
i i i ! _ | ! I
O. 20 0.40 O. 60 O. 80 1. O0 t .20,AI. ILImJ -- --
X D, II pmol
3.80
I ! | [ ! ! !
0.20 0.40 0.60 0.80 t .00 t .20° "_ . %,IW,,.IP--
X I, 11 pmol
3.00
...... I ' ' ' I ' ' ' I ' ' ' I ' ' 'O. 20 O. 40 O. 6:0 O. 80 t. O0 t. 20
Q, 12 pmolX
t ! I ! ! i I _ i !
0.20 0.,40 0.60 0.80 '! .00 t .20_, 4 .uu
X K, 5 pmol
3.80
..... I ' ' ' J ' ' ' I ' ' ' I ' ' '0.20 O. 40 0.60 0.80 1.00 i. 20
_1 . li.lU --
x V, lO pmol
3.80
...... I ' ' ' I ' ' ' i ' ' ' I ' ' '0.20 0.,40 0.60 0.80 4..00 t .:20
X A, 1lpmol III
3.80
...... I ' ' ' I ' I ' ' '0.20 0.,40 0.60 0.80 4..00 I. 20
x G, 9 pmol
3.80
o I i ! I I
O. 20 0.40 O. 60 O. 80 t. O0 11.20
x t01 _inutes
G.OO:_" A
1'IIO,,, 269 nm
X S.[_D /" %
"%..
, , i_''':--'' ' I ' ' ' I ' ' ' i ' ' ' I ' ' '0.40 O. 60 O. 80 t .00 t .20
6.00o B
I
o 313 nm 269 nm,, 269 nm
x s.t_ < _ t. )_. _)
M4.130
' ' I ' ' ' I ' ' ' I ' ' _ I ' ' ' I ' ' '0.40 0.60 0.80 I .00 t .20
" C V, 21 pmol0 4.20
?0 4.00
X
3.80
,, "k, , , I ' ' ' I ' ' ' I ' ' ' I ' ' '0.40 0.60 0.80 I .00 1.20
" 1o D dehydro-S, 11 pmol
4.00
3.80B
3.60
0.40 0.60 0.80 t .00 t .20gl
0 4.20 E G, 18 pmol
I
_ 4.00
X
3.80
_._o , , , . , , . . , , , . .0.40 0.60 O. 80 1.00 t .20
x 10 t e_inutes
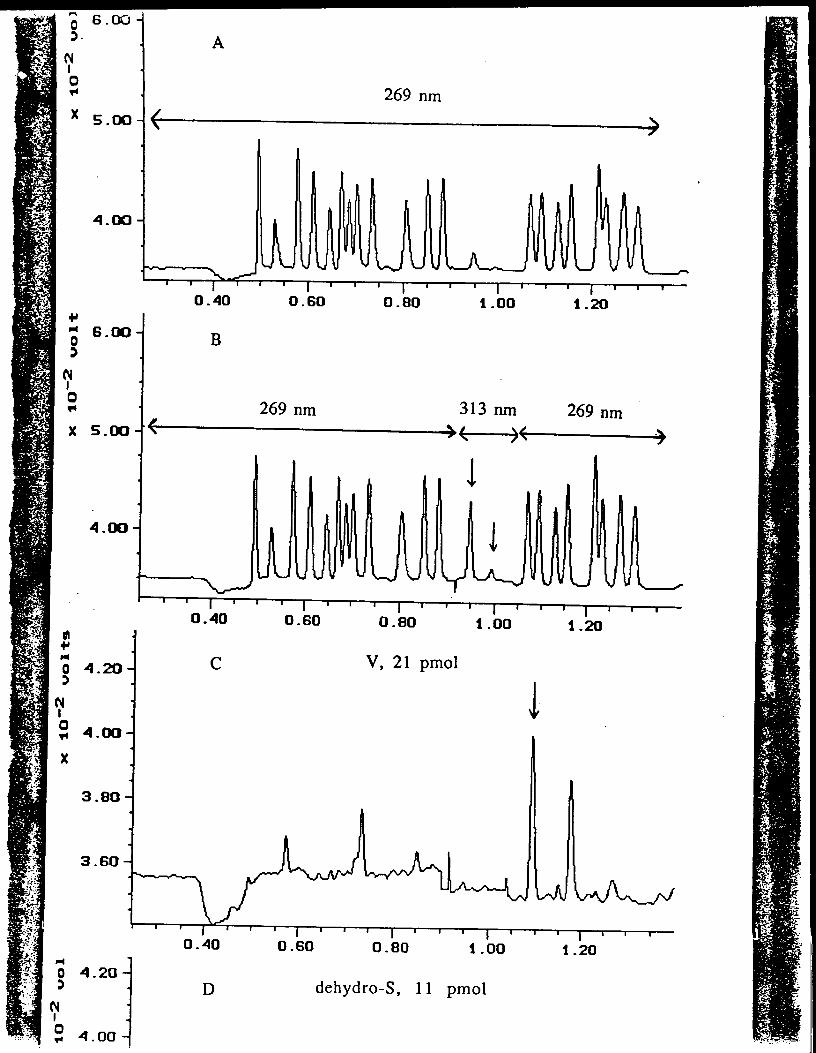
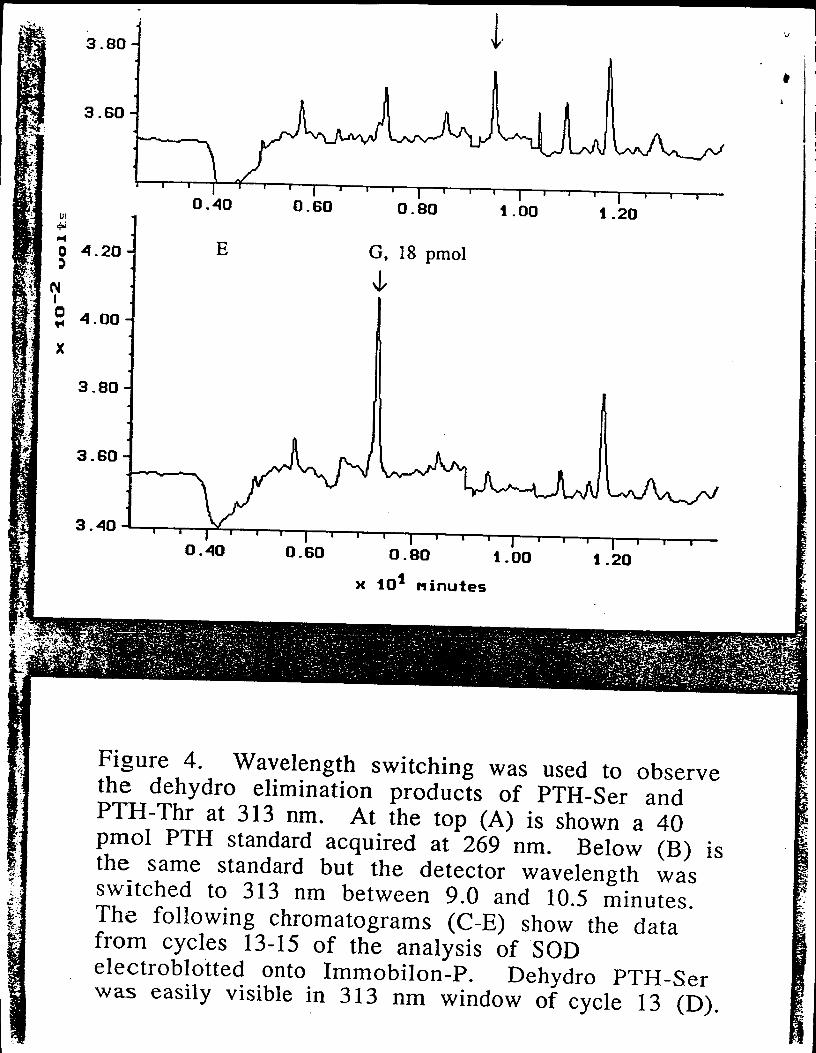
Figure 4. Wavelength switching was used to observethe dehydro elimination products of PTH-Ser andPTH-Thr at 313 nm. At the top (A) is shown a 40pmol PTH standard acquired at 269 nm. Below (B) isthe same standard but the detector wavelength wasswitched to 313 nm between 9.0 and 10.5 minutes.
The following chromatograms (C-E) show the datafrom cycles 13-15 of the analysis of SODelectroblotted onto Immobilon-P. Dehydro PTH-Serwas easily visible in 313 nm window of cycle 13 (D).
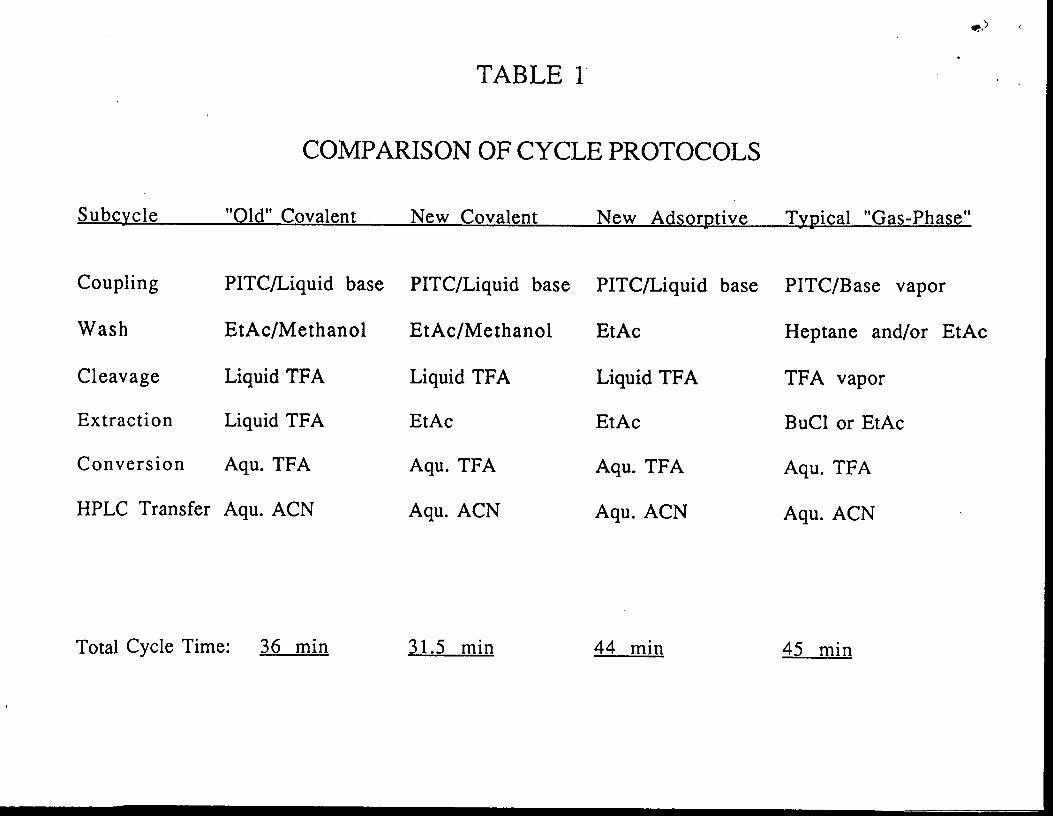
TABLE 1
COMPARISON OF CYCLE PROTOCOLS
Subcycle "Old" Covalent New Covalent New Adsorptive Typical "Gas-Phase"
Coupling PITC/Liquid base PITC/Liquid base PITC/Liquid base PITC/Base vapor
Wash EtAc/Methanol EtAc/Methanol EtAc Heptane and/or EtAc
Cleavage Liquid TFA Liquid TFA Liquid TFA TFA vapor
Extraction Liquid TFA EtAc EtAc BuC1 or EtAc
Conversion Aqu. TFA Aqu. TFA Aqu. TFA Aqu. TFA
HPLC Transfer Aqu. ACN Aqu. ACN Aqu. ACN Aqu. ACN
Total Cycle Time: 36 min 31.5 min 44 min 45 min
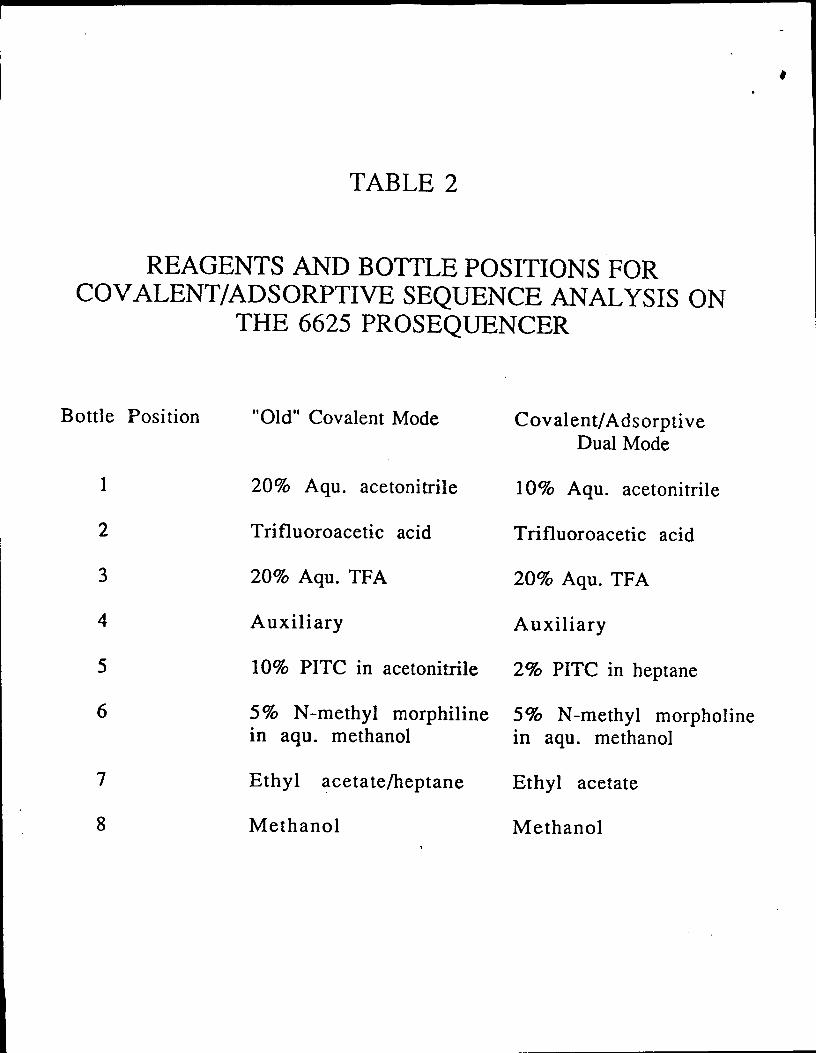
TABLE 2
REAGENTS AND BOTTLE POSITIONS FOR
COVALENT/ADSORPTIVE SEQUENCE ANALYSIS ONTHE 6625 PROSEQUENCER
Bottle Position "Old" Covalent Mode Covalent/AdsorptiveDual Mode
1 20% Aqu. acetonitrile 10% Aqu. acetonitrile
2 Trifluoroacetic acid Trifluoroacetic acid
3 20% Aqu. TFA 20% Aqu. TFA
4 Auxiliary Auxiliary
5 10% PITC in acetonitrile 2% PITC in heptane
6 5% N-methyl rnorphiline 5% N-methyl morpholinein aqu. methanol in aqu. methanol
7 Ethyl acetate/heptane Ethyl acetate
8 Methanol Methanol
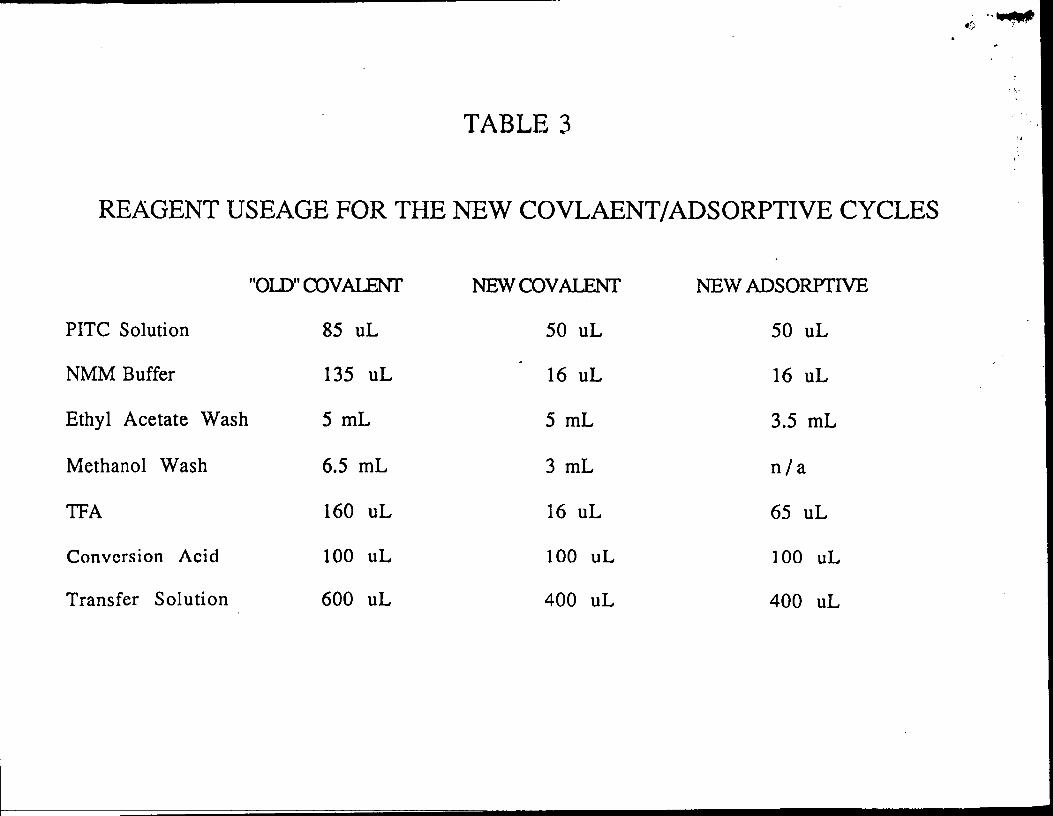
TABLE 3 "
REAGENT USEAGE FOR THE NEW COVLAENT/ADSORPTIVE CYCLES
"OtD" COVAt ._,rr NEW COV_,t ._NT NEW ADSORPTIVE
PITC Solution 85 uL 50 uL 50 uL
NMM Buffer 135 uL 16 uL 16 uL
Ethyl Acetate Wash 5 mL 5 mL 3.5 mL
Methanol Wash 6.5 mL 3 mL n/a
TFA 160 uL 16 uL 65 uL
Conversion Acid 100 uL 100 uL 100 uL
Transfer Solution 600 uL 400 uL 400 uL
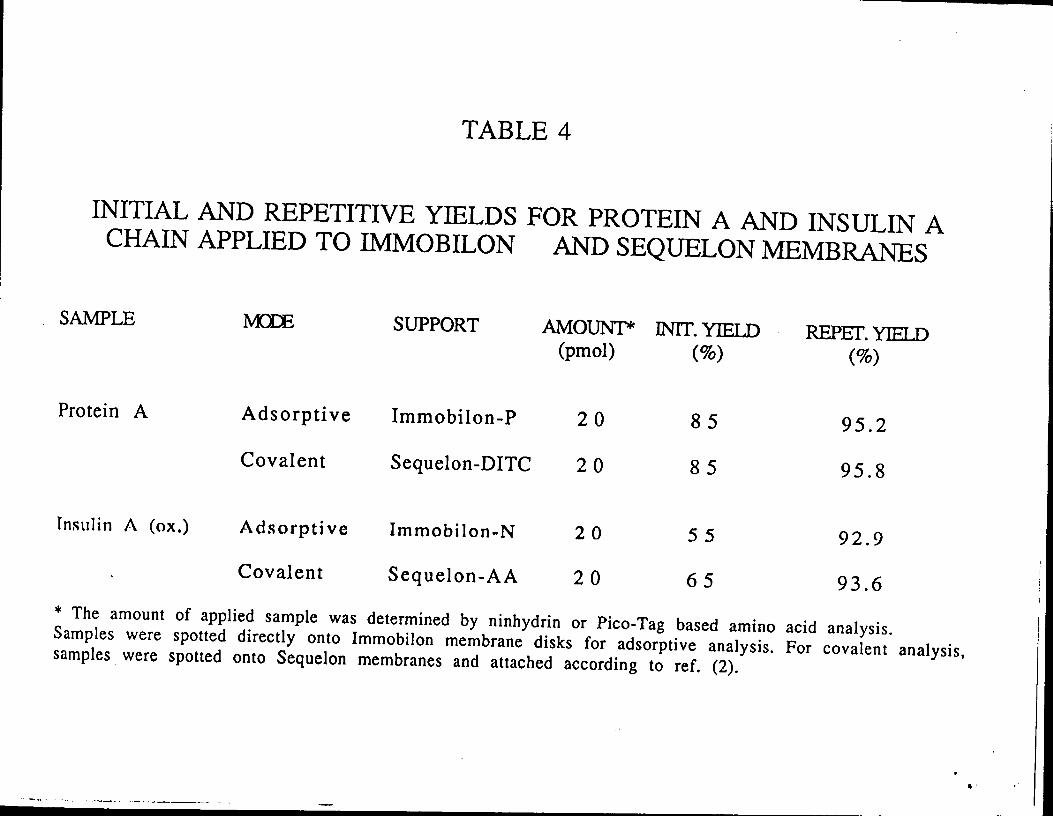
TABLE 4
INITIAL AND REPETITIVE YIELDS FOR PROTEIN A AND INSULIN ACHAIN APPLIED TO IMMOBILON AND SEQUELON MEMBRANES
SAMPLE lvI(I)E SUPPORT AMOUNT* INIT. YW.I.I_ REPEI'. Ylm.D(pmol) (%) (%)
Protein A Adsorptive Immobilon-P 2 0 8 5 95.2
Covalent Sequelon-DITC 2 0 8 5 95.8
Insulin A (ox.) Adsorptive Immobilon-N 20 5 5 92.9
Covalent Sequelon-AA 2 0 6 5 93.6
* The amount of applied sample was determined by ninhydrin or Pico-Tag based amino acid analysis.Samples were spotted directly onto Immobilon membrane disks for adsorptive analysis. For covalent analysis,samples were spotted onto Sequelon membranes and attached according to ref. (2).
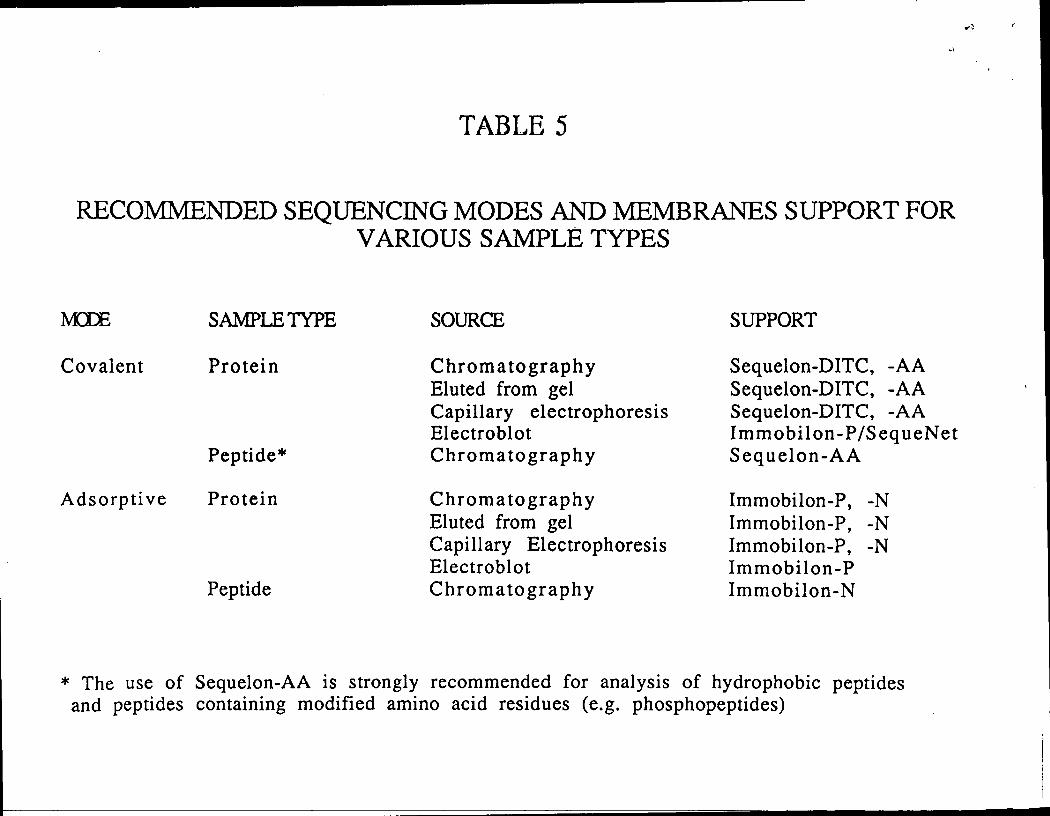
TABLE 5
RECOMMENDED SEQUENCING MODES AND MEMBRANES SUPPORT FORVARIOUS SAMPLE TYPES
h/K31_ SAMPI_ TYPE SOURCE SUPPORT
Covalent Protein Chromatography Sequelon-DITC, -AAEluted from gel Sequelon-DITC, -AACapillary electrophoresis Sequelon-DITC,-AAElectroblot Immobilon-P/SequeNet
Peptide* Chromatography Sequelon-AA
Adsorptive Protein Chromatography Immobilon-P, -NEluted from gel Immobilon-P, -NCapillary Electrophoresis Immobilon-P, -NElectroblot Immobilon-P
Peptide Chromatography Immobilon-N
* The use of Sequelon-AA is strongly recommended for analysis of hydrophobic peptidesand peptides containing modified amino acid residues (e.g. phosphopeptides)
i 1
./
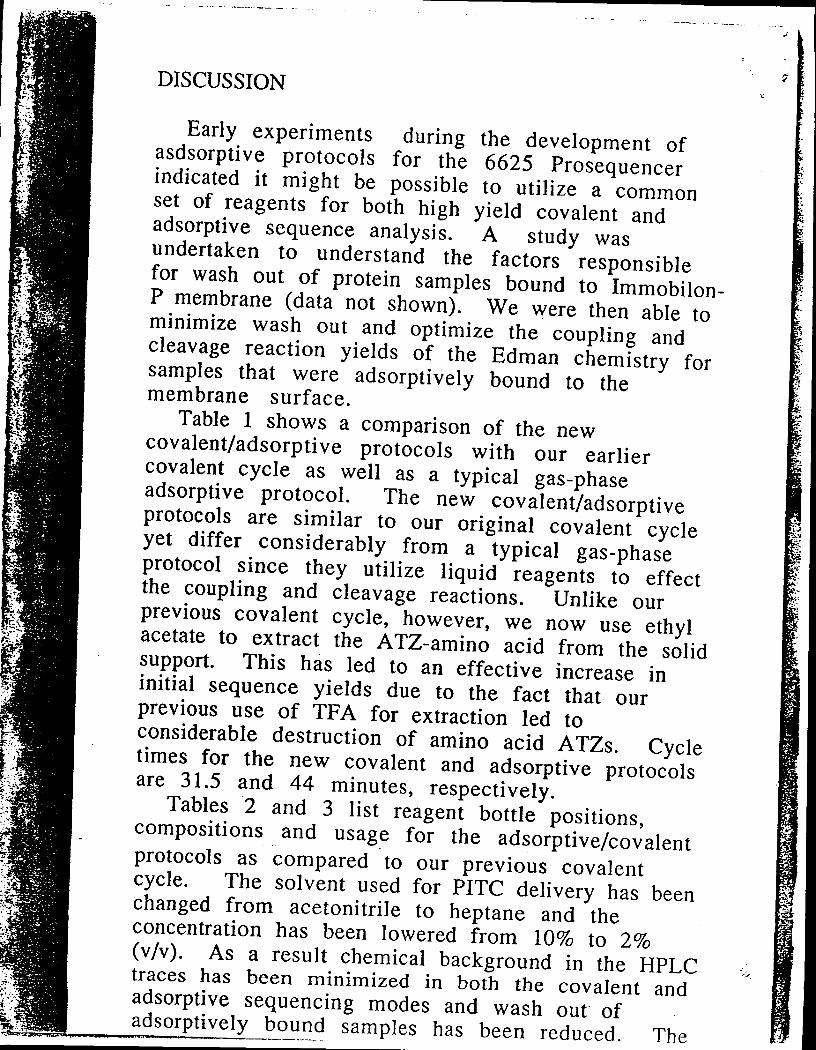
DISCUSSION
Early experiments during the development ofasdsorptive protocols for the 6625 Prosequencerindicated it might be possible to utilize a commonset of reagents for both high yield covalent andadsorptive sequence analysis. A study wasundertaken to understand the factors responsiblefor wash out of protein samples bound to Immobilon-P membrane (data not shown). We were then able tominimize wash out and optimize the coupling andcleavage reaction yields of the Edman chemistry forsamples that were adsorptively bound to themembrane surface.
Table 1 shows a comparison of the newcovalent/adsorptive protocols with our earliercovalent cycle as well as a typical gas-phaseadsorptive protocol. The new covalent/adsorptiveprotocols are similar to our original covalent cycleyet differ considerably from a typical gas-phaseprotocol since they utilize liquid reagents to effectthe coupling and cleavage reactions. Unlike ourprevious covalent cycle, however, we now use ethylacetate to extract the ATZ-amino acid from the solid
support. This has led to an effective increase ininitial sequence yields due to the fact that ourprevious use of TFA for extraction led toconsiderable destruction of amino acid ATZs. Cycletimes for the new covalent and adsorptive protocolsare 31.5 and 44 minutes, respectively.
Tables 2 and 3 list reagent bottle positions,compositions and usage for the adsorptive/covalent
protocols as compared to our previous covalentcycle. The solvent used for PITC delivery has beenchanged from acetonitrile to heptane and theconcentration has been lowered from 10% to 2%
(v/v). As a result chemical background in the HPLC %traces has been minimized in both the covalent and
adsorptive sequencing modes and wash out ofadsorptively bound samples has been reduced. The
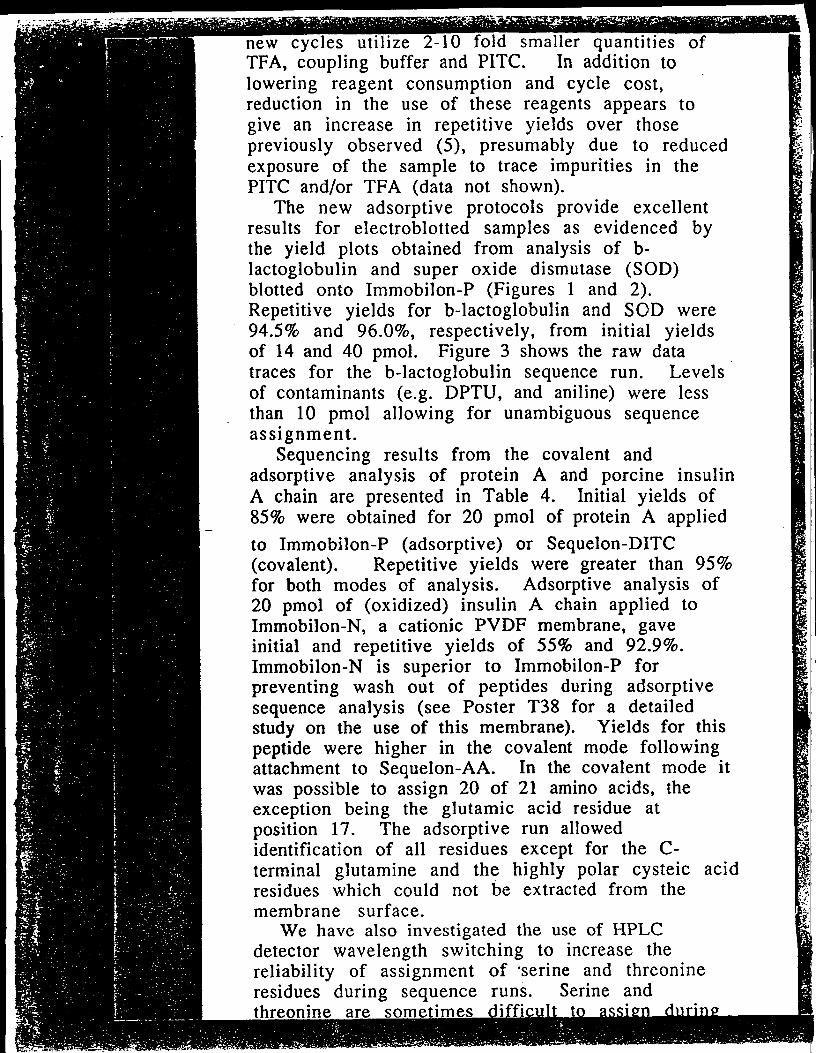
new cycles utilize 2-10 fold smaller quantities ofTFA, coupling buffer and PITC. In addition tolowering reagent consumption and cycle cost,reduction in the use of these reagents appears togive an increase in repetitive yields over thosepreviously observed (5), presumably due to reducedexposure of the sample to trace impurities in thePITC and/or TFA (data not shown).
The new adsorptive protocols provide excellentresults for electroblotted samples as evidenced bythe yield plots obtained from analysis of b-lactoglobulin and super oxide dismutase (SOD)blotted onto Immobilon-P (Figures 1 and 2).Repetitive yields for b-lactoglobulin and SOD were94.5% and 96.0%, respectively, from initial yieldsof 14 and 40 pmol. Figure 3 shows the raw datatraces for the b-lactoglobulin sequence run. Levelsof contaminants (e.g. DPTU, and aniline) were lessthan 10 pmol allowing for unambiguous sequenceassignment.
Sequencing results from the covalent andadsorptive analysis of protein A and porcine insulinA chain are presented in Table 4. Initial yields of85% were obtained for 20 pmol of protein A applied
to Immobilon-P (adsorptive) or Sequelon-DITC(covalent). Repetitive yields were greater than 95%for both modes of analysis. Adsorptive analysis of20 pmol of (oxidized) insulin A chain applied toImmobilon-N, a cationic PVDF membrane, gaveinitial and repetitive yields of 55% and 92.9%.Immobilon-N is superior to Immobilon-P forpreventing wash out of peptides during adsorptivesequence analysis (see Poster T38 for a detailedstudy on the use of this membrane). Yields for thispeptide were higher in the covalent mode followingattachment to Sequelon-AA. In the covalent mode itwas possible to assign 20 of 21 amino acids, theexception being the glutamic acid residue atposition 17. The adsorptive run allowedidentification of all residues except for the C-terminal glutamine and the highly polar cysteic acidresidues which could not be extracted from themembrane surface.
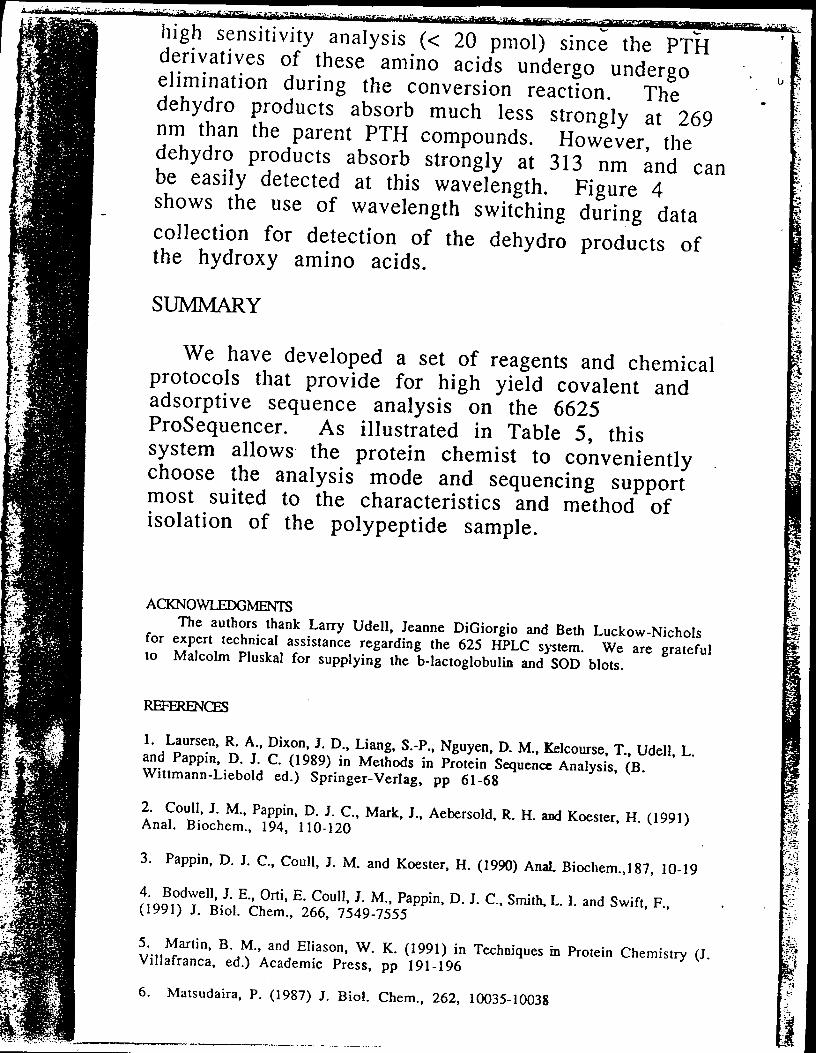
We have also investigated the use of HPLCdetector wavelength switching to increase thereliability of assignment of 'serine and threonineresidues during sequence runs. Serine andthreonine are sometime
, _ .k ?S._'.-_'_:_ "l:tf- _ i{:.>__'- " _.:._"_.__'_ : _L__._-'r__z_khg_:_'_r'..d:_ _ _; _'_ ._.==_._ "_'-_.;L.r_._-_:_:.:" "_il_,L_._.._.z_-_e_-':_'-_dt._B_li._ _-_¢.ZZ._ _,,._'_.,.:a"_lT_""mr_. _ _._a_'j_..Z_'_._, :
high sensitivity analysis (< 20 pmol) since the PTHderivatives of these amino acids undergo undergoelimination during the conversion reaction. Thedehydro products absorb much less strongly at 269nm than the parent PTH compounds. However, thedehydro products absorb strongly at 313 nm and canbe easily detected at this wavelength. Figure 4
_ shows the use of wavelength switching during datacollection for detection of the dehydro products ofthe hydroxy amino acids.
SUMMARY
We have developed a set of reagents and chemicalprotocols that provide for high yield covalent andadsorptive sequence analysis on the 6625ProSequencer. As illustrated in Table 5, thissystem allows the protein chemist to convenientlychoose the analysis mode and sequencing supportmost suited to the characteristics and method of
isolation of the polypeptide sample.
ACKNOWLEDGMENTS
The authors thank Larry Udell, Jeanne DiGiorgio and Beth Luckow-Nicholsfor expert technical assistance regarding the 625 HPLC system. We are gratefulto Malcolm Pluskal for supplying the b-lactoglobulia and SOD blots.
_f'b'Yl
1. Laursen, R. A., Dixon, J. D., Liang, S.-P., Nguyen, D. M., Kelcourse, T., Udell, L.and Pappin, D. J. C. (1989) in Methods in Protein Sequence Analysis, (B.Wittmann-Liebold ed.) Springer-Verlag, pp 61-68
2. Coull, J. M., Pappin, D. J. C., Mark, J., Aebersold, R. H. and Koester, H. (1991)Anal. Biochem., 194, 110-120
3. Pappin, D. J. C., Coull, J. M. and Koester, H. (1990) Anal. Biochem.,187, 10-19
4. Bodwell, J. E., Orti, E. Coull, J. M., Pappin, D. J. C., Smith, L. I. and Swift, F.,(1991) J. Biol. Chem., 266, 7549-7555
5. Martin, B. M., and Eliason, W. K. (1991) in Techniques in Protein Chemistry (J.
Villafranca, ed.) Academic Press, pp 191-196
6. Matsudaira, P. (1987) J. Biol. Chem., 262, 10035-10038