Embed Size (px)
Citation preview
0
E-CONTENT
EDU-C-301: Methodology of
Educational Research-I
Prepared By
Dr. Mohammad Sayid Bhat
Assistant Professor,
Department of Education,
Central University of Kashmir
Unit-IV: Sampling for Data Collection
Concept of Population and Sample Methods/ Strategies of Sampling: probability and Non-probability
Various techniques of Probability and Non-Probability Sampling
Sampling Distribution and Sampling Error
Characteristics of a good Sample

1
UNIVERSE OR POPULATION
Population, compilation, or set of things, items, or quantities (grouped together on
the basis of common or defining descriptions or characteristics) from which a representative
sample is drawn for relationship, comparison or measurement. The population
or universe embodies the entire group of units which is the centre of the study. Thus, the
population could consist of all the persons in the country, or those in a particular
topographical position, or a special cultural or economic group, depending on the rationale
and exposure of the study.
Thus, it is a total set of elements (persons or objects) that share some common
features defined by the sampling criterion established by the researcher. Population is
Comprised of two groups - target population & accessible population.
TARGET POPULATION
Target population is the total group of population units from which the sample is to
be drawn. A sample is the group of units who took part in research. Generalisability refers to
the degree to which we can correlate the findings of our research to the target
population we are concerned.
ACCESSIBLE POPULATION
Accessible population is the population in research to which the researchers can
correlate their conclusions. This population is a split or subset of the target population and
is also known as the study population. It is from the accessible population that researchers
draw their samples. Sample Group or Sampling.
SAMPLE
Sample is a subset of population containing same characteristics of a larger
population. Samples are used in statistical testing when population size is too big for the
test to include all members for observation. Sample should stand for the whole population
and not reflect prejudice toward a precise feature.

2
In the research methodology, realistic formulation of the research is important and
should be done very cautiously with proper attentiveness and in the occurrence of a very
good supervision.
But during the formulation of the research on the sensible grounds, one likely to go
through a large number of problems. These problems are normally related to the perceptive
of the descriptions of the universe or the population on the basis of studying the
characteristics of the exact part or some portion, generally called as the sample.
Thus, sampling is defined as the method or the practice consisting of selection for
the study of the part or the piece or the sample, with a view to describe conclusions or the
solutions about the universe or the population.
According to Mildred Parton, “Sampling method is the process or the method of
drawing a definite number of the individuals, cases or the observations from a particular
universe, selecting part of a total group for investigation.”
BASIC PRINCIPLES OF SAMPLING
Generally sampling is based on the following two laws:
Law of Statistical Regularity: The law is drawn from the mathematical theory of probability.
According to King, "Law of Statistical Regularity says that a moderately large number of the
items chosen at random from the large group are almost sure on the average to possess the
features of the large group.” According to this law the units of the sample must be selected
at random and all should represent the entire population.
Law of Inertia of Large Numbers: According to this law, the other thing is being equal: the
larger the size of the sample; the more accurate the results are likely to be.
CHARACTERISTICS OF THE SAMPLING TECHNIQUE
1. Much cheaper.
2. Much reliable.
3. Saves time.
4. Scientific in nature.
5. Very suitable for carrying out different surveys.
ADVANTAGES OF SAMPLING
1. Economical in nature.
2. High suitability ratio towards the different surveys.

3
3. In cases, when the population/universe is very large, then sampling method is the
only practical method for collecting the data.
4. Takes less time.
5. Very accurate.
6. Very reliable.
DISADVANTAGES OF SAMPLING
1. Untrained manpower.
2. Absence of informants.
3. Chances for bias.
4. Chances of committing errors in sampling.
5. Difficulty of getting representative sample.
6. Inadequacy of samples.
7. Problems of accuracy.
SAMPLE DESIGN
The sample design is prepared up of the following two elements:
Sampling method. Sampling method refers to the set of laws and measures by which
some elements of the population are included in the sample. Some common
sampling methods are simple random sampling , stratified sampling , and cluster
sampling, quota or judgment.
Estimator. The estimation procedure for calculating sample statistics is called the
estimator. Different sampling methods may use different estimators. For example,
the formula for computing a mean score with a simple random sample is different
from the formula for computing a mean score with a stratified sample. Similarly, the
formula for the standard error may vary from one sampling method to the next.
The best sample design is dependent upon survey objectives and on survey
resources. For example, a researcher might select the most economical design that gives a
required level of accuracy. Or, if the resources are limited, a researcher might select the
design that gives the greatest accuracy without going over financial plan.

4
CHARACTERISTICS OF A GOOD SAMPLE DESIGN
In a field study due to time constraint and finance involved, generally, only a section
of the population is considered. These respondents are identified as the sample and are
representative of the general population or universe. A sample design is a predetermined
plan for getting a sample from a population. It refers to the method or the process for
attaining a sample from a given population.
Following are some of the basic characteristics of good sample design:
Sample design should be a representative sample: A researcher relatively selects a small
number for a sample from an entire population. This sample is required to match all the
features of the entire population. If the sample selected in an experiment is a representative
one then it will assist to generalize the results from a small group to large one.
Sample design should possess small sampling error: Sampling error is an error caused by
taking a small sample instead of the entire population for the study. Sampling error refers to
the difference that may result from judging all on the basis of a small number. Sampling
error is condensed by selecting a large sample and by using proficient sample design and
inference approaches.
Sample design should be cost-effectively: Most of the research studies have a limited
budget known as research budget. The sampling should be done in a way that it is within
the research budget and should not be too expensive to be replicated.
Sample design should have no methodical bias: Methodical prejudice results from errors in
the sampling procedures which is very difficult to reduce or eliminate by increasing the
sample size. The best bet for researchers is to sense the causes and correct them.
Results attained from the sample should have the capacity to be generalized and
applicable to the whole population: The sampling design should be shaped keeping in view
that samples should cover the whole population of the study and is not limited to a part
only.
PROBABILITY SAMPLING
A probability sampling is any method of sampling that makes use of some form
of chance selection. In order to have a random selection method, a researcher must set up a
few process or procedure that guarantees the diverse units in your population have equal

5
chance of being selected. Researchers have long used various types of random selection,
like picking a name out of a box, or choosing the short straw. These days, we use computers
as the instrument for generating random numbers as the basis for random selection.
Before various probability methods are discussed, some basic terms used are given
here. These are:
N: number of cases in the sampling frame
n: number of cases in the sample
NCn: number of combinations (subsets) of n from N
f = n/N: sampling fraction
With those terms defined we can begin to define the different probability sampling
methods.
Simple Random Sampling
One of the simple form of random sampling is known as simple random sampling.
Here is the quick description of simple random sampling:
The objective is to select n units out of N such that each NCn has an equal chance of being
selected.
The procedure is: Use a table of random numbers, a computer random number generator,
or a mechanical device will be used to select the sample.
A somewhat pretentious, if precise, description. We should make it a little more
real. How do we select a simple random sample? For the sake of the example, say you want
to select 100 students to survey and that there were 1000 students in a school. Then, the
sampling fraction is f = n/N = 100/1000 = .10 or 10%. Now, to actually draw the sample, you
have several options. You could print off the list of 1000 students, tear then into separate

6
strips, put the strips in a box, mix them up real good, close your eyes and pull out the first
100. But this mechanical procedure would be boring and the quality of the sample would
depend on how methodically you mixed them up and how randomly you reached in.
Perhaps a better procedure would be to use the kind of ball machine that is popular with
many of the state lotteries. You would need three sets of balls numbered 0 to 9, one set for
each of the digits from 000 to 999 (if we select 000 we will call that 1000). Number the list of
names from 1 to 1000 and then use the ball machine to select the three digits that selects
each person. The obvious disadvantage here is that you need to get the ball machines.
Neither of these mechanical measures is very practicable and with the development
of low-cost computers there is a much easier way. Here is a simple practice that is
particularly useful if you have the names of the clients already on the computer. Many
computer programmes can create a series of random numbers. Suppose you can copy and
paste the list of client names into a column in an EXCEL spreadsheet. Then, in the column
right next to it paste the function =RAND() which is EXCEL's way of putting a random
number between 0 and 1 in the cells. Then, sort both columns: the list of names and the
random number- by the random numbers. This rearranges the list in random order from the
lowest to the highest random number. Then, all you have to do is take the first hundred
names in this sorted list. pretty simple. You could probably accomplish the whole thing in
shorter period of time.
Simple random sampling is simple to achieve and is simple to describe to others.
Because simple random sampling is a good way to select a sample, it is rational to generalize
the results from the sample back to the population. Simple random sampling is not the most
statistically well-organized method of sampling, just because of the luck of the draw, not get
good representation of subgroups in a population. To deal with these problems, we have to
turn to other sampling methods.
Stratified Random Sampling
Stratified Random Sampling, also at times known as proportional or quota random
sampling, involves separating population into uniform subgroups and then taking a simple
random sample in each subgroup. In more proper terms, it is illustrated as below:

7
Objective: Divide the population into non-overlapping groups (i.e., strata) N1, N2, N3, ... Ni,
such that N1 + N2 + N3 + ... + Ni = N. Then do a simple random sample of f = n/N in each
strata.
There are various key reasons why you should favour stratified sampling over simple
random sampling. First, it promises that you will be in a position to signify not only the
entire population, but also key subgroups of the population, particularly small marginal
groups. If you want to be in a position to talk about subgroups, this may be the only way to
assure efficiently you will be able to. If the subgroup is enormously small, you can use
diverse sampling fractions (f) within the different strata to randomly over-sample the small
group (although you will then have to ponder the within-group estimates using the sampling
division at any time you want on the whole population estimates). When we use the same
sampling fraction within strata we are conducting balanced stratified random sampling.
When we employ different sampling fractions in the strata, we call this unequal stratified
random sampling. Second, stratified random sampling will usually have additional statistical
accuracy than simple random sampling. This will only be accurate if the strata or groups are
uniform. If they are, we anticipate that the inconsistency within-groups is lower than the
unevenness for the population as a whole. Stratified sampling take advantages on that fact.
For example, suppose the population of teachers for our area can be divided into
three groups: Kashmiri, tribal and pandith and if we assume that both the tribal and pandith
are relatively small minorities of the clientele (10% and 5% respectively). If we just did a

8
simple random sample of n=100 with a sampling fraction of 10%, we would expect by
chance single-handedly that we would only get 10 and 5 persons from each of our two
smaller groups. And, by chance, we could get fewer than that. If we stratify, we can do
better. First, we should decide how many people we want to have in each group. Say for
example we still want to take a sample of 100 from the population of 1000 teachers. But we
think that in order to say something about subgroups we need at least 25 cases in each
group. So, say sample 50 Kashmiri, 25 Tribals, and 25 Pandiths. We know that 10% of the
population, or 100 teachers, are Kashmiri. If we randomly sample 25 of these, we have a
within-stratum sampling fraction of 25/100 = 25%. Similarly, we know that 5% or 50
teachers are Tribals. So our within-stratum sampling fraction will be 25/50 = 50%. Finally, by
subtraction we know that there are 850 Kashmiri teachers. Our within-stratum sampling
fraction for them is 50/850 = about 5.88%. Because the groups are more uniform within-
group than from the population as a whole, we anticipate greater statistical accuracy. And,
because we have stratified population, we know we will have sufficient cases from each
group to make meaningful subgroup deductions.
Systematic Random Sampling
Here are the steps you require to go after in order to attain a systematic random
sample:
number the units in the population from 1 to N
decide on the n (sample size) that you want or need
k = N/n = the interval size
randomly select an integer between 1 to k
then take every kth unit

9
All of this will be much vivid with an example. assume that we have a population that
only has N=100 people in it and that you desire to take a sample of n=20. To use systematic
sampling, the population must be listed in a random order. The sampling fraction would be f
= 20/100 = 20%. in this case, the interval size, k, is equal to N/n = 100/20 = 5. Now, select a
random integer from 1 to 5. In our example, envisage that you chose 4. Now, to select the
sample, start with the 4th unit in the list and take every k-th unit (every 5th, because k=5).
You would be sampling units 4, 9, 14, 19, and so on to 100 and you would wind up with 20
units in your sample.
For this to work, it is necessary that the units in the population are by chance
ordered, at least with respect to the features you are measuring. Why would you still want
to use systematic random sampling? For one thing, it is quite easy to do. You only have to
choose a single random number to start things off. It may also be more accurate than simple
random sampling. Finally, in some cases there is simply no easier way to do random
sampling. For instance, a study that involved sampling from all the books in a library. Once
selected, would have to go to the shelf, set the book, and record when it is last distributed. I
knew that I had a reasonably good sampling frame in the shape of the shelf list (which is a
card catalogue where the entries are made in the order they happen on the shelf). To do a
simple random sample, I could have estimated the total number of books and generated
random numbers to draw the sample; but how would I find book A easily if that is the
number I selected? I could not very well calculate the cards until I came to A. Stratifying

10
would not resolve that problem either. For instance, I could have stratified by card
catalogue drawer and drawn a simple random sample within each drawer. But I would still
be caught counting cards. Instead, I did a systematic random sample. I estimated the
number of books in the entire compilation. Imagine it was 100,000. I decided that I required
to take a sample of 1000 for a sampling fraction of 1000/100,000 = 1%. To get the sampling
interval k, I divided N/n = 100,000/1000 = 100. Then I selected a random integer between 1
and 100. Say for instance, I got 57. Next I did a little side study to decide how thick a
thousand cards are in the card catalogue (taking into account the varying ages of the cards).
Say that on average I found that two cards that were separated by 100 cards were about
0.75 inches apart in the catalogue drawer. That information gave me the whole thing I
needed to draw the sample. I counted to the 57th by hand and recorded the book
information. Then, I took a range. Then I set the compass at .75", stuck the pin end in at the
57th card and sharp with the pencil end to the next card (approximately 100 books away). In
this way, I approximated selecting the 157th, 257th, 357th, and so on. I was able to achieve
the whole selection process in very modest time using this systematic random sampling
approach. I would most likely still be there counting cards if I would have tried another
random sampling method.
Cluster Random Sampling
This is also known as area sampling. The problem with random sampling methods
when we have to sample a population that is disbursed from corner to corner a wide area is
that you will have to cover a lot of ground geographically in order to get to each of the units
you sampled. Visualize taking a simple random sample of all the residents of Kashmir in
order to have personal interviews. By the chance of the draw you will wind up with
respondents who come from all over the valley. Your interviewers are going to have a lot of
travelling to do. It is for accurately this problem that cluster or area random sampling was
invented.
In cluster sampling, we follow these steps:
divide population into clusters (usually along geographic boundaries)
randomly sample clusters

11
measure all units within sampled clusters
For instance, in the figure we see a map of Kashmir valley. Suppose say that we have
to do a survey of town governments that will require us going to the towns personally. If we
do a simple random sample state-wide we will have to cover the whole state geographically.
Instead, we make a decision to do a cluster sampling of five districts. Once these are
selected, we go to every town government in the five areas. Clearly this approach will help
us to cut down our mileage. Cluster or area sampling, then, is helpful in situations like this,
and is done mainly for effectiveness of management. Note also, that we probably do not
have to be anxious about using this approach if we are conducting a mail or telephone
survey because it does not matter as much where we call or send letters to.
Multi-Stage Sampling
The four methods we have deliberated upon so far, simple, stratified, systematic and
cluster are the simplest random sampling approaches. In most authentic applied social
research, we would use sampling methods that are significantly more composite than these
simple variations. The most important principle here is that we can unite the simple
methods explained previously in a variety of useful ways that help us to address our
sampling requirements in the most proficient and successful manner possible. When we
combine sampling methods, we call this multi-stage sampling.
For example, consider the idea of sampling Kashmiri residents for face-to-face
interviews. Clearly we would want to do some type of cluster sampling as the first stage of

12
the course. We might sample townships or census areas all over the valley. But in cluster
sampling we would then go on to determine everyone in the clusters we select. Even if we
have sampling census tracts we may not be able to assess everyone who is in the census
tract. So, we might set up a stratified sampling procedure within the clusters. In this case,
we would have a two-stage sampling method with stratified samples within cluster samples.
Or, consider the problem of sampling students in grade schools. We might begin with a state
sample of school districts stratified by economics and educational level. Within selected
districts, we might do a simple random sample of schools. Within schools, we might do a
simple random sample of classes or grades. And, within classes, we might even do a simple
random sample of students. In this case, we have three or four stages in the sampling
practice and we employ both stratified and simple random sampling. By mixing various
sampling methods we are able to attain a rich array of probabilistic sampling methods that
can be used in a wide range of social research situations.
NON-PROBABILITY SAMPLING
The difference between non-probability and probability sampling is that non-
probability sampling does not engage random selection and probability sampling does. Does
that mean that non-probability samples are not representative of the population? Not
necessarily. But it does signify that non-probability samples cannot depend upon the
justification of probability premise. At least with a probabilistic sample, we know the odds
or probability that we have represented the population well. We are able to approximate
confidence intervals for the statistic. With non-probability samples, we may or may not
represent the population well, and it will often be tough for us to know how well we have
done so. In general, researchers prefer probabilistic or random sampling methods over non-
probabilistic ones, and consider them to be more perfect and meticulous. However, in
applied social research there may be situations where it is not practicable, realistic or
theoretically sagacious to do random sampling. Here, we consider a wide range of non-
probabilistic alternatives.
We can divide non-probability sampling methods into two broad types: accidental or
purposive. Most sampling methods here have purposive nature because we usually advance
the sampling problem with a precise plan in mind. The most important differences among

13
these types of sampling methods are the ones among the various types of purposive
sampling techniques.
Accidental, Convenience or Haphazard Sampling
The most general methods of non-probability sampling goes under the various
names. In this category the traditional man on the street or person on the street. interviews
conducted frequently by television news programmes to get a quick (although non-
representative) reading of public opinion. I would also disagree that the classic exercise of
college students in much psychological research is mainly a matter of convenience. In
medical practice, we might employ clients who are accessible to us as our sample. In many
research background, we sample merely by asking for volunteers. Clearly, the problem with
all these types of samples is that we have no proof that they are the real representatives of
the populations we are concerned in generalizing the results and in many cases we would
clearly suspect that they are not.
Purposive Sampling
Here more precise predefined groups we are looking for. For example, have you ever
run into people on the street who carry a clipboard and who stop various people and ask if
they could interview them? Most likely they are conducting a purposive sample (and most
probably they are occupied in market research). They might be looking for Kashmiri males
between 30-40 years old. They appraise the people passing by and anybody who looks to be
in that category they stop him to ask if he will take part. One of the first things they are
likely to do is authenticate that the respondent does meet the criterion for being in the
sample. Purposive sampling can be very helpful for circumstances where you need to
accomplish a targeted sample swiftly and where sampling for proportionality is not the main
concern. With a purposive sample, you are likely to get the judgments of your target
population, but you are also likely to overweight subgroups in your population that are
more willingly reachable.
All of the techniques that follow can be considered subcategories of purposive
sampling methods. We might sample for definite groups or types of people as in modal
instance, expert, or quota sampling. We might sample for multiplicity as in heterogeneity

14
sampling. Or, we might take advantage of on casual social networks to recognize precise
respondents who are tough to get contacted otherwise, as in snowball sampling. In all of
these techniques we know what we desire to we are sampling with a rationale.
Modal Instance Sampling
In statistics, the mode is the most commonly happening value in a distribution. In
sampling, when we do a modal instance sample, we are sampling the most common case, or
the typical case. In a lot of casual public opinion polls, for instance, they interview a typical
voter. There are a number of problems with this sampling technique. First, how do we know
what the typical or modal case? We could say that the modal voter is a person who is of
average age, educational level, and income in the population. But, it is not apparent that
using the averages of these is the reasonable (consider the skewed distribution of income,
for instance). And, how do you know that those three variables- age, education, income are
the solitary or even the most pertinent for categorizing the distinctive voter? What if
religion or ethnicity is an important discriminator? Clearly, modal illustration sampling is
only rational for casual sampling situations.
Expert Sampling
Expert sampling involves the collecting of a sample of persons with recognized or
verifiable knowledge and know-how in some area. Often, we organize such a sample under
the patronage of a panel of experts. There are in fact two reasons for having expert
sampling. First, because it would be the excellent way to obtain the views of persons who
have particular expertise. In this case, expert sampling is fundamentally just a exact sub case
of purposive sampling. But the other reason you might use expert sampling is to offer proof
for the legitimacy of another sampling technique you have selected. For instance, say you
do modal instance sampling and are worried that the criterion you have used for defining
the modal instance are subject to disapproval. You might arrange an specialist board
consisting of persons with recognized experience and insight into that area or topic and ask
them to scrutinize your modal definitions and remark on their suitability and strength. The
benefit of doing this is that you are not out on your own trying to shield your conclusions
you have some accredited experts to back you. The weakness is that even the experts can
be wrong.

15
Quota Sampling
In quota sampling, the researcher selects people non-randomly according to some
predetermined quota. There are two types of quota sampling: proportional and non
proportional. In proportional quota sampling the researcher wants to represent the main
characteristics of the population by sampling a proportional quantity of each. For instance, if
the researcher knows the population has 40% women and 60% men, and that he wants a
total sample size of 100, he will continue sampling until he gets those percentages and then
will stop. So, if he has already got the 40 women for his sample, but not the sixty men, he
will continue to sample men but even if genuine women respondents come along, he will
not sample them because he has already met his quota. The problem here (as in much
purposive sampling) is that he has to decide the specific features on which he will stand the
quota. Will it be by gender, age, education race, religion, etc.
Non-proportional quota sampling is a bit unrestricted. In this technique, the
researcher specifies the minimum number of sampled units he wants in each category.
here, he is not worried about having numbers that match the magnitude in the population.
Instead, he simply wants to have sufficient to guarantee that ge will be able to talk about
even small groups in the population. This method is the non-probabilistic analogue of
stratified random sampling in that it is characteristically used to reassure that smaller
groups are sufficiently represented in his sample.
Heterogeneity Sampling
We sample for heterogeneity when we want to incorporate all opinions or views,
and we are not concerned about representing these views proportionately. Another term
for this is sampling for variety. In many brainstorming or small group processes (including
concept mapping), we would employ some form of heterogeneity sampling because our
main concern is in getting broad range of information, not identifying the average or modal
instance ones. In consequence, what we would like to be sampling is not people, but ideas.
We imagine that there is a cosmos of all probable information pertinent to some theme and
that we want to sample this population, not the population of people who have the ideas.
Obviously, in order to get all of the ideas, and especially the outlier or strange ones, we have
16
to include a broad and varied range of participants. Heterogeneity sampling is, in this sense,
approximately the contradictory of modal instance sampling.
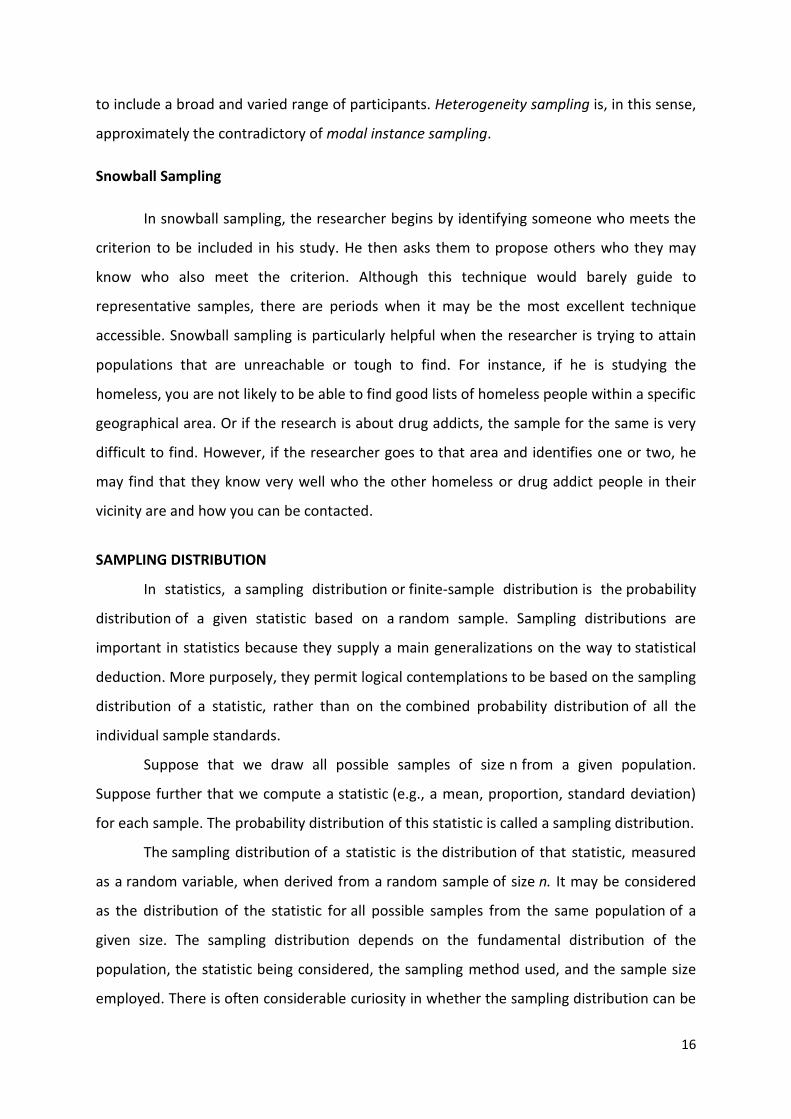
Snowball Sampling
In snowball sampling, the researcher begins by identifying someone who meets the
criterion to be included in his study. He then asks them to propose others who they may
know who also meet the criterion. Although this technique would barely guide to
representative samples, there are periods when it may be the most excellent technique
accessible. Snowball sampling is particularly helpful when the researcher is trying to attain
populations that are unreachable or tough to find. For instance, if he is studying the
homeless, you are not likely to be able to find good lists of homeless people within a specific
geographical area. Or if the research is about drug addicts, the sample for the same is very
difficult to find. However, if the researcher goes to that area and identifies one or two, he
may find that they know very well who the other homeless or drug addict people in their
vicinity are and how you can be contacted.
SAMPLING DISTRIBUTION
In statistics, a sampling distribution or finite-sample distribution is the probability
distribution of a given statistic based on a random sample. Sampling distributions are
important in statistics because they supply a main generalizations on the way to statistical
deduction. More purposely, they permit logical contemplations to be based on the sampling
distribution of a statistic, rather than on the combined probability distribution of all the
individual sample standards.
Suppose that we draw all possible samples of size n from a given population.
Suppose further that we compute a statistic (e.g., a mean, proportion, standard deviation)
for each sample. The probability distribution of this statistic is called a sampling distribution.
The sampling distribution of a statistic is the distribution of that statistic, measured
as a random variable, when derived from a random sample of size n. It may be considered
as the distribution of the statistic for all possible samples from the same population of a
given size. The sampling distribution depends on the fundamental distribution of the
population, the statistic being considered, the sampling method used, and the sample size
employed. There is often considerable curiosity in whether the sampling distribution can be

17
approximated by an asymptotic distribution, which matches up to the restrictive case either
as the number of random samples of limited size, taken from an unlimited population and
used to generate the distribution, tends to infinity, or when just one equally-infinite-size
sample is taken of that same population.
SAMPLING ERROR
In statistics, sampling error consigns to the amount of inaccuracy that is estimated to
exist within a sample population of the attribute being measured. More simply put, since
psychological and social science experiments employ samples of people or animals during
experiments (since we clearly cannot use the whole human population), it is conventional
that a sample population does not totally reproduce the exact actuality of the population as
a whole. Therefore, a sampling error is calculated to reveal how true the results of a study
basically are.
STANDARD ERROR
A standard error is the standard deviation of the sampling distribution of a statistic.
Standard error is a statistical name that measures the correctness with which a sample
represents a population. In statistics, a sample mean deviates from the real mean of a
population, this deviation is the standard error.
Breaking Down Standard Error
The term standard error is used to denote to the standard deviation of a variety of
sample statistics such as the mean or median. For example, the standard error of the mean
refers to the standard deviation of the distribution of sample means taken from a
population. The smaller the standard error the more representative the sample will be of
the whole population.
The standard error is also contrariwise proportional to the sample size; the larger the
sample size, the smaller the standard error because the statistic will advance the real value.
The standard error is considered part of descriptive statistics. It represents the
standard deviation of the mean within a dataset. This provides as a measure of variation for
random variables, providing a measurement for the spread. The smaller the spread, the
more true the dataset is said to be.
Standard Error and Population Sampling

18
When a population is sampled, the mean, or average, is generally calculated. The
standard error may include the difference between the calculated mean of the population
and the actual mean of the population. This helps reimburse for any minor inaccuracies
related the gathering of the data from the sample. In cases where multiple samples are
collected, the mean of each sample may vary a little from the others, creating a stretch
among the variables. This stretch is most often measured as the standard error, accounting
for the differences between the means across the datasets. The more data points involved
in the calculations of the mean, the smaller the standard error tends to be. When the
standard error is small, the data is said to be more representative of the true mean. In cases
where the standard error is big, the data may have some noteworthy abnormalities.
Standard Deviation and Standard Error
The standard deviation is a depiction of the spread of each of the data points. The
standard deviation is used to help determine authenticity of the data based the number of
data points displayed within each level of standard deviation. Standard error functions more
as a way to determine the correctness of the sample or the exactness of multiple samples
by analyzing deviation within the means.
REFERENCES
Aggarwal, Y.P. (1998), The Science of Educational Research: A Source Book, Nirmal,
Kurukshetra.
Best, john W. and Kahn James V (1995), Research in Education, Prentice Hall, New
Delhi.
Burns, R.B. (1991), Introduction to Research in Education , prentice Hall, New Delhi.
Good, C.V. and Douglas, E. Scats (1954), Methods in Social Research , McGraw Hill,
New York.
Kerlinger, F.N. (1973), Foundation of Behavioral Research, Holt, Rinehart and
Winston, New York.
Koul, Lokesh (1988), Methodology of Educational Research, Vikas, New Delhi.
McMillan, James H. and Schumarcher, S. (1989), Research on Education: A
Conceptual Introduction, Harper and Collins, New York.
Mouly, A.J. (1963), The Science of Educational Research, Eurasia, New Delhi.

19
Neuman, W.L. (1997), Social Research Methods: Qualitative and Quantitative
Approaches, Allyn and Bacon, Boston
Travers, R.M.W. (1978), An Introduction to Educational Research, McMillan, New
York.
Van Dalen, D.B.(1962), Understanding Educational Research , McGraw Hill , New
York.
Ruane, Janet M (2004), Essentials of Research Methods to Social Science Research,
Blackwell Publications Ltd.


![HNgoztechnika.hu/keszletlista/pdf/572.pdf · 0puphfvwvh nnfrv]dniwovdr +dwwipnun,p2h6 u '1 )7 )7 )7 )7 )7 edu edu edu edu edu edu edu edu edu](https://img.pdfslide.net/doc/110x75/5fc6730ab5393d30f166460f/0puphfvwvh-nnfrvdniwovdr-dwwipnunp2h6-u-1-7-7-7-7-7-edu-edu-edu-edu-edu.jpg)