Embed Size (px)
DESCRIPTION
Organisation for Economic Co-operation and Development (OECD). Education at a Glance 2007 Key results for Hungary. Michael Davidson Senior Analyst, OECD Education Directorate 18 September 2007. Quantity and quality challenges. - PowerPoint PPT Presentation
Citation preview

111111
Education at a Glance 2007Key results for Hungary
Organisation for Economic Co-operation and Development (OECD)
Michael DavidsonSenior Analyst, OECD Education Directorate
18 September 2007
2222
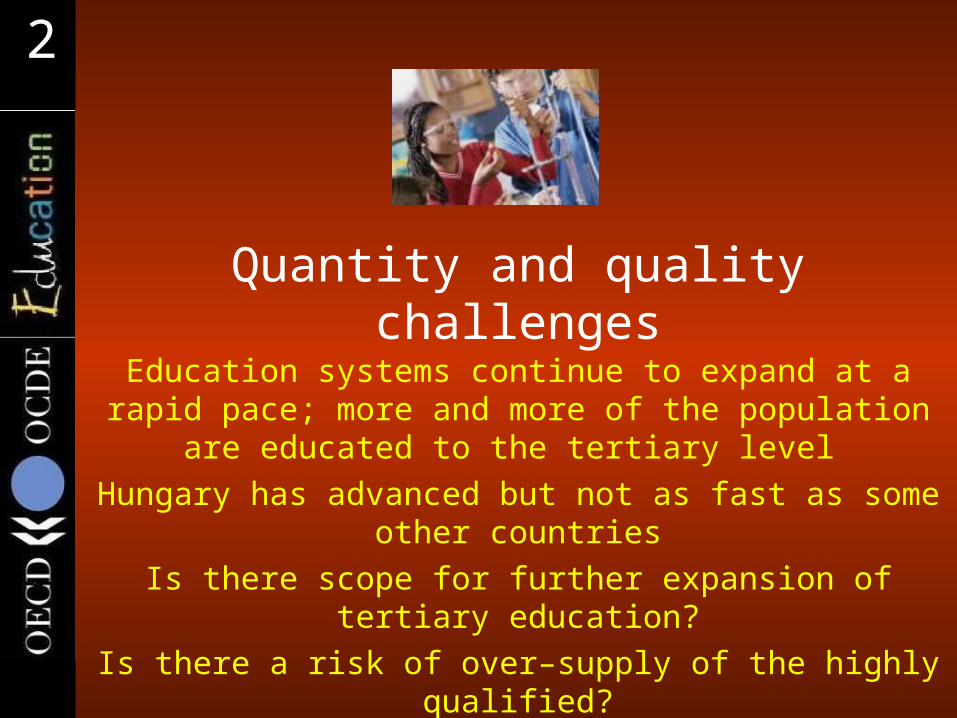
Quantity and quality challenges
Education systems continue to expand at a rapid pace; more and more of the population are educated
to the tertiary level Hungary has advanced but not as fast as some other
countriesIs there scope for further expansion of tertiary
education?Is there a risk of over–supply of the highly qualified?
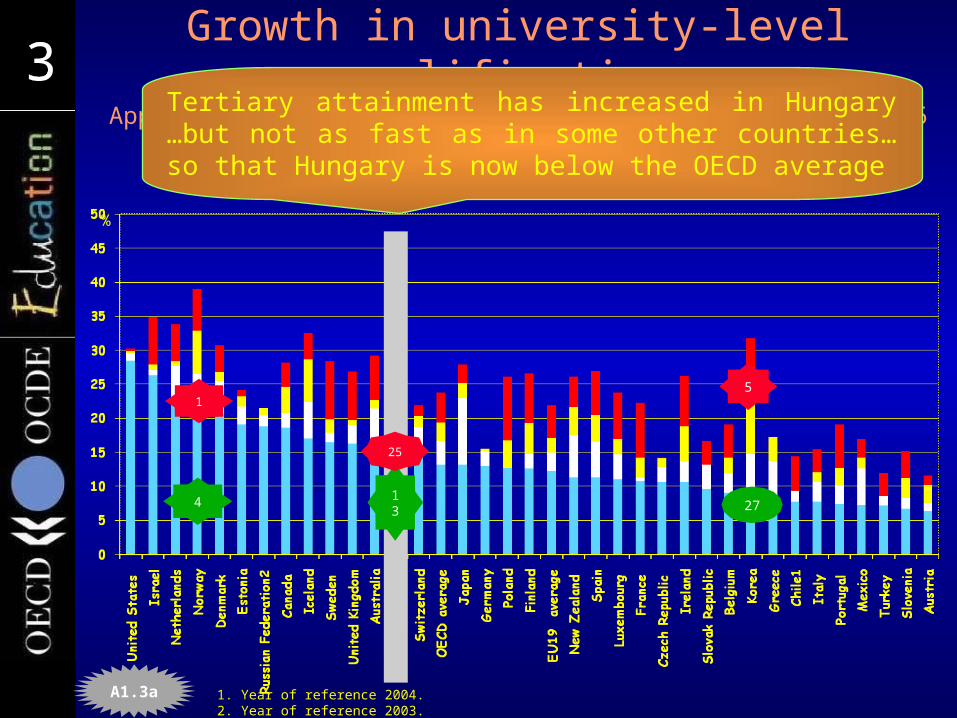
333333 Growth in university-level qualificationsApproximated by the percentage of persons with ISCED 5A/6
qualification born in the age groups shown below (2005)
%
A1.3a 1. Year of reference 2004.2. Year of reference 2003.
13
25
27
5
4
1
Tertiary attainment has increased in Hungary …but not as fast as in some other countries…so that Hungary is now below the OECD average
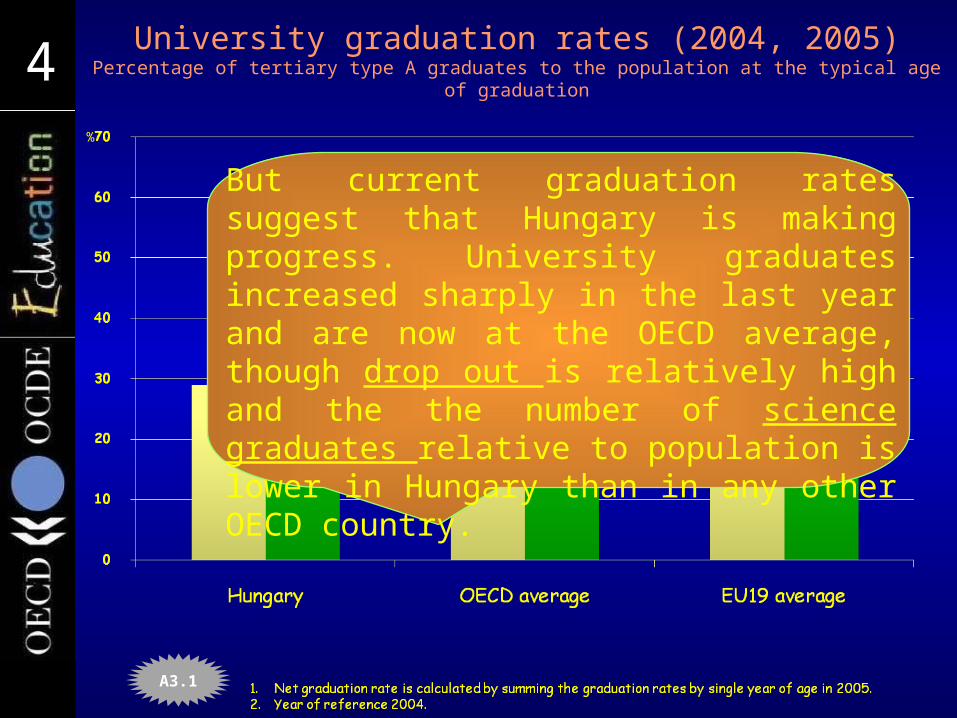
444444 University graduation rates (2004, 2005)Percentage of tertiary type A graduates to the population at the typical age of graduation
%
A3.1
But current graduation rates suggest that Hungary is making progress. University graduates increased sharply in the last year and are now at the OECD average, though drop out is relatively high and the the number of science graduates relative to population is lower in Hungary than in any other OECD country.
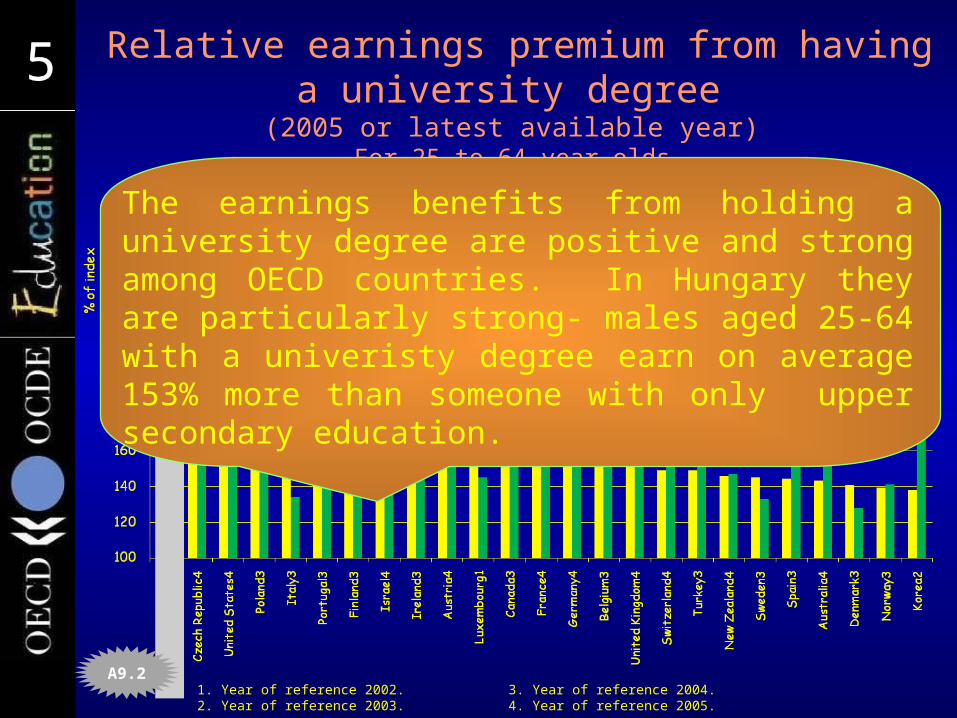
555555
A9.2
Relative earnings premium from having a university degree
(2005 or latest available year) For 25-to-64-year-olds
(upper secondary education= 100).
1. Year of reference 2002. 3. Year of reference 2004.2. Year of reference 2003. 4. Year of reference 2005.
The earnings benefits from holding a university degree are positive and strong among OECD countries. In Hungary they are particularly strong- males aged 25-64 with a univeristy degree earn on average 153% more than someone with only upper secondary education.
777777Is there a danger in producing
too many highly qualified people?
Analysis of this year’s indicators show that: In countries that have expanded tertiary
education the labour market benefits of attaining a tertiary degree are still strong
No evidence that tertiary expansion damages the labour market prospects of the less qualified (no “crowding out”)
On the contrary, it seems that the least educated individuals benefit in terms of better unemployment opportunities when more people go into higher education.
8888
Equity challenges
Achieving strong baseline qualifications is a cornerstone of equity.
Strong expansion of secondary education in HungaryBut penalties for those who miss out are significantEquity concerns in the Hungarian education system
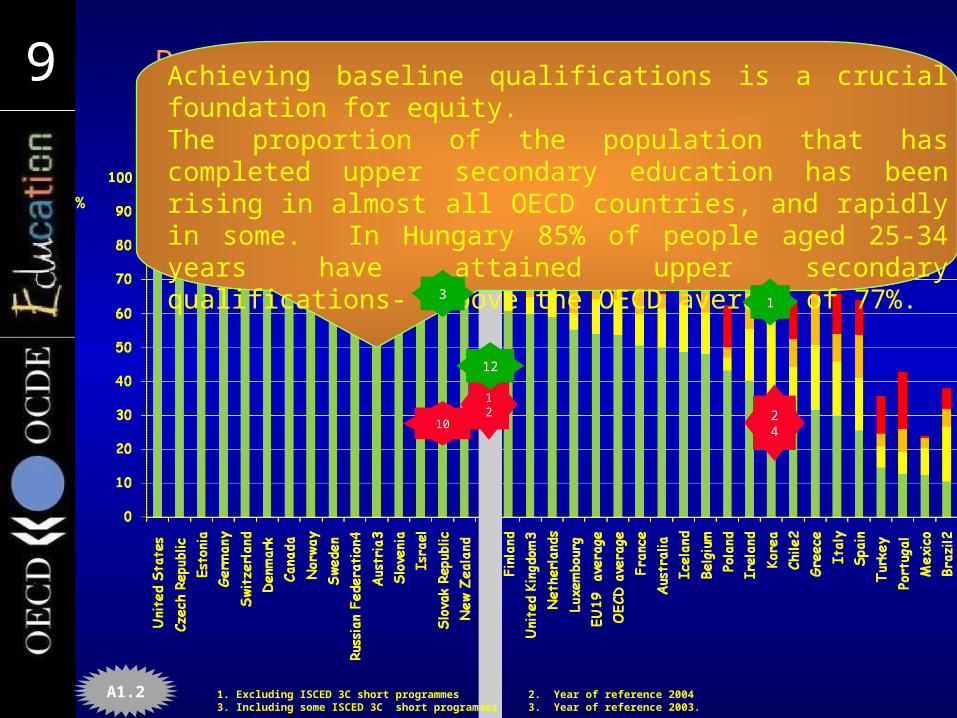
999999 Population that has attained at least upper secondary education (2005)
Percentage by age group
%
A1.2 1. Excluding ISCED 3C short programmes 2. Year of reference 20043. Including some ISCED 3C short programmes 3. Year of reference 2003.
Achieving baseline qualifications is a crucial foundation for equity.The proportion of the population that has completed upper secondary education has been rising in almost all OECD countries, and rapidly in some. In Hungary 85% of people aged 25-34 years have attained upper secondary qualifications- above the OECD average of 77%.
12
12
24
10
31
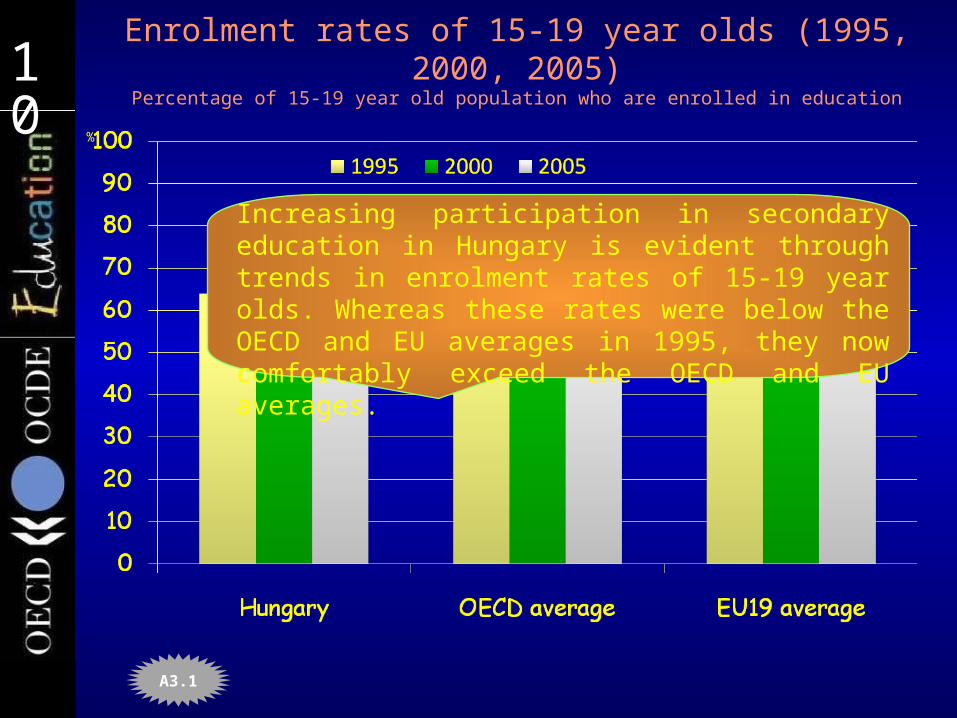
101010101010Enrolment rates of 15-19 year olds (1995, 2000,
2005)Percentage of 15-19 year old population who are enrolled in education
%
A3.1
Increasing participation in secondary education in Hungary is evident through trends in enrolment rates of 15-19 year olds. Whereas these rates were below the OECD and EU averages in 1995, they now comfortably exceed the OECD and EU averages.
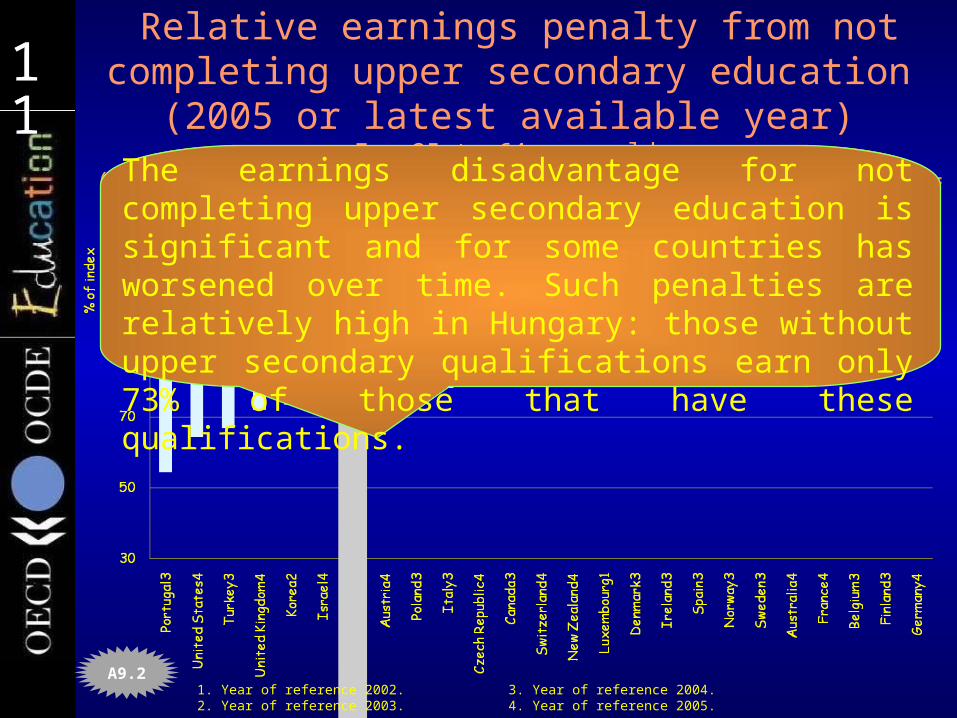
111111111111
A9.2
Relative earnings penalty from not completing upper secondary education
(2005 or latest available year) For 25-to-64-year-olds
(upper secondary and post-secondary non-tertiary education= 100).
1. Year of reference 2002. 3. Year of reference 2004.2. Year of reference 2003. 4. Year of reference 2005.
The earnings disadvantage for not completing upper secondary education is significant and for some countries has worsened over time. Such penalties are relatively high in Hungary: those without upper secondary qualifications earn only 73% of those that have these qualifications.
121212121212
0
5
10
15
20
25
30
35
40
45
Sw
eden
Den
mar
k
Uni
ted
Sta
tes
Fin
land
Sw
itze
rlan
d
Uni
ted
Kin
gdom
Can
ada
Slo
vak
Rep
ublic
Fra
nce
Aus
tria
Bel
gium
Luxe
mbou
rg
Ger
man
y
Cze
ch R
epub
lic
Irel
and
Net
herl
ands
Pola
nd
Port
ugal
Spa
in
Hun
gary
Ital
y
Gre
ece
OECD
ave
rage
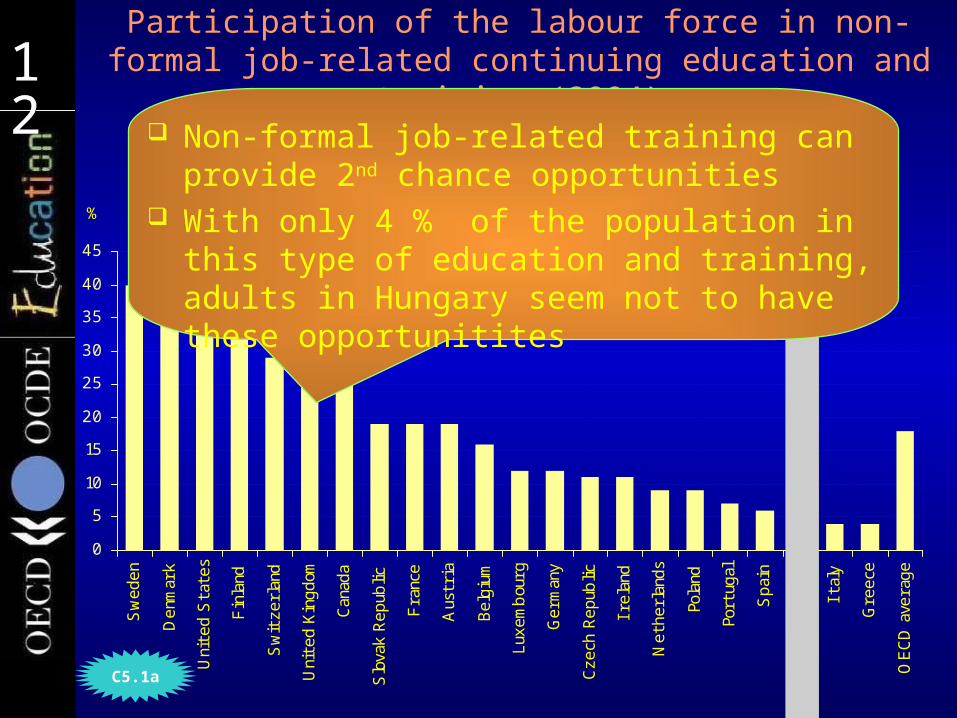
Participation of the labour force in non-formal job-related continuing education and training (2004)
%
Non-formal job-related training can provide 2nd chance opportunities
With only 4 % of the population in this type of education and training, adults in Hungary seem not to have these opportunitites
C5.1a
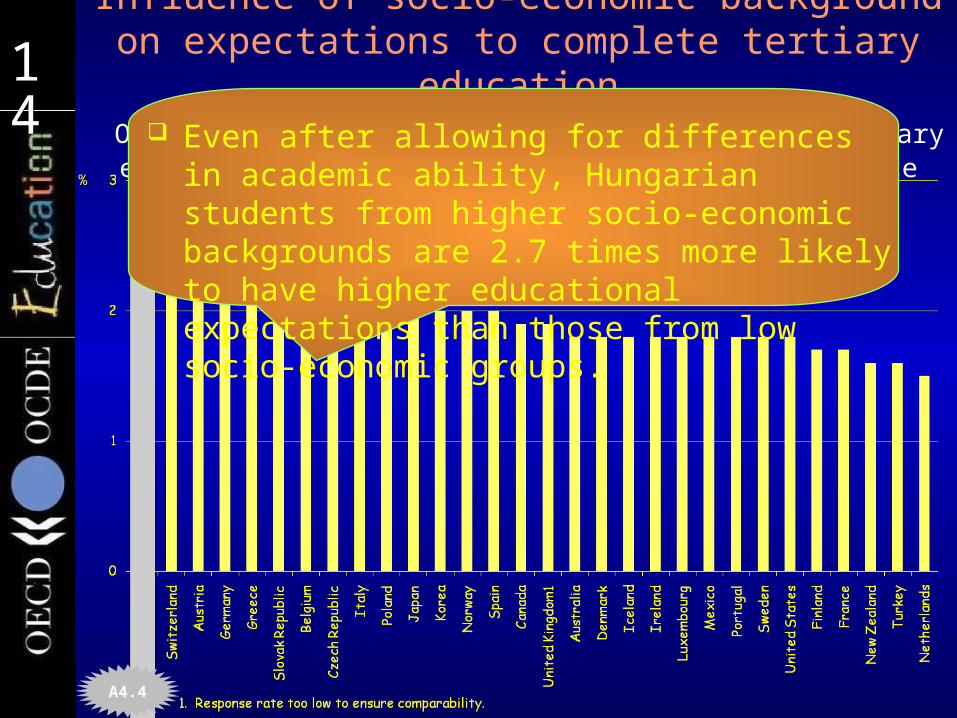
141414141414Influence of socio-economic background on expectations to complete tertiary education
Odds ratio that students expect to complete tertiary education, after adjusting for student performance (2003)
A4.4
%
Even after allowing for differences in academic ability, Hungarian students from higher socio-economic backgrounds are 2.7 times more likely to have higher educational expectations than those from low socio-economic groups.
15151515
Resource and efficiency challenges
Trends in educational expenditureFactors affecting spending levels
Has expenditure kept pace with expansion of tertiary education?
How should further expansion be funded?
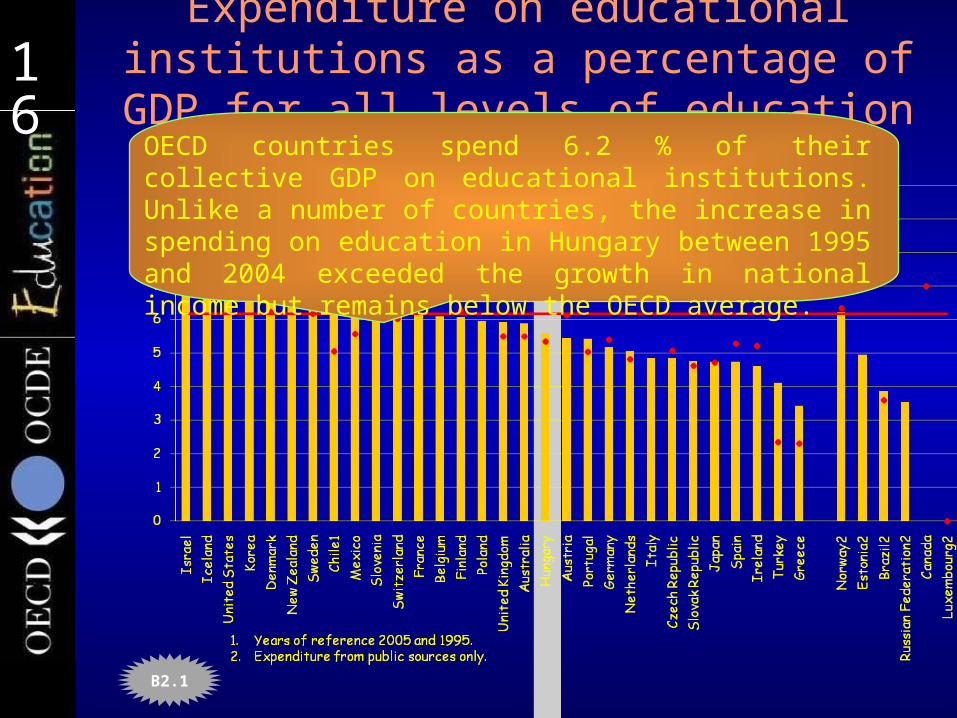
161616161616Expenditure on educational institutions as a percentage of GDP for all levels of
education (1995, 2004)
B2.1
OECD countries spend 6.2 % of their collective GDP on educational institutions. Unlike a number of countries, the increase in spending on education in Hungary between 1995 and 2004 exceeded the growth in national income but remains below the OECD average.
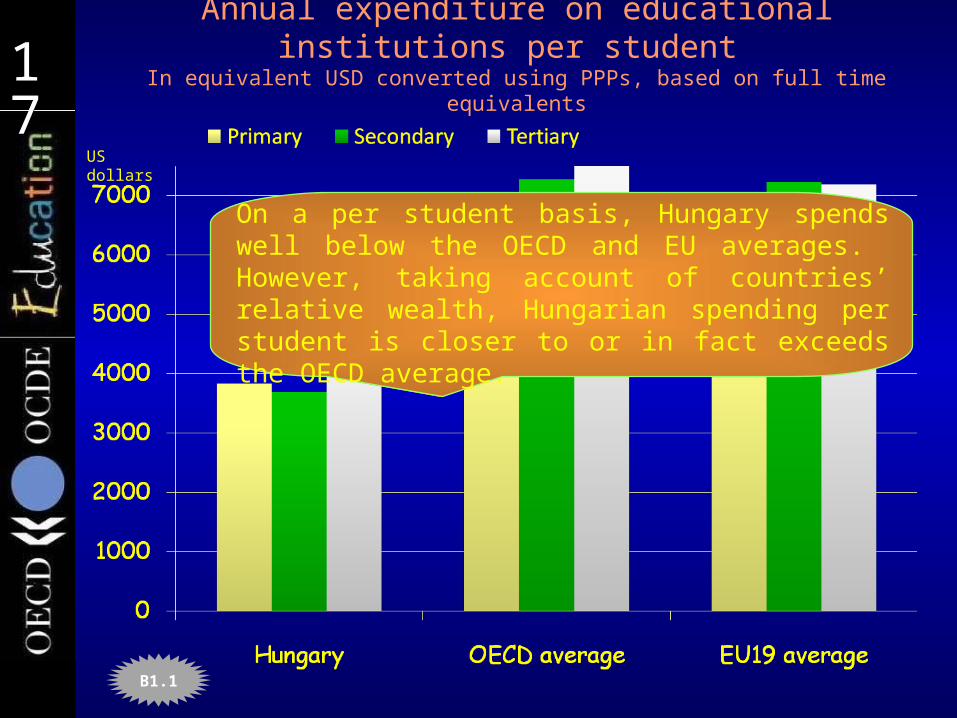
171717171717Annual expenditure on educational institutions per
student In equivalent USD converted using PPPs, based on full time equivalents
US dollars
B1.1
On a per student basis, Hungary spends well below the OECD and EU averages. However, taking account of countries’ relative wealth, Hungarian spending per student is closer to or in fact exceeds the OECD average.
181818181818
Influences on primary and secondary spending
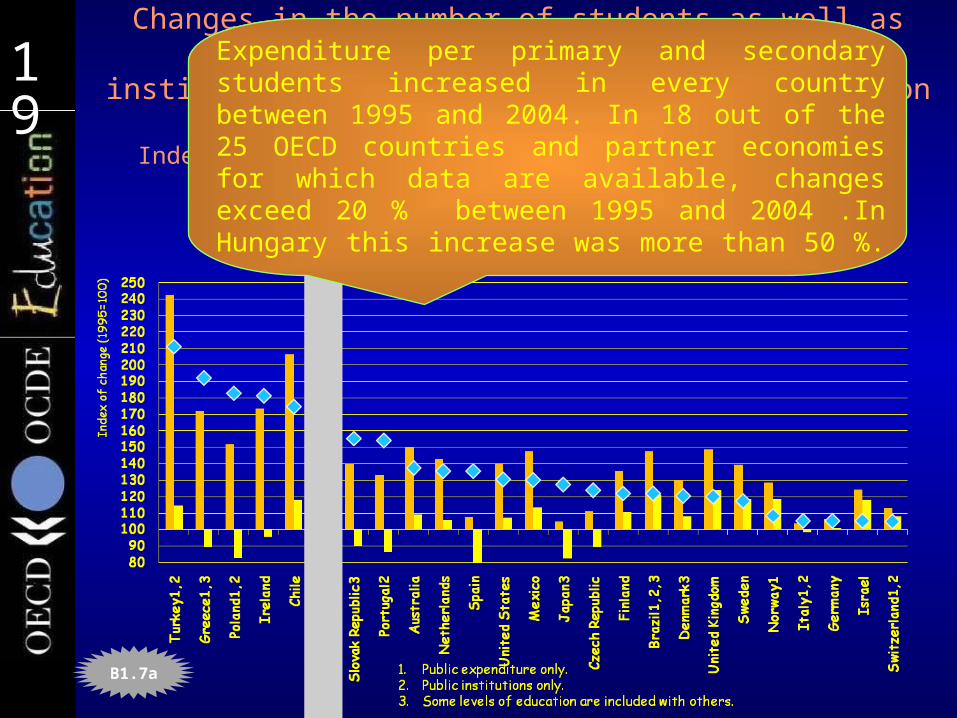
191919191919Changes in the number of students as well as changes in expenditure on educational institutions per student, by
level of education (1995,2004)Index of change between 1995 and 2004 (1995=100, 2004 constant
prices)
B1.7a
Expenditure per primary and secondary students increased in every country between 1995 and 2004. In 18 out of the 25 OECD countries and partner economies for which data are available, changes exceed 20 % between 1995 and 2004 .In Hungary this increase was more than 50 %.
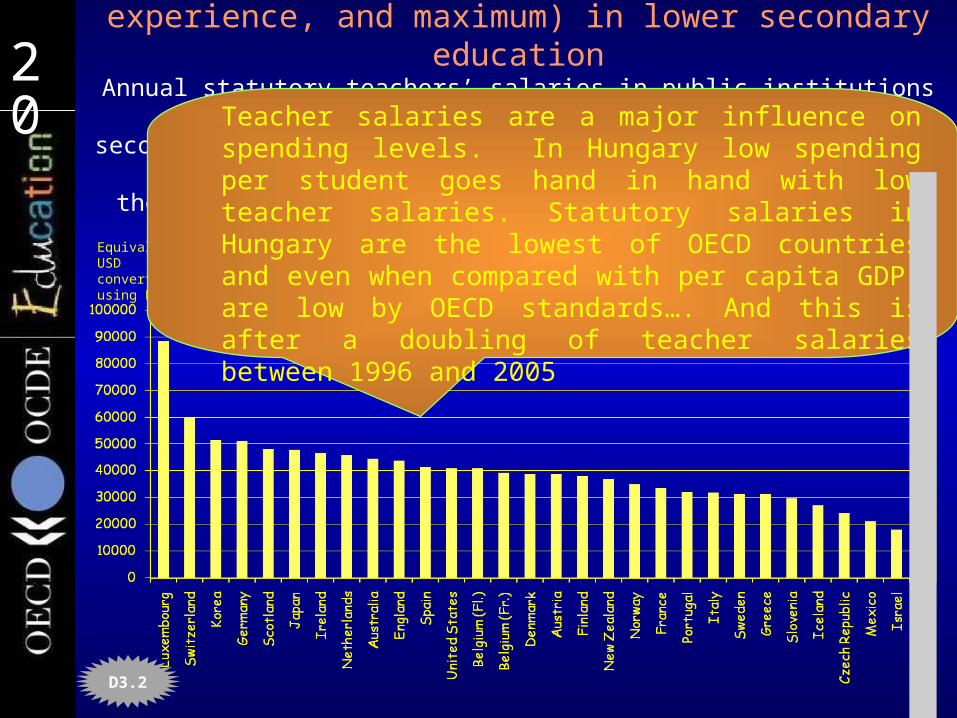
202020202020Teachers’ salaries (minimum, after 15 years
experience, and maximum) in lower secondary education
Annual statutory teachers’ salaries in public institutions in lower secondary education, in equivalent USD converted using PPs, and
the ratio of salary of 15 years of experience to GDP per capita
Equivalent USD converted using PPPs
D3.2
Teacher salaries are a major influence on spending levels. In Hungary low spending per student goes hand in hand with low teacher salaries. Statutory salaries in Hungary are the lowest of OECD countries and even when compared with per capita GDP, are low by OECD standards…. And this is after a doubling of teacher salaries between 1996 and 2005
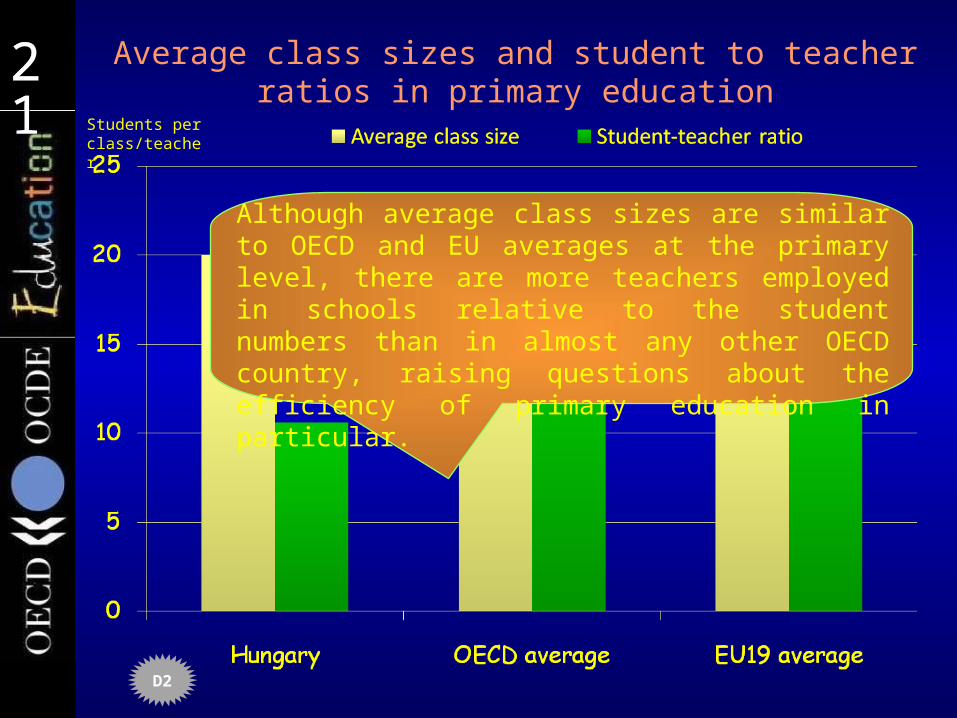
212121212121 Average class sizes and student to teacher ratios in primary education
Students per class/teacher
D2
Although average class sizes are similar to OECD and EU averages at the primary level, there are more teachers employed in schools relative to the student numbers than in almost any other OECD country, raising questions about the efficiency of primary education in particular.

222222222222 Number of teaching hours per year, by level of education (2005)
Net contact time in hours per year in public institutions
Hours per year
D4.2
The teaching load of teachers in Hungary is below average and particularly low for lower secondary teachers, where annual hours of teaching is 555 hours compared with the OECD average of 707 hours.Alongside this, the number of hours of instruction that students can expect to receive in Hungary are well below the OECD averages.
232323232323
Influences on tertiary spending
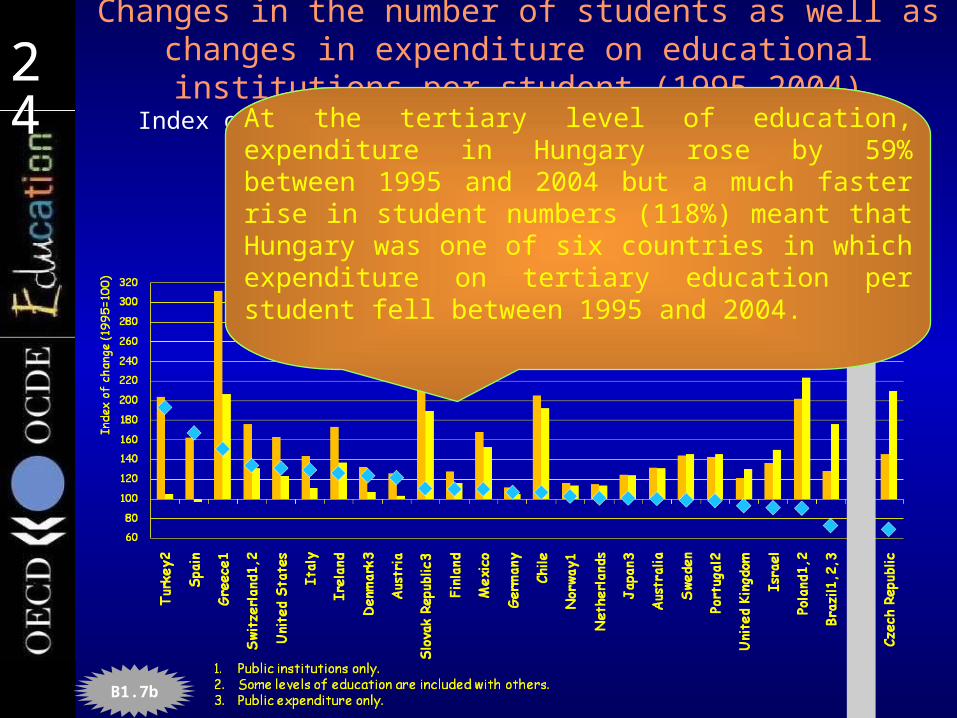
242424242424Changes in the number of students as well as
changes in expenditure on educational institutions per student (1995,2004)
Index of change between 1995 and 2004 (1995=100, 2004 constant prices)
B1.7b
At the tertiary level of education, expenditure in Hungary rose by 59% between 1995 and 2004 but a much faster rise in student numbers (118%) meant that Hungary was one of six countries in which expenditure on tertiary education per student fell between 1995 and 2004.
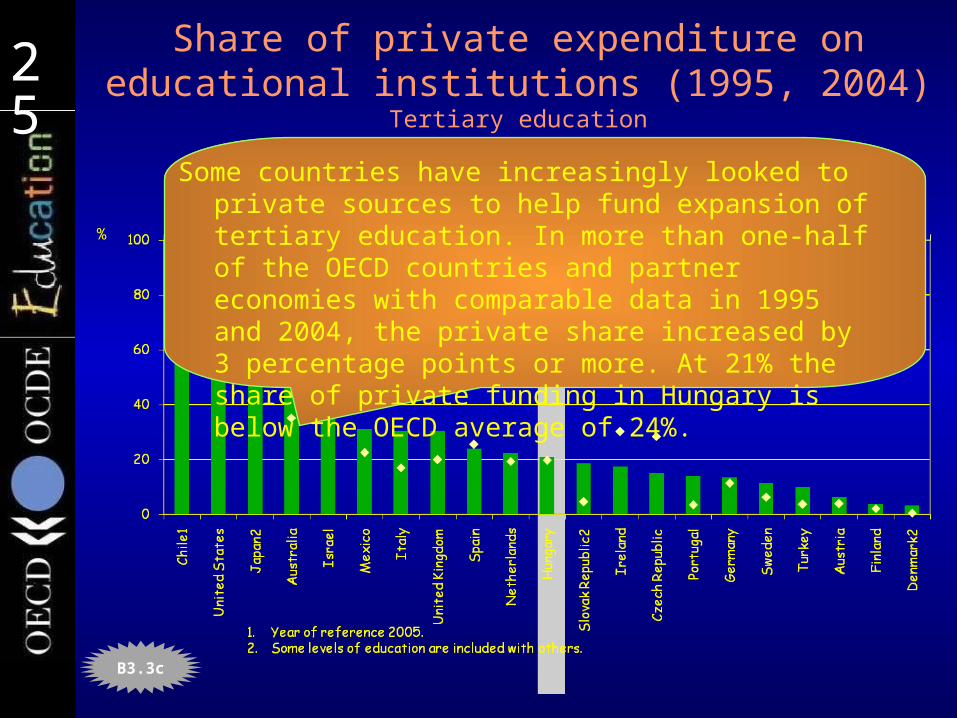
252525252525 Share of private expenditure on educational institutions (1995, 2004)
Tertiary education
%
Some countries have increasingly looked to private sources to help fund expansion of tertiary education. In more than one-half of the OECD countries and partner economies with comparable data in 1995 and 2004, the private share increased by 3 percentage points or more. At 21% the share of private funding in Hungary is below the OECD average of 24%.
B3.3c

262626262626 Summary for Hungary
Improvements are evident over time More and more qualified people in the
population Expansion of tertiary education and
increased participation at the secondary level
Significant growth in expenditure on education including a sharp rise in teacher salaries

272727272727 Main challenges for Hungary Tertiary education
Potential for further expansion Sharing of costs between public and private sources
should reflect the benefits gained Equity
Improve higher education prospects for students from poorer socio-economic backgrounds
Address large variations in performance between schools and sub-populations of students
Efficiency Teacher demand and supply issues; efficient use of
teacher resources
282828282828
Thank you for listening !Thank you for listening !
www.oecd.org/edu/eag2007 www.pisa.oecd.org
– All national and international publications– The complete micro-level database