Embed Size (px)
Citation preview
Page 1 of 46
CAYMAN ISLANDS GOVERNMENT 18/12/2020
Education Data Report FOR ACADEMIC YEAR 2019-20
Page 2 of 46
Contents Introduction ................................................................................................................................................... 3
Enrolment Data ............................................................................................................................................. 4
Early Childhood Care and Education (ECCE) Centres .............................................................................. 4
Primary and Secondary Enrolment .......................................................................................................... 5
Attendance Data ............................................................................................................................................ 6
Student Performance Data ............................................................................................................................ 8
End of Key Stage 2 (Year 6) ...................................................................................................................... 8
National Curriculum Levels (NCL) Description ..................................................................................... 8
Key Stage 4 (KS4) Performance Indicators ............................................................................................ 12
May/June 2020 Examinations Series Considerations ....................................................................... 12
Year 11 ................................................................................................................................................ 13
Prior Attainment ................................................................................................................................. 16
Year 12: Performance Indicators ....................................................................................................... 21
Cognitive Abilities Tests (CAT4) – Year 12 ......................................................................................... 25
Appendix A ................................................................................................................................................. 26
Appendix B ................................................................................................................................................. 28
Appendix C ................................................................................................................................................. 30
Appendix D .................................................................................................................................................. 33
Appendix E .................................................................................................................................................. 34
Appendix F .................................................................................................................................................. 37
Appendix G .................................................................................................................................................. 40
Appendix H .................................................................................................................................................. 41
Appendix I ................................................................................................................................................... 43
Appendix J ................................................................................................................................................... 45
Appendix K .................................................................................................................................................. 46
Page 3 of 46
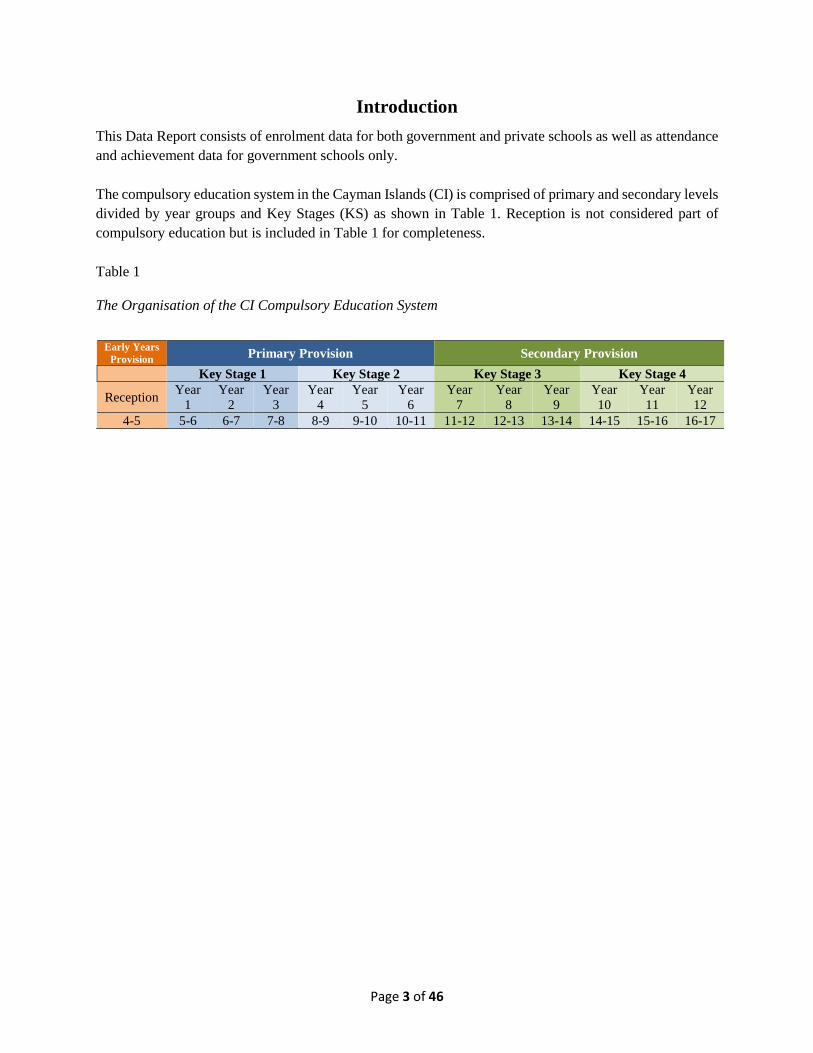
Introduction This Data Report consists of enrolment data for both government and private schools as well as attendance and achievement data for government schools only. The compulsory education system in the Cayman Islands (CI) is comprised of primary and secondary levels divided by year groups and Key Stages (KS) as shown in Table 1. Reception is not considered part of compulsory education but is included in Table 1 for completeness. Table 1 The Organisation of the CI Compulsory Education System
Early Years Provision Primary Provision Secondary Provision
Key Stage 1 Key Stage 2 Key Stage 3 Key Stage 4
Reception Year 1
Year 2
Year 3
Year 4
Year 5
Year 6
Year 7
Year 8
Year 9
Year 10
Year 11
Year 12
4-5 5-6 6-7 7-8 8-9 9-10 10-11 11-12 12-13 13-14 14-15 15-16 16-17
Page 4 of 46
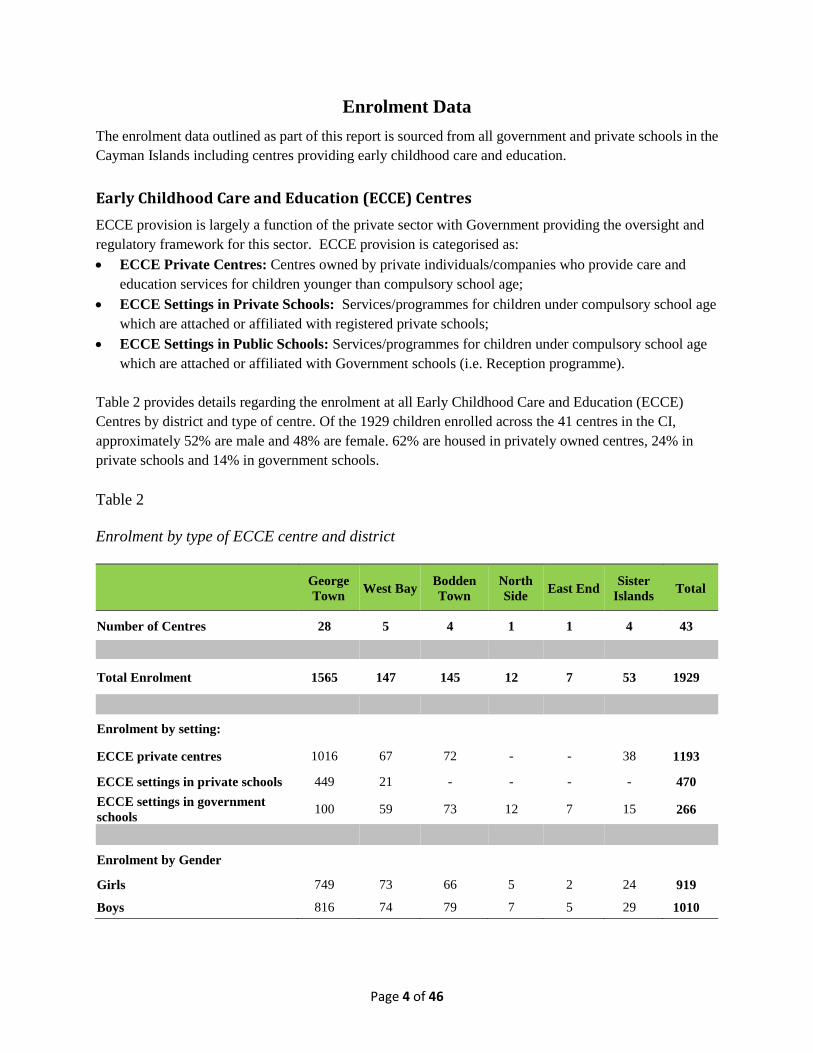
Enrolment Data The enrolment data outlined as part of this report is sourced from all government and private schools in the Cayman Islands including centres providing early childhood care and education. Early Childhood Care and Education (ECCE) Centres ECCE provision is largely a function of the private sector with Government providing the oversight and regulatory framework for this sector. ECCE provision is categorised as: • ECCE Private Centres: Centres owned by private individuals/companies who provide care and
education services for children younger than compulsory school age; • ECCE Settings in Private Schools: Services/programmes for children under compulsory school age
which are attached or affiliated with registered private schools; • ECCE Settings in Public Schools: Services/programmes for children under compulsory school age
which are attached or affiliated with Government schools (i.e. Reception programme). Table 2 provides details regarding the enrolment at all Early Childhood Care and Education (ECCE) Centres by district and type of centre. Of the 1929 children enrolled across the 41 centres in the CI, approximately 52% are male and 48% are female. 62% are housed in privately owned centres, 24% in private schools and 14% in government schools. Table 2 Enrolment by type of ECCE centre and district
George Town West Bay Bodden
Town North Side East End Sister
Islands Total
Number of Centres 28 5 4 1 1 4 43
Total Enrolment 1565 147 145 12 7 53 1929
Enrolment by setting:
ECCE private centres 1016 67 72 - - 38 1193
ECCE settings in private schools 449 21 - - - - 470 ECCE settings in government schools 100 59 73 12 7 15 266
Enrolment by Gender
Girls 749 73 66 5 2 24 919
Boys 816 74 79 7 5 29 1010
Page 5 of 46
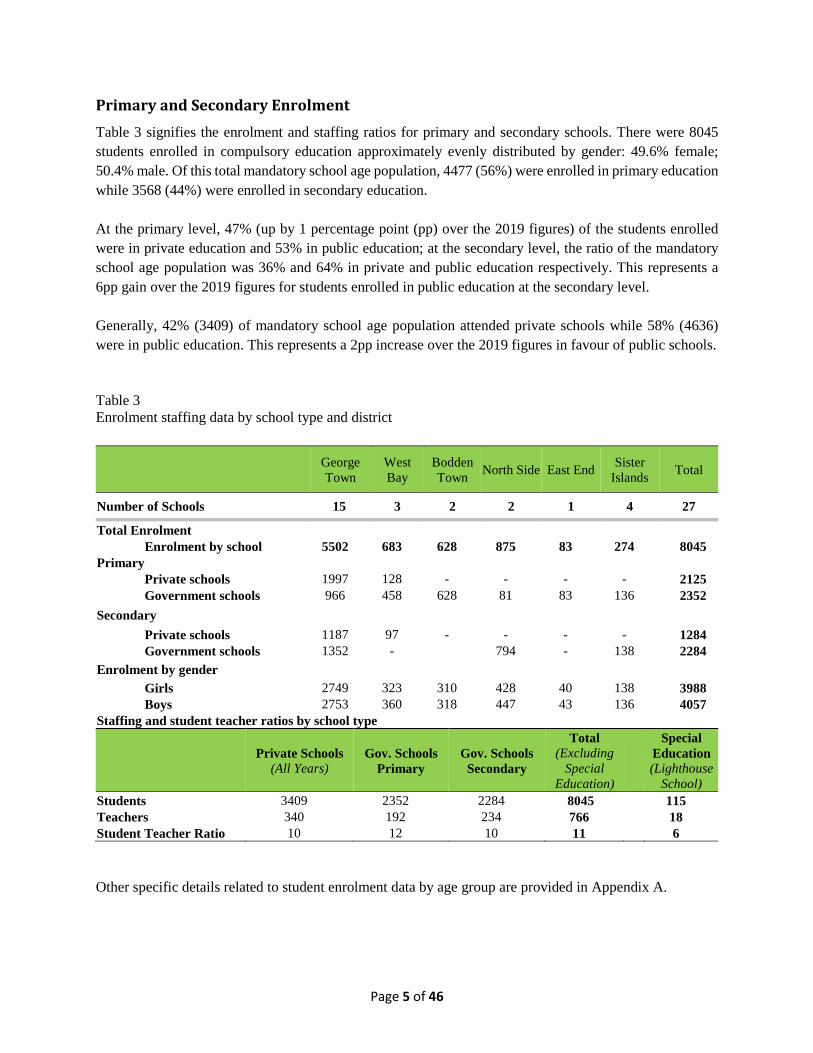
Primary and Secondary Enrolment Table 3 signifies the enrolment and staffing ratios for primary and secondary schools. There were 8045 students enrolled in compulsory education approximately evenly distributed by gender: 49.6% female; 50.4% male. Of this total mandatory school age population, 4477 (56%) were enrolled in primary education while 3568 (44%) were enrolled in secondary education. At the primary level, 47% (up by 1 percentage point (pp) over the 2019 figures) of the students enrolled were in private education and 53% in public education; at the secondary level, the ratio of the mandatory school age population was 36% and 64% in private and public education respectively. This represents a 6pp gain over the 2019 figures for students enrolled in public education at the secondary level. Generally, 42% (3409) of mandatory school age population attended private schools while 58% (4636) were in public education. This represents a 2pp increase over the 2019 figures in favour of public schools. Table 3 Enrolment staffing data by school type and district
George Town
West Bay
Bodden Town North Side East End Sister
Islands Total
Number of Schools 15 3 2 2 1 4 27 Total Enrolment
Enrolment by school 5502 683 628 875 83 274 8045 Primary
Private schools 1997 128 - - - - 2125 Government schools 966 458 628 81 83 136 2352
Secondary Private schools 1187 97 - - - - 1284 Government schools 1352 - 794 - 138 2284
Enrolment by gender Girls 2749 323 310 428 40 138 3988 Boys 2753 360 318 447 43 136 4057
Staffing and student teacher ratios by school type
Private Schools (All Years)
Gov. Schools Primary
Gov. Schools Secondary
Total (Excluding
Special Education)
Special Education (Lighthouse
School) Students 3409 2352 2284 8045 115 Teachers 340 192 234 766 18 Student Teacher Ratio 10 12 10 11 6 Other specific details related to student enrolment data by age group are provided in Appendix A.
Page 6 of 46
Attendance Data Attendance is mandatory for all students that are legally resident in the Cayman Islands. Government schools are required to take attendance registers twice daily: once at the start of morning session of each school day and once during the afternoon session. Registration should indicate whether students are:
• Present • Attending an approved educational activity • Absent: unable to attend school due to exceptional circumstances; absences may be classified as
either authorised or unauthorised. When students of compulsory school age are absent, schools are required to:
• ascertain the reason for the absence; • ensure the proper safeguarding action is taken; • classify and record the absence as authorised by the school or unauthorised.
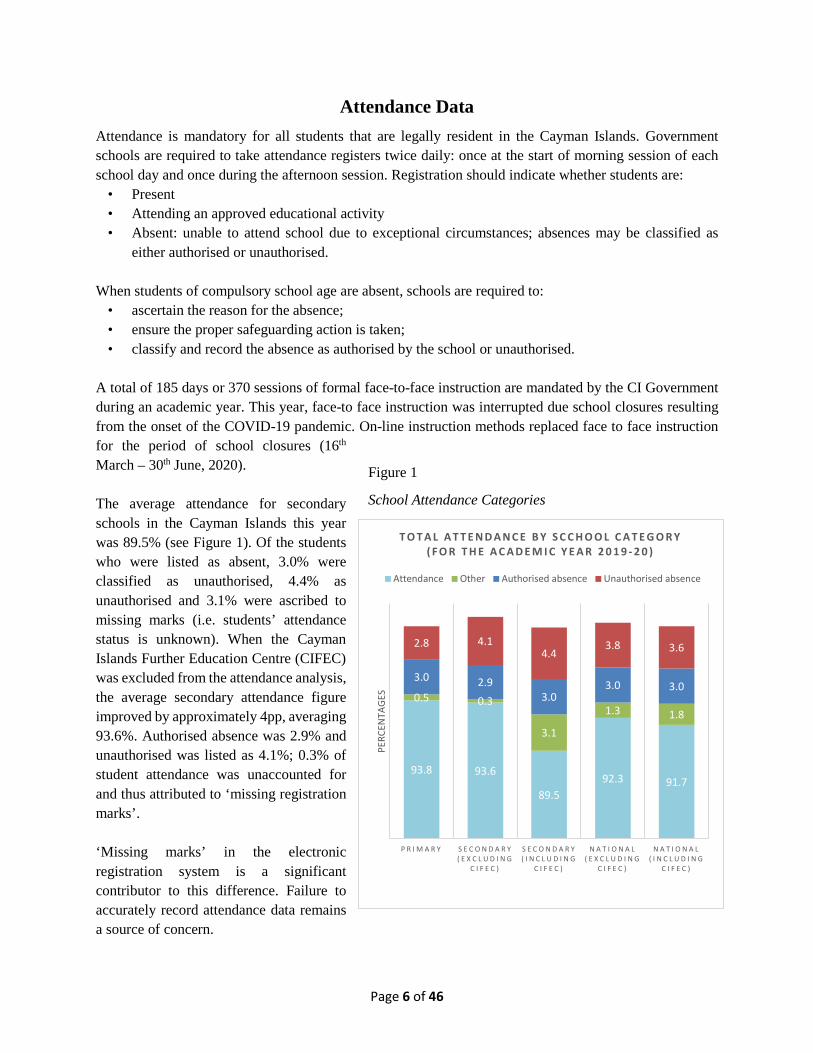
A total of 185 days or 370 sessions of formal face-to-face instruction are mandated by the CI Government during an academic year. This year, face-to face instruction was interrupted due school closures resulting from the onset of the COVID-19 pandemic. On-line instruction methods replaced face to face instruction for the period of school closures (16th March – 30th June, 2020). The average attendance for secondary schools in the Cayman Islands this year was 89.5% (see Figure 1). Of the students who were listed as absent, 3.0% were classified as unauthorised, 4.4% as unauthorised and 3.1% were ascribed to missing marks (i.e. students’ attendance status is unknown). When the Cayman Islands Further Education Centre (CIFEC) was excluded from the attendance analysis, the average secondary attendance figure improved by approximately 4pp, averaging 93.6%. Authorised absence was 2.9% and unauthorised was listed as 4.1%; 0.3% of student attendance was unaccounted for and thus attributed to ‘missing registration marks’. ‘Missing marks’ in the electronic registration system is a significant contributor to this difference. Failure to accurately record attendance data remains a source of concern.
Figure 1
School Attendance Categories
93.8 93.6
89.592.3 91.7
0.5 0.3
3.1
1.3 1.8
3.0 2.93.0
3.0 3.0
2.8 4.14.4
3.8 3.6
P R I M A R Y S E C O N D A R Y( E X C L U D I N G
C I F E C )
S E C O N D A R Y( I N C L U D I N G
C I F E C )
N A T I O N A L( E X C L U D I N G
C I F E C )
N A T I O N A L( I N C L U D I N G
C I F E C )
PERC
ENTA
GES
T O T A L A T T E N D A N C E B Y S C C H O O L C A T E G O R Y( F O R T H E A C A D E M I C Y E A R 2 0 1 9 - 2 0 )
Attendance Other Authorised absence Unauthorised absence
Page 7 of 46
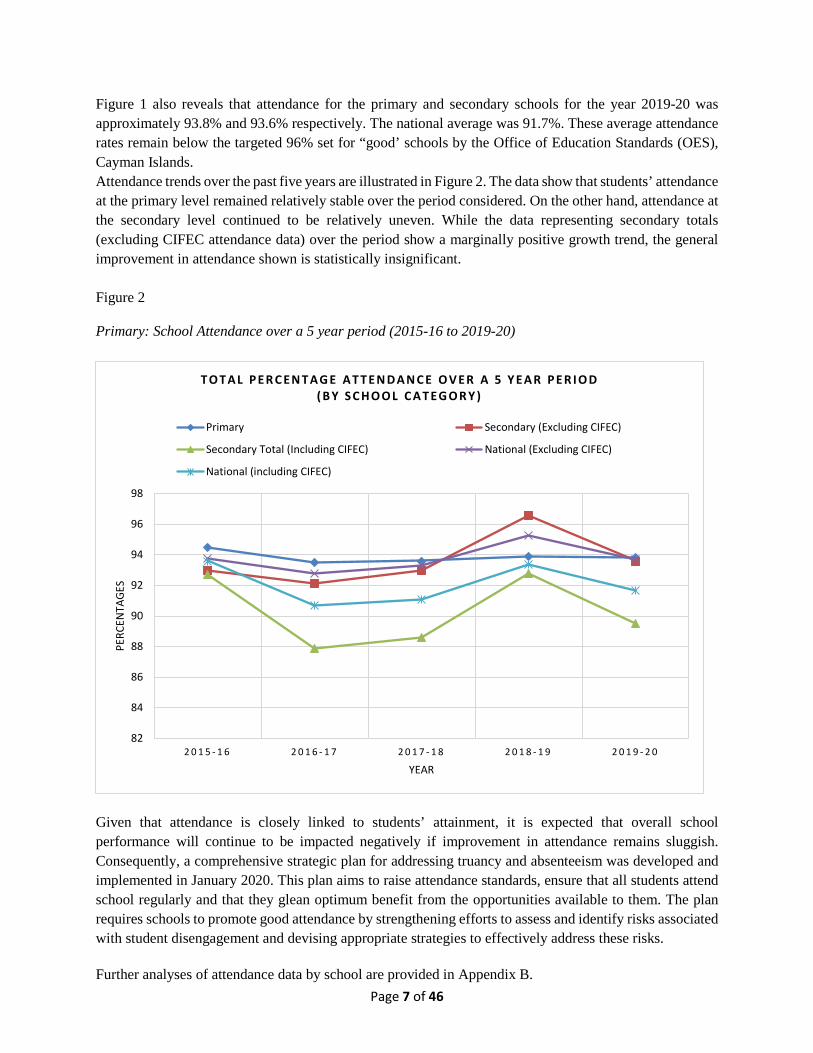
Figure 1 also reveals that attendance for the primary and secondary schools for the year 2019-20 was approximately 93.8% and 93.6% respectively. The national average was 91.7%. These average attendance rates remain below the targeted 96% set for “good’ schools by the Office of Education Standards (OES), Cayman Islands. Attendance trends over the past five years are illustrated in Figure 2. The data show that students’ attendance at the primary level remained relatively stable over the period considered. On the other hand, attendance at the secondary level continued to be relatively uneven. While the data representing secondary totals (excluding CIFEC attendance data) over the period show a marginally positive growth trend, the general improvement in attendance shown is statistically insignificant. Figure 2 Primary: School Attendance over a 5 year period (2015-16 to 2019-20)
Given that attendance is closely linked to students’ attainment, it is expected that overall school performance will continue to be impacted negatively if improvement in attendance remains sluggish. Consequently, a comprehensive strategic plan for addressing truancy and absenteeism was developed and implemented in January 2020. This plan aims to raise attendance standards, ensure that all students attend school regularly and that they glean optimum benefit from the opportunities available to them. The plan requires schools to promote good attendance by strengthening efforts to assess and identify risks associated with student disengagement and devising appropriate strategies to effectively address these risks. Further analyses of attendance data by school are provided in Appendix B.
82
84
86
88
90
92
94
96
98
2 0 1 5 - 1 6 2 0 1 6 - 1 7 2 0 1 7 - 1 8 2 0 1 8 - 1 9 2 0 1 9 - 2 0
PERC
ENTA
GES
YEAR
T O T A L P E R C E N T A G E A T T E N D A N C E O V E R A 5 Y E A R P E R I O D( B Y S C H O O L C A T E G O R Y )
Primary Secondary (Excluding CIFEC)
Secondary Total (Including CIFEC) National (Excluding CIFEC)
National (including CIFEC)
Page 8 of 46
Student Performance Data This report reflects the achievement data for students enrolled in the public school system in the Cayman Islands. Students’ achievement standards are discussed in relation to the national expectations at the end of Key Stage 2 (Year 6) and Key Stage 4 (Years 11 and 12).
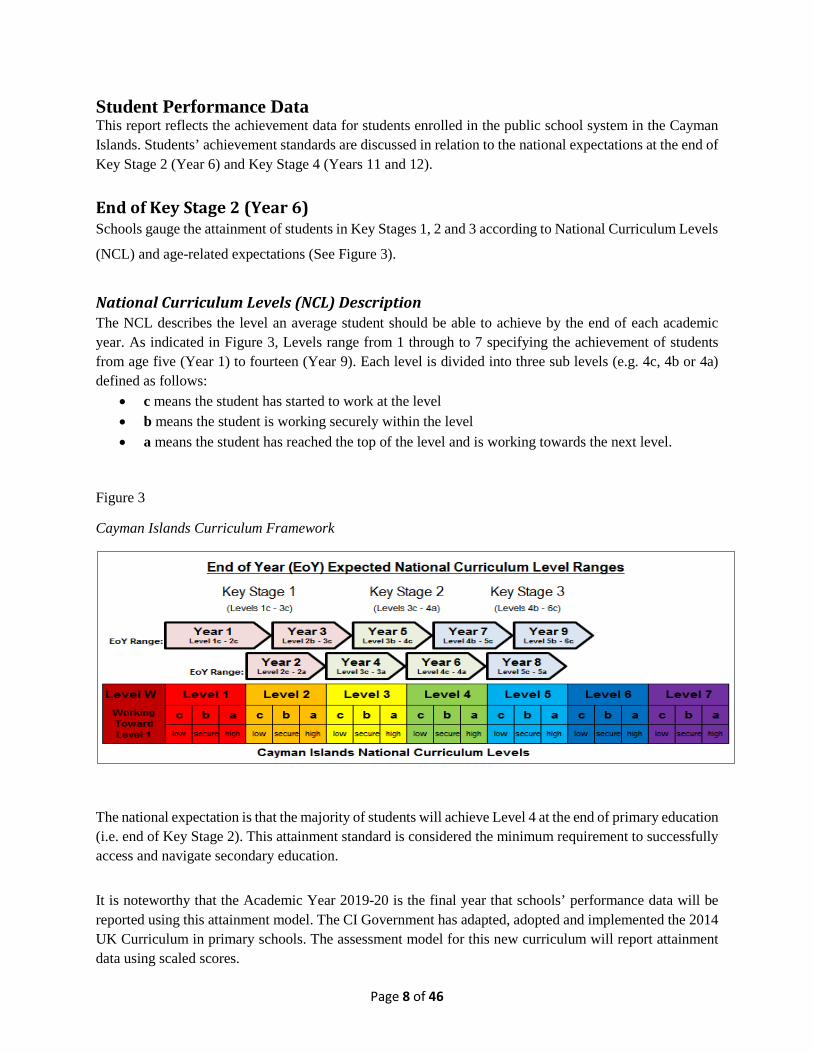
End of Key Stage 2 (Year 6) Schools gauge the attainment of students in Key Stages 1, 2 and 3 according to National Curriculum Levels
(NCL) and age-related expectations (See Figure 3).
National Curriculum Levels (NCL) Description The NCL describes the level an average student should be able to achieve by the end of each academic year. As indicated in Figure 3, Levels range from 1 through to 7 specifying the achievement of students from age five (Year 1) to fourteen (Year 9). Each level is divided into three sub levels (e.g. 4c, 4b or 4a) defined as follows:
• c means the student has started to work at the level • b means the student is working securely within the level • a means the student has reached the top of the level and is working towards the next level.
Figure 3 Cayman Islands Curriculum Framework
The national expectation is that the majority of students will achieve Level 4 at the end of primary education (i.e. end of Key Stage 2). This attainment standard is considered the minimum requirement to successfully access and navigate secondary education.
It is noteworthy that the Academic Year 2019-20 is the final year that schools’ performance data will be reported using this attainment model. The CI Government has adapted, adopted and implemented the 2014 UK Curriculum in primary schools. The assessment model for this new curriculum will report attainment data using scaled scores.
Page 9 of 46
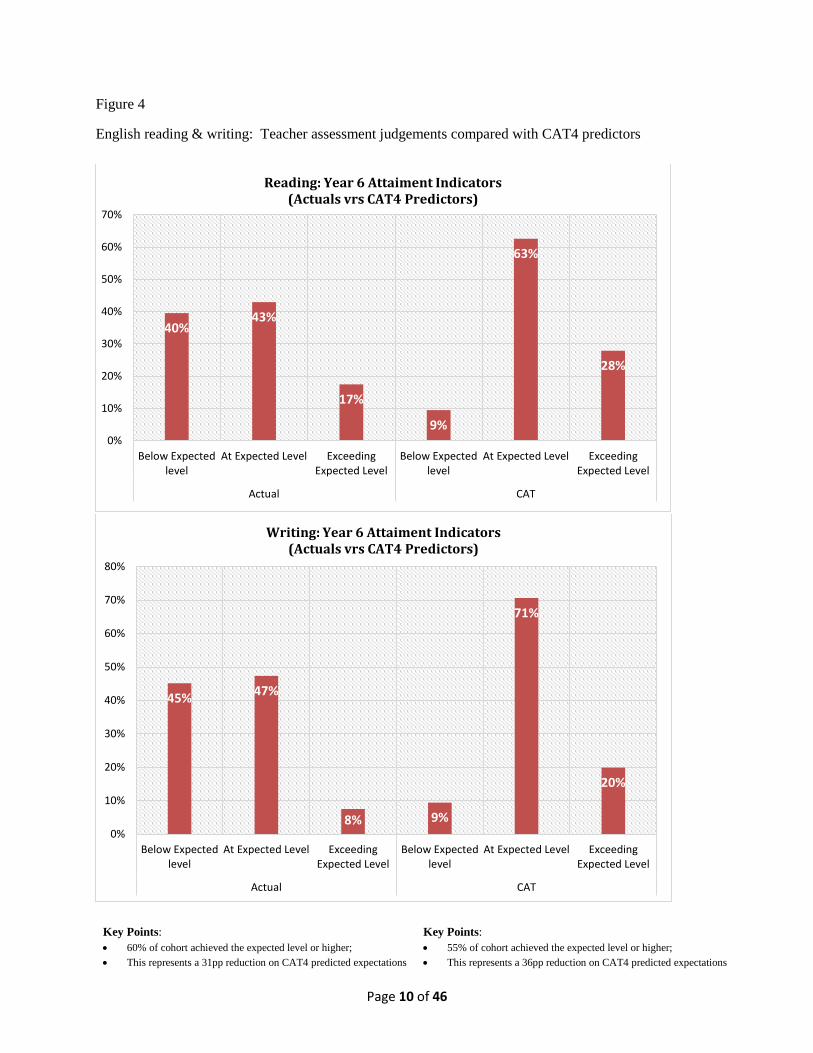
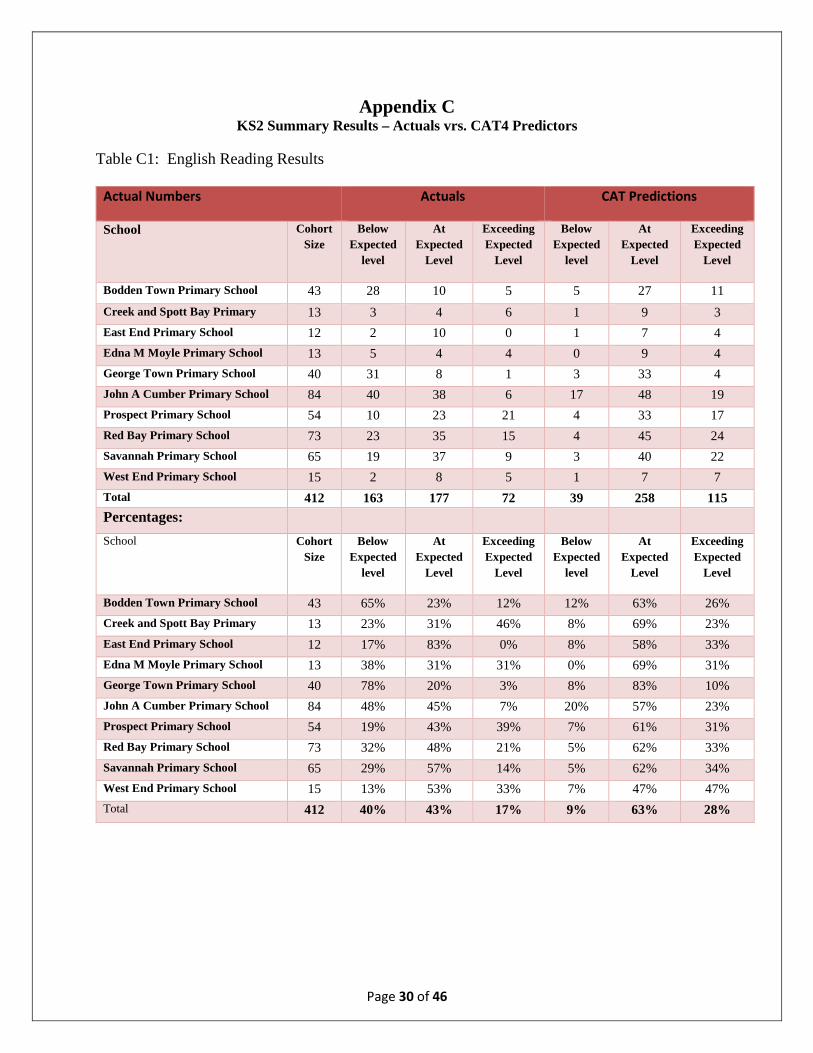
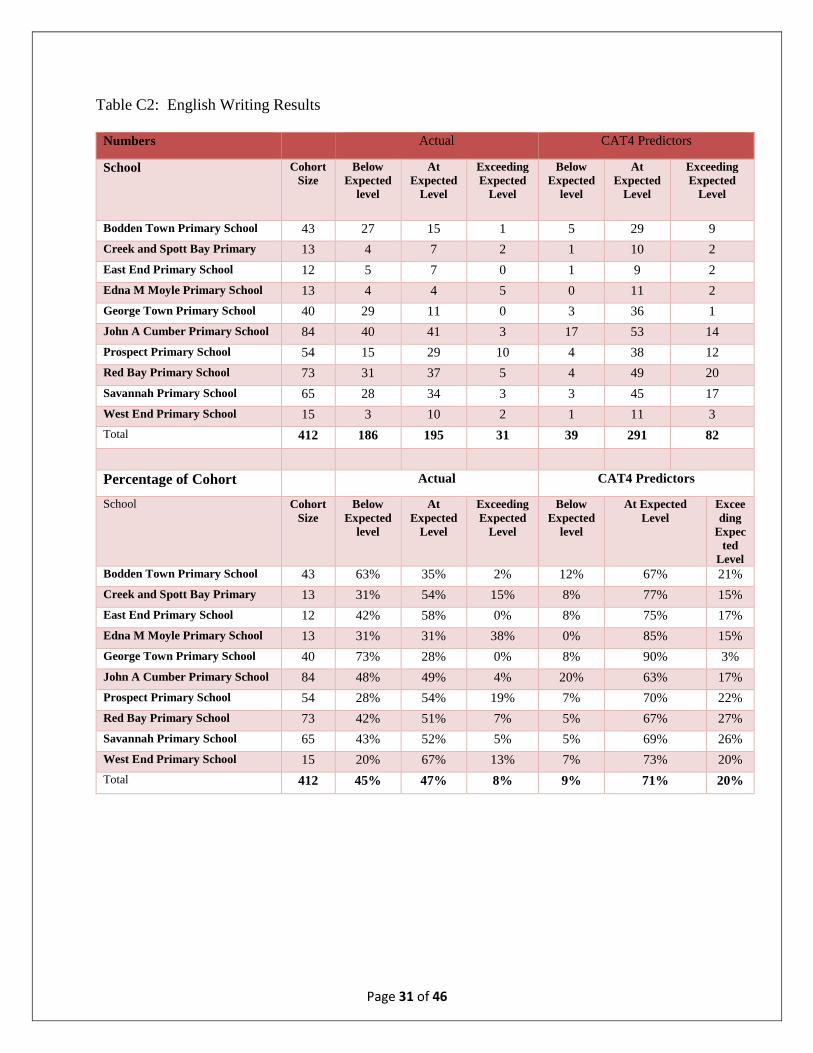
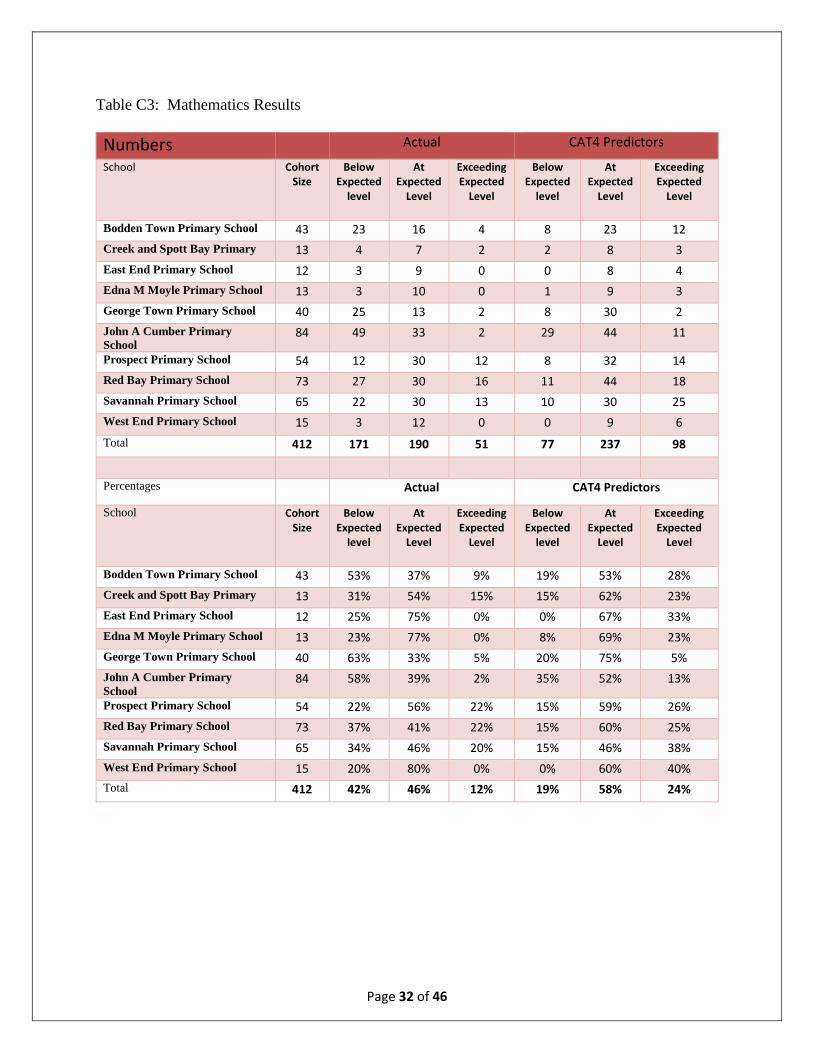
2020 KS2 Examinations Administration. Due to the spread of the COVID-19 pandemic, the end of KS2 examination was cancelled this year. Schools were closed on 16th March, 2020 for the rest of the academic year as part of the CI Government’s comprehensive plan for infection prevention and control. Consequently, the KS2 results and comparisons detailed in this report are based on school-based teacher judgements over the year as well as the results from the standardised Cognitive Abilities Test Fourth Edition (CAT4). Teacher Judgements. These judgments are a critical part of assessing progress and achievement and bear fidelity to the curriculum. Teachers are required to design assessments in their classrooms so that teaching and learning is meaningful and meets the needs all students. These assessments are used collectively to determine whether students are performing below, within or above the expected standard for their age group. The Cognitive Abilities Test Fourth Edition (CAT4): CAT4 is a suite of tests which assesses a student’s reasoning (thinking) abilities in the key areas that support educational development and academic attainment. CAT4 comprises the following sections or batteries: Reasoning Battery – thinking with words; Quantitative (or Numerical) Reasoning Battery – thinking with numbers; Non-verbal Reasoning Battery – thinking with shapes; Spatial Ability Battery – thinking with shape and space. CAT4 is also used as a valuable screening tool to identify a pupil’s strengths, weaknesses and learning preferences and to help set challenging but realistic targets. Significant identified variations between the potential measured by CAT4 and actual outcomes can form the basis for further investigation of potential barriers to learning. Figures 4 and 5 compare the CAT4 predictors with the actual outcomes based on teacher judgements for the year. The charts indicate that 60% (English reading), 55% (English writing) and 58% (mathematics) of the Year 6 cohort were assessed by teachers as meeting or exceeding the expected standard. This result is significantly lower than the 91% (English reading and writing) and 82% (mathematics) predicted by the CAT4 test.
Page 10 of 46
Figure 4
English reading & writing: Teacher assessment judgements compared with CAT4 predictors
Key Points: • 60% of cohort achieved the expected level or higher; • This represents a 31pp reduction on CAT4 predicted expectations
Key Points: • 55% of cohort achieved the expected level or higher; • This represents a 36pp reduction on CAT4 predicted expectations
40%43%
17%
9%
63%
28%
0%
10%
20%
30%
40%
50%
60%
70%
Below Expectedlevel
At Expected Level ExceedingExpected Level
Below Expectedlevel
At Expected Level ExceedingExpected Level
Actual CAT
Reading: Year 6 Attaiment Indicators(Actuals vrs CAT4 Predictors)
45% 47%
8% 9%
71%
20%
0%
10%
20%
30%
40%
50%
60%
70%
80%
Below Expectedlevel
At Expected Level ExceedingExpected Level
Below Expectedlevel
At Expected Level ExceedingExpected Level
Actual CAT
Writing: Year 6 Attaiment Indicators(Actuals vrs CAT4 Predictors)
Page 11 of 46
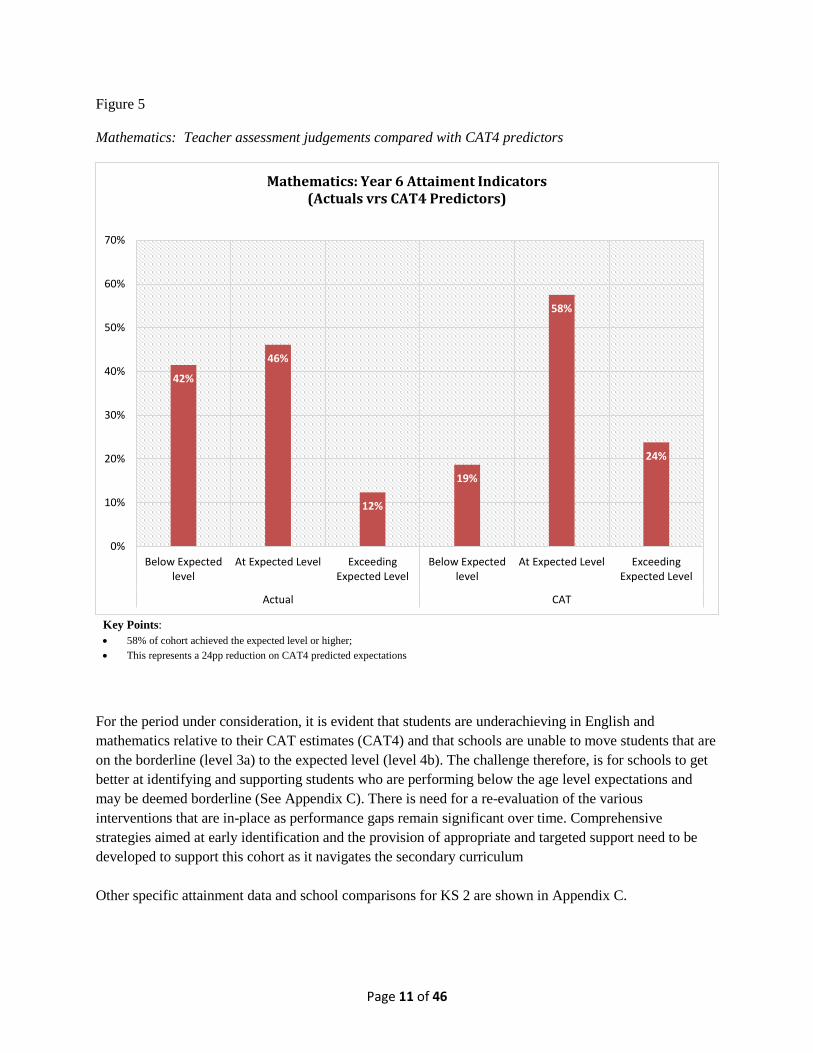
Figure 5 Mathematics: Teacher assessment judgements compared with CAT4 predictors
Key Points: • 58% of cohort achieved the expected level or higher; • This represents a 24pp reduction on CAT4 predicted expectations
For the period under consideration, it is evident that students are underachieving in English and mathematics relative to their CAT estimates (CAT4) and that schools are unable to move students that are on the borderline (level 3a) to the expected level (level 4b). The challenge therefore, is for schools to get better at identifying and supporting students who are performing below the age level expectations and may be deemed borderline (See Appendix C). There is need for a re-evaluation of the various interventions that are in-place as performance gaps remain significant over time. Comprehensive strategies aimed at early identification and the provision of appropriate and targeted support need to be developed to support this cohort as it navigates the secondary curriculum Other specific attainment data and school comparisons for KS 2 are shown in Appendix C.
42%
46%
12%
19%
58%
24%
0%
10%
20%
30%
40%
50%
60%
70%
Below Expectedlevel
At Expected Level ExceedingExpected Level
Below Expectedlevel
At Expected Level ExceedingExpected Level
Actual CAT
Mathematics: Year 6 Attaiment Indicators(Actuals vrs CAT4 Predictors)
Page 12 of 46
Key Stage 4 (KS4) Performance Indicators A summary of students’ attainment in the following Level 1 (L1) or Level 2 (L2) qualifications is reported in this document:
• Caribbean Secondary Certificate of Education (CSEC) • General Certificate of Secondary Education (GCSE) • International General Certificate of Secondary Education (iGCSE) • Business and Technical Education Council (BTEC) awards • Institute of the Motor Industry (IMI) awards • Award Scheme Accreditation and Development Network (ASDAN) awards
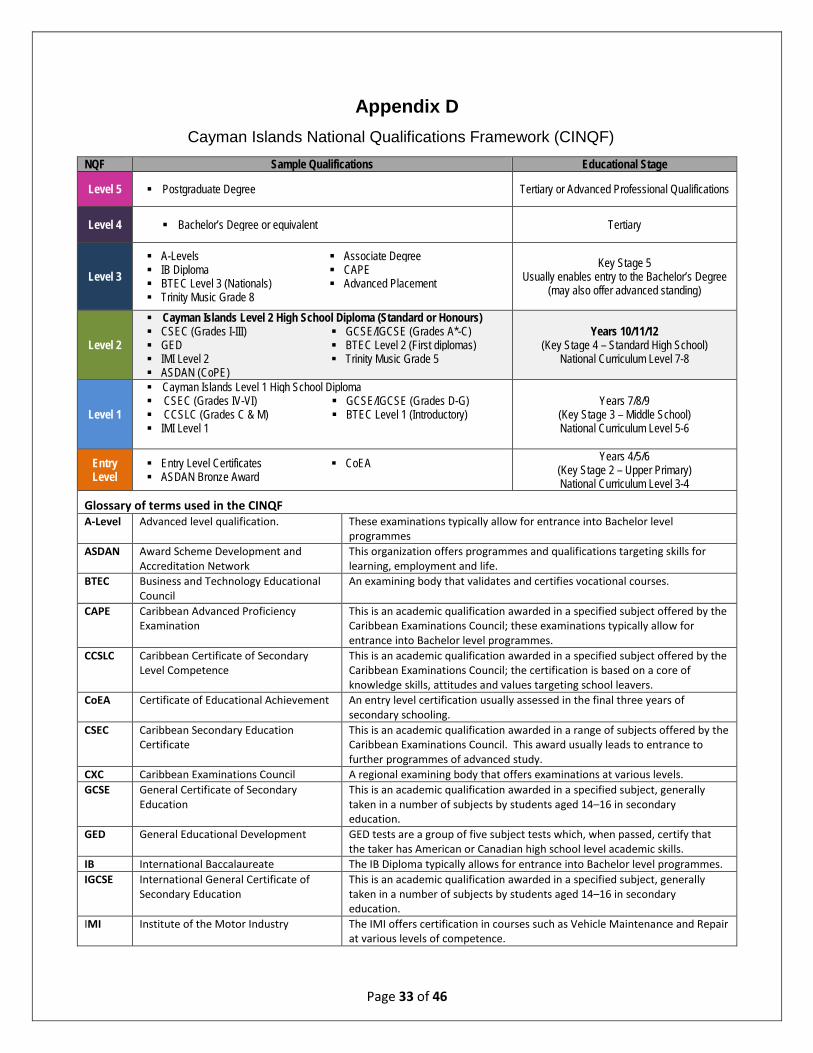
Generally, qualifications achieved by students are defined in terms of a difficulty level. The established convention for interpreting the level of the qualification is: the higher the level, the more difficult the qualification. The levels are based on the standards of knowledge, skill and competences needed for each qualification. Qualifications accepted in the Cayman Islands are detailed in the Cayman Islands’ National Qualification Framework (CINQF). The CINQF affirms that students at KS4 are expected at a minimum, to pursue Level 2 qualifications (see Appendix D). In terms of attainment, the national expectation is that students will achieve at least five Level 2 qualifications including English and mathematics by the end of Key Stage 4. May/June 2020 Examinations Series Considerations When considering these results, it is important to note that in March 2020, the various UK Examination Boards announced the cancellation of the June 2020 examinations series at centres in all jurisdictions due to the COVID-19 pandemic. Of paramount importance was the protection and the safety of candidates and teachers. Consequently, candidates scheduled to sit examinations in May/June 2020 were awarded a centre assessment grade: based on what the educational institution believed the student would most likely have achieved had the written exams been administered. The Caribbean Examinations Council took a different approach in its response to the prevalence of the pandemic; The Board cancelled its normal examinations scheduled but opted to use a modified approach to the examinations process. That is, examinations were offered but the number of written papers per subject was reduced to the minimum necessary to provide valid assessed grades. Generally, the award of final grades was based on a moderated School Based Assessment (SBA) and the results from the administration of a Multiple-Choice Paper. The exceptions to this process were Modern Languages (Spanish, French and Portuguese), Human and Social Biology, and Visual Arts. The above stated modifications to the process of awarding of grades by external examining agencies for the May/June 2020 examination series elevate and advance concerns regarding year on year national grade comparisons. It is unclear whether differences should be attributed to changes in the underlying student performances or to the changes in the approach to assessment taken by the various examining Boards to award grades. In any event, this report will reflect and describe the performance of the current cohort as per national requirement. Comparative analyses with respect to year-on-year system improvement should be viewed
Page 13 of 46
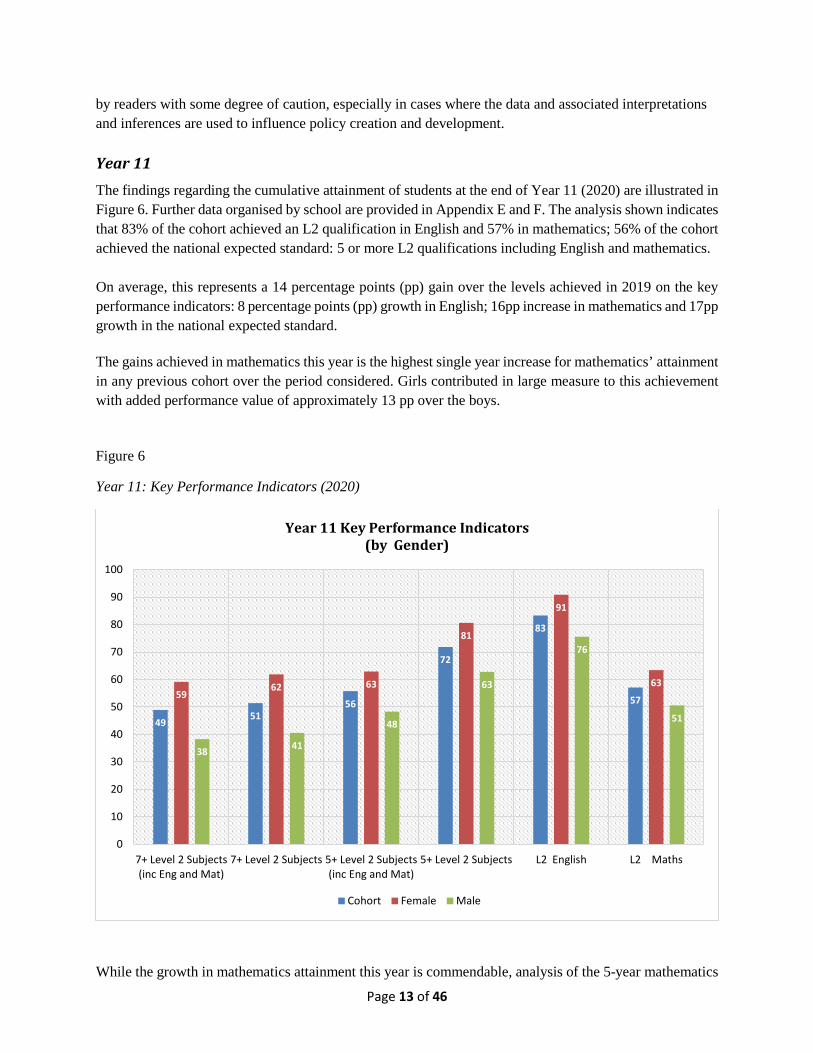
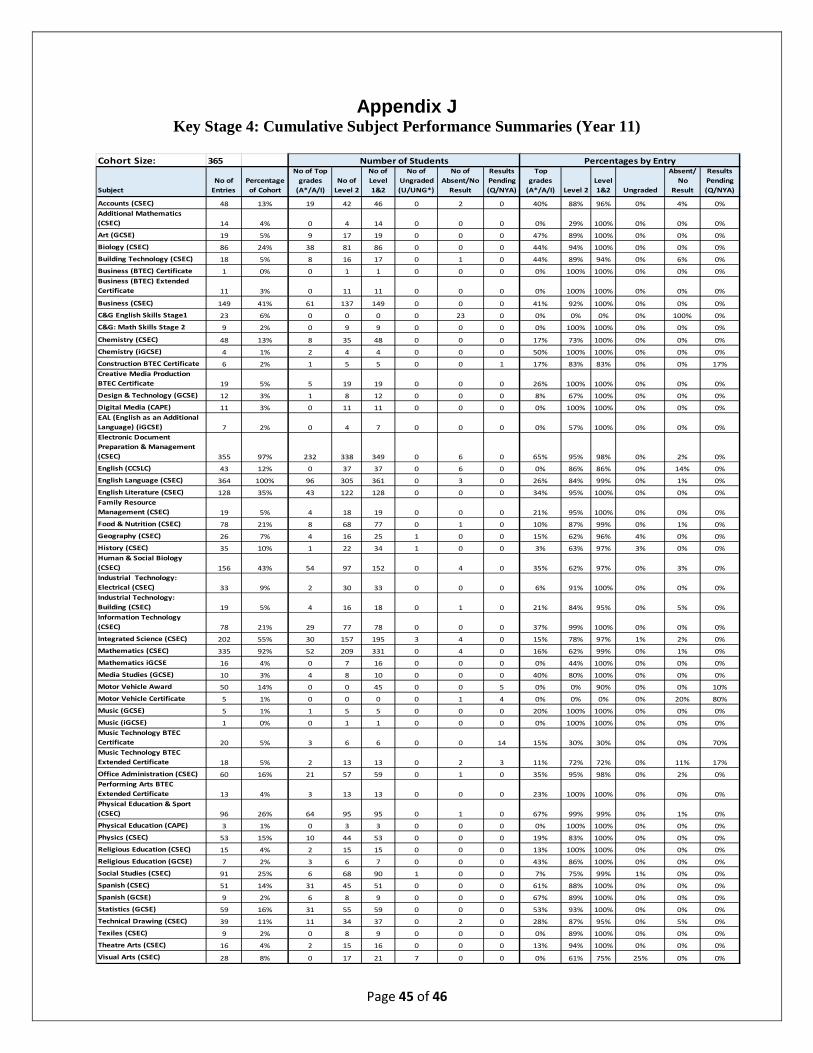
by readers with some degree of caution, especially in cases where the data and associated interpretations and inferences are used to influence policy creation and development. Year 11 The findings regarding the cumulative attainment of students at the end of Year 11 (2020) are illustrated in Figure 6. Further data organised by school are provided in Appendix E and F. The analysis shown indicates that 83% of the cohort achieved an L2 qualification in English and 57% in mathematics; 56% of the cohort achieved the national expected standard: 5 or more L2 qualifications including English and mathematics. On average, this represents a 14 percentage points (pp) gain over the levels achieved in 2019 on the key performance indicators: 8 percentage points (pp) growth in English; 16pp increase in mathematics and 17pp growth in the national expected standard. The gains achieved in mathematics this year is the highest single year increase for mathematics’ attainment in any previous cohort over the period considered. Girls contributed in large measure to this achievement with added performance value of approximately 13 pp over the boys. Figure 6 Year 11: Key Performance Indicators (2020)
While the growth in mathematics attainment this year is commendable, analysis of the 5-year mathematics
49 5156
72
83
575962 63
81
91
63
38 41
48
63
76
51
0
10
20
30
40
50
60
70
80
90
100
7+ Level 2 Subjects(inc Eng and Mat)
7+ Level 2 Subjects 5+ Level 2 Subjects(inc Eng and Mat)
5+ Level 2 Subjects L2 English L2 Maths
Year 11 Key Performance Indicators(by Gender)
Cohort Female Male
Page 14 of 46
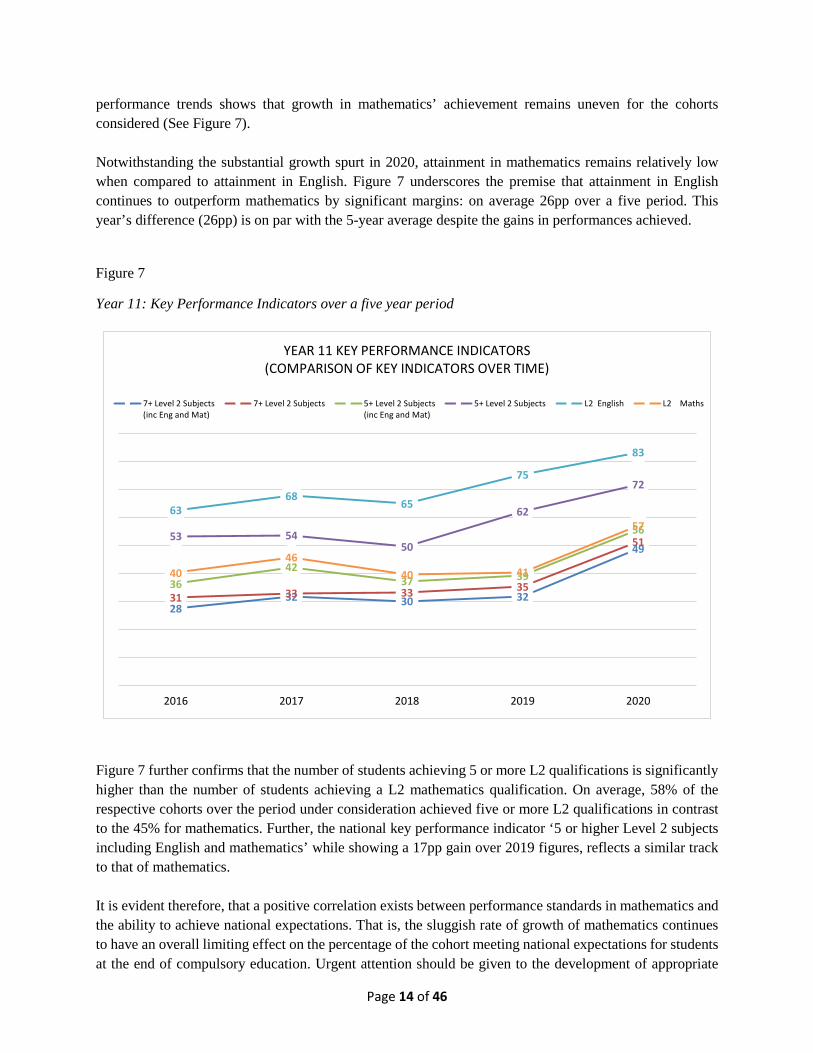
performance trends shows that growth in mathematics’ achievement remains uneven for the cohorts considered (See Figure 7). Notwithstanding the substantial growth spurt in 2020, attainment in mathematics remains relatively low when compared to attainment in English. Figure 7 underscores the premise that attainment in English continues to outperform mathematics by significant margins: on average 26pp over a five period. This year’s difference (26pp) is on par with the 5-year average despite the gains in performances achieved. Figure 7 Year 11: Key Performance Indicators over a five year period
Figure 7 further confirms that the number of students achieving 5 or more L2 qualifications is significantly higher than the number of students achieving a L2 mathematics qualification. On average, 58% of the respective cohorts over the period under consideration achieved five or more L2 qualifications in contrast to the 45% for mathematics. Further, the national key performance indicator ‘5 or higher Level 2 subjects including English and mathematics’ while showing a 17pp gain over 2019 figures, reflects a similar track to that of mathematics. It is evident therefore, that a positive correlation exists between performance standards in mathematics and the ability to achieve national expectations. That is, the sluggish rate of growth of mathematics continues to have an overall limiting effect on the percentage of the cohort meeting national expectations for students at the end of compulsory education. Urgent attention should be given to the development of appropriate
49
32303228
51
35333331
56
393742
36
72
62
505453
83
75
6568
6357
414046
40
20202019201820172016
YEAR 11 KEY PERFORMANCE INDICATORS(COMPARISON OF KEY INDICATORS OVER TIME)
7+ Level 2 Subjects(inc Eng and Mat)
7+ Level 2 Subjects 5+ Level 2 Subjects(inc Eng and Mat)
5+ Level 2 Subjects L2 English L2 Maths
Page 15 of 46
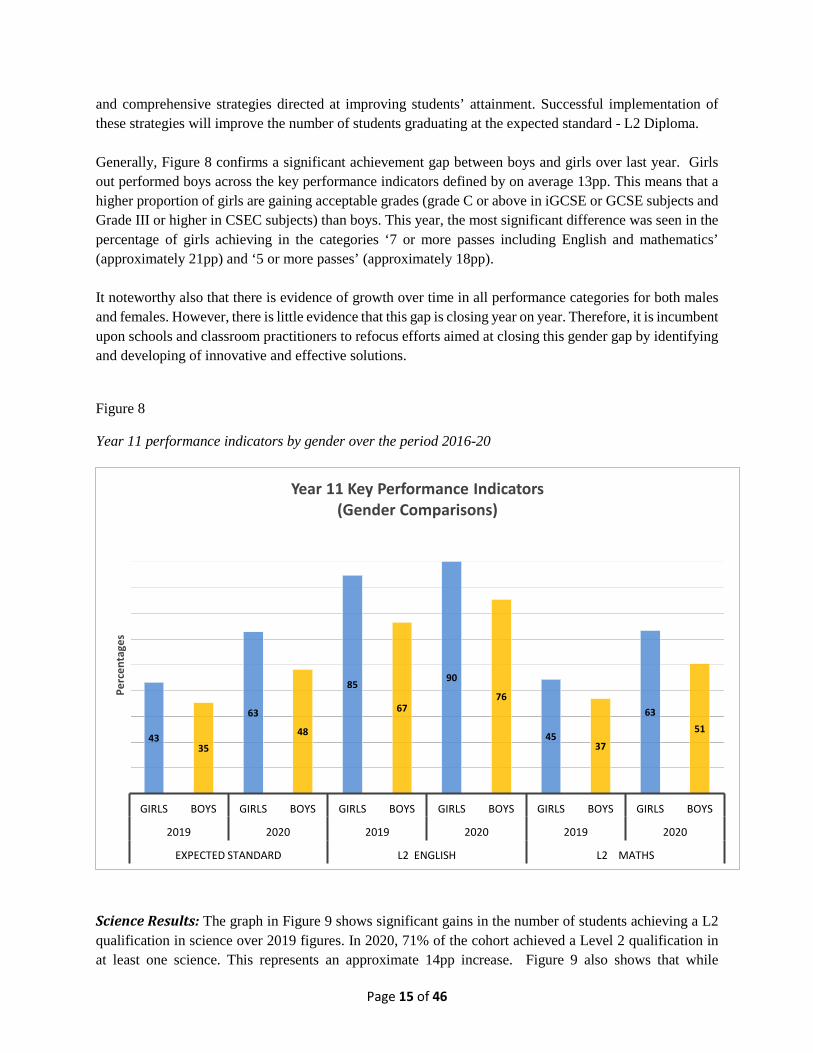
and comprehensive strategies directed at improving students’ attainment. Successful implementation of these strategies will improve the number of students graduating at the expected standard - L2 Diploma. Generally, Figure 8 confirms a significant achievement gap between boys and girls over last year. Girls out performed boys across the key performance indicators defined by on average 13pp. This means that a higher proportion of girls are gaining acceptable grades (grade C or above in iGCSE or GCSE subjects and Grade III or higher in CSEC subjects) than boys. This year, the most significant difference was seen in the percentage of girls achieving in the categories ‘7 or more passes including English and mathematics’ (approximately 21pp) and ‘5 or more passes’ (approximately 18pp). It noteworthy also that there is evidence of growth over time in all performance categories for both males and females. However, there is little evidence that this gap is closing year on year. Therefore, it is incumbent upon schools and classroom practitioners to refocus efforts aimed at closing this gender gap by identifying and developing of innovative and effective solutions. Figure 8 Year 11 performance indicators by gender over the period 2016-20
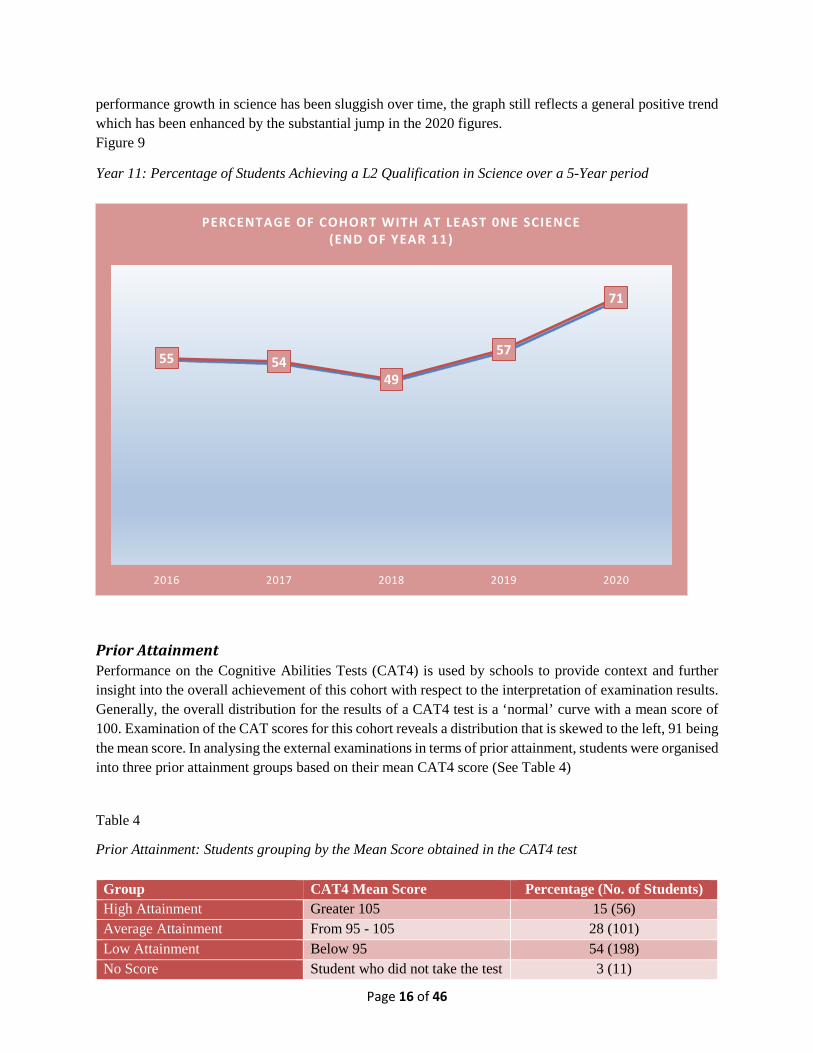
Science Results: The graph in Figure 9 shows significant gains in the number of students achieving a L2 qualification in science over 2019 figures. In 2020, 71% of the cohort achieved a Level 2 qualification in at least one science. This represents an approximate 14pp increase. Figure 9 also shows that while
4335
63
48
85
67
90
76
4537
6351
GIRLS BOYS GIRLS BOYS GIRLS BOYS GIRLS BOYS GIRLS BOYS GIRLS BOYS
2019 2020 2019 2020 2019 2020
EXPECTED STANDARD L2 ENGLISH L2 MATHS
Perc
enta
ges
Year 11 Key Performance Indicators(Gender Comparisons)
Page 16 of 46
performance growth in science has been sluggish over time, the graph still reflects a general positive trend which has been enhanced by the substantial jump in the 2020 figures. Figure 9 Year 11: Percentage of Students Achieving a L2 Qualification in Science over a 5-Year period
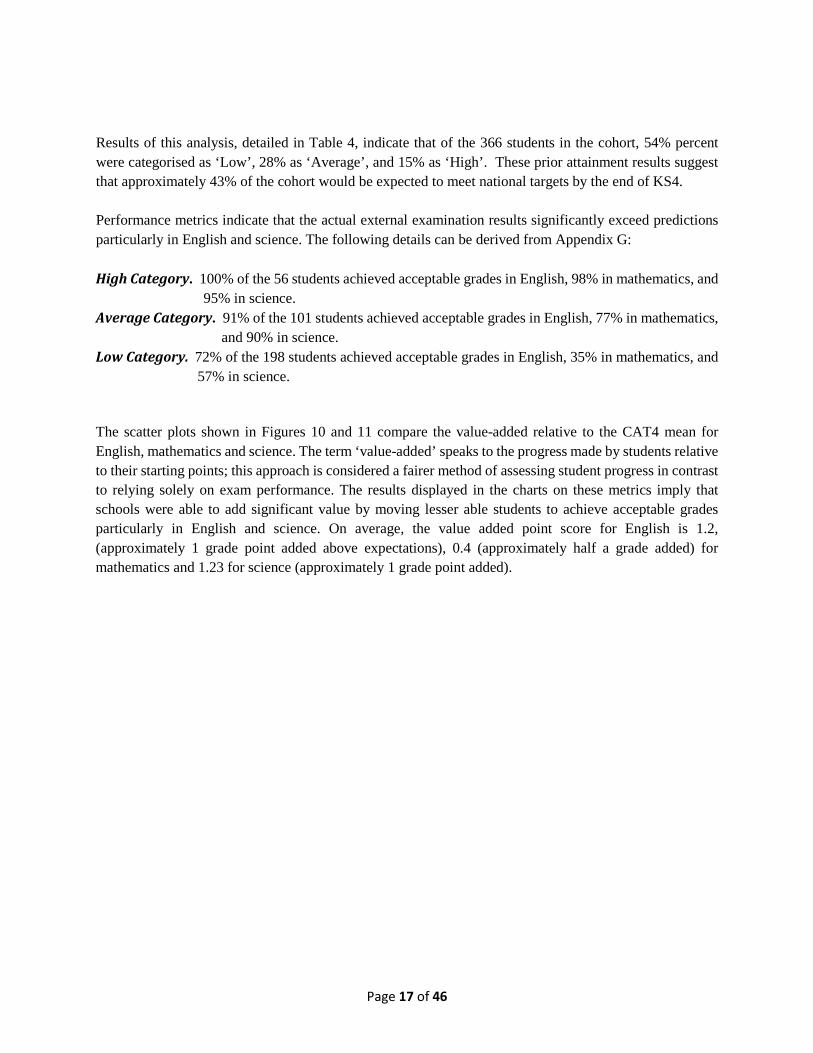
Prior Attainment Performance on the Cognitive Abilities Tests (CAT4) is used by schools to provide context and further insight into the overall achievement of this cohort with respect to the interpretation of examination results. Generally, the overall distribution for the results of a CAT4 test is a ‘normal’ curve with a mean score of 100. Examination of the CAT scores for this cohort reveals a distribution that is skewed to the left, 91 being the mean score. In analysing the external examinations in terms of prior attainment, students were organised into three prior attainment groups based on their mean CAT4 score (See Table 4) Table 4 Prior Attainment: Students grouping by the Mean Score obtained in the CAT4 test Group CAT4 Mean Score Percentage (No. of Students) High Attainment Greater 105 15 (56) Average Attainment From 95 - 105 28 (101) Low Attainment Below 95 54 (198) No Score Student who did not take the test 3 (11)
55 5449
57
71
2016 2017 2018 2019 2020
PERCENTAGE OF COHORT WITH AT LEAST 0NE SCIENCE(END OF YEAR 11)
Page 17 of 46
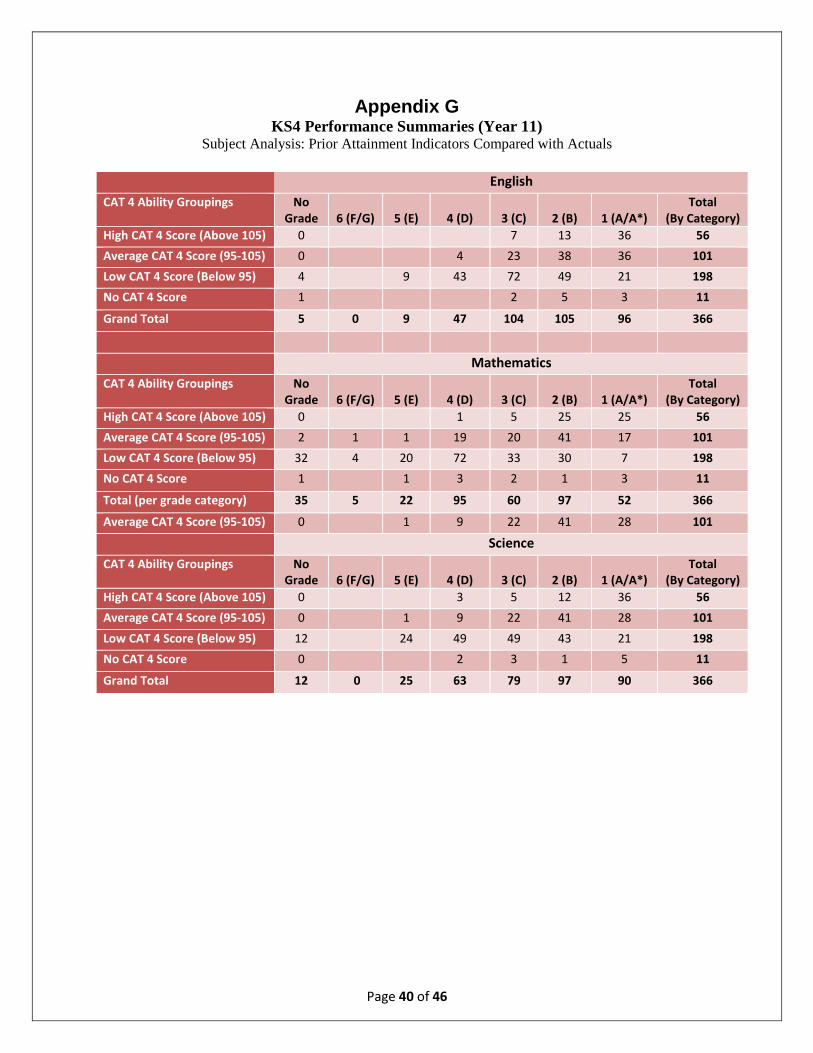
Results of this analysis, detailed in Table 4, indicate that of the 366 students in the cohort, 54% percent were categorised as ‘Low’, 28% as ‘Average’, and 15% as ‘High’. These prior attainment results suggest that approximately 43% of the cohort would be expected to meet national targets by the end of KS4. Performance metrics indicate that the actual external examination results significantly exceed predictions particularly in English and science. The following details can be derived from Appendix G: High Category. 100% of the 56 students achieved acceptable grades in English, 98% in mathematics, and
95% in science. Average Category. 91% of the 101 students achieved acceptable grades in English, 77% in mathematics,
and 90% in science. Low Category. 72% of the 198 students achieved acceptable grades in English, 35% in mathematics, and
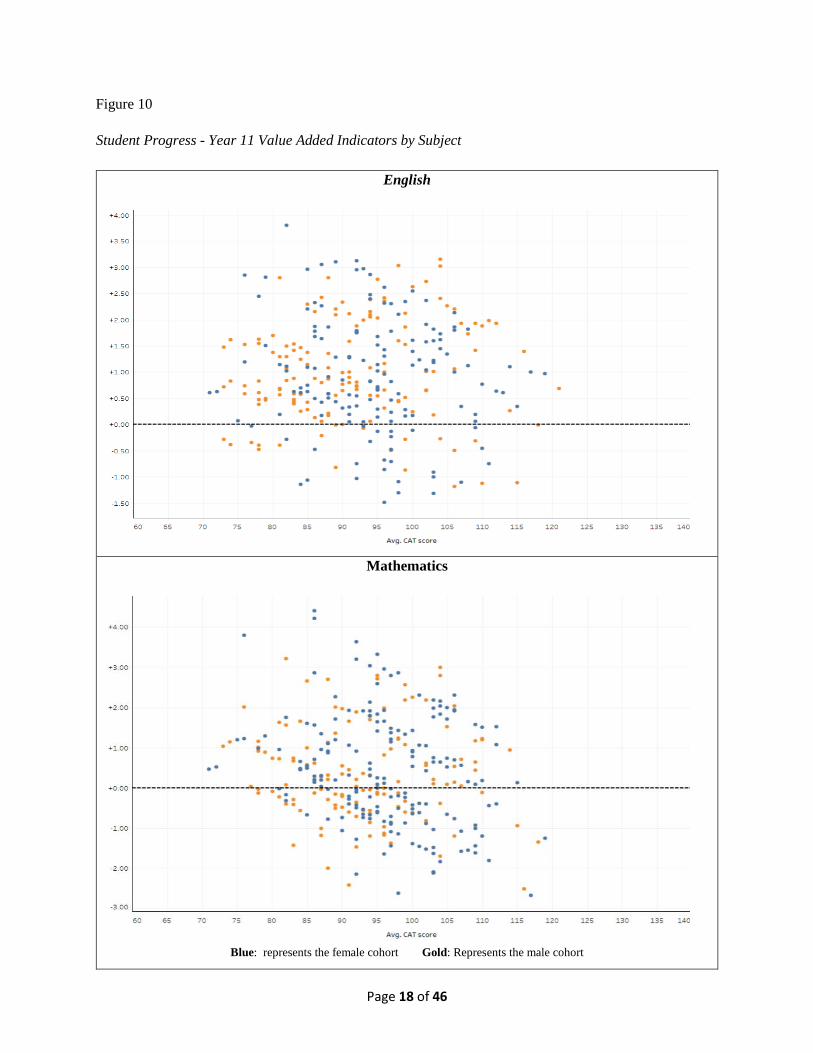
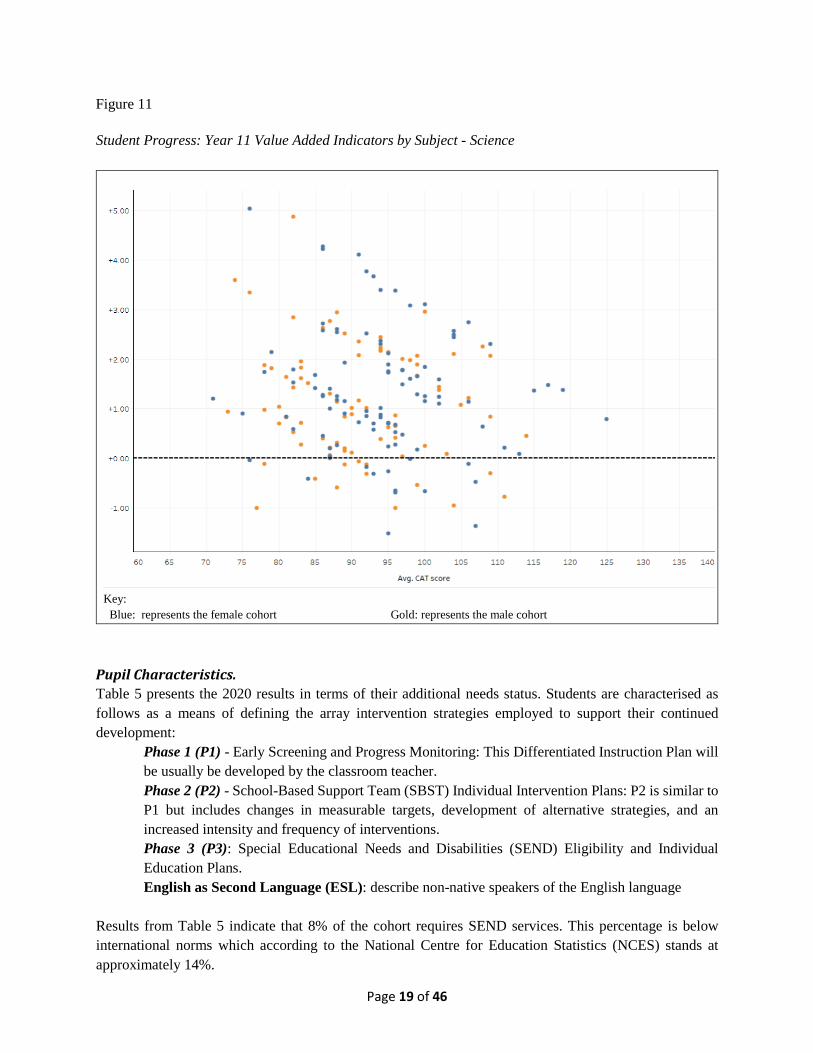
57% in science. The scatter plots shown in Figures 10 and 11 compare the value-added relative to the CAT4 mean for English, mathematics and science. The term ‘value-added’ speaks to the progress made by students relative to their starting points; this approach is considered a fairer method of assessing student progress in contrast to relying solely on exam performance. The results displayed in the charts on these metrics imply that schools were able to add significant value by moving lesser able students to achieve acceptable grades particularly in English and science. On average, the value added point score for English is 1.2, (approximately 1 grade point added above expectations), 0.4 (approximately half a grade added) for mathematics and 1.23 for science (approximately 1 grade point added).
Page 18 of 46
Figure 10 Student Progress - Year 11 Value Added Indicators by Subject
English
Mathematics
Blue: represents the female cohort Gold: Represents the male cohort
Page 19 of 46
Figure 11 Student Progress: Year 11 Value Added Indicators by Subject - Science
Key: Blue: represents the female cohort Gold: represents the male cohort
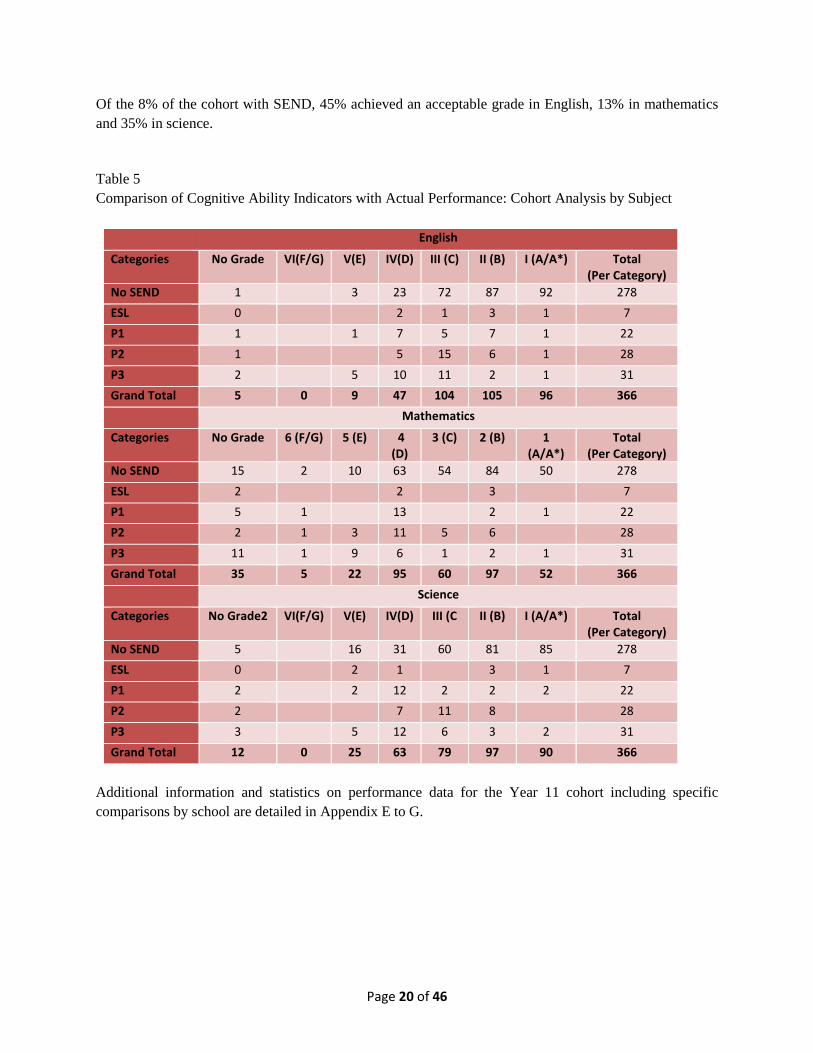
Pupil Characteristics. Table 5 presents the 2020 results in terms of their additional needs status. Students are characterised as follows as a means of defining the array intervention strategies employed to support their continued development:
Phase 1 (P1) - Early Screening and Progress Monitoring: This Differentiated Instruction Plan will be usually be developed by the classroom teacher. Phase 2 (P2) - School-Based Support Team (SBST) Individual Intervention Plans: P2 is similar to P1 but includes changes in measurable targets, development of alternative strategies, and an increased intensity and frequency of interventions. Phase 3 (P3): Special Educational Needs and Disabilities (SEND) Eligibility and Individual Education Plans. English as Second Language (ESL): describe non-native speakers of the English language
Results from Table 5 indicate that 8% of the cohort requires SEND services. This percentage is below international norms which according to the National Centre for Education Statistics (NCES) stands at approximately 14%.
Page 20 of 46
Of the 8% of the cohort with SEND, 45% achieved an acceptable grade in English, 13% in mathematics and 35% in science. Table 5 Comparison of Cognitive Ability Indicators with Actual Performance: Cohort Analysis by Subject
English
Categories No Grade VI(F/G) V(E) IV(D) III (C) II (B) I (A/A*) Total (Per Category)
No SEND 1
3 23 72 87 92 278 ESL 0
2 1 3 1 7
P1 1
1 7 5 7 1 22 P2 1
5 15 6 1 28
P3 2
5 10 11 2 1 31 Grand Total 5 0 9 47 104 105 96 366
Mathematics
Categories No Grade 6 (F/G) 5 (E) 4 (D)
3 (C) 2 (B) 1 (A/A*)
Total (Per Category)
No SEND 15 2 10 63 54 84 50 278 ESL 2
2
3
7
P1 5 1
13
2 1 22 P2 2 1 3 11 5 6
28
P3 11 1 9 6 1 2 1 31 Grand Total 35 5 22 95 60 97 52 366
Science
Categories No Grade2 VI(F/G) V(E) IV(D) III (C II (B) I (A/A*) Total (Per Category)
No SEND 5
16 31 60 81 85 278 ESL 0
2 1
3 1 7
P1 2
2 12 2 2 2 22 P2 2
7 11 8
28
P3 3
5 12 6 3 2 31 Grand Total 12 0 25 63 79 97 90 366
Additional information and statistics on performance data for the Year 11 cohort including specific comparisons by school are detailed in Appendix E to G.
Page 21 of 46
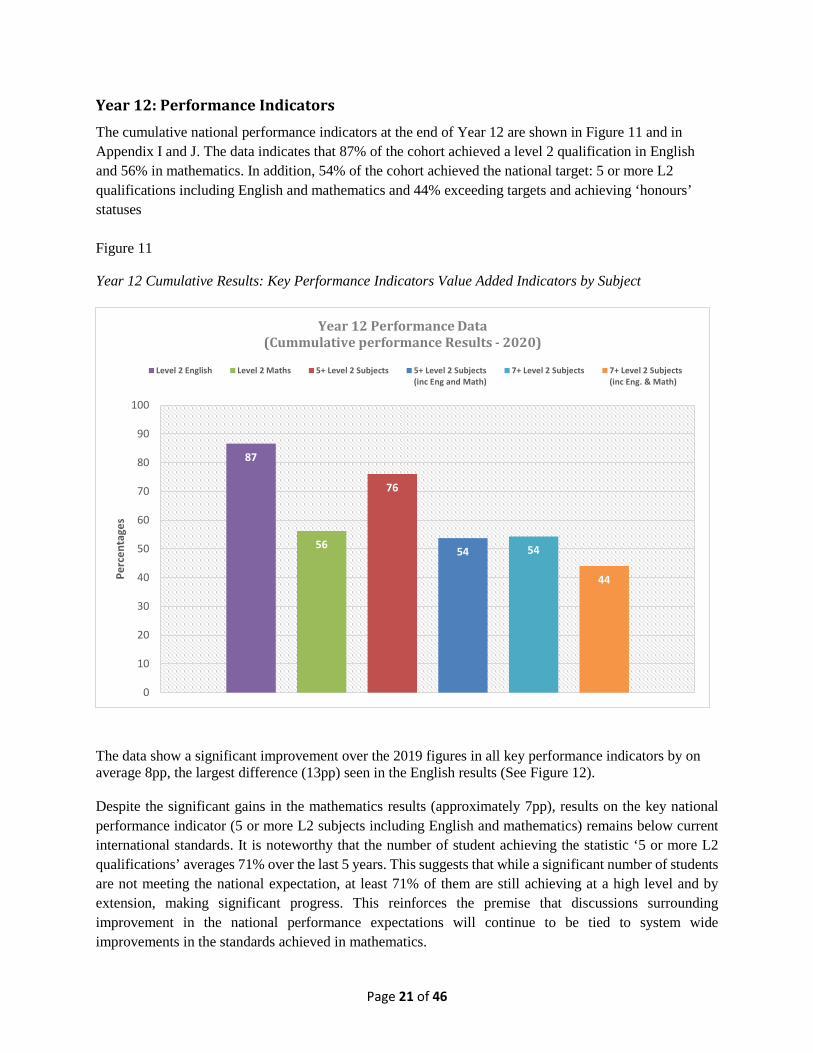
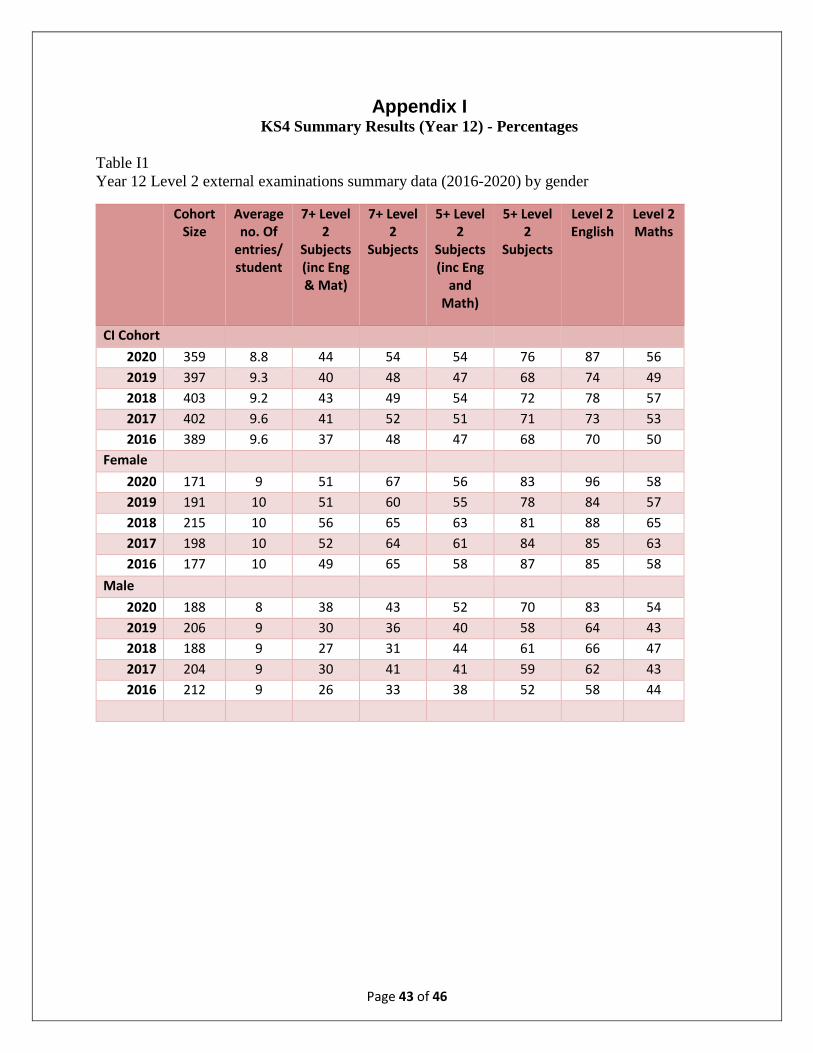
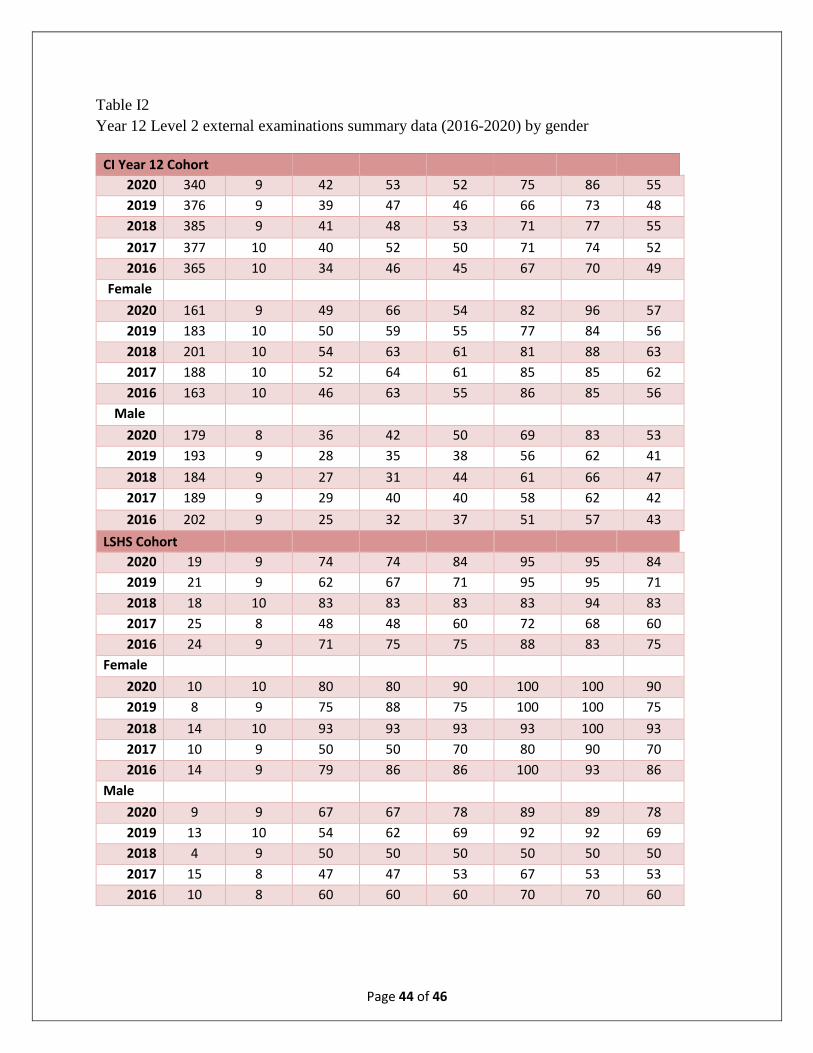
Year 12: Performance Indicators The cumulative national performance indicators at the end of Year 12 are shown in Figure 11 and in Appendix I and J. The data indicates that 87% of the cohort achieved a level 2 qualification in English and 56% in mathematics. In addition, 54% of the cohort achieved the national target: 5 or more L2 qualifications including English and mathematics and 44% exceeding targets and achieving ‘honours’ statuses Figure 11 Year 12 Cumulative Results: Key Performance Indicators Value Added Indicators by Subject
The data show a significant improvement over the 2019 figures in all key performance indicators by on average 8pp, the largest difference (13pp) seen in the English results (See Figure 12). Despite the significant gains in the mathematics results (approximately 7pp), results on the key national performance indicator (5 or more L2 subjects including English and mathematics) remains below current international standards. It is noteworthy that the number of student achieving the statistic ‘5 or more L2 qualifications’ averages 71% over the last 5 years. This suggests that while a significant number of students are not meeting the national expectation, at least 71% of them are still achieving at a high level and by extension, making significant progress. This reinforces the premise that discussions surrounding improvement in the national performance expectations will continue to be tied to system wide improvements in the standards achieved in mathematics.
87
56
76
54 54
44
0
10
20
30
40
50
60
70
80
90
100
Perc
enta
ges
Year 12 Performance Data(Cummulative performance Results - 2020)
Level 2 English Level 2 Maths 5+ Level 2 Subjects 5+ Level 2 Subjects(inc Eng and Math)
7+ Level 2 Subjects 7+ Level 2 Subjects(inc Eng. & Math)
Page 22 of 46
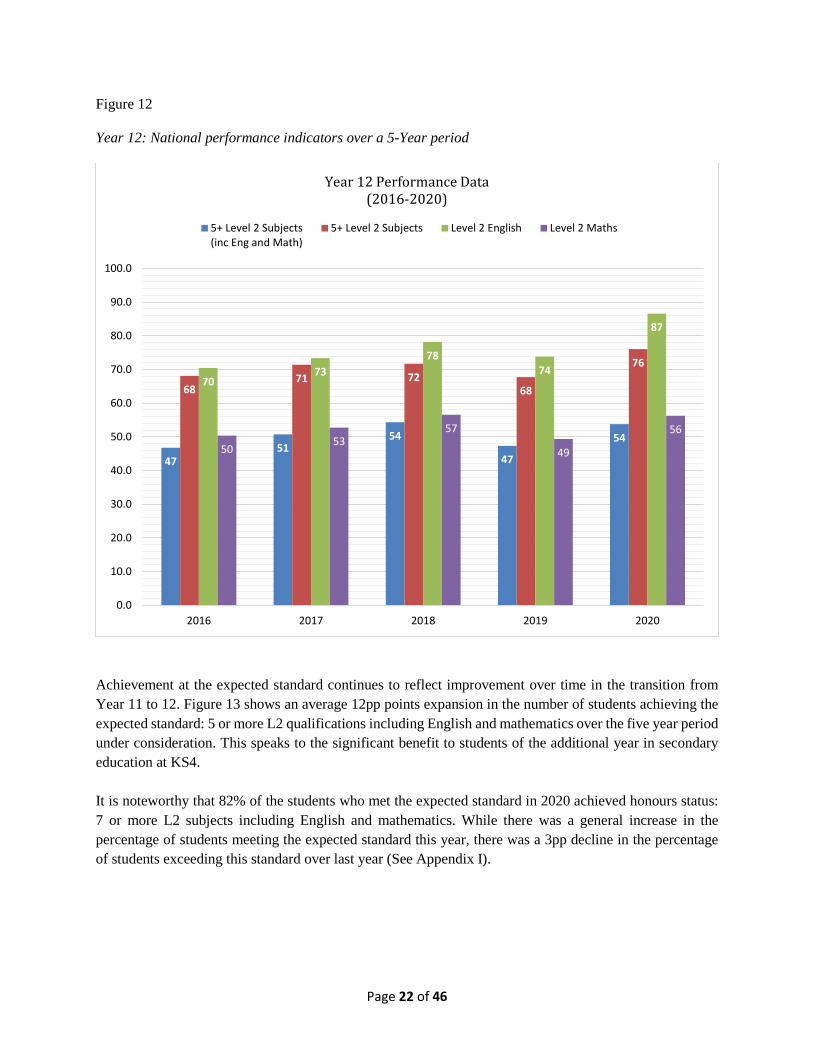
Figure 12 Year 12: National performance indicators over a 5-Year period
Achievement at the expected standard continues to reflect improvement over time in the transition from Year 11 to 12. Figure 13 shows an average 12pp points expansion in the number of students achieving the expected standard: 5 or more L2 qualifications including English and mathematics over the five year period under consideration. This speaks to the significant benefit to students of the additional year in secondary education at KS4. It is noteworthy that 82% of the students who met the expected standard in 2020 achieved honours status: 7 or more L2 subjects including English and mathematics. While there was a general increase in the percentage of students meeting the expected standard this year, there was a 3pp decline in the percentage of students exceeding this standard over last year (See Appendix I).
4751
54
47
54
6871 72
68
7670
7378
74
87
5053
57
49
56
0.0
10.0
20.0
30.0
40.0
50.0
60.0
70.0
80.0
90.0
100.0
2016 2017 2018 2019 2020
Year 12 Performance Data(2016-2020)
5+ Level 2 Subjects(inc Eng and Math)
5+ Level 2 Subjects Level 2 English Level 2 Maths
Page 23 of 46
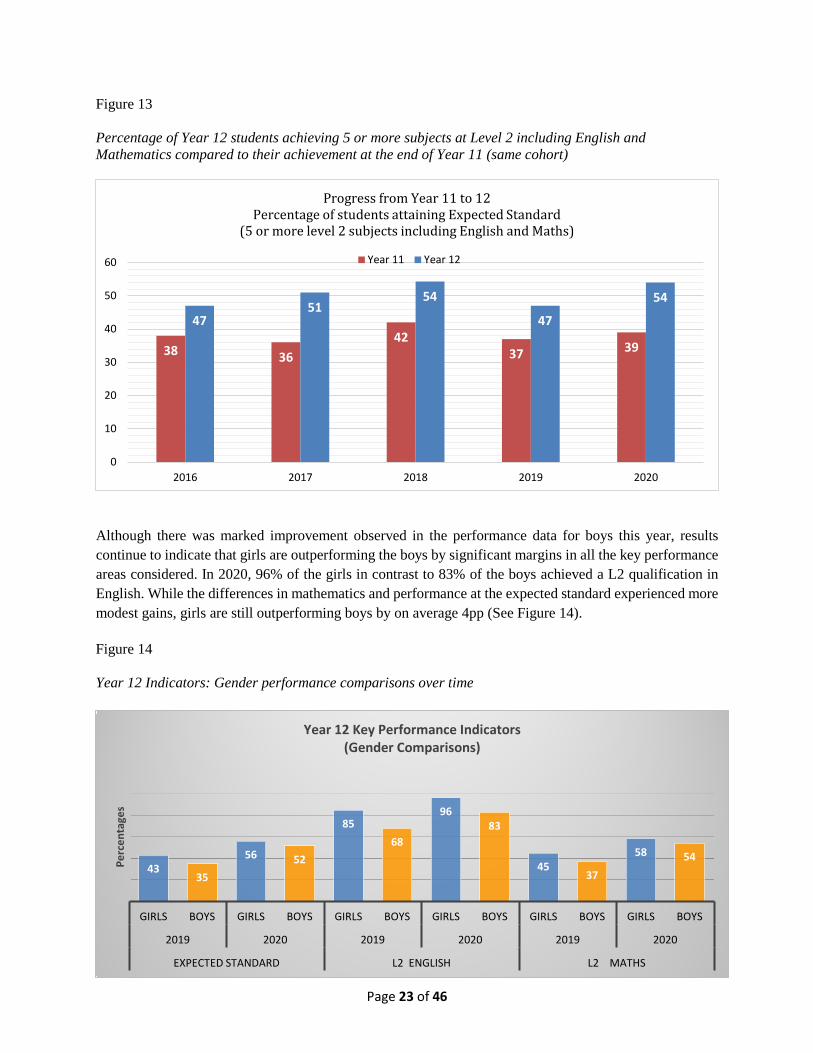
Figure 13 Percentage of Year 12 students achieving 5 or more subjects at Level 2 including English and Mathematics compared to their achievement at the end of Year 11 (same cohort)
Although there was marked improvement observed in the performance data for boys this year, results continue to indicate that girls are outperforming the boys by significant margins in all the key performance areas considered. In 2020, 96% of the girls in contrast to 83% of the boys achieved a L2 qualification in English. While the differences in mathematics and performance at the expected standard experienced more modest gains, girls are still outperforming boys by on average 4pp (See Figure 14). Figure 14 Year 12 Indicators: Gender performance comparisons over time
38 3642
37 39
4751
54
47
54
0
10
20
30
40
50
60
2016 2017 2018 2019 2020
Progress from Year 11 to 12Percentage of students attaining Expected Standard
(5 or more level 2 subjects including English and Maths)
Year 11 Year 12
4335
56 52
8568
9683
4537
58 54
GIRLS BOYS GIRLS BOYS GIRLS BOYS GIRLS BOYS GIRLS BOYS GIRLS BOYS
2019 2020 2019 2020 2019 2020
EXPECTED STANDARD L2 ENGLISH L2 MATHS
Perc
enta
ges
Year 12 Key Performance Indicators(Gender Comparisons)
Page 24 of 46
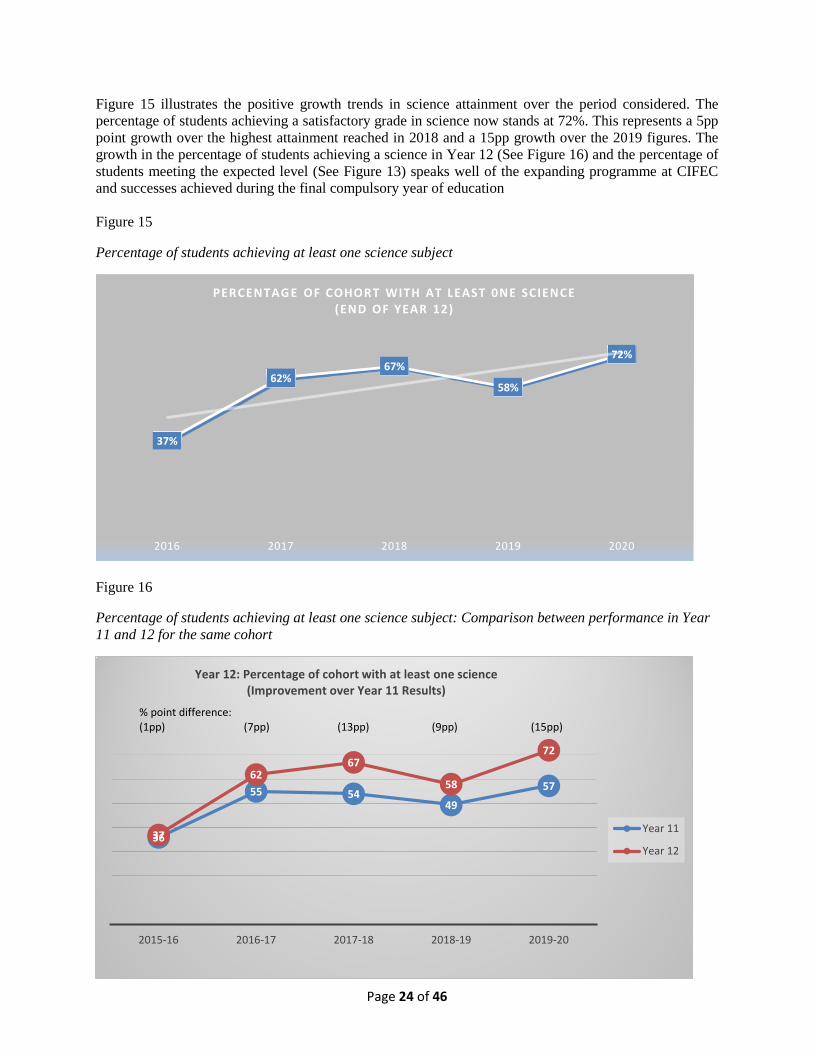
Figure 15 illustrates the positive growth trends in science attainment over the period considered. The percentage of students achieving a satisfactory grade in science now stands at 72%. This represents a 5pp point growth over the highest attainment reached in 2018 and a 15pp growth over the 2019 figures. The growth in the percentage of students achieving a science in Year 12 (See Figure 16) and the percentage of students meeting the expected level (See Figure 13) speaks well of the expanding programme at CIFEC and successes achieved during the final compulsory year of education Figure 15 Percentage of students achieving at least one science subject
Figure 16 Percentage of students achieving at least one science subject: Comparison between performance in Year 11 and 12 for the same cohort
37%
62%67%
58%
72%
2016 2017 2018 2019 2020
PERCENTAGE OF COHORT WITH AT LEAST 0NE SCIENCE(END OF YEAR 12)
36
55 5449
57
37
6267
58
72
2015-16 2016-17 2017-18 2018-19 2019-20
Year 12: Percentage of cohort with at least one science (Improvement over Year 11 Results)
Year 11
Year 12
% point difference:(1pp) (7pp) (13pp) (9pp) (15pp)
Page 25 of 46
Cognitive Abilities Tests (CAT4) – Year 12
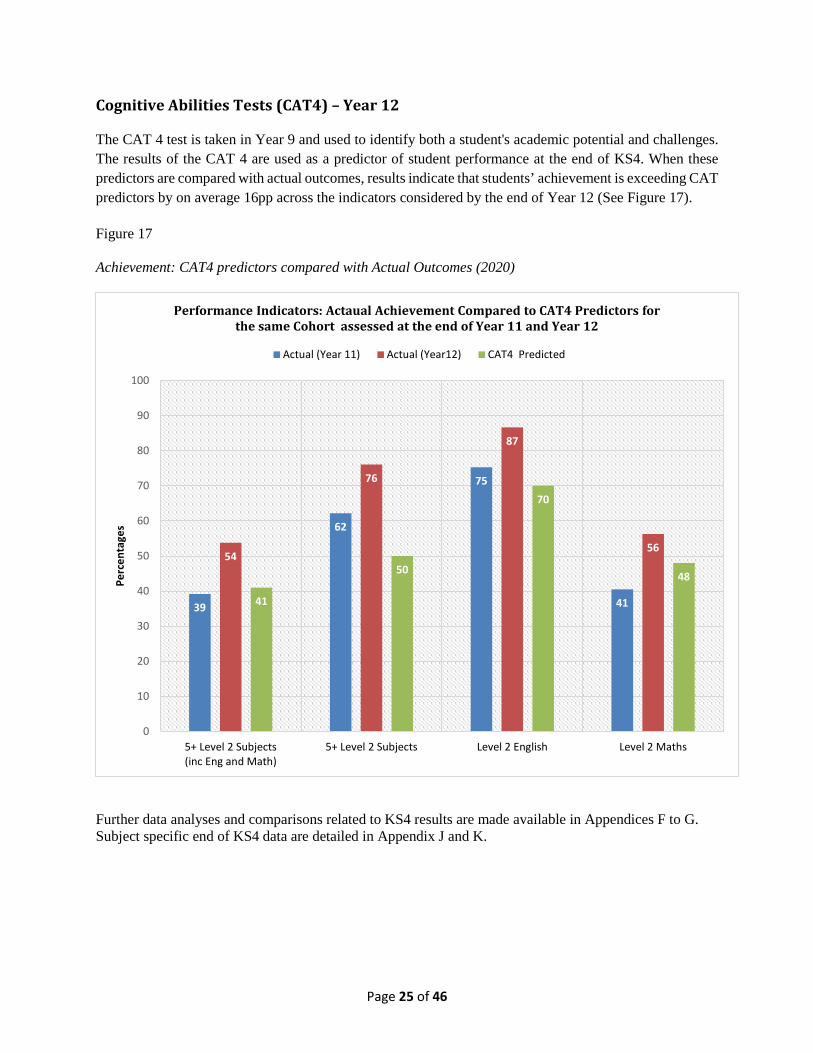
The CAT 4 test is taken in Year 9 and used to identify both a student's academic potential and challenges. The results of the CAT 4 are used as a predictor of student performance at the end of KS4. When these predictors are compared with actual outcomes, results indicate that students’ achievement is exceeding CAT predictors by on average 16pp across the indicators considered by the end of Year 12 (See Figure 17). Figure 17 Achievement: CAT4 predictors compared with Actual Outcomes (2020)
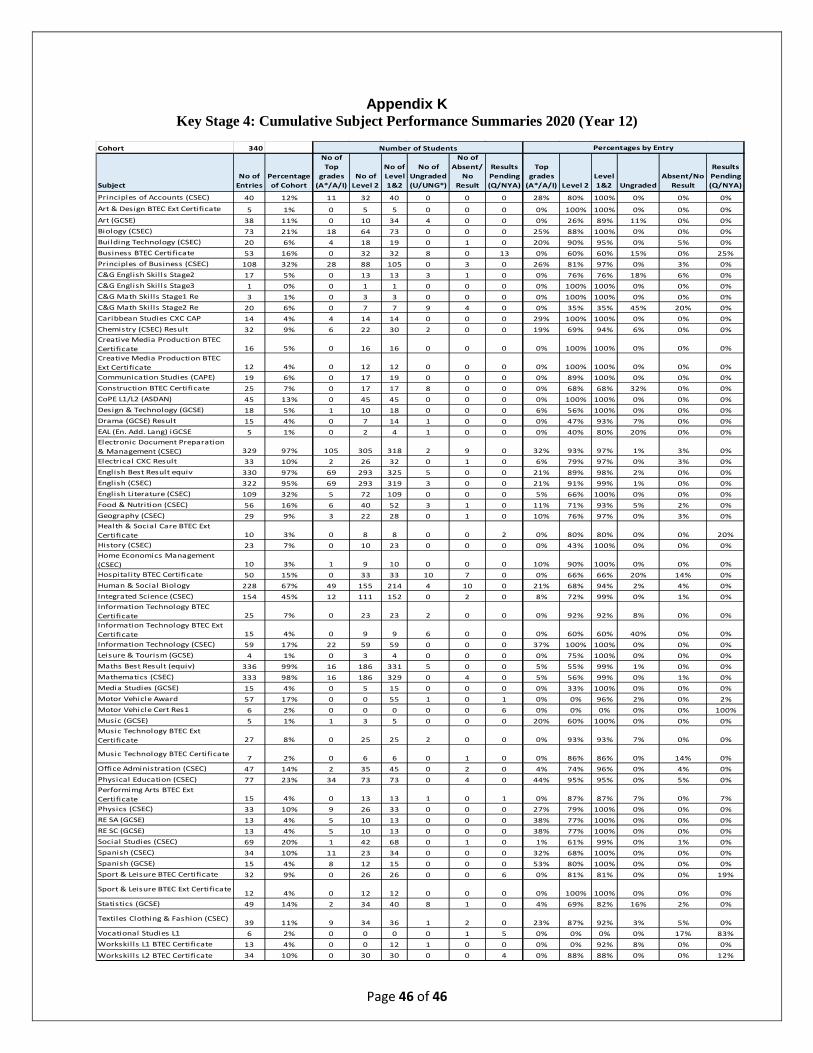
Further data analyses and comparisons related to KS4 results are made available in Appendices F to G. Subject specific end of KS4 data are detailed in Appendix J and K.
39
62
75
41
54
76
87
56
41
50
70
48
0
10
20
30
40
50
60
70
80
90
100
5+ Level 2 Subjects(inc Eng and Math)
5+ Level 2 Subjects Level 2 English Level 2 Maths
Perc
enta
ges
Performance Indicators: Actaual Achievement Compared to CAT4 Predictors for the same Cohort assessed at the end of Year 11 and Year 12
Actual (Year 11) Actual (Year12) CAT4 Predicted
Page 26 of 46
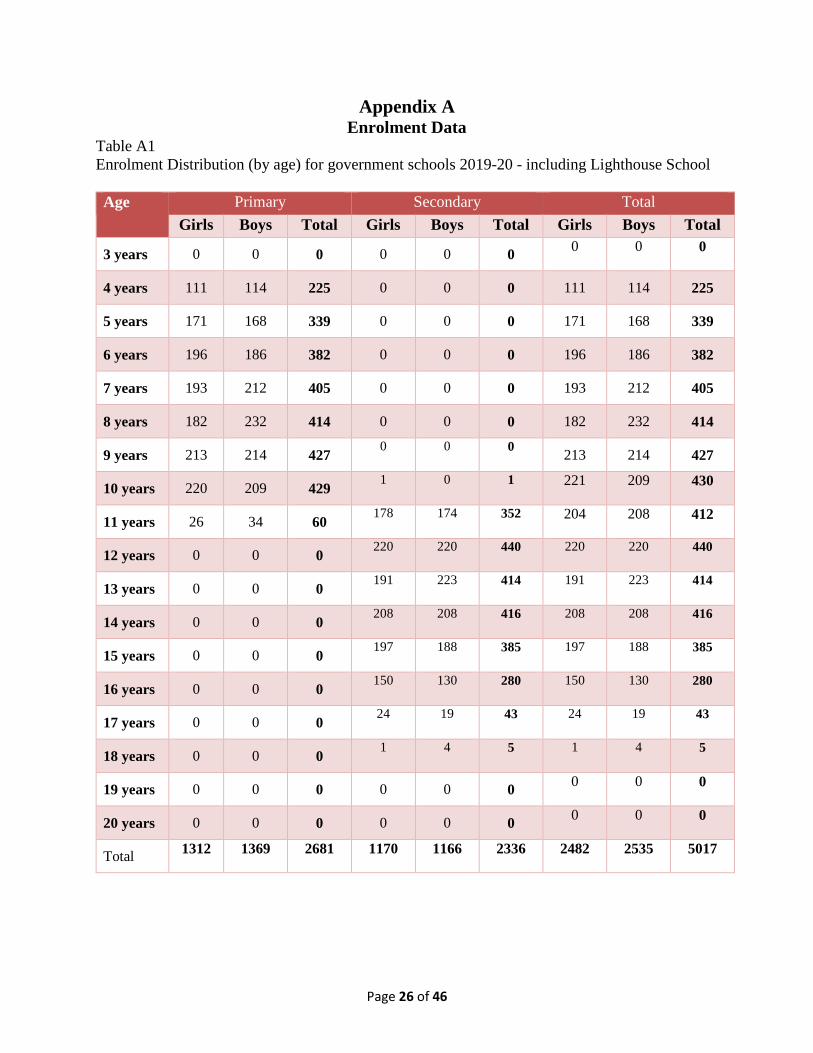
Appendix A Enrolment Data
Table A1 Enrolment Distribution (by age) for government schools 2019-20 - including Lighthouse School Age Primary Secondary Total
Girls Boys Total Girls Boys Total Girls Boys Total
3 years 0 0 0 0 0 0 0 0 0
4 years 111 114 225 0 0 0 111 114 225
5 years 171 168 339 0 0 0 171 168 339
6 years 196 186 382 0 0 0 196 186 382
7 years 193 212 405 0 0 0 193 212 405
8 years 182 232 414 0 0 0 182 232 414
9 years 213 214 427 0 0 0 213 214 427
10 years 220 209 429 1 0 1 221 209 430
11 years 26 34 60 178 174 352 204 208 412
12 years 0 0 0 220 220 440 220 220 440
13 years 0 0 0 191 223 414 191 223 414
14 years 0 0 0 208 208 416 208 208 416
15 years 0 0 0 197 188 385 197 188 385
16 years 0 0 0 150 130 280 150 130 280
17 years 0 0 0 24 19 43 24 19 43
18 years 0 0 0 1 4 5 1 4 5
19 years 0 0 0 0 0 0 0 0 0
20 years 0 0 0 0 0 0 0 0 0
Total 1312 1369 2681 1170 1166 2336 2482 2535 5017
Page 27 of 46
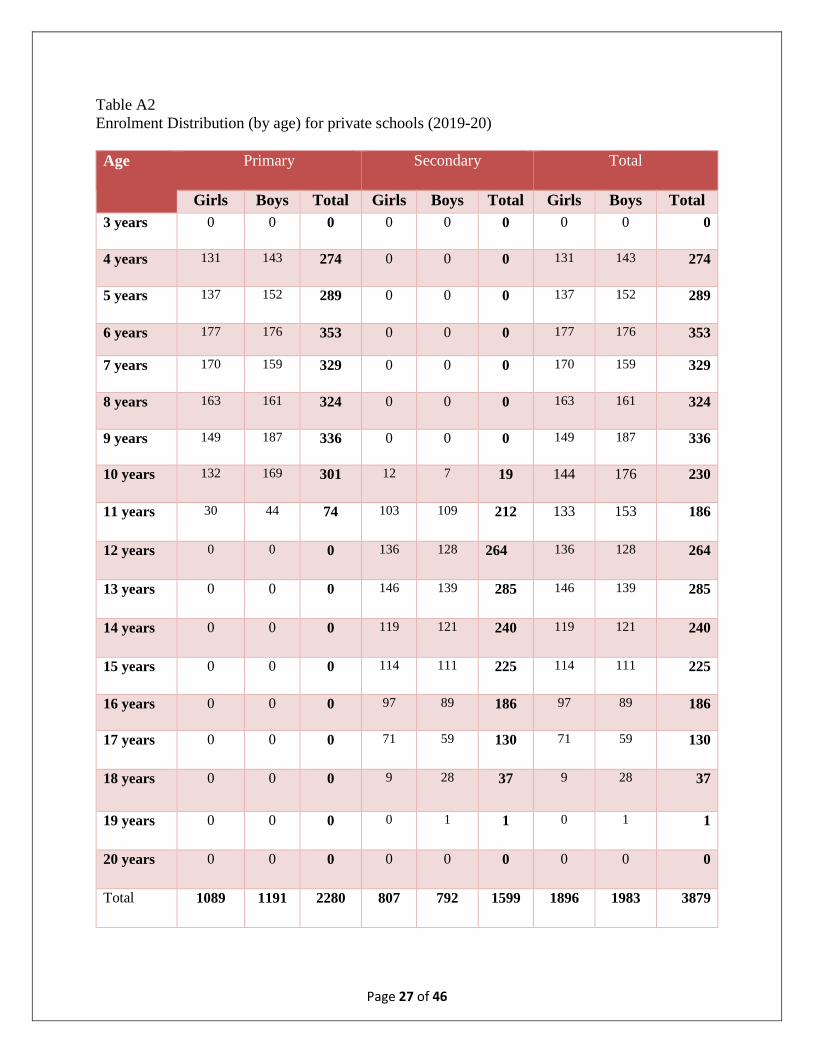
Table A2 Enrolment Distribution (by age) for private schools (2019-20) Age Primary Secondary Total
Girls Boys Total Girls Boys Total Girls Boys Total 3 years 0 0 0 0 0 0 0 0 0
4 years 131 143 274 0 0 0 131 143 274
5 years 137 152 289 0 0 0 137 152 289
6 years 177 176 353 0 0 0 177 176 353
7 years 170 159 329 0 0 0 170 159 329
8 years 163 161 324 0 0 0 163 161 324
9 years 149 187 336 0 0 0 149 187 336
10 years 132 169 301 12 7 19 144 176 230
11 years 30 44 74 103 109 212 133 153 186
12 years 0 0 0 136 128 264 136 128 264
13 years 0 0 0 146 139 285 146 139 285
14 years 0 0 0 119 121 240 119 121 240
15 years 0 0 0 114 111 225 114 111 225
16 years 0 0 0 97 89 186 97 89 186
17 years 0 0 0 71 59 130 71 59 130
18 years 0 0 0 9 28 37 9 28 37
19 years 0 0 0 0 1 1 0 1 1
20 years 0 0 0 0 0 0 0 0 0
Total 1089 1191 2280 807 792 1599 1896 1983 3879
Page 28 of 46
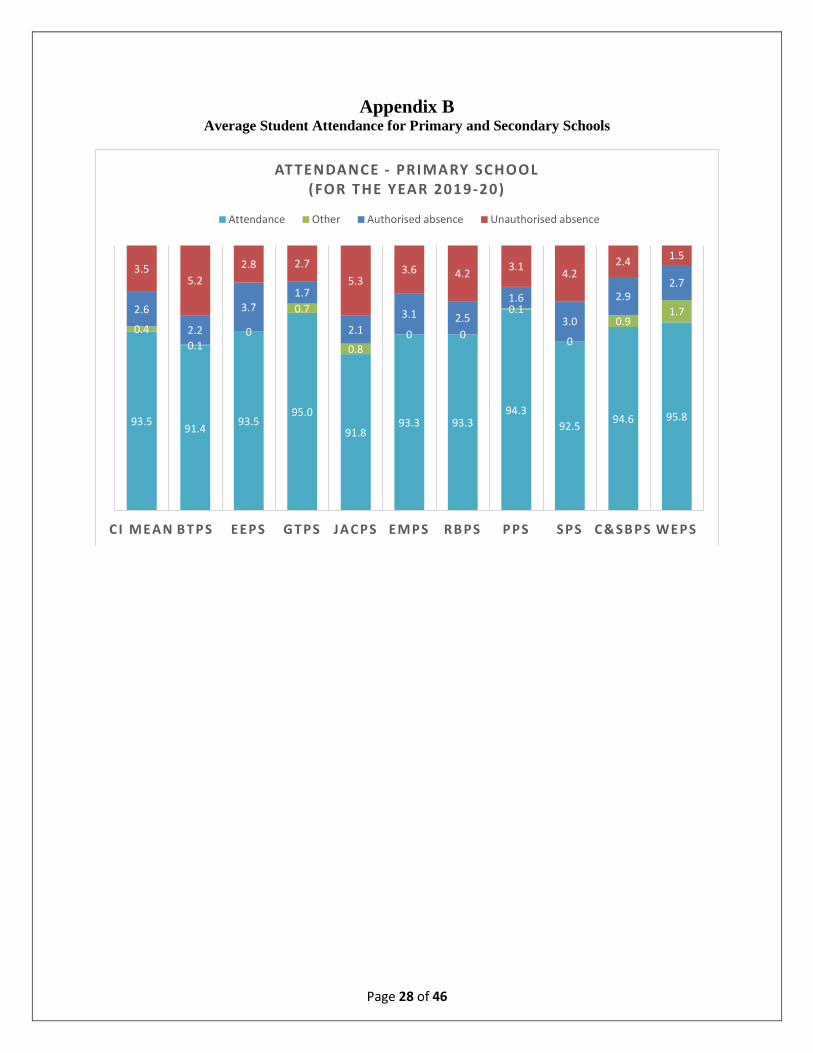
Appendix B Average Student Attendance for Primary and Secondary Schools
93.5 91.4 93.595.0
91.893.3 93.3
94.392.5 94.6 95.8
0.40.1
0
0.7
0.80 0
0.1
0
0.91.72.6
2.2
3.71.7
2.13.1 2.5
1.6
3.0
2.92.7
3.55.2
2.8 2.75.3
3.6 4.2 3.1 4.22.4 1.5
CI MEAN BT PS EEPS GT PS JACPS EMPS RBPS PPS SPS C&SBPS WEPS
AT TENDANCE - PRIMARY SCHOOL(FOR THE YEAR 2019-20)
Attendance Other Authorised absence Unauthorised absence
Page 29 of 46
93.6 92.093.2
95.5
85.5
0.30 0.20.0
0.7
5.9
2.90 3.23.3
2.2
3.0
5.37 4.63.5
1.6
6.7
80%
82%
84%
86%
88%
90%
92%
94%
96%
98%
100%
C I M E A N( E X C L U D I N G
C I F E C )
C H H S J G H S L S H S N A T I O N A L S E C O N D A R Y
PERC
ENTA
GES
SCHOOLS
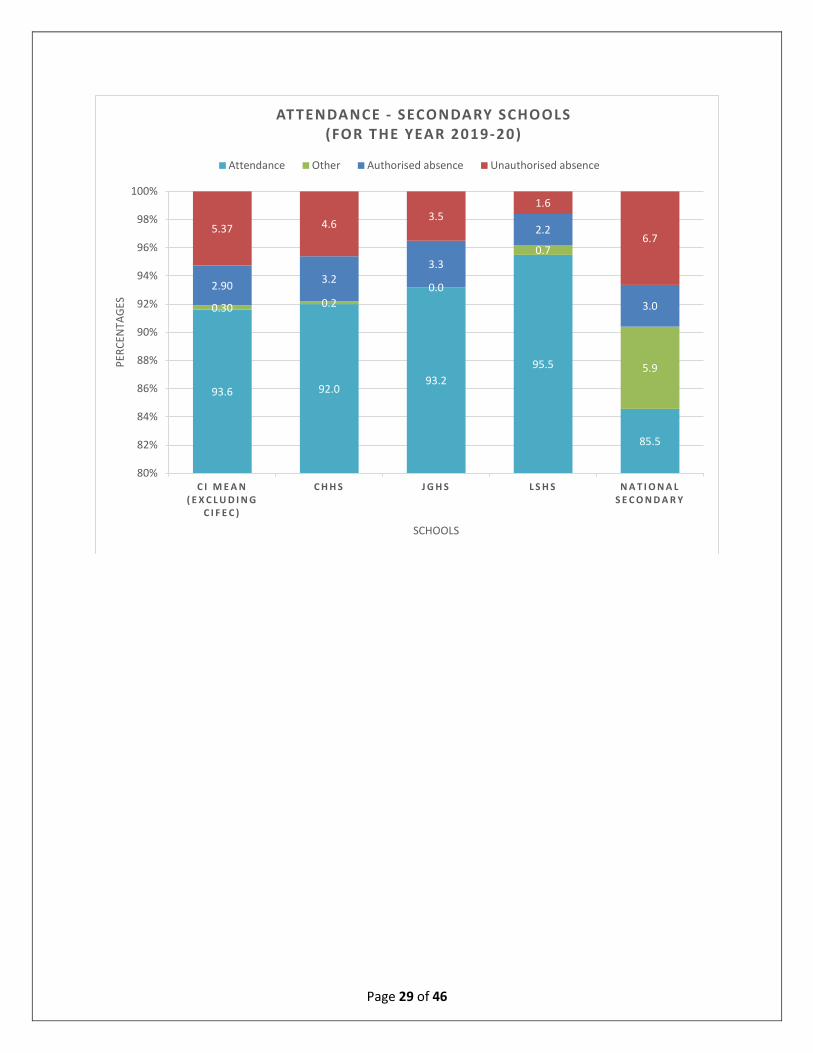
AT TENDANCE - SECONDARY SCHOOLS(FOR THE YEAR 2019-20)
Attendance Other Authorised absence Unauthorised absence
Page 30 of 46
Appendix C KS2 Summary Results – Actuals vrs. CAT4 Predictors
Table C1: English Reading Results
Actual Numbers Actuals CAT Predictions
School Cohort Size
Below Expected
level
At Expected
Level
Exceeding Expected
Level
Below Expected
level
At Expected
Level
Exceeding Expected
Level
Bodden Town Primary School 43 28 10 5 5 27 11 Creek and Spott Bay Primary 13 3 4 6 1 9 3 East End Primary School 12 2 10 0 1 7 4 Edna M Moyle Primary School 13 5 4 4 0 9 4 George Town Primary School 40 31 8 1 3 33 4 John A Cumber Primary School 84 40 38 6 17 48 19 Prospect Primary School 54 10 23 21 4 33 17 Red Bay Primary School 73 23 35 15 4 45 24 Savannah Primary School 65 19 37 9 3 40 22 West End Primary School 15 2 8 5 1 7 7 Total 412 163 177 72 39 258 115 Percentages:
School Cohort Size
Below Expected
level
At Expected
Level
Exceeding Expected
Level
Below Expected
level
At Expected
Level
Exceeding Expected
Level
Bodden Town Primary School 43 65% 23% 12% 12% 63% 26% Creek and Spott Bay Primary 13 23% 31% 46% 8% 69% 23% East End Primary School 12 17% 83% 0% 8% 58% 33% Edna M Moyle Primary School 13 38% 31% 31% 0% 69% 31% George Town Primary School 40 78% 20% 3% 8% 83% 10% John A Cumber Primary School 84 48% 45% 7% 20% 57% 23% Prospect Primary School 54 19% 43% 39% 7% 61% 31% Red Bay Primary School 73 32% 48% 21% 5% 62% 33% Savannah Primary School 65 29% 57% 14% 5% 62% 34% West End Primary School 15 13% 53% 33% 7% 47% 47% Total 412 40% 43% 17% 9% 63% 28%
Page 31 of 46
Table C2: English Writing Results
Numbers
Actual CAT4 Predictors
School Cohort Size
Below Expected
level
At Expected
Level
Exceeding Expected
Level
Below Expected
level
At Expected
Level
Exceeding Expected
Level
Bodden Town Primary School 43 27 15 1 5 29 9 Creek and Spott Bay Primary 13 4 7 2 1 10 2 East End Primary School 12 5 7 0 1 9 2 Edna M Moyle Primary School 13 4 4 5 0 11 2 George Town Primary School 40 29 11 0 3 36 1 John A Cumber Primary School 84 40 41 3 17 53 14 Prospect Primary School 54 15 29 10 4 38 12 Red Bay Primary School 73 31 37 5 4 49 20 Savannah Primary School 65 28 34 3 3 45 17 West End Primary School 15 3 10 2 1 11 3 Total 412 186 195 31 39 291 82
Percentage of Cohort
Actual CAT4 Predictors
School Cohort Size
Below Expected
level
At Expected
Level
Exceeding Expected
Level
Below Expected
level
At Expected Level
Exceeding
Expected
Level Bodden Town Primary School 43 63% 35% 2% 12% 67% 21% Creek and Spott Bay Primary 13 31% 54% 15% 8% 77% 15% East End Primary School 12 42% 58% 0% 8% 75% 17% Edna M Moyle Primary School 13 31% 31% 38% 0% 85% 15% George Town Primary School 40 73% 28% 0% 8% 90% 3% John A Cumber Primary School 84 48% 49% 4% 20% 63% 17% Prospect Primary School 54 28% 54% 19% 7% 70% 22% Red Bay Primary School 73 42% 51% 7% 5% 67% 27% Savannah Primary School 65 43% 52% 5% 5% 69% 26% West End Primary School 15 20% 67% 13% 7% 73% 20% Total 412 45% 47% 8% 9% 71% 20%
Page 32 of 46
Table C3: Mathematics Results Numbers
Actual CAT4 Predictors
School Cohort Size
Below Expected
level
At Expected
Level
Exceeding Expected
Level
Below Expected
level
At Expected
Level
Exceeding Expected
Level
Bodden Town Primary School 43 23 16 4 8 23 12 Creek and Spott Bay Primary 13 4 7 2 2 8 3 East End Primary School 12 3 9 0 0 8 4 Edna M Moyle Primary School 13 3 10 0 1 9 3 George Town Primary School 40 25 13 2 8 30 2 John A Cumber Primary School
84 49 33 2 29 44 11
Prospect Primary School 54 12 30 12 8 32 14 Red Bay Primary School 73 27 30 16 11 44 18 Savannah Primary School 65 22 30 13 10 30 25 West End Primary School 15 3 12 0 0 9 6 Total 412 171 190 51 77 237 98
Percentages
Actual CAT4 Predictors
School Cohort Size
Below Expected
level
At Expected
Level
Exceeding Expected
Level
Below Expected
level
At Expected
Level
Exceeding Expected
Level
Bodden Town Primary School 43 53% 37% 9% 19% 53% 28% Creek and Spott Bay Primary 13 31% 54% 15% 15% 62% 23% East End Primary School 12 25% 75% 0% 0% 67% 33% Edna M Moyle Primary School 13 23% 77% 0% 8% 69% 23% George Town Primary School 40 63% 33% 5% 20% 75% 5% John A Cumber Primary School
84 58% 39% 2% 35% 52% 13%
Prospect Primary School 54 22% 56% 22% 15% 59% 26% Red Bay Primary School 73 37% 41% 22% 15% 60% 25% Savannah Primary School 65 34% 46% 20% 15% 46% 38% West End Primary School 15 20% 80% 0% 0% 60% 40% Total 412 42% 46% 12% 19% 58% 24%
Page 33 of 46
Appendix D
Cayman Islands National Qualifications Framework (CINQF)
NQF Sample Qualifications Educational Stage
Level 5 Postgraduate Degree
Tertiary or Advanced Professional Qualifications
Level 4 Bachelor’s Degree or equivalent
Tertiary
Level 3 A-Levels Associate Degree IB Diploma CAPE BTEC Level 3 (Nationals) Advanced Placement Trinity Music Grade 8
Key Stage 5 Usually enables entry to the Bachelor’s Degree
(may also offer advanced standing)
Level 2
Cayman Islands Level 2 High School Diploma (Standard or Honours) CSEC (Grades I-III) GCSE/IGCSE (Grades A*-C) GED BTEC Level 2 (First diplomas) IMI Level 2 ASDAN (CoPE)
Trinity Music Grade 5
Years 10/11/12 (Key Stage 4 – Standard High School)
National Curriculum Level 7-8
Level 1
Cayman Islands Level 1 High School Diploma CSEC (Grades IV-VI) GCSE/IGCSE (Grades D-G) CCSLC (Grades C & M) BTEC Level 1 (Introductory) IMI Level 1
Years 7/8/9 (Key Stage 3 – Middle School) National Curriculum Level 5-6
Entry Level
Entry Level Certificates CoEA ASDAN Bronze Award
Years 4/5/6 (Key Stage 2 – Upper Primary) National Curriculum Level 3-4
Glossary of terms used in the CINQF A-Level Advanced level qualification. These examinations typically allow for entrance into Bachelor level
programmes ASDAN Award Scheme Development and
Accreditation Network This organization offers programmes and qualifications targeting skills for learning, employment and life.
BTEC Business and Technology Educational Council
An examining body that validates and certifies vocational courses.
CAPE Caribbean Advanced Proficiency Examination
This is an academic qualification awarded in a specified subject offered by the Caribbean Examinations Council; these examinations typically allow for entrance into Bachelor level programmes.
CCSLC Caribbean Certificate of Secondary Level Competence
This is an academic qualification awarded in a specified subject offered by the Caribbean Examinations Council; the certification is based on a core of knowledge skills, attitudes and values targeting school leavers.
CoEA Certificate of Educational Achievement An entry level certification usually assessed in the final three years of secondary schooling.
CSEC Caribbean Secondary Education Certificate
This is an academic qualification awarded in a range of subjects offered by the Caribbean Examinations Council. This award usually leads to entrance to further programmes of advanced study.
CXC Caribbean Examinations Council A regional examining body that offers examinations at various levels. GCSE General Certificate of Secondary
Education This is an academic qualification awarded in a specified subject, generally taken in a number of subjects by students aged 14–16 in secondary education.
GED General Educational Development GED tests are a group of five subject tests which, when passed, certify that the taker has American or Canadian high school level academic skills.
IB International Baccalaureate The IB Diploma typically allows for entrance into Bachelor level programmes. IGCSE International General Certificate of
Secondary Education This is an academic qualification awarded in a specified subject, generally taken in a number of subjects by students aged 14–16 in secondary education.
IMI Institute of the Motor Industry The IMI offers certification in courses such as Vehicle Maintenance and Repair at various levels of competence.
Page 34 of 46
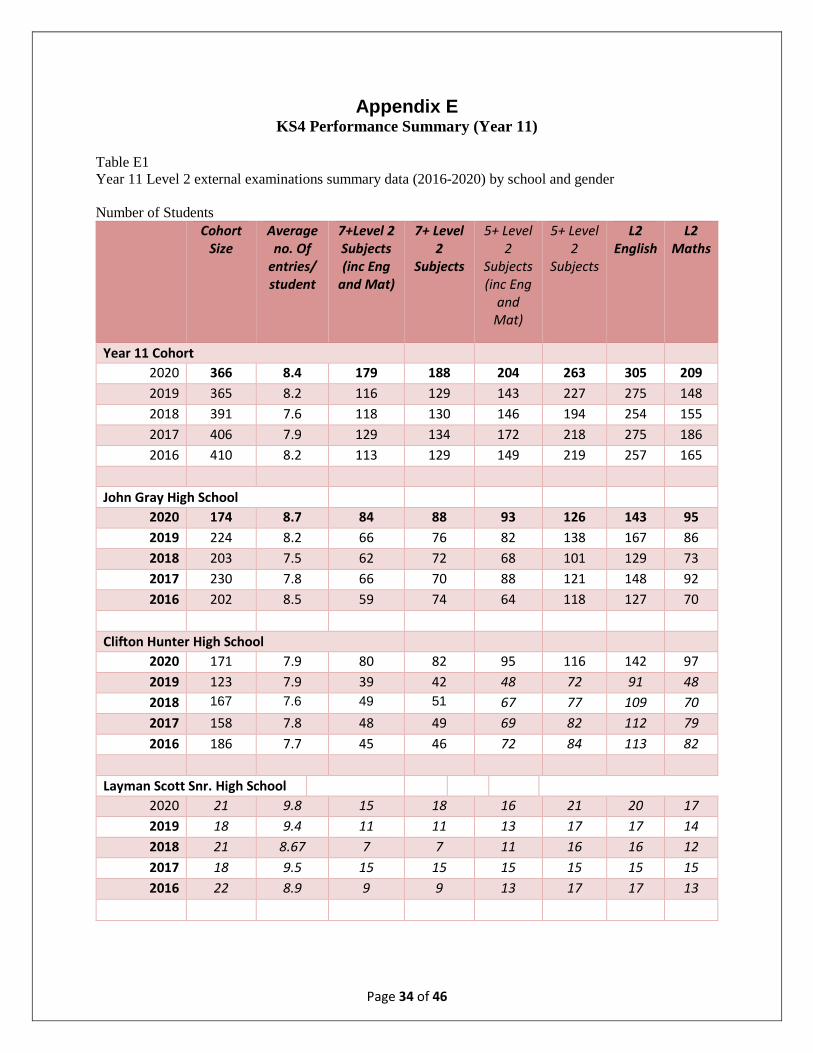
Appendix E KS4 Performance Summary (Year 11)
Table E1 Year 11 Level 2 external examinations summary data (2016-2020) by school and gender Number of Students
Cohort Size
Average no. Of
entries/ student
7+Level 2 Subjects (inc Eng
and Mat)
7+ Level 2
Subjects
5+ Level 2
Subjects (inc Eng
and Mat)
5+ Level 2
Subjects
L2 English
L2 Maths
Year 11 Cohort
2020 366 8.4 179 188 204 263 305 209 2019 365 8.2 116 129 143 227 275 148 2018 391 7.6 118 130 146 194 254 155 2017 406 7.9 129 134 172 218 275 186 2016 410 8.2 113 129 149 219 257 165
John Gray High School
2020 174 8.7 84 88 93 126 143 95 2019 224 8.2 66 76 82 138 167 86 2018 203 7.5 62 72 68 101 129 73 2017 230 7.8 66 70 88 121 148 92 2016 202 8.5 59 74 64 118 127 70
Clifton Hunter High School
2020 171 7.9 80 82 95 116 142 97 2019 123 7.9 39 42 48 72 91 48 2018 167 7.6 49 51 67 77 109 70 2017 158 7.8 48 49 69 82 112 79 2016 186 7.7 45 46 72 84 113 82
Layman Scott Snr. High School
2020 21 9.8 15 18 16 21 20 17 2019 18 9.4 11 11 13 17 17 14 2018 21 8.67 7 7 11 16 16 12 2017 18 9.5 15 15 15 15 15 15 2016 22 8.9 9 9 13 17 17 13
Page 35 of 46
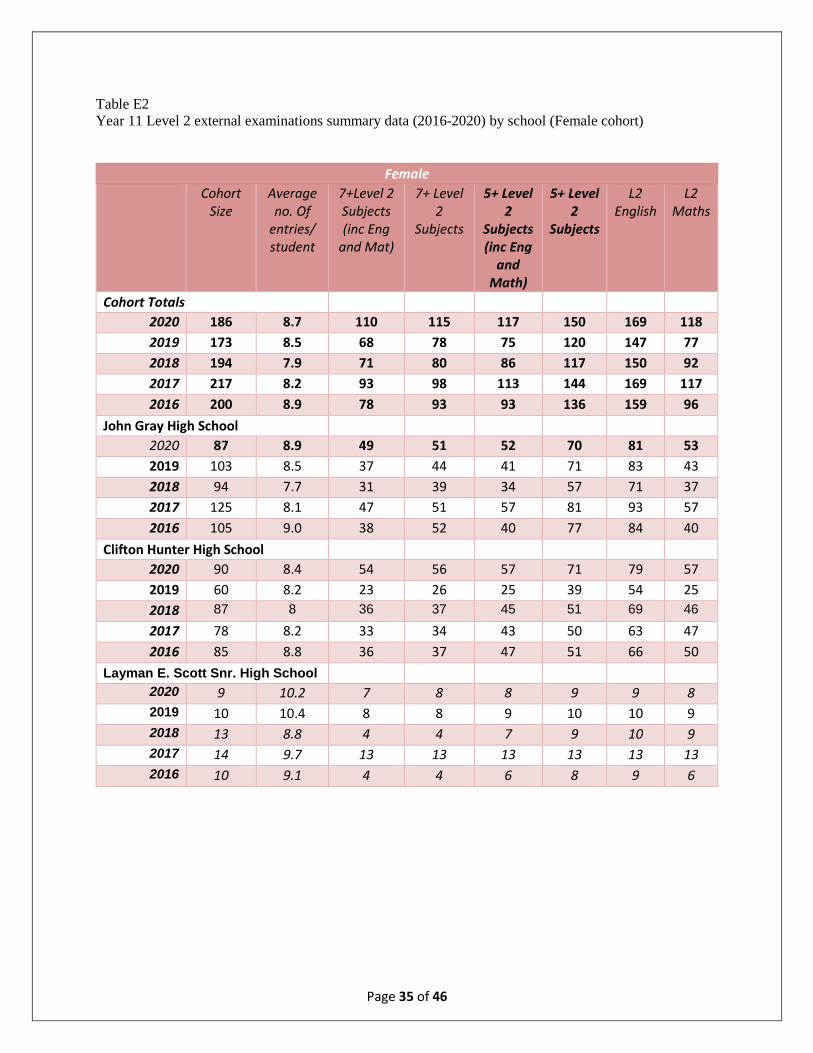
Table E2 Year 11 Level 2 external examinations summary data (2016-2020) by school (Female cohort)
Female Cohort
Size Average no. Of
entries/ student
7+Level 2 Subjects (inc Eng
and Mat)
7+ Level 2
Subjects
5+ Level 2
Subjects (inc Eng
and Math)
5+ Level 2
Subjects
L2 English
L2 Maths
Cohort Totals 2020 186 8.7 110 115 117 150 169 118 2019 173 8.5 68 78 75 120 147 77 2018 194 7.9 71 80 86 117 150 92 2017 217 8.2 93 98 113 144 169 117 2016 200 8.9 78 93 93 136 159 96
John Gray High School
2020 87 8.9 49 51 52 70 81 53 2019 103 8.5 37 44 41 71 83 43 2018 94 7.7 31 39 34 57 71 37 2017 125 8.1 47 51 57 81 93 57 2016 105 9.0 38 52 40 77 84 40
Clifton Hunter High School
2020 90 8.4 54 56 57 71 79 57 2019 60 8.2 23 26 25 39 54 25 2018 87 8 36 37 45 51 69 46 2017 78 8.2 33 34 43 50 63 47 2016 85 8.8 36 37 47 51 66 50
Layman E. Scott Snr. High School
2020 9 10.2 7 8 8 9 9 8 2019 10 10.4 8 8 9 10 10 9 2018 13 8.8 4 4 7 9 10 9 2017 14 9.7 13 13 13 13 13 13 2016 10 9.1 4 4 6 8 9 6
Page 36 of 46
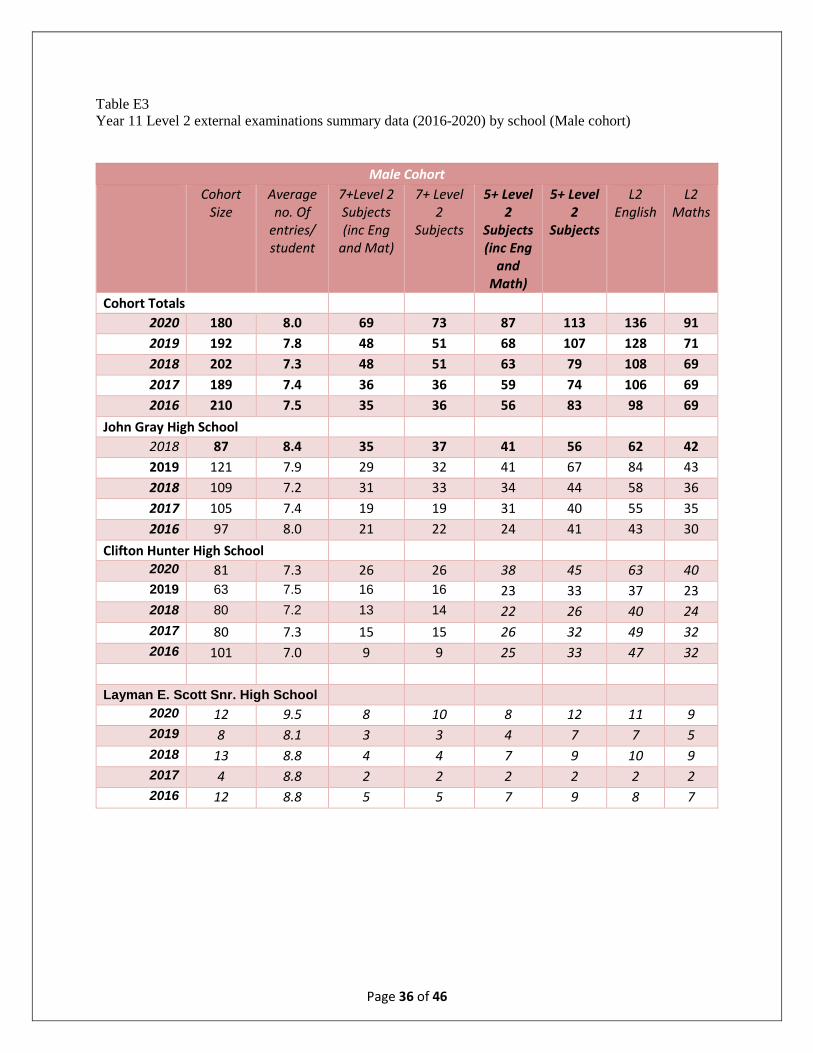
Table E3 Year 11 Level 2 external examinations summary data (2016-2020) by school (Male cohort)
Male Cohort Cohort
Size Average no. Of
entries/ student
7+Level 2 Subjects (inc Eng
and Mat)
7+ Level 2
Subjects
5+ Level 2
Subjects (inc Eng
and Math)
5+ Level 2
Subjects
L2 English
L2 Maths
Cohort Totals 2020 180 8.0 69 73 87 113 136 91 2019 192 7.8 48 51 68 107 128 71 2018 202 7.3 48 51 63 79 108 69 2017 189 7.4 36 36 59 74 106 69 2016 210 7.5 35 36 56 83 98 69
John Gray High School
2018 87 8.4 35 37 41 56 62 42 2019 121 7.9 29 32 41 67 84 43 2018 109 7.2 31 33 34 44 58 36 2017 105 7.4 19 19 31 40 55 35 2016 97 8.0 21 22 24 41 43 30
Clifton Hunter High School
2020 81 7.3 26 26 38 45 63 40 2019 63 7.5 16 16 23 33 37 23 2018 80 7.2 13 14 22 26 40 24 2017 80 7.3 15 15 26 32 49 32 2016 101 7.0 9 9 25 33 47 32
Layman E. Scott Snr. High School
2020 12 9.5 8 10 8 12 11 9 2019 8 8.1 3 3 4 7 7 5 2018 13 8.8 4 4 7 9 10 9 2017 4 8.8 2 2 2 2 2 2 2016 12 8.8 5 5 7 9 8 7
Page 37 of 46
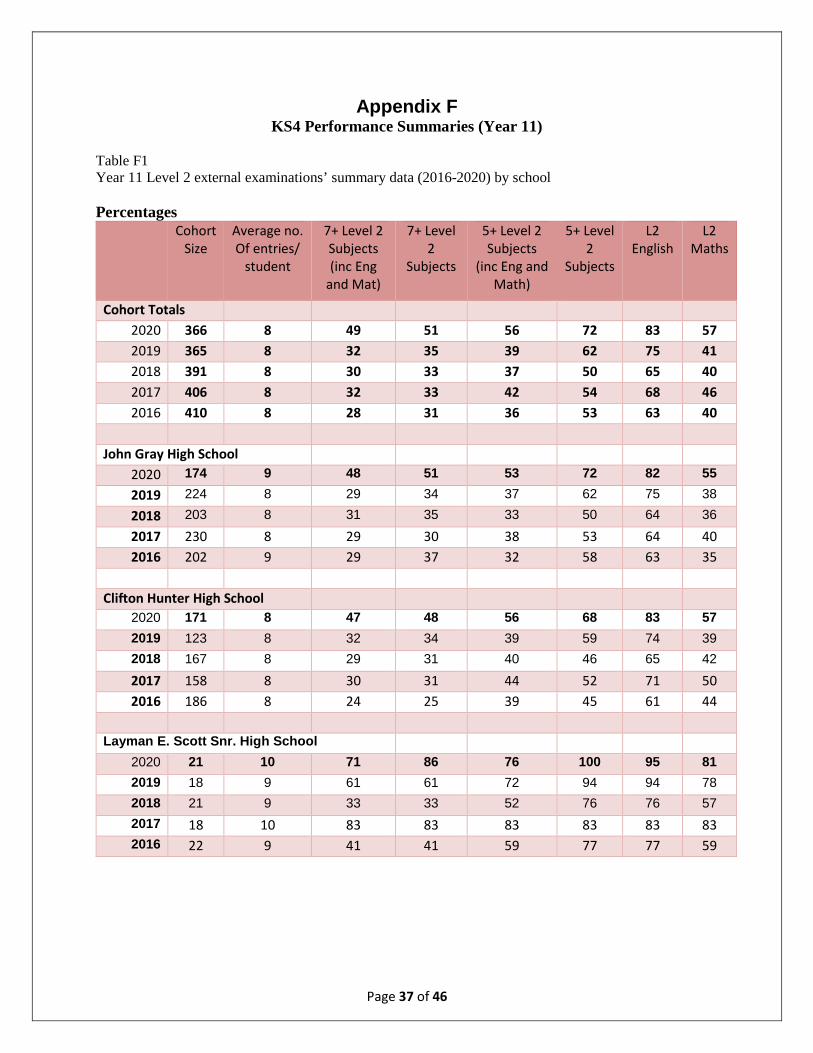
Appendix F KS4 Performance Summaries (Year 11)
Table F1 Year 11 Level 2 external examinations’ summary data (2016-2020) by school Percentages
Cohort Size
Average no. Of entries/
student
7+ Level 2 Subjects (inc Eng
and Mat)
7+ Level 2
Subjects
5+ Level 2 Subjects
(inc Eng and Math)
5+ Level 2
Subjects
L2 English
L2 Maths
Cohort Totals
2020 366 8 49 51 56 72 83 57 2019 365 8 32 35 39 62 75 41 2018 391 8 30 33 37 50 65 40 2017 406 8 32 33 42 54 68 46 2016 410 8 28 31 36 53 63 40
John Gray High School
2020 174 9 48 51 53 72 82 55 2019 224 8 29 34 37 62 75 38 2018 203 8 31 35 33 50 64 36 2017 230 8 29 30 38 53 64 40 2016 202 9 29 37 32 58 63 35
Clifton Hunter High School
2020 171 8 47 48 56 68 83 57 2019 123 8 32 34 39 59 74 39 2018 167 8 29 31 40 46 65 42 2017 158 8 30 31 44 52 71 50 2016 186 8 24 25 39 45 61 44
Layman E. Scott Snr. High School
2020 21 10 71 86 76 100 95 81 2019 18 9 61 61 72 94 94 78 2018 21 9 33 33 52 76 76 57 2017 18 10 83 83 83 83 83 83 2016 22 9 41 41 59 77 77 59
Page 38 of 46
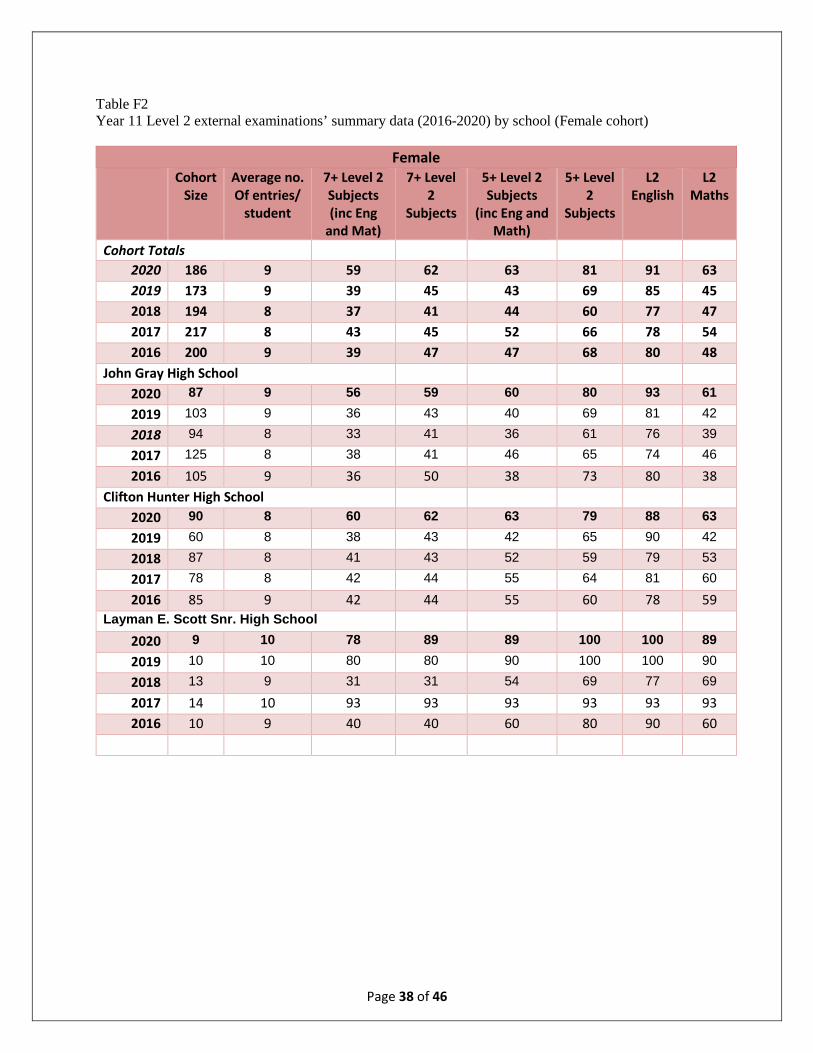
Table F2 Year 11 Level 2 external examinations’ summary data (2016-2020) by school (Female cohort)
Female Cohort
Size Average no. Of entries/
student
7+ Level 2 Subjects (inc Eng
and Mat)
7+ Level 2
Subjects
5+ Level 2 Subjects
(inc Eng and Math)
5+ Level 2
Subjects
L2 English
L2 Maths
Cohort Totals 2020 186 9 59 62 63 81 91 63 2019 173 9 39 45 43 69 85 45 2018 194 8 37 41 44 60 77 47 2017 217 8 43 45 52 66 78 54 2016 200 9 39 47 47 68 80 48
John Gray High School
2020 87 9 56 59 60 80 93 61 2019 103 9 36 43 40 69 81 42 2018 94 8 33 41 36 61 76 39 2017 125 8 38 41 46 65 74 46 2016 105 9 36 50 38 73 80 38
Clifton Hunter High School
2020 90 8 60 62 63 79 88 63 2019 60 8 38 43 42 65 90 42 2018 87 8 41 43 52 59 79 53 2017 78 8 42 44 55 64 81 60 2016 85 9 42 44 55 60 78 59
Layman E. Scott Snr. High School
2020 9 10 78 89 89 100 100 89 2019 10 10 80 80 90 100 100 90 2018 13 9 31 31 54 69 77 69 2017 14 10 93 93 93 93 93 93 2016 10 9 40 40 60 80 90 60

Page 39 of 46
Table F3 Year 11 Level 2 external examinations’ summary data (2016-2020) by school (Male cohort)
Male Cohort
Size Average no. Of entries/
student
7+ Level 2 Subjects (inc Eng
and Mat)
7+ Level 2
Subjects
5+ Level 2 Subjects
(inc Eng and Math)
5+ Level 2
Subjects
L2 English
L2 Maths
Cohort Totals 2020 180 8 38 41 48 63 76 51 2019 192 8 25 27 35 56 67 37 2018 202 7 24 25 31 39 53 34 2017 189 7 19 19 31 39 56 37 2016 210 8 17 17 27 40 47 33
John Gray High School
2020 87 8 40 43 47 64 71 48 2019 121 8 24 26 34 55 69 36 2018 109 7 28 30 31 40 53 33 2017 105 7 18 18 30 38 52 33 2016 97 8 22 23 25 42 44 31
Clifton Hunter High School
2020 81 7 32 32 47 56 78 49 2019 63 8 25 25 37 52 59 37 2018 80 7 16 18 28 33 50 30 2017 80 7 19 19 33 40 61 40 2016 101 7 9 9 25 33 47 32
Layman E. Scott Snr. High School
2020 12 10 67 83 67 100 92 75 2019 8 8 38 38 50 88 88 63 2018 13 9 31 31 54 69 77 69 2017 4 9 50 50 50 50 50 50 2016 12 9 42 42 58 75 67 58
Page 40 of 46
Appendix G KS4 Performance Summaries (Year 11)
Subject Analysis: Prior Attainment Indicators Compared with Actuals
English CAT 4 Ability Groupings No
Grade 6 (F/G) 5 (E) 4 (D) 3 (C) 2 (B) 1 (A/A*) Total
(By Category) High CAT 4 Score (Above 105) 0 7 13 36 56 Average CAT 4 Score (95-105) 0 4 23 38 36 101 Low CAT 4 Score (Below 95) 4 9 43 72 49 21 198 No CAT 4 Score 1 2 5 3 11
Grand Total 5 0 9 47 104 105 96 366
Mathematics CAT 4 Ability Groupings No
Grade 6 (F/G) 5 (E) 4 (D) 3 (C) 2 (B) 1 (A/A*) Total
(By Category) High CAT 4 Score (Above 105) 0 1 5 25 25 56 Average CAT 4 Score (95-105) 2 1 1 19 20 41 17 101 Low CAT 4 Score (Below 95) 32 4 20 72 33 30 7 198 No CAT 4 Score 1 1 3 2 1 3 11
Total (per grade category) 35 5 22 95 60 97 52 366
Average CAT 4 Score (95-105) 0 1 9 22 41 28 101 Science
CAT 4 Ability Groupings No Grade 6 (F/G) 5 (E) 4 (D) 3 (C) 2 (B) 1 (A/A*)
Total (By Category)
High CAT 4 Score (Above 105) 0 3 5 12 36 56 Average CAT 4 Score (95-105) 0 1 9 22 41 28 101 Low CAT 4 Score (Below 95) 12 24 49 49 43 21 198 No CAT 4 Score 0 2 3 1 5 11
Grand Total 12 0 25 63 79 97 90 366
Page 41 of 46
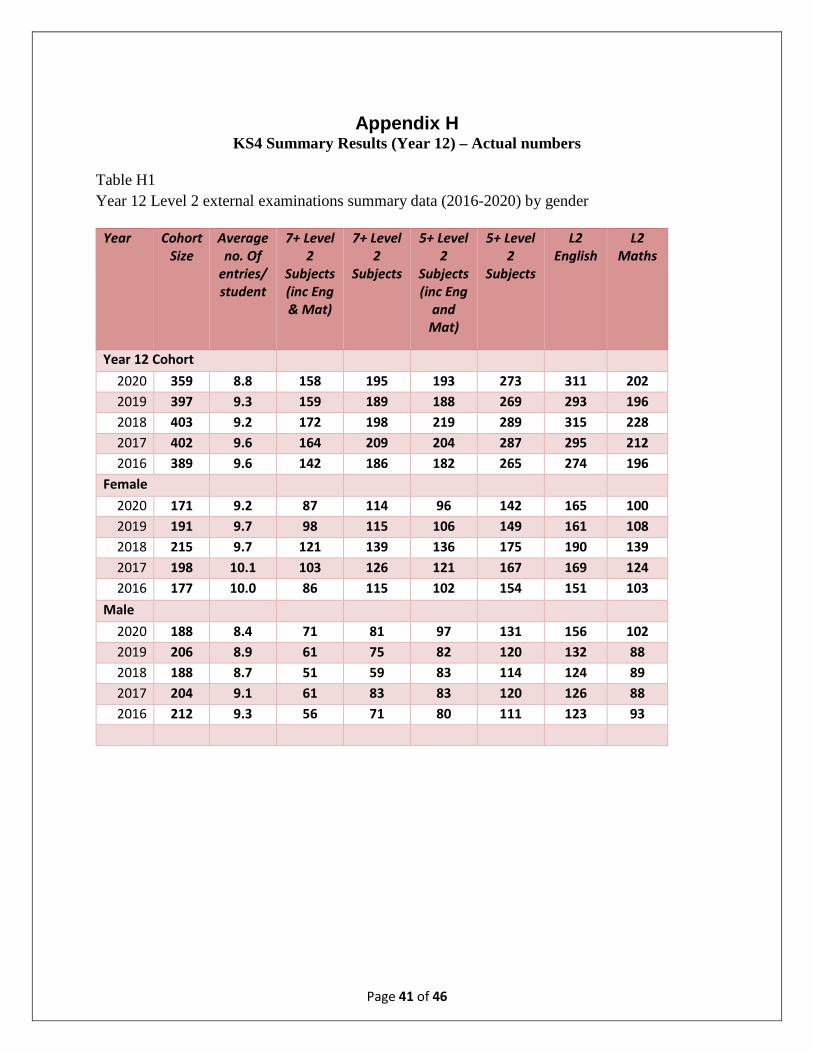
Appendix H
KS4 Summary Results (Year 12) – Actual numbers Table H1 Year 12 Level 2 external examinations summary data (2016-2020) by gender
Year Cohort Size
Average no. Of
entries/ student
7+ Level 2
Subjects (inc Eng & Mat)
7+ Level 2
Subjects
5+ Level 2
Subjects (inc Eng
and Mat)
5+ Level 2
Subjects
L2 English
L2 Maths
Year 12 Cohort 2020 359 8.8 158 195 193 273 311 202 2019 397 9.3 159 189 188 269 293 196 2018 403 9.2 172 198 219 289 315 228 2017 402 9.6 164 209 204 287 295 212 2016 389 9.6 142 186 182 265 274 196
Female 2020 171 9.2 87 114 96 142 165 100 2019 191 9.7 98 115 106 149 161 108 2018 215 9.7 121 139 136 175 190 139 2017 198 10.1 103 126 121 167 169 124 2016 177 10.0 86 115 102 154 151 103
Male 2020 188 8.4 71 81 97 131 156 102 2019 206 8.9 61 75 82 120 132 88 2018 188 8.7 51 59 83 114 124 89 2017 204 9.1 61 83 83 120 126 88 2016 212 9.3 56 71 80 111 123 93
Page 42 of 46
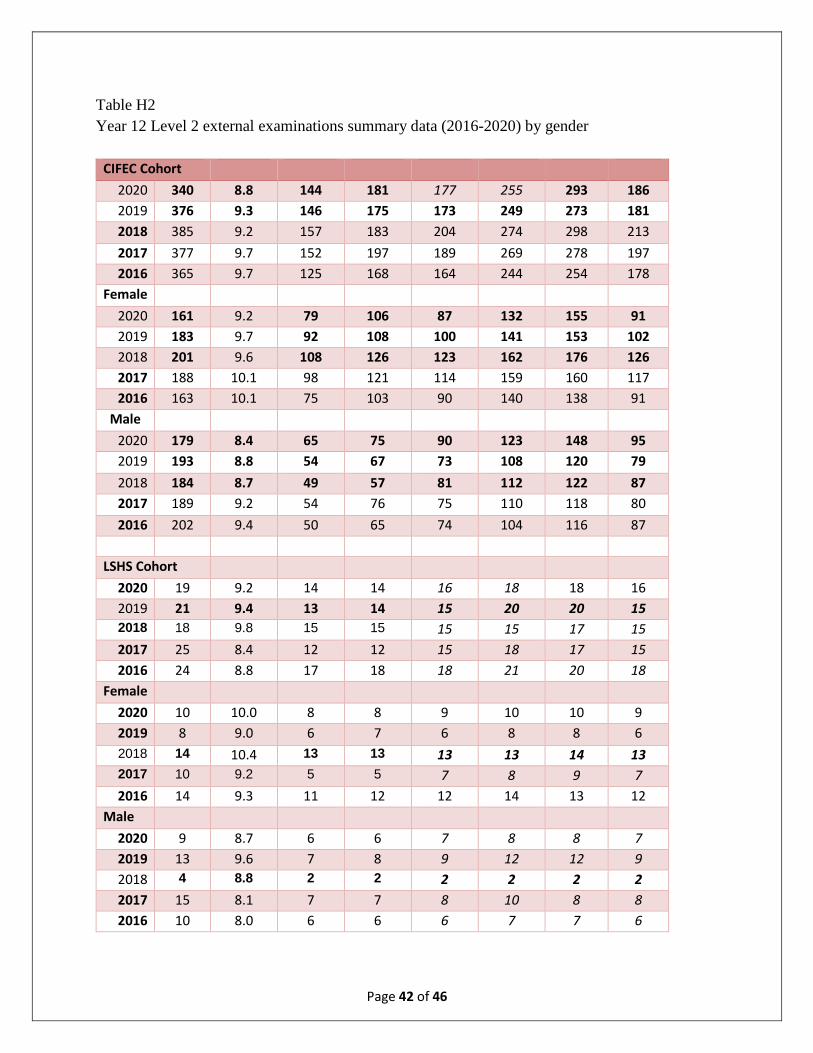
Table H2 Year 12 Level 2 external examinations summary data (2016-2020) by gender
CIFEC Cohort 2020 340 8.8 144 181 177 255 293 186 2019 376 9.3 146 175 173 249 273 181 2018 385 9.2 157 183 204 274 298 213 2017 377 9.7 152 197 189 269 278 197 2016 365 9.7 125 168 164 244 254 178
Female 2020 161 9.2 79 106 87 132 155 91 2019 183 9.7 92 108 100 141 153 102 2018 201 9.6 108 126 123 162 176 126 2017 188 10.1 98 121 114 159 160 117 2016 163 10.1 75 103 90 140 138 91
Male 2020 179 8.4 65 75 90 123 148 95 2019 193 8.8 54 67 73 108 120 79 2018 184 8.7 49 57 81 112 122 87 2017 189 9.2 54 76 75 110 118 80 2016 202 9.4 50 65 74 104 116 87
LSHS Cohort 2020 19 9.2 14 14 16 18 18 16 2019 21 9.4 13 14 15 20 20 15 2018 18 9.8 15 15 15 15 17 15 2017 25 8.4 12 12 15 18 17 15 2016 24 8.8 17 18 18 21 20 18
Female 2020 10 10.0 8 8 9 10 10 9 2019 8 9.0 6 7 6 8 8 6 2018 14 10.4 13 13 13 13 14 13 2017 10 9.2 5 5 7 8 9 7 2016 14 9.3 11 12 12 14 13 12
Male 2020 9 8.7 6 6 7 8 8 7 2019 13 9.6 7 8 9 12 12 9 2018 4 8.8 2 2 2 2 2 2 2017 15 8.1 7 7 8 10 8 8 2016 10 8.0 6 6 6 7 7 6
Page 43 of 46
Appendix I KS4 Summary Results (Year 12) - Percentages
Table I1 Year 12 Level 2 external examinations summary data (2016-2020) by gender
Cohort Size
Average no. Of
entries/ student
7+ Level 2
Subjects (inc Eng & Mat)
7+ Level 2
Subjects
5+ Level 2
Subjects (inc Eng
and Math)
5+ Level 2
Subjects
Level 2 English
Level 2 Maths
CI Cohort 2020 359 8.8 44 54 54 76 87 56 2019 397 9.3 40 48 47 68 74 49 2018 403 9.2 43 49 54 72 78 57 2017 402 9.6 41 52 51 71 73 53 2016 389 9.6 37 48 47 68 70 50
Female 2020 171 9 51 67 56 83 96 58 2019 191 10 51 60 55 78 84 57 2018 215 10 56 65 63 81 88 65 2017 198 10 52 64 61 84 85 63 2016 177 10 49 65 58 87 85 58
Male 2020 188 8 38 43 52 70 83 54 2019 206 9 30 36 40 58 64 43 2018 188 9 27 31 44 61 66 47 2017 204 9 30 41 41 59 62 43 2016 212 9 26 33 38 52 58 44
Page 44 of 46
Table I2 Year 12 Level 2 external examinations summary data (2016-2020) by gender
CI Year 12 Cohort 2020 340 9 42 53 52 75 86 55 2019 376 9 39 47 46 66 73 48 2018 385 9 41 48 53 71 77 55 2017 377 10 40 52 50 71 74 52 2016 365 10 34 46 45 67 70 49
Female 2020 161 9 49 66 54 82 96 57 2019 183 10 50 59 55 77 84 56 2018 201 10 54 63 61 81 88 63 2017 188 10 52 64 61 85 85 62 2016 163 10 46 63 55 86 85 56
Male 2020 179 8 36 42 50 69 83 53 2019 193 9 28 35 38 56 62 41 2018 184 9 27 31 44 61 66 47 2017 189 9 29 40 40 58 62 42 2016 202 9 25 32 37 51 57 43
LSHS Cohort 2020 19 9 74 74 84 95 95 84 2019 21 9 62 67 71 95 95 71 2018 18 10 83 83 83 83 94 83 2017 25 8 48 48 60 72 68 60 2016 24 9 71 75 75 88 83 75
Female 2020 10 10 80 80 90 100 100 90 2019 8 9 75 88 75 100 100 75 2018 14 10 93 93 93 93 100 93 2017 10 9 50 50 70 80 90 70 2016 14 9 79 86 86 100 93 86
Male 2020 9 9 67 67 78 89 89 78 2019 13 10 54 62 69 92 92 69 2018 4 9 50 50 50 50 50 50 2017 15 8 47 47 53 67 53 53 2016 10 8 60 60 60 70 70 60
Page 45 of 46
Appendix J Key Stage 4: Cumulative Subject Performance Summaries (Year 11)
Cohort Size: 365
SubjectNo of
EntriesPercentage of Cohort
No of Top grades
(A*/A/I)No of
Level 2
No of Level 1&2
No of Ungraded (U/UNG*)
No of Absent/No
Result
Results Pending (Q/NYA)
Top grades
(A*/A/I) Level 2Level 1&2 Ungraded
Absent/No
Result
Results Pending (Q/NYA)
Accounts (CSEC) 48 13% 19 42 46 0 2 0 40% 88% 96% 0% 4% 0%Additional Mathematics (CSEC) 14 4% 0 4 14 0 0 0 0% 29% 100% 0% 0% 0%
Art (GCSE) 19 5% 9 17 19 0 0 0 47% 89% 100% 0% 0% 0%
Biology (CSEC) 86 24% 38 81 86 0 0 0 44% 94% 100% 0% 0% 0%
Building Technology (CSEC) 18 5% 8 16 17 0 1 0 44% 89% 94% 0% 6% 0%
Business (BTEC) Certificate 1 0% 0 1 1 0 0 0 0% 100% 100% 0% 0% 0%Business (BTEC) Extended Certificate 11 3% 0 11 11 0 0 0 0% 100% 100% 0% 0% 0%
Business (CSEC) 149 41% 61 137 149 0 0 0 41% 92% 100% 0% 0% 0%
C&G English Skills Stage1 23 6% 0 0 0 0 23 0 0% 0% 0% 0% 100% 0%
C&G: Math Skills Stage 2 9 2% 0 9 9 0 0 0 0% 100% 100% 0% 0% 0%
Chemistry (CSEC) 48 13% 8 35 48 0 0 0 17% 73% 100% 0% 0% 0%
Chemistry (iGCSE) 4 1% 2 4 4 0 0 0 50% 100% 100% 0% 0% 0%
Construction BTEC Certificate 6 2% 1 5 5 0 0 1 17% 83% 83% 0% 0% 17%Creative Media Production BTEC Certificate 19 5% 5 19 19 0 0 0 26% 100% 100% 0% 0% 0%
Design & Technology (GCSE) 12 3% 1 8 12 0 0 0 8% 67% 100% 0% 0% 0%
Digital Media (CAPE) 11 3% 0 11 11 0 0 0 0% 100% 100% 0% 0% 0%EAL (English as an Additional Language) (iGCSE) 7 2% 0 4 7 0 0 0 0% 57% 100% 0% 0% 0%Electronic Document Preparation & Management (CSEC) 355 97% 232 338 349 0 6 0 65% 95% 98% 0% 2% 0%
English (CCSLC) 43 12% 0 37 37 0 6 0 0% 86% 86% 0% 14% 0%
English Language (CSEC) 364 100% 96 305 361 0 3 0 26% 84% 99% 0% 1% 0%
English Literature (CSEC) 128 35% 43 122 128 0 0 0 34% 95% 100% 0% 0% 0%Family Resource Management (CSEC) 19 5% 4 18 19 0 0 0 21% 95% 100% 0% 0% 0%
Food & Nutrition (CSEC) 78 21% 8 68 77 0 1 0 10% 87% 99% 0% 1% 0%
Geography (CSEC) 26 7% 4 16 25 1 0 0 15% 62% 96% 4% 0% 0%
History (CSEC) 35 10% 1 22 34 1 0 0 3% 63% 97% 3% 0% 0%Human & Social Biology (CSEC) 156 43% 54 97 152 0 4 0 35% 62% 97% 0% 3% 0%Industrial Technology: Electrical (CSEC) 33 9% 2 30 33 0 0 0 6% 91% 100% 0% 0% 0%Industrial Technology: Building (CSEC) 19 5% 4 16 18 0 1 0 21% 84% 95% 0% 5% 0%Information Technology (CSEC) 78 21% 29 77 78 0 0 0 37% 99% 100% 0% 0% 0%
Integrated Science (CSEC) 202 55% 30 157 195 3 4 0 15% 78% 97% 1% 2% 0%
Mathematics (CSEC) 335 92% 52 209 331 0 4 0 16% 62% 99% 0% 1% 0%
Mathematics iGCSE 16 4% 0 7 16 0 0 0 0% 44% 100% 0% 0% 0%
Media Studies (GCSE) 10 3% 4 8 10 0 0 0 40% 80% 100% 0% 0% 0%
Motor Vehicle Award 50 14% 0 0 45 0 0 5 0% 0% 90% 0% 0% 10%
Motor Vehicle Certificate 5 1% 0 0 0 0 1 4 0% 0% 0% 0% 20% 80%
Music (GCSE) 5 1% 1 5 5 0 0 0 20% 100% 100% 0% 0% 0%
Music (iGCSE) 1 0% 0 1 1 0 0 0 0% 100% 100% 0% 0% 0%Music Technology BTEC Certificate 20 5% 3 6 6 0 0 14 15% 30% 30% 0% 0% 70%Music Technology BTEC Extended Certificate 18 5% 2 13 13 0 2 3 11% 72% 72% 0% 11% 17%
Office Administration (CSEC) 60 16% 21 57 59 0 1 0 35% 95% 98% 0% 2% 0%Performing Arts BTEC Extended Certificate 13 4% 3 13 13 0 0 0 23% 100% 100% 0% 0% 0%Physical Education & Sport (CSEC) 96 26% 64 95 95 0 1 0 67% 99% 99% 0% 1% 0%
Physical Education (CAPE) 3 1% 0 3 3 0 0 0 0% 100% 100% 0% 0% 0%
Physics (CSEC) 53 15% 10 44 53 0 0 0 19% 83% 100% 0% 0% 0%
Religious Education (CSEC) 15 4% 2 15 15 0 0 0 13% 100% 100% 0% 0% 0%
Religious Education (GCSE) 7 2% 3 6 7 0 0 0 43% 86% 100% 0% 0% 0%
Social Studies (CSEC) 91 25% 6 68 90 1 0 0 7% 75% 99% 1% 0% 0%
Spanish (CSEC) 51 14% 31 45 51 0 0 0 61% 88% 100% 0% 0% 0%
Spanish (GCSE) 9 2% 6 8 9 0 0 0 67% 89% 100% 0% 0% 0%
Statistics (GCSE) 59 16% 31 55 59 0 0 0 53% 93% 100% 0% 0% 0%
Technical Drawing (CSEC) 39 11% 11 34 37 0 2 0 28% 87% 95% 0% 5% 0%
Texiles (CSEC) 9 2% 0 8 9 0 0 0 0% 89% 100% 0% 0% 0%
Theatre Arts (CSEC) 16 4% 2 15 16 0 0 0 13% 94% 100% 0% 0% 0%
Visual Arts (CSEC) 28 8% 0 17 21 7 0 0 0% 61% 75% 25% 0% 0%
Number of Students Percentages by Entry
Page 46 of 46
Appendix K Key Stage 4: Cumulative Subject Performance Summaries 2020 (Year 12)
Cohort 340
SubjectNo of
EntriesPercentage of Cohort
No of Top
grades (A*/A/I)
No of Level 2
No of Level 1&2
No of Ungraded (U/UNG*)
No of Absent/
No Result
Results Pending (Q/NYA)
Top grades
(A*/A/I) Level 2Level 1&2 Ungraded
Absent/No Result
Results Pending (Q/NYA)
Principles of Accounts (CSEC) 40 12% 11 32 40 0 0 0 28% 80% 100% 0% 0% 0%Art & Design BTEC Ext Certificate 5 1% 0 5 5 0 0 0 0% 100% 100% 0% 0% 0%Art (GCSE) 38 11% 0 10 34 4 0 0 0% 26% 89% 11% 0% 0%Biology (CSEC) 73 21% 18 64 73 0 0 0 25% 88% 100% 0% 0% 0%Building Technology (CSEC) 20 6% 4 18 19 0 1 0 20% 90% 95% 0% 5% 0%Business BTEC Certificate 53 16% 0 32 32 8 0 13 0% 60% 60% 15% 0% 25%Principles of Business (CSEC) 108 32% 28 88 105 0 3 0 26% 81% 97% 0% 3% 0%C&G English Skil ls Stage2 17 5% 0 13 13 3 1 0 0% 76% 76% 18% 6% 0%C&G English Skil ls Stage3 1 0% 0 1 1 0 0 0 0% 100% 100% 0% 0% 0%C&G Math Skil ls Stage1 Re 3 1% 0 3 3 0 0 0 0% 100% 100% 0% 0% 0%C&G Math Skil ls Stage2 Re 20 6% 0 7 7 9 4 0 0% 35% 35% 45% 20% 0%Caribbean Studies CXC CAP 14 4% 4 14 14 0 0 0 29% 100% 100% 0% 0% 0%Chemistry (CSEC) Result 32 9% 6 22 30 2 0 0 19% 69% 94% 6% 0% 0%Creative Media Production BTEC Certificate 16 5% 0 16 16 0 0 0 0% 100% 100% 0% 0% 0%Creative Media Production BTEC Ext Certificate 12 4% 0 12 12 0 0 0 0% 100% 100% 0% 0% 0%Communication Studies (CAPE) 19 6% 0 17 19 0 0 0 0% 89% 100% 0% 0% 0%Construction BTEC Certificate 25 7% 0 17 17 8 0 0 0% 68% 68% 32% 0% 0%CoPE L1/L2 (ASDAN) 45 13% 0 45 45 0 0 0 0% 100% 100% 0% 0% 0%Design & Technology (GCSE) 18 5% 1 10 18 0 0 0 6% 56% 100% 0% 0% 0%Drama (GCSE) Result 15 4% 0 7 14 1 0 0 0% 47% 93% 7% 0% 0%EAL (En. Add. Lang) iGCSE 5 1% 0 2 4 1 0 0 0% 40% 80% 20% 0% 0%Electronic Document Preparation & Management (CSEC) 329 97% 105 305 318 2 9 0 32% 93% 97% 1% 3% 0%Electrical CXC Result 33 10% 2 26 32 0 1 0 6% 79% 97% 0% 3% 0%English Best Result equiv 330 97% 69 293 325 5 0 0 21% 89% 98% 2% 0% 0%English (CSEC) 322 95% 69 293 319 3 0 0 21% 91% 99% 1% 0% 0%English Literature (CSEC) 109 32% 5 72 109 0 0 0 5% 66% 100% 0% 0% 0%Food & Nutrition (CSEC) 56 16% 6 40 52 3 1 0 11% 71% 93% 5% 2% 0%Geography (CSEC) 29 9% 3 22 28 0 1 0 10% 76% 97% 0% 3% 0%Health & Social Care BTEC Ext Certificate 10 3% 0 8 8 0 0 2 0% 80% 80% 0% 0% 20%History (CSEC) 23 7% 0 10 23 0 0 0 0% 43% 100% 0% 0% 0%Home Economics Management (CSEC) 10 3% 1 9 10 0 0 0 10% 90% 100% 0% 0% 0%Hospitality BTEC Certificate 50 15% 0 33 33 10 7 0 0% 66% 66% 20% 14% 0%Human & Social Biology 228 67% 49 155 214 4 10 0 21% 68% 94% 2% 4% 0%Integrated Science (CSEC) 154 45% 12 111 152 0 2 0 8% 72% 99% 0% 1% 0%Information Technology BTEC Certificate 25 7% 0 23 23 2 0 0 0% 92% 92% 8% 0% 0%Information Technology BTEC Ext Certificate 15 4% 0 9 9 6 0 0 0% 60% 60% 40% 0% 0%Information Technology (CSEC) 59 17% 22 59 59 0 0 0 37% 100% 100% 0% 0% 0%Leisure & Tourism (GCSE) 4 1% 0 3 4 0 0 0 0% 75% 100% 0% 0% 0%Maths Best Result (equiv) 336 99% 16 186 331 5 0 0 5% 55% 99% 1% 0% 0%Mathematics (CSEC) 333 98% 16 186 329 0 4 0 5% 56% 99% 0% 1% 0%Media Studies (GCSE) 15 4% 0 5 15 0 0 0 0% 33% 100% 0% 0% 0%Motor Vehicle Award 57 17% 0 0 55 1 0 1 0% 0% 96% 2% 0% 2%Motor Vehicle Cert Res1 6 2% 0 0 0 0 0 6 0% 0% 0% 0% 0% 100%Music (GCSE) 5 1% 1 3 5 0 0 0 20% 60% 100% 0% 0% 0%Music Technology BTEC Ext Certificate 27 8% 0 25 25 2 0 0 0% 93% 93% 7% 0% 0%
Music Technology BTEC Certificate 7 2% 0 6 6 0 1 0 0% 86% 86% 0% 14% 0%Office Administration (CSEC) 47 14% 2 35 45 0 2 0 4% 74% 96% 0% 4% 0%Physical Education (CSEC) 77 23% 34 73 73 0 4 0 44% 95% 95% 0% 5% 0%Performimg Arts BTEC Ext Certificate 15 4% 0 13 13 1 0 1 0% 87% 87% 7% 0% 7%Physics (CSEC) 33 10% 9 26 33 0 0 0 27% 79% 100% 0% 0% 0%RE SA (GCSE) 13 4% 5 10 13 0 0 0 38% 77% 100% 0% 0% 0%RE SC (GCSE) 13 4% 5 10 13 0 0 0 38% 77% 100% 0% 0% 0%Social Studies (CSEC) 69 20% 1 42 68 0 1 0 1% 61% 99% 0% 1% 0%Spanish (CSEC) 34 10% 11 23 34 0 0 0 32% 68% 100% 0% 0% 0%Spanish (GCSE) 15 4% 8 12 15 0 0 0 53% 80% 100% 0% 0% 0%Sport & Leisure BTEC Certificate 32 9% 0 26 26 0 0 6 0% 81% 81% 0% 0% 19%
Sport & Leisure BTEC Ext Certificate 12 4% 0 12 12 0 0 0 0% 100% 100% 0% 0% 0%Statistics (GCSE) 49 14% 2 34 40 8 1 0 4% 69% 82% 16% 2% 0%
Textiles Clothing & Fashion (CSEC) 39 11% 9 34 36 1 2 0 23% 87% 92% 3% 5% 0%Vocational Studies L1 6 2% 0 0 0 0 1 5 0% 0% 0% 0% 17% 83%Workskil ls L1 BTEC Certificate 13 4% 0 0 12 1 0 0 0% 0% 92% 8% 0% 0%Workskil ls L2 BTEC Certificate 34 10% 0 30 30 0 0 4 0% 88% 88% 0% 0% 12%
Number of Students Percentages by Entry