Embed Size (px)
Citation preview

Education Efficiency Audit of West Virginia’s Primary and Secondary
Education System
Public Works LLC www.GoodIdeas.us
January 3, 2012
TABLE OF CONTENTS Overview ......................................................................................................................... 1 1. Savings and Efficiencies ........................................................................................ 14
1.1. Administration ..................................................................................................... 16 A. Reorganize and Right-Size the West Virginia Department of Education......... 16
Background and Findings ................................................................................... 16 Recommendations .............................................................................................. 30 Estimated Savings .............................................................................................. 31
1.2. Facilities .............................................................................................................. 32 A. Implement Efficiencies in School Building Capital Projects and Management 32
Background and Findings ................................................................................... 32 Recommendations .............................................................................................. 34 Estimated Savings .............................................................................................. 35
B. Reassess Cedar Lakes Conference Center Operations ................................. 36 Background and Findings ................................................................................... 36 Recommendations .............................................................................................. 40 Estimated Savings .............................................................................................. 45
1.3. Human Resources .............................................................................................. 45 A. Consider Integration of Human Resources IT Systems .................................. 45
Background and Findings ................................................................................... 45 Recommendations .............................................................................................. 46 Estimated Savings .............................................................................................. 46
B. Update District Support Personnel Hiring Practices ....................................... 46 Background and Findings ................................................................................... 46 Recommendations .............................................................................................. 48 Estimated Savings .............................................................................................. 48
1.4. Transportation ..................................................................................................... 49 A. Improve Transportation Systems and Training ............................................... 49
Background and Findings ................................................................................... 49 Recommendations .............................................................................................. 50 Estimated Savings .............................................................................................. 50
B. Review Policies Concerning Mid-Day Bus Trips ............................................. 51 Background and Findings ................................................................................... 51 Recommendations .............................................................................................. 52 Estimated Savings .............................................................................................. 52
1.5. Ancillary Services ............................................................................................... 53 A. Use All Appropriate Local Health Services Available to Reduce Duplication and Costs ...................................................................................................................... 53
Background and Findings ................................................................................... 53 Recommendations .............................................................................................. 53 Estimated Savings .............................................................................................. 54
B. Reorganize Professional Development for Educators .................................... 54 Background and Findings ................................................................................... 54 Recommendations .............................................................................................. 62 Estimated Savings .............................................................................................. 67
C. Utilize Cooperative and Pooled Purchasing ................................................... 68 Background and Findings ................................................................................... 68 Recommendations .............................................................................................. 69 Estimated Savings .............................................................................................. 69

www.public-works.org
D. Maximize Limited Local Personnel Resources ............................................... 70 Background and Findings ................................................................................... 70 Recommendations .............................................................................................. 70 Estimated Savings .............................................................................................. 70
1.6. Regional Coordination ........................................................................................ 71 A. Improve Oversight and Accountability of Regional Education Service Agencies (RESAs) to Maximize Resources ........................................................................... 71
Background and Findings ................................................................................... 71 Recommendations .............................................................................................. 81 Estimated Savings .............................................................................................. 82
1.7. County - and Regional-Level Efficiencies ............................................................ 83 Overview ................................................................................................................ 83 Methodology .......................................................................................................... 83
Peer Comparisons .............................................................................................. 83 Stakeholder Input ............................................................................................... 85
Possible Statewide Implications Identified From Local Reviews................................. 91 2. Education Delivery Improvements ........................................................................ 102
2.1. Better Connecting the Education System to Workforce and Career Futures ..... 103 A. Enhance Collaboration between Education and Workforce Development .... 103
Background and Findings ................................................................................. 103 Recommendations ............................................................................................ 107 Estimated Savings ............................................................................................ 114
2.2. Supporting and Improving School Building Leadership and Classroom Teaching ................................................................................................................................ 114
A. Mandate 180 Days of Instructional Time and Align Teacher and Support Personnel Work Calendars................................................................................... 115
Background and Findings ................................................................................. 115 Recommendations ............................................................................................ 117
B. Launch a Comprehensive Plan to Recruit the Best Teachers and Improve Training and Licensure ......................................................................................... 117
Background and Findings ................................................................................. 117 Recommendations ............................................................................................ 119
C. Establish an Evaluation System Modeled Based on National Best Practices and Research ....................................................................................................... 121
Background and Findings ................................................................................. 121 Recommendations ............................................................................................ 123
D. Improve Teacher Compensation to Help Attract and Maintain the Best Teaching Corps Possible ..................................................................................... 124
Background and Findings ................................................................................. 124 Recommendations ............................................................................................ 129
E. Strengthen School Leadership by Investing in Principals ............................. 131 Background and Findings ................................................................................. 131 Recommendations ............................................................................................ 132
2.3. Making West Virginia the Leader in Remote Technology and Distance Learning ................................................................................................................................ 133
Background and Findings ................................................................................. 133 Recommendations ............................................................................................ 137
3. Summary and Conclusion .................................................................................... 142

1 www.public-works.org
OVERVIEW
WANTED: A MORE STUDENT-CENTERED EDUCATION SYSTEM FOR WEST VIRGINIA At no other time in our nation’s history has there been a greater call to transform our educational system. The future of our economy and our democracy depend upon our ability to find better ways to marshal limited resources and to educate our children. West Virginia’s education system, like most in our country, has developed into a structure that satisfies the needs and desires of a wide swath of constituencies and consumers that depend on the outputs of primary and secondary education: businesses that hope to employ West Virginia’s graduates; school professionals – teachers, administrators, support personnel, transportation providers, and many others – who devote their time and energy to education; educational policymakers, both elected and appointed, with ideas and aspirations for our schools; the parents who entrust their children – and their hopes for their children’s futures – to all school professionals every day; and, of course, the taxpayers who fund this educational system and thus ultimately expect a say in its cost and structure. One fact is noteworthy about all these variegated constituencies: They are all adults. With a new Governor and a new Superintendent of Education, West Virginia is poised to create an education system based on a different perspective and direction: that of the student. At the express direction of Governor Earl Ray Tomblin, this report focuses on how West Virginia’s educational system can be better designed to meet the needs of students, elevate their aspirations, and prepare them for post-secondary education and careers. If one looks at the system from the perspective of what and how students need to learn in order to succeed in the 21st Century, one quickly realizes the need to drive more of the educational decision-making down to the level closest to these students, by:
• Eliminating excess bureaucracy, cutting unneeded spending, and reducing inefficiencies in service delivery to put more money into classroom instruction without raising taxes.
• Better relating the education system to the workforce needs and career futures of these young people.
• Raising educational standards statewide.
• Developing mechanisms to better prepare all teachers, to motivate all teachers to
improve, to retain great teachers, and to get ineffective teachers out of the classroom. • Driving more educational decision-making down to the classroom and building level –
allowing principals to lead and teachers to deliver the most effective curriculum for their students – and then holding them accountable for student success.
• Using technology and new methods of educational development to empower parents and, as they near adulthood, students themselves, with the ability to choose the best educational options.

2 www.public-works.org
Across America, schools, school districts, and states are reforming and modernizing their systems of education. It is time for West Virginia to do so, as well. EDUCATION EFFICIENCY AUDIT OF WEST VIRGINIA’S PRIMARY AND SECONDARY EDUCATION SYSTEM In 2010, the State of West Virginia initiated a comprehensive review of its primary and secondary education system, which it called “Education Efficiency Audit of West Virginia’s Primary and Secondary Education System.” While the word “audit” is used to describe this initiative, the review was not intended as an audit in the strictest meaning of the term. Rather, an “efficiency audit” uses an array of techniques to identify issues, research possible solutions, determine best practices, and develop recommendations – all activities designed to identify opportunities for savings, eliminate duplication, and to work smarter. This review was intended to help the state achieve two goals:
1. Producing the best possible outcomes for its students. And
2. Receiving the highest return on the educational dollars it spends. Compared to its sister states, West Virginia has recently scored very well in its expenditures on an income and per-pupil expenditure basis. The state ranks 8th in education expenditures relative to income, even adjusting for anomalies in its current spending levels (which include an annual average of $333,575,000 for pay-down of the unfunded liability of the Teachers' Retirement System, which does not constitute spending on students in the public schools: The state nevertheless ranks 7th, according to the U.S. Department of Commerce, in salaries exclusive of benefit payments, relative to the state’s income levels, and when total spending is adjusted to exclude the pay-down of the unfunded pension liability, the state still ranks 32nd nationally, ahead of such states as Massachusetts, California, and Virginia).1
In sum, West Virginia, unlike most similarly poor states, cannot be said to stint on education spending.
Unfortunately, this considerable commitment of funds has not equated to a high level of achievement: West Virginia students score below the national average on 21 of the 24 indicators of student performance as reported by the National Assessment of Educational Progress.2
This was the impetus for the state to launch this “Education Efficiency Audit of West Virginia’s Primary and Secondary Education System.”
In initiating its review of the State’s education system, the State of West Virginia asserted:
These statistics suggest that the state of West Virginia is getting a poor return on its investment in primary and secondary education, a total of $3.5 billion in FY2010. For that reason . . . this audit is to locate redundancies and duplication of effort, identify areas where economies of scale can be created, and develop recommendations for ideal ratios for educational, administrative, and other expenses for West Virginia school districts.
In May 2011, the West Virginia Governor’s Office retained Public Works and its partner firm, MGT of America, to conduct this review. This resulting report seeks to identify (1) savings and efficiencies, and (2) service-delivery improvements that can be instituted to make the best use of West Virginia’s educational spending and to increase student achievement.

3 www.public-works.org
SECTION I: SAVINGS AND EFFICIENCIES The findings and recommendations in this Report are derived from several different examinations. First, all state-level education governance entities – including the West Virginia Board of Education, the School Building Authority, and the Center for Professional Development – were examined. Second, three separate and distinct county school systems were examined (Harrison, Taylor, and Wyoming Counties), and our auditors also reviewed one Regional Education Service Agency (RESA) with a particularly diverse constituency of West Virginia counties (RESA 7). The first section of this Report describes 56 findings and recommendations spread over six state-level function areas:
1. Administration. 2. Facilities. 3. Human Resources. 4. Transportation. 5. Ancillary Services – including health services, professional development, purchasing,
and back-office staffing. 6. Regional Coordination.
The recommendations in these areas represent savings of just over $18.1 million in Year One and $115.7 million over five years, identified during the state-level review. At a cost for undertaking the review of $275,000, this represents a ROI of roughly 66:1 in a single year – with savings multiplying year after year. Summaries of these recommendations and estimated savings are contained in Table 1: Summary of State-Level Recommendations and Estimated Savings and Table 2: Summary of District- and RESA 7 Recommendations and Estimated Savings, below. After that, this Report summarizes the findings of the local reviews and consistent themes found across them. It then suggests issues that could and should be reviewed in all districts statewide. The individual reviews themselves identified approximately $5 million per year in savings and efficiencies in just these four local jurisdictions, at a cost of $475,000, or an ROI of 10:1, with five-year savings of over $18 million. If carried out statewide, in all districts and RESAs, proportionate savings would come to roughly $70 million per year, at a total cost of about $6 million. The detailed findings and analyses of these four individual reports are contained in separate volumes. If West Virginia were to implement all these recommendations, then, and apply the review process to all districts and RESAs statewide, the annual savings could total approximately $90 million. This is consistent with the roughly-5 percent level of savings we find achievable through efficiency improvements in government entities of all types and sizes across the country.

4 www.public-works.org
Table 1: Summary of State-Level Recommendations and Estimated Savings
Page # Recommendations Estimated Savings
Year 1 5-Year Administration
16 Organize and Right-Size the West Virginia Department of Education $3,200,000 $21,200,000
30 Rethink the organization of the WVDE to organize around major goals or functions, not funding sources
30 Increase span of control to not less than 1:10 ratios of supervisors to
subordinates and reduce number of offices 30 Reduce the number of positions in the department
30 Consider expanding WVDE’s role with the RESAs as a vehicle for improved assistance to school districts
30 Implement additional cross-department initiatives to reduce duplication of
effort and ensure funds are used as efficiently as possible
31 Implement additional initiatives to partner with school districts and RESAs in order to provide the technical assistance and support districts need
Facilities
32 Implement Efficiencies in School Building Capital Projects and Management $3,460,000 $31,300,000
34 Hire state employees to replace some contracted professional consultants, such as architects and engineers
34 Amend Section 18 of the WV Code so that the staff and responsibilities of
the Office of Facilities become the responsibility of the SBA
34 Amend Section 18 of the WV Code to place the responsibility for reducing all school facilities’ energy usage with the SBA
34 Establish SBA as the single point of responsibility and authority to address
energy issues
34 Eliminate SBA expenditure for two-year HVAC maintenance contracts and
the cost of WVDE backing up current HVAC technicians by upgrading HVAC technician job specification
34 Use Energy Specialists to reduce energy consumption
34 Modify code to allow the SBA to use funds for technology equipment
35 Amend the Code to allow the SBA and counties to use all methods of financing, including lease-purchases, to acquire technology equipment
35 Use lease-purchase agreements so that counties can expedite capital projects
36 Reassess Cedar Lakes Conference Center (CLCC) Operations $607,188 $3,507,720
40 Move Cedar Lakes Conference Center out of WVDE to a department with the resources, expertise and mission to support a facilities operations
40 Exempt Cedar Lakes from WVDE’s statutory requirement to match county
service personnel wage levels
41 Continue to encourage State departments, particularly educational agencies, to use Cedar Lakes Conference Center facilities
42 Increase Cedar Lakes advertising and promotion efforts
43 Review Cedar Lakes’ lodging and conference meeting fees and remove any barriers preventing CLCC from charging market rates
44 Increase private donations and support for Cedar Lakes

5 www.public-works.org
Page
# Recommendations Estimated Savings
Year 1 5-Year Human Resources
45 Consider Integration of Human Resources Systems
46 Conduct a thorough system analysis, including cost and Return on
Investment estimates, and develop plans to integrate the education HR systems into ERP
46 Update District and WVDE Hiring Practices
48 Amend WV Code to eliminate the current WVDE and county job applicant and evaluation systems and replace them with the Division of Personnel’s
system
48 Amend Section §18A-4-8e of the WV Code to eliminate the requirement that counties provide at least one day’s training before administering a job test
Transportation 49 Improve Transportation Systems and Training ($1,175,000) $5,625,000
50 Purchase one bus routing system for the state and require all counties use the system
50
Expedite the rollout to the entire state of the RESAs bus driver training program unless a county can demonstrate that its training course is less
expensive than that of the RESA
50 Purchase school bus equipment and fuels on a state contract that is administered by WVDE’s Office of School Transportation
51 Review Policies Concerning Mid-Day Bus Trips $878,826 $4,400,000
52 Modify West Virginia Code and State Board policies to eliminate the
requirement for counties to pay additional compensation for bus drivers who do bus runs during regular work hours
Ancillary Services
53 Use All Appropriate Local Health Services Available to Reduce Duplication and Costs $1,800,000 $9,000,000
53 Amend Section 18 of the WV Code to allow counties to use nurses and other appropriate professionals in all health care agencies
53
Amend West Virginia Code to require that these health care centers perform the duties of a school nurse, free of charge, as payment for the use of
school facilities 54 Reorganize Professional Development for Educators $2,260,000 $11,300,000
62 Establish clear state-level leadership on professional development 63 Consolidate advisory functions related to professional development
63 Streamline the regional and local professional development advisory and policymaking structure
63 Refine and use the Master Plan for Statewide Professional Staff
Development as a true strategic planning tool 63 Determine the best and most cost-effective professional development
delivery model for the state 65 Improve professional development data to minimize course duplication
65 Continue to refine evaluation tools to determine the effects of professional development on teacher practice and student achievement
65 Provide adequate funding for RESAs to become centers of excellence for
teacher quality and professional development
65 Establish research-based state standards to create a vision for high-quality
professional development
66 Use student achievement data to assess the effectiveness of professional
development

6 www.public-works.org
Page # Recommendations Estimated Savings
Year 1 5-Year
66 Modify statutory language on teacher mentoring to provide for greater flexibility, accountability, and efficiency
66 Clarify training expectations for mentor teachers
66 Establish research-based state standards to create a vision for high-quality
professional development 66 Maximize professional development funding by actively pursuing all
available federal and private grant opportunities
66 Review WVDE policies and utilize waivers to allow more flexibility in how schools can use state teacher mentoring fund
67 Evaluate ways to establish best practices and improve compliance with
state laws and policies governing teacher mentoring
67 Allocate state and local professional development spending to identified priorities
67 Maximize West Virginia’s professional development funding by actively
pursuing all available federal and private grant opportunities 68 Utilize Cooperative and Pooled Purchasing $5,100,000 $25,500,000
69 Work with counties and RESAs to develop a purchasing plan that will
combine purchasing of common goods and services to achieve economies of scale
69
Amend Chapter 5A, Article 3 of the WV Code to allow schools operated by the WVDE to purchase materials and services from county and RESA
cooperative contracts
69 Amend §5A-3-19 of the West Virginia Code to exempt the WVDE from the
state’s procurement laws that require competitive bids and Request for Proposals when the WVDE uses State Board-approved consortiums
70 Maximize Limited Local Personnel Resources
70 Establish an initiative through WVDE to help small counties create job-sharing arrangements, wherever possible
Regional Coordination
71 Improve Oversight and Accountability of Regional Education Service Agencies (RESAs) to Maximize Resources $782,000 $3,900,000
81 Establish a comprehensive strategic planning process to review each RESA’s capabilities, strengths, and current services
81 Clarify the core services each RESA should provide and identify
opportunities for collaboration
81 Standardized RESA job descriptions so that WVDE can rely on a more consistent understanding of the expertise and ability of RESA staff
81
Establish a formal role for RESAs to more effectively use them to help identify struggling schools and to work, in cooperation with WVDE and the
district, in developing interventions
81 Educate districts on the role of RESAs and correct the perception that districts must invite RESAs into the county
81
Develop a comprehensive policies and procedures manual, including financial procedures, to provide for more consistent operations of the
RESAs 81 Streamline oversight and accountability of RESAs 82 Designate RESAs as eligible applicants for e-Rate funding
TOTAL $18,088,014 $115,732,720
7 www.public-works.org
Table 2: Summary of District- and RESA 7 Recommendations and Estimated Savings
District Total # Commendations
Total # Recommendations (No Fiscal Impact)
Total # Recommendations
(With Costs or Savings)
Total 5-Year Costs or Savings
Harrison 40 66 24 $11,029,320
Taylor 25 64 16 $3,885,947
Wyoming 28 73 13 $3,105,930
RESA 7 21 39 3 $124,870
TOTAL 114 242 56 $18,146,067
SECTION II: EDUCATION DELIVERY IMPROVEMENTS The main thrust of this review is to make the West Virginia educational system more efficient, from top to bottom, so that tax dollars can be better spent educating our children. But this review also has yielded overarching lessons that West Virginia can use to achieve the best return on its educational investment. This broader education-reform approach desired by Governor Tomblin also will pay dividends in improved efficiency and better targeted spending: Across the country, education reforms that empower schools, parents and students have gone hand-in-hand with reduced bureaucratic and administrative costs.
• The Baltimore school district initiated its reform program with $165 million in central-
office budget cuts, of which $88 million was diverted to local schools. By the end of the year, the district was expected to have diverted 80 percent of its operating budget directly to local schools.3
• The Hartford public schools, with just 22,000 students, reduced central-office expenditures by 20 percent as a result of its reform program.4
• The New York City Department of Education – a leader in empowering local schools and parents – has cut more than $230 million from its central-office budget since 2006.5
By increasing flexibility, reducing administrative overhead, and moving responsibility to the district, school building, and classroom levels, and empowering individual students and their families with 21st-century learning technologies, West Virginia will save money and make every expenditure more efficient. The second section of this Report addresses the broader policy implications raised by freeing up resources for the direct delivery of education at levels closest to student learners: the district, the school house, the classroom, and the student’s very desktop.
• To improve outcomes for individual students, West Virginia must deliver an education
that prepares today’s young people for the world – and particularly the workplace – of the future. Section 2.1 addresses means for better connecting the education system to the workforce and career futures that today’s students face.

8 www.public-works.org
• To improve education delivery at the school building and classroom levels, West Virginia
must focus on the quality of leadership from the building’s principal and the quality of classroom instruction delivered by the teacher. Section 2.2 addresses ways to support and improve school building leadership and classroom teaching.
• Finally, new technologies are making it more possible to deliver education geared to the individual student and to monitor individual needs and progress. Section 2.3 addresses how West Virginia can become not just an adapter, but a leader of these new developments in technology.

9 www.public-works.org
Table 3: Education Improvement Recommendations
Page # Recommendations
103 Enhance Collaboration Between Education and Workforce Development
107 Enhance strategic planning and collaboration between West Virginia’s education, workforce, and economic development leaders
107 Review all state education, workforce and economic development strategies and goals to determine possible areas of coordination and collaboration
108 Develop an interagency education/workforce/economic development plan that clearly establishes roles for each agency built on the state’s priorities
108 Evaluate opportunities to pool education, workforce and economic development funds toward common strategic goals 109 Develop integrated performance measures in workforce and education 109 Improve the use of job forecasting data to plan secondary and post-secondary programs 110 Support different high school design approaches 110 Establish a School Innovation Fund and simplify current Innovation Zone procedures 111 Better integrate career preparedness into the standard curriculum 111 Expand “cross-counseling” efforts in high schools
112 Improve educational outcomes and reduce costs incurred when students must receive remediation in post-secondary education
112 Increase articulation agreements between secondary and post-secondary institutions for Earn a Degree, Graduate Early (EDGE) credits
113 Maximize use of facilities, equipment and resources that can be shared by CTE Center and CTCs 115 Mandate 180 Days of Instructional Time and Align Teacher and Support Personnel Work Calendars 117 Revise West Virginia code to require districts to provide a minimum of 180 days of instructional time 117 Require all instructional days to contain at least the minimum number of hours in State Board policy 117 Revise code to abolish 43 week limit
117 Reduce the number of staff support days to reflect the number of instructional days and an appropriate number of training days
117 Revise code to provide consequences to districts for not meeting 180-day minimum days and hours per day threshold
117 Require districts to make up days that exceed the UC days estimated for the year, including adding days to the end of the school year if necessary
117 Launch a Comprehensive Plan to Recruit the Best Teachers
119 Modify code and policy to change hiring practices to allow for the filling of professional staff vacancies with the most qualified person regardless of seniority in the district
119 Establish a Teach for America program to recruit teachers for hard-to-serve areas
120 Establish a Teacher Recruitment Work Group, with representatives from the counties, to develop innovative ways to identify and hire qualified teachers
120 Provide flexibility to alternate route teachers in demonstrating content knowledge 120 Require new teachers to have a reduced workload 120 Ensure that elementary teachers know the science of reading 120 Ensure that elementary teachers know elementary content math 120 Ensure that elementary content texts adequately assess content knowledge in each subject area 120 Ensure that special education teachers are adequately prepared to teach subject matter 120 Ensure that teacher preparation programs are accountable for the quality of teachers they produce
121 Establish more comprehensive coursework requirements geared to areas of knowledge needed by elementary school teachers
121 Strengthen middle school teachers' subject matter preparation 121 Require all teacher preparation programs to meet state approval and not just national accreditation
121 Provide scholarships at state universities for aspiring teachers and active teachers seeking to pursue advanced degrees who pledge to work in West Virginia schools for a minimum of five years
121 Hold teacher preparation programs accountable for the quality of their graduates

10 www.public-works.org
Page # Recommendations
121 Establish Evaluation System Modeled after National Best Practices and Research 123 Increase percentage of points attributed to student learning 123 Work closely with district leadership to ensure sufficient time for evaluations 123 Identify others in school learning community to participate on evaluation team 123 Ensure that teachers and administrators receive data on impact on student growth in a timely fashion
123 Work on long-range plan to tie consequences to evaluation such as compensation, tenure, hiring, promotion and dismissal
123 Connect tenure decisions to teacher effectiveness 123 Prevent ineffective teachers from remaining in the classroom indefinitely 124 Use data reporting to help establish an equitable distribution of effective teachers among schools 124 Improve Teacher Compensation to Help Attract and Maintain the Best Teaching Corps Possible 129 Encourage districts to tie compensation to teacher effectiveness, not just advanced degrees and years teaching 129 Support retention pay, such as significant boosts in salary after tenure is awarded, for effective teachers 129 Encourage districts to provide compensation for related prior subject-area work experience 129 Support differential pay 129 Ensure that pension systems are neutral 129 Create career ladders for teacher
129 Create a rural homesteading program that would arrange very low-cost loans for new teachers who agreed to live and work in a rural community for 5 year
129 Initiate a substantial loan forgiveness program for students majoring in designated shortage areas 130 Offer higher salaries to teachers who choose to be judged on merit 131 Strengthen School Leadership by Investing in Principals 132 Remove barriers for talented individuals to enter the profession 133 Give principals control over school staffing and scheduling 133 Allow principals to have discretion to spend the school budget on the best programs and services for students
133 Give principals the freedom and responsibility on purchasing, setting schedules, work rules and hiring and releasing teachers
133 Introduce a multi-tier licensure system and tie salaries to licensure level 133 Encourage districts to use differential pay to motivate principals 133 Evaluate principals at least annually 133 Make West Virginia the Leader in Remote Technology and Distance Learning
138 Continue to work with private sector carriers to ensure high-speed broadband internet access for teachers and students
138 Ensure that all public school students and teachers have accessible computers or similar mobile devices 138 Use lease-purchase agreements to acquire computers and peripherals 139 Replace textbooks with digital content, including interactive and adaptive media
139 Require districts to spend 50 percent of their textbook budget on on-line content within two years – and 100 percent within a decade
139 Use statewide purchasing power to negotiate lower cost digital content and on-line courses 140 Appropriate significantly more funding to technology-assisted courses 140 Enact legislation and fund WVVS so that counties can use only state-approved on-line learning programs 140 Require schools to report to the WVDE all reasonable but unavailable student course requests 140 Create a dedicated funding stream to fund WVVS 140 Develop and lease WVDE virtual courses to out-of-state entities 140 Ensure access to high-quality digital content and on-line courses to all students 140 Let students take as many on-line courses as they want 141 Hire an adequate number of Technology Integration Specialists to support teachers 141 Increase training in curricular use of technology

11 www.public-works.org
Better Connecting the Education System to Workforce and Career Futures There are many reasons for an education: The sheer joy of learning. Life’s enrichment through a knowledge and understanding of music and the arts. The cultivation of social skills and transmission of cultural norms and values. The development of an informed and conscientious citizenry essential to the proper functioning of a democracy. But for most people, the primary purpose of an education is to acquire the skills necessary to succeed and support oneself in the work world. This purpose is becoming more imperative all the time. Advancing technology in all areas of work – from nuclear physics to automotive repair – means that the range and depth of intellectual skills required for pursuit of virtually any occupation is greater today than it used to be, and continually expanding. Globalization and development are bringing increased competition for American workers, requiring higher and higher skill levels. It is more and more true every year that “the more you learn, the more you earn.” Higher levels and better quality of education are increasingly important both to individual advance and the national interest. While not the only goal of education, our schools and educational system as a whole clearly must be aligned with the workforce demands which graduates must master in the 21st Century, There are additional reasons for connecting education with the world of work. It turns out that people learn better through doing and applying, rather than just rote memorization. Young people in particular appreciate and understand their studies better when they can see how what they are learning has or will have real-world relevance for them: In a very simple example, kids are more motivated to learn arithmetic as part of a process of calculating a customer’s bill at the check-out counter than by simply remembering multiplication tables. What each student needs to know will vary. It’s estimated that by 2018, 63 percent of all jobs nationally will require education beyond high school; by way of comparison, currently 40 percent of the nation’s workforce is required to have some type of postsecondary certificate or licensure. In short, the percentage of the jobs requiring some amount of college or post-high school education will rise by nearly two-thirds (from 40 percent to 63 percent) in just the next half-dozen years: A lot more employers are going to be looking for employees with more education – and a lot more workers are going to need to study beyond high school. Most of these individuals, however, will not require a four-year college education. For all these reasons and in all these ways, the education system needs to relate to and interact with the workforce development system and the private sector. Global demands and business needs are changing faster than our schools – educational leaders and policy-makers need to be attuned to these changes and respond accordingly. Curricula need to be restructured based on what we know about how better to engage students and impart knowledge, starting in early grades and continuing through high school. Individual students need to have different options available to prepare them for traditional college liberal arts curricula, for advanced math and science education, or for post-secondary technical training, depending upon their varying interests and aptitudes. All of this will require closer cooperation amongst all the various sectors – the PK-12 system, community colleges, public and private four-year colleges and universities, the private sector, and state government policymakers. West Virginia took a strong step in this direction with the creation of the state’s Jobs Council under former Governor Joe Manchin. Now, Governor Tomblin is assuming a crucial leadership role in furthering inter-sectoral cooperation in this area.

12 www.public-works.org
Improving Schools: Setting High Standards and Curriculum, Then Allowing Principals to Lead and Teachers to Teach – and Holding Them Accountable Studies indicate that empowering principals, teachers and involved parents is the best way to run effective schools. West Virginia should give principals more authority over their school, give them the resources to make that school work – and then hold them accountable. If the school succeeds, they should be rewarded; if it does not, they should be replaced. If management changes do not show improvement, then faculties need to change, too.
Under this system, every public school would be able to design the best curriculum and hire the best staffs to meet students’ needs. The best schools will thrive. Schools that do not achieve would get new leadership and staff. And it all starts with setting high standards and then giving responsibility to educators to meet them. Districts across the country have used these elements as the basis of successful school reform models.
• Boston now has 23 pilot schools, a program launched in 1995.6 The pilots are public schools with greater control over their budgets, schedules, hiring and curriculum. Students in Boston's pilot high schools perform better on standardized tests, have fewer discipline events, attend class more often, and graduate at higher rates than those enrolled in the city's regular public high schools. Students had higher ninth-grade attendance, higher advancement rates to the 10th grade, and higher 10th-grade test scores.7 Factors that help pilot high schools produce better results include the schools' smaller sizes (100 to 450 students), faculty buy-in (since they help design the curriculum), and greater accountability.8
• Beginning in the 2007-08 school year, all New York City schools are being held accountable for meeting their own “statement of performance terms” in which they pledge to meet targets in student progress. Schools not living up to their commitments face consequences, while schools that meet them receive rewards.9 Leading-edge schools like this also can be found in Baltimore, Chicago, Cincinnati, Denver, Houston, Oakland and San Francisco, Seattle, St. Paul and Hawaii.10
Similarly, West Virginia needs to set higher expectations for its schools, and its students – as well as give them the tools they need to succeed. That starts by raising a minimal educational requirement on which West Virginia lags behind virtually every other state: the length of the instructional year. West Virginia needs to require 180 instructional days of all schools, if it to begin to compete effectively with other states. It then needs to give its educators the ability to do what they can do best, by treating them as members of society’s most valued profession, paying and training them accordingly. The state then needs to go out and recruit the best teachers, and provide the means for any under-performing teachers to raise their skills to the required level. Empowering Students and Their Families to Obtain the Best Education In an ideal world, every school would attract the highest-quality teachers with tremendous school leadership, achieve world-class educational standards, and parents and their children would have their choice of a wide range of all the best options, choosing what is right for them in

13 www.public-works.org
terms of career preparation, courses of study, school atmosphere, and convenience. But this is rarely the case. Some of the changes suggested in this study will help this ideal to become more common. Meanwhile, schools and families in rural areas – like most of West Virginia – face a special challenge. It is hard for parents to place their children in a better school if that school is 100 miles away. And, in any event, West Virginia needs to do more to attract, train, and retain the best teachers in every school. West Virginia is currently shooting itself in the foot in that regard; this Report has identified numerous ways in which it can, and must, do better in recruiting and keeping its teachers. But the Mountain State will still face stiff competition in this arena: Most states offer financial incentives for teachers in subject-area shortages, such as math and science, or underserved schools.11
New York City offers teachers in high-need content areas, including math and science, and in underserved schools, a $14,600 housing subsidy. The state’s resources are tight, and West Virginia already ranks high in per-pupil spending.
Instead, West Virginia can and must use technology to give West Virginia families and schools more choices. Thanks to today’s technology, students anywhere can to take courses from the best teachers. West Virginia must ensure that schools have the technology and the leadership to:
• Enable students to take any course they want, from any teacher, anywhere in the state – or the world – to travel to any country or museum or laboratory anywhere they want, and to do it from anywhere they want.
• Attract the best teachers to West Virginia classrooms – by giving those who live here the
best and most modern instructional tools and by enabling those who don’t to reach our students, as well, through modern technology.
• Turn “distance” from a concept that limits options and costs money, as now, into one that
means expanding options and financial savings – thanks again to these new technologies.
These fundamental changes will place West Virginia at the forefront of education reform in the 21st Century by giving parents, teachers and principals the freedom – and the responsibility – to improve the state’s schools. Combined with the cost-savings and reductions in bureaucracy and non-educational spending identified in the first part of the report – which will help free up the resources needed to invest in this new educational future – these recommendations will help create the future-oriented, student-centered education system that West Virginia wants and needs.

14 www.public-works.org
1. SAVINGS AND EFFICIENCIES
For this state-level review, we looked across the board at administrative and management operations to determine how “back office” functions are provided, and most especially, to look for ways that these functions can be accomplished more efficiently and effectively. The review included:
• Overall organization, administration and management; • Design and delivery of programs and services and oversight of each program; • Facilities; • Delivery of educational services; • Purchasing; • Food services and child nutrition; • Transportation; • Human Resources; and, • Information technology.
To investigate these areas, we:
• Reviewed budgets, performance data, reports, organizational procedures, West Virginia Code, West Virginia Board of Education Policies, and any other documents relevant to the review.
• Researched best practices from around the country and assessing their relevance to
West Virginia.
• Conducted on-site interviews – individual, small groups and focus groups – of key stakeholders, community representatives, West Virginia Department of Education (WVDE) leadership, management, administration, supervisors and staff.
• Set up a URL address to give WVDE administrators and staff a confidential forum to provide opinions and comments on WVDE operations.
In addition to reviewing the WVDE, the state-level review included the Center for Professional Development in the Department of Education and the Arts and the School Building Authority. This report starts its examination of possible savings at the state level by discussing statewide administration, before turning to various sub-units and functions of the state-level education system and working its way down to relationships at the regional level (MGT provides separate reports on the regional and district level, which are summarized herein). This places first what all review participants expect to be the most widely cited and highly charged finding of this report: that West Virginia could save roughly $4 million per year by reducing the size of its state-level education bureaucracy, especially its supervisory levels. While right-sizing the Department is a worthwhile goal and a part of our recommendations, however, it is only one part of what West Virginia must focus on and achieve to meet its twin goals of improving the efficiency of education spending and then using those efficiencies to improve education and educational outcomes throughout the state.
15 www.public-works.org
Unlike the previous issue, one that has the effect (as do some others in the report) of increasing WVDE’s size and importance is our recommendation that the overall state education system be streamlined by consolidating all professional development oversight in one place (WVDE) rather than splitting it between two state-level entities (WVDE and the Department of Education and the Arts), as now. That goes to a question we were asked more than once: “Is West Virginia’s education system too centralized, or too decentralized?” The answer is “both” – in some areas, greater decentralization would improve educational delivery, while in others greater centralization would improve efficiency. There is no cookie-cutter answer. West Virginia’s education system is unique in the country in one major factor – the Department of Education, governed by a State Board, is constitutionally separate from the Executive or Legislative Branch. The system is detailed to the extreme in statutory language that results in an education system that has little flexibility to modify policy and operations without changes to Code. We have encountered no other state that insulates its education system so much from gubernatorial – or voter – control; restricts local initiative so much on the part of districts, building principals, and teachers; and vests so much authority for education at the state level. This is, of course, the citizens’ choice. But it runs counter to most of the concern and thinking in educational reform today that individual initiative and accountability should be encouraged, while responsibility for education must ultimately come to a single point at the top of the pyramid and that the individual ultimately responsible must him- or herself be accountable to the voters. This should not, however, preclude the Department and State Board from working with the Governor to improve the system and to ensure better outcomes for students. This review is a significant step in bringing about this type of cooperative approach to identifying ways the education system in West Virginia can be re-focused on students. In considering the specific recommendation that responsibility for professional development be taken from the Secretary of Education and the Arts and consolidated in WVDE, we necessarily considered the history and institutional arrangements behind the unique role that the Secretary has played in West Virginia. The incumbent Secretary, Kay Goodwin, is a forceful and talented exponent of that role, particularly for the function of maintaining a gubernatorial presence (if, indeed, a small one) in the formulation of education policy and the oversight of system-wide spending that accounts for roughly half of all state funds in West Virginia. But this raises the questions, Why professional development? And why not everything else? The answers are historically and politically, not education and efficiency, based. We conclude that efficiency and performance factors call for consolidating service delivery under the single bureaucracy of the WVDE. But an important place remains for what Secretary Goodwin has identified as the “watchdog” and advocacy role of the Secretary in making sure that the largely independent education created entity by West Virginia’s Constitution remains publicly accountable and, crucially in a democracy, constantly if collegially questioned. Therefore, while we recommend that the legislature, consistent with the Constitution, consolidate operational roles such as the conduct of professional development in WVDE, we also suggest that it expand the more general oversight and advocacy role of the executive branch through the Secretary of Education and the Arts. Together, these, and some of the other 50 recommendations in the first section of this report, will undoubtedly engender heated debate amongst many in West Virginia. But they are all intended to ensure that West Virginia’s education dollars are spent as efficiently and effectively as possible – so that the state is best positioned to address the vital education delivery improvements discussed in the second half of the report.

16 www.public-works.org
1.1. Administration
A. Reorganize and Right-Size the West Virginia Department of Education
Background and Findings State education agencies play a critical role in managing a large and complex education system in every state. Yet little attention is focused on how the state agency is organized, operates or spends state and federal funds on administration, and little is known as to how well they are performing required functions.12
Since 2001 and the enactment of the No Child Left Behind Act (NCLB), state education agencies have evolved from serving as conduits for federal funds and enforcers of federal spending requirements, and have adopted a focus on standards, assessment and accountability. With NCLB and the more recent federal Race to the Top initiative, heightened attention is now placed on low-performing schools, data collection, and teacher quality – and state education agencies are challenged to change how they operate in order to help school districts in these critical areas. Nationally, the shift from strict monitoring to one of partnering with districts and providing technical assistance has not been accompanied by a commensurate focus on how well state agencies are doing the job and whether they have the capacity to assist districts to meet the demands of the new requirements. The West Virginia Department of Education (WVDE) has a formidable responsibility to oversee 55 school districts plus institutional education and the Schools for the Deaf and Blind in pursuing its mission to ensure that every child in West Virginia receives a quality education. To accomplish this goal, the WVDE is responsible for functions ranging from regulatory oversight to providing technical assistance and support to county districts and schools. Perceptions of WVDE’s primary role vary. Department employees believe they are engaged with the counties, providing technical assistance and support. District employees and representatives of various professional organizations in the state, in contrast, see the Department as concerned primarily with regulatory functions and not as a significant resource for assistance in tackling particular problems; these groups describe the Department as distant from the real-world problems of operating a school district. Additionally, the Department is described as operating in “silos” that can sometimes lead to duplication of efforts, inefficiency, and contradictory guidance. Newly-appointed Superintendent Jorea Marple and the state Board of Education are examining the WVDE organization and working to assess its effectiveness. In the past six months, Superintendent Marple has instituted a broad internal management and accountability system to focus, streamline and coordinate the work of WVDE staff. All staff members have been held accountable for organizing work around Board of Education goals and strategic priorities. This comprehensive effort is accessible through a digital work plan that is the centerpiece of a quarterly monitoring process that will direct staff evaluations and goal setting. The Superintendent and her staff are continuing to refine this system in order to assure the efficient and effective expenditure of public funds. Some managers and staff are aware of the new Superintendent’s and Board’s directives to collaborate on planning and service delivery to the counties. Unfortunately, however, not everyone, especially at the local level, is aware of this message and many still see WVDE as “playing with the edges” rather than taking bold steps to organize around centers of excellence.

17 www.public-works.org
The following discussion first looks at the WVDE’s size, structure and organization itself. It then compares the Department’s size with those in other states. To help explain the discrepancies identified, the report then examines the recent trend in the distribution of WVE staff and finally looks at the organization’s “span of control” to assess supervisor-to-subordinate ratios.
A Look at the WVDE Organization Table 4: WVDE Positions – FY2011 Full-Time Positions, identifies the title and number of full-time staff in each title within the West Virginia Department of Education. This staffing list includes some titles not directly associated with K-12 education, since WVDE also operates the Cedar Lakes Conference Center, Institutional Education and the Schools for the Deaf and Blind. This listing of staff and a look at the new organization chart on the WVDE web site reveals:
• The department lists a total of 637 positions, including offices not directly related to PK-12 education such as Cedar Lakes and Institutional Education.
• Of the 637 budgeted positions in the department, 319 are administrative and
management staff overseeing all aspects of the K-12 education system. The remaining 318 employees are associated with the Office of Education Performance Audits, Cedar Lakes Conference Center, and Institutional Education.
• In addition to the Superintendent and Deputy Superintendent, WVDE has four Assistant
Superintendents, 19 Executive Directors and 27 Assistant Directors, one Division Assistant Chief, one Executive Director/Chief Financial Officer.13
• In FY11, WVDE had a total payroll of $45.7 million. Deducting payroll for Cedar Lakes and Institutional programs (Schools for the Deaf and Blind are already separated out), the portion of the payroll associated with oversight of the PK-12 system is $21.0 million.14 Including fringe benefits (calculated at 33 percent of salary), the cost of personnel overseeing the K-12 system amounts to $27.9 million. About 26 percent of salary and benefits come from federal funds.15

18 www.public-works.org
Table 4: WVDE Positions – FY2011 Full-Time Positions
Officials/Administrators
Administrative Support Assistant Directors 27 Accountant II/Front Desk Foreman 1
Assistant Superintendent 4 Accountant II/Secretary II 2
Deputy Superintendent 1 Accountant III 1 Division Assistant Chief 1 Accountant III Lead 18
Ex. Assistant to Asst. Supt. 1 Accountant III/Adm. Services 1
Executive Director/CFO 1 Aide 9 Executive Directors 19 Associate Secretary 1
Executive/Administrative Assistant 1 Conference Services Coordinator 1
Liaisons Director 5 Craft Center Service Coordinator 1 OEPA Deputy Director 1 Division Secretary 4
OEPA Director 1 Executive Assistant Secretary 1
OIEP Superintendent 1 Executive Secretary 2 State Superintendent 1 Graphic Artist 2 Total 64
Legal Secretary 1
Professionals
Legal Secretary 1 Academic Coach 4 Mail Clerk/Print Operator
Assistant Principal 2
Operations Manager 1
Attorney 1 Secretary II 43 Autism Mentor 1 Secretary II/Aide 2
Career Tech. Instructor 1 Secretary III & IIIA 31
Coordinator 142 Secretary III/Super Aide 3 1 Coordinator Lead 2 Secretary IV 1
Cosmetology Instructor 1 Total 125 Counselor 22
Skill Craft
Counselor/Social Worker 1 Specialist 1
Culinary Arts Instructor 1 Total 1 Diagnostician 4 Service Maintenance
E-learning Program Assistant 1 Cafeteria Manager 3
Engineer/Mechanical 1 Carpenter 2
General Counsel 1 Cook III 7 Intervention Specialist 8 Cook III/Handyman/Custodian 1
Investigator 1 Crew Leader/Groundsman 1
Lead Teacher 9
Custodians 7 Math Interventionist 1
Electric Tech. II/Acct. 1
On-Line Instructors 5
Food Service Coordinator 1
Plumbing Instructor 1
Foreman 4 Principal 13
Handyman 1
Public School Liaison 2
Inspectors 5
Reading Specialist 2
Mechanic 1 Teacher 164
Printing Operator 2
Transition Specialist 1
Supervisors 1 Total 392
Total 37

19 www.public-works.org
Technicians
Cisco Networking 1 Computer Technician 2 Curriculum Dev. Technician 1 Data Coordinator 1 HVAC Tech 3 Information Systems Technician 3 Programmer 4 Technology Integration Specialist 1 Web Designer/Programmer 2 Total 18
GRAND TOTAL 637
Source: West Virginia Department of Education. As noted in narrative, 637 positions include: Cedar Lakes, OPEA, and Institutional Education. Removing these from the count results in 319 positions overseeing the K-12 system.
Comparison to Other States The first question that arises is how this size and structure compare with those of other state education departments. This is not a question with a straightforward answer, as a number of variables must be considered. No two state education agencies are organized in exactly the same way. Nonetheless, while comparing state structures is not an exact science, it is an excellent way to benchmark various indicators such as ratios of staff to students or number of schools. The West Virginia Department of Education has explained during the course of this review that, in its view, it is nearly unique, and a uniquely efficient and effective use of the state’s taxpayer dollars, because:
• A high proportion of its staff and programming is supported by non-state (federal and other) grant funding;
• It is responsible for the oversight of a number of troubled school districts;
• It oversees a vast array of different, individual education programs, giving its staff an unusually large “span of responsibility”; ,
• The state is highly rural, requiring higher staffing levels per student and school;
• The state is under a court order to promote educational equity, thereby requiring state-level involvement in virtually every aspect of local school district functioning; and
• The state constitution gives the department almost unparalleled responsibility for the state’s entire education system’s operation.
In fact, states include different functions in their departments of education – some have responsibility for workforce programs, vocational rehabilitation, state library systems, even

20 www.public-works.org
higher education. Despite this variance, there are some commonalities that should be noted, as well as some differences:
• All states have a combination of federal and state funds that support programs and staff. All states are competing for or allocated the same federal funds. Virginia’s department of education, for instance, is funded 45 percent by state monies and 55 percent by federal or other dedicated funds such as licensing fees, compared to 43 percent in West Virginia funded by federal or special grants.16
• All states have responsibility for intervening in failing school systems. This may consist of formal legislative authority to “take over” a district or, short of “takeover” authority, requiring the state agency to become involved in decision-making and daily oversight of a low-performing district. In both scenarios, however, state agencies in every state have added responsibilities for low-performing districts.
• All states have staff responsibilities that encompass local and/or regional oversight of programs, staff or grants. Unlike some state services where the agency directly provides services to the public, education agencies in every state oversee districts, programs, funding and services that are not directly provided by the agency.
• The National Center for Education Statistics lists 23 states where at least 50 percent of the districts are rural, ranging from a high of 87 percent in Alaska to 51 percent in Wyoming. In West Virginia, 58.1 percent of the districts are considered rural.17
• Forty states are under court orders in lawsuits brought by parents and education advocates that challenged the fairness of funding formulas.18 Twenty states have revised school facilities funding in response to litigation.19
• In short, many of the explanations offered for West Virginia’s staffing levels do not significantly distinguish it from many, if not, most other states. However, West Virginia does stand out in one area in particular: Some states are more highly regulated by code than others and some are working under court orders that require the state agency to perform certain duties in relation to school districts. West Virginia has one of the most highly regulated systems in the country – if not the most – with many of the details of school operations spelled out in code.
To get at meaningful differences in departmental size and structure, then, we first benchmarked West Virginia’s state education bureaucracy against those of neighboring states, especially Virginia, to which the state often compares itself. WVDE objected, however, that this comparison was both too broad and too narrow; the Department argued that its range of responsibilities necessarily required personnel beyond those of these other states, and also that such larger neighbors as Virginia, Maryland and Ohio offered poor comparisons with the needs of smaller, more rural West Virginia. In this discussion, therefore, we first look at state education organizations in total, regardless of differences in responsibilities, but then refine those comparisons by narrowing the scope to staffing related directly to PK-12 oversight. We also, at WVDE’s urging, look beyond West Virginia’s immediately neighboring states and compare the Department with its peers in five categories:

21 www.public-works.org
1. All states (46) for which there is comparable data. 2. All states (15) that are at least as rural as West Virginia, including a direct comparison
with the two states (Maine and New Mexico) most directly comparable to West Virginia in share of rural districts.
3. The two states (Idaho and Nebraska) closest in student population to West Virginia. 4. The one state (Hawaii) whose state education department possesses inarguably larger
statewide responsibility. 5. Three directly neighboring states (Virginia, Maryland and Ohio).
As will be seen, the conclusions to be drawn from all five comparisons are essentially the same. The most recent review of state education agencies was conducted for Center for American Progress, American Enterprise Institute for Public Policy Research, and The Broad Foundation, in a report entitled, State Education Agencies as Agents of Change.20
The authors acknowledge the scarcity of information on state education agencies and therefore went through the exercise of contacting every state in the country to compile data on the number of staff in each state education agency. Table 5: Ratio of Education Agency Staff to Number of Students – All States, lists agency staff and student counts from the report. In addition, we have added the ratio of staff to students that shows the wide variation in state organizations.
Comparing total staffing to student enrollment shows a wide variance ranging from 1:206.6 in Alaska to 1 to 5,327.6 in New York State. West Virginia has the second-lowest ratio (1 to 419.3), i.e. the fewest students per state departmental staff, in the country. As noted, this includes all state agency staffing – in the instance of West Virginia, that includes staffing for Cedar Lakes, Institutional Education, and the Office of Education Performance Audits, but not all of professional development. Other states have similar issues – some include vocational rehabilitation, state library systems, higher education, or other programs not directly related to PK-12 education oversight and not included in West Virginia’s total. If one includes West Virginia staffing numbers associated only with PK-12 oversight, thus reducing the size of the West Virginia bureaucracy under consideration by half (and without making similar allowances for other states), West Virginia (at 887.2) would still rank only ninth-lowest in the ratio of students to state bureaucrats..
22 www.public-works.org
Table 5: Ratio of Education Agency Staff to Number of Students – All States
Agency Staff
Student Enrollment
Ratio of Staff to Students -- 1 to
Alaska 634 131,000 206.6
West Virginia* 675* 283,000 419.3
Delaware 222 123,000 554.1
Vermont 158 92,000 582.3
Wyoming 135 86,000 637.0
New Hampshire 284 201,000 707.7
Hawaii 215 180,000 837.2
Alabama 888 744,000 837.8
Montana 166 143,000 861.4
South Dakota 135 120,000 888.9
North Dakota 101 95,000 940.6
Louisiana 650 681,000 1,047.7
Rhode Island 133 146,000 1,097.7
New Mexico 245 328,000 1,338.8
Nebraska 215 291,000 1,353.5
Maine 139 191,000 1,374.1
Tennessee 695 964,000 1,387.1
Maryland 548 846,000 1,543.8
Arkansas 366 579,000 1,582.0
Connecticut 325 568,000 1,747.7
Utah 328 576,000 1,756.1
Kansas 251 468,000 1,864.5
North Carolina 779 1,458,000 1,871.6
Massachusetts 500 963,000 1,926.0
Wisconsin 437 874,000 2,000.0
Oregon 268 559,000 2,085.8
Minnesota 400 838,000 2,095.0
Kentucky 315 666,000 2,114.3
Idaho 128 272,000 2,125.0
Oklahoma 300 642,000 2,140.0

23 www.public-works.org
Agency Staff
Student Enrollment
Ratio of Staff to Students -- 1 to
Iowa 225 482,000 2,142.2
Colorado 369 802,000 2,173.4
Arizona 481 1,087,000 2,259.9
Florida 1,128 2,667,000 2,364.4
Washington 400 1,030,000 2,575.0
Georgia 537 1,650,000 3,072.6
Ohio 582 1,822,000 3,130.6
Michigan 460 1,666,000 3,621.7
Pennsylvania 493 1,788,000 3,626.8
Missouri 251 917,000 3,653.4
Nevada 100 429,000 4,290.0
Illinois 487 2,113,000 4,338.8
Indiana 239 1,046,000 4,376.6
Virginia 265 1,231,000 4,645.3
California 1,200 6,070,000 5,058.3
New York 519 2,765,000 5,327.6 Source: State Education Agencies as Agents of Change, Center for American Progress, American Enterprise Institute for Public Policy Research, The Broad Foundation, July 2011. Authors had no response from: Mississippi, New Jersey, South Carolina and Texas. *Note: The report does not differentiate staffing that is not related to PK-12 system oversight. WVDE staffing, therefore, includes Cedar Lakes, Institutional Education, Office of Education Performance Audits. Likewise, other states may have functions such as Vocational Rehabilitation, State Library systems, and other functions not related to PK-12.
Table 6: Ratio of Staff to Students in Selected Rural States, below, compares West Virginia only to those other states with at least as high a percentage of rural districts. This comparison shows states that have district oversight challenges similar to West Virginia’s, caused by geography such as mountains, prairies or deserts. It also again includes staffing numbers associated only with PK-12 oversight, thus reducing the size of the West Virginia bureaucracy under consideration by half without similar adjustment in other states’ numbers. This comparison shows that:
• Only three of the 15 states have ratios of staff to students that are lower than WVDE. • Nine states have ratios of staff to students in the thousands, ranging from 1,082.6 in
Alaska to 4,290 in Nevada.
• North Dakota, the most rural state (93.1 percent of districts), has a higher ratio than WVDE – 1 to 940.6 compared to WVDE at 1 to 887.2.

24 www.public-works.org
• Maine and New Mexico, the states with the percentage of rural districts closest to that of West Virginia, have ratios of staff to students of 1 to 1,374.1 and 1 to 1,338.8, respectively.
• Idaho and Nebraska, the states with student enrollments closest to that of West Virginia, have ratios of staff to students of 1 to 2,125.0 and 1 to 1,353.5, respectively.
Table 6: Ratio of Staff to Students in Selected Rural States
Agency
Staff Student
Enrollment Percent of Districts
Rural
Ratio of Staff to Students --
1 to
Vermont 158 92,000 66.4 582.3
Wyoming 135 86,000 51.0 637.0
Montana 166 143,000 84.5 861.4
West Virginia 319* 283,000 58.1 887.2
South Dakota 135 120,000 85.6 888.9
North Dakota 101 95,000 93.1 940.6
Alaska 12121 131,000 87.2 1,082.6
New Mexico 245 328,000 61.3 1,338.8
Nebraska 215 291,000 73.3 1,353.5
Maine 139 191,000 54.8 1,374.1
Arkansas 366 579,000 63.5 1,582.0
Idaho 128 272,000 68.1 2,125.0
Iowa 225 482,000 68.3 2,142.2
Colorado 369 802,000 65.9 2,173.4
Nevada 100 429,000 52.9 4,290.0 Note: WVDE staffing is PK-12 oversight only. It does not include Cedar Lakes, Institutional Education, Schools for the Deaf and Blind. Comparison states’ staffing includes only PK-12 oversight also.
WVDE itself suggested Hawaii as a potential comparison (along with such states as New Mexico and Nebraska, for reasons noted above) because of the responsibility given to Hawaii’s state education department for oversight of the state’s entire education system. WVDE argues that the Mountain State is nearly unique in the responsibility vested in its state department for overseeing failing school districts as well as general functioning of the state’s districts and RESAs: Despite a population similar to West Virginia’s spread over 7 major islands and 130 other islets, Hawaii has only one school district for the entire state, directly administered by the state department of education. “The Hawaii State Department of Education is the most centralized and only statewide public education system in the United States. The school district can be thought of as analogous to the school districts of other cities and communities in the United States, but in some manners can also be thought of as analogous to the state education

25 www.public-works.org
agencies of other states. As the official state education agency, the Hawaii State Department of Education oversees all 283 public schools and charter schools and over 13,000 teachers in the State of Hawaii.”22
As a result, it is impossible to compare Hawaii’s staffing directly with West Virginia’s, since the former includes thousands of teachers, principals, and other local school and district officials. However, it is possible to do a straight “apples-to-apples” comparison of the two state departments: WVDE’s staff deployed on PK-12 functions (319) outstrips Hawaii’s (215) by nearly 50 percent (a total of 104 positions), while West Virginia’s staff-to-student ratio – at 887.2 – is only slightly better (by about 6 percent) than Hawaii’s (837.2). Focusing on Hawaii as a benchmark, then, affects any assessment of WVDE staffing levels only marginally.
Compared, however, to a sample of states immediately bordering West Virginia (Maryland, Ohio, and Virginia were used where reliable comparison data was found), WVDE’s organization stands out as proportionately even larger in total number of staff, generally with more divisions. Again, this snap-shot of the organization does not include the additional staffing in the Center for Professional Development, which in other states is part of the state education agency. As shown in Table 7: State Education Agencies Staffing Comparisons and Table 7A: West Virginia Profile Comparison to Other States below, some key administrative staffing comparisons to other states include:
• Virginia has 288 employees (265 full-time, 45 part-time) in its state-level Department of Education dedicated to the oversight of the K-12 educational system – slightly fewer than West Virginia.23 Virginia, however, has about four and a half times the number of students and almost three times the number of schools as West Virginia.24
• Virginia has a Superintendent and Deputy, six Assistant Superintendents, 25 Executive Directors, and 5 Assistant Directors – one more Assistant Superintendent, two more Executive Directors, and 17 fewer Assistant Directors than West Virginia.
• Maryland, with about three times the student population and almost twice the number of
schools as West Virginia, has 468 staff in its Department of Education dedicated to K-12 – 44 percent more staff than WVDE. This includes a Superintendent, two Deputy Superintendents, eight Assistant Superintendents, 28 Executive Directors, and 34 Branch/Sector Chiefs.25
• Ohio, with over six times the student population and five times the number of schools as West Virginia, recently reorganized its Department of Education, with approximately 600 staff (about one and a half times the administrative staffing in West Virginia). The department now has one Deputy Superintendent, one Chief Operating Officer, two Associate Superintendents and four Senior Executive Directors, each responsible for a “center” – Curriculum and Assessment, Teaching Profession, Accountability and Continuous Improvement, and Student Support and Education Options. 26

26 www.public-works.org
Table 7: State Education Agencies Staffing Comparisons
Number
of Schools
Number of
Students
State Level
Staffing Superintendent/
Secretary Deputy/
Associate Superintendent
Assistant Superintendent
Executive Director/ Division Director
Assistant Director
Total Admin.
West Virginia 771 282,662 319 1 2 3 27 22 55
Maryland 1,475 848,412 468 1 2 8 28 34* 73
Virginia 2,186 1,245,340 288 1 1 6 29 37
Ohio 3,895 1,764,297 600 1 1 6 N/A N/A
*Note: Maryland’s titles are Branch/Section Chiefs
Table 7A: West Virginia Profile Comparison to Other States
Number
of Schools
Number of
Students
State Level
Staffing Schools as
percent of WV Students as
percent of WV
West Virginia 771 282,662 319
Maryland 1,475 848,412 468 191.3% 300.2%
Virginia 2,186 1,245,340 288 283.5% 440.6%
Ohio 3,895 1,764,297 600 505.2% 624.2%
Comparing WVDE’s level of staffing to neighboring states shows ratios of staff to both the number of schools and the number of students to be significantly less than in surrounding states. As is shown in Table 7B: Ratios of Schools and Students to Staff, WVDE has a staff to student ratio of 1 to 367 and 1 to 2.4 ratio of staff to schools – surrounding states are well above this level.
Table 7B: Ratios of Schools and Students to Staff
State Level
Staffing
Number of
Schools
Ratio Total Staff
to Schools
Number of
Students
Ratio Total
Staff to Students
West Virginia 319 771 1 to 2.4 282,662 1 to 886
Maryland 468 1,475 1 to 3.2 848,412 1 to 1,813 Ohio 600 3,895 1 to 6.5 1,764,297 1 to 2,941
Virginia 288 2,186 1 to 7.6 1,245,340 1 to 4,324 Finally, Table 8: State Education Agencies Management/Senior Staffing Comparisons below, displays key administrative staffing numbers in WVDE compared to those for the same set of rural states used earlier. As can be seen, West Virginia has a much higher number of mid-level administrators.
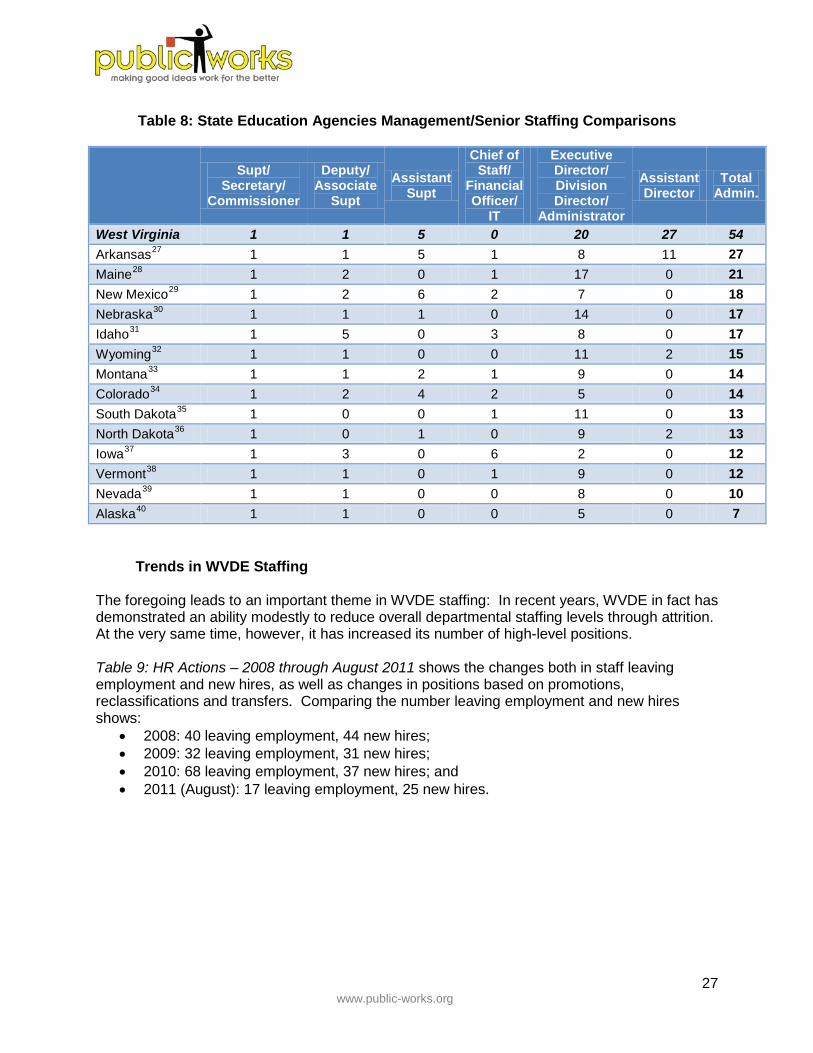
27 www.public-works.org
Table 8: State Education Agencies Management/Senior Staffing Comparisons
Supt/
Secretary/ Commissioner
Deputy/ Associate
Supt Assistant
Supt
Chief of Staff/
Financial Officer/
IT
Executive Director/ Division Director/
Administrator
Assistant Director
Total Admin.
West Virginia 1 1 5 0 20 27 54 Arkansas27 1 1 5 1 8 11 27 Maine28 1 2 0 1 17 0 21 New Mexico29 1 2 6 2 7 0 18 Nebraska30 1 1 1 0 14 0 17 Idaho31 1 5 0 3 8 0 17 Wyoming32 1 1 0 0 11 2 15 Montana33 1 1 2 1 9 0 14 Colorado34 1 2 4 2 5 0 14 South Dakota35 1 0 0 1 11 0 13 North Dakota36 1 0 1 0 9 2 13 Iowa37 1 3 0 6 2 0 12 Vermont38 1 1 0 1 9 0 12 Nevada39 1 1 0 0 8 0 10 Alaska40 1 1 0 0 5 0 7
Trends in WVDE Staffing The foregoing leads to an important theme in WVDE staffing: In recent years, WVDE in fact has demonstrated an ability modestly to reduce overall departmental staffing levels through attrition. At the very same time, however, it has increased its number of high-level positions. Table 9: HR Actions – 2008 through August 2011 shows the changes both in staff leaving employment and new hires, as well as changes in positions based on promotions, reclassifications and transfers. Comparing the number leaving employment and new hires shows:
• 2008: 40 leaving employment, 44 new hires; • 2009: 32 leaving employment, 31 new hires; • 2010: 68 leaving employment, 37 new hires; and • 2011 (August): 17 leaving employment, 25 new hires.

28 www.public-works.org
Table 9: HR Actions – 2008 Through August 2011
Calendar Year
Resign/ Reduction in Force
Retire New Employ Promotions Reclassification Transfers
2008 16 24 44 4 13 24
2009 10 22 31 4 10 18
2010 21 47 37 24 48 28 2011
(August) 5 12 25 3 3 6
52 107 137 Source: Information provided by WVDE HR Office, September 27, 2011. Includes Cedar Lakes; excludes Institutional Education.
An organization the size of WVDE will always have new hires and promotions due to resignations and retirements. While WVDE reclassifies some positions because of additional responsibilities, the Department also reclassifies positions based on course work completed by incumbents even when the position responsibilities are not changed – increasing salary costs for reasons unrelated to any organizational needs. Partially as a result, WVDE lists a total of 64 Officials/Administrators in 2011, up from 58 in 2010. Staffing charts indicate that the increase of six such positions included an additional five Assistant Directors and one Director.41
Span of Control That leads to the fundamental issue that seems to drive WVDE’s comparative size: its number of silos and the resulting ratio of higher-level positions to those whom these officials oversee. Successful organizations in both the public and private sectors have long recognized the importance of maintaining a proper balance of supervisory and frontline personnel. The ratio of employees to supervisors – or “span of control” – is the measurement commonly used to assess this distribution of resources. There is no one formula for the ideal span of control for an organization. In fact, the opinion of organizational design experts has changed over time. Early in the 20th century, there was a consensus that six-to-one was an optimal ratio of frontline workers to managers. Today, that number is usually placed at ten- or fifteen-to-one, based on trends toward flattening organizational structures and using improved technology.42
WVDE argues that its staff responsibilities include oversight of local and regional programs and grants, and sometimes staff, and that while its personnel supervise relatively few other individuals these small units are given a wide range of programs to oversee (an alternative to “span of control” that departmental officials termed “span of authority”). This is not an unusual circumstance, however, but is true in most of the same ways of the other state education departments examined. While it is worth considering in making decisions about staffing and supervision, it does not alter the fact that WVDE is divided into numerous offices that could be combined for more efficient and effective operations. A review of WVDE’s span of control highlights the need for a comprehensive re-thinking of the WVDE organizational structure. WVDE’s span of control in many offices is well below

29 www.public-works.org
commonly accepted standards. Table 10: Examples of WVDE Span of Control, below, highlights some examples.
Table 10: Examples of WVDE Span of Control
Executive Director
Assistant Directors
Professional Staff
Support/ Associate Staff
Office of Healthy Schools 1 1 4 3
Office of School Improvement 1 2 6 2
Office of School Facilities 1 4 0.5
Office of School Transportation 1 5 0.5 Office of Assessment and
Accountability 1 9 4.5
Office of Research 1 2 6 1.5
Office of Title I 1 7 1 Office of Adult Education and
Workforce Development 1 2 5 5
Office of Career & Technical Innovation 1 1 2
• Office of Healthy Schools: four professional staff (Coordinators) with an Executive Director and Assistant Director resulting in 1:1 ratio of Executive Director to Assistant Director, 1:4 ratio of Assistant Director to Professional Staff.
• Office of School Improvement: six professional staff (Coordinators and
Teacher/Coach) with an Executive Director and two Assistant Directors resulting in 1:2 ratio of Executive Director to Assistant Directors, 2:4 ratio (or 1:2) of Assistant Directors to Professional Staff.
• Office of School Facilities: four professional staff with an Executive Director resulting
in 1:4 ratio of Director to Professional Staff. • Office of School Transportation: five professional staff with an Executive Director
resulting in 1:5 ratio of Director to Professional Staff.
• Office of Assessment and Accountability: nine professional staff (Coordinators) with one Executive Director and two Assistant Directors resulting in 1:2 ratio of Executive Director to Assistant Director, 2:9 ratio (or 1:4.5) of Assistant Director to Professional Staff.
• Office of Research: six professional staff with an Executive Director and two Assistant
Directors resulting in 1:2 ratio of Executive Director to Assistant Directors, 2:6 ratio (or 1:3) of Assistant Director to Professional Staff.
• Office of Title I: one Executive Director and seven Professional Staff resulting in 1:7 ratio of Executive Director to Professional Staff.

30 www.public-works.org
• Office of Adult Education and Workforce Development: one Executive Director, two
Assistant Directors and five Professional Staff resulting in 1:2 ratio of Executive Director to Assistant Directors, 2:5 ratio (or 1:2.5) of Assistant Directors to Professional Staff.
• Office of Career & Technical Innovation: one Executive Director, one Professional Staff resulting in 1:1 ratio of Executive Director to Professional Staff.
Recommendations The West Virginia Department of Education should:
1. Rethink the organization of the WVDE to organize around major goals or functions, not funding sources. Again, Superintendent Marple has stated her commitment to take a fresh look at the Department and make needed changes to ensure it is positioned to support the counties. We encourage her to be bold and creative and to look at examples of best practices around the country. A strategic planning effort should be launched that includes key stakeholders outside of the department in order to ensure adequate input from “customers” throughout the system – school districts, RESAs, parents, and advocates. As noted above, Ohio is an example of a recently reorganized department that streamlined its reporting structure into two divisions and four Center of Excellence – Curriculum and Assessment, Teaching Profession, Accountability and Continuous Improvement, and Student Support and Education Options.43
2. Increase span of control to not less than 1:10 ratios of supervisors to subordinates, thus reducing the number of offices within the department. WVDE is most out of step in the area of management positions compared to its neighboring states. Reducing the number of offices and managers will have the added benefit of consolidating functions and reducing the “silos” that result in overlap and duplication of effort. In addition, a rethinking of titles, positions, job descriptions and responsibilities will require a comprehensive effort to lay a foundation for change.
3. Reduce the number of positions in the department. The number of staff overseeing
the K-12 system in general (besides management and supervisors noted above) is well above comparisons to surrounding states. As shown above, WVDE has ratios of staff to number of students and number of schools that is significantly lower than surrounding states. And as noted, WVDE has been successful in recent years in beginning to reduce overall staff counts through attrition; this commendable trend should be continued and reinforced.
4. Consider expanding WVDE’s working with the RESAs as a vehicle for improved assistance to school districts. As discussed in more detail in Section 1.6, the department should use RESA services more strategically and ensure they have the authority to work with low-performing counties on behalf of the department as needed.
5. Implement additional cross-department initiatives to reduce duplication of effort
and ensure funds are used as efficiently as possible. As WVDE senior staff report, the Superintendent has challenged supervisors to work more collaboratively. This is a

31 www.public-works.org
critical first step for immediate improvement in the department’s approach to the counties, however, it must be followed with more structural changes in the department.
6. Implement additional initiatives to partner with school districts and RESAs in
order to provide the technical assistance and support districts need. Districts know what they need. Developing a strong culture of support and technical assistance in WVDE will go a long way in having districts view the department as a partner in educational success.
Estimated Savings WVDE can achieve the changes in organizational structure through a plan to allow some management positions to be eliminated when they become vacant. With an average of about 95 HR transactions per year, 40 of which are new hires, the Department should begin a three- to five-year process of reducing management positions and reorganizing offices. Savings can be achieved as units are combined and fewer managers are needed. Personnel savings will depend on WVDE’s ability to make critical decisions when positions become vacant.
Position Average
Annual Base Salary
Average Salary with
Benefits Total Salary
Plus Benefits Reduce 10 of 53 Positions
Reduce Staff by 20%***
Reduce Assistant Superintendents, Executive
Directors, Assistant Directors (53 positions)
$89,069* $118,097 $6.2 million $1.2 million
Reduce number of staff $61,289** $81,514 $16.4 million $3.3 million
Estimated Total $4.5 million
*This average salary is calculated from actual position salaries provided by WVDE. Fringe benefits, per WVDE, are approximately 33 percent. **As noted above, WVDE provided salary information that indicates a total department salary of $20,997,280 without benefits for the 319 managers and staff responsible for oversight of the K-12 system. ***Calculation is based on 267 (319-53) staff positions. Based on a phase-in plan to reduce positions through reorganization and attrition, it is possible for WVDE to save $ 21.2 million over five years.
Five-Year Estimated Savings
Year 1 Year 2 Year 3 Year 4 Year 5 5-Year Total
$3.2 M $4.5 M $4.5 M $4.5 M $4.5 M $21.2 M

32 www.public-works.org
1.2. Facilities
A. Implement Efficiencies in School Building Capital Projects and Management
Background and Findings The West Virginia legislature created the School Building Authority (SBA) in 1989 as a result of the Recht Decision, which found the West Virginia school financing system to be largely unconstitutional and ordered a high-quality education system to be put in place and financed.44
To carry out the equitable funding of capital projects provisions of the Recht Decision, the SBA became the sole state agency to administer state monies for school capital projects.
The Authority primarily determines funding priorities through examination of county, vocational, and WVDE ten-year plans.45
These plans must include details on facility maintenance, major improvements, new facilities, school access and safety, and a repair and a replacement schedule. State Code §18-9D-2 does not allow the SBA to pay for items such as “books, computers or equipment used for instructional purposes; fuel; supplies; routine utility services fees; routine maintenance costs; ordinary course of business improvements; or other items which are customarily considered to result in a current or ordinary course of business operating charge.”
Contracted Building Professionals SBA projects require the use of several types of building professionals such as architects, engineers, construction managers, and clerks of the works, most of which are obtained through contracts with private vendors. Information provided by SBA indicates, however, that these contracted professionals are actually more expensive than in-house staff.46 According to a recent SBA study, the agency spends about six percent of construction costs on contracted building professionals.47 The cost for these professional services if conducted by in-house, state professionals would equal about 5.48 percent of construction costs.48
Shared Responsibilities Current West Virginia Code defining the responsibilities of the SBA and WVDE related to facilities management creates an overlap in the system that makes the roles and responsibilities of each agency at best confusing. For example:
• §18-9D-2 of the West Virginia Code mandates that the SBA require facility plans. The Code in §18-9D-16(3)(D)(17)(ii)(IX)(4)(C)(c) requires the WVDE to inspect schools, at least annually, to ensure that the plans meet the SBA’s requirements. Afterward, the WVDE must report its findings back to the SBA.49
• Both WVDE and the SBA have a role in HVAC maintenance. The WVDE provides job descriptions, employment tests, and back-up training for school HVAC technicians.50 But, SBA ensures facility heating, ventilation, and air conditioning systems work properly.51 The SBA pays for HVAC maintenance contracts for two years after a school building is completed.52 After these two years, the Office of Facilities in the WVDE becomes responsible for ensuring that county employees can maintain the HVAC systems.53

33 www.public-works.org
• According to §18-9E-5(a) of the West Virginia Code, the WVDE, not the SBA, must
require counties to investigate indoor air quality problems and follow a correction plan. The WVDE can also restrict county funding to ensure acceptable indoor air quality.54 But, each remediation plan must be reported to the SBA in the county’s ten-year plan.55
• West Virginia Code §18-5-10 allows the State Board of Education to require that all county boards submit all plans and specifications for State Board approval. The Code gives the SBA no explicit authority over these specifications even though SBA funds are used for the plans. In addition the plans become the basis for SBA-financed projects.
• The SBA has no responsibility to pursue energy saving technology though the Authority
regularly pursues bids for school electricity, oil, natural gas, and coal equipment and distribution systems.56 While counties have little expertise in this field, the West Virginia Code places ultimate authority with them for energy management contracts (without any involvement of the SBA or WVDE).57 The WVDE (without legislative authority) occasionally uses its staff in the Office of School Facilities to encourage counties to enter into energy management contracts.58
The only mandated functions of the Office of School Facilities are for HVAC-related responsibilities described above and for annual on-site inspections.59 The Office, located in the WVDE Division of Student Support Services, employs three HVAC technicians, one HVAC maintenance technician, one mechanical engineer, one Executive Director, and one Secretary.60
Energy Savings West Virginia counties spend county money to pay for energy expenses. The state allows the counties to enter into Energy Savings Performance Contracts (ESPC) to reduce energy costs in school facilities. An ESPC is an agreement between a county and an energy service company that identifies ways for the county to save energy money. The contract identifies projects that can save money, arranges financing for projects, and guarantees that the improvements will pay for themselves through energy savings. When a project is paid for, the savings then accrue to the county. Of the 55 West Virginia counties, about twelve have had contractors investigate the financial benefits of energy performance contracts for their schools.61
As identified by MGT in the Harrison County review, an Energy Specialist monitors HVAC Computer Control Management Systems, reviews bills for spikes and billing errors, and educates facilities staff so they can support the program. Since hiring the specialist position in October 2009, the county has avoided significant energy costs.
WVDE Technology Office Approval The SBA is not required to consider the Department of Education’s recommendations regarding technology components vital for student learning beyond the input supplied by the three SBA Board members who are also State Board of Education members.62 In the past, the SBA has consulted the Office of Facilities Management on technology issues such as wiring and placement of equipment, but this practice ceased about two years ago.63

34 www.public-works.org
Facility Financing The SBA funds projects through legislative appropriations and bond proceeds. Entities receiving SBA grants (such as counties, WVDE, and vocational schools) must provide at least a 25 percent match to the SBA funds (except for emergency projects which currently require at least a two percent match).64
In fact, West Virginia was the first state to take advantage of tax-credit bonds (Qualified School Construction Bonds) available through the American Recovery and Reinvestment Act in 2009 and 2010. Selling these bonds enabled SBA to provide more funds for school construction at a much lower cost.
The 25 percent match comes from either bond sales approved by county referenda and/or operating budgets.65 Some counties pay their share by borrowing all of the money upfront (after authorization from a locally-approved referendum).66 Others have available cash flow to pay for capital projects on a pay-as-you-go basis.67
The West Virginia Code allows the SBA to enter into lease-purchase agreements with counties for facilities and equipment.68 However, to date, the SBA has not used lease-purchasing for any projects.69
The Code does not allow the SBA to finance instructional computers and related equipment.70
This can become an issue if counties have inadequate resources, resulting in new buildings and renovations not meeting the State Board’s goal of equal access to technology for every West Virginia student.
Recommendations
1. Hire state employees in SBA to replace some contracted professional consultants, such as architects and engineers, who are basically used full time because of the amount of ongoing projects conducted by the SBA.
2. Amend Section 18 of the West Virginia Code so that the staff and responsibilities
of the Office of Facilities become the responsibility of the SBA.
3. Establish SBA as the single point of responsibility and authority to address energy issues. This can be done by:
• Amending Section 18 of the West Virginia Code to place responsibility with the SBA for working with counties to reduce all school facilities’ energy usage. All counties should be required to explore energy management contracts and enter into them when appropriate.
• Working with counties to use Energy Specialists where appropriate to
reduce energy consumption and create a new classification for Energy Specialists in the code. Job duties should include developing education and incentive programs for staff and students and to allow schools to use saved energy dollars for non-energy uses.
4. Eliminate SBA expenditure for two-year HVAC maintenance contracts and the cost
incurred by WVDE for backing up current HVAC technicians. This recommendation

35 www.public-works.org
should be implemented in conjunction with the recommendations for testing and hiring of certified technicians discussed in Section 1.3 B. HVAC technician job specifications and testing must be updated so that counties and schools hire only certified HVAC technicians who are able to maintain the systems without outside help.
5. Develop and streamline written procedures to define roles and responsibilities
and timeframes for action for each agency involved in facilities planning. West Virginia code has both the WVBE/WVDE and SBA requiring various facilities plans from the counties. Procedures should clearly define the SBA as responsible for working with the counties on all facilities planning, construction, renovations, and working with the counties on all facets of facilities management, and require WVDE input before decisions on plans are made. So as not to delay decision-making, timeframes for comments should be clearly defined.
6. Modify code to allow the SBA to use funds for technology equipment. As discussed later in this paper in Section 2.3, the future success of West Virginia’s school children depends on increasing the availability and use of technology. Yet, current code does not permit SBA to fund equipment purchases for new construction or renovations, and counties do not always have sufficient funds to buy equipment. These shortcomings in funding opportunities contributes to the chances that new or renovated construction projects may be completed without sufficient equipment installed to fully utilize the new space. Allowing SBA and the counties to include equipment purchases as part of the “furnishings” of new or renovated construction projects would eliminate this problem.
7. Amend the Code to allow the SBA and counties to use all methods of financing, including lease-purchases, to acquire technology equipment. In addition to allowing equipment purchases as part of new construction or renovations, the SBA and counties should use lease-purchase agreements to acquire needed equipment. As noted in Section 2.3, this is a proven method used by many states to obtain needed equipment without major outlays of cash upfront.
8. Use lease-purchasing agreements so that counties can expedite capital projects. While this option is available to SBA and the counties, it has not been used. SBA should make lease-purchasing part of its analysis when making decisions about projects and funding.
Estimated Savings In the past twenty years, the SBA has spent $35.7 billion on school construction and capital improvements. Annual expenditures vary considerably based on available funding and demand but have never been less than about $102.7 million annually. Of this amount, SBA spent six percent ($6.2 million of the $102.7 million) on contracted professional consultants. If SBA hires 10 in-house professional staff, the cost would be about $5.6 million (5.48 percent of project costs), saving the state and counties $600,000 yearly starting in FY2014. Savings would be less in the first year to allow for start-up costs of $500,000 for offices and equipment for the new employees. On average, the state funds 57 percent of these projects and the counties contribute 43 percent. Using these percentages, savings for this recommendations would accrue to both the state and counties as shown in the Five-Year Estimated Savings chart below.

36 www.public-works.org
Secondly, since Harrison County hired its Energy Specialist, the county has experienced a cost avoidance of approximately $1.1 million which equals a savings of between 4.7 and 28.9 percent of energy costs. In the 2009-2010 academic year, counties spent approximately $60.1 million on facility energy costs.71
If other counties could achieve similar savings as Harrison County, a ten percent savings every year would equal about $6 million in annual savings.
Thirdly, the SBA spends about $360,000 per year on HVAC maintenance contracts. By requiring operating authorities to take responsibility for HVAC systems instead of hiring a contractor, the state will save this $360,000 per year. Assuming that 25 percent of counties can save two percent of their energy expenditures annually by using energy management contracts, counties could save about $300,000 per year after the contracts’ terms are over in about 15 years. While this is a substantial potential savings, it is not included in estimates since the timeframe for savings is beyond the five-year window.
Five-Year Estimated Savings
Year 1 Year 2 Year 3 Year 4 Year 5 5-Year Total
Replace contractors – State savings $57,000 $342,000 $342,000 $342,000 $342,000 $1.4 M
Replace contractors – County savings $43,000 $258,000 $258,000 $258,000 $258,000 $1.1 M
Eliminate 2- Year HVAC contracts $360,000 $360,000 $360,000 $360,000 $360,000 $1.8 M
Hire Energy Specialists $3,000,000 $6,000,000 $6,000,000 $6,000,000 $6,000,000 $27.0
Total Savings (State and County) $3,460,000 $6,960,000 $6,960,000 $6,960,000 $6,960,000 $31.3 M
B. Reassess Cedar Lakes Conference Center Operations
Background and Findings In 1950, residents of Jackson County donated land to the West Virginia Department of Education to serve as an educational retreat. The Board used the land to create camps for student Future Farmers of America (FFA) and Future Homemakers of America (FHA) clubs. Over the next sixty-one years, additional acreage was added to the original parcel along with recreational and lodging facilities to create the Cedar Lakes Conference Center (CLCC). West Virginia statute outlines the purpose of the state’s camp and conference center as follows:
For the purpose of developing competent leadership, developing character, training for useful citizenship, fostering patriotism, and of providing and encouraging the development of organized recreational

37 www.public-works.org
activities for Future Farmers of America and Future Homemakers of America members, and other youth and adult groups, a camp and conference center is hereby established.72
Currently, CLCC has grown to a 300-acre complex serving as meeting and lodging space for a variety of public and private sector groups.73 CLCC hosts an estimated 500,000 people each year74 ranging from recreation travelers to meeting, training, and conference participants. CLCC has meeting space to accommodate groups up to 400.75 Lodging offerings including both hotel rooms and dormitories, with a capacity of 606 beds.76
CLCC offers cafeteria-style breakfast, lunch, and dinner in its Lakeview Dining Hall. The Center also provides banquet and reception catering as well as picnic meals.77
CLCC is also home to the Mountain State Art & Craft Fair, an annual event that brings the region’s best artisans and craftspeople to Ripley. According to an economic impact study conducted in 2008 by Marshall University’s Center for Business and Economic Research, the Fair brings over $600,000 to the local economy attracting visitors from over 45 states and Canada.78
Budget In recent years, the CLCC has generated approximately $1.6-1.8 million in revenue each year. The Center’s operational revenues come primarily from fees charged for meeting space, lodging and meals. The West Virginia legislature supplements CLCC’s income each year with a State appropriation of approximately $1 million. Without the supplemental support from the legislature, CLCC would operate at a loss each year. See Table 11: Cedar Lakes Revenues, Expenditures, Net Gain/Loss and Table 11A: Cedar Lakes Revenue-Expenditure Comparison for a comparison of CLCC revenues and expenditures.
Table 11: Cedar Lakes Revenues, Expenditures, Net Gain/Loss
Generated Revenue
% of Total Revenue
State Appropriated
Total Revenue
Total Expenditures
Net Gain/ Loss
% Gain/ Loss
FY05 $1,653,199 62.8 $979,790 $2,632,989 $2,698,268 $(65,279) (2.5)
FY06 $1,723,711 63.4 $996,516 $2,720,227 $2,711,348 $8,879 0.33
FY07 $1,829,960 64.0 $3,029,257a $4,859,217a $4,840,466 $18,751 0.66b
FY08 $1,730,946 62.3 $1,048,938 $2,779,884 $2,711,063 $68,821 2.5
FY09 $1,773,593 63.0 $1,042,705 $2,816,298 $2,716,740 $99,558 3.5
FY10 $1,753,392 62.7 $1,042,721 $2,796,113 $2,749,258 $46,855 1.7
FY11 $1,667,563 61.2 $1,056,293 $2,723,856 $2,688,940 $34,916 1.3 a – Includes $2M State appropriation for debt pay-off for Holt Lodge. b – Excludes $2M State appropriation for debt pay-off for Holt Lodge.
Source: West Virginia Department of Education

38 www.public-works.org
Table 11A: Cedar Lakes Revenue-Expenditure Comparison
Generated Revenue
Total Expenditures
Annual Operational
Shortfall
FY05 $1,653,199 $2,698,268 $(1,045,069)
FY06 $1,723,711 $2,711,348 $(987,637)
FY07 $1,829,960 $2,840,466a $(1,010,506)a
FY08 $1,730,946 $2,711,063 $(980,117)
FY09 $1,773,593 $2,716,740 $(943,147)
FY10 $1,753,392 $2,749,258 $(995,866) The primary driver in CLCC’s budget is personnel costs. In recent years, personnel costs have accounted for approximately 70 percent of CLCC’s total expenses. See Table 12: Cedar Lakes Personnel Costs for a detailed breakdown of CLCC personnel costs from FY05-11.
Table 12: Cedar Lakes Personnel Costs
Total
Expenditures Unclassified % of Total Expenditures Personnel % of Total
Expenditures
FY05 $2,698,268 $852,708 31.6 $1,845,560 68.4
FY06 $2,711,348 $901,333 33.2 $1,810,014 66.8
FY07 $2,840,466 $989,855 34.8 $1,850,612 65.2
FY08 $2,711,063 $819,537 30.2 $1,891,526 69.8
FY09 $2,716,740 $728,656 26.8 $1,988,083 73.2
FY10 $2,749,258 $784,269 28.5 $1,964,989 71.5
FY11 $2,688,940 $775,700 28.8 $1,913,240 71.2
Personnel Costs West Virginia Code §18A-4-18(b) requires that all West Virginia Department of Education service personnel receive a salary that is “at least equal to the salary paid to comparable personnel employed by the county board [of education] in the county in which their principal place of employment is located.”79
This statutory requirement was intended to create salary parity for educational service personnel whether employed by local or state school boards. This provision applies to CLCC service personnel even though they are employed in the hospitality industry, not in a school setting. Therefore, the salary of CLCC’s service personnel, such as cooks and custodians, must be set according to the Jackson County School Service Personnel Salary Schedule.
These salary levels are significantly higher than those paid by CLCC’s private competitors. For example, custodians and cooks in the Jackson County School System are currently paid at a

39 www.public-works.org
salary range of $2,073 to $3,364 per month.80 According to the most recent Bureau of Labor Statistics, the average monthly salary for custodians in West Virginia is $1,803 ($1,576 for housekeepers) and $1,669 for cafeteria cooks.81
This means that the Jackson County district rates, on average, are anywhere from 14.9 to 113.5 percent more than comparable private sector wages for such services. See Table 13: Jackson County School Service Personnel Monthly Wage Comparison below for the full wage comparison for these positions.
Table 13: Jackson County School Service Personnel Monthly Wage Comparison
Jackson County School District
West Virginia Average Wage*
% Difference
Custodian $2,073 - $3,364 $1,803 14.9 – 86.6
Housekeeper $2,073 - $3,364 $1,576 31.5 – 113.5
Cook-Cafeteria $2,073 - $3,364 $1,669 24.2 – 101.6
*According to most recently available Bureau of Labor Statistics data.
Based on the Jackson County rates, Cedar Lakes is paying significantly more than their private sector competition for virtually every position. Currently, CLCC is paying wages from 45 to 50 percent above average West Virginia rates for its frontline workers. See Table 14: Cedar Lakes Service Personnel Monthly Wage Comparison for examples of these wage discrepancies.82
Table 14: Cedar Lakes Service Personnel Monthly Wage Comparison
Cedar Lakes
Conference Center West Virginia
Average Wagea %
Difference
Grounds Maintenance $2,771 $1,817 52.5
Housekeeper $2,290 $1,576 45.3
Cook-Cafeteria $2,505 $1,669 50.1
*According to most recently available Bureau of Labor Statistics data.
These wage rates do not include the considerable cost that CLCC also pays for employee benefits, an additional 37 percent.83 Marshall’s 2008 Economic Impact Study found that CLCC paid disproportionately higher benefits costs compared to its private sector competition whose benefits fell in the 28 to 30 percent range.84
CLCC management has described these challenges to the Board by noting that “[i]t is extremely difficult to operate the Center as a business. The constraints associated with state government procedures and policies sometimes limit management’s ability to function effectively. This is

40 www.public-works.org
particularly true when comparing Cedar Lakes’ labor costs with other hospitality related businesses.”85
Recommendations Consider alternatives for Cedar Lakes Conference Center management and operations to create personnel savings. If Cedar Lakes Conference Center is expected to operate as a successful business, then it must be able to function in a market economy. Certainly, Cedar Lakes should pay a competitive wage to all of its employees. But, it will never break even if it is required to incur personnel costs often double that of its competitors. In FY11, personnel costs made up 71.2 percent of CLCC’s total expenditures, the largest budget driver for the Center by far. Several options may be considered to address this issue:
1. Move Cedar Lakes Conference Center out of WVDE to a department with the resources, expertise and mission to support a facilities operations. CLCC has been administered by the WVDE since the original gift of the land from the residents of Jackson County to the Department in 1950. Recognizing the intent for the property to be used as an educational retreat, the legislature designated the WVDE Division of Vocational Education as the operator of the Center. While the current management of CLCC has done a tremendous job of managing the Center’s challenging budget constraints and ongoing infrastructural improvement needs, the Department of Education is not the State’s expert in tourism, cultural services, hospitality, or facilities management.
CLCC leadership has recognized this as well and pointed out to the State Board that “[i]t is challenging to fit the operation of the Center into the mission and goals of the State Board. It is difficult to ascertain the needs and priorities Cedar Lakes has or should have within the Department of Education.”86
The State Board has also considered whether the Department should continue to administer CLCC. In 2008, several Board members questioned how CLCC fit into the Department’s mission.
If the State chooses to continue public sector operation of CLCC, it should be administered by a department with the appropriate resources, expertise and mission to support such an endeavor, such as the Department of Administration, or even the Department of Education and the Arts. Moving CLCC out of the Department of Education would have the added benefit of removing it from the legislative requirement tying wage levels to those in county school systems.
2. Exempt Cedar Lakes from WVDE’s statutory requirement to match county service
personnel wage levels. It should be noted that any CLCC salary changes would only apply to prospective hires, not current CLCC employees. Recognizing this, it would be several years before the Center would see full budget savings. Even so, with a five year phase-in of savings (with a 20 percent increase each year), Cedar Lakes could save $353,910 over five years.
41 www.public-works.org
Tying the wage rate of service personnel at a hospitality-based conference center that functions year-round to those of school service personnel working a ten-month year (typically 200 to 210 day) in an educational setting is a flawed model. If Cedar Lakes continues to be administered by WVDE, lawmakers should exempt the Center from the provisions of §18A-4-18 which were intended to create salary parity between county and state employees in educational settings. If CLCC remains within the Department of Education, then wage rates would still remain relatively high since WVDE pays higher wages than other departments in State government. If CLCC is administered by another executive branch agency, then wages would be more in line with market rates. Ideally, policymakers would allow CLCC the flexibility it needs to pay competitive wages and bring its budget into line with other comparable private sector operations. If Cedar Lakes’ current payroll reflected average West Virginia wage levels, it would save $117,970 per year.
Five-Year Estimated Savings
Year 1 Year 2 Year 3 Year 4 Year 5 5-Year Total
$23,594 $47,188 $70,782 $94,376 $117,970 $353,910
It should be noted that the State has considered privatization options for CLCC in the past. The 2008 Economic Impact Study assessed opportunities to privatize some elements of Center operations as well as full privatization. While the study recommended continued consideration of outsourcing some CLCC functions, it concluded that full privatization was not likely because of the Center’s on-going revenue shortfalls making it a less desirable investment.
3. Continue to encourage State departments, particularly educational agencies, to use Cedar Lakes Conference Center facilities. Last year, it is estimated that the West Virginia Department of Education spent over $1.9 million on meeting space, lodging and food for conferences and training.87
In the region, West Virginia government agencies and local educational entities spend tens of millions each year to support meeting and training costs. Unfortunately, little of this business is given to CLCC.
This is certainly not a new issue. There have been long-standing observations of low usage of the CLCC facilities by WVDE and other State agencies. In the past, WVDE leadership (Superintendent David Stewart in 2003-04) was unwilling to require the Department to use the CLCC facilities for meetings until much-needed repairs were completed and the facilities were updated. Since that time, CLCC has made several infrastructure improvements, including new meeting facilities that will be available this fall. The Center is located only 40 miles outside of Charleston, definitely close enough for several State agency meetings and

42 www.public-works.org
trainings. The greatest opportunities for use of CLCC, beyond educational purposes, will require a code change.88
At present, WVDE uses CLCC free of charge.89 So, additional Department use of the facility would not create additional revenue for the Center, but rather produce savings for the WVDE offices currently using other private meeting space. While a formal calculation of potential WVDE savings has not been completed, CLCC leadership has estimated that “several thousands to millions could be saved in the cost of paying for meeting space and a reduction in the cost of meals and refreshments, etc.”90
Recently, the Superintendent’s encouragement for groups within the WVDE to use CLCC facilities has produced results. Last summer, the State Science Coordinator held the first West Virginia State Science Camp at CLCC and plans to hold another camp next year. Also, the Foreign Language Coordinator is planning a similar Foreign Language Camp for students in the upcoming year.91
Of course, other State departments and local educational entities can also use the CLCC facilities for much less than comparable private meeting and conference space costs. This would save money for those agencies while also increasing CLCC’s revenues. Certainly, the CLCC facilities are still not adequate to support all meeting and conference needs. The Center can only accommodate meetings with a maximum of 400 attendees, and lodging offerings still need to be expanded and updated. Facility improvements must continue if CLCC wants to make the case for department business. But, if CLCC could support just ten percent of the Department’s meetings and training venue needs that would mean almost $190,000 in annual spending could be kept in-house at the Department rather than being outsourced. Furthermore, every dollar CLCC brings in from additional business with other State agencies and local education entities has a dual benefit. These dollars not only grow CLCC’s annual revenue, but create savings for the agencies currently using more expensive private venues. In tight budget times, the State Board and Superintendent should take every opportunity to encourage use of Cedar Lakes by these groups.
Five-Year Estimated Savings to WVDE
Year 1 Year 2 Year 3 Year 4 Year 5 5-Year Total
$190,000 $190,000 $190,000 $190,000 $190,000 $950,000
4. Increase Cedar Lakes advertising and promotion efforts. CLCC must not only grow its client base within government, but also expand its outreach to other groups through increased advertising and promotion efforts.

43 www.public-works.org
The low occupancy and usage rates for Cedar Lakes’ lodging and meeting facilities show that the Center has ample availability for more customers. In 2010, the average occupancy rate across all room types was 21.05 percent. The average usage rate across all meeting facilities was 32.67 percent.92
The CLCC Economic Impact Study conducted by Marshall University in 2008 repeatedly underscored the need for Cedar Lakes to expand its marketing efforts by noting:
A surprising constraint on the expansion and success of the CLCC is the lack of awareness by potential visitors of the range of services that are offered. Before you can expand any business, potential customers must know you exist. The targeted marketplace does not have an accurate or complete awareness that the CLCC is more than just the Art & Craft Fair and a place for band or church camp retreats… A facility which is seen as catering to that type of clientele will not appear attractive to professional organizations. 93
Marshall’s Economic Impact Study went on to recommend specifically that Cedar Lakes develop an extensive marketing campaign including mass media advertising (billboards, brochures, television and print media), with targeted outreach to groups likely to use the facility with its expanded and improved amenities. The report also noted that CLCC should explore opportunities to coordinate efforts with the West Virginia Division of Tourism and the West Virginia Department of Commerce to utilize available marketing resources afforded to other attractions in the state. 94
In 2004, the CLCC marketing position was eliminated in an effort to reduce operational costs. Historically, Cedar Lakes has conducted minimal advertising and promotional efforts. This is partially attributable to an agreement to avoid competition with a hotel and meeting facility in the Cedar Lakes area. Such agreements diminish CLCC’s marketing efforts and put the Center at an unfair disadvantage when trying to operate a profitable enterprise. The Department and Cedar Lakes management should reevaluate these current restrictions on marketing and pursue an aggressive promotion campaign to bring in more business to the Conference Center. If a focused marketing effort could increase CLCC’s revenues by just five percent that would mean an additional $90,000 annually.
Five-Year Estimated Revenue
Year 1 Year 2 Year 3 Year 4 Year 5 5-Year Total
$90,000 $90,000 $90,000 $90,000 $90,000 $450,000
5. Continue to review Cedar Lakes’ lodging and conference meeting fees and remove any barriers preventing CLCC from charging market rates. West Virginia

44 www.public-works.org
Code allows the Board of Education to establish for CLCC “such rates, fees, rentals and other charges for the use of the buildings and recreational facilities as it determines necessary and advisable.”95
As with any business enterprise, the determination of such customer fees and charges is built upon several factors. At a minimum, fees and charges must be equal to or more than the cost of providing the services. Beyond that, businesses should conduct an assessment of both the market supply and demand as well as the rates of competitors to determine an optimum rate for its services. If the cost of doing business exceeds what the market will bear in prices, then continuation of the enterprise should be reconsidered. As noted earlier, CLCC generates approximately $1.6-1.8 million in revenue each year primarily from fees charged for meeting space, lodging and meals. The West Virginia legislature supplements CLCC’s income annually with a State appropriation of approximately $1 million. Without the supplemental support from the legislature, CLCC would operate at a loss each year. Marshall University’s 2008 Economic Impact Study also suggested that CLCC consider a flat percentage charge to all customers to establish a capital improvement fund for needed infrastructural improvements at the Center.96
CLCC management explored charging additional facility usage fees, but decided against it when they observed the state 4-H Camp Jackson Mills pursue a similar option three years ago and experience a 15 percent decrease in usage.
While charges need to be high enough to cover operational costs, they also need to be low enough to attract customers. In the past, CLCC has been strongly discouraged from charging rates that create competition with a hotel and meeting facility in the Cedar Lakes area. Again, such agreements undermine the market viability of the Conference Center. Currently, Cedar Lakes conducts an annual market analysis of fees charged by comparable meeting and lodging facilities, but has made no changes to their current rates. State leaders should review such analyses and allow CLCC to charge a fair market rate without arbitrary limitations set by a single private competitor.
6. Increase private donations and support for Cedar Lakes. Given CLCC’s limited revenues and fixed budget costs, the Center should actively pursue additional external resources such as private donations. West Virginia Code §18-2-16 authorizes the Board of Education to receive and use gifts and donations of “money, land, buildings, materials, equipment, supplies, and labor, either from public or private sources” for the administration of Cedar Lakes.97
Additionally, a Cedar Lakes Foundation has also been created to receive private donations to support the work of CLCC.
A few years ago, CLCC leadership made a concerted effort to solicit donations from several private and corporate sources to support the Center. Several commitments were made; some as substantial as $1 million.98 Before finalizing their contributions, several donors asked for assurances that the State Board would continue to support and make improvements at Cedar Lakes. Unfortunately, the Board could not reach

45 www.public-works.org
consensus to endorse Cedar Lakes for the long term, so the private donations commitments were withdrawn. If WVDE (or the State) plans to continue to operate CLCC, then it should provide an official endorsement stating that it will support Cedar Lakes' long-term operations to encourage private donations.
Estimated Savings
Five-Year Estimated Savings/Additional Revenue
Year 1 Year 2 Year 3 Year 4 Year 5 5-Year Total
$303,594 $327,188 $350,782 $374,376 $397,970 $1,753,910
1.3. Human Resources
A. Consider Integration of Human Resources IT Systems
Background and Findings The WVDE, RESAs, and counties all operate independent Human Resources (HR) systems that are also independent from the state government HR system.99
This means that taxpayer money goes into purchasing, maintaining, and replacing at least 63 HR systems for the public school system in West Virginia even though the functions of each system are compatible – if not identical – to each other. WVDE and the counties use the West Virginia Education Information System (WVEIS) – a system that users consider an excellent system for tracking student data. It is not, however, considered sufficient for supporting some management and operations, including human resources, and counties have implemented their own systems to make up for the WVEIS shortcomings. These county systems are not integrated and often use a simple Excel spreadsheet which is not robust enough to adequately support functions.
The state is currently contracting with a private vendor to create a state-of-the-art Enterprise Resource Planning (ERP) system to integrate 118 various information and processing systems in state government.100 The ERP will update and integrate the state HR, financial, and procurement systems.101 Once completed, the new OASIS system will allow all state systems to “talk” to each other enabling quicker processing and eliminating data input duplication.102
Currently the WVDE uses the state’s financial and procurement systems but not its HR system. By participating in the ERP, WVDE’s HR system will be integrated with its financial and procurement systems and, like the state’s systems, will result in efficiencies among the three system components. The new state system will cost approximately $197 million with an ROI in about eight years.103 It is expected to save the state about $125 million in years nine through nineteen in avoided maintenance and replacement costs for the state’s individual 118 legacy systems.104 The state does not plan any employee layoffs or attrition as a result of the project.105

46 www.public-works.org
Plans and cost estimates for the ERP system required almost 12 months of work that included hundreds of meetings, culminating in 12,310 system requirements.106 OASIS officials indicate that the system could accommodate all of the education system requirements and that a thoughtful planning initiative to develop the system would take several months of dedicated OASIS staff time.107 Public school information system integration with OASIS could begin as early as January 1, 2014, after the state’s financial and HR information integration is complete.108
Recommendations
Conduct a thorough system analysis, including cost and ROI estimates, and develop plans to integrate the education HR systems in ERP. It is expected that a thorough analysis, including additional cost and ROI estimates, will show comparable savings for the education system as is being achieved in the ERP system for the general government. Because the state HR ERP module planning has already begun, including the selection of an ERP vendor, it is not possible to include WVDE HR at this time without causing a delay to the current project; however, beginning planning now will be more cost-effective than delaying inclusion of WVDE too far into the future. This approach is considered more effective (rather than upgrading WVEIS) because it will eventually tie WVDE into the state system and improve management planning and transparency.
Estimated Savings
Exact savings cannot be determined at this time without additional analysis. The WVDE and counties collectively could experience savings similar to those the state expects from its ERP implementation – approximately 63 percent of HR system cost in years nine through nineteen after implementation. In the short term, one or two additional OASIS employees will be needed to complete the recommended analysis.
B. Update District Support Personnel Hiring Practices
Background and Findings
Current County Employment Testing Practices West Virginia Code §18A-4-8e(a) requires the State Board of Education to develop and make available competency tests for all personnel who apply for the approximately 14,000 county service personnel positions. To this end, the WVDE provides 35 tests covering 59 classifications out of a total of 86 classes.109 Four classes (bus operator, LPN, sanitation plant operator, and truck driver) require a license or permit rather than a passing test score.110 (Note: a bus operator must pass a written and practical test administered by the county and the WVDE Office of School Transportation.)111
Currently, both WVDE and the counties have a hand in testing potential personnel. WVDE’s Division of Technical and Adult Education staff develops tests with written and performance sections, provides testing protocol instructions to each county, and maintains rosters of test-

47 www.public-works.org
takers and whether they passed or failed a test.112 The counties advertise the time and location of exams and any training for tests, proctor and grade the tests, and report pass/fail scores to each applicant and the WVDE.113
Counties must use a WVDE test if one is available. Otherwise, each county has complete control over several aspects of testing process:
• If the state does not provide a test for a classification, the county can develop its own exam.114 There is no state rule requiring that county tests not discriminate against protected classes or that the tests measure an applicant’s readiness for a position.115
• The West Virginia Code §18A-4-8e requires that a county offer at least one day of training to every prospective applicant who wishes to take a job test. Each county develops and teaches its own training materials for each test, including those tests written by the WVDE. According to knowledgeable WVDE staff, these training sessions sometimes use exact test questions to train applicants.
• Each county also decides when training will be given and rescheduled.116
It is reported that some counties have offered to reschedule training sessions so that current employees can attend, but do not always extend this courtesy to non-employees.
• Each county chooses who will administer each test, including practical portions of tests which are usually one-on-one exams.117 The WVDE requires no training for this task and has issued no prohibitions concerning the relationship between tester and test taker.118
Federal Requirements and County Employment Practices Title VII of the Civil Rights Act of 1964, the Americans with Disabilities Act of 1990, and the Age Discrimination in Employment Act of 1967 prohibit employers from using discriminatory employment tests and selection procedures. According to federal Office of Equal Employment Opportunity’s Uniform Guidelines on Employee Selection Procedures, it is the responsibility of employers to ensure that their tests and selection procedures are not discriminatory.119 Neither WVDE nor the counties assess county test data to determine if test questions result in unlawful discrimination based on race, color, sex, national origin, religion, disability, or age (40 or older).120 Neither do they fully validate their tests as required by law.121 Employers must validate the job tests to demonstrate that “the selection procedure is predictive of or significantly correlated with important elements of job performance.” 122 In addition, the law requires “evidence of the validity of a test or other selection procedure by a criterion-related validity study [which] should consist of empirical data demonstrating that the selection procedure is predictive of or significantly correlated with important elements of job performance.”123 WVDE does not gather such empirical data.124
The West Virginia Department of Administration Division of Personnel administers employee hiring for the Executive Branch. According to Michael J. Campbell, Assistant Director of Staffing Services, the Division has chosen to significantly reduce the number of job tests in the past several years because of complex federal laws requiring extensive resources to validate tests. Instead of testing, the Division of Personnel requires third party certification when possible and relies on the strength of applicants’ resumes. When the Division does use exams (in about 35 of 1,000 job classifications versus WVDE’s 59 out of 86 classes), it provides a written script for

48 www.public-works.org
test proctors, offers the exams at least once per month at many different areas in the state, and uses a computer program for its applicant tracking system to assess all test questions. 125
These assessments validate that questions are relevant to job knowledge and skills so as not to discriminate against protected classes.
West Virginia’s Human Resources Procedures Maintenance of statewide HR procedures by the Division of Personnel frees up other agencies to perform their core functions. The state HR procedures accommodates the differences inherent in disparate state agency functions: for instance the Department of Education and the Arts uses many of the same job specifications as the Department of Corrections. When an agency does require a unique position, the Division of Personnel also maintains that job specification and classification. WVDE does not use the state’s HR procedures and system for hiring. Instead, WVDE maintains and administers its own HR system even though many of the state’s and WVDE’s job classes and specifications have generally the same job responsibilities.
Recommendations
1. Amend the West Virginia Code to eliminate the current WVDE and county job applicant and evaluation systems and replace them with the Division of Personnel’s system. Longer term, the combined systems should become part of the new state ERP system. (See related recommendation on human resources IT system above.) Any WVDE unique requirements for hiring can be accommodated by the Division of Personnel, including any special education, experience or knowledge required for a position.
2. Amend Section §18A-4-8e of the West Virginia Code to eliminate the requirement
that counties provide at least one day’s training before administering a job test.
Estimated Savings Savings will occur when county and WVDE employees no longer administer and maintain their own HR systems, including the elimination of current training and testing expenses. Because no entity gathers data concerning the duplicative expenses associated with WVDE and county HR procedures, these savings figures cannot be calculated at this time. Eliminating potential legal liability is also a significant cost avoidance that cannot be determined at this time.
49 www.public-works.org
1.4. Transportation
A. Improve Transportation Systems and Training
Background and Findings In 2009-2010, West Virginia spent almost $239.1 million on student transportation.126 Of this total, salaries and benefits represented 68.7 percent ($164.3 million), vehicle supplies, composed mostly of fuel costs, represented 14.6 percent ($34.9 million), bus replacement equaled 9.3 percent ($22.3 million), and the remaining 7.4 percent ($17.6 million) paid for other items such as insurance, maintenance and equipment.127
The most recent national statistics (2008-09) indicate that West Virginia spends almost 10 percent more per student in transportation costs, $948 per student compared to the national average of $866 per pupil.128
There is no question that the topography of West Virginia is one reason for this expense. There are three issues, however, that should be considered for savings in providing bus services.
Routing Technology Only nine counties in West Virginia use bus routing technology to plan school transportation routes; the majority of counties continue to plan routes manually.129 Yet, counties using bus routing technology are shown to have lower per student transportation costs130
.
• Six of 14 counties in high density areas use routing technology (Wood, Kanawha, Ohio, Berkeley, Hancock, and Cabell). Four of these six counties incur the lowest cost per pupil.
• Of the 15 sparsely populated counties in West Virginia, the two counties using route
technology (Hardy and Randolph) have the second and third lowest per pupil costs.
• Among medium density counties, Mineral County is the only one using routing technology. Its expenses per mile are less than six of the other ten medium density counties.
• No low density county in the state uses route technology systems.
Bus routing technology can save transportation costs by computing the shortest routes to reduce equipment, fuel, and driver expenses. The technology also reduces the number of administrative staff needed to produce routes, answer routing questions, and eliminates the need to maintain paper files. West Virginia Code requires that counties annually enter each student’s transit time into WVEIS.131 Bus route technology allows counties to enter student data information once, then automatically updates information when changes made. According to the Route Manager of Wood County, its routing system produced a 33 percent office staff reduction and reduced the number of bus runs from 102 to 92.132
Some routing software can also: track buses so that officials know the exact location of a bus in case of emergency; track the amount of time trips take to compare to standards set by the

50 www.public-works.org
software calculations; and provide the added advantage of locating student residences even if a home address is not available.133
Driver Training The time and cost involved in training an applicant to become a bus driver is extensive because counties use current drivers to oversee the written and performance tests and pay drivers overtime for training and conducting the testing. In addition, there is sometimes a delay in training drivers of as much as six months because trainers hold classes in addition to regular duties. 134
To expedite driver training and testing, RESAs 1 and 7 recently conducted a pilot bus driver training program. According to the Executive Director at RESA 7, the pilot reduced the training and testing time from four to six months to four to six weeks and reduced training and testing costs by 20 percent without sacrificing the quality of training provided.135
Equipment and Fuel Purchases The WVDE Office of School Transportation (with input from the counties) prepares, advertises, evaluates, and awards school bus purchasing contracts every year.136 The centrally-awarded contracts ensure that counties purchase similar equipment for a competitive price. 137
This purchasing process pertains to the actual bus itself but not all of the additional equipment required to fully equip buses prior to being put in operation.
All counties buy the same or similar fuel and equipment (such as cameras, automatic chains, and GPS systems) for their buses138. Currently, contracts for these goods are awarded on a county-by-county basis, precluding economies of scale that could be attained through a group purchase or statewide contract.139
Recommendations
1. Purchase one bus routing system for the state and modify the West Virginia Code to require every county to use the system.
2. Expedite the rollout to the entire state of the RESAs bus driver training program
unless a county can demonstrate that its training course is less expensive than that of the RESA.
3. Establish statewide school bus equipment and fuel contracts that are
administered by WVDE’s Office of School Transportation.
Estimated Savings A bus routing system for the entire state will initially cost about $1.9 million, which includes $1.5 million for the software and $375,000 for sufficient licenses for each county to be able to use the software. This initial cost may be reduced by as much as $200,000 if the nine counties currently using routing software systems are compatible with a new state system. Additionally, annual

51 www.public-works.org
licensing and maintenance expenses may be reduced by about $60,000 if the nine counties simply switch funds expended on the current system to the new system. Exact savings associated with a system are difficult to estimate because costs will depend on such variables as the flexibility and performance of the contracted technology and the size and density of each county. However, one vendor has reported that nationally, routing technology has saved clients about three to four percent per year. Using these figures, West Virginia could expect to save about $1 million per year after the second year of operating a new routing system. Over a five-year period, beginning in fiscal year 2013, savings would equal approximately $2.1 million ($4 million in total net savings in years 2014 through 2017 minus the system’s hardware, software, and maintenance costs in FY 2013 of $1.9 million.) Because counties do not gather data on bus driver training expenses, savings for driver training conducted by the RESAs cannot be precisely calculated. As noted previously, RESAs 6 and 7 have saved about 20 percent of the cost of county bus driver training. Transportation-related commodity expenditures for the 2009-2010 school year equaled over $34.9 million.140
Assuming a two percent savings, cooperative purchasing would save the state almost $700,000 per year or $3.5 million over five years.
Five-Year Estimated Savings for Bus Routing System
Year 1 Year 2 Year 3 Year 4 Year 5 5-Year Total
($1,875,000) $1,000,000 $1,000,000 $1,000,000 $1,000,000 $2,125,000
Five-Year Estimated Savings for Cooperative Purchasing
Year 1 Year 2 Year 3 Year 4 Year 5 5-Year Total
$700,000 $700,000 $700,000 $700,000 $700,000 $3,500,00
B. Review Policies Concerning Mid-Day Bus Trips
Background and Findings The cost of student transportation in West Virginia has been a longstanding issue. As noted above there are some actions that WVDE can take to reduce these costs. The policies and procedures surrounding trips other than to and from school, however, also remains an area that needs attention. There is little evidence that sufficient planning and analysis is conducted to enable WVDE and the districts to understand the cost of both curricular and extracurricular trips. Typically, there is no differentiation to cost out trips to and from school as opposed to mid-day trips. MGT also found insufficient analysis in both Harrison and Taylor counties.
52 www.public-works.org
At the request of Public Works, WVDE surveyed counties to gather information on mid-day bus trips and to try to gather cost data for this service. Forty-four counties responded to the survey and indicated:
• Counties reported 23,599 mid-day trips were made last year. • 35 counties pay bus drivers additional compensation for these mid-day trips even when
within the normal work day.
• Few counties that compensate bus drivers for mid-day trips were able to separate out the cost for this additional compensation though it is estimated that this is in the millions of dollars.
• An example of this expense is reported by MGT in its review of Harrison County. MGT
found that additional runs take on average 30 minutes to one hour yet bus drivers receive two hours of extra compensation for each run. On average bus drivers doing the additional mid-day runs are working six to seven hours daily and being compensated for eight to 13 hours.
Recommendations
Modify West Virginia Code and State Board policies to eliminate the requirement for counties to pay additional compensation for bus drivers who do bus runs during regular work hours.
Estimated Savings If 80 percent of other counties (as reported in the WVDE survey) reimburse bus drivers for mid-day trips in ways similar to that found in Harrison County, eliminating this additional compensation can save almost $900,000 per year and $4.4 million over five years.
Mid-Day Bus Runs FY11 Expenditure
Trips reported in survey 23,599 Total hours at two-hour compensation per trip 47,198
Salary cost at average salary of $14/hour $660,772
Salary with benefits $878,826

53 www.public-works.org
Year 1 Year 2 Year 3 Year 4 Year 5 5-Year Total
$878,826 $878,826 $878,826 $878,826 $878,826 $4.4 M
1.5. Ancillary Services
A. Use All Appropriate Local Health Services Available to Reduce Duplication and Costs
Background and Findings West Virginia Code §18-5-22 requires counties to employ “at least one school nurse for every one thousand five hundred kindergarten through seventh grade pupils in net enrollment or major fraction thereof.” The Code allows county boards to contract with a public health department for equivalent services if provided in accordance with a plan approved by the state board. Currently, though not required in statute, West Virginia counties count all students, including pre-kindergarten and high school students when determining the number of school nurses needed to meet the mandated ratio of one school nurse for every 1,500 students.141
Almost half the counties in West Virginia have a school-based health center housed in a public school, some located within walking distance to other public schools.142 These 60 centers do not pay rent or utilities for the school building space they occupy.143 Federally-qualified health centers (FQHC) operate the majority of these centers to serve uninsured and underserved patients on a sliding scale. While most of these centers receive substantial federal funding, they are not public entities. Because West Virginia Code §18-5-22 allows counties to contract only with public health departments for student health care, schools housing these private school-based health centers cannot use the centers’ nurses as school nurses. Instead, counties must hire additional nurses for student health to meet requirements.144
Recommendations
1. Amend West Virginia Code to allow counties to use nurses and other appropriate health professionals in all health care agencies such as FQHCs to serve as school nurses. Counties should have the flexibility to plan for health services in the most efficient way. Some counties may be able to use health centers in place of school nurses, others may need to supplement school nurses with health center professionals when faced with students who have chronic health issues.
2. Amend West Virginia Code to require that these health care centers perform the duties of a school nurse, free of charge, as payment for the use of school facilities.

54 www.public-works.org
Estimated Savings Because all counties currently meet the legislated ratio of students to school nurses, this recommendation will be not require additional expenditures. Assuming that 50 percent of the 60 school-based health centers can assume the role of current school nurses, annual savings would equal about $1.8 million per year ($60,000 in salaries and benefits x 45 nurses = $2.7 million.). Five–year savings would equal approximately $13.5 million.
Five-Year Estimated Savings
Year 1 Year 2 Year 3 Year 4 Year 5 5-Year Total
$1,800,000 $1,800,000 $1,800,000 $1,800,000 $1,800,000 $9,000,000
B. Reorganize Professional Development for Educators
Background and Findings In education, the term “professional development” generally refers to in-service opportunities for educators and other personnel to learn techniques and acquire competencies that can positively affect student achievement. Traditionally, professional development (PD) in the United States has consisted primarily of brief workshops and training sessions offered occasionally during the school year, focused on particular challenges that arise in the classroom.145 More recently, school districts have been encouraged, in part by the federal No Child Left Behind legislation,146
to use more systematic methods for professional development, such as regular, ongoing improvements in content knowledge, peer interaction, instructional groups, and mentoring.
In spite of the billions of dollars (an estimated $9 billion in 2002)147
spent annually for professional development in education, traditional methods, focused on one-shot workshops and minimum requirements for maintaining certification, persist. Moreover, at a time when K-12 education nationally and in most states is being driven by efforts to measurably improve student achievement, PD efforts are rarely linked to end-results.
Research indicates that professional development can have a positive impact on student achievement if it is sustained, current, interactive, connected to school and district goals, content-specific, and data-driven.148
Data collection and research on the effectiveness of particular PD models remains very limited.
Teachers themselves often report having little confidence in the professional development opportunities that are available. According to a recent report from the National Staff Development Council, teachers often find that PD offerings do not meet their individual needs or

55 www.public-works.org
include critical follow-up or the school leadership support needed to implement the strategies covered in sessions. The November 2006 RESA Task Force report rightly found that the “governance structure of the West Virginia professional development system is too diffuse to assume that the entities responsible for professional development are working in a synchronized way to meet state goals for professional development. The professional development system needs to be driven by an agreed upon professional development definition, vision, and standards.” In West Virginia, educators were asked their opinions of professional development offerings as part of a survey in the evaluation of the 2010-11 Master Plan for Statewide Professional Staff Development. Overall, the survey showed that educators were moderately satisfied with the PD offerings in the state. Teachers were asked what impact the PD offerings had on their knowledge, teaching behavior, and attitudes/beliefs in the content area of a course. Survey responses showed that West Virginia teachers thought the courses had the strongest impact on changing their knowledge of the content area and their behavior, but had less influence on their attitudes and beliefs about courses.149
Master Plan for Statewide Professional Staff Development In recent years, West Virginia policymakers have emphasized focusing professional development on clearly established goals. In 1998, the legislature enacted a statute requiring the West Virginia Board of Education to establish annual PD goals so that adequate and appropriate professional staff development is available to ensure high quality teaching in the public schools.150 The Code directs the West Virginia Center for Professional Development to design a “proposed professional staff development program plan” to achieve the Board’s goals.151
Once approved by the Board, this plan becomes the state’s “Master Plan for Professional Staff Development” (hereinafter referred to as the “Master Plan”). This Plan is intended to guide the coordinated delivery of professional staff development programs offered by WVDE, CPD, the RESAs, and the state’s leading teacher preparation institutions.
Legislation requires that each year’s Master Plan must include a strategy for evaluating the effectiveness of the professional staff development programs delivered.152
The 2010-2011 Master Plan was evaluated by the WVDE Division of Curriculum and Instructional Services, Office of Research. The Research Office will again evaluate the 2011-2012 Plan.
It is important to note that the Master Plan and its evaluations are limited in scope to only those professional development activities that relate to the annual PD goals set out by the Board of Education. There are a host of other professional learning opportunities provided throughout West Virginia that are outside the scope of the state goals but provided in response to local needs or legislative mandates. The Master Plan does not provide a catalogue of these PD opportunities. Educators must consult each PD provider to determine the full list of their courses.153
In 2010-2011, 37,062 educators participated in professional development sessions associated with the state’s Master Plan. (It should be noted that these counts do not include participation in professional development offered by individual districts and schools.)154

56 www.public-works.org
In recent years, the state’s Master Plan process has been heavily influenced by West Virginia’s active participation in two nationwide educational improvement efforts -- the Partnership for 21st Century Skills and the Common Core State Standards Initiative. For 2011-2012, the Board of Education established professional development goals aimed at consolidating these two initiatives in key content areas, and moving toward steps tangibly to improve school performance. In addition, the Board of Education reviewed the Master Plan process and requested a review of the professional development plans of each county in early 2011 to evaluate professional development needs statewide. Subsequently, the Board will again review the county professional development plans this fall before the development of next year’s professional development goals.155
West Virginia Professional Staff Development Advisory Council and Regional Councils
To help guide the State Board’s planning and strategy for PD, the legislature also created the West Virginia Professional Staff Development Advisory Council and eight Regional Professional Staff Development Councils. As established in Code §18-2I-1, the purpose of these councils is to “advise and assist the state board with ensuring the coordination and quality of professional staff development programs that address locally identified needs for professional staff development and meet the goals for professional staff development established by the state board.”156
These groups were originally created in 1998 because the legislature found that there was “an inadequate and inefficient delivery of staff development programs for professional education in West Virginia.”157 The Legislature went on to state in their findings that “the creation of a West Virginia Staff Development Advisory Council and regional staff development councils will assure the efficient delivery of high quality staff training programs and will further assure that duplication of efforts will be minimized” and that the councils would “assure that key personnel will be fully aware of identified needs and programmatic services, that all stakeholders will be appropriately involved in planning and implementing programs to meet requisite needs and that high quality staff development programs will be provided to public school educators of West Virginia in the most efficient manner.”158
The Professional Staff Development Advisory Council is currently made up of the following members:
• Secretary of Education and the Arts or designee (who serves as Chair) • Chairpersons of each of the eight regional staff development councils • Coordinators of each of the eight RESA staff development councils • WVDE Assistant Superintendent for the Division of Instructional and Student Services • Chancellor of the Higher Education Policy Commission or designee • Executive Director of the West Virginia Center for Professional Development • Presidents (or designees) of the two professional organizations representing teachers in
the state with the greatest number of teacher members.159

57 www.public-works.org
Additional Professional Development Leadership and Providers in West Virginia There are a plethora of entities and organizations in PD policymaking, planning and delivery in the state, including:
• State Board of Education • State School Superintendent • Secretary of Education and the Arts • Legislative Oversight Commission on Education Accountability (LOCEA) • West Virginia Professional Staff Development Advisory Council • West Virginia Commission for Professional Teaching Standards • WVDE Division of Instructional and Student Services • West Virginia Center for Professional Development • Higher Education Institutions • 8 Regional Staff Development Councils • 8 Regional Staff Development Coordinators • 8 RESA Executive Directors (ex officio on regional staff development councils) • County Professional Staff Development Councils • County Professional Staff Development Coordinators
This list includes merely the West Virginia-specific professional development players, not to mention the many federal officials and programs, and private PD providers that play a role in shaping the state’s professional development landscape. The PD providers listed in the state’s Master Plan does not represent the full range of course providers statewide. The specific providers reviewed in the Master Plan vary from year to year, since only those courses related to the Board of Education’s annual goals are evaluated. For 2011-2012, the providers to be evaluated include:
• Marshall University June Harless Center • Regional Education Service Agencies (RESAs) 1-8 • West Virginia Center for Professional Development • WVDE Office of Assessment and Accountability • WVDE Office of Career and Technical Education • WVDE Office of Institutional Education Programs • WVDE Office of Instruction • WVDE Office of Instructional Technology • WVDE Office of International Schools • WVDE Office of School Improvement • WVDE Office of Special Programs • WVDE Office of Title I.160
In 2010-2011, the top three providers of professional development in the state’s Master Plan were RESA 2 (with 6,164 participants), Marshall University June Harless Center (5,119 participants), and RESA 3 (3,472 participants).161

58 www.public-works.org
Teacher Mentoring According to the 2011 West Virginia Teacher, Leader and Counselor Evaluation Task Force, 44 percent of West Virginia educators will be eligible to retire in the next 5 years, with 28 percent eligible now.162
West Virginia schools must be prepared to integrate a large number of beginning teachers in the immediate future, something that in the current system, as noted in this report, needs improvement.
Teacher mentoring, at least for new teachers, is one of the most universally appreciated and utilized means of professional development. The West Virginia legislature created the state’s current teacher mentoring program for all new teachers in 1991. The state law governing teacher mentoring (§18A-3-2b) has not significantly changed since its enactment. Pursuant to the statute, all newly licensed teachers (other than those with five years of experience in another state) must go through at least a year of mentoring. At the end of the program, each teacher is either deemed fully licensed; directed to another year of supervision by a mentoring team; or recommended for dismissal (after a second year in the program). There is no provision for additional mentoring for teachers who successfully complete the program. Mentor teachers receive a $600 per year stipend for their service. This amount has not been increased since 1991. The mentoring statute includes detailed requirements for the time spent by mentors with new teachers in classrooms (eighteen one-hour sessions) and in meetings with teachers (one hour per week the first semester; one hour every two weeks the second semester); for joint planning periods; for the composition of mentoring committees; and, for the training of mentors. There is currently no provision made for retired teachers who might serve as full-time mentors, or for any other type of more flexible arrangement like allowing a school to pool their mentoring stipends to hire a full or part-time teacher mentor. The Board of Education may issue waivers to local districts from the precise Code requirements. Even though the mentoring statute is highly prescriptive, there is little evidence of standardization in how it is being implemented across the state. Thus, the West Virginia system for teacher mentoring is both insufficiently flexible in design and excessively lax in implementation. While assessments of the system by teachers and researchers range from “teacher mentoring is broken” to suggestions for specific improvements, it is clear that reevaluation and reform are long overdue.
Cost of Professional Development The cost of professional development at the state and local government levels in the United States is a controversial and somewhat mysterious topic since there is relatively little data collected on expenditures in this area. West Virginia is no exception to this general rule. The only hard data available in West Virginia are the state’s expenditures on particular programs that are directly tied to professional development efforts. Table 15: FY12 State Spending on Professional Development supplies those numbers for Fiscal Year 2012. It must be emphasized, however, that this only scratches the surface of state professional development investments, and does not include the school district level at all.

59 www.public-works.org
Table 15: FY12 State Spending on Professional Development (Partial List)
Department Item Amount
WV Department of Education Teacher Mentoring $842,034
21st Century Assessment & Professional Development $4,457,825
Principals Mentorship $79,250
Strategic Staff Development (fund 3937, org 0402) $801,202
WV Dept. of Education & the Arts Center for Professional Development $2,730,230
Benedum Professional Development Collaborative $927.500
TOTAL $8,911,469 Source: FY12 West Virginia State Budget Researchers have developed rough estimates of professional development spending nationally, as a percentage of total education spending, which could provide a rough estimate of such expenditures in West Virginia. When addressing this topic, it is important to distinguish between professional development activities performed (and at least partially financed) by local school districts, and those that are directly supplied and financed by state government. Typically, local school district investments in professional development include staff costs associated with planning and delivering in-service programs and opening schools for extra days for in-service; sending staff to workshops; supervising and evaluating personnel; reimbursing tuition; and paying the salary increments teachers earn when they attain graduate degrees, college credits, or continuing education units.163
The state government investment in professional development for educators generally includes the cost of operating professional development and licensure coordination and delivery programs; administering state and federal funds set aside for professional development; time provided by state employees for in-service programs or consulting to schools; administrative costs for teacher recertification programs; costs of state-funded conferences or workshops; state subsidies to colleges and universities for courses provided to teachers or for extension services to schools; tuition reimbursements and salary increments for credits for teachers employed directly by the state; and the additional state aid to local districts whose budgets have increased because of teachers salary increases earned as a result of college credits or degrees.164
The most reputable research on professional development spending suggests that local school districts around the country devote approximately three to five percent of their total operating expenditures to professional development activities each year.165 Translating that to West

60 www.public-works.org
Virginia, one can estimate that school districts in the state spent somewhere between $88.5 and $147.5 million on professional development during the 2008-2009 school year (the most recent for which collective spending data is available).166
Corresponding studies on state governments estimate that states spend between one and three percent of their public education expenditures (not including higher education) on professional development. For West Virginia, that would mean between $22.6 million and $67.8 million in the latest year for which data is available, Fiscal Year 2012.167
Federal Funding Available for Professional Development According to the State Budget Office, in FY 2012, West Virginia is estimated to receive $549.4 million in federal funding from the Department of Education.168
Many US Department of Education grants can be used to support educator professional development activities. See Table 16: Professional Development Federal Funding for a list of federal project grants available to fund PD in Fiscal Year 2012.

61 www.public-works.org
Table 16: Professional Development Federal Funding
Federal Grant Funds Available to Fund Professional Development in Education – FY12
CFDA # Program Name Agency/Office Type of Funding: Project Grants
10.574 Team Nutrition Grants Department of Agriculture, Office of Food and Nutrition Service
43.001 NASA Science Grants National Aeronautics and Space Administration 47.076 Education and Human Resources National Science Foundation
66.951 Environmental Education Grants Environmental Protection Agency, Office of the Administrator
84.004 Civil Rights Training and Advisory Services Department of Education, Office of Elementary and Secondary Education
84.103 TRIO Staff Training Program Department of Education, Office of Postsecondary Education
84.165 Magnet Schools Assistance Department of Education, Office of Innovation and Improvement
84.184 Safe and Drug-Free Schools and Communities-National Programs
Department of Education, Office of Safe and Drug-Free Schools
84.051 Career and Technical Education-National Programs Department of Education, Office of Vocational and Adult Education
84.206 Javits Gifted and Talented Students Education Department of Education, Office of Elementary and Secondary Education
84.215 Fund for the Improvement of Education Department of Education, Office of Innovation and Improvement
84.229 Language Resource Centers Department of Education, Office of Postsecondary Education
84.283 Comprehensive Centers Department of Education, Office of Elementary and Secondary Education
84.293 Foreign Language Assistance Department of Education, Office of English Language Acquisition
84.299 Indian Education-Special Programs for Indian Children Department of Education, Office of Elementary and Secondary Education
84.323 Special Education - State Personnel Development Department of Education, Office of Special Education and Rehabilitative Services
84.325 Special Education-Personnel Development to Improve Services and Results for Children with Disabilities
Department of Education, Office of Special Education and Rehabilitative Services
84.327 Special Education-Technology and Media Services for Individuals with Disabilities
Department of Education, Office of Special Education and Rehabilitative Services
84.334 Gaining Early Awareness and Readiness for Undergraduate Programs (GEAR-UP)
Department of Education, Office of Postsecondary Education
84.336 Teacher Quality Partnership Grants Department of Education, Office of Innovation and Improvement
84.359 Early Reading First Department of Education, Office of Elementary and Secondary Education
84.363 School Leadership Department of Education, Office of Innovation and Improvement
84.364 Improving Literacy Through School Libraries Department of Education, Office of Elementary and Secondary Education
84.351 Arts in Education Department of Education, Office of Innovation and Improvement
Type of Funding: Cooperative Agreements, Project Grants, Direct Payments for Special Use
84.191 Adult Education-National Leadership Activities Department of Education, Office of Vocational and Adult Education
Compiled by Public Works. Source: Catalogue of Federal Domestic Assistance.

62 www.public-works.org
Recommendations A primary goal of educator professional development is to equip teachers with tools to improve student achievement. As stated earlier, research indicates that professional development can have a positive impact on student performance if it is sustained, ongoing, interactive, connected to school and district goals, content-specific, and data-driven. Educational policy at the state level, therefore, should be aimed primarily at establishing high standards for professional development (both in terms of improving professional competencies and affecting student achievement), creating systems for data collection and evaluation, and utilizing techniques that are integrated into the daily classroom experience and sustained over time. States cannot improve the quality of professional development with a patchwork or series of improvement strategies. Rather, improvements must be strategic, systemic, and use research to determine the way professional development is selected, delivered, evaluated, and funded. The recommendations below outline several key areas where West Virginia should assess its professional development programs and systems to ensure that they are contributing to educational excellence in the state.
Professional Development Leadership and Strategy Many of the components needed for a successful professional development system are present in West Virginia. But, for a truly effective system, there must be clear roles and responsibilities throughout the system to ensure that leadership, resources, and providers at all levels are focused on the system’s priorities. In its 2005 study of professional development in West Virginia (commissioned by the Legislative Oversight Commission on Education Accountability), the National Staff Development Council encouraged the state to reexamine the roles, responsibilities, and reporting structures for all state-funded professional development entities, specifically noting that “[t]he governance structure needs to ensure that goals are aligned throughout the system and that results at all levels are used to evaluate the impact of each initiative.”169
This remains the most important challenge facing professional development efforts in West Virginia. Sorting out and clearly organizing -- and in some cases consolidating -- the roles and responsibilities of the many players is an essential step in improving the governance of the state’s educator professional development.
1. Establish clear state-level leadership on professional development. Interviews conducted for this Review indicated that leaders in higher education institutions do not know who is in charge of professional development in West Virginia -- the State Board, the Department of Education, the Center for Professional Development, local districts, RESAs, or the education schools at the universities themselves. Similar statements were made by the education officials leading the state’s PD initiatives in both the Department of Education and CPD.
63 www.public-works.org
One single state-level entity should be authorized with general oversight and policymaking on professional development. The Department of Education possesses the resources and scope of activities best suited for the task at present. There is no reason why the Center for Professional Development should operate independently within the Executive Branch. While there would be no significant savings from consolidating CPD with the WVDE (since most of CPD’s staff operate direct PD delivery programs that would exist in either agency), bringing the entities together could eliminate some of the confusion and inefficiency that exists now with separate operations.
2. Consolidate the advisory functions related to professional development. These functions are currently shared (or duplicated) by the Commission for Professional Teaching Standards, the Professional Staff Development Advisory Council and the CPD Board of Directors into a single entity. This entity should make its recommendations to the State Board of Education and the agency in charge of professional development, not to any subordinate organization in the PD system, and should continue to be chaired by the Secretary of Education and the Arts. The responsibilities of the Secretary of Education and the Arts should be broadened statutorily to encompass a similar oversight and advocacy role throughout education, generally.
3. Streamline the regional and local professional development advisory and
policymaking structure. Once state-level leadership has been identified, the effort to reorganize the system should be extended to the regional and local levels. The present system defined in code and policy of giving a role in professional development policy to staff development councils (and RESA executive directors) in every region, and to professional staff development councils in counties, is unnecessarily cumbersome and confusing. Regional and local input should be offered through representation on the state advisory council. To be clear, important work in professional development other than simple implementation of state policies and delivery of state-mandated services can and should be conducted at the local and regional levels. School districts are uniquely able to assess their own PD needs and convey them to policymakers. And, as MGT noted in its evaluation of local and regional educational bodies, RESAs are in a good position to develop region-wide needs assessment. If conducted within the framework of a well-integrated system, such “bottom-up” initiatives will help guide statewide policymakers in designing PD plans that are both flexible and responsive to the actual needs of schools and teachers.
4. Refine and use the Master Plan for Statewide Professional Staff Development as a true strategic planning tool. In interviews conducted for this review, educators commented that while the Master Plan articulates the state’s PD goals, it does not lay out a larger strategy for how those goals will be achieved. Some interviewees described the Plan as merely a “laundry list of state-approved PD courses.” At its inception, the Master Plan was intended to serve as a tool to identify redundancies in PD offerings. However, so far, there are no real examples of eliminating duplications. Development of the Master Plan has produced some positive results for the PD community. Certainly, there is improved communication among many of the PD stakeholders. Also, changes are being made to refine the scope and content of the Plan. For example, last year the WVBE recommended a more focused approach to developing the Plan that would review the PD plans of each county to evaluate needs
64 www.public-works.org
statewide before developing the state’s goals. Hopefully, this strategy will help address the challenge currently facing RESAs that are directed to simultaneously provide courses in response to the needs of the county districts as the needs are identified and also put together a slate of PD offerings in advance, guided by the state goals as approved by the WVBE. In its evaluation of the 2010-11 Master Plan, the WVDE Office of Research recommended that the State Board consider several questions as it refines the focus and scope of future Master Plans. These questions included:
• Goal formulation:
o How are the PD goals formulated? o What would be the pros and cons of having the goals be formulated, in part,
based on the professional development needs as reflected in the district school improvement plans?
o What other priorities are reflected in the Board’s PD goals?
• Plan formulation: o How do statewide providers currently formulate their PD plans? o How influenced are the statewide providers by the Board goals as they formulate
their plans? o What other priorities (e.g., district needs) are addressed by providers as they
formulate their plans?
• Agencies included: o How are agencies chosen to be included in the PD Master Plan? o Why are some state offices and not others included? o How are institutions of higher education included?170
These questions could not be answered in our investigation or through interviews with key participants in the current professional development system. Addressing questions such as these will be a vital first step in making the Master Plan a true strategic planning document for the state. If leaders leave the questions unanswered, the result will be continued inefficiency and duplication in a patchwork of PD offerings.
Professional Development Delivery and Evaluation
5. Determine the best and most cost-effective professional development delivery model for the state. As is discussed in other recommendations in this study, local districts and RESAs should evaluate opportunities to work together to deliver services more efficiently. This is particularly true for small districts that do not have the personnel resources or breadth of expertise needed to offer specific services like professional development. Data for 2010-11 showed that the eight RESAs provided nearly half (47 percent) of the total PD sessions offered in conjunction with the state Master Plan -- making them the largest vehicle for professional development in West Virginia.171
Yet, the state is not consistent with its use of the RESAs for the delivery of professional development for the county school districts.

65 www.public-works.org
As noted earlier, the state is making a concerted effort to review the PD needs assessments established by county districts and RESAs. Simultaneous with this review, further study should take place to determine the best, most consistent, and most cost-effective PD delivery model for the state.
6. Improve professional development data to minimize course duplication. Currently,
it is difficult for the Center for Professional Development to ascertain the exact PD courses being offered by local districts and each county’s professional development requirements. If CPD had access to this information, then it could offer courses that complement the county programs rather than duplicating them. Each county is required to submit a strategic plan to WVDE that includes a professional development section. Unfortunately, the format of the PD data is not user-friendly. When CPD recently requested a copy of the professional development offerings cited in the strategic plans, they received a spreadsheet with 46,000 lines of unsorted data. This information needs to be put into a more usable format so that CPD and other providers can target their course offerings and maximize the state’s PD resources.
7. Continue to refine evaluation tools to determine the effects of professional
development on teacher practice and student achievement. West Virginia education leaders have commented that in spite of the statutory requirement in Code §18-2-23(d) to evaluate the effectiveness of professional staff development, there is no real system in place to track the effects of educator PD on actual teaching practice and student performance. WVDE is making strides to change this as the evaluation studies of the PD Master Plan mature. The evaluation of the 2010-2011 Master Plan laid the ground work by surveying educators and asking how the PD offering affected their 1) knowledge, 2) behavior and skills, and 3) attitudes and beliefs.172
WVDE acknowledged that the survey results were limited and has already refined their survey approach for the next round (in its evaluation plan for the 2011-2012 Master Plan).
To take PD evaluation to the next level, the state must consider ways to evaluate not only how professional development affects teacher practice, but also how it influences student achievement. West Virginia should develop a mechanism to collect data and determine whether student learning is affected by changes in teacher practice spawned by professional development. States such as Iowa require that school district PD plans include an evaluation component to assess the impact of professional development on student learning.173
West Virginia should consider similar requirements.
This type of evaluation will be the key to determining whether West Virginia is getting a return on its substantial investment in professional development. Very simply, courses that are shown to improve student achievement should be kept and ineffective programs should be abandoned.
8. Provide adequate funding for RESAs to become centers of excellence for teacher
quality and professional development, especially related to high need areas such as science, mathematics, and technology.
9. Establish research-based state standards to create a vision for high-quality professional development. Factors that have been shown to improve student

66 www.public-works.org
achievement include: a duration of at least 14 hours; the ability for teachers to practice what they have learned and receive feedback; a focus on improving a teachers’ core content knowledge; professional development tied to school and district goals for student learning; opportunities for collaboration; and the inclusion of embedded follow-up and continuous feedback.
10. Use student achievement data to assess the effectiveness of professional development. Teacher Mentoring
11. Modify statutory language on teacher mentoring to provide for greater flexibility,
accountability, and efficiency. Statutory language should be reviewed to provide greater guidance on the results teacher mentoring programs should produce in terms of teacher competence and school productivity, and how these results should be evaluated. The state law, adopted in 1991, that requires mentoring for new teachers is highly restrictive about how mentors spend their time, yet largely silent about the state’s expectations for the results mentoring programs are expected to accomplish. In particular, the different needs and capacities of larger and smaller school districts are not accommodated in a one-size-fits-all statutory mandate. Furthermore, the pool of potential mentors is significantly reduced if the Code requirements are overly restrictive. The Code should be modified to eliminate prescriptive language about the composition of local mentoring teams, mandatory planning sessions and meetings with teachers, and specific numbers of hours required for classroom observation. Aside from being inflexible, these requirements have placed a special burden on smaller schools with limited personnel resources. For example, both Boone and Cabell Counties have been forced to use principals or even pay for substitute teachers to cover the classrooms of mentor teachers so they can meet the statutory requirement for classroom observation hours.
12. Clarify training expectations for mentor teachers. State law (§18A-3-2b) currently
requires that teacher mentors attend training provided by the Center for Professional Development (CPD). While this statutory requirement is quite clear, many local districts still choose to offer “new teacher” training. This has created confusion for teachers as to the expectations and requirements for mentor training. Several teachers have commented to CPD that they have “already received training at the local level” and “don’t understand why they must repeat it.” Certainly, local districts may choose to offer supplemental mentor training, but this does not nullify the current Code mandate for CPD training. And, if local districts are offering duplicative training, then this is a waste of limited professional development resources. Code should be modified to either continue the CPD requirement for training (and discourage the counties from providing new teacher training) or to eliminate it at the state level and allow the counties to provide the training as defined by the state.
13. Review WVDE policies and utilize waivers to allow more flexibility in how schools
can use state teacher mentoring funds. School districts should be encouraged to use state teacher mentoring funds in ways that are most suitable to their specific circumstances, and that maximize their effective use. Cabell County recently obtained a

67 www.public-works.org
waiver from the WVBE to pool mentor stipend funds to hire full-time mentors. This allowed the personnel to focus exclusively on mentoring and reduced the need to take mentor teachers away from their own classrooms (also saving the districts on the cost of substitute teachers.)
14. Evaluate ways to establish best practices and improve compliance with state laws
and policies governing teacher mentoring. It is evident from even a cursory examination of local district practices that compliance with the current “system” is very limited. At present, teacher mentoring is implemented differently in all 55 counties (e.g., how mentors are selected, application processes, whether mentors can be retirees, etc.). As reforms are implemented to provide appropriate flexibility to meet local needs, it is appropriate to expect fuller compliance with the state’s teacher mentoring program. State education leaders should consider ways to share mentor program best practices and whether measures need to be taken to achieve more standardization of teacher mentoring statewide.
Professional Development Funding
15. Allocate state and local professional development spending to identified
priorities. As noted in the earlier background and findings, West Virginia does not know the total cost of educator professional development each year. But, based on national research, it is estimated that the state likely allocates between one and three percent of public education expenditures (not including higher education) to PD and local districts likely spend between three to five percent of their total operating expenditures on PD. Obviously, tremendous resources are allocated to these efforts. Education policymakers should have a clear understanding of this funding and prioritize resources (both financial and personnel) based on the statewide PD goals. Unfortunately, this information is not currently accessible to decision makers. Education leaders should assemble such data and then make strategic funding decisions accordingly.
16. Maximize West Virginia’s professional development funding by actively pursuing
all available federal and private grant opportunities. In West Virginia, as in many states, there are multiple sources of funding available to support educator professional development. A significant source of such funding is the federal government. Included earlier in this section is a current resource map listing federal funds (both formula and discretionary grants) available for professional development initiatives in West Virginia. State leaders should review this list and actively pursue all available funding. Furthermore, a similar exercise should be conducted to review and pursue private grants opportunities.
Estimated Savings While no reliable data exists for West Virginia’s actual expenditures on professional development, there are clearly several areas where savings can be achieved. It is reasonable to expect savings of at least 10 percent through elimination of efforts that are redundant, ineffective, or are unrelated to West Virginia’s educational goals.

68 www.public-works.org
As noted above, state investments in professional development are estimated at $22.6 to $67.8 million annually. A ten percent reduction would equate to $2.26 to $6.78 million annually; $11.3 to $33.9 million over five years. This does not include the substantial savings that local districts could achieve if they similarly reduced redundancy and focused their efforts and resources on identified goals.
Five-Year Estimated Savings
Year 1 Year 2 Year 3 Year 4 Year 5 5-Year Total
$2,260,000 $2,260,000 $2,260,000 $2,260,000 $2,260,000 $11,300,000
C. Utilize Cooperative and Pooled Purchasing
Background and Findings
County and RESA Purchasing Each county and RESA in West Virginia must follow the procurement rules outlined in the Purchasing Policies and Procedures Manual for Local Educational Agencies in the State of West Virginia provided by the WVDE Office of School Finance. 174 This manual prescribes the minimum requirements established by the State Board of Education for local educational agencies for the ”… purchasing , receiving, safeguarding and disposal of goods and services obtained for use in their operation.”175
West Virginia counties function almost identically; they follow the same state and federal mandates and receive the same categorical funding. Outside of contracts managed by RESAs for food, natural gas, technical equipment/supplies, vehicle fuels and vehicle lubricants and an independent co-op, each county purchases its own materials and services separate from other counties, RESAs, and the state.176
This creates substantial duplication when multiple counties write contract specifications, process bids based on those specifications, and then awards contracts for the same type services and materials.
Similarly, RESAs do not work cooperatively to purchase goods and services.177
While each RESA performs different functions, all support pre-K-12 education in their regions.
Counties and RESAs have the option to use the state’s procurement contracts for materials and supplies. They are only required to use state contracts for technology purchased with state funds.178
WVDE State Level Purchasing WVDE, like all other state agencies, must use state contracts, as required by West Virginia Code §5A-3, when purchasing goods and services. There are some unique aspects to WVDE, however, that makes this purchasing requirement a hindrance. Most notably, WVDE operates Institutional Schools and the Schools for the Deaf and Blind – considered to be operating more

69 www.public-works.org
like local districts than state agencies. The state procurement system does not provide adequate nor timely procurement services for these operations. 179 These WVDE schools buy supplies and materials similar to those purchased by other public schools.180
Purchasing from Consortiums West Virginia Code §5A-3-19 authorizes the Director of the Department of Administration, Division of Purchasing to allow agencies to “…participate in… consortium for the purchases of commodities or services, with…other public bodies if available and financially advantageous.” WVDE would like to use the Southern Regional Educational Board (SREB) and other educational consortiums for curriculum services and materials;181 however, the Department of Administration has determined that WVDE cannot use educational consortiums’ products and services without going through an RFP or bid process because the WVDE has not demonstrated that the transactions would be “financially advantageous.”182 Instead, WVDE must use the current state procurement process that can take several months longer than those of the approved consortiums.183
Recommendations
1. Work with counties and RESAs to develop a purchasing plan that will combine purchasing of common goods and services to achieve economies of scale.
2. Amend Chapter 5A, Article 3 of the West Virginia Code to allow schools operated
by the WVDE to purchase materials and services from county and RESA cooperative contracts.
3. Amend §5A-3-19 of the West Virginia Code to exempt the WVDE from the state’s
procurement laws that require competitive bids and Request for Proposals when the WVDE uses State Board-approved consortiums.
Estimated Savings States have reduced the cost of purchased good and services and cut administrative costs through the use of cooperative purchasing agreements. Counties and RESAs purchased over $256.6 million of goods and services in 2009-2010.184
If cooperative purchasing saved only two percent of the cost of these goods and services, savings would equal $5.1 million annually.
Data does not currently exist to determine savings from the reduction of administrative time if individual counties and RESAs did not duplicate procurement processes.
Five-Year Estimated Savings
Year 1 Year 2 Year 3 Year 4 Year 5 5-Year Total
$5,100,000 $5,100,000 $5,100,000 $5,100,000 $5,100,000 $25,500,000
70 www.public-works.org
D. Maximize Limited Local Personnel Resources
Background and Findings There is considerable variance in the size of the student population in West Virginia counties. Kanawha County’s 28,458 students number over 30 times more than Gilmer’s student count of 943. Almost half (47 percent) of West Virginia counties have less than 4,000 pupils. Counties such as Monroe, Summers, Calhoun, Pleasants, Ritchie, Tyler, Wirt, Doddridge, Gilmer, Upshur, Grant, and Pendleton educate less than 2,000 students each. At the same time, all West Virginia counties must meet the same state and federal requirements regardless of student population or total budget. For instance, all counties must employ someone to manage student transportation, administer the food programs, maintain facilities, account for revenues, and track expenditures. Each of these jobs requires specific knowledge and a unique skill set that may not overlap with the skills or experience needed for other jobs. Furthermore, each of these positions must complete certain functions, especially completing extensive state and federal reporting requirements, regardless of the number of students served. West Virginia’s larger counties employ one or more persons to handle specific administrative duties while the smaller counties employ one person to handle two or more of these jobs at the same time. For example, Calhoun County uses the same staff person to administer the Child Nutrition Program, student transportation, and facilities. The Finance Department has two employees in charge of budgeting, accounting, and purchasing, while the Superintendent and his Executive Secretary handle all personnel matters in addition to standard superintendent duties.185
Knowledgeable WVDE staff members have noted that individuals responsible for two or more positions often cannot adequately complete all job responsibilities.
There are examples were counties have successfully shared personnel to perform some of these administrative duties. Gilmer and Calhoun Counties recently initiated job-sharing for their Child Nutrition programs. While there were some difficulties unrelated to human resources that prevented the counties from continuing this arrangement, administrators are planning for job-sharing in the near future.
Recommendations
1. Establish an initiative through WVDE to help small counties create job-sharing arrangements, wherever possible.
Estimated Savings This recommendation may not result in savings. However, job-sharing among counties will create the opportunity for county employees to better perform their job duties.

71 www.public-works.org
1.6. Regional Coordination
A. Improve Oversight and Accountability of Regional Education Service Agencies (RESAs) to Maximize Resources
Background and Findings Over the many years of their existence, RESAs have evolved and changed. West Virginia Code §18-2-26 and WVDE Policy 3233 authorize RESAs to “encourage and implement cooperative initiatives….[to] achieve greater efficiency and equity in educational opportunities and…increasing quality and cost effectiveness.” Amendments to these statutes and policies over the years since 1972 made RESAs mandatory, modified management and oversight structures, and changed RESA responsibilities. Senate Bill 4319, enacted in 2002, established six areas of service concentration for RESAs:
• Providing technical assistance to low performing schools; • Planning for and conducting professional development activities; • Facilitating cooperation and coordination among county boards; • Providing computer repair and maintenance, especially related to 21st Century Tools for
21st Century Schools and WVEIS; • Receiving and administering grants; and • Developing and implementing other programs and services to address the specific
needs of counties within the region or required by the WVBE. Opinions about the role, authority and actual services provided by RESAs vary widely. As shown in Table 17: RESA Staffing and Table 18: RESA Services below, there is considerable variance in the staffing and services provided by RESAs. This variance seems to be based more on the grants a particular RESA has successfully obtained than on any comprehensive needs assessment or strategic planning process. In fact, one universal comment concerning RESAs is that they must work to “follow the money” to pursue grants for their survival rather than base services on an assessment of the most critical needs of districts in the region. Examples of variances in staffing levels include:
• A range from 17 staff in RESA 2 to 131 in RESA 8.
• Disproportionate staffing levels compared to the number of districts, students or schools served by the RESA:
o RESA 8, with 131 staff, has a student enrollment of 42,538 in 90 schools. o RESA 1, with 41 staff, has a student enrollment of 33,240 students in 94 schools
– fewer students, more schools than RESA 8 and with considerably fewer staff. o RESA 2, with slightly more students and schools than RESA 1, has the smallest
staff composition of only 17.

72 www.public-works.org
Table 17: RESA Staffing
RESA 1 RESA 2 RESA 3 RESA 4 RESA 5 RESA 6 RESA 7 RESA 8
McDowell, Mercer, Monroe, Raleigh,
Summers, Wyoming
Cabell, Lincoln, Logan, Mason, Mingo, Wayne
Boone, Clay,
Kanawha, Putnam
Braxton, Fayette,
Greenbrier, Nicholas,
Pocahontas, Webster
Calhoun, Jackson,
Pleasants, Ritchie, Roane, Tyler, Wirt, Wood
Brooke, Hancock, Marshall,
Ohio, Wetzel
Barbour, Doddridge,
Gilmer, Harrison,
Lewis, Marion,
Monongalia, Preston,
Randolph, Taylor, Tucker, Upshur
Berkeley, Grant,
Hampshire, Hardy,
Jefferson, Mineral, Morgan,
Pendleton
Regional Council Membership 18 18 16 17 22 14 31 20
Student Enrollment 33,240 39,236 45,367 21,126 27,420 20,663 53,525 42,538 Number of Schools 94 116 117 74 73 59 150 90 Director Services/Coordinator (Supportive Services)
9 5 9 7 11 4 16 11
Director/Coordinator of Services 1 4 1 3 4 2 2
Director/Manager (Instructional) 1 2 2 2 5 1
Accountant 2 Teacher Pre-K 1 37 Teacher K 1 Teacher Elementary 4 Teacher Middle/Junior High 15 1 Teacher High School 1 Teacher Vocational (Adult) 12 12 9 3 14 6
Teacher Special Education 6 Teacher Vocational (K-12) 1 Teacher (Post Secondary) 2 Counselor 1 Electronic Technician 10 3 11 9 4 16 7 Programmer 2 1 5 1 1 Computer Operator 3 1 2 Technology Systems Specialist 1 1 Supervisory Aide 1 Aide 1 2 3 6 34 Secretary/Executive Secretary 4 2 11 5 5 4 7 12
Administrative Assistant 2 Audiologist 1 1 1 1 Occupational Therapist 1 1 4 Physical Therapist 1 2 Treasurer/CSBO 1 1 1 Therapist Paraprofessional 4 Truck Driver 1 Psychologist 1

73 www.public-works.org
RESA 1 RESA 2 RESA 3 RESA 4 RESA 5 RESA 6 RESA 7 RESA 8
School Nurse/LPN 1 1 2 Custodian 1 2 Sign Language Specialist 9 Speech Language Specialist 1 2 Clerk Autism Mentor 3 Inventory Supervisor 1 Paraprofessional 1 4 Attendance Officer 2 Bus Operator 20 Curriculum Specialist 1 Total 41 17 61 19 62 56 93 131 Ratio Students to Staff 810.7 2,308.0 743.7 1,111.9 442.3 369.0 575.5 324.7 Ratio of Schools to Staff 2.3 6.8 1.9 3.9 1.2 1.1 1.6 0.7
Source: West Virginia Department of Education Some observations on the services provided by RESAs indicate:
• There are 15 services provided by all eight RESAs – ranging from professional development to direct student services to administrative functions supporting district operations.
• The number of RESAs providing specific administrative support functions to districts
varies: o Six RESAs provide energy management services. o Four RESAs provide supplies/materials. o Three provide cooperative custodial/maintenance supplies. o Two provide substitute calling systems. o One provides cooperative purchasing of natural gas and vehicle fuels.

74 www.public-works.org
Table 18: RESA Services
RESA SERVICES – GROUPED BY NUMBER OF RESAS PROVIDING
RESA 1
RESA 2
RESA 3
RESA 4
RESA 5
RESA 6
RESA 7
RESA 8
ALL RESAS
Professional Development x x x x x x x x Computer Training Lab x x x x x x x x County Technology Services x x x x x x x x Medicaid x x x x x x x x Special Education x x x x x x x x Student Academic Competitions x x x x x x x x Graduate Classes at Reduced Rates x x x x x x x x Regional School Wellness Program x x x x x x x x Repository of Exemplary Practice x x x x x x x x School and County Improvement x x x x x x x x Substitute Teacher Training x x x x x x x x Supplemental Educational Services x x x x x x x x Technology Repair Services x x x x x x x x Teleconferencing Services x x x x x x x x WVEIS x x x x x x x x
7 RESAs
Cooperative Food Service x x x
x x x x Technology Coordination x x x x x x x
6 RESAs
Adult Basic Education x
x
x x x x Cooperative Technology Equipment/Supplies
x x
x x x x
Energy Management Services
x x x x x x
Public Service Training Program x
x
x x x x
Special Education Contracted Services
x x
x x x x
SPOKES x
x
x x x x 5
RESAs Audiology Services
x x
x x x
Teaching American History x x x
x
x
4 RESAs
Adolescent Health Initiative x
x x x Coop. Classroom
Supplies/Materials
x x x
x Graduate Degree Programs x x
x
x
Alternate Certification Programs x x x
x
Benedum Grant x x x
x ABE Assessment x
x
x
x
3 RESAs
Bus Operator Training Program x
x x
Coop. Custodial/Maintenance Supplies
x
x x
County Supported School Improvement
x
x x
Intervention Program
x
x x Tech Prep Consortium x x
x
Math-Science Partnership Grant
x
x
x
21st CCLC x
x
x

75 www.public-works.org
RESA SERVICES – GROUPED BY NUMBER OF RESAS PROVIDING
RESA 1
RESA 2
RESA 3
RESA 4
RESA 5
RESA 6
RESA 7
RESA 8
2 RESAs
Credit Recovery Program
x
X Deaf/Blind/Visually Impaired Services
x x
HEPC Title II Grant x
x National Board Certification
of Teachers
x
x School Safety Program
x
x
Substitute Calling System
x
x Workforce Investment Board
Grant
x x Workforce Investment
Program
x x
1 RESA
ABE Technology Coordination x
Child and Adult Food Care Program
x
Communities Putting Prevention to Work
x
Coop. Natural Gas
x Coop. Vehicle Fuels &
Lubricants
x Doing What Works Grant
x
Early Childhood Program Birth to 3
x
Early Childhood Program Head Start
x
Gear-Up Grant
x Legal Services
x
On-Site Visit Preparation
x Parental Communication
System
x Science Instructional
Materials
x Student Support Services
x
Student Test-Out Program
x Student Transportation
x
Student Tutoring Services
x Title II Alternative
Certification Grant
x West Virginia College
Foundation Grant
x West Virginia Workplace
Education
x WV Wood Technology
Program
x Source: West Virginia Department of Education
The lack of a statewide, coordinated planning process for the RESAs creates a system that fosters independence but also allows the RESAs to work in isolation, sometimes to the detriment of the entire system. There are opportunities to reduce duplication of effort and increase efficiencies if WVDE establishes a comprehensive planning process, helps RESAs identify core services to be provided by all RESAs and works to establish shared services across RESAs. For example, some RESAs have developed expertise in cooperative purchasing, others excel at technology, still others provide superior services to districts for students with special needs, and some provide specialized services such as audiology screening. In all of these examples, and more, resource sharing among RESAs should be more fully explored.

76 www.public-works.org
Finally, the provision of services such as training for emergency medical technicians (EMTs) provided by some RESAs should be reviewed. While there are historical and practical reasons for why these services are provided through the RESAs, they are not part of the core mission of the Department of Education or school districts. They should, therefore, be carefully reconsidered. Anything that may cause a distraction from the core mission should be eliminated. At the very least, as discussed in RESA Funding section below, the reporting and tracking of funds should be separated so that there is an accurate picture of spending on services for the K-12 system.
RESA Oversight Just as the role and responsibilities of RESAs have changed over the years, so also has their governing structure. Initially RESAs were governed by a Regional Board that was responsible for all aspects of RESA operations. Currently, the State Board of Education is statutorily responsible for oversight of the RESAs; Regional Councils are now designated as advisory. The WVDE assigns a senior department staff member to each RESA to act as a liaison between the state and regional area. West Virginia Code §18-2-26 establishes a Regional Council as an advisory group to each RESA and details the membership of these councils. Because the number of counties vary within each region, RESA Regional Council membership ranges from a high of 31 in RESA 7 to a low of 14 in RESA 6 with an average membership of 19. Attendance at Regional Council meetings is reported to be sporadic at best. In addition, a review of a sample Regional Council minutes shows agendas that are “reporting out” meetings where RESA Executive Directors merely update members on programs and operations and no substantive discussions take place. There do not seem to be opportunities for in-depth discussion on strategic planning or specific issues that are typical of advisory groups with large memberships. Maintaining active interest and participation when a group is seen as advisory is a difficult task. In the case of the RESA Regional Councils, it makes the oversight of RESAs overly cumbersome and complex, causes confusion about the authority and responsibility of the RESAs, and is time consuming and costly. At the same time, there are active Superintendents’ meetings in each region that provide an opportunity for district leaders to have a forum for discussion, planning and development of cooperative programs. This group also attends Regional Council meetings. More meaningful and productive oversight of the RESAs can be achieved by tapping into these Superintendents’ groups and appointing them as the advisory council to the RESAs. Lastly, West Virginia Code §18-2-26(i)(2) allows for compensation of County Board members who serve on the RESA Regional Council at a rate of up to $100 per meeting, plus travel costs. According to the FY11 RESA Budget Summary provided by WVDE, RESAs spent almost $34,000 in compensation of County Board members; the cost of travel is not known.
RESA Funding While the direct state appropriation for RESAs is capped at about $4 million annually, RESAs had an operating budget in FY2011 of approximately $52 million, of which an estimated $45.3 million is for K-12 services. Often, when discussing the importance of RESAs in the West Virginia education system, interviewees seemed to minimize their importance based on the fact

77 www.public-works.org
that they “only receive $4 million” with a large percentage of the funds restricted. As displayed in Table 19: Regional Education Service Agencies – Revenue and Key Expenditures below, RESAs have substantial funding. WVDE needs to develop tighter controls and oversight of RESA spending. Some of the variances in revenue and spending shown in Table 16: Regional Service Agencies – Revenue and Key Expenditures Fiscal Year Ending June 30, 2011 highlight the effects of the differences in grant funding pursued by each RESA.
• RESAs receive $16.1 million in state funds. While the majority of this funding is in restricted grants, it remains a substantial amount of money in the system that is not adequately recognized. Simply because funds are restricted does not reduce the need to ensure that funds are going where needed, are being used effectively, and are tracked for transparency in the system.
• The percentage of total state funding varies among RESAs and is not necessarily in
proportion to the number of students. For instance: o RESA 4 has only 4.4 percent of state funds ($709,297 of $16.1 million), although
they serve 7.5 percent of the student population. o RESA 7 has 13.2 percent of state funding ($2.1 million of the $16.1 million); yet
they serve 18.9 percent of the student population. o RESA 8 has 10.3 percent ($1.6 million of the $16.1 million) of state funding, yet
they serve 15.0 percent of the student population.
• Total spending per student varies from a low of $70.29 per student in RESA 2 to a high of $204.99 per student in RESA 5. Average total spending per student is $160.07.
• State spending per student ranges from a low of $29.17 in RESA 2 to a high of $63.01 in
RESA 6. Average state spending per student is $56.72.
• RESAs are spending $8.1 million for purchased professional and technical services that needs to be considered in the analysis of the complex professional development system in West Virginia (see Professional Development Section).

78 www.public-works.org
Table 19: Regional Service Agencies – Revenue and Key Expenditures Fiscal Year Ending June 30, 2011
RESA 1 RESA 2 RESA 3 RESA 4 RESA 5 RESA 6 RESA 7 RESA 8 Total
Student Enrollment 33,240 39,236 45,367 21,126 27,420 20,663 53,525 42,538 283,115 Number of Schools 94 116 117 74 73 59 150 90
Source of Funds Local and Intermediate $1,249,947 $1,018,467 $1,718,931 $539,365 $3,568,502 $2,784,154 $3,739,057 $2,874,231 $17,492,653
State $1,725,625 $1,144,325 $4,233,076 $709,297 $1,560,801 $1,301,960 $2,124,479 $1,654,219 $16,057,085 Federal $1,706,947 $595,125 $2,251,193 $1,580,995 $913,107 $436,014 $3,364,167 $4,467,109 $15,314,655
Subtract Non-K-12 Revenue $459,996 $0 $486,118 $627,630 $421,709 $303,137 $650,858 $595,481 $3,544,929 Total Revenues K-12 $4,222,523 $2,757,917 $7,717,082 $2,202,027 $5,620,701 $4,218,991 $8,576,845 $8,400,078 $45,319,464
Largest Expenditures Salaries $3,067,591 $1,267,801 $4,805,635 $1,247,041 $3,435,763 $3,756,710 $8,114,804 $7,656,548 $33,348,896
Purchased professional and tech services $690,793 $872,957 $3,720,500 $849,019 $255,599 $335,069 $810,462 $562,919 $8,097,318
Subtract Non-K-12 Expense $459,996 $0 $486,118 $627,630 $421,709 $303,137 $3,364,167 $595,481 $6,258,238 Largest Expenditures K-12 $3,298,388 $2,140,758 $8,040,017 $1,468,430 $3,269,653 $3,788,642 $5,561,099 $7,623,986 $35,187,976
Percent Revenue Source to Total Revenue
State Revenue 40.9% 41.5%t 54.9% 32.2% 27.8% 30.9% 24.8% 19.7% 35.4% Federal Revenue 40.4% 21.6% 29.2% 71.8% 16.2% 10.3% 39.2% 53.2% 33.8%
Local 29.6% 36.9% 22.3% 24.5% 63.5% 66.0% 43.6% 34.2% 38.6% Percent By Source to Source Total Percent State Revenue to Total
State Revenue 10.7% 7.1% 26.4% 4.4% 9.7% 8.1% 13.2% 10.3% Percent Federal Revenue to
Total Federal Revenue 11.1% 3.9% 14.7% 10.3% 6.0% 2.8% 22.0% 29.2% Percent Local Revenue to Total
Local Revenue 7.1% 5.8% 9.8% 3.1% 20.4% 15.9% 21.4% 16.4%
RESA Profile Percent of Students served by
RESA 11.7% 13.9% 16.0% 7.5% 9.7% 7.3% 18.9% 15.0% Total Spending per student $127.03 $70.29 $170.10 $104.23 $204.99 $204.18 $160.24 $197.47 $160.07
State Spending per student $51.91 $29.17 $93.31 $33.57 $56.92 $63.01 $39.69 $38.89 $56.72 Note: RESA 3 revenue reduced by $1.7 million to reflect funding for WVEIS management. Source: WVDE RESA Summary of Total Revenues and Expenditures.

79 www.public-works.org
Potential Role for RESAs in e-Rates
E-Rate is the commonly used name for the Schools and Libraries Program of the Universal Service Fund. This fund, administered by the Universal Service Administrative Company (USAC) under the direction of the Federal Communications Commission (FCC), provides discounts to schools and libraries to obtain affordable telecommunications and internet access. Funding can be requested under four categories: telecommunications services, Internet access, internal connections, and basic maintenance of internal connections. The level of discount ranges from 20 percent to 90 percent depending on the level of poverty and the urban/rural status of the population served, and the costs of eligible services. Eligible schools, school districts and libraries may apply individually or as part of a consortium. States are responsible for requesting the designation of an entity as eligible for e-Rate funding – many states have been able to get approval from USAC to designate their regional service agencies as e-Rate eligible. When the program was created 13 years ago, the WVDE submitted applications for every school district. The rationale was that the State was best capable of coordinating services across the districts, and also had the personnel and expertise to navigate the somewhat complicated program requirements. Over the years, some districts have opted to submit their own applications or hire consultants to do so. However, the State still submits applications for some schools, and also provides e-Rate program training and coordination of requests. By some accounts, the State is maximizing its e-Rate funding opportunities given the limited infrastructure in some parts of the state. Once more capacity is available in those parts of the state (which is to be completed by a contractor by 2013 using a federal grant), more opportunities for e-Rate reduced services will be available. There may be other opportunities, however, that are more immediate. One example is highlighted in MGT’s discussion of e-Rates in RESA 7. T-1 lines were installed, a service eligible for e-Rate funding, but the State did not take advantage of this opportunity because the RESAs are not designated by WVDE as eligible applicants. Based on a very conservative analysis of past opportunities at RESA 7, it is estimated that the State may have forfeited about $1.4 million in e-Rate funding over the last several years. This type of additional revenue to the education system could be obtained in the future by examining other RESA activities that are eligible for e-Rate funding. It is noted that with the enactment of the federal Broadband Technology Opportunities Program (BTOP), some installation of broadband infrastructure may be covered through this new funding source. This, however, does not lessen the need to designate RESAs for e-Rate funding for opportunities not covered by BTOP or other federal funding. There is no one way to determine if a state has received its fair share of e-Rate funding. As depicted in Table 20: Key State E-Rate Comparisons, West Virginia’s funding has not compared favorably to that of surrounding states, states of comparable size, or states with similar geography.

80 www.public-works.org
• West Virginia is slightly below average on all variables of per capita funding, per student, per Free/Reduced Lunch Eligible Students and per school.
• In the 10-state comparison, West Virginia ranks:
o 6th in per capita funding o 5th in per student funding o 6th in Free/Reduced (F/R) Lunch Eligible Student funding o 5th in per school funding
This status among comparison states indicates that West Virginia has potential for additional e-Rate funding.
Table 20: Key State E-Rate Comparisons
E-Rate Funding
Total Population
Total Student
Population
Free/Reduced Lunch
Eligible Students
Number of
Schools
Per Capita
Funding
Per Student Funding
Per F/R Lunch
Student Funding
Per School Funding
Surrounding States
West Virginia $145,800,000 1,852,994 282,662 141,448 771 $78.68 $515.81 $1,030.77 $189,105.06 Kentucky $491,800,000 4,339,367 680,089 345,926 1,565 $113.33 $723.14 $1,421.69 $314,249.20 Maryland $273,400,000 5,773,552 848,412 292,398 1,475 $47.35 $322.25 $935.03 $185,355.93 Ohio $993,000,000 11,536,540 1,764,297 661,151 3,895 $86.07 $562.83 $1,501.93 $254,942.23 Pennsylvania $1,010,600,000 12,702,379 1,786,103 591,250 3,292 $79.56 $565.81 $1,709.26 $306,986.63 Virginia $412,800,000 8,001,024 1,245,340 408,336 2,186 $51.59 $331.48 $1,010.93 $188,838.06
Com
parable Size
Nebraska $112,000,000 1,826,341 295,368 112,293 1,142 $61.32 $379.19 $997.39 $98,073.56
New Mexico $521,300,000 2,059,179 334,419 202,758 866 $253.16 $1,558.82 $2,571.05 $601,963.05
Com
parable Rural
Maine $90,400,000 1,328,361 189,225 71,407 662 $68.05 $477.74 $1,265.98 $136,555.89
Vermont $26,700,000 625,741 92,431 27,115 323 $42.67 $288.86 $984.69 $82,662.54
Average
$88.18 $572.59 $1,342.87 $235,873
Source: E-Rate Funding – http://www.sl.universalservice.org/funding/opendatasearch/Search1.asp
81 www.public-works.org
Recommendations
1. Establish a comprehensive strategic planning process to review each RESA’s capabilities, strengths, and current services to better target resources to school district needs. With resources of over $45 million, it is evident the RESAs have a significant contribution to make in the educational system in West Virginia. Planning for these funds in a more comprehensive and targeted way will ensure funds are used most effectively.
2. Clarify the core services each RESA should provide and identify
opportunities for collaboration. State leadership will be required to develop a more integrated regional system that taps into the expertise in each RESA and uses such a system to identify collaborative opportunities. RESAs should be working together on many “back office” functions such as cooperative purchasing, assistance in recruitment, assessing possible energy savings, and other functions districts must perform in order to operate at their best. Currently, these services are provided sporadically around the state depending on individual RESA experience. In addition, RESAs should be intimately involved in providing technical assistance to counties on key WVDE initiatives such as Global 21.
3. Standardize job descriptions for RESA staff so that WVDE can rely on a more consistent understanding of the expertise and ability of RESA staff.
4. Establish a formal role for RESAs to more effectively use them to help identify struggling schools and to work, in cooperation with WVDE and the district, in developing interventions.
5. Educate districts on the role of RESAs and correct the perception that districts must invite RESAs into the county.
6. Develop a comprehensive policies and procedures’ manual, including financial procedures, to provide for more consistent operations of the RESAs.
7. Streamline and focus RESA oversight and accountability and eliminate Regional Councils. There are adequate opportunities for community input and citizen involvement in the oversight of districts through local school boards. In addition, Superintendents are charged with identifying needed resources to benefit their districts, and are best equipped to ensure RESA services are structured to support districts. By establishing a Superintendents’ Advisory Board, the relationship between districts and RESAs could be strengthened, resulting in more efficient planning, oversight and operations of the RESAs. As noted in the MGT report on RESA 7, assuming RESAs into the WVDE structure would jeopardize the RESA’s eligibility for some federal funding opportunities. Short of this take-over, however, there are several actions identified in this report that WVDE and the board can take to improve oversight

82 www.public-works.org
and operations of the RESAs, including elimination of Regional Councils, WVDE leadership in a strategic planning initiative, and clarification of roles and responsibilities of RESAs in assisting the department, especially for low-performing schools.
8. Designate RESAs as eligible applicants for e-Rate funding. States throughout the country have successfully applied to USAC to designate regional education agencies as eligible for e-Rate funding. WVDE should take advantage of assistance that is available to help states accomplish this application process.
Estimated Savings Identifying exact savings will depend on how quickly WVDE can establish a more strategic planning process for the RESAs. A preliminary review, targeting a 10 percent savings if RESAs worked together to obtain better pricing on key administrative spending could result in:
Category FY11 Expenditure 10 Percent Projected Savings
Insurance $204,350 $20,400
Communications $1,365,576 $136,000
Utilities and Energy $2,245,716 $220,000
Supplies $3,906,307 $390,000
Equipment $156,846 $15,600
SUBTOTAL $782,000 Source: WVDE RESA Summary Budget Administrative savings such as those identified here can be increased substantially if a concerted effort is made to identify services and plan for more efficient delivery. Most importantly, managing the $45.3 million in RESA resources for K-12 more effectively will allow for dollars to be targeted to need and used more efficiently. By reducing duplication, ensuring grant funds are used most effectively, reducing “back office” costs, sharing services, and increasing cooperative purchasing, RESAs can use available funds to provide additional services without increased costs. In addition, designating RESAs to be eligible to apply for e-Rate funding could increase funding by millions of dollars.

83 www.public-works.org
Five-Year Estimated Savings
Year 1 Year 2 Year 3 Year 4 Year 5 5-Year Total
$782,000 $782,000 $782,000 $782,000 $782,000 $3.9 M
1.7. County - and Regional-Level Efficiencies The following information presents an overview of MGT’s approach and methodology for conducting the efficiency and effectiveness reviews of Harrison, Taylor, and Wyoming School Districts and Regional Education Service Agency 7 (RESA 7).
Overview MGT studied the major work processes in the school district and RESA 7 operational areas to identify inefficiencies and opportunities for cost savings, such as:
• Unnecessary work tasks being performed. • Underutilization of technology. • Inefficient work processes (bottlenecks, duplication). • Opportunities to collaborate with other educational entities. • Needed work processes that are not being performed. • Productivity management practices and staff evaluation processes. • Inefficient organization or staffing.
While the teams are charged with identifying specific cost saving opportunities, they also note where additional financial investments may be warranted in order to achieve greater efficiencies. MGT’s key strategies for conducting the studies are summarized below.
Methodology
Peer Comparisons To successfully conduct an efficiency review it is important to fully understand the environment and the community in which the district operates. In addition to gauging the effectiveness and efficiency of each school district against its own standards, districts are compared to similar school districts. This comparison provides an objective basis for contrasting effectiveness and efficiency measures. MGT used data reported to the West Virginia Department of Education. Analyses compare budgeting, staffing, and expenditure data as well as student performance information in each school district report. While MGT did not base recommendations

84 www.public-works.org
solely on comparison school district findings, we used these analyses to provide insights on where the district stands among its peers. Tables 21, 21A and 21B identifies the peer districts used for each school district study.
Table 21: Summary of West Virginia Peer Districts
Harrison County Schools
DISTRICT ENROLLMENT AMERICAN
INDIAN/ ALASKAN
NATIVE
ASIAN/ PACIFIC
ISLANDER BLACK HISPANIC WHITE
PUPIL/ TEACHER
RATIO
Cabell County Schools 12,552 0.26% 0.81% 8.59% 0.76% 88.92% 14.3
Raleigh County Schools 12,340 0.11% 0.80% 9.96% 0.60% 87.79% 14.4
Harrison County Schools 11,196 0.08% 0.72% 2.94% 0.79% 95.03% 14.6
Monongalia County Schools 10,459 0.19% 3.40% 5.70% 1.32% 88.75% 14.6
Mercer County Schools 9,552 0.07% 0.42% 9.89% 0.50% 88.66% 14.6
Average 11,220 0.14% 1.23% 7.42% 0.80% 89.83% 14.5
Table 21A: Taylor County Schools
DISTRICT ENROLLMENT AMERICAN
INDIAN/ ALASKAN
NATIVE
ASIAN/ PACIFIC
ISLANDER BLACK HISPANIC WHITE
PUPIL/ TEACHER
RATIO
Roane County Schools 2,554 0.12% 0.39% 0.90% 0.43% 98.04% 14.4
Barbour County Schools 2,478 1.33% 0.12% 1.33% 0.44% 93.87% 14.3
Taylor County Schools 2,450 0.04% 0.08% 0.82% 0.37% 98.57% 15.2
Hardy County Schools 2,307 0.04% 0.22% 2.82% 3.73% 93.15% 15.7
Braxton County Schools 2,230 0.00% 0.31% 0.45% 0.31% 98.25% 12.4
Average 2,404 0.31% 0.22% 1.26% 1.06% 96.38% 14.4

85 www.public-works.org
Table 21B: Wyoming County Schools
DISTRICT ENROLLMENT AMERICAN
INDIAN/ ALASKAN
NATIVE
ASIAN/ PACIFIC
ISLANDER BLACK HISPANIC WHITE
PUPIL/ TEACHER
RATIO
Hancock County Schools 4,311 0.05% 0.49% 3.73% 0.60% 94.50% 14.5
Mason County Schools 4,308 0.07% 0.28% 1.25% 0.30% 98.05% 13.9
Wyoming County Schools 4,161 0.05% 0.07% 1.30% 0.14% 98.39% 13.3
Nicholas County Schools 4,042 0.00% 0.22% 0.82% 0.35% 98.54% 13.6
Upshur County Schools 3,825 0.08% 0.18% 0.86% 0.65% 98.09% 13.6
Average 4,129 0.05% 0.25% 1.59% 0.41% 97.51% 13.8
Stakeholder Input Stakeholder input is a valuable component of MGT’s methodology, and several techniques are used to obtain information from stakeholders on the issues and opportunities facing the school districts. MGT held community open houses in each of the school district reviews to allow parents, community, and business members an opportunity to provide teams with their comments on the school districts’ strengths and areas in need of improvement. In addition to the community open houses, MGT offered a web address to the public for additional input. MGT also conducted on-line surveys of central office administrators, school principals, and teachers to solicit their opinions on efficiencies and inefficiencies within each of the three school districts as well as RESA 7. In addition, all of the remaining school districts and RESAs were given the opportunity to participate in the survey. As shown in Table 22: Summary of West Virginia School District Participation, 47 of the 55 districts participated in the survey. All eight RESAs participated in the survey.
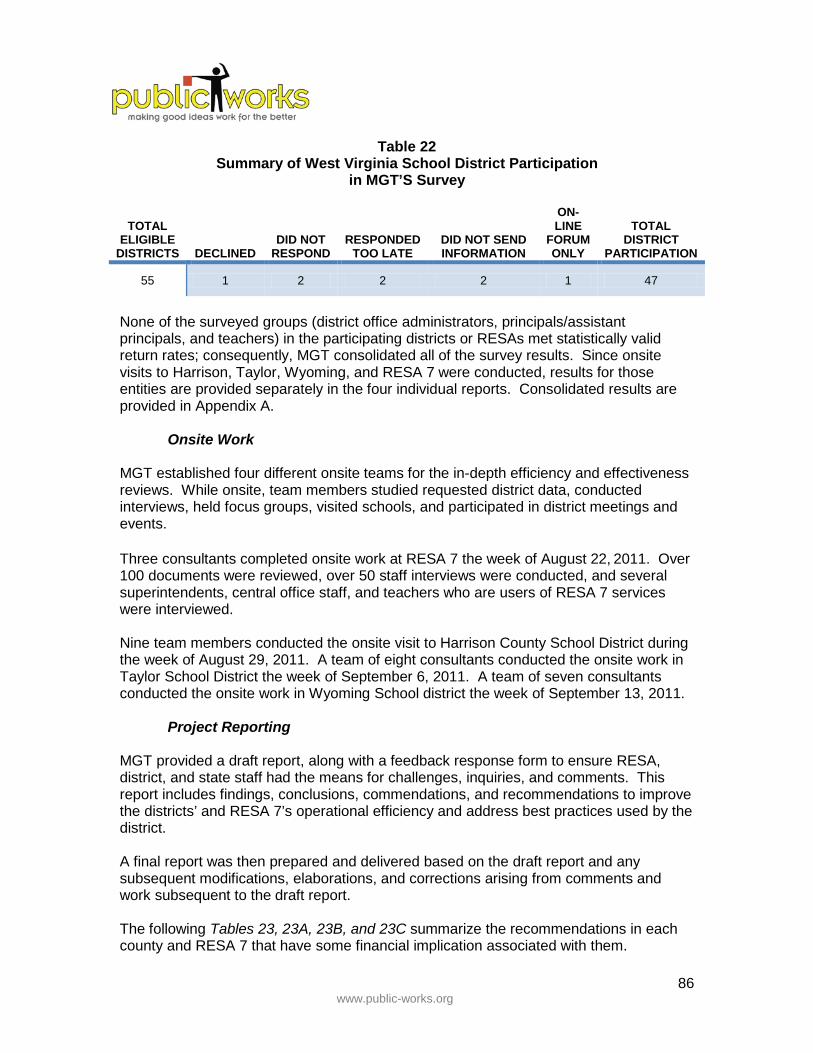
86 www.public-works.org
Table 22 Summary of West Virginia School District Participation
in MGT’S Survey
TOTAL ELIGIBLE
DISTRICTS DECLINED DID NOT
RESPOND RESPONDED
TOO LATE DID NOT SEND INFORMATION
ON-LINE
FORUM ONLY
TOTAL DISTRICT
PARTICIPATION
55 1 2 2 2 1 47
None of the surveyed groups (district office administrators, principals/assistant principals, and teachers) in the participating districts or RESAs met statistically valid return rates; consequently, MGT consolidated all of the survey results. Since onsite visits to Harrison, Taylor, Wyoming, and RESA 7 were conducted, results for those entities are provided separately in the four individual reports. Consolidated results are provided in Appendix A.
Onsite Work MGT established four different onsite teams for the in-depth efficiency and effectiveness reviews. While onsite, team members studied requested district data, conducted interviews, held focus groups, visited schools, and participated in district meetings and events. Three consultants completed onsite work at RESA 7 the week of August 22, 2011. Over 100 documents were reviewed, over 50 staff interviews were conducted, and several superintendents, central office staff, and teachers who are users of RESA 7 services were interviewed. Nine team members conducted the onsite visit to Harrison County School District during the week of August 29, 2011. A team of eight consultants conducted the onsite work in Taylor School District the week of September 6, 2011. A team of seven consultants conducted the onsite work in Wyoming School district the week of September 13, 2011.
Project Reporting MGT provided a draft report, along with a feedback response form to ensure RESA, district, and state staff had the means for challenges, inquiries, and comments. This report includes findings, conclusions, commendations, and recommendations to improve the districts’ and RESA 7’s operational efficiency and address best practices used by the district. A final report was then prepared and delivered based on the draft report and any subsequent modifications, elaborations, and corrections arising from comments and work subsequent to the draft report. The following Tables 23, 23A, 23B, and 23C summarize the recommendations in each county and RESA 7 that have some financial implication associated with them.

87 www.public-works.org
Table 23: Harrison County Schools
RECOMMENDATION YEAR 1 5-YR TOTAL
Reduce Use of Paper for BOE Meetings $35 $175
Purchase Security Cabinets ($10,500) ($10,500)
Eliminate Policy and Administrative Regulations Guide Printing Cost $4,797 $44,275
Submit CAFR for Certificate of Excellence in Financial Reporting $0 ($4,000)
Create Inventory as an Asset on the Balance Sheet of the General Current Expense Fund $1,880,904 $1,805,664
Eliminate In-House Print Shop $15,205 $76,025
Sell Offset Presses $11,000 $11,000
Reduce Child Nutrition School-based Labor Hours 9 Percent $378,066 $1,890,330
Implement Grab-n-Go Breakfast at 19 Sites $495,873 $2,479,365
Increase Elementary and Secondary Breakfast $.25 $49,209 $246,045
Increase Elementary and Secondary Lunch $.25 $163,845 $819,225
Market Free Lunch Participation $112,250 $561,250
Market Reduced Price Meal Participation $18,686 $93,430
Increase User Fees $13,000 $65,000
Establish a Cleaning Supplies Budget $25,000 $125,000
Establish Goal for Utilities Cost Avoidance $100,000 $1,500,000
Install Trash Compactors at Each School $25,000 $225,000
Convert a Bus Supervisor Position to Director of Transportation Position ($12,204) ($61,020)
Decrease Curricular Field Trips by 10 Percent $53,623 $268,115
Decrease by One-Third the Hours Paid to Bus Operators for Additional Bus Runs $150,361 $751,805
Computer Assisted Routing System ($41,000) ($60,200)
Require ASE Certification for Seven Mechanics ($1,512) ($3,024)
Implement a Vehicle Management Information System ($75,000) ($99,000)
Provide a Compensation Change for Director of Technology, Information Services, and Planning ($7,850) ($39,250)
Eliminate Video Production Specialist Position $58,320 $291,600 Technology Schedule Coordination $14,602 $73,010 Develop and Implement a Technology Training Model ($5,000) ($20,000)
TOTAL $3,416,710 $11,029,320

88 www.public-works.org
Table 23A: Taylor County Schools
RECOMMENDATION YEAR 1 5-YR TOTAL
Use Electronic Board Documents ($6,700) ($6,700)
Acquire eSchoolMall Warehouse System ($5,500) ($5,500)
Complete Initial Inventory ($720) ($720)
Reduce Site-Based 10 Work Days $28,864 $144,320
Achieve an 8 Percent Reduction in School-Based Labor Hours $48,290 $241,450
Decrease Unpaid Student Meals by 50 Percent $56,476 $282,380
Eliminate Adult Charge Meals $4,913 $24,565
Reduce Per Meal Costs $419,616 $2,098,080
Increase Breakfast Price $0.25 $5,625 $28,125
Increase Lunch Price $0.25 $41,261 $206,305
Increase Breakfast Program Participation $83,700 $418,500
Increase Free Lunch Sales 5 Percent $37,949 $189,745
Increase Reduced Price Lunch Sales 5 Percent $32,467 $162,335
Employee Supplement for Energy Management Coordination ($6,000) ($30,000)
Travel Expenses for Coordinator ($1,200) ($6,000)
Estimated Energy Management Savings Unknown Unknown
Decrease Curricular Field Trips by 10 Percent $14,528 $72,640
Purchase a Computer-Assisted Routing System ($41,000) ($60,200)
Create New Bus Routes $106,010 $530,050
Require ASE Certification for Four Mechanics ($864) ($1,728)
Implement a Disaster Recovery Plan ($40,000) ($60,000)
Technology Coordinator/ Network Engineer ($64,000) ($320,000)
Secure and Cool Server Environment ($21,000) ($21,000)
Facilitator Services ($700) ($700)
TOTAL $692,015 $3,885,947

89 www.public-works.org
Table 23B: Wyoming County Schools
RECOMMENDATION YEAR 1 5-YR TOTAL
Reduce the Number of Scheduled Board Meetings $9,900 $49,500
Eliminate One Assistant Principal Position in Each High School $168,178 $840,890
Contract for Internal Auditor ($9,000) ($24,000)
Create a Position of Purchasing Agent With the Costs Shared With Other RESA 1 Districts ($15,000) ($75,000)
Increase Lunch Prices $83,130 $415,650
Increase Breakfast Participation $141,155 $705,775
Charge Direct and Indirect Costs $132,578 $866,530 Develop Policy Regarding the Use of Individual Appliances in the Schools $3,000 $15,000
Add a Half-Time Position Through RESA 1 ($26,000) ($130,000)
Create a Systematic Process to Monitor and Support Adopted Curriculum and Instructional Practices ($15,000) ($35,000)
Reassign Assessment and Reduce the Additional Hours and Stipend Provided to the School-to-Work Facilitator $0 $94,320
Add 1.0 FTE Counselor and Focus Support for Middle and High School Students ($61,112) ($305,560)
TOTAL $549,394 3,105,930
Table 23C: RESA 7
RECOMMENDATION YEAR 1 5-YR TOTAL
Reimbursement for Services Provided to the Mountaineer Highland Cooperative $3,888 $19,440
Allow RESA 7 to be Its Own Fiscal Agent $7,600 $38,000
Recover Funding from e-Rate for T-1 Lines $13,486 $67,430
TOTAL $24,974 $124,870
Themes/Trends Findings across the three district efficiency reviews illustrate basic themes or trends represented by the recommendations shown in Table 24: School District Recommendations. As only a single RESA was reviewed, no trends were identified for the RESAs.
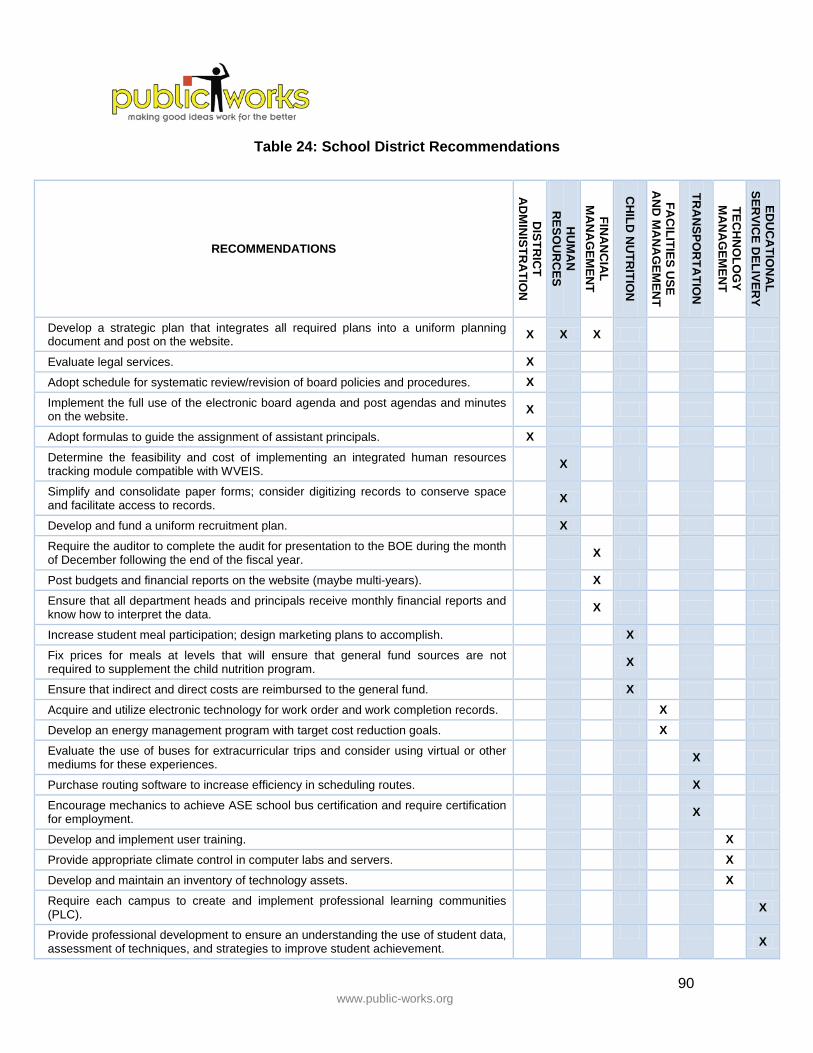
90 www.public-works.org
Table 24: School District Recommendations
RECOMMENDATIONS
DISTR
ICT
AD
MIN
ISTRA
TION
HU
MA
N
RESO
UR
CES
FINA
NC
IAL
MA
NA
GEM
ENT
CH
ILD N
UTR
ITION
FAC
ILITIES USE
AN
D M
AN
AG
EMEN
T
TRA
NSPO
RTA
TION
TECH
NO
LOG
Y M
AN
AG
EMEN
T
EDU
CA
TION
AL
SERVIC
E DELIVER
Y
Develop a strategic plan that integrates all required plans into a uniform planning document and post on the website. X X X
Evaluate legal services. X Adopt schedule for systematic review/revision of board policies and procedures. X Implement the full use of the electronic board agenda and post agendas and minutes on the website. X
Adopt formulas to guide the assignment of assistant principals. X Determine the feasibility and cost of implementing an integrated human resources tracking module compatible with WVEIS. X
Simplify and consolidate paper forms; consider digitizing records to conserve space and facilitate access to records. X
Develop and fund a uniform recruitment plan. X Require the auditor to complete the audit for presentation to the BOE during the month of December following the end of the fiscal year. X
Post budgets and financial reports on the website (maybe multi-years). X Ensure that all department heads and principals receive monthly financial reports and know how to interpret the data. X
Increase student meal participation; design marketing plans to accomplish. X Fix prices for meals at levels that will ensure that general fund sources are not required to supplement the child nutrition program. X
Ensure that indirect and direct costs are reimbursed to the general fund. X Acquire and utilize electronic technology for work order and work completion records. X Develop an energy management program with target cost reduction goals. X Evaluate the use of buses for extracurricular trips and consider using virtual or other mediums for these experiences. X
Purchase routing software to increase efficiency in scheduling routes. X Encourage mechanics to achieve ASE school bus certification and require certification for employment. X
Develop and implement user training. X Provide appropriate climate control in computer labs and servers. X Develop and maintain an inventory of technology assets. X Require each campus to create and implement professional learning communities (PLC).
X
Provide professional development to ensure an understanding the use of student data, assessment of techniques, and strategies to improve student achievement.
X

91 www.public-works.org
Possible Statewide Implications Identified From Local Reviews Clearly, statewide conclusions cannot be drawn from findings and observations in only three local districts and one RESA. There are, however, important findings identified by MGT during its review of Harrison, Taylor, and Wyoming Counties, and RESA 7, that should be investigated further to determine statewide applicability. Table 25: Crosswalk of Local and Regional Issues With State-Level, below, identifies the local and regional findings that may have applicability statewide. Where the issue is also discussed above, we indicate in the chart the applicable page number of this report. Finally, we provide more detail on a few key issues that should be investigated further for statewide applicability.

92 www.public-works.org
Table 25: Crosswalk of Local and Regional Issues With State-Level
RECOMMENDATIONS District Recommendation #
Page # This Report
Administration Evaluate legal services and ensure contracts for legal services are in place H 1-12; T 1-9
Adopt schedule for systematic review/revision of board policies & procedures H 1-9; W 1-10
Implement the full use of the electronic board agenda and post agendas and minutes on the website H 1-5; W 1-4 & 5
Adopt formulas to guide the assignment of assistant principals H 1-19; W 1-19
Human Resources Determine the feasibility and cost of implementing an integrated human resources tracking module compatible with WVEIS H 2-3; T 2-2; W 2-5 46
Simplify and consolidate paper forms; consider digitizing records to conserve space and facilitate access to records H 2-5; T 2-4
Update and standardize job descriptions H 2-6, W 2-7
Develop a recruitment plan to increase the availability of qualified candidates H 2-8; T 2-6, W-2-8 124
Financial Management Require the auditor complete the audit for presentation to the BOE during the month of December following the end of the fiscal year H 3-1; T 3-1; W 3-8
Post budgets and financial reports on the website (maybe multi-years) H 3-2; T 3-2; W 3-9
Ensure that all department heads and principals receive monthly financial reports and know how to interpret the data. H 3-4; T 3-5
Ensure contracting management and oversight are assigned appropriately in the purchasing department H 3-12, T 3-13
Child Nutrition Increase student participation; design marketing plans to increase meal participation H 4-6; T 4-5
Fix prices for meals at levels that will ensure that general fund sources are not required to supplement the child nutrition program H 4-5; T 4-3; W 4-8
Align labor with Meals Per Labor Hour (MPLH) standards H 4-1, T 4-1
Conduct annual compliance training for personnel working with national school breakfast and lunch programs H 4-10, T 4-9
Facilities Acquire and utilize electronic technology for work order and work completion records H 5-5; T 5-8
Establish cleaning supply budgets for each school H 5-8, T 5-12
Develop an energy management program with target cost reduction goals H 5-9; T 5-14 34

93 www.public-works.org
RECOMMENDATIONS District Recommendation #
Page # This Report
Transportation Develop a formal process for evaluating the costs of transportation operations H 6-2; T 6-2 50
Evaluate the use of buses for extracurricular trips and consider using virtual or other mediums for these experiences H 6-3; T 6-3
Eliminate practice of paying bus drivers two hours for runs during normal work hours H 6-4 52
Purchase routing software to increase efficiency in scheduling routes H 6-6; T 6-4 50
Encourage mechanics to achieve ASE school bus certification and require certification for employment H 6-7; T 6-5 48
Technology
Develop and implement training to maximize use of technology H 7-5; T 7-8; W 7-8 141
Provide appropriate climate control in computer labs and servers including mitigation of risk to assets T 7-6 & 7; W 7-5
Develop and maintain an inventory of technology assets T 7-5; W 7-4
Educational Service Delivery Require each campus to create and implement professional learning communities (PLC) H 8-5; T 8-5 54
Provide professional development to ensure an understanding of the use of student data, assessment of techniques, and strategies to improve student achievement
H 8-12; T 8-2 65
Regional Education Service Agencies (RESAs)
Develop a comprehensive Executive Director evaluation 2-2
Streamline reporting relationship between State Board, WVDE, Regional Councils and RESAs 2-3 81
Develop common core of services 2-4 81
Align state funding with mandated core services 2-5 81
Expand cooperatives and shared service models 2-7 81
Eliminate historical practice that RESAs must be invited in to work with county 2-9 81
Develop and implement a standardized needs assessment process 2-13 81
Develop comprehensive policy and procedures manual 2-14 81 Determine if the current approach to audiology screening is meeting needs 3-8 81
Extend a shared service model for all to participate in Energy Education Program 3-10 81
Allow EDGE credits transfer to state universities 3-12 81
Develop a comprehensive operations and financial operations manual 2-14, 4-1 81
Make RESAs eligible for e-Rate funding 5-6 82

94 www.public-works.org
Highlights of Issues Identified During District Reviews
• Free and Reduced Meal Program. The WVDE operates its student meal program on the theory that the program’s primary objective is to feed all hungry students and that WVDE is not interested in making a profit or breaking even on student meals.186
For that reason, the Department has objected to this review’s focus on making the meal program more efficient, arguing, essentially, that this runs counter to its humanitarian mission of feeding hungry children. We believe that this gets it backwards.
The policy to provide meals for all children regardless of income is the right policy. This does not preclude, however, the need to purchase food and prepare and distribute meals as efficiently as possible. In fact, the more efficient the program can be, the further the money will go and the more likely WVDE will be able to meet the goal of providing more and better meals to all West Virginia students.
In order to enable West Virginia to operate meal programs as efficiently as possible, MGT identifies six recommendations that should be considered statewide:
o Encourage counties that do not meet National Food Service Management Institute (NFSMI) industry standards to reduce labor costs and meet these standards.
o Consider implementing Provision 2, an alternative meal counting and claiming method allowed by federal regulations.
o Increase meal prices. o Reduce food service staff paid days by 10. o Encourage counties to use food co-ops to take advantage of lower
pricing. o Prohibit counties from allowing adults to charge meals.
WVDE has expressed concerns about some of these recommendations. Those concerns are addressed at greater length in the individual district reports, but are summarized where appropriate here.
o Meeting NFSMI standards. The National Food Service Management Institute (NFSMI), a US Department of Agriculture-funded organization that is working to identify standards in the student meals industry, recommends that labor costs should constitute no more than 45 percent of the cost of student meals.187 In Taylor and Harrison Counties, however, labor costs are higher than this standard, which increases the cost of the meals.188
While West Virginia is admirably committed to serving healthy, nutritious meals, this does not preclude the need to prepare meals with reasonable labor costs and to work toward meeting national best-practice standards.
Taylor and Harrison Counties together serve about five percent of the Pre-K through Grade 12 publicly educated students in West Virginia.189 If those schools were to align their labor costs with national standards, they

95 www.public-works.org
could save over $480,000 annually.190
Assuming that West Virginia’s remaining schools could achieve savings at half the savings rate in Taylor and Harrison County schools, the annual savings, including Taylor and Harrison Counties, would equal about $4,800,000.
WVDE questions the use of this standard and asserts that savings in this area are unrealistic and based in part on reducing food service positions and labor hours, which in turn would have a negative effect on meal quality. There are several responses to the Department’s asserted concerns. First, the NFSMI standards are research-based best-practice recommendations that apply to every state. There is no evidence that meeting this standard in any way jeopardizes student meal programs or causes a diminution in the quality of meals prepared. The preferred method of reducing labor costs actually is to increase participation – precisely the goal WVDE espouses. In fact, alternatives to reducing labor hours are provided, including increasing participation in the breakfast program, implementing Provision 2 (discussed below), collecting unpaid meal charges, and marketing the school meals programs. Secondly, while WVDE asserts generally that reducing expenditures on cost-factors would reduce federal funding and thus somehow hamper the state’s efforts, in fact federal funds for the child nutrition program are based not on costs but on the number of meals that meet the required meal pattern and are served to eligible children. The intent of the program is to provide nutritiously balanced, low-cost meals to school-aged children. Preparing these meals in a more cost-efficient manner has no effect on federal funds. Rather, preparing meals more efficiently can free up local and state funds currently used in the program to help WVDE better meet its goal to feed all children.
o Implementing Provision 2. Since many districts in West Virginia are economically depressed, MGT recommends that districts be encouraged to investigate the possibility of implementing Provision 2, a special assistance alternative meal counting and claiming method allowable by USDA. Provision 2 reduces paperwork and other administrative burdens at the local level and can be a significant help to WVDE in working with districts to meet its goal of feeding all students. This method requires meals to be served to all participating children at no cost and reduces application burdens to once every four years (or even less often, if the provision is extended). Families are not required to pay for meals or complete the free and reduced-price application after the first year. Since all meals are served at no cost, negative stigmas associated with the school lunch program are removed. As a result, participation increases, thereby reducing the percent of labor costs and meeting the recommended goals.

96 www.public-works.org
o Increase meal prices. According to USDA, federal regulations require that a district’s average price for a paid lunch come to $2.46. MGT found the average price per paid lunch in Harrison County to be $1.27. As a result, the district is not only losing money on each paid meal that is served but is also out of compliance with federal regulations and therefore risks losing its federal funding. WVDE contends that increasing prices will decrease participation in the food program and this will result in a loss of federal funds. In addition, it proposes that the price of meals should be based on the actual cost of producing the meals, not national standards or comparisons to other districts. Contrary to the Department’s position, these recommendations are intended to help the state retain federal funding rather than continue to risk losing it, as at present. There are several ways to accomplish this objective. In order to bring prices into alignment with federal regulations, districts are required to increase meal charges by at least $.10 annually, however a larger increase is permitted if districts so choose. In lieu of increasing prices, however, a school food authority may reduce the average price of a paid lunch if an equivalent amount of financial support is added from non-Federal sources of funds (other than in-kind contributions).191
In addition, if a district implements Provision 2, as recommended above, the issue of raising prices becomes moot since families are not charged for meals served to participating children.
Ultimately, if a program can operate more efficiently, it should do so, whether the taxpayer funds saved thereby are federal, state or local. Meeting national best practice standards, as discussed above, will ensure food service programs are operating as efficiently as possible. In this instance, there is also potential for gaining federal funds and/or reducing the need for state and local funds to supplement the program if Provision 2 is not implemented.
o Reduce food service paid days. MGT found that food service
personnel currently are paid for 29 non-school days per year, and recommends that this excess number be cut by 10 days. As WVDE notes, this will require a change in legislation. The Department also argues, however, that reducing food service person-hours at the school level will negatively affect the ability of districts to expand meal services. We disagree.
During these 29 non-school days, revenue is not generated because meals are not served. Since children are not at school during these times, eliminating 10 days will not affect participation in the school meals programs. Of course, staff development, cleaning, in-service training, and brainstorming innovative strategies are critical elements to a successful

97 www.public-works.org
program, and, according to 126 CSR 86-13.2.3, 15 clock hours of staff development are required for food service personnel. Fortunately, these activities can be completed during the remaining 19 days when children do not attend school and do not receive meals prepared by school staff.
o Cooperative purchasing. Cooperative purchasing reduces commodity prices due to economies of scale. According to Taylor County officials, cooperative food purchasing has saved significantly on food costs.192 All West Virginia counties except for five (Webster, Nicholas, Pocahontas, Raleigh, Summers, and Mercer), participate in cooperative food purchasing.193
o Eliminate ability for adults to charge meals. All counties in West Virginia use WVDE’s “cash register” system for school meals.194 The system can accept cash, recognize pre-paid accounts, and track charged meals, including those of adults, which some counties allow.195 Some of these charges are never paid, resulting in state general funds being used to offset these uncollected receivables.196
The charging system for students should not be changed, however, adults’ ability to charge for meals should be totally eliminated.
Taylor County represents about one percent of the Pre-K through Grade 12 publicly educated students in West Virginia.197 Taylor County could have saved over $5,000 in 2010-11 if adults paid for their meals as required rather than allowing the county to write-off the uncollected debt.198
Assuming that West Virginia’s remaining schools could, by reducing free meals to adults, achieve savings at half the savings rate in Taylor County schools, the annual savings, including Taylor County, would equal over $500,000.
Five-Year Estimated Savings – Align Labor Costs
Year 1 Year 2 Year 3 Year 4 Year 5 5-Year Total
$4,800,000 $4,800,000 $4,800,000 $4,800,000 $4,800,000 $24,000,000
Five-Year Estimated Savings – Eliminate Free Adult Meals
Year 1 Year 2 Year 3 Year 4 Year 5 5-Year Total
$500,000 $500,000 $500,000 $500,000 $500,000 $2,500,000

98 www.public-works.org
• Graduation requirements. While graduation credits are set at 24 in state statute, counties are permitted to set higher rates. This is putting some students, especially those in alternative learning centers or who are transient, at a disadvantage. Counties should be required to adhere to a uniform graduation credit requirement.
• Truancy. The counties reviewed were found to have trouble meeting the
statutory requirement of addressing truancy problems within five days.
• Implementation of the 2020 Blueprint. West Virginia took a bold and aggressive stance in creating the Vision 2020: An Education Blueprint for 2020 that is now in statute. The plan addresses the need for 21st Century skills, is comprehensive and accountability-oriented. During the review of Harrison, Taylor and Wyoming Counties, however, implementation issues were identified that may have statewide implications. Counties need help to:
o Develop concrete plans for implementation, including establishing a timeline, year-by-year objectives, and alignment of county initiatives with the plan.
o Create and implement a communications plan to involve stakeholders in the planning process.
o Align five-year district and school plans with the blueprint goals – helping educators see how to work smarter, not harder.
o Ensure professional development initiatives are aligned with the blueprint.
Highlights of Issues Identified During RESA 7 Review Discussion of the roles, responsibilities, authority and organizational structure of RESAs are discussed in Section I: 1.6. The review of RESA 7 raised some additional issues that should be considered for possible statewide implications. These include:
• Improve Audiology Services. RESA 7 staff and the nine county special education directors shared concerns about the mandate for physicians to do the initial audiology screening for new students and entering students. While this state mandate is well intentioned it has unintended consequences. • Some doctors do a thorough analysis • Others allow nurses and/or secretaries to do the assessment • In some cases parents have been asked for information rather than a student
being tested • The state forms do not say whether the student passed or failed the
screening but only that they were checked
Because of the inconsistency with physician screening, the school districts are requesting retesting by the RESA 7 staff in order to make sure that students are tested correctly and identified problems are addressed. While auditory problems must be documented in an IEP for special needs students, RESA 7 and districts find that this does not always happen.

99 www.public-works.org
The state needs to determine if the current approach is in reality working and to enforce the requirement for doctors to perform the audiology tests.
• Improve the evaluation system. While everyone in RESA 7 is evaluated, a
more comprehensive evaluation system should be implemented that ties performance to the strategic plan and operational goals. In addition, the evaluation instrument for the Executive Director could be strengthened, go beyond merely a checklist, and include observations and opinions of staff and key stakeholders.
• Clarify and refine the hiring process. The current system, requiring the
selection be made by the State Board is cumbersome and time consuming. Allowing the Executive Director to be chosen by the Superintendents within the region, with State Board approval, will streamline the process and develop stronger buy-in between the Executive Director and counties.
Highlights of Issues Identified From Financial Accounting Reviews • The Handbook for School Finance in West Virginia is out of date. It was
prepared in 1990 and has not been updated since that time. West Virginia Code §18-9B-9 and §18-9B-9 charges the West Virginia Board of Education with formulating and prescribing a uniform system of school district budgeting and accounting for use of all county districts.
o We have been advised that an initiative is underway to revise the
handbook and that it will also include chapters for RESA financial management. The WVDE should Financial Reporting - The topic of financial reporting is included in a section entitled “Communications.” This section does not discuss the audited Annual Financial Report nor does it provide any sample formats for monthly financial reporting. Both interim and annual financial reporting should be discussed in more detail.
o There is no reference to requirements of the Governmental Accounting Standards Board (GASB). GASB is recognized by governments, the accounting industry, and the capital markets as the official source of generally accepted accounting principles (GAAP) for state and local governments. GASB standards such as Statement 34, Basic Financial Statements – and Management’s Discussion and Analysis – for State and Local Governments and Statement 54, Accounting and Financial Reporting for Postemployment Benefits Other than Pensions, have had far reaching impacts on the accounting for school districts and other governmental entities.
o Restructure the materials describing the Public School Support Program by establishing two categories; one that identifies the basis for calculating resources that are available for allocation by the district and one that lists those categories for which specific resources must be allocated and

100 www.public-works.org
record the financial transactions for the allocated items in the Special Revenue Fund.
o MGT observed some confusion regarding the accounting for the special allotment programs, this minor structural adjustment will make it easier to provide useful financial information that will clarify how the allotted resources are being managed.
o Require that all excess levy resources be accounted for in Fund 12, Excess Levy, regardless of the levy call requirements. Districts currently provide separate financial reporting for the excess levy activities and this reporting is not provided on a consistent basis. Tracking these revenues and expenses in a separate fund will more clearly indicate how the district is managing these resources.
o Governmental Accounting - The Handbook provides no discussion about
the concept of governmental accounting. It is strictly a ”how to” document. It should include an introductory overview regarding the basic aspects of governmental accounting.
o State Aid Formula – This section identifies items 1 through 7 and
indicates the county’s entitlement is the sum of these costs, minus the “local share,” as determined by Code §18-9A-11. The requirements associated with the State Aid Formula have been expanded since the issuance of the Handbook. Although the updated materials are available from the WVDE web site, the information in the Handbook should be updated.
o Use of Purchase Cards – Since completion of the Handbook, a Purchase
Card Program coordinated by the State Auditor’s Office has been introduced; information pertaining to this program should be included in the Handbook.
o West Virginia Educational Information System (WVEIS) – Every district in
the state uses the financial system incorporated into this program; it is not referenced in the existing document. The procedural accounting references should all relate to the WVEIS financial system.
• West Virginia Code §12-3-18 should be either eliminated or revised to allow local
Boards of Education to approve transactions after they have been paid.
The reality is that although the vendor has not been paid until approval by the Board of Education, the service has already been provided. The agreements and contracts have been entered into by those with authorization from the Board to do so, thus, regardless of a concern of a board or community member, the district has an obligation to pay the invoices on the list awaiting approval. Additionally, when a school district has a reputation for paying on time and maintaining professional relationships with vendors, the district will receive the

101 www.public-works.org
very best possible prices and service and the vendors will talk to others in the community about how effective the district is in managing its business practices.

102 www.public-works.org
2. EDUCATION DELIVERY IMPROVEMENTS
Section 1 of this report details the many ways in which the West Virginia education system can work to reduce non-instructional costs, especially those furthest from the students the system is meant to serve. That then raises the question of what West Virginia can do to raise educational quality and outcomes for these students. In some ways, framing the inquiry itself answers these questions:
• As West Virginia works to reduce unneeded expenditures at the greatest distance from students themselves, and least directly involved in the delivery of instruction and educational experiences, the more resources this frees up for the direct delivery of education at levels closest to student learners: the district, the school house, the classroom, and the student’s very desktop.
• As, in turn, reviews of this sort identify potential efficiencies at the district level – as we have done in three of the state’s 55 districts – this allows more resources to be driven further down the “org chart” to the individual building, classroom, and learner.
• What can we do to improve outcomes for these individual learners? Let’s start by focusing on those outcomes. The outcomes we want for these young people – and the outcomes that most of them, and their families, want – are, foremost, the ability to support themselves in the future in a changing and challenging economy, as well as serving as responsible citizens of a democracy, contributing members of a community, constituent parts of an ongoing and vibrant culture and civilization, and individuals who live intellectually and emotionally fulfilling lives. In short, the adults with whom we are most concerned in this system are the adults whom today’s child will someday become; our education system needs to focus on those adults’ needs. West Virginia therefore needs to place primary emphasis on delivering an education that prepares today’s young people for the world – and particularly the workplace – of the future. Section 2.1 addresses means for better connecting the education system to the workforce and career futures today’s students face.
• This construct suggests, and this report assumes, that the means to this goal of world-class student preparation is world-class education delivery at the levels closest to the students themselves. That means as West Virginia frees up resources further from actual education-delivery and the student, and redirects those resources into more student-centered functions, it can and should work to put those resources to best use by focusing on improvements in education delivery at the school building and classroom levels. It is widely accepted that the most important variable at the school-building level is the quality of leadership from the building’s principal (the title “principal” derives from the function of “principal teacher”) and that the most important variable at the classroom level is

103 www.public-works.org
the quality of instruction delivered by the teacher. Section 2.2 addresses ways to support and improve school building leadership and classroom teaching.
• Finally, new technologies are making it more possible to deliver education geared to the individual student and to monitor individual needs and progress. These technologies enable students to take courses on virtually any subject, from any institution, at any level, and to “travel” virtually anywhere in the world to “see” great works of art, “conduct” scientific experiments, or “meet” outstanding individuals in their fields. As discussed below, early indications are that these technologies, combined with traditional teachers, produce better learning outcomes together than either do separately; this means that investing in these technologies don’t simply represent a new way to individuate instruction – they act as a multiplier of the investments in teacher and school quality. Moreover, providing the best education for individual students generally involves giving that individual (or, his or her parents) a wider range of individualized options; in general, improved choices for consumers drives improvement in the delivery system, as well. But, as discussed in the overview, West Virginia is unlikely to be able to offer as broad a range of choices to its students as can many other states: Population densities and geography make the state an unlikely candidate for widespread competition and choice amongst schools, whether under public or private models, or for extensive curricular offerings; high rates of poverty and low concentrations of urban amenities make it more difficult to attract new blood to the state’s teaching profession. Installing sufficient broadband and developing these new distance-conquering technologies can help West Virginia overcome these obstacles. Section 2.3 addresses how West Virginia can become not just an adapter but a leader of these new developments in technology.
2.1. Better Connecting the Education System to Workforce and Career Futures
A. Enhance Collaboration between Education and Workforce Development
Background and Findings Nobel Laureate economist Gary Becker has stated that “the stock of education, training, skills and even the health of people constitutes about 75 percent of the wealth of a modern economy. Not diamonds, buildings or oil, but things that we carry in our heads.”199
It is imperative that we recognize this when establishing a strong educational foundation for West Virginia’s next generation workforce. Experts and academics alike have noted that the skill needs of the innovation economy are demanding more and better collaboration among our education leaders and workforce training providers.

104 www.public-works.org
West Virginia policymakers have instructed education leaders in the PK-12 system, Career Technical Education (CTE) programs, and the Community and Technical Colleges (CTCs) to work collaboratively to develop a seamless curriculum and a “continuum of competencies” that will allow students to transition from one education level to another without unnecessary duplication. The Community and Technical College System (CTCS) has recognized this charge and committed to “strategically partner with economic, workforce and community development, K-12 and the universities to meet the workforce development needs of citizens and businesses.”200
To this end, the CTCs and the state’s Career-Technical Education (CTE) Centers have worked together to expand program and course collaborations. As of 2010, CTCs and CTEs collaborated on 462 post-secondary courses.201
See Table 26: West Virginia Community and Technical College System Program and Course Collaborations for more details from the most recent CTCS report on program and course collaborations.
Table 26: West Virginia Community and Technical College System Program and
Course Collaborations
2008-09 2009-10 Increase/ Decrease
CTCS Goal
Percentage Goal
Attainment
Number of courses brokered from other higher education institutions 190 83 -37 300 27.67%
Number of postsecondary courses brokered from or offered in collaboration with public school career-technical education centers
445 462 17 376 122.87%
Number of programs offered in collaboration with employers 321 245 -76 288 85.07%
Source: WV CTCS Report to LOCEA, January 2011. While many collaborations have been developed to create a seamless transition for West Virginia students from secondary to post-secondary environments, more can be done.
West Virginia EDGE Program West Virginia’s “Earn a Degree, Graduate Early” (EDGE) program is one area where enhanced collaboration could occur. The EDGE program allows students to take high school courses for community and technical college credit. This creates a great opportunity for students to earn a degree with substantial savings. It is estimated that students can save up to $3,000 in college tuition in the EDGE program taking the right mix of courses.202 Students who take the college credit courses available in high school
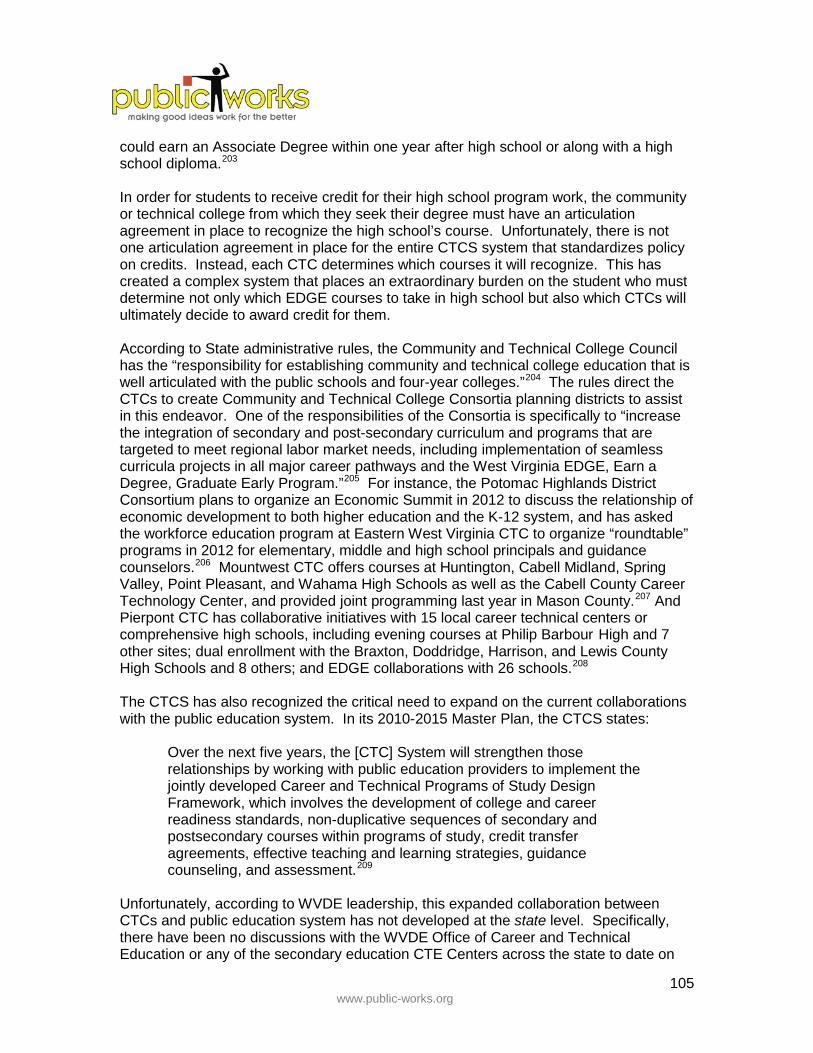
105 www.public-works.org
could earn an Associate Degree within one year after high school or along with a high school diploma.203
In order for students to receive credit for their high school program work, the community or technical college from which they seek their degree must have an articulation agreement in place to recognize the high school’s course. Unfortunately, there is not one articulation agreement in place for the entire CTCS system that standardizes policy on credits. Instead, each CTC determines which courses it will recognize. This has created a complex system that places an extraordinary burden on the student who must determine not only which EDGE courses to take in high school but also which CTCs will ultimately decide to award credit for them.
According to State administrative rules, the Community and Technical College Council has the “responsibility for establishing community and technical college education that is well articulated with the public schools and four-year colleges.”204 The rules direct the CTCs to create Community and Technical College Consortia planning districts to assist in this endeavor. One of the responsibilities of the Consortia is specifically to “increase the integration of secondary and post-secondary curriculum and programs that are targeted to meet regional labor market needs, including implementation of seamless curricula projects in all major career pathways and the West Virginia EDGE, Earn a Degree, Graduate Early Program.”205 For instance, the Potomac Highlands District Consortium plans to organize an Economic Summit in 2012 to discuss the relationship of economic development to both higher education and the K-12 system, and has asked the workforce education program at Eastern West Virginia CTC to organize “roundtable” programs in 2012 for elementary, middle and high school principals and guidance counselors.206 Mountwest CTC offers courses at Huntington, Cabell Midland, Spring Valley, Point Pleasant, and Wahama High Schools as well as the Cabell County Career Technology Center, and provided joint programming last year in Mason County.207 And Pierpont CTC has collaborative initiatives with 15 local career technical centers or comprehensive high schools, including evening courses at Philip Barbour High and 7 other sites; dual enrollment with the Braxton, Doddridge, Harrison, and Lewis County High Schools and 8 others; and EDGE collaborations with 26 schools.208
The CTCS has also recognized the critical need to expand on the current collaborations with the public education system. In its 2010-2015 Master Plan, the CTCS states:
Over the next five years, the [CTC] System will strengthen those relationships by working with public education providers to implement the jointly developed Career and Technical Programs of Study Design Framework, which involves the development of college and career readiness standards, non-duplicative sequences of secondary and postsecondary courses within programs of study, credit transfer agreements, effective teaching and learning strategies, guidance counseling, and assessment.209
Unfortunately, according to WVDE leadership, this expanded collaboration between CTCs and public education system has not developed at the state level. Specifically, there have been no discussions with the WVDE Office of Career and Technical Education or any of the secondary education CTE Centers across the state to date on

106 www.public-works.org
these issues. EDGE plays an important role in preparing students for work. It connects them to career paths, especially in middle-skill jobs, and helps them to achieve training and skills needed for the workforce by the time they graduate from high school. Stronger collaboration between CTC and WVDE can only enhance these opportunities. Of growing importance in the economy of the future is the need for the CTCS system to play a critical role in reaching students even at the middle school level. Starting in middle school, students can explore career options and the requirements of a career.
Transitioning to Post-Secondary Education 2011 research has shown that by 2020, 58 percent of jobs will require a career certificate or college degree. Currently, only 28 percent of West Virginians have an Associate’s Degree or higher, leaving a 25 percent skills gap.210
For every 100 West Virginia students who enter a two or four-year college program, only 16 percent graduate on time. In many cases, this is due to either the need for substantial remediation or to time wasted as students try to figure out a study path that will end in gainful employment. See Table 27: West Virginia Post-Secondary On-Time Completion Rates for a breakdown of on-time completion rates in West Virginia.
Table 27: West Virginia Post-Secondary On-Time Completion Rates
On Time At 150% Time
Full-Time Part-Time Full-Time Part-Time
One-year Certificate 11.7% ** 13.8% **
Two-year Associate’s Degree 5.2% 0.5% 12.6% 4.7%
Four-year Bachelor’s Degree 22.2% 1.2% 48.2% 10.3% Source: Complete College America211
** - Insignicant number to calculate
Currently, many West Virginia students are not prepared when they enter post-secondary education. Recent reports show that 69.3 percent of West Virginia students entering two-year colleges need developmental course work; 19.6 percent of those entering four-year colleges need remediation.212
These students are far less likely to graduate than other students because many do not successfully complete developmental coursework or the first college-level follow-up course. And, of the students requiring remediation who do ultimately graduate, most are significantly delayed.

107 www.public-works.org
Goal Three in the West Virginia Board of Education’s Strategic Plan establishes the expectation that “all students will graduate from high school prepared for post-secondary education and career success through personalized pathways and guidance that focus students on productive and satisfying lives.”213
More must be done to make sure that students receive both the instruction they need in the classroom and the academic and career counseling out of the classroom to plan a successful path to post-secondary education and the workforce.
Recommendations
Strengthen State-Level Coordination and Planning
1. Enhance strategic planning and collaboration between West Virginia’s education, workforce, and economic development leaders. In recent years, states across the nation have recognized the need for better integration of their education, workforce and economic development efforts. The National Governors Association (NGA) Center for Best Practices reviewed approaches to integration and outlined several basic lessons for states considering such alignment. For example, states use financial incentives to help focus educational institutions on developing a trained workforce, administrative actions to align priorities and resolve differences among education, workforce, and economic development efforts, and development of industry clusters to promote regional partnerships among key workforce stakeholder groups.214
West Virginia should consider similar options to create a more focused and unified vision for the state.
While certainly education, workforce and economic development agencies have distinctive purposes and functions, they should work toward common strategic goals for the betterment of the state. Currently, there is no functioning body or structure in West Virginia to bring the agencies together at the strategic and policymaking level. There are several ad hoc “committees” and “working groups” – some more functional than others – that focus interagency planning on a particular program or funding stream. But, there is no real strategic planning group that enables leaders to work together at the macro level to address the most pressing educational and workforce needs of the state.
2. Require all state education, workforce and economic development entities
to coordinate their strategic plans and determine areas for coordination and collaboration. The State Board of Education, the Department of Education, and the Department of Commerce, including Workforce West Virginia, should jointly review their strategic plans to identify opportunities for enhanced coordination around common goals. Each agency also should conduct a review of its own strategic plan by assessing and updating internal goals. The priorities identified in each agency review could then be compared with those from the other bodies to identify areas for collaboration. This type of “goal sharing” should be expanded to a variety of potential partners and other stakeholders. Certainly, the Community and Technical College System and the Higher Education Policy Commission should be included. But, leaders should also think even more

108 www.public-works.org
broadly about partnership opportunities with in-state groups like local chambers of commerce or even regional entities such as the Appalachian Regional Commission (who identified “increasing educational and job skill opportunities” as one of the top priorities in its 2011-2016 strategic plan).215
3. Develop an interagency education/workforce/economic development plan that clearly establishes roles for each agency built on the state’s priorities. It is not only important for education, workforce and economic development leaders to work together to develop strategies, they must also ensure coordination in the execution of such strategic plans. All state agencies should be working toward a common agenda that reflects the state’s overarching priorities. To accomplish this, executive branch leaders should develop an interagency plan that clearly establishes roles for each agency and targets those toward the state’s goals.
4. Evaluate opportunities to pool education, workforce and economic
development funds toward common strategic goals. States that have been successful in aligning their education, workforce and economic development efforts have often done so by pooling funding to focus on common strategic goals. For example, Oklahoma was able to use WIRED funding to advance its regional economic development planning activities. They were able to convene workforce partner groups to analyze industry requirements, worker and service provider needs, and ways to pool incentive dollars.216 In addition, Georgia has used funds combined from several sources to finance a wide range of projects to further its “Work Ready Regions.” Projects range from training, screening and assessment to providing support services, such as child care and transportation, to facilities and equipment purchasing.217
West Virginia has successfully blended funding streams before to support initiatives such as Literacy West Virginia, a program that provides individual and small group tutoring in literacy, basic skills, computers, and English as a Second Language (ESL). The state-level effort was funded by the West Virginia Adult Basic Education Office (which receives support from the Workforce Investment Act), the Benedum Foundation, and corporate donations. Local programs were funded primarily through private donations, mini-grants, and local support.218
Similarly, the WVDE Office of Adult Education and Workforce Development has supported Workforce West Virginia Career Center services. The West Virginia Adult Basic Education (WVABE) program has used Title II funds to provide ABE services in several comprehensive or satellite Workforce West Virginia Career Center facilities, including some Centers with full-time learning centers.219
The State should expand joint-funding practices such as these and blend resources to target dollars to the common goals and strategies identified by an interagency leadership group (such as the one recommended above). Such an effort will not only focus the efforts of the various agencies, but also maximize their collective resources.

109 www.public-works.org
5. Develop integrated performance measures in workforce and education. Research has long documented the benefits of establishing cross-programmatic performance measures to focus independent agencies on a priority list of common goals. In recent years, many states have considered common measures and system measures for their workforce educational programs. Now, leading states have begun to move toward multi-tiered measurement models linked to statewide strategic goals, workforce system-building and continuous improvement. The most successful efforts have brought together collaborations of workforce and education professionals along with business representatives, other state agencies, elected officials, and community leaders as partners in the performance measure design and implementation. West Virginia should consider similar integrated performance measures.
6. Improve the use of job forecasting data to plan secondary and post-
secondary programs that will produce the workforce we know West Virginia will need. West Virginia educators can also help prepare the next generation’s workforce by using job forecasting data to inform their curriculum and program planning. The state’s Labor Market Information (LMI) system has an abundance of data available illustrating the specific workforce needs for every part of the state for the near future. The LMI data, maintained by Workforce West Virginia, includes everything from wage data to occupational forecasting. This information is vitally important to students who are choosing an education and career path.
The Community and Technical College System has made a commitment to design programs and curriculum around identified high growth and emerging industries. One good example is the new CTC “Learn and Earn” program in which CTCs will partner with employers to provide cooperative education opportunities for students. State funding for this initiative is limited to cooperative education programs offered high-demand occupational fields.220
Educational programs at all levels should regularly update their course offerings to reflect changes in the state’s future workforce needs. For example, current occupational forecasting data shows that the state needs to train more registered nurses (RNs) as opposed to licensed practical nurses (LPNs). Yet new LPN programs are coming on-line as opposed to the RN programs that are needed. Cooperative planning should determine whether there are sufficient offerings in both RN and LPN courses to meet the job demands. The state Workforce Investment Board (WIB) is another great resource for workforce data. Traditionally, educators have participated only minimally in WIB meetings and activities. This is a venue where education and workforce partnerships should be expanded. Finally, West Virginia’s K-12 schools (particularly middle and high schools) should review job forecasting data when designing curriculum to develop programs of study that will chart the course for students in post-secondary education and ultimately the workforce.

110 www.public-works.org
Expand High School Options While the economy today’s young people will enter already has changed dramatically during their short lifetimes, the preparation they receive for it in high school has barely changed at all. It is time for us to reinvent the entire high school experience – not just the math/science component of it – to elevate secondary education and how we are meeting the demands of the new global economy.
7. Support different high school design approaches. The state should promote the development and replication of new and innovative public high school models, such as reorganizing around themes, breaking up large schools, and creating “schools within a school” with particular subject area focuses such as arts, law enforcement, or, of course, math and science. Examples of this already exist in Kanawha County, for example, where three “specialty” high schools – like “magnet” schools elsewhere – serve those students who choose to attend them; for instance, the University Collaborative Program allows students to earn both high school and college credits through its partnership with West Virginia University. Students are encouraged and supported in their exploration of the full range of offerings at the university in order to broaden their perspectives on future careers. The state should consider special funding for the lowest performing high schools willing to try new models, accreditation/licensing flexibility, and/or technical support. However, local education officials, principals and teachers should be the ones to bring these redesigned schools to life.
8. Establish a School Innovations Fund to encourage the creation of new
schools, especially in communities where they are needed most, and simplify current Innovation Zone legislation. West Virginia has the foundation in code to develop innovative and responsive educational programs for the 21st Century. Both the Vision 2020 Blueprint and the Innovation Zone code language sets the foundation for schools to establish programs to ensure students are prepared for the 21st Century. Meeting all of the requirements, however, is cumbersome and often makes it impossible for districts or higher education institutions to develop real alternatives. Additionally, lack of funding prevents many districts from even trying to establish alternatives.
For example, North Carolina created a high school “innovations fund” as part of legislation designed to increase high school and college completion rates. The Governor’s Education Task Force identified “reforming the high school experience” as one of the state’s six strategies for building a superior public education system. Concluding that the state needed to encourage more options and customization for students in smaller schools with more supports for college and workforce success, the task force recommended that a High Schools Innovations Fund be created with public, foundation, and corporate money to provide seed capital for establishing theme or workforce-focused high schools. The initiative aims to link education and economic development by supporting collaborative efforts among high schools, community colleges, four-year institutions, and local businesses.221

111 www.public-works.org
9. Better integrate career preparedness into the standard curriculum. As noted earlier, only 16 percent of West Virginia students who enter two or four-year college programs graduate on time. In many cases, this is due either to the need for substantial remediation or time wasted as students try to figure out a study path that will end in gainful employment. West Virginia educators can help address the two issues by better preparing our secondary students, both in the classroom and in educational and career counseling. For example, Oregon added four career-related goals to its graduation requirements to be met by graduating seniors:
• Develop an education plan and build an education profile. Students identify
personal, academic, and career interests and goal, plan learning experiences that prepare students for steps after high school, and to track and document progress.
• Demonstrate applied learning through a collection of evidence. Students build a body of evidence that demonstrates the application and acquisition of skills and knowledge related to their interests and post-high school goals.
• Demonstrate career-related learning knowledge and skills. These include capabilities in personal management, problem solving, communication, and teamwork, along with knowledge about the workplace and career planning and advancement.
• Participate in career-related learning experiences. This enables student to connect classroom learning with experiences in the workplace, in the community, or in school relevant to their interests and post-high school goals.
Similarly, Washington includes career objectives in its basic goals for graduating students; the states four primary goals are for students to be able to:
• Read with comprehension, write with skill, and communicate effectively and
responsibly in a variety of ways and settings; • Know and apply the core concepts and principles of mathematics; social,
physical, and life sciences; civics and history; geography; arts; and health and fitness;
• Think analytically, logically, and creatively, and to integrate experience and knowledge to form reasoned judgments and solve problems; and
• Understand the importance of work and how performance, effort, and decisions directly affect future career and educational opportunities.
In addition to course requirements that enable students to meet these goals, students must complete a culminating project in which they demonstrate their mastery of the third and fourth goals, above. Finally, students must have a High School and Beyond Education Plan, in which they detail their plans for further schooling or employment.
10. Expand “cross-counseling” efforts in high schools. Even the most academically successful students can waste valuable time in secondary and post-secondary education if they are not prepared to select and focus on a

112 www.public-works.org
specific course of study. West Virginia high schools should invite CTCs to assign personnel to their campuses to provide “cross-counseling” services. CTC counselors and admissions offices could provide vital information and guidance to students and parents by identifying high school study areas that will transition seamlessly into CTC programs.
Certainly, the best option is to place personnel at the high schools full time to answer academic and financial aid questions. But, if staffing resources are limited, post-secondary institutions should at least endeavor to make their counseling and admissions resources readily available. Southern West Virginia Community and Technical College has done this by having the CTC President and senior staff visit every high school in the region to speak to students and answer questions.
Strengthen PK-12/Higher Education Articulation
11. Improve educational outcomes and reduce costs incurred when students
must receive remediation in post-secondary education. Quite simply, too many West Virginia students are unprepared when they enter post-secondary education.
Almost 7 out of 10 students entering two-year colleges need developmental course work; almost 1 in 5 students entering four-year colleges need remediation.222
These numbers are far too high and translate into wasted time and money when students sit through the same subject matter multiple times in developmental courses.
Reforming secondary curriculum and student performance standards will certainly be the long-term solution to this problem. In the meantime, educators must do all they can to minimize the delays in the remediation process. The CTCS is working with three institutions to pilot a model developmental education program called Integrated Pathways to Adult Student Success (I-PASS), based on a Washington state program with a contextualized learning model which teaches basic skills in the context of technical skills. The CTCS plans to work with these CTCs to refine the I-PASS model and disseminate it to all West Virginia community and technical colleges. The System is also assessing other models for accelerating the developmental education process.223
Secondary and post-secondary educators must continue to work together to address the issue of remediation if the state is going to produce the skilled workforce it needs for the future.
12. Increase articulation agreements between secondary and post-secondary
institutions for Earn a Degree, Graduate Early (EDGE) credits. As noted earlier, the EDGE program presents West Virginia students with an opportunity to get a head start on their post-secondary education and earn a degree with substantial savings.

113 www.public-works.org
Presently, EDGE credits are not being recognized by all community and technical colleges. Furthermore, each school decides which EDGE credits it will recognize, often with little standardization or formal procedure. In some cases, CTCs will not recognize EDGE credits for high school or CTE Center classes even though these programs have received the same accreditation as the CTC’s own program. This lack of alignment and connectivity often creates confusion for students or worse prolongs their education (and increases their tuition bills) when they have to re-take courses at the post-secondary level. West Virginia needs a universal system of articulation agreements for EDGE credits, one which aligns coursework and credits across all high schools, CTE centers, and colleges in the state. In fact, a truly universal system would also include EDGE agreements with private training providers and private institutions wherever possible. Expanding the current number of EDGE articulation agreements -- or better yet, establishing a universal system of articulation agreements -- could be important first steps in developing a truly seamless curriculum for West Virginia’s students.
13. Maximize use of facilities, equipment and resources that can be shared by
CTE Center and CTCs. The West Virginia Community and Technical College System (CTCS) is in the process of designing, building and renovating facilities across the state with more than $78 million in bond proceeds and a $30 million appropriation for two advanced technology centers. As noted in CTCS’ Report to the Legislative Oversight Commission, the CTCS is also seeking another $120 million over the next four to five years for a second phase of construction and renovation projects.224
At the same time, the state’s Career Technical Education (CTE) Centers have an inventory of unused facilities and equipment that could be used to meet some of the CTCS needs. Specifically, the CTE Centers have state-of-the-art engineering and technical equipment that is rarely used during the weeknight evenings or on weekends. Leaders in both the CTC and CTE systems have recognized that there is a benefit from sharing facilities and resources, especially in rural areas that otherwise might be underserved. There have been successful examples of facility sharing such as the partnership of Southern West Virginia Community and Technical College to open a first of its kind classroom facility physically connected to the Lincoln County Comprehensive High School.225
Similar collaboration and joint planning is vital during the development of the state’s new Advanced Technology Centers (ATCs). While these Centers were intended to provide a “location for collaboration in the delivery of technical programs among community and technical colleges, secondary career-technical education and baccalaureate institutions,”226
the CTE programs have had a very limited role in planning meetings thus far.

114 www.public-works.org
Additionally, the CTC and CTE programs should explore opportunities to blend their technical program development and modernization funds to finance infrastructure improvements for both groups. Given the critical facility and equipment needs of all education providers and the state’s limited budget resources, all avenues to maximize existing facilities should be explored.
Estimated Savings The recommendations for enhanced collaboration and seamless student transitions will not produce direct savings of state funds. However, they will certainly save West Virginia students time and tuition dollars by improving their education and transitioning them more quickly into the workforce. Savings can be achieved by maximizing the facilities, equipment, and resources of the state’s Career Technical Education Centers and Community and Technical Colleges. CTE and CTC leadership should work together on a comprehensive study matching their collective infrastructure needs and assets to identify potential savings.
2.2. Supporting and Improving School Building Leadership and Classroom Teaching
The first step in achieving successful educational outcomes is setting high expectations. Then the state needs to empower educators in its schools and classrooms, as well as students, to meet those higher standards. Then, it can and must hold them accountable. West Virginia currently does not perform well on any of these accounts – although it is moving in the right direction on accountability. But on the most minimal of school standards – instructional time – the state lags behind the vast majority of states, not to mention foreign competitors. And improvement is needed in the support given the education profession. In the 2011 Quality Counts report, West Virginia’s overall grade (which includes measurements for Students’ Chance for Success; K-12 Achievement; School Finance; Standards, Assessments, and Accountability; Transitions and Alignment; and the Teaching Profession) is a B- . Although the State earned a B- for the Teaching Profession section, it received a C+ for two of the three aspects of the Teaching Profession examined: Accountability for Quality; and Incentives and Allocation. West Virginia scored even more poorly in the National Council on Teacher Quality’s assessment, The 2009 State Teacher Policy Yearbook. This report provides detailed analysis of each state’s policies that impact the teaching profession. The report considers five policy areas: delivering well prepared teachers, expanding the teacher pool, identifying effective teachers, retaining effective teachers, and exiting ineffective teachers. West Virginia’s overall grade? D+.

115 www.public-works.org
The most significant findings from these reports – things both sources highlighted – are the need for policies that ensure teachers are well prepared, and policies (in general) need to better connect to teacher effectiveness. The research overwhelming finds that the most important factor to keep in mind during policy-making is teacher effectiveness. Almost as important as classroom teaching is effective educational leadership. While much attention is focused on the quality of teaching, principals are often, unfortunately, overlooked. As with its teaching corps, West Virginia – like most states – needs to do more both to empower and strengthen principals, and to hold them accountable.
A. Mandate 180 Days of Instructional Time and Align Teacher and Support Personnel Work Calendars
Background and Findings West Virginia Code §18-5-45 provides detailed instructions for setting school calendars. While the language acknowledges the benefits of school instructional days, and establishes the goal of 180 days, the restrictions make it difficult for districts to have any flexibility in changing the calendar to ensure students do, in fact, have 180 days of instruction. As noted in the West Virginia Department of Education (WVDE) instructions,227
the restrictions on the beginning and ending dates for the instructional term were removed from the code, however, the 200 day employment term remains for educators and support staff and there are restrictions on how these days can be scheduled, including that the beginning and ending dates of the term cannot exceed 43 weeks for support staff. This means that some support staff with direct service responsibilities to students, for instance food service workers, get paid for 200 days per year even though students are in school for a maximum of 180 days or even less as discussed below.
In establishing the school calendar, districts schedule:
• 6 Outside of School Environment Days (OS) • 3 Continuing Professional Development Days (CE) • 2 preparation days (P), and • 1 additional day that districts may designate as either teacher/parent conference
days or an additional preparation day
In addition, districts must schedule five Instructional Support and Enhancement Days (IS) – three must be scheduled prior to the beginning of the instructional term. These days are considered instructional, however, the days are scheduled with both student and professional activities for teachers; the statute requires only two hours of each IS day be used for instructional activities for students.
WVDE estimates Unscheduled Closings (UC) days by calculating the average number of UC days in the prior three years. OS days, equivalent to the number of UC days (up to a
116 www.public-works.org
maximum of eight) must be scheduled after March 1 in the event OS days must be used to make up UC days. If more UC days occur than are scheduled, however, counties have few options to extend schedules to reach the 180 days. They can add to the school day or add instructional days to the calendar, however, they are required to extend the employment terms, that is pay additional compensation, to teachers and support staff for working the additional time. This scheduling complexity, and the requirement that additional days will incur additional costs, affects the number of instructional days students have in school and adds to the number of teacher and support staff paid days for which they are not working. A report from WVDE shows:
• No school district made 180 days during the 2009-2010 school year. In fact, o 34 districts were at 170 or less days – six percent fewer days than
recommended. o 27 of the 34 districts were at 169 days or less. o The lowest number of days was 160 in one school district – 10 percent
fewer days in school for the children of that district.
• Only 5 districts met the 180 standard during the 2007-2008 school year.
• Only 3 districts met the 180 standard during the 2008-2009 school year. The majority of states (29) require 180 days of school per year; 11 states require more than 180.228 By comparison, the school year in Europe is between 190 and 210 days and Japan is at 240 days – possibly being one of the elements for why U.S. students lag behind Europe and Asia, especially in critical subjects such as math and science. Most notably, research shows that lower-income students lose more ground during summer breaks than higher-income children.229
Time in school alone, however, will not improve student outcomes. What matters most is quality, instructional time. That is why it is important for policymakers to consider requiring the right kind of time, not just mandating days in a school calendar. A study completed by the Mackinac Center for Public Policy finds that “the correlation between time and achievement increases when students are given more instructional time, and is even greater when students’ academic learning time increases.”230
Typically, an extension of the school year would have some financial impact, however, this is not necessarily the case in West Virginia. WVBE should be able to recommend modifications to the restrictions now in code to make it possible for districts to have a 180-instructional day calendar year. Complicating this scheduling are rules concerning support staff calendars. Most support staff contracts allow for 200 days of work within a 43 week time period.

117 www.public-works.org
Recommendations
1. Revise West Virginia Code §18-5-45 to first and foremost require districts to provide a minimum of 180 days per school year of instructional time.
2. Require all instructional days to contain at least the minimum number of
instructional hours outlined in State Board Policy 2510, §126-42-7.2.4.c.
3. Revise code to abolish the 43 week limit.
4. Reduce the number of staff support days to reflect the number of instructional days and an appropriate number of training days.
5. Revise the code to provide consequences to districts for not meeting the 180 day, minimum number of hours per day thresholds.
6. Require districts to make up days that exceed the UC days estimated for
the year, including adding days to the end of the school calendar year, if necessary.
B. Launch a Comprehensive Plan to Recruit the Best Teachers and Improve Training and Licensure
Background and Findings Having effective teachers rises to the top of every study as the most important factor in determining student success.231
Highly qualified, effective teachers are more important than ethnicity, family income, what school a child attends, class size, type of teacher certification, or advanced degrees earned by a teacher in predicting student achievement.
Education Week recently summarized several studies that actually show a detrimental effect on teacher retention and student achievement when teachers are recruited late in the hiring cycle. A study in Michigan232 found that teachers hired after the beginning of the school year were twice as likely to leave the school after one year. Researchers from The National Commission on Teaching and America’s Future calculated the cost of losing a teacher at from $5,000 to $18,000.233
Other studies done by Harvard University’s Center for Educational Policy Research234
also found that teachers hired late in the hiring cycle, especially after the start of school, did not perform as well as teachers hired before school began.
Louisiana is one example of a state education system meeting the challenge of timely hiring to identify and attract the best candidates for teaching positions.235 Louisiana found that five applicants applied for every one open position yet between 31 and 58 percent of the candidates withdrew from the hiring process in August. The majority of

118 www.public-works.org
applicants cited late hiring decisions as the major reason for withdrawing from the process; these candidates took jobs where district commitments could be made more timely. As a result, the Louisiana Department of Education, working closely with school districts, initiated the Statewide Staffing Initiative. The initiative:
• Directs priority applicants to target schools, putting struggling schools at the front of the list.
• Trains principals in effective hiring.
• Provides personalized staffing assistance, helping districts project vacancies and
plan for recruiting and hiring.
• Works to overcome staffing barriers such as streamlining the hiring process, securing earlier budget projections (student count is completed in March for the following year), and advancing hiring timelines.
• Increases chances for retaining teachers by rewarding top performers,
addressing poor performance and helping teachers develop improved skills. Additionally, research indicates that although professional coursework is important for prospective teachers, content knowledge is also a critical factor in improving student achievement. Research also indicates that variances in teacher effectiveness are most often attributed to lack of content knowledge. As noted previously, the National Council on Teacher Quality (NCTQ) identified teacher preparation as an area in critical need for attention in West Virginia. West Virginia Hiring Procedures West Virginia’s system for recruiting and retaining teachers is not taking advantage of any creative, innovative or nationally proven mechanisms to recruit and retain high-quality teachers. The NCTQ found that some West Virginia policies limit the teacher pipeline. The current system, defined in detail in code, is extremely restrictive and provides no incentives or creative options for districts to attract or retain high-quality teachers, especially in low-income areas of the state. During this review, several interviewees cited examples of times principals will choose to employ long-term substitute teachers rather than hire a current employee, who on paper meets the criteria for the position, but whom they believe is not the best match for the job. West Virginia Code §18A-4-7a details requirements for the filling of professional staff vacancies through new hires, promotion or transfer. The rules, in practice, severely limit a principals ability to recommend for hiring the most qualified and best person for a position if that person is a new employee to the system. Section §18A-4-7a(d), while intending to permit the hiring of the most qualified teacher, in effect defines the most qualified as a teacher in good standing already employed by the county. It further places the burden on the principal of requiring “If the applicant with the most seniority is not

119 www.public-works.org
selected for the position…a written statement of reasons shall be given to the applicant with suggestions for improving the applicant's qualifications.” As noted by NCTQ, most states including West Virginia, do not require assessments to ensure teachers have scientifically-based knowledge of reading instruction or math content. Elementary licensing tests, not only do not have sub-scores for understanding the science of reading and math content, but also overall passing test scores on the Praxis II exam are set far below the mean – creating a situation where it is possible to pass the overall test but fail subject areas if sub-scores were computed. Getting the Most from Alternative Programs A February 2010 study from Harvard University found no significant difference in student performance between alternatively and regularly certified teachers.236 One good example of this alternative approach is the Teach For America (TFA) program – a program that recruits recent college graduates to teach in high-need schools for at least two years. While not the total answer to teacher shortages, the growth of the program since its inception in 2001 alone indicates the program is helping to address critical teacher needs, especially in low-income areas. Studies on the effectiveness of TFA teachers are reported to be mixed, however, more recent researchers find, as an economist from the University of Washington indicates “The weight of the evidence suggests that TFA teachers as a whole are at least as effective as other teachers in the schools they end up in.”237
Another method of alternative recruiting that West Virginia is not taking advantage of is the hiring of foreign nationals – people who are legally residing in the United States and who, in many cases, have credentials from excellent higher education institutions and in hard-to-fill subjects such as math and science. West Virginia Code §18A-3-12 grants the State Board of Education the authority to issue “certificates except in the case of a foreign national who meets the requirements to teach who can only be issued a permit.” These permits must be renewed yearly and put foreign national teachers at a disadvantage compared to certificate teachers. Certificate teachers receive increments for additional studies and can apply for a salary adjustment based on the completion of each course. Permit teachers can only receive an increment when the degree or complete course of study is finished. These restrictions establish a disincentive for highly-qualified foreign nationals to teach in West Virginia.
Recommendations The West Virginia Board and Department of Education should:
1. Modify code and policy to change hiring practices to allow for the filling of professional staff vacancies with the most qualified person regardless of seniority in the district.
2. Establish a Teach for America program to recruit teachers for hard-to-serve
areas.

120 www.public-works.org
3. Establish a Teacher Recruitment Work Group, with representatives from
the counties, to develop innovative ways to identify and hire qualified teachers.
4. Provide flexibility to alternate route teachers in demonstrating content knowledge. The State should allow such candidates to illustrate their subject-matter knowledge with a vigorous test without also requiring a major in the field.
7. Require new teachers to have a reduced workload. New teachers need time to observe experienced teachers during school day and additional time for lesson planning. Time also needs to be available for new teachers to meet and debrief with the teachers they observe, meet with their mentors, and participate in additional professional development.
8. Ensure that elementary teachers know the science of reading. While
teacher preparation courses must provide training in the science of reading, teacher candidates should be assessed in these skills and demonstrate the sufficient knowledge prior to licensure.
9. Ensure that elementary teachers know elementary content math. Similar to reading, elementary school teachers need mathematical education coursework, not just general math coursework. The state should require teacher preparation programs to include math content geared to elementary educators – including coursework in foundations, algebra and geometry, and some statistics – and require teacher candidates to pass a rigorous mathematics assessment test.
10. Ensure that elementary content tests adequately assess content knowledge in each subject area. Instead of only requiring teacher candidates to pass a Praxis II general subject-matter test, the State should require separate passing scores for each area. Currently, West Virginia’s passing score is set so far below the mean that it is unclear if it provides any assurance of content knowledge, let alone knowledge of individual subjects.
11. Ensure that special education teachers are adequately prepared to teach subject matter. Currently, West Virginia allows special education teacher applicants to demonstrate subject area knowledge in only one academic area. Since special education teachers are often called upon to teach multiple subjects, the state should require teacher preparation programs to have candidates knowledgeable in two areas.
12. Ensure that teacher preparation programs (traditional and alternate route) are accountable for the quality of the teachers they produce. When approving teacher preparation programs, West Virginia should look beyond licensure pass rates. The State should collect data to provide an index of program performance, including average raw scores of graduates on licensing tests (including basic skills, subject matter, and professional knowledge tests); satisfaction ratings of the programs’ student teachers (by school principals and teacher supervisors); academic achievement gains of students taught by

121 www.public-works.org
programs’ graduates over the first three years of teaching; and five-year retention rates in the teaching profession. The State should set minimum standard performance levels for each area.
13. Establish more comprehensive coursework requirements geared to the areas of knowledge needed by elementary school teachers and base the licensing test on those standards.
14. Strengthen middle school teachers’ subject matter preparation. Middle school teachers who plan to teach multiple subjects should earn a minor in each of those academic areas. Middle school teacher candidates who intend to teach a single subject should earn a major in that area.
15. Require all teacher preparation programs to meet state approval and not just national accreditation. Currently the State has ceded oversight authority of these programs to accreditors.
16. Provide scholarships at state universities for aspiring teachers, and for active teachers seeking to pursue advanced degrees who pledge to remain in West Virginia schools for five years or to teach in low-income districts that are hard to serve.
17. Hold teacher preparation programs accountable for the quality of their graduates. A major weakness in the teacher quality equation is linked to the fact that most states do little to hold teacher preparation programs accountable for their admissions standards, program content, or, most importantly, the quality of their graduates. Research shows that the more quality preparation teachers have, the more effective they will be. West Virginia should implement a program similar to the one recently enacted by the State of Texas, which is strengthening its standards for colleges of education and teacher preparation programs after being criticized for producing weak instructors. If Texas’ teacher programs fall short of the standards set forth, they could potentially lose their state accreditation.
C. Establish an Evaluation System Modeled Based on National Best Practices and Research
Background and Findings West Virginia has followed best-practice and moved to a statewide method for measuring teacher impact on student growth. Current West Virginia code §18A-7-12(e)(2) defines the frequency and duration of evaluations for teachers – “…for classroom teachers with five or more years of experience who have not received an unsatisfactory rating, an evaluation shall be conducted or professional growth and development plan required only when the principal determines it to be necessary for a

122 www.public-works.org
particular classroom teacher, or when a classroom teacher exercises the option of being evaluated at more frequent intervals.” Recently, WVDE, in collaboration with the West Virginia Teacher, Leader and Counselor Evaluation Task Force, established a pilot project in 25 schools to evaluate possible revisions to the current evaluation system. This pilot puts West Virginia on the right track and, when implemented statewide, will place the state education system in the group of states nationally that are working to use teacher evaluations as a tool to support teachers and identify areas for improvement if needed. National research and best practice clearly shows that the best predictor of student achievement is effective teachers and the best predictor of teacher effectiveness is past performance, not a teacher’s route to certification, advanced degrees or experience level.238
For school leaders to know students have the most effective teachers, they must have a fair and accurate way to gauge teacher performance.
The New Teacher Project,239
a non-profit organization founded by teachers, outlines six guiding principles for education systems when establishing a teacher evaluation system. Evaluation systems should:
• Be conducted at least annually regardless of ability or years of experience.
• Be clear and rigorous – based on evidence of student progress.
• Include multiple measures, primarily student academic growth.
• Have four or five rating levels to describe teacher performance – highly effective, effective, needs improvement, ineffective – in order to provide a clear picture of performance to teachers both within a school and across the district.
• Provide for frequent observations and constructive feedback, using regular
conversations with teachers to discuss performance, student progress, goals and identification of tools that will help teachers improve.
• Have some significance in terms of both positive and negative consequences,
such as factoring in evaluation results into decisions about tenure, compensation, hiring, promotion and dismissal.
This pilot addresses several of the issues that are part of the current West Virginia system. Most notably, this pilot applies to all teachers and, when implemented statewide, will require annual evaluations of teachers regardless of their years of experience or status. In addition, it provides for ratings’ levels, includes observation and feedback, and includes opportunities to plan additional supports for teachers who need improvement.

123 www.public-works.org
Recommendations Some refinements to the new system that should be considered as the pilot unfolds include:
1. Increase the percentage of points attributed to student learning. As noted in
the Educator Evaluation Guide, “Student Learning is the single, most important goal of education.” Yet the rating system in the new pilot attributes only 20 percent of the evaluation score to improving student performance and five percent to school improvement. To make the evaluation more outcome oriented – for the most important outcome of student improvement – the WVBE and WVDE should consider increasing this percentage. Measures of teacher impact on student growth should be a substantial—but not the only— factor in a teacher’s evaluation. The current plan is to make student growth 25 percent of the teacher evaluation in West Virginia; this should be raised to at least 51 percent.
2. Work closely with district leadership to ensure sufficient time is built into schedules to complete evaluations as planned. Change is difficult and the demands on principals can be overwhelming. There is, however, no other more important task than for principals to ensure good, high-quality teachers are in every classroom. Ensuring sufficient time is set aside for evaluations will solidify this commitment to have high-quality teachers in every classroom.
3. Identify others in the school learning community such as mentors, peers,
coaches, etc. who can be part of an evaluation team for teachers.
4. Ensure that teachers and administrators receive data on impact on student growth in a timely fashion.
5. Work on a long-range plan that will tie consequences to the evaluation, including such things as compensation, tenure, hiring, promotion and dismissal.
6. Connect tenure decisions to teacher effectiveness. Currently teachers receive tenure virtually automatically when their probationary period ends after three years. The State should require a clear process for districts to use when considering awarding tenure, such as a hearing, in order to ensure that a teacher’s performance is reviewed and found to be effective.
7. Prevent ineffective teachers from remaining in the classroom indefinitely. Ineffectiveness should be made grounds for dismissal by the state in order to support districts that might feel they lack a legal basis for terminating poor performers. While West Virginia requires teachers who receive unsatisfactory evaluations to be placed on improvement plans, it should go further. Oklahoma, for example, recently adopted legislation that requires tenured teachers to be terminated if they are rated “ineffective” for two consecutive years, or rated as

124 www.public-works.org
“needs improvement” for three years running, or if they do not average at least an “effective” rating over a five-year teaching period. The State should allow appeals to occur only once, at the district level, and with adjudicators who have educational expertise.
8. Use data reporting to help establish an equitable distribution of effective teachers among schools. While West Virginia does report on the percentage of highly-qualified teachers in each school, it should expand its data collection and reporting. Individual school report cards should include an index of teacher quality with data such as teachers’ average SAT or ACT scores, the percentage of teachers failing basic skills licensure tests at least once, the percentage of teachers on emergency credentials, the selectivity of teachers’ undergraduate colleges, the percentage of new teachers, and teacher absenteeism and turnover rates. These data can be used to address staff quality and stability issues.
D. Improve Teacher Compensation to Help Attract and Maintain the Best Teaching Corps Possible
Background and Findings Superintendent Marple and the State Board of Education recognize that “[s]alary is a determining factor for career choice”240 but West Virginia historically has performed poorly on this measure. There has been improvement in recent years, however, with West Virginia moving from 45th in the nation in teacher salaries in 2008-09 up to 40th in the last school year, according to the National Education Association.241
Nevertheless, West Virginia salaries remain below competitive levels both nationally and regionally.
The proper level of teacher salaries for the state is a matter of policy beyond the scope of this efficiency review – although it hardly would be surprising to observe that West Virginia cannot hope to attract and retain the highest-quality teachers when it pays them at almost the lowest levels in the nation. While the Governor and legislature did raise salaries in 2008-09 and 2011-12, West Virginia still remains at one of the lowest levels in the country. Even compared to other education personnel in West Virginia, it would be fair to say that, if what they are paid is an indication, then teachers are the least valued part of the state’s education structure.242
That runs counter to the objectives identified in this report.
Whatever the level of compensation, the manner in which that compensation is structured, allocated and paid is a proper object of an efficiency study, and so this review examined that subject from the perspective of how well West Virginia teacher compensation structures serve the objectives of best utilizing the state’s education resources and improving educational outcomes – specifically, in attracting and retaining the best classroom teachers. For this purpose, we examined teacher compensation policies in eight states, including West Virginia, its neighbors (Kentucky, Maryland, Ohio, Pennsylvania, and Virginia), and the states closest to it in population (Nebraska and New Mexico).

125 www.public-works.org
Of the states examined in this report, four had no State-established minimum salaries. Of the others, three have State-established minimum salary schedules (Kentucky, Ohio, and West Virginia), and one has State-established minimum salaries for each of its three licensure levels (New Mexico). The difference between a minimum salary schedule and minimum salaries is that a minimum salary schedule lays out the minimum salary at every educational and experience level, whereas a minimum salary just creates a level initial playing field. In practice, minimum salary schedules are more restrictive on districts’ ability to make salary decisions based on their resources, needs, and priorities. West Virginia utilizes an annual minimum salary schedule for teachers, established by statute, WVC §18A-4-2. The school funding formula is based on teacher ratios and teacher compensation. Each school district receives an allowance to pay the annual state minimum salary based on degree classification and years of experience. Districts are allowed to create their own salary schedules so long as these minimums are met. The comparison states exhibited a range of alternatives:
• Kentucky’s biennial budget salary schedule for teachers is based on years of experience and credential earned. The state allows districts to add to the salary schedule. According to one report, “This practice has led district salaries to vary considerably, depending upon available resources, other plans and needs, the age and rank distribution of teachers within the district, local cost of living concerns, ‘market’ conditions, and the like…. the minimum salary schedule has not been used by many districts in recent years.”243 In addition, Kentucky statutes require local districts to pay an annual salary supplement of $2,000 to teachers who attain National Board for Professional Teaching Standards certification and are employed as teachers or mentors in the field of the national certification.244
• Ohio currently sets a minimum salary schedule in statute, like West Virginia. However, an Ohio Department of Education employee reported that the state is moving away from this compensation structure and will likely move toward merit-based pay in the next few years. Ohio law also stipulates that teachers must possess a Master’s degree by their 14th year of service. Ohio currently includes teacher salaries as part of the base formula when determining school funding. However, the state is also in the process of changing its funding formula.
• New Mexico has a three-tiered licensure system.245
For each tier, teachers are guaranteed a certain minimum salary. New teachers must possess a Baccalaureate degree to teach in a core area (such as fine arts, language arts, math, languages, reading, science, or social studies), pass all required licensure tests, and earn full state licensure. New teachers are issued a 5-year, non-renewable Level I license (“Provisional Teacher”) and are guaranteed a minimum salary of $30,000.
To remain a teacher in the state, by the end of the 5th year, teachers at Level I licensure must progress to Level II (“Professional Teacher”). Requirements for

126 www.public-works.org
Level II include completion of an approved mentoring program, completion of at least three full academic years of teaching at Level I, and demonstration of increased skills in the nine teaching competencies as determined by the Public Education Department. Level II teachers are guaranteed a minimum salary of $40,000.
Advancement to the highest level, Level III-A (“Instructional Leader”), is optional. To advance to this level, teachers must earn a Master’s Degree or National Board for Professional Teacher Standards Certification, complete at least three full academic years of teaching at Level II, and demonstrate the nine teaching competencies. Level III-A teachers are guaranteed a minimum salary of $50,000.
• Maryland, Nebraska, Pennsylvania, and Virginia all lack annual minimum teacher
salaries. None of these states have a statewide minimum teacher salary schedule; salaries are left entirely up to the districts. The State of Nebraska is considering legislation to pilot merit-based compensation salaries in some districts. Virginia also offers several statewide financial incentives for teachers:
o Virginia Performance-Pay Incentives Initiative – A competitive-grant
program providing performance payments of up to $5,000 for exemplary teachers in schools that may have difficulty attracting, retaining and rewarding experienced, fully licensed teachers.
o National Board Certification Incentive Awards – An initial award not to
exceed $5,000 awarded to individuals who are fully licensed and employed as a teacher and who were awarded National Board Certification while teaching in Virginia. Continued awards not to exceed $2,500 annually are available for the life of the certificate and awarded to individuals who continue to maintain the certificate, licensure, and employment in the state as a teacher. The individual must meet the definition each year the award is granted.
o Virginia Middle School Teacher Corps – The Virginia Middle School
Teacher Corps seeks to reinforce the quality of mathematics instruction in middle schools and to help ensure that students receive a solid foundation in mathematics as they prepare to enter high school. This initiative addresses middle school mathematics, one of the top 10 areas of critical teacher shortage in 2010-2011. The Teacher Corps also provides support for middle schools likely to have difficulty finding qualified mathematics teachers to comply with the No Child Left Behind Act of 2001. Eligible schools can seek funding to provide up to a $10,000 annual salary differential for the Teacher Corps member. If a Teacher Corps member currently is teaching at an eligible school, the school division may apply for funding to provide a $5,000 annual salary differential for the Teacher Corps member.

127 www.public-works.org
Two factors to consider in evaluating which type of compensation policy is most effective at attracting and retaining good teachers are relative competitiveness and salary schedule structure.
Relative Competitiveness One tool to evaluate a state’s relative competitiveness in terms of teacher salaries is the Teacher Portal’s Teacher Salary Comfort Scores.246
The Teacher Portal is a teacher-support website that provides information for every state on requirements for becoming a teacher, average teacher salaries, and other information of general interest to teachers. Teacher Salary Comfort Scores examine average salaries for each state (both starting and overall) and compares them to each state’s cost of living. States are then ranked by this metric to determine which states are easiest for teachers to live in from a salary perspective. Low rankings indicate better salaries given the state’s cost of living.
Table 28: Teacher Portal’s Teacher Salary Comfort Scores and Salary Information
for Select States
State Salary
Comfort Score
State Established
Minimum Salary?
Average Starting Salary
Average Salary
Salary Last Year
Salary Raise Last 10 Years
Kentucky 15th Yes $30,619 $42,592 4.0% 28.8%
Maryland 37th No $37,125 $54,333 3.8% 32.0%
Nebraska 17th No $29,303 $40,382 2.4% 28.2%
New Mexico 29th Yes $33,730 $41,637 5.7% 43.2%
Ohio 6th Yes $33,671 $50,314 3.3% 33.0%
Pennsylvania 5th No $34,976 $54,027 1.4% 17.2%
Virginia 25th No $33,200 $43,823 2.5% 26.0%
West Virginia 40th Yes $30,858 $38,284 (0.2%) 19.1% When considering West Virginia and the neighboring states with which it may be competing for teachers, West Virginia ranks the lowest in terms of Salary Comfort (40th), significantly lower than Pennsylvania (5th), Ohio (6th), Kentucky (15th), and Virginia (25th), but only slightly lower than Maryland (37th). The states in our survey are equally split in terms of whether they have State-established minimum salaries, and nearly equally split in their Salary Comfort Ratings. Ohio, Kentucky, New Mexico, and West Virginia have State-established minimum salaries and rank 6th, 15th, 29th, and 40th, respectively; Pennsylvania, Nebraska, Virginia, and Maryland do not and rank 5th, 17th, 25th, and 37th, respectively. In this sample at least, there is no correlation between the existence of State-established minimum salaries and how competitive teacher salaries are.

128 www.public-works.org
Salary Schedule Structure
Nationally, the prevailing method for setting teacher salaries is with a schedule based on experience and education. While some schools and districts have experimented with merit-based pay, and both Ohio and Nebraska are considering adopting or piloting it in some districts, it has not been widely adopted. If a state or district is going to stick with the traditional experience and education-based salary schedule, the next question is, how best to construct that schedule to attract and retain good teachers? We found two research reports that examined this question in depth – one of which explicitly examined West Virginia’s compensation system. The first report was from the National Council on Teacher Quality (NCTQ). The NCTQ advocates for reforms in a broad range of teacher policies at the federal, state, and local levels in order to increase the number of effective teachers. Its yearly publication focuses on different topics; in 2008, the focus concerned what states can do to retain effective new teachers.247
NCTQ focused on three goals, including retaining teachers deemed effective. West Virginia earned a D. Specific recommendations for the state pertaining to pay scales included:
1. Not requiring districts to adhere to a state-dictated salary schedule that sets minimum pay for every level as this practice limits districts’ flexibility;
2. Discouraging districts from tying additional compensation to advanced degrees as research has shown “unequivocally” that advanced degrees do not impact teacher effectiveness;
3. Discouraging salary schedules that only reward experience and thus imply that teachers with the most experience are the most effective;
• Encouraging districts to provide a significant pay increase when teachers are awarded tenure, provided tenure is based on sufficient data to determine effectiveness; this policy would provide an incentive for quality teaching and improve retention because it demonstrates to new teachers that they will be rewarded for success once their probationary period is over; and
• Discouraging longevity bonuses, which are awarded at the end of teachers’ careers and are not an effective retention strategy.
A second report by researchers at the University of Missouri and the University of Southern California complemented some of NCTQ’s recommendations. It argued that districts benefit from providing greater salary returns to teachers early in their careers – not back loading salary schedules with bigger increases with more years of experience and longevity bonuses. These researchers matched salary data to school-level student performance data on math and reading achievement tests across states and find that frontloaded salary schedules are associated with better performance in multiple grades and across the achievement distribution.248

129 www.public-works.org
Recommendations
1. Encourage districts to tie compensation to teacher effectiveness, not just advanced degrees and number of years of teaching experience.
2. Support retention pay, such as significant boosts in salary after tenure is awarded, for effective teachers. West Virginia should encourage districts to provide a significant pay increase to teachers awarded tenure, provided tenure is based on sufficient data to determine effectiveness as discussed above. The state should not support longevity bonuses, which are awarded at the end of teachers’ careers and do not assist with retention.
3. Encourage districts to provide compensation for related prior subject-area work experience. The State should encourage local school districts to compensate new teachers with relevant prior work experience. Districts should consider starting these new teachers at an advanced step on the pay scale.
4. Support differential pay. Differential pay initiatives could be offered by the state in shortage subject areas and high-needs schools to obtain a more equitable distribution of effective teachers. Districts could also be encouraged to provide differential pay for teachers taking “advanced roles” (such as master teachers or mentors), and/or for the attainment of specific skills tied to improving student learning.
5. Ensure that pension systems are neutral. To treat teachers more equitably, regardless of when they started their careers, and to discourage early retirement by effective teachers, the state should raise its retirement age to align with Social Security and not years of service.
6. Create career ladders for teachers. A career ladder allows teachers to earn more by taking on additional roles and responsibilities. For example, teachers can provide professional development, become mentors, or take shared leadership responsibilities with principals.
7. Create a rural homesteading program that would arrange very low-cost loans for new teachers who agreed to live and work in a rural community for 5 years. Teachers and students in teacher education programs would be eligible for the loans provided they met borrowing criteria and signed a contract to teach for 5 years in rural West Virginia, the Eastern Panhandle or other communities experiencing severe teacher shortages. We recommend a “Homesteading Trust Fund,” with a state appropriation of $5 million recapitalized every seven years, through the West Virginia Housing Development Fund. Mortgages would be provided by guaranteed lending organizations. At current rates the program would serve about 35 new borrowers per year at an average annual subsidy per borrower of $5,051.16.

130 www.public-works.org
8. Initiate a substantial loan forgiveness program for students majoring in designated shortage areas. For each year of successful teaching service, one year’s stipend would be forgiven. Stipend awards would be paid on a semester basis. Loans could supplement scholarship programs such as the Promise Scholarship or the Underwood-Smith Teacher Scholarship Program, or serve as stand-alone awards. The stipend could be used for tuition, fees, books, room and board and other related expenses. Participants would be required to maintain a B or 3.0 average in their course of study to maintain eligibility. Ballpark cost: $1,500 per semester = $3,000 per year to 400 awardees = $1.2 million/year initially, rising to $4.8 million/year when fully phased-in.
9. Offer higher salaries to teachers who choose to be judged on merit. The West Virginia Executive Teachers Corps would be the nation’s only state-level experiment with a true pay for performance system. It would challenge the state’s most highly accomplished teachers to accept higher paying, higher risk positions in the state’s failing schools. The Executive Teachers Corps would begin as a limited pay-for-performance pilot program. With proven results, it would revolutionize education not just in West Virginia but for the United States. Executive Teachers would volunteer to forego standard raises negotiated by the teachers’ unions in return for merit-based pay. Corps teachers would receive a 25 percent salary increase for: • Meeting exceptional annual performance requirements;
• Serving in under-performing schools; and
• Sharing their teaching expertise with less experienced teachers.
West Virginia would pilot the Executive Teachers Corps program over a period of three years. District administrators of schools in need of improvement would annually negotiate separate temporary contracts for teachers participating in the Corps. Executive Teachers would be based in designated schools “in need of improvement,” where they would have the most impact. States like Alaska, Colorado, Massachusetts, Texas and Mississippi have paved the way for changes in this complicated area. The Hillsborough County (Florida) Public Schools have received a seven-year, $100 million grant from the Bill and Melinda Gates Foundation to reinvent education throughout the district, and, as part of this initiative, the Hillsborough Classroom Teachers Association has agreed to work with the school district to create a voluntary teacher compensation system that ties pay to student performance instead of seniority: Current teachers have the option of staying under the current traditional pay system or opting to be evaluated under the new pay-for-performance system; new teachers will enter the performance-pay scale. The system is costly, but could be paid for by increased cigarette taxes. Ballpark cost: $16.88 million, based on 1,500 participants over 3 years receiving an average bonus of $11,250 each (25 percent of $45,000).

131 www.public-works.org
E. Strengthen School Leadership by Investing in Principals
Background and Findings The job of the principal “has to be one of the most challenging in today’s society – as well as one of the most important.249
Principals are the CEO’s of our schools. As we expect more of our students than ever, more will be expected of our schools’ management. We cannot hold principals to the highest standards of performance without providing them adequate resources to succeed.
Principal leadership is the single most important indicator of whether any education reform effort will succeed or fail at the school level. The importance of principal leadership is one of the key findings of a five-year University of Miami study on the results of the South Florida Annenberg Challenge (SFAC). The Annenberg Challenge provided $500 million in private and public grants to 18 local educational reform efforts around the country.250
A total of $100 million was raised for the South Florida program, including $66 million in private sector and community funds, a statewide record for a K-12 educational initiative that impacted 385 schools with a focus on at-risk children. SFAC schools showed statistically significant gains in reading, writing, and math, outpacing other Florida schools in test-score improvement, particularly at the elementary level. Principal empowerment is first among three areas identified by the University of Miami SFAC study for future concentration. Among the report’s conclusions:
• Principals are the catalysts and facilitators of change. Principals must be empowered to link the vision and the reality. Reform flourishes under an empowered principal who shares decision-making, advocates for their school, and develops partnerships.
• School environment is closely correlated to high test scores – and principals are
central to creating the environment that supports academic success and helps all stakeholders to understand and support change.
While the strong leadership role of principals is essential in improving the performance of our schools, the U.S. Department of Labor estimates that 40 percent of the country’s principals are getting ready to retire.251
And the job has become far more complex, and harder to fill, than in years past. Principals report spending more time on legal concerns, budget, and social service issues than principals of prior generations. Principals must be trained in and given access to new tools, and empowered to navigate the increasing complexity of their roles. The range of tools and information resources available to principals for tackling problems and implementing goals must be expanded as it has been in other states. For instance:
• Florida makes a Professional Developmental Initiative (PDI) available online to provide instantly accessible, locally relevant information to help principals manage their schools and efficiently troubleshoot the many problems encountered by school leadership – from the mundane to the unforeseen – through a “Principal Portal.”252

132 www.public-works.org
• The nation’s largest school districts now use web-enabled professional
development programs such as Accelerated School Administrator Program (ASAP) to proactively manage their human resource development, and ensure a continual pool of qualified school leaders. Using professionally developed training materials that are aligned with district and state standards for educational leaders, ASAP offers individualized online learning to prepare teachers and administrators for new leadership roles.253
• Several states, such as Louisiana, Arkansas, Kentucky, Maryland, and Ohio, have tired systems that provide an initial certificate when basic criteria are met, then provide a more advanced-level certificate once candidates have completed a period of induction and demonstrate their capacity for leading a school. Houston and Pittsburgh tie principal bonuses to student performance.254
• Depending on the state and district, leading schools increasingly control a larger proportion of their district’s budget, from a low of 41 percent in Hawaii to a high of 90 percent in Edmonton, Alberta, Canada. Before New York City moved to a reform program, a typical school controlled around 6 percent of its own budget; after reform, it controls up to 85 percent. At John Hay Elementary in Seattle, prior to reform, the principal controlled a budget of $25,000 per year; with new discretion over a budget of $2 million a year, the principal and teachers decided together to reorganize their teaching resources. From 2001 to 2005 standardized math scores went from the 32nd to the 64th percentile.255
• In New York City, 22 local training teams serve 500 schools in order to develop support structures and to transition to site-based management. The most recent survey results indicate 95 percent of principals are satisfied with the support provided.256
West Virginia recognized the importance of school leadership in the creation of the Global21 initiative in 2006. One element of this initiative was the creation of the West Virginia Institute for 21st Century Leadership, designed to help principals transform schools for the future. The goals of the initiative are:
• Development of statewide leadership standards;
• Design of a leadership development continuum;
• Development of policy and practices that affect leadership development and support.257
Recommendations
1. Remove barriers for talented individuals to enter the profession. For
example, a minimum number of years teaching experience may deter promising principal candidates, such as those from other youth-serving fields such as social work or youth development who instead should be allowed to show evidence of

133 www.public-works.org
teaching, leadership, or youth development experience. Although these candidates might require additional coursework on curriculum and instruction, they should not be barred outright from the profession.
2. Give principals control over school staffing and scheduling. Principals will have increased decision-making powers over budgeting, teacher recruitment, programs and policies.
3. Allow principals to have discretion to spend the school budget on the best programs and services for students.
4. Give principals the freedom and responsibility to:
o Decide whether to purchase supplies and advisory services from the
school district – or not. o Set longer school days and school years for both students and faculty. o Reduce work rules to will help staff meet the school mission. o Hire and release teachers in order to best meet their students’ needs.
Released teachers return to the district pool where they can be picked up by other schools.
5. Introduce a multi-tier licensure system and tie salaries to licensure level.
6. Encourage districts to use differential pay to motivate principals. Not only
can such increased salary be used to recruit principals to high-need areas, it can also be used to encourage principals to implement efforts to boost student learning.
7. Evaluate principals at least annually. Evaluations should be based on both student achievement and other measures.
2.3. Making West Virginia the Leader in Remote Technology and Distance Learning
Background and Findings The future of education is on-line learning. But, as former US Secretary of Education Rod Paige has written, “Education is the only business still debating the usefulness of technology.”258
West Virginia’s Legislature has recognized the value of technology in the classroom, particularly on-line courses, by creating the West Virginia Virtual School (WVVS) in 2000. Later the legislature required public schools offer equal access to technology, proficiency in basic computer skills, and technology integration in all programs of study for K-12 students. (126CSR46). In addition, §126-42-5.6 requires that all high school students “shall be provided integrated opportunities within the core requirements to

134 www.public-works.org
master… technology and recommends that all high school students…complete an on-line learning experience”. To operate the virtual school and provide technology and professional training, the West Virginia State Board of Education has required that the counties support a county technology team, create a comprehensive technology plan, include computer skills in all programs of study, provide facilities and technology, and provide staff technology training. Schools are required to plan for technological inclusion in facilities, provide a technology team and a comprehensive technology plan, including staff development plans, and ensure that computer/technology skills be taught and used in classes. Today’s students have grown up with technology, and many if not most, students are more comfortable learning on-line than by traditional methods. A recent 93 page report on on-line education conducted by SRI International for the federal Department of Education, finds that: “On average, students in on-line learning conditions performed better than those receiving face-to-face instruction.”259
West Virginia: An independent, federally-funded study of West Virginia’s on-line Spanish I course stated that “In classes where technology works well, and students have access to the necessary tools (e.g., enough headsets and microphones): students learn more Spanish (and) students are more engaged.” The study also reported that the “… success of the Spanish program suggests that it could easily be replicated with different languages.”
Experts agree that technology in schools and on-line courses improve learning. The studies noted below illustrate this point.
Also in West Virginia, another federally-funded, independent study affirmed the positive effect Technology Integration Specialists (TIS) had on student gains in mathematics and reading scores when students and teachers used technology. (TISs are specially trained professionals who help teachers use technology to improve learning.) The study found that the “Technology Model Schools (TMS) dramatically increased the use of technology by teachers and students in classrooms, and that increase is associated with gains in mathematics and reading/language arts.”
North Carolina: In three years, the Mooresville Graded School District rose to fourth from 30th place in the state’s school performance measurements rankings when the laptop to student ratio of 1 to 1 was achieved and teacher equipment and training was improved.
Alabama: After creating the third-largest virtual school in the county (ACCES), the state’s graduation rate increased from 62.1 percent to 69 percent, a 4.3 percent increase over the national average. In addition, students taking AP exams doubled from 2004 to 2010 and the number of qualifying scores more than doubled. California: Primarily low-income elementary students rose to the top of the state’s test scores when they used part of their school day to work on lab and language arts skills. These students outperformed more affluent students in schools without learning lab technology.

135 www.public-works.org
Most objective reports caution that teaching is not a “one size fits all” endeavor and that includes the use of technology. Studies indicate that all types of learners can become more successful students when they use technology but that the technology, course design, teacher preparation, and administrative approaches and instructional factors are critical to success. For instance, studies indicate that virtual schools help both the extroverts and introverts. The former type of student tends to succeed in interactive courses while introverts perform better in self-paced courses. Virtual schools and technology can fix the disconnect between student need and school resources: academically talented students can take a wide range of AP courses through on-line courses, students behind in school can catch up by using technology written for that purpose, and students who have failed can retake a course for credit recovery. West Virginia law (126SCSR 48-3.2 ) allows on-line courses when ”curriculum content cannot be delivered because there is a shortage of certified personnel, a need to provide low-incidence courses, a need to offer a course while the teacher/facilitator renews course-related skills, or any other validated student need to access technology delivered courses.” Following the requirement of this statute, the WVVS provides on-line courses in three ways.
• The state leases the content through tuition agreements with external entities like the Florida Virtual School and the Southern Regional Educational Board (SREB) Co-op. These groups provide curriculum and on-line teachers while the state or county provides the technology and a classroom proctor.
• Alternatively, the external providers offer only class content while the state or
counties provide the technology and a face-to-face or an on-line teacher. • The WVVS or a county creates a course and trains the teachers.
West Virginia does not provide a full-time or part-time on-line school, allowing students to combine traditional class work with a significant portion of class work able to be done on-line. Instead, on-line course work has been viewed as a supplement to traditional classes. The state offers courses for credit such as Advanced Placement (AP) classes, credit recovery classes for students who have failed a course (“onTargetWV”), and provides targeted on-line assistance for students in danger of failing a course. The introduction of the TechSteps program has helped teachers infuse technology into traditional instruction and helped teachers focus on subject matter while also teaching technology skills. WVDE has developed only one core curriculum course – Spanish I – at a cost of about $250,000. Counties and schools can develop or purchase on-line courses, and these need not be WVDE approved if not part of the state’s core curriculum. Concern was expressed, however, that some of these courses are not good quality and do not meet student needs. A majority of the Southern Regional Board states believe that only the State Board of Education should offer virtual courses so as to reduce duplication of effort and resources.

136 www.public-works.org
Like most states, West Virginia has targeted its on-line courses to high school students. Of the over 200 courses available, the vast majority are for high school students.
Funding and Equipment All purchased courses are paid for on an as-needed basis because they are leased from outside vendors, except for Spanish I, which is owned by the state. WVDE’s policy is to pay the full course fee for the first ten students who take the same course in the same county. Should additional students in that same county take the course, then the county or school must pay the first $200 of the tuition for these students. If tuition is over $200, then the state pays for any remaining tuition costs. (typical cost of a course is $200 to $850 per student). All West Virginia schools have internet access though about $4.1 million is needed to provide sufficient broad band service so that all high schools can take advantage of on-line courses. Every school has student computers: the ratio of devices to students is better than the national average at 5-to-1 in elementary school, 3-to-1 in middle school, and 3-to-1 or 2-to-1 in different high schools. Due to insufficient funding, the state can only replace devices on a six-year cycle, rather than three years, which is the industry standard.260
Since 2003, the West Virginia legislature has appropriated $20 million annually for technology. This represents about 42 percent of total funding; counties, federal and private funds make up the remaining $27.6 million (58 percent). Compared to other states in the region, West Virginia’s appropriation for on-line learning is lower than the 15 states which have virtual schools in the Southern Regional Educational Board (SREB) area; only Oklahoma and Maryland provide less state funding than West Virginia for its on-line classes. The amount of funding needed to meet student demand in West Virginia for on-line classes is not known because WVDE does not gather this data. Other states in the SREB region fund their Virtual Schools in a variety of ways. Louisiana charges a school $150 for materials and technology per student per course; North Carolina funds its virtual school based on the average daily membership in the virtual school; Texas pays the provider district $400 and the receiver district $80 for every successfully completed course. Florida’s virtual school, the largest in the country, receives direct funding from the state for every successfully completed course. Reprogramming future school expenditures to pay for student access to digital technology can reduce the new funds needed for an expanded on-line learning program. For instance, the state currently does not have an approved Social Studies textbook for any grade in the PK-12 system. Instead of purchasing new Social Studies textbooks at a cost of about $1.4 million per grade level, the state could redirect Social Studies textbook funding ( and most other textbook funding) to partially provide the infrastructure necessary for students to access on-line courses. The course itself and all future on-line courses would cost only about $250,000 each for one-time

137 www.public-works.org
development costs and about $10 per student to access the state’s on-line resources (e-learning platform, learning object repository, and e-portfolio). Upon assuming leadership of the WVDE, Superintendent Marple focused almost immediately on how to bring West Virginia’s schools into the 21st Century through targeted initiatives, including the use of technology. Among the Superintendent’s technology priorities are one-to-one computer access for all students, a notebook computer for each teacher, adequate wireless capacity (like wireless access points, controllers, switches, and network drops) for each student, statewide internet access for educational purposes, and a sufficient number of information specialists to support classroom teachers.261
The Superintendent has championed the state’s Global 21 initiative to bring all components of the education system into line.
Currently, the state and counties use an annual appropriation to buy student computers and peripheral hardware. If the state and counties were to enter into a lease/purchase agreement for computers and hardware on a three-year basis, the state could purchase almost three times as many student computers during the first year of the lease-purchase agreement. The Department of Administration has a contract that provides lease-purchase opportunities to state entities, including WVDE and the counties. While this may not be the entire solution for obtaining equipment more quickly, it should be one of the tools considered. West Virginia officials also need to examine ways to reduce the high cost of personnel so that savings can be used for the state’s on-line learning program. In 2010, Alabama converted a traditional summer school to an exclusively on-line school via the school’s computer system. Cost savings came from replacing text books with free E-books, reducing the number of staff from 15 full-time teachers and administrative staff to only a principal, assistant principal, counselor and one teacher. The summer school pilot saved more than half the cost of prior years’ costs – $42,000 for one month of summer school. Some states like Florida and Alabama add to their virtual schools’ revenue streams by developing courses and leasing them to outside entities.
Recommendations There are three components required to embrace new technologies and expand on-line learning:
• Providing students with on-line access through computers and broad-band connectivity, both at home and at school.
• Providing electronic educational content on those computers. This can be static content – the electronic equivalent of books, or audio and video – or interactive content, including educational games and laboratory simulations.

138 www.public-works.org
• Training teachers to improve instruction by mastering electronic pedagogic methodologies.
On-Line Access
The first step is to ensure that every student has access to current digital technology. Since converting to computer-based instruction, North Carolina’s Mooresville Graded School District (MGSD) “has seen an improvement of 20 percentage points—from 68 percent to 88 percent—in the portion of its students who scored “proficient” on all core-subject state exams, in the subjects of reading, math, and science. Six of eight schools achieved Adequate Yearly Progress, or AYP, up from two of seven schools during the conversion’s first year. And its 2010-11 graduation rate rose to 91 percent, up 14 percentage points from four years ago.262 Out of 115 school districts in North Carolina, Mooresville was one of only six to make all Adequate Yearly Progress (AYP) targets during the 2009–2010 school year, and had the highest number of targets met. Also, during the same year, all MGSD schools were recognized as “Schools of Distinction.”263 These gains came during an economic downturn that has seen the proportion of the district’s students eligible for free or reduced-price lunch rise from 31 percent to 40 percent since 2007-08.264
West Virginia should:
1. Continue to work with private sector carriers to ensure high-speed broadband Internet access for public school teachers and students.
2. Ensure that all public school students and teachers have Internet-
accessible computers or similar mobile devices. A “one-to-one” computer program is surprisingly inexpensive – and cost-effective. Schools in MGSD spend roughly $200 per student per year on hardware, software, and maintenance costs for laptops for all students –which, this year, are new MacBook Airs. Thirty-five dollars of that covers digital content through subscriptions to services like Silver Spring, Md.-based Discovery Education’s content service.265 Technology expenditures to cover hardware, software, maintenance and training for each child runs approximately one dollar per day, exclusive of infrastructure.266
3. Use lease-purchase agreements to acquire computers and peripherals so that additional computers and peripheral equipment can be obtained more quickly. This may not work in all instances, but should be one of the options WVDE and the counties consider when having to make equipment purchases. Lease-purchase agreements will also free-up funding for other on-line course needs such as wiring, teacher training, software, and Technology Instruction Specialists.
On-Line Content
California’s "first-in-the-nation" digital textbook initiative was introduced as a way to provide schools and students a new way to access textbooks that are less expensive, easier and lighter. The first phase, which took place in the summer of 2009, involved the

139 www.public-works.org
review of free digital high school math and science content by a state panel that made recommendations to schools. Additional content will be solicited and evaluated in the years to come with plans to create a statewide Web site highlighting available digital textbooks. According to the governor's office, this initiative has the potential to save California's schools millions of dollars.267
Moving to digital materials saves money: Researchers in North Carolina estimate that the district has eliminated 95 percent of its spending on print textbooks, thanks in part to state policy that allows districts flexibility in how they spend state funding. Although AP classes still utilize traditional texts (in order to comply with state standards), nearly all other knowledge stores are contained on CDs or on-line. These resources are not only timely — offering the ability to be updated as new developments and discoveries warrant — but also extremely cost effective: Instead of paying $80 for a U.S. history book, the district now pays $33.50 per student per year for a huge media reference library that students have available to them at all times of the day.268
The district has reduced spending not just on books but also on calculators, encyclopedias, and maps, all resources that can be found embedded within a laptop and an Internet connection.
The Florida State Board of Education (FSBE) therefore is requiring that by the 2014-2015 school year, all “instructional materials” reviewed by the state be “digital.” The FSBE will also “delete requirements that districts spend half their “textbook money” on state-approved books and instead require they spend half on “digital content.”269
West Virginia should:
4. Replace textbooks with digital content, including interactive and adaptive media.
5. Require districts to spend 50 percent of their textbook budget on on-line content rather than books within two years – and 100 percent within the decade.
6. Use statewide purchasing power to negotiate lower cost digital content and
on-line courses.
On-Line Instruction Twenty-seven states run on-line schools, offering a full range of on-line school services. In 2008-09, they provided 320,000 course enrollments (a course enrollment is one student taking one semester-long course.). On-line schools in other states typically have more than 15,000 course enrollments and the numbers are growing.270 In Washington, for example, “the total number of students taking on-line courses in 2009 was 16,196. This represents an increase of 145 percent over the approximately 6,600 students enrolled in 2007-08.”271 In 2000, roughly 45,000 K-12 students took an on-line course. In 2009, more than 3 million K-12 students did so, as well, most through blended learning environments.272 The authors of Disrupting Class project that 50 percent of all high school courses will be delivered on-line by 2019.273

140 www.public-works.org
In the full-time Florida Virtual Learning School middle and high school students from all over the world can choose from more than 90 courses including core subjects, world languages, electives, honors, and Advanced Placement courses. The school provides, by far, the largest number of course enrollments in the country, with more than 150,000 enrollments in 2008-09 alone.274
There are typically two types of digital conversion: Blended and Full-time. “Blended on-line learning combines on-line course content with local, in-person instruction.275 While West Virginia students – particularly those in isolated areas – should be able to take all their courses on-line from remote locations (such as home), in general, blended instruction is the most effective, “providing a rationale for the effort required design and implement blended approaches.”276
In addition, such an approach contemplates a continued and important, though changed, role for teachers – in fact, to the extent that West Virginia can become a leader in the field, it opens up the opportunity for the state’s teachers to export and expand their teaching.
West Virginia should:
7. Appropriate significantly more funding to technology-assisted courses. West Virginia should begin this effort by requiring that each middle school student and each high school student take at least one course that is an on-line course or contains a significant amount of on-line content.
8. Enact legislation and sufficiently fund the West Virginia Virtual School so
that the counties can use only state-approved on-line learning programs. In addition to the fact that courses developed by non-state entities can draw revenue away from the WVVS, some current local courses and on-line courses purchased locally are not of sufficient quality to help students adequately learn.
9. Require schools to report to the WVDE all reasonable but unavailable student course requests, including summer school, electives, credit recovery, and AP courses. This will allow WVDE to calculate the unmet demand that should be met with on-line courses.
10. Create a dedicated funding stream to fund the WVVS. This will eliminate the current practice of charging schools for virtual school courses, a practice that may discourage school participation.
11. Develop and lease WVDE virtual courses to out-of-state entities in order to increase the virtual school revenue stream.
12. Ensure access to high-quality digital content and on-line courses to all students.
13. Let students take as many on-line classes as they want. The state should not limit the number of credits earned on-line.

141 www.public-works.org
Teacher Training New technologies require new and additional teacher training in order to use on-line and digital material to the best effect “To encourage buy-in to MGSD’s sweeping paradigm shift by teachers, administrators, and staff, the school board voted to implement a comprehensive professional development effort. Initially approving six early release days — which freed up afternoons for training — the board eventually increased that number to ten. “I would say our professional development was the biggest, most important thing we did,” says Dr. Scott Smith, MGSD’s chief technology officer.”277
West Virginia should:
14. Hire an adequate number of Technology Integration Specialists to support teachers.
15. Increase training in curricular use of technology. Even though the West
Virginia Department of Education provides a significant number of on-line technology training courses, many current teachers need training in classroom technology. However, only a small fraction of the large school technology budget goes to professional development; equipment in classrooms around the state is lying idle because teachers do not know how to use it. Future school technology spending should follow the national standard: one-third for equipment; one-third for professional development; one-third for technical support.
Former Harvard University President Derek Bok famously remarked, “If you think education is expensive, try ignorance.” Investing in the technology West Virginia needs to move its education system into the 21st Century will not be cheap – the technology investment recommended by Superintendent Marple, for instance, would cost approximately $23 million per year, indefinitely, to purchase, refresh, and maintain the needed equipment. Fortunately, this happens more-or-less to equal the annual savings that the State can achieve by implementing the state-level recommendations in this report to reduce inefficiencies, bureaucracy, and unneeded costs. These concluding recommendations suggest, however, that West Virginia go further and become a true leader in the development and deployment of new educational techniques and technologies: Not only would this improve education in the state, it also holds significant potential for further reducing unneeded costs of education delivery, such as textbooks and, less immediately, travel and facilities costs. This represents a true win-win where this reviews two objectives – reducing costs and increasing performance – come together synergistically. And that could make West Virginians once again the conquerors of new heights and the blazers of new paths to the future.

142 www.public-works.org
3. SUMMARY AND CONCLUSION
Over the course of the approximately four months that this review took place, we talked to more than a hundred people in West Virginia. We interviewed the Governor, members of his staff, the State School Board, the Superintendent, staffs at the Department of Education, Department of Education and the Arts, School Building Authority, and other state departments such as Human Resources, the Community and Technical College System, and Workforce Development. We heard from legislative leaders, various professional organizations, and reviewed information, findings and recommendations produced by MGT in its reviews of Harrison, Taylor and Wyoming Counties and RESA 7. We reviewed hundreds of pages of legislative language, regulations, policies, budget, and other documents produced by the various state departments and agencies outlining their visions, goals, priorities and current practices. First, we thank all of the people who took time from their busy schedules to provide information and share opinions about the state of the education system in West Virginia. This report would not have been possible without this involvement and the dedication of all of those in the education system who work tirelessly every day to make sure that West Virginia’s children can learn and are ready for the future. This review had several components and are addressed in each section of the report. The first section describes 56 findings and recommendations in six state-level functional areas: Administration, Facilities, Human Resources, Transportation, Ancillary Services – including health services, professional development, purchasing, and back-office staffing – and Regional Coordination. The recommendations in these areas represent savings of just over $18.1 million in Year One and $115.7 million over five years. This section also summarizes the recommendations found at the local and regional levels that may have implications for statewide consideration. While definite conclusions cannot be drawn from a sample of only three counties and one RESA, we highlight areas that should be investigated further. The individual reviews themselves identified approximately $5 million per year in savings and efficiencies in just these four local jurisdictions, with five-year savings of over $18 million. If carried out statewide, in all districts and RESAs, proportionate savings would come to roughly $70 million per year, at a total cost of about $6 million. The detailed findings and analyses of the three counties and RESA are contained in separate volumes. If West Virginia were to implement all these recommendations, then, and apply the review process to all districts and RESAs statewide, the annual savings could total approximately $90 million. The savings achievable from these reports, then, represent more than a hundredfold return on the cost of conducting this review, in just the first year. We believe therefore that this process has represented a worthwhile investment of public resources.

143 www.public-works.org
But the purpose and value of such a review lies not just in monetary return. The ultimate objective is to improve the education afforded West Virginia’s young people, and thereby improve their future professional and personal accomplishments and opportunities. The second section of the report therefore discuss much broader education policy considerations. We start with the fact that West Virginia has one of the most highly centralized and impermeable education systems in the country: No other state education system is so highly regulated in code and is constitutionally separate from the executive and legislative branches of government. There remains, however, many areas for improvement in order to create a more student-centered education system. A broader education reform agenda also will pay dividends in improved efficiency and better targeted spending. There are initiatives around the country that West Virginia can learn from and adapt: empowering schools, parents and students; reducing bureaucratic and administrative costs; increasing flexibility; better connecting the education and workforce development systems; moving greater responsibility to the district, school building and classroom level; and empowering students and their families with 21st Century learning technologies. To improve outcomes for individual students, West Virginia must deliver an education that prepares today’s young people for the world – and particularly the workplace – of the future. It must also improve education delivery at the school building and classroom levels by focusing on the quality of leadership from the building’s principal and the quality of classroom instruction delivered by the teacher. And it must invest in the technologies that will help today’s students to learn better, and today’s teachers to teach better, about the world of tomorrow. None of that comes cheap. Which is why it is so important that every education dollar be spent as efficiently and effectively as possible. The efficiency recommendations discussed in the first section of this report therefore are integral to the goal of freeing up the resources that all adults involved in the system – from teachers to administrators to government leaders in all branches – want to see in better preparing students for their future, empowering teachers to teach and school leaders to lead, and investing in needed technologies, discussed in the second section of the report. We hope that the numerous ideas contained in this report on how to achieve these outcomes will help to enable West Virginia to become a leader in education reform and student progress.

144 www.public-works.org
NOTES 1 http://www2.census.gov/govs/school/09f33pub.pdf 2 http://nces.ed.gov/programs/stateprofiles/sresult.asp?mode=full&displaycat=7&s1=54 3 Gibbons, Patrick R. “Financing Entrepreneurial Education: Part III.” Nevada Policy Research Institution (NPRI). 30 Dec 2009. 4 Id. 5 Id. 6 “The Boston Pilot and Horace Mann Schools.” The Boston Pilot Schools Network. (Boston, MA: Center for Collaborative Education). Web. 7 “Progress and Promise.” Results from the Boston Pilot Schools. (Boston, MA: Center for Collaborative Education, Jan 2006.) 8 Id. 9 “About Us: Children First.” New York City Department of Education. Copyright 2010. Web. http://schools.nyc.gov 10 Gibbons, Patrick. “Empowerment model puts classrooms first. Cutting administrative bloat gives principals more control, more money.” Las Vegas Review-Journal (NV). 3 Jan 2010. 11 Jeremiah Johnson, State Financial Incentive Policy for Recruiting and Retaining Effective Teachers in Hard to Staff Schools (Denver, CO: Education Commission of the States, 2005). 12 Brown, Cynthia G., Frederick M. Hess, Daniel K. Lautenheiser, Isabel Owen, “State Education Agencies as Agents of Change,” Center for American Progress, American Enterprise Institute for Public Policy Research and The Board Foundation, July 2011. 13 Email report from Terry Harless, December 16,2011 14 Information provided by WVDE, September 30, 2011 15 Email from Terry Harless, WVDE Finance. 16 Telephone interview and emails from Kent Dickey, Virginia Department of Education, Finance. 17 http://nces.ed.gov/pubs97/97529.pdf 18 http://www.wpaag.org/Judicial%20Governance%20-%20National%20Plot%20in%2040%20States.htm 19 http://www.schoolfunding.info/policy/facilities/facilities.php3 20 Brown, Cynthia G., Frederick M. Hess, Daniel K. Lautenheiser, Isabel Owen, “State Education Agencies as Agents of Change,” Center for American Progress, American Enterprise Institute for Public Policy Research and The Broad Foundation, July 2011. 21 Email from Les Morse, Deputy Commissioner, Alaska Department of Education, December 19, 2011
22 http://e.wikipedia.ord/wiki/Hawai’i_Department_of_Education. 23 http://www.doe.virginia.gov/about/organization_chart.pdf 24 Telephone interview and emails from Kent Dickey, Virginia Department of Education, Finance. 25 http://www.marylandpublicschools.org/NR/rdonlyres/20DDA1CC-AD44-4815-92AB-D7D5304DE846/27020/MSDE_Organization_Chart_12_2010.pdf 26 http://www.ode.state.oh.us/GD/Templates/Pages/ODE/ODEDefaultPage.aspx?page=1 27 http://arkansased.org/about/directory.html 28 http://www.maine.gov/education/eddir/teamlist.htm 29 http://www.ped.state.nm.us/resources/personneldirectory/fullDirectoryPackage.pdf 30 http://www.education.ne.gov/documents/catstaff1.dir.pdf and email from Denise Fisher, HR, Nebraska Department of Education, dated December 19, 2011 31 http://www.sde.idaho.gov/site/divisions.htm 32 http://edu.wyoming.gov/Libraries/Publications/2010-11WDEDirectory_F.sflb.ashx 33 http://opi.mt.gov/pdf/superintendent/opistaff.pdf 34 http://www.cde.state.co.us/cdecomm/cdeorgcht.htm 35 http://doe.sd.gov/about.asp 36 http://www.dpi.state.nd.us/dept/orgchart.pdf 37 http://educateiowa.gov/index.php?option=com_content&view=article&id=1295&Itemid=2686 38 http://education.vermont.gov/new/html/directories/educ_directory_staff_A_K.html 39 http://www.doe.nv.gov/StaffDirectories.htm 40 Ibid 41 Information provided by WVDE with the Employee Handbook, July 2008 42 The Economist, “Span of Control,” November 9, 2009, available at: http://www.economist.com/node/14301444 (last accessed October 7, 2011).

145 www.public-works.org
43 http://www.ode.state.oh.us/gd/templates/pages/ODE/ODEGoogleSearch.aspx?page=221&query=organization chart&start=0&OriginatingURL=/GD/Templates/Pages/ODE/ODEDefaultPage.aspx?Page=1 44 See: Purdy, Deirdre H., “An Economical, Thorough, and Efficient School System: The West Virginia School Building Authority ‘Economy of Scale’ Numbers,” Journal of Research in Rural Education, Winter 1997, Vol. 13, No.3, 170-182. 45 Mark A. Manchin, Executive Director, School Building Authority, State of West Virginia, July 6, 2011. 46E-mail from David A. Sneed, Chief of Architectural Services, School Building Authority, State of West Virginia, August 16, 2011. 47 Ibid. 48 Ibid. 49 WV Code 18-9D-16(3)(D)(17)(ii)(IX)(4)(C)(c). 50 Mike Pickens, Executive Director, Office of School Facilities, West Virginia Department of Education, June 29, 2011. 51 Ibid. 52 Mark A. Manchin, Executive Director, School Building Authority, State of West Virginia, July 6, 2011. 53 18-9E-3(f) 54 18-9E-5(b) West Virginia Code. 55 18-9E-5(a) West Virginia Code. 56 Mark A. Manchin, Executive Director, School Building Authority, State of West Virginia, July 6, 2011. 57 WV Code18-5-9A-(a)(1)(A)(2) 58 Mike Pickens, Executive Director, Office of School Facilities, West Virginia Department of Education, June 29, 2011. 59 Ibid. 60 Ibid. 61 John F. Herholdt, Jr., Director, West Virginia Division of Energy, June 29, 2011. 62 David A. Sneed, Chief of Architectural Services, School Building Authority, State of West Virginia, August 2, 2011. 63 E-mail from Wesley A. Holland, Coordinator, Office of Instructional Technology, State of West Virginia, July 7, 2011. 64 Mark A. Manchin, Executive Director, School Building Authority, State of West Virginia, July 6, 2011. 65 Ibid. 66 David A. Sneed, Chief of Architectural Services, School Building Authority, State of West Virginia, August 2, 2011. 67 Ibid. 68 18-9D-15(f) West Virginia Code. 69 Ibid. 70 David A. Sneed, Chief of Architectural Services, School Building Authority, State of West Virginia, August 2, 2011. 71 “County Boards of Education Expenditures for Utilities General Current Expense Funds(Funds 11 and 12), 2009-10 Year”, Office of School Finance, June 9, 2011. 72 W. Va. Code §18-2-16. 73 Price, Jennifer L., Calvin A. Kent, Kent N. Sowards (Marshall University Center for Business and Economic Research, “The Economic Impact of Cedar Lakes Conference Center-Final Report,” April 17, 2008, page 4. 74 West Virginia State agencies website, available at: http://www.wv.gov/Pages/agencies.aspx (last accessed September 20, 2011). 75 Cedar Lakes Conference Center facilities website, available at: http://wvde.state.wv.us/cedarlakes/facilities.htm (last accessed September 26, 2011). 76 Cedar Lakes General Manager Ron Grimes. Note: Some student groups have converted double beds into “quad rooms” taking the total maximum capacity to 720 individuals. 77 Cedar Lakes Conference Center food service website, available at: http://wvde.state.wv.us/cedarlakes/food.htm (last accessed September 26, 2011). 78 Price et al., page 7. 79 W. Va. Code §18A-4-18(b). 80 Jackson County Board of Education, see: http://jackson.wv.schoolwebpages.com/education/components/docmgr/default.php?sectiondetailid=168&catfilter=42#showDoc (last accessed October 11, 2011).

146 www.public-works.org
81 US Bureau of Labor Statistics, May 2010 West Virginia average wage data, available at: http://www.bls.gov/oes/current/oes_wv.htm#37-0000 (last accessed October 11, 2011). 82 Annual CLCC wage data supplied by CLCC General Manager Ron Grimes. 83 Email from CLCC General Manager Ron Grimes, October 13, 2011. 84 Price et al. page 35. 85 Grimes, Ron (Executive Director/General Manager, Cedar Lakes Conference Center, ”2004 Cedar Lakes Report” (submitted to State Superintendent of Schools and Assistant State Superintendent of Schools Technical and Adult Education), 11. 86 Grimes Report, page 2. 87 WVDE budget assessment, provided by Terry Harless, September 30, 2011. 88 W. Va. Code §18-2-16. 89 Interview with CLCC General Manager Ron Grimes. 90 Grimes Report, page 9. 91 Email from CLCC General Manager Ron Grimes, October 13, 2011. 92 Data provided by CLCC General Manager Ron Grimes, November 2, 2011. 93 Price et al., pages 3, 39. 94 Price et al., pages 3, 39. 95 W. Va. Code §18-2-16A. 96 Price et al., page 41. 97 W. Va. Code §18-2-16. 98 Interview with CLCC General Manager Ron Grimes. 99 Keith R. Burdette, Executive Director, Office of Human Resources, West Virginia Department of Education, June, 9, 2011. 100 Todd Childers, OASIS Project Director, State of West Virginia, September 26,2011. 101 Ibid. 102 Ibid. 103 Ibid. 104 Ibid. 105 Ibid. 106 Todd Childers, OASIS Project Director, State of West Virginia, October, 21, 2011. 107 Ibid. 108 Ibid. 109 Abigail Heid, Technology and Information Support Coordinator, Division of Technical and Adult Education, West Virginia Department of Education, August 10 ,2011. 110 Ibid. 111 Ben Shew, Executive Director, Office of School Transportation, West Virginia Department of Education, June 8, 2011. 112 Abigail Heid, Technology and Information Support Coordinator, Division of Technical and Adult Education, West Virginia Department of Education, August 10,2011. 113 Ibid. 114 “School Service Manual”, Division of Technical and Adult Education, West Virginia Department of Education, pg. 5, e-mail attachment to Gloria W. Homer from Abigail Heid, August 10, 2001. 115 Abigail Heid, Technology and Information Support Coordinator, Division of Technical and Adult Education, West Virginia Department of Education, August 10,2011. 116 West Virginia Code 18A-4-8e. 117 Ibid. 118 Abigail Heid, Technology and Information Support Coordinator, Division of Technical and Adult Education, West Virginia Department of Education, August 10, 2011. 119 Uniform Guidelines on Employee Selection Procedures, Office of Equal Employment Opportunity, 29 CFR Part 1603.1.3.A (7-1-00 Edition). 120 Abigail Heid, Technology and Information Support Coordinator, Division of Technical and Adult Education, West Virginia Department of Education, August 10, 2011. 121 Ibid, 122 Uniform Guidelines on Employee Selection Procedures, Office of Equal Employment Opportunity, 29 CFR Part 1607.1.B (7-1-00 Edition). 123 Uniform Guidelines on Employee Selection Procedures, Office of Equal Employment Opportunity, 29 CFR Part 1607.5.B (7-1-00 Edition).

147 www.public-works.org
124 Abigail Heid, Technology and Information Support Coordinator, Division of Technical and Adult Education, West Virginia Department of Education, August 10, 2011. 125 Michael J. Campbell, Assistant Director of Staffing Services, Division of Personnel, West Virginia Department of Administration, August 22, 2011. 126 “County Boards of Education School Transportation Expenditures by Purpose of Expenditure for the 2009-10 Year”, Office of School Finance, West Virginia Department of Education, March 7, 2011. 127 County Boards of Education School Transportation Expenditures by Purpose of Expenditure for the 2009-10 Year”, Office of School Finance, West Virginia Department of Education, March 7, 2011. 128 “Public school students transported at public expense and current expenditures for transportation: Selected years, 1980-81 to 2007-08”, U.S. Department of Education, National Center for Education Statistics. (2011). Digest of Education Statistics, 2010 (NCES 2011-015), Chapter 2 . 129 Ben Shew, Executive Director, Office of School Transportation, West Virginia Department of Education, June 8,201 130 “County Boards of Education School Transportation Expenditures on a Per Mile and Per Pupil Basis – Arranged in Ascending Order on a Cost per Mile Basis with Density Categories”, Office of School Finance, March 7, 2011. 131 State Board Policy, Section 126-92-13.18.5. 132 Robert Marlow, Route Manager, Wood County, West Virginia, October 5, 2011. 133Ibid. 134 Ben Shew, Executive Director, Office of School Transportation, West Virginia Department of Education, June 8, 2011. 135 Gabriel J. Devono, Executive Director, RESA 7, August 5, 2011. E-mail from Ben Shew, Executive Director, Office of School Transportation, West Virginia Department of Education, 2011. 136 Ben Shew, Executive Director, Office of School Transportation, West Virginia Department of Education, June 8, 2011. 137 Ibid. 138 Ibid. 139 Ibid. 140 County Boards of Education School Transportation Expenditures by Purpose of Expenditure for the 2009-10 Year”, Office of School Finance, West Virginia Department of Education, March 7, 2011 141 Melanie Purkey, Executive Director, Office of Healthy Schools, West Virginia Department of Education, August 10, 2011. 142 Ibid. 143 Ibid. 144 Ibid. 145 Darling-Hammond, Linda, et al. (for the National Staff Development Council), “Professional Learning in the Learning Profession: A Status Report on Teacher Development in the United States and Abroad,” February 2009, (hereafter Darling-Hammond et al.), available at: http://www.learningforward.org/news/NSDCstudy2009.pdf (last accessed September 28, 2011). 146 No Child Left Behind Act of 2001, available at: http://www2.ed.gov/policy/elsec/leg/esea02/index.html (last accessed September 28, 2011). 147 Killeen, M. Kiernan et al., “School District Spending on Professional Development: Insights from National Data (1992-1998),” Journal of Education Finance 28 (2002), pages 25-30, available at: http://depts.washington.edu/ctpmail/PDFs/JEFArticle-KKDMMP.pdf (last accessed October 14, 2011). 148 Grossman, Tabitha and Eric Hirsch (for the National Governors Association Center for Best Practices), State Policies to Improve Teacher Professional Development, October 2009, (hereafter NGA Report), available at: http://www.newteachercenter.org/pdfs/Grossman_StatePolicies-PD.pdf (last accessed October 3, 2011). 149 Hammer, P. C., Hixson, N., (West Virginia Department of Education, Division of Curriculum and Instructional Services, Office of Research), “Implementation of the Master Plan for Statewide Professional Staff Development for 2010–2011: An Evaluation Study,” (hereafter 2010-11 Master Plan Evaluation), page vii. 150 WV Code §18-2-23a(b) 151 WV Code §18-2-23a(c) 152 WV Code §18-2-23a(d) 153 West Virginia Board of Education, “West Virginia Master Plan for Statewide Professional Staff Development 2011-2012,” (hereafter 2011-12 Master Plan), page 6. 154 2010-11 Master Plan Evaluation, page 43.

148 www.public-works.org
155 2011-12 Master Plan, page 4. 156 WV Code 18-2I-1. 157 WV. Code 18-2I-2. 158 Id. 159 WV Code 18-2I-3. 160 West Virginia Department of Education, Division of Curriculum and Instructional Services, Office of Research), “West Virginia Master Plan for Professional Development (Evaluation Plan) for 2011–2012,” page 3. 161 2010–2011 Master Plan Evaluation, page 43. 162 West Virginia Department of Education, Teacher, Leader and Counselor Evaluation Task Force Recommendations, 2011. 163 US Department of Education, “CPRE Policy Brief: Helping Teachers Teach Well: Transforming Professional Development,” (hereafter CPRE Policy Brief), June 1995, available at: http://www2.ed.gov/pubs/CPRE/t61/t61c.html#4 (last accessed November 9, 2011). 164 Id. 165 Id. 166 Based on US Census Public School Finance Data showing total West Virginia elementary and secondary school system expenditures for 2008-09 of $2.95 billion. More information available at: http://www.census.gov/govs/school/ (last accessed October 22, 2011). 167 Based on West Virginia Center for Budget Priorities FY 2012 budget analysis, showing total state public education investments of $2.26 billion. More information available at: http://www.wvpolicy.org/downloads/budget_update_FY2012.pdf (last accessed October 22, 2011). 168 West Virginia Consolidated Report of Federal Funds FY2012, available at: http://www.budget.wv.gov/reportsandcharts/federalfunds/Documents/FedFunds2012.pdf (last accessed October 21, 2011). 169 National Staff Development Council (NSDC), “A Study of Professional Development for Public School Educators in West Virginia,” (report to the WV Legislative Oversight Commission on Education Accountability, 2005, page 45, available at: http://wvde.state.wv.us/boe/documents/NSDC percent202005 percent20Study percent20WV percent20Professional percent20Development.pdf (last accessed October 15, 2011). 170 2010–2011 Master Plan Evaluation, pages vii-viii. 171 Id., at page 42. 172 See: 2010–2011 Master Plan Evaluation, page 28. 173 See: NGA Report. For more information on Iowa’s Professional Development Model, see: http://educateiowa.gov/index.php?option=com_content&task=view&id=232&Itemid=1286. 174 State Board Policy 8200, 126CSR202. 175 State Board Policy 8200, 126CSR202-1.1.. 176 “Matrix of RESA Programs and Services.” 177 Ibid. 178 Phillip Uy, Assistant Director, Office of Internal Operations, West Virginia Department of Education, June 10, 2011. 179 Fran Warsing, Superintendent, Institutional Education Programs, West Virginia Department of Education, July 28,2011. 180 Ibid. 181 Brenda Williams, Executive Director, Office of Instructional Technology, West Virginia Department of Education, June 9, 2011. 182 Ibid. 183 Ibid. 184 “County Boards of Education Expenditures by Object of Expenditure, General Current Expense Fund with Comparative Analysis for the 2009-10 School Year”, Office of School Finance, West Virginia Department of Education, June 28, 2011. 185 Roger Probst, Superintendent, Calhoun County Schools, September 5, 2011. 186 Ibid. 187 http://scn.ky.gov/costcontrol.PDF 188 “Child Nutrition – Harrison County”, MGT of America, page 4 -.6 and “Child Nutrition – Taylor County”, MGT of America, page 4-4. 189 “County Boards of Education Second Month Enrollment by Grade (2010-11 School Year), Office of School Finance, December 7, 2011.

149 www.public-works.org
190 “Child Nutrition – Harrison County”, MGT of America, page 4 -.6 and “Child Nutrition – Taylor County”, MGT of America, page 4-4. 191 § 7 CFR 210.14(e)(4) and (e)(5) 192 “Child Nutrition – Taylor County”, MGT of America, page 4-7. 193 Daniel Todd, Office of Child Nutrition, West Virginia Department of Education, November 2, 2011. 194 Richard J. Goff, Executive Director, Office of Child Nutrition, West Virginia Department of Education, June 9, 2011. 195 Ibid. 196 “Child Nutrition – Taylor County”, MGT of America, page 4-7. 197 “County Boards of Education Second Month Enrollment by Grade (2010-11 School Year), Office of School Finance, December 7, 2011. 198 “Child Nutrition – Taylor County”, MGT of America, page 4-7. 199 Gary Becker, “Economic Evidence on the Value of Education,” Remarks to executives of the Lotus Development Corporation, January 1999. 200 Community and Technical College Master Plan 2010-2015 (report to the Legislative Oversight Commission on Educational Accountability), September 13, 2010, pages 3-4. 201 Id. 202 http://careertech.k12.wv.us/techprep/edge.htm 203 West Virginia Tech Prep website, available at: http://www.wvtechprep.wvnet.edu/edge.htm (last accessed November 3, 2011). 204 Guidelines for Granting College Credit for Courses under the West Virginia EDGE, “Earn a Degree, Graduate Early” Program, 135CSR28, effective July 15, 2011, available at: http://www.wvctcs.org/downloads/RulesPolicies/HEPC/Series_28_for_Final_File_EDGE_Rule.pdf (last accessed November 3, 2011). 205 Id. 206 Email from Charles Terrell, President, Eastern West Virginia CTC, to James L. Skidmore, Chancellor, WV Council for Community and Technical College Education, December 14, 2011, copy provided by Chancellor Skidmore. 207 Email from Keith Cotroneo, President, Mountwest CTC, to James L. Skidmore, Chancellor, Wv Council for Community and Technical College Education, December 14, 2011, copy provided by Chancellor Skidmore. 208 Email from Leslie Lovett, Interim Vice President for Academic affairs, Pierpont CTC, to James L. Skidmore, Chancellor, WV Council for Community and Technical College Education, December 14, 2011, copy provided by Chancellor Skidmore. 209 CTC Master Plan, page 22. 210 Complete College America, West Virginia profile-2011, available at: http://www.completecollege.org/docs/West_Virginia.pdf (last accessed October 13, 2011). 211 Available at: http://www.completecollege.org/docs/West_Virginia.pdf (last accessed October 13, 2011). 212 Id. 213 2011-12 West Virginia Board of Education Strategic Plan, page 4. 214 National Governors Association Center for Best Practices-Social, Economic and Workforce Programs Division, Issue Brief: Aligning State Workforce Development and Economic Development Initiatives, September 2005, pages 1-2. 215 Appalachian Regional Commission, Strategic Plan 2011-2016, available at: http://www.arc.gov/images/newsroom/publications/sp/ARCStrategicPlan2011-2016.pdf (last accessed November 1, 2011). 216 Southern Growth Policies Board, in affiliation with the National Network of Sector Partners, “Supporting Sector Strategies in the South,” March 2008, available at http//www.southerngrowth.com/pubs/pubs_pdfs/ssi_whitepaper.pdf 217 Ibid 218 West Virginia Adult Basic Education Handbook, 2008-2009, available at: http://wvde.state.wv.us/abe/documents/section1.pdf (last accessed November 1, 2011). 219 Id. 220 Emergency legislative rule §135-27-1, effective April 22, 2011, available at: http://www.wvctcs.org/downloads/RulesPolicies/Series_27_Rule_EMERGENCY_RULE_042211.pdf (last accessed November 3, 2011). 221 http://www.nga.org/cda/files/0310READY.pdf, page 24. 222 Complete College America report.

150 www.public-works.org
223 CTC Master Plan, page 12. 224 http://www.legis.state.wv.us/reports/agency_reports/agency_reports_docs/C09_FY_2010_1110.pdf 225 Id. at 21. 226 Advanced Technology Center presentation to the WV Council for Community and Technical College Education, available at: http://www.wvctcs.org/act percent20centers percent20summary percent20and percent20overview percent20april percent202008 percent20for percent20council percent20meeting.pdf (last accessed November 3, 2011). 227Instructions for Preparing the School Calendar for the 2011-12 School Year distributed by the West Virginia Department of Education 228 http://nces.ed.gov/programs/digest/d03/tables/dt126.asp 229 http://www.educationsector.org/sites/default/files/publications/OntheClock.pdf" 230 http://www.mackinac.org/10840 231 http://www.centerforpubliceducation.org/Main-Menu/Staffingstudents/How-good-are-your-teachers-Trying-to-define-teacher-quality/Does-highly-qualified-mean-highly-effective.html 232 http://www.sree.org/conferences/2011/program/downloads/abstracts/39.pdf 233 http://www.kidsohio.org/wp-content/uploads/2008/02/national-commission-on-teaching-and-americas-future_-the-cost-of-teacher-turnover-in-five-school-districts.pdf 234 http://www.gse.harvard.edu/~pfpie/pdf/Teacher_Employment_Patterns_and_Student_Results_in_CMS_Feb_23_2010.pdf 235 http://www.teachlouisiana.net/pdf/LSSI_Overview.pdf 236 http://www.gse.harvard.edu/~pfpie/pdf/Teacher_Employment_Patterns_and_Student_Results_in_CMS_Feb_23_2010.pdf 237 http://www.time.com/time/nation/article/0,8599,2047211,00.html#ixzz1Zk8Lu8oa 238 http://tntp.org/files/Teacher-Evaluation-Oct10F.pdf 239 Ibid 240 Jorea M. Marple, Ed.D., & The West Virginia Board of Education, “An Action Plan for Public Education in West Virginia” (2001), p.2 241 http://www.nea.org/assets/docs/HE/NEA_Rankings_and_Estimates010711.pdf 242 Harris, Amy Julia, “Super-sized school salaries?”, Charleston Gazette (Nov. 19, 2011), http://www.wvgazette.com/News/201111190089. 243 Clements, Stephen, Kentucky Long-term Policy Research Center, 1999. Teacher Quality and Future Issues, Part 2, http://www.kltprc.net/books/kysteachers/Chpt_05.htm. 244 KRS 157.395. 245 TeachNM, 3-TLS Overview, http://www.teachnm.org/programs/3-tiered-licensure-system/3-tls-overview.html; Hatch Valley (New Mexico) Public Schools, New Mexico’s 3-Tiered Teacher Licensure System, http://www.hatch.k12.nm.us/LinkClick.aspx?fileticket=fRFygoODMlQ%3D&tabid=5186&mid=10081. 246 Teacher Portal, http://teacherportal.com/ 247 National Council on Teacher Quality, 2008 State Teacher Policy Yearbook: What States Can Do To Retain Effective New Teachers, West Virginia, http://www.nctq.org/stpy08/reports/stpy_westvirginia.pdf 248 Grissom, Jason A., and Katharine O. Strunk, University of Missouri and the University of Southern California, How Should School Districts Shape Teacher Salary Schedules? Linking School Performance to Pay Structure in Traditional Compensation Schemes, http://web.missouri.edu/~grissomja/papers/salary_schedules.pdf 249 Ferrandino, V. L. (2001). Challenges for 21st-century elementary school principals. Phi Delta Kappan, 82(6). 440-442. 250 Florida Council for Educational Change. University of Miami Evaluation Report of $100 million South Florida Annenberg Challenge Initiative Released. 251 Lankes, Tiffany and Christopher O’ Donnell. “Meeting a Need for Principals.” Sarasota Herald Tribune. 19 Apr 2010. 252 https://www.floridaschoolleaders.org/supportRes.aspx?onlineID=1003 253 http://asapportal.com/node/63 254 http://www.wallacefoundation.org/knowledge-center/school-leadership/principal-training/Documents/Six-Strategies-to-Prepare-More-Good-Prinicipals.pdf 255 http://www.academicleadership.org/article/The_Future_of_Site-Based_Management_Principals_are_the_Key 256 http://www.nycleadershipacademy.org/

151 www.public-works.org
257 http://wvde.state.wv.us/global21/professional-development.html 258 United States Department of Education, Toward a new golden age in American education: How the Internet, the law and today’s students are revolutionizing expectations (2004), p.9, http://www.ed.gov/print/about/offices/list/os/technology/plan/2004/plan.html. 259 New York Times, http://bits.blogs.nytimes.com/2009/08/19/study-finds-that-on-line-education-beats-the-classroom/ 260 West Virginia Legislative Auditor’s Report, Jan. 2010 261 Office of Instructional Technology, West Virginia Department of Education, “ West Virginia Department of Education Technology Infrastructure Budget Request, Instructional and Administrative (WVEIS) Technology Improvement Package”, June 6, 2011. 262 Quillen, http://www.edweek.org/dd/articles/2011/10/19/01conversion.h05.html?intc=DD10.11EM 263 Cisco, http://www.cisco.com/web/strategy/docs/education/CiscoEduEveryLearner.pdf 264 Ibid. 265 Quillen, http://www.edweek.org/dd/articles/2011/10/19/01conversion.h05.html?intc=DD10.11EM 266 Cisco, http://www.cisco.com/web/strategy/docs/education/CiscoEduEveryLearner.pdf 267 Intel, “Transforming Classrooms With Help From Technology,” http://www.k12blueprint.com/k12/blueprint/digital.php?menu=digital. For more information, visit http://gov.ca.gov/index.php?/fact-sheet/12455/ or http://www.clrn.org/fdti/FDTI_Report.pdf 268 Cisco, http://www.cisco.com/web/strategy/docs/education/CiscoEduEveryLearner.pdf 269 Orlando Sentinel, “Going Digital: State board pushes schools’ conversion by 2014,” http://articles.orlandosentinel.com/2011-01-18/news/os-state-board-priorities-20110118_1_school-grades-middle-or-high-schools-john-padget 270 Finne, Liv, On-line Learning in Washington State, 2: http://www.washingtonpolicy.org/sites/default/files/On-lineSchoolsPB_0.pdf 271 Ibid, 3. 272 Horn, B. Michael and Heather Clayton Staker, The Rise of K-12 Learning (Innosight Institute, Inc.), 2011, 1. 273 Christensen, Clayton M., Michael B. Horn, and Curtis W. Johnson, Disrupting Class: How Disruptive Innovation Will Change the Way the World Learns (New York: McGraw-Hill, 2008). 274 Ibid, 2. 275 Ibid. 276 U.S. Department of Education, Office of Planning, Evaluation, and Policy Development, Evaluation of Evidence-Based Practices in On-line Learning: A Meta-Analysis and Review of On-line Learning Studies, Washington, D.C., 2010, xviii. 277 Ibid.