Embed Size (px)
Citation preview
2014/ED/EFA/MRT/PI/14
Background paper prepared for the Education for All Global Monitoring Report 2013/4
Teaching and learning: Achieving quality for all
Educational Attainment and Maternal Mortality
Sonia Bhalotra with Damian Clarke
2013 This paper was commissioned by the Education for All Global Monitoring Report as background information to assist in drafting the 2013/4 report. It has not been edited by the team. The views and opinions expressed in this paper are those of the author(s) and should not be attributed to the EFA Global Monitoring Report or to UNESCO. The papers can be cited with the following reference: “Paper commissioned for the EFA Global Monitoring Report 2013/4, Teaching and learning: Achieving quality for all” For further information, please contact [email protected]
Educational Attainment and Maternal Mortality
Sonia Bhalotra∗ Damian Clarke†
September 1, 2013
Abstract
We examine whether a causal relationship exists between maternal education and ma-
ternal mortality. Despite considerable evidence in favour of a causal relationship between
education and a range of other health behaviours and outcomes, and a significant gradi-
ent between maternal mortality and education across time and countries, no comprehensive
study exists to examine whether this relationship is—at least in part—causal. By forming a
large panel of data consisting of 108 countries over 20 years, and by examining three natural
experiments resulting in plausibly exogenous expansions in education, we present consider-
able evidence that increases in maternal education causally reduce the likelihood of dying
in child birth. The size of this relationship is considerable. Our preferred estimates suggest
that a country moving from 0 to 1 years of education will reduce maternal mortality by
174 deaths per 100,000 births, while moving from 7 to 8 years results in a smaller, but still
significant, 15 deaths per 100,000 births.
1 Introduction
Life expectancy exhibits a consistently positive gradient in education that, unlike income gra-
dients, tends not to diminish as education levels rise and is evident across and within rich and
poor countries (Richards and Barry, 1998; Kunst and Mackenbach, 1994; Elo and Preston, 1996;
Lleras-Muney, 2005; Meara et al., 2008). Maternal mortality is an important determinant of life
∗[email protected]†[email protected]
1
expectancy for women in developing countries but there is not much evidence of the relationship
between maternal mortality and education. This paper attempts to fill that gap.
Every day, approximately 800 women die from preventable causes related to pregnancy and
childbirth, 99% of all maternal deaths occur in developing countries and they are largely pre-
ventable (WHO, 2012). The maternal mortality ratio in developing countries is 240 per 100,000
births versus 16 per 100,000 in developed countries. There are large disparities between and
within countries, with a few countries having extremely high maternal mortality ratios of 1,000
or more per 100,000 live births; more than half of all maternal deaths occur in sub-Saharan Africa
and almost one third occur in South Asia (WHO, 2012). The WHO identifies poverty, limited
access to public services, cultural practices and lack of information as the main causes or sources
of variation in maternal mortality ratios.
Between 1990 and 2010, maternal mortality worldwide dropped by almost 50%. While this is
impressive, certainly relative to trends in the preceding twenty years, the average rate of decline
in the global maternal mortality ratio (the number of maternal deaths per 100,000 live births)
of 3.1% per year over this period falls well below the annual decline of 5.5% required to achieve
the Millennium Development Goals (MDG) for maternal health adopted by the international
community in 2000. There are signs of increasing policy commitment to addressing maternal
mortality: official development assistance for maternal and new-born health has risen relative,
for instance, to funding for child health (Greco et al., 2008).1
However policy documents on maternal mortality seldom indicate education as a cause and
the academic literature has very little to say about the relationship between maternal mortality
and education. This said, there is a lively literature in economics that documents a positive corre-
lation between education and other indicators of health. One possibility, relatively uninteresting
for policy, is that this correlation is driven by time preference, people with lower discount rates
tending to invest more in both forms of human capital. While this is likely so, the crop of studies
that identify causal effects of education on health most often tend to associate this with edu-
cated people engaging in healthier behaviours, for instance, smoking and drinking less and being
more likely to seek prenatal care, adopt new drugs or adhere to treatment for disease (Goldman
and Smith, 2010; Goldman and Lakdawalla, 2001; Currie and Moretti, 2003; Lichtenberg and
Lleras-Muney, 2005; Cutler and Lleras-Muney, 2010; Glied and Lleras-Muney, 2008; Jensen and
Lleras-Muney, 2012). This is consistent with the efficacy that education confers in acquiring and
1Overall donor disbursements increased from US$2,119 million in 2003 to $3,482 million in 2006; funding forchild health increased by 63% and that for maternal and new-born health increased by 66%. In the 68 prioritycountries, child-related disbursements increased from a mean of $4 per child in 2003 to $7 per child in 2006;disbursements for maternal and neonatal health increased from $7 per live birth in 2003 to $12 per live birth in2006.
2
processing relevant information (Rosenzweig, 1995; Rosenzweig and Schultz, 1989; Cutler and
Lleras-Muney, 2010). Education may also influence health through its influence on income and,
thereby, the facility to purchase health inputs but the impacts of education on health tend to be
larger than direct impacts of income, to hold conditional upon income, and to be similar for men
and women, at least in richer countries (Lleras-Muney, 2005; Cutler and Lleras-Muney, 2010).
The proximate causes of maternal mortality are pregnancy complications such as pre- eclamp-
sia, bleeding, infections and unsafe abortion. To the extent that educated women are more likely
to adopt simple and low-cost practices to maintain hygiene, are more able to react to symptoms
such as bleeding or high blood pressure, more likely to assess the information on abortion and
place of abortion, and more willing to accept treatment and birth attendance, education may
plausibly cause declines in maternal mortality. Moreover, if these are the mechanisms by which
it acts then education may have an impact on maternal mortality conditional upon the state of
health services. The payoff to education tends to be higher in circumstances where learning is
important, for instance, circumstances of structural and technological change (Foster and Rosen-
zweig, 2004). Such change is characteristic of developing countries which, in the post-war period,
have experienced massive technological change in the public health sphere (Cutler et al., 2006)
as well as changes in the economic (and occupational) structure.
Using panel data for 108 developing countries and new estimates of maternal mortality
ratios for 1990-2010, we estimate the relationship between maternal mortality and educational
attainment under the standard panel data identifying assumptions, unconditional and conditional
upon indicators of income, public health provision and fertility. We find large and consistently
significant impacts of education. Indeed, depending upon the specification, the (standardized)
impacts of education on maternal mortality are equal to or larger than the impacts of skilled
birth attendance, an instrument that the WHO currently focuses upon in devising programs to
address maternal mortality. In contrast, within-country variation in GDP has no signigicant
impact on maternal mortality conditional upon education. We supplement the cross-country
analysis with case studies from Nigeria, Zimbabwe and Kenya. These are three countries that
implemented substantial education reforms. We use cohort and region variation in education
generated by the reform, that we argue is plausibly exogenous. To match this to maternal
mortality rates, we construct cohort mortality rates for regions within these countries using the
Demographic and Health Surveys. In two of the three case we identify a sizeable and negative
impact of improvements in education on maternal mortality. In both Nigeria and Zimbabwe
we find that the educational expansions due to policy experiments significantly reduce maternal
death in affected cohorts, and find that these results are surprisingly close to those estimated in
cross-country regressions. In Kenya—which experienced a schooling extension at the lower high
school level—we do not find evidence of such a reduction, estimating that the effect on maternal
3
mortality is not significantly different to zero.
All in all, this paper generates new data on maternal mortality that is available for individuals
within regions and states of countries, and it provides what would appear to be the first systematic
consideration of the relationship between maternal mortality ratios and education. It opens up
several avenues for further research.
2 Literature
The medical literature suggests that maternal mortality is principally associated with labour, de-
livery and the early postpartum period; largely occuring between the third trimester of pregnancy
and the first post-partum week. The principal medical cause of these deaths is obstetric haem-
orrhage, a largely preventable cause provided “access to timely and competent obstetric care”
is available (Ronsmans and Graham, 2006). Along with haemorrhage, a number of other causes
are reported, including sepsis, abortion, hypertensive disorders, obstructed labour, embolism and
ectopic pregnancy2. Despite the fact that these complications account for the majority of deaths
during labour, birth and the post-partum period, the prevalence of each varies by region (Khan
et al., 2006). Whilst haemorrhage is the principal cause in developing regions, complications
from caesarian sections and anaesthesia are more common in developed countries, and other
region-specific disease burdens are noted (abortion in Latin America and the Caribbean, sepsis
and HIV in Africa and anaemia in Asia).
Much focus in the existing literature is on the difficulty of obtaining accurate statistics of
maternal mortality, particularly in those areas where maternal mortality is highest(Ronsmans and
Graham, 2006; McCarthy and Maine, 1992; McAlister and Baskett, 2006). The ability to compile
credible data is confounded by the lack of consistent classification prior to the introduction
of ICD-9 coding, the need to collect data from an array of data sources, misclassification of
maternal death, significant under-reporting of maternal mortality, and missing and incomplete
data(Yazbeck, 2012; Hogan et al., 2010).
Early work3 in the medical literature highlighted the importance of addressing the ‘proximal
causes’ or inputs of maternal mortality; namely the likelihood that a women becomes pregnant,
2Highly cited figures (AbouZahr et al., 1991) suggest figures of 25% due to haemorrhage, 20% due to indirectcauses, 15% due to infection, 13% due to abortions, 12% due to eclampsia, 8% to obstructed labour and 8% toother direct causes. Khan et al. (2006) provide evidence broadly in agreement with these values however notethat these estimates suffer from large confidence intervals.
3The Safe Motherhood Initiative of 1987 was put in place in response to the increasing recognition of this topicin developing countries.
4
or the likelihood of complications (and the treatment of these complications) conditional upon
her becoming pregnant (McCarthy and Maine, 1992; Goodburn and Campbell, 2001; Trussell
and Pebley, 1984). Along with attendence and medical care for mothers during pregnancy and
child birth, these studies suggest that altering maternal age, quantity of births, and spacing
of births could have a considerable effect on rates of maternal mortality. More recent medical
studies also suggest that socioeconomic factors are fundamental in the reduction of maternal
mortality. Costello et al. (2004), for example, argue that the focus on primary care and skilled
attendance is not a sufficient strategy, citing considerable reductions in maternal mortality fol-
lowing community-based interventions4. McAlister and Baskett (2006) suggest that social—and
specifically gender-specific factors such as female education—should predict maternal mortality,
demonstrating cross-country correlation between these variables. Recent work from Ahmed et al.
(2012) suggests that family planning inputs would allow for considerable reductions in maternal
deaths world-wide, with the authors estimating that the equivalent of 44% of maternal deaths in
2008 were averted due to contraceptive use, and that meeting unmet demand for family planning
could prevent a further 29%.
3 Methodology
3.1 Cross-Country Analysis
In order to examine the effect of educational expansions on maternal mortality, we run country-
level regressions of the following form:
MMRit = αi + educitβ + Witγ + δt + εit, (1)
where MMRit refers to the maternal mortality rate in country i and period t, educit to a series
of variables measuring the percent of the population with a given level of education, and Wit
refers to a vector of relevant country- and time-varying covariates. Given that we have both tem-
poral and regional variation in the variables of interest, we employ a fixed-effects methodology
which allows for us to control for all time-fixed country-specific factors which may confound the
analysis in (1). The ability to eliminate these time invariant factors is particularly important in
this analysis, given that many unobserved factors, such as the institutional and political aspects
of a given country, are likely to be correlated with both maternal mortality and educational at-
tainment. Whilst some of these variables are not strictly “time-invariant”, they evolve sufficiently
4Also see Manandhar et al. (2004) for the results of a randomized trial of community-based meetings.
5
slowly that our analysis over a comparatively short time horizon will mean that a fixed-effect
estimator will largely control for them. We cluster standard errors at the level of the country
(allowing for the stochastic term uit to be correlated over time for each i.)
We are able to estimate (1) for a number of different subgroups. Whilst we primarily focus on
women of reproductive age, our data allows us to run a similar analysis for educational attainment
of both gender groups and for various age subgroups created within the fertile age range. We
also segregate countries by region- and income-level, and present group-specific estimates of the
above specification. A full list of the educational variables which we use and a description of the
time varying covariates Wit is provided in the data section of this document.
3.2 Natural Experiments
In addition to (1) which we estimate with panel data, we focus on a number of country-specific
cases in countries which have experienced isolated, policy-defined expansions in schooling achieve-
ment. Such expansions allow for us to causally identify the effect of education on maternal
mortality if we believe that we can identify similar subgroups of individuals who are differen-
tially affected by these isolated shocks to education. In these country case studies, we construct
comparable subgroups of women who entered school on either side of an important educational
reform. We exploit variation in the intensity of treatment between regions and cohorts of birth
to estimate the effect of educational expansions on maternal mortality.
Prominent educational reforms discussed in the economics literature are listed below in table
1. Of the reforms listed here, we identify three which are suitable to use as natural experiments to
identify the effect of education on maternal mortality. There are Nigeria, Zimbabwe, and Kenya.
Of the other three cases listed, they were either not examined as they occurred too recently to
observe the outcome of interest (maternal mortality) or because microdata for maternal mortality
outcomes was not available for the country in question. For each of the three natural experiments
examined, we briefly describe the nature of the reform, and the identification strategy used in
estimation.
3.2.1 Nigeria 1976
The Universal Primary Education (UPE) programme was initiated in Nigeria in September 1976
as a national programme directed at primary school enrolment. This programme involved the
6
provision of free primary school education, along with significant classroom construction (Osili
and Long, 2008). The gross primary enrolment rate doubled between 1974 and 1981 for male
students, and nearly tripled for females. Osili and Long (2008) suggest using a double-differences
identification strategy in which women from cohorts born between 1970 and 1975 in high-intensity
states5 act as the treatment group. As per Osili and Long, rather than opt for a control group
immediately older than the treatment group, we examine women born between 1956-1961 in order
for our analysis to not be confounded by over- and under-age enrolments in primary school. We
also examine the effect on cohorts born between 1965 and 1970, which may be partially affected
by the reform given over-age enrolment in primary school.
Two measures of treatment intensity are defined: a dummy for those living in high-intensity
states, and a measure of federal capital funds dispersed per capita in each state in 1976 (the year
of the reform)6. The effect of UPE on schooling and maternal mortality is then estimated using
a difference-in-difference framework:
yijk = α+β UPE Cohortjk+γUPE Inputk+δ(UPE Inputk×UPE Cohortjk)+X′ijkθ+εijk. (2)
The schooling and maternal mortality outcomes (y) for individual i in cohort j and state k are
regressed on controls for year of birth, religion, ethnicity, and additional controls for groups
differentially affected by the 1967-70 civil war (see Akresh et al. (2012) for further discussion.)
The UPE Cohort dummy captures whether an individual was of primary school age at the time
of the reform (year of birth between 1970 and 1975 inclusive), and UPE Input is a dummy for
whether an invididual resides in a treatment high-intensity state, or the investment per capita
of a given individual’s state as discussed above. For educational outcomes we expect that δ—
the reduced form estimate of the effect of UPE—should be positive, and, if education reduces
maternal mortality, that δ < 0 for maternal mortality outcomes. Further details and summary
statistics for outcome and treatment variables are provided in section 4.
3.2.2 Zimbabwe 1980
Aguero and Bharadwaj (2010) use extensions of schooling availability to black citizens in 1980
after independence in Zimbabwe to isolate the effect of education on health investments. This
extension in years of education was observed in high-school age students, with the authors demon-
5Prior to the UPE program the non-Western states of Nigeria had low primary enrolment rates and low levelsof investment per capita. With the introduction of the UPE, these states experienced a considerable expansionin educational investments (Osili and Long, 2008), and so are defined as ‘high-intensity’ states.
6Two additional treatment measures are examined by interacting funds per capita with treatment state, andfunds per capita with number of years affected by the treatment. Further details are available as notes to Table6a
7
strating a discontinuity between the ages of 14 and 15. The reform in question occurred in April
1980, and has been used in the literature in earlier papers (see for example Edwards (1995)).
In estimating the effect of the reform we follow Aguero and Bharadwaj (2010) in estimating
around the discontinuity in educational attainment between the cohorts aged 14 and 15 in 1980:
yij = β1DumAgeij+β2DumAgeij×(Age80ij−14)+β3(1−DumAgeij)×(Age80ij−14)+X′ijθ+εij .
(3)
Here DumAge takes the value of 1 for those aged 14 or less in 1980, and 0 for all women aged
over 14 in 1980, and linear trends are fitted on each side of this cutoff.7 The Xij vector includes
controls for age at 1980, survey fixed-effects, region fixed effects, and a rural dummy variable.
In this context β1 is the reduced-form estimate of the effect of the expansion on education and
maternal mortality outcome variables.
3.2.3 Kenya 1985
A primary school reform in Kenya in 1985 resulted in a change in the structure of education
from a “7-4-2- 3” system (7 years primary education, 4 years of lower secondary, 2 years of upper
secondary, and 3 years of tertiary) to an “8-4-4” system. Significantly, this means an increase by
one year in required primary schooling to receive the Kenyan Certificate of Primary Education
(KCPE). This reform was sharp, taking place nationally in January of 1985 by allowing no
students to progress from primary to secondary education in this school year. Chicoine (2011)
shows that this has a significant impact on years of completed schooling, both for those women
who complete only primary school, as for those women who progress to secondary education.
Chicoine (2011) demonstrates that for those individuals born prior to or in 1963, there is null
(or very low) probability that they will be treated by the 1985 reform in Kenya. For those born
between 1963 and 1972, the probability of treatment is an increasing function of birth year,
and for those born post-1972 they are treated with a probability of 1 (where ‘treatment’ implies
matriculating to secondary school after 1985, and hence completing an additional year of primary
schooling).
A treatment variable is then defined in line with the probability that an individual in each
cohort is affected by the reform. This variable is approximately identical to that defined by
7This is in line with that suggested by Aguero and Bharadwaj (2010). We also present results estimated witha quadratic and cubic trend.
8
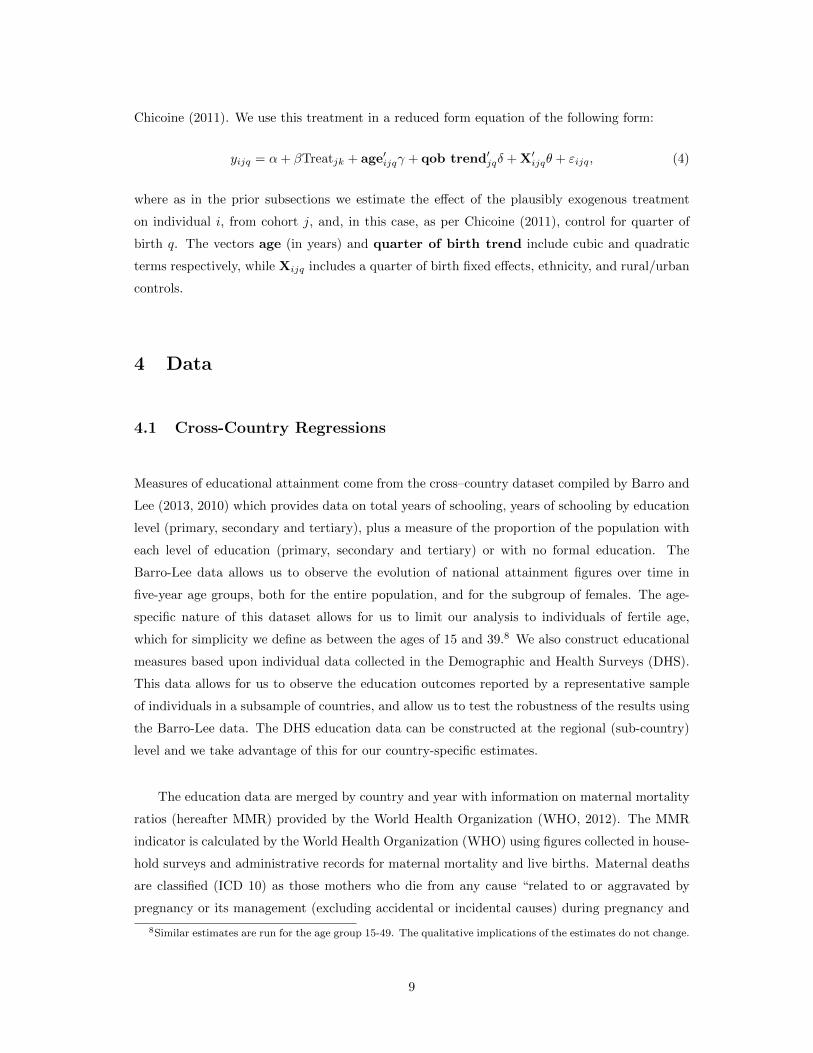
Chicoine (2011). We use this treatment in a reduced form equation of the following form:
yijq = α+ βTreatjk + age′ijqγ + qob trend′
jqδ + X′ijqθ + εijq, (4)
where as in the prior subsections we estimate the effect of the plausibly exogenous treatment
on individual i, from cohort j, and, in this case, as per Chicoine (2011), control for quarter of
birth q. The vectors age (in years) and quarter of birth trend include cubic and quadratic
terms respectively, while Xijq includes a quarter of birth fixed effects, ethnicity, and rural/urban
controls.
4 Data
4.1 Cross-Country Regressions
Measures of educational attainment come from the cross–country dataset compiled by Barro and
Lee (2013, 2010) which provides data on total years of schooling, years of schooling by education
level (primary, secondary and tertiary), plus a measure of the proportion of the population with
each level of education (primary, secondary and tertiary) or with no formal education. The
Barro-Lee data allows us to observe the evolution of national attainment figures over time in
five-year age groups, both for the entire population, and for the subgroup of females. The age-
specific nature of this dataset allows for us to limit our analysis to individuals of fertile age,
which for simplicity we define as between the ages of 15 and 39.8 We also construct educational
measures based upon individual data collected in the Demographic and Health Surveys (DHS).
This data allows for us to observe the education outcomes reported by a representative sample
of individuals in a subsample of countries, and allow us to test the robustness of the results using
the Barro-Lee data. The DHS education data can be constructed at the regional (sub-country)
level and we take advantage of this for our country-specific estimates.
The education data are merged by country and year with information on maternal mortality
ratios (hereafter MMR) provided by the World Health Organization (WHO, 2012). The MMR
indicator is calculated by the World Health Organization (WHO) using figures collected in house-
hold surveys and administrative records for maternal mortality and live births. Maternal deaths
are classified (ICD 10) as those mothers who die from any cause “related to or aggravated by
pregnancy or its management (excluding accidental or incidental causes) during pregnancy and
8Similar estimates are run for the age group 15-49. The qualitative implications of the estimates do not change.
9
childbirth or within 42 days of termination of pregnancy. . . ”.9 Given concerns of underreporting
by member states and the difficulty in compiling accurate measures of maternal mortality, point
estimates are reported along with confidence intervals in the MMR dataset used.
Merging Barro-Lee and MMR data results in a panel of 146 countries with observations
over a period of 20 years (1990-2010). Both sets of data provide observations on a 5-yearly
cycle; 1990, 1995, 2000, 2005 and 2010. To this main dataset we add measures for the log of
GDP per capita, immunization rates—which we consider an imperfect proxy for national health
expenditures—and fertility which are accessed from The World Bank Data Bank. We construct
two further variables for the analysis by combining results from household surveys with available,
but sporadic, cross-country measures. In order to control for births attended by skilled health
staff and for the adolescent fertility rate, we use household data from the Demographic and
Health Surveys (DHS) for that subset of countries and time periods for which a DHS survey is
available. Where DHS data is not available, we access more complete cross-country data provided
by The World Bank (2013) Data Bank. A precise description of what these variables represent
and how they are constructed is provided in appendix A. The full merged dataset is available for
download from the authors’ webpage.
The estimation sample with non-missing data for all relevant variables contains 108 countries
observed quinquennially through 1990-2010. The panel is unbalanced containing gaps in years
in which attended births or adolescent fertility observations are not available. A full list of
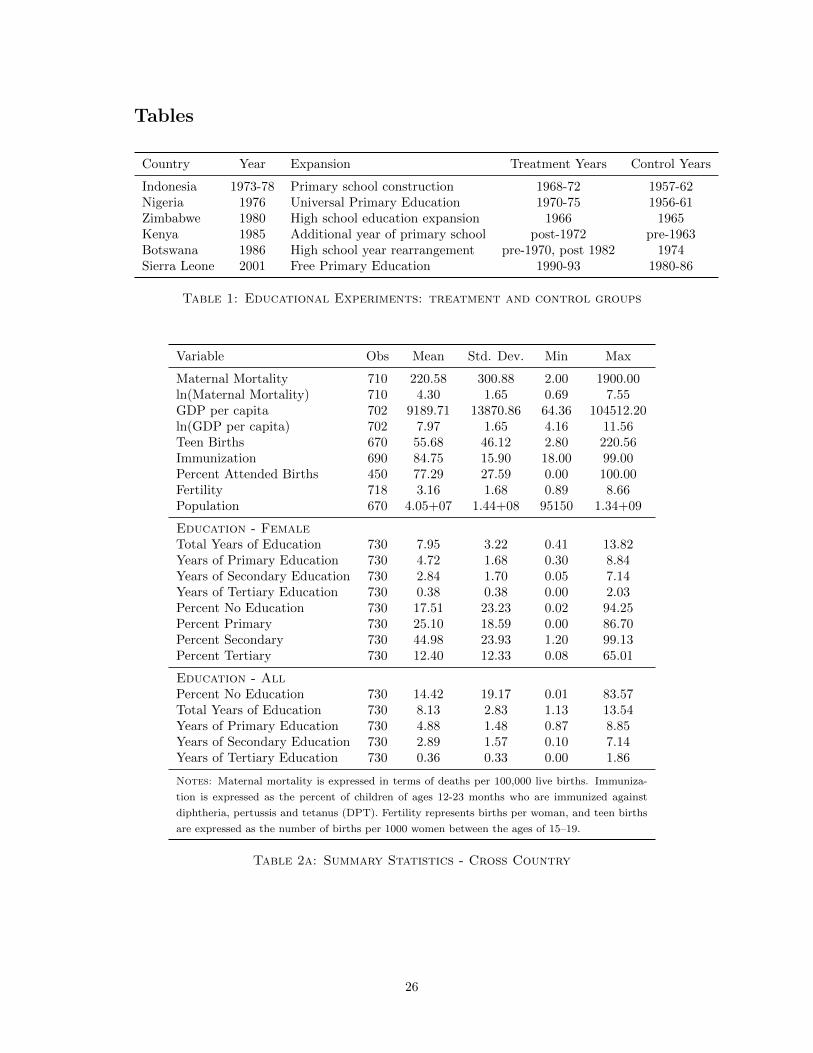
countries and years of availability is presented in table 6 in appendix B, and summary statistics
are presented in table 2a below.
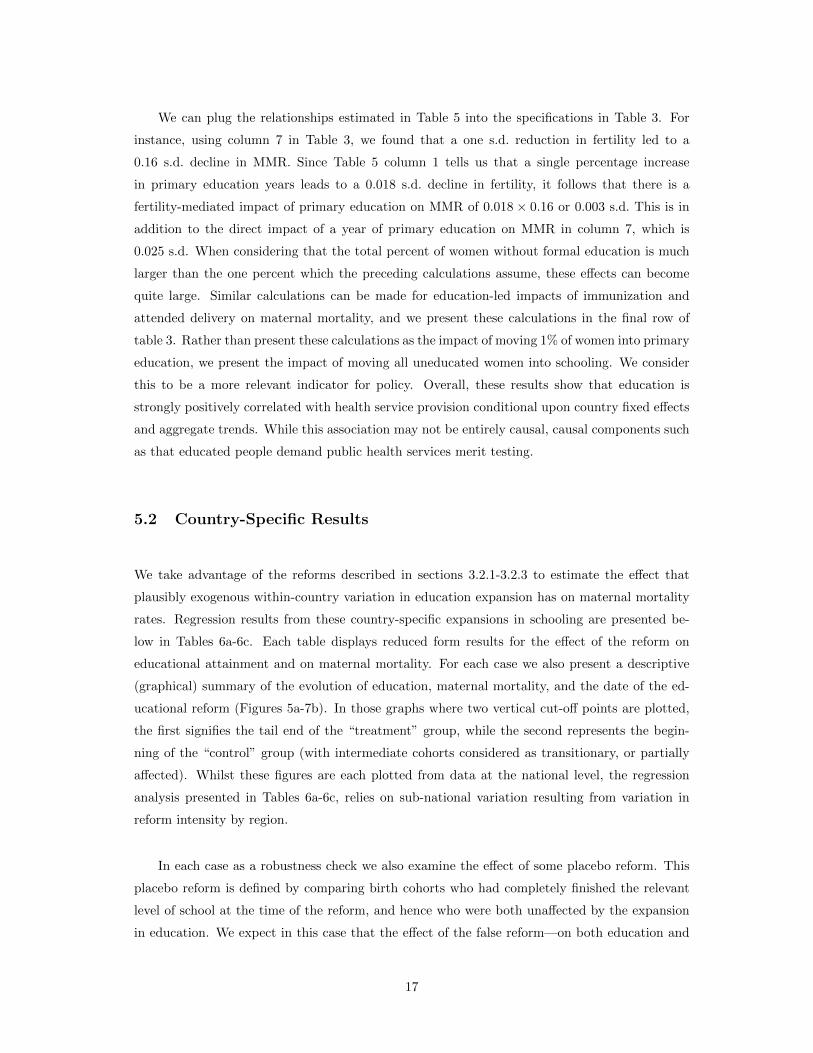
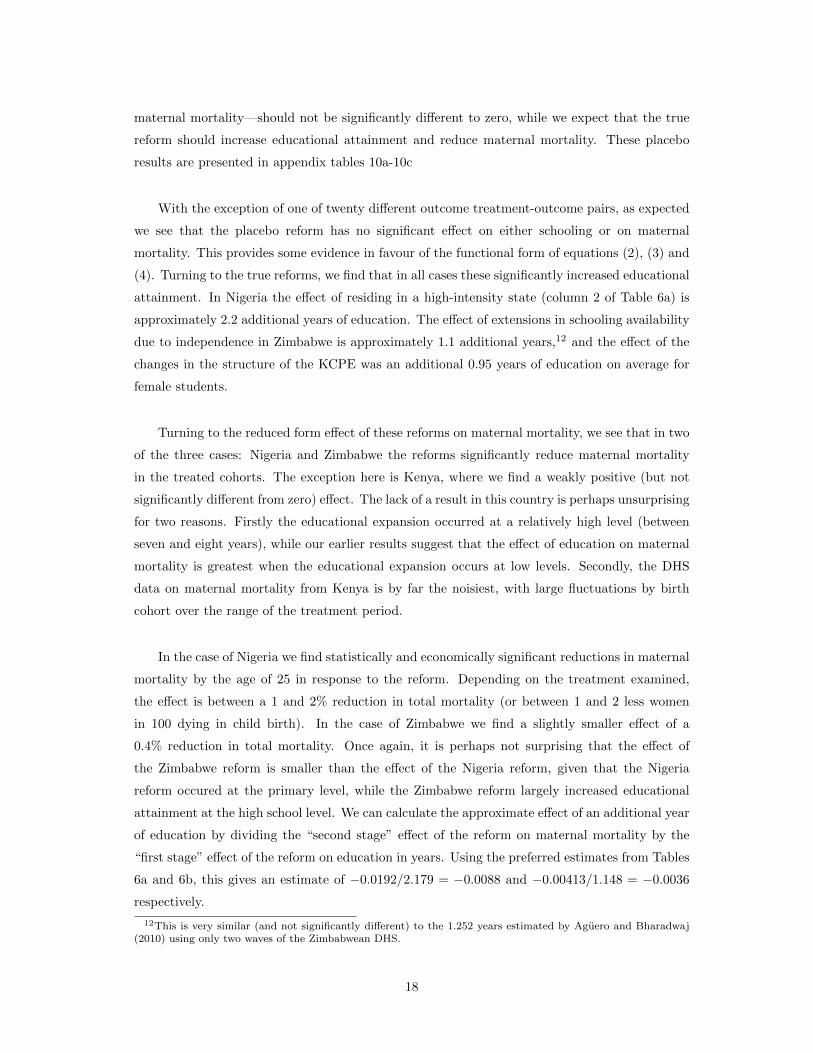
Trends in maternal mortality and education in the cross-country sample are displayed in
figures 1-2. There is considerable variation both across time and continents, but overall a consis-
tently positive trend in years of schooling, and a negative trend in regional maternal mortality
figures. Exceptionally, in sub-Saharan Africa, maternal mortality stagnated between 1990-1995,
beginning to fall in line with other regions during the late 1990s and early 2000s.
Despite reductions in maternal mortality in sub-Saharan Africa, this region still had over-
whelmingly the highest rates of maternal death associated with childbirth in 2010 (Figure 4).
Whilst certain countries in South, Central and East Asia, along with Middle East and North
Africa, and Latin America have achieved ratios of less than 100 deaths per 100,000 births, all but
a small hand-full of sub-Saharan countries still have ratios which exceed 300 per 100,000 births.
9A full description is provided by The World Health Organization at http://apps.who.int/gho/
indicatorregistry/App_Main/view_indicator.aspx?iid=26
10
4.2 Natural Experiments
In order to focus on country-specific case studies, we use micro-level survey data from the De-
mographic and Health Surveys (DHS). These surveys focus on maternal and child health, and
have a module focusing on maternal mortality. This maternal mortality module of the DHS is
based upon the sisterhood method, where surveyed women are asked about sisters who have
died, and whether death was during or related to child-birth (Rutstein and Rojas, 2006). These
surveys allow us to calculate cohort specific maternal mortality rates, which can be combined
with similarly calculated cohort specific educational attainment figures. Given that we do not
have educational data on women who have died during childbirth and are not available to be
surveyed, we use the microdata from the DHS respondents themselves. Effectively we work with
two individual-level databases: a maternal mortality database of all sisters of respondents and
their survival status, and an education database with years of completed education of all survey
respondents.
Given that we observe data on each respondent’s sisters and their survival status, our mater-
nal mortality measure in this case is at the level of the woman, not at the level of the birth. While
in the cross-country specification (1) we examine deaths per 100,000 births, in each country case
we examine deaths per woman (or the probability that a woman dies in child birth) over her
fertile life. This latter measure is referred to as maternal mortality rate, and reflects both the risk
of maternal death per birth and the frequency of births in a population. The maternal mortality
rate and the maternal mortality ratio are not directly comparable without some measure of the
fertility in a given country. In the results section of this paper we use fertilty data described in
section 4.1 to provide a rough comparison of the results from cross-country and country-specific
estimates.
The DHS surveys interview women aged 15-49 at the time of the survey. To correct for the
fact that many women are interviewed before they have completed their fertility (younger cohorts
in the sample), as a robustness check we use the correction method discussed by Rutstein and
Rojas (2006) and Stanton et al. (1997). This involves weighting each age cohort by an adjustment
factor, which is calculated based upon its exposure to maternal mortality.10 We note however
that in the empirical strategies outlined in section 3.2, all identification is either based upon
a double-difference estimator, or includes appropriate cohort-specific trends, so we expect that
variation in exposure to maternal mortality should be accounted for even in the absence of this
correction.
10These adjustment factors have been calculated as 0.107, 0.206, 0.343, 0.503, 0.664, 0.882, and 0.900 for fiveage groups from 15-19 to 45-49 (respectively).
11
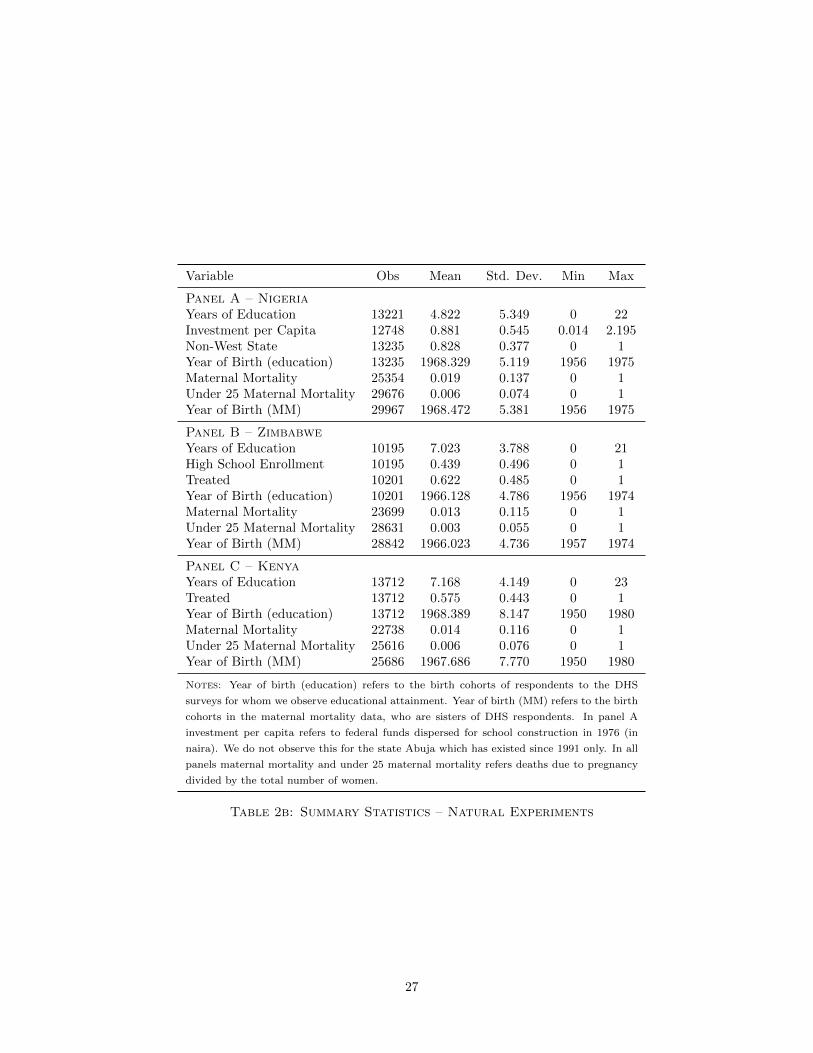
Table 2b presents summary statistics from the DHS data for each of these country-specific ex-
periments. In each case we present descriptive statistics for years of education, maternal mortality
rate, and treatment intensity, along with the time period examined in the natural experiment of
interest. In Zimbabwe and Kenya, the two countries in which the natural experiments occurred
at the secondary or upper-primary level, average educational attainment is approximately 7-8
years for all women in the sample, while in Nigeria, where the natural experiment of interest in-
volves primary school construction, average education in the cohorts of interest is approximately
5 years. In each case, over the entire range of cohorts examined, betwee 1 and 2 in every 100
women dies during child birth.
5 Results
5.1 Global
5.1.1 The Sensitivity of Maternal Mortality to Education (and Health Interven-
tions)
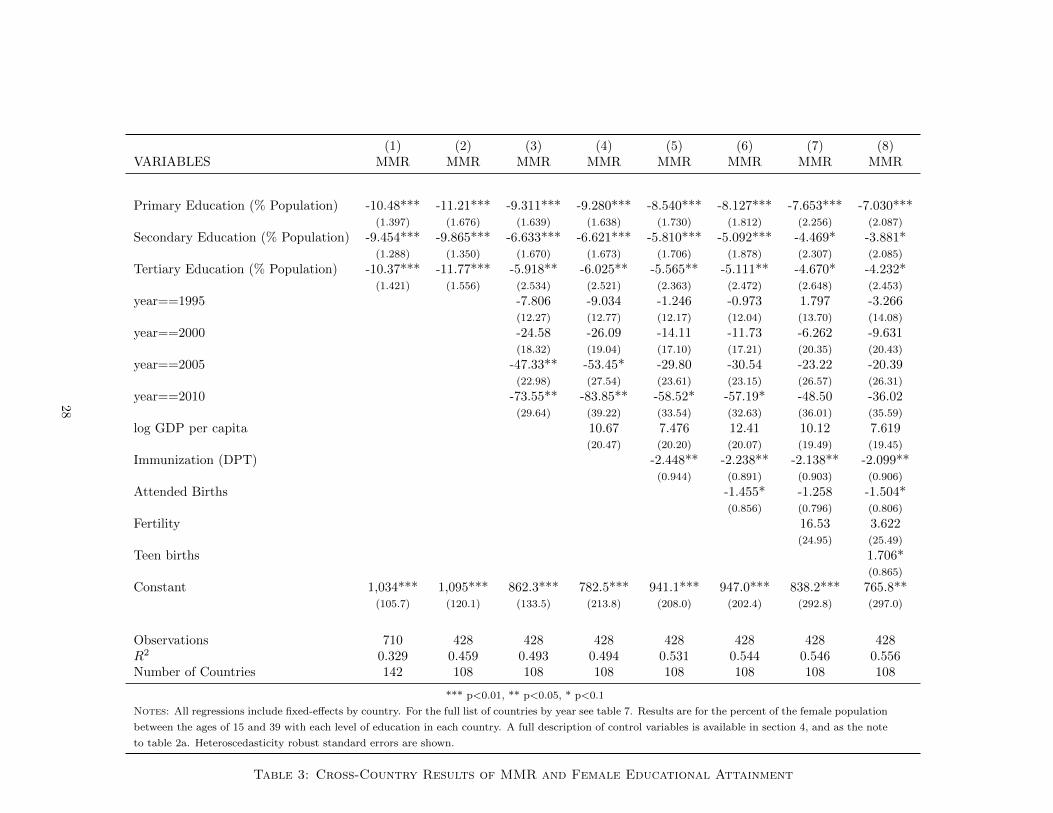
Table 3 provides results for our principal cross-country specification (1), estimated on cross-
country panel data for 108 developing countries observed at five yearly intervals in 1990-2010,
and using the percentage of people in a country and year who have attained specified levels
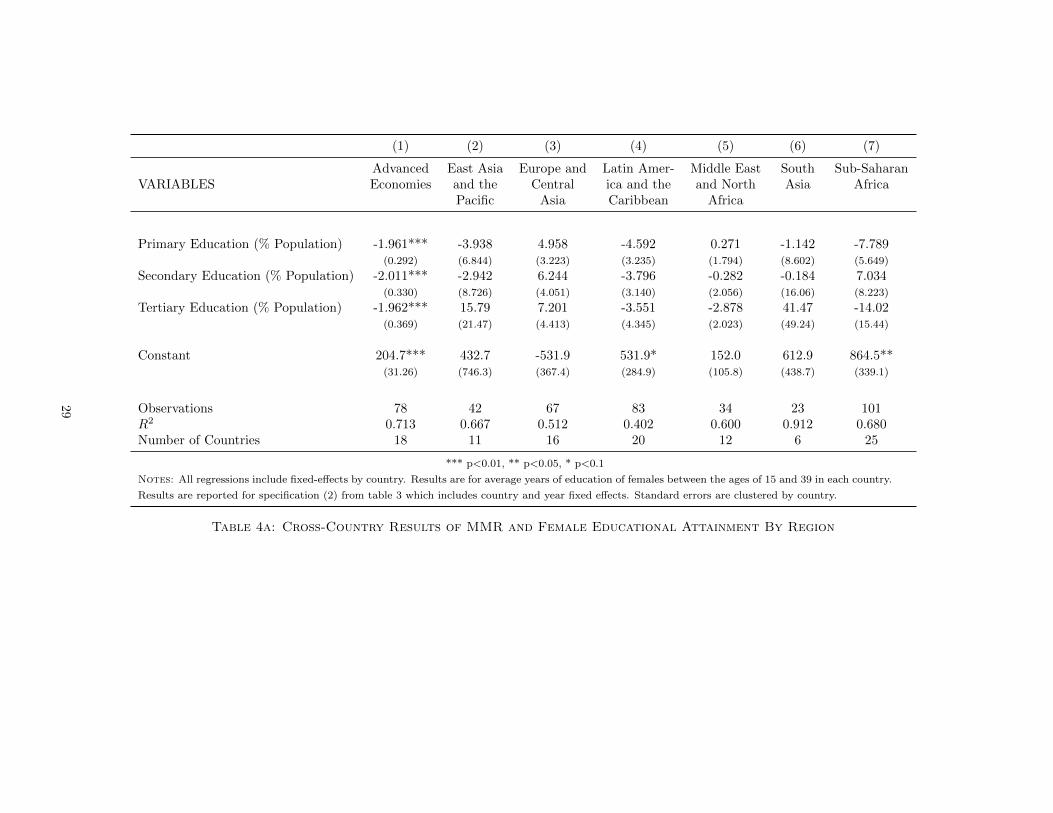
of education. We present similar results disaggregated by country income group and regional
classifications as tables 4a and 4b respectively. In order to test the robustness of our results to
alternative functional form specifications of the education variable, we run regressions using years
of education and years of education squared, and these results are included as appendix tables
8a and 8b. We start with a simple panel data specification in which the identifying variation is
within countries over time, with country fixed effects absorbing all country-specific time-invariant
components of, for instance, political institutions, climate, culture and deep-set attitudes towards
women that may produce a correlation between education and maternal mortality. We then add
flexible controls for aggregate trended unobservables and for country and time-varying variables
that we expect are correlated with education and maternal mortality.
The pooled within-country correlation of maternal mortality rates with women’s education
is significantly negative for the percent of the population attaining each education level. The
estimates suggest that the MMR-returns to investment in women’s education are positive and
weakly diminishing in level of education (this is confirmed by fitting a quadratic in total years
12
of education: the quadratic term is positive and significant but the turning point lies outside the
sample range). The point estimates are consistently largest for primary education but they are
not statistically significantly different from the estimates for higher levels of education.
The estimates are robust to the introduction of year dummies, and further time-varying
controls which reflect changes in the health and development status of a country. When examining
coefficients by region- and income-specific groups (tables 4a and 4b), we find that the relationship
between educational improvements and MMR reduction is larger in lower income environments
(consistent with their higher baseline rates of maternal mortality and their lower baseline levels
of education).
Column (2) is the favoured specification. It shows that, conditional upon aggregate trends in
maternal mortality, if an additional one percent of the population enrolled in primary education
this would lower the number of maternal deaths by 11 per 100,000 live births (The omitted group
is the percent of the population with no formal education). This coefficient is estimated with
precision (a p-value less than 0.01). It denotes a large impact, equivalent to 0.04 of a standard
deviation and 5% of the mean maternal mortality rate in the sample. It is illustrative to consider
the impact of moving the entire population of individuals with no education—on average 17.5%
of women—into enrolment in primary education. Our estimates suggest this would lower MMR
by 196 per 100,000 births, which is 0.68 of a s.d of total MMR. The addition of controls in the
remaining columns of the table lowers the coefficient on primary education but in no case is it
significantly different from the coefficient in column 2. In the richest model, conditional upon
controls for economic and health variables (column 7), the point estimate on primary education
is reduced to almost two thirds of its initial size (column 2). For policy purposes it can be useful
to look at the estimates conditional and unconditional upon alternative sets of controls since
cohort changes in primary education will sometimes evolve similarly to changes in the controls
that we introduce. We examine this in the following section.
Conditional on the controls introduced, the coefficients on secondary and tertiary education
also remain significant. An additional percent of the population moving into secondary education
lowers maternal mortality by 10 in 100,000 births. The effect of moving the sample population of
uneducated women of fertile age into secondary education is estimated to create a mean reduction
in maternal mortality of 172 (0.77 s.d.) in addition to the reduction of 196 associated with their
passage through primary education. So the total impact of moving all uneducated women into
secondary education is a reduction in MMR of 368 deaths per 100,000 births.
In columns 3-7 we introduce a succession of controls for the state of the economy, public
13
health care, and fertility. We control for the logarithm of per capita GDP so as to assess whether
education is simply proxying income. We find that it is not; the coefficients on education are
unchanged and the coefficient on GDP is insignificantly different from zero (column 3). This is
important, given that the most recent WHO factsheet on maternal mortality highlights differences
in maternal mortality ratios by income and not education (WHO, 2012).
Another widely recognised stylized fact highlighted in the WHO factsheet is that maternal
mortality is a function of health services. We investigate this, introducing into the equation,
DPT immunization rates for children as an indicator of the quality of public health provision.11
The coefficient on primary education falls by about one quarter but this drop is not statistically
significant. Immunization has a direct impact on maternal mortality. A one standard deviation
increase in immunization rates (which is 15.9% points) lowers maternal mortality by 39 per
100,000 birth, which is 0.14 s.d. or 20% of the mean (column 5).
We also include in the equation an index of health provision that is more directly related to
maternal mortality. Skilled care before, during and after childbirth is recognised in the public
health community to save the lives of both women and new-born babies. Maternal deaths tend
to occur because of bleeding and infection and timely management and treatment can make the
difference between life and death (WHO, 2012). India and Nepal for instance have, in the last
decade, introduced financial incentives to encourage women to give birth in facilities with birth
attendants rather than at home (Bauhoff et al., 2012; Powell-Jackson and Hanson, 2012). We find
that the percentage of births attended by a skilled professional is associated with lower maternal
mortality conditional upon immunization (column 8). A one s.d. increase in the percentage of
births attended (which is 27.6% points) results in a drop in MMR of 41 which is 0.14 s.d. or 19%
of the mean. Conditioning upon birth attendance does not alter the immunization coefficient.
The measure of maternal mortality that we use here is per live birth and so it is mechanically
a function of the number of live births in the country and, plausibly, a function of fertility (the
number of births per woman). Women in developing countries have on average many more
pregnancies than women in developed countries, and their lifetime risk of death due to pregnancy
is higher. A woman’s lifetime risk of maternal death—the probability that a 15 year old woman
will eventually die from a maternal cause—is 1 in 3,800 in developed countries, versus 1 in 150 in
developing countries. Introducing the fertility rate in column 7, we see that an additional birth
per mother is associated with an increase in maternal mortality of 28 per 100,000 live births or
11UNICEF for instance regards immunization rates as indicating the quality of overall public health provisionin developing countries. Most immunization is directed at children under the age of 12 (and sometimes up to 24)months and our measure of immunization rates pertains to children but it includes tetanus and tetanus injectionsfor pregnant mothers are part of routine prenatal care and in this way immunization rates may also directlyinfluence maternal mortality.
14
that a one s.d. increase in fertility (which is 1.7 births) leads to 48 additional maternal deaths,
which is 0.16 of a s.d. or 22% of mean fertility. In the main specification however it should be
noted that the effect of total fertility is weakly estimated, and not significant at typical levels of
confidence.
Teenage fertility is highly prevalent in developing countries, and this is closely associated
with women dropping out of school early. Adolescent women face relatively high risks of com-
plications and death as a result of pregnancy than older women (Conde-Agudelo et al., 2005;
Patton et al., 2009). Whether this is because such women are negatively selected or because they
are biologically more at risk is unclear and we know of no causal evidence on this. Introducing
into the model the percentage of women who give birth at age 15-19, we find a significantly
positive association. A one s.d. increase in the percent of teen births (which is 46 percentage
points) results in 81 more maternal deaths per 100,000 births, which is 0.27 s.d. and 37% of the
mean. Overall, in standardised terms, the association of maternal mortality with fertility and
the prevalence of teen births is stronger than its association with either health interventions or
education. It is well established that education tends to lower fertility and raise age at birth. In
standardized terms, the impacts of primary and secondary education, DPT immunization rates
and attended delivery on the maternal mortality ratio are almost identical, each conditional upon
the others. To the extent that standardized estimates are useful, this suggests that the payoff
to basic education in terms of a health sector outcome is equal to or larger than the payoff to
a common index of provision in the health sector. This contributes to a literature documenting
synergies between investments in education and health. It is of particular import for policy given
that WHO policy documents on maternal mortality have under-emphasised education.
Alternative specification of education The specification in appendix Table 8a (column
2) suggests that an additional year of education for all women lowers the number of maternal
deaths by 56 per 100,000 live births. A one standard deviation increase in years of education, of
3.21 years, would lower MMR by 180 per 100,000 births, which is 0.59 of a s.d. of MMR. The
introduction of controls—particularly the addition of immunization—renders the linear years of
education variable insignificant, although the coefficient is still negative. In appendix Table 8b
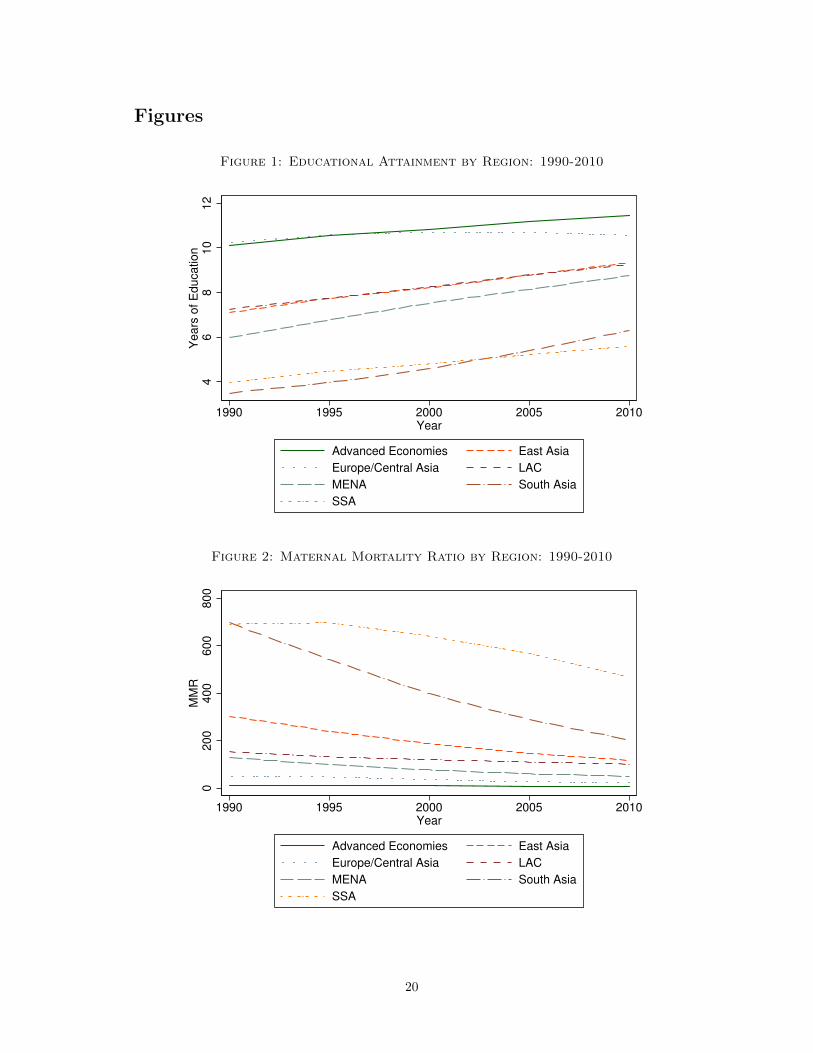
we show estimates using a quadratic in years of education, the functional form suggested by a
non-parametric plot of the relationship of interest (see Figure 3). The education coefficient is now
robust to the introduction of immunization and other controls. With the exception of fertility
which is now significant and of larger magnitude, other controls behave similarly in terms of their
effects on MMR as the estimates in Table 3 discussed earlier. The linear and quadratic terms
in education are significant and they indicate continuously positive but diminishing marginal
returns (in terms of MMR reductions) to years of education. The estimates in column 2 show
15
that moving from 0 to 1 year of education is associated with a reduction of 224 deaths per
100,000 live births, while moving from 5 to 6 years of education is associated with a smaller, but
still very significant, reduction of 98 maternal deaths per 100,000 births. In the model with all
controls (column 8) these estimates are attenuated slightly but still suggest significant effects:
reductions of 166 deaths and 56 deaths respectively when moving from 0 to 1 or from 5 to 6 years
of education.
Similarly, we present results examining the total percentage of women enrolled in primary
education (Table 9). Here we see that a 1% increase in total primary school enrollment in a given
country is associated with an average reduction of 10 maternal deaths per 100,000 live births
(unconditional), or a reduction of 7 deaths conditional on the full set of included controls. Given
that our summary statistics suggest that some 17.5% of women were unenrolled over all sample
years (or 13% in 2010), considerable reductions in maternal death could potentially be achieved
by providing education to this group.
5.1.2 Potential Pathways and Correlated Effects
The discussion in the preceding section establishes that declines in maternal mortality in de-
veloping countries have been associated with gains in education, improvements in public health
services and declines in fertility. Since our primary interest in this paper is in the benefits flowing
from education, in this section we consider the extent to which improvements in public health
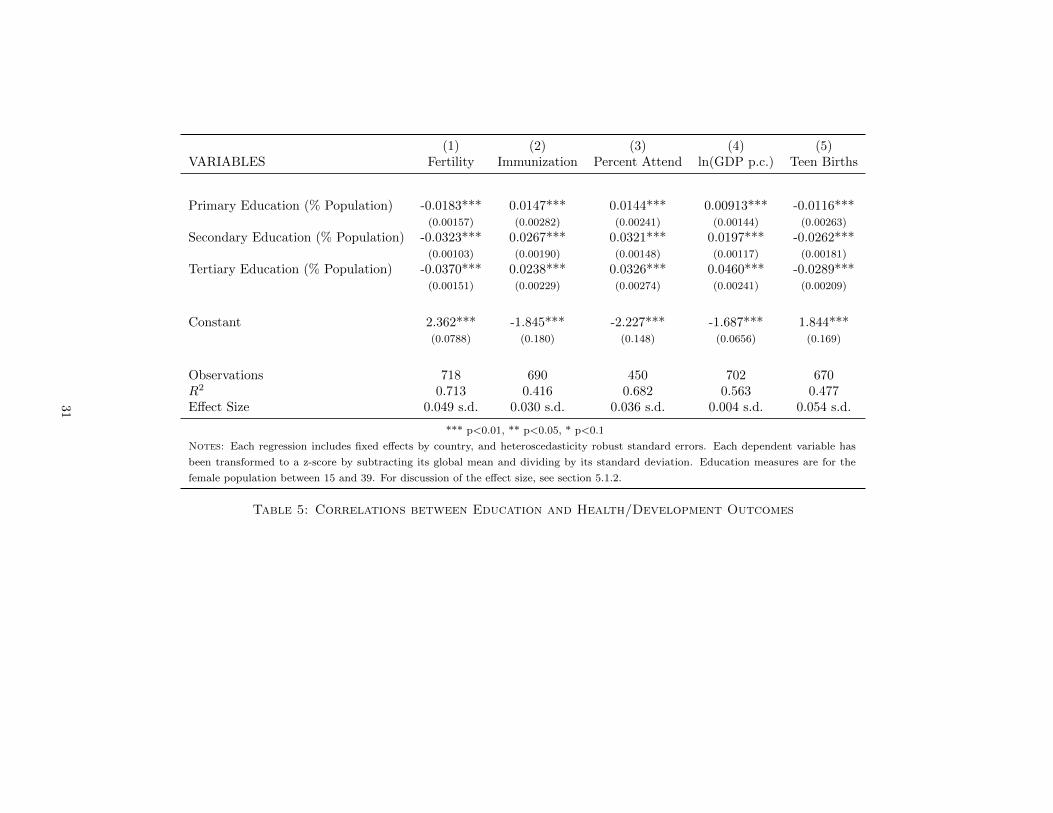
services and declines in fertility are themselves driven by improvements in education. We take
each of the controls that were used in Table 3 (including GDP which had no significant impact on
maternal mortality) and regress them on education conditional upon country fixed effects (Table
5):
fertit = α+ educ′itβ + W′iγ + uit. (5)
We see that increases in education are significant predictors of within-country variation in
fertility, immunization, the percentage of attended births and log per capita GDP. The dependent
variables in Table 5 have been cast as z-scores (see notes to Table 5) so the coefficients on the
education variables indicate the standard deviation change in the outcome flowing from a one
year increase in education at the specified level. For example, moving an additional percent of
non-school attendees into primary education results in a 0.018 s.d. decline in fertility; an increase
of approximately 0.014 s.d. in both immunization rates and attended births; and a 0.001 s.d.
increase in log GDP p.c. So education not only directly influences maternal mortality, it also is
strongly correlated with other determinants of maternal mortality.
16
We can plug the relationships estimated in Table 5 into the specifications in Table 3. For
instance, using column 7 in Table 3, we found that a one s.d. reduction in fertility led to a
0.16 s.d. decline in MMR. Since Table 5 column 1 tells us that a single percentage increase
in primary education years leads to a 0.018 s.d. decline in fertility, it follows that there is a
fertility-mediated impact of primary education on MMR of 0.018 × 0.16 or 0.003 s.d. This is in
addition to the direct impact of a year of primary education on MMR in column 7, which is
0.025 s.d. When considering that the total percent of women without formal education is much
larger than the one percent which the preceding calculations assume, these effects can become
quite large. Similar calculations can be made for education-led impacts of immunization and
attended delivery on maternal mortality, and we present these calculations in the final row of
table 3. Rather than present these calculations as the impact of moving 1% of women into primary
education, we present the impact of moving all uneducated women into schooling. We consider
this to be a more relevant indicator for policy. Overall, these results show that education is
strongly positively correlated with health service provision conditional upon country fixed effects
and aggregate trends. While this association may not be entirely causal, causal components such
as that educated people demand public health services merit testing.
5.2 Country-Specific Results
We take advantage of the reforms described in sections 3.2.1-3.2.3 to estimate the effect that
plausibly exogenous within-country variation in education expansion has on maternal mortality
rates. Regression results from these country-specific expansions in schooling are presented be-
low in Tables 6a-6c. Each table displays reduced form results for the effect of the reform on
educational attainment and on maternal mortality. For each case we also present a descriptive
(graphical) summary of the evolution of education, maternal mortality, and the date of the ed-
ucational reform (Figures 5a-7b). In those graphs where two vertical cut-off points are plotted,
the first signifies the tail end of the “treatment” group, while the second represents the begin-
ning of the “control” group (with intermediate cohorts considered as transitionary, or partially
affected). Whilst these figures are each plotted from data at the national level, the regression
analysis presented in Tables 6a-6c, relies on sub-national variation resulting from variation in
reform intensity by region.
In each case as a robustness check we also examine the effect of some placebo reform. This
placebo reform is defined by comparing birth cohorts who had completely finished the relevant
level of school at the time of the reform, and hence who were both unaffected by the expansion
in education. We expect in this case that the effect of the false reform—on both education and
17
maternal mortality—should not be significantly different to zero, while we expect that the true
reform should increase educational attainment and reduce maternal mortality. These placebo
results are presented in appendix tables 10a-10c
With the exception of one of twenty different outcome treatment-outcome pairs, as expected
we see that the placebo reform has no significant effect on either schooling or on maternal
mortality. This provides some evidence in favour of the functional form of equations (2), (3) and
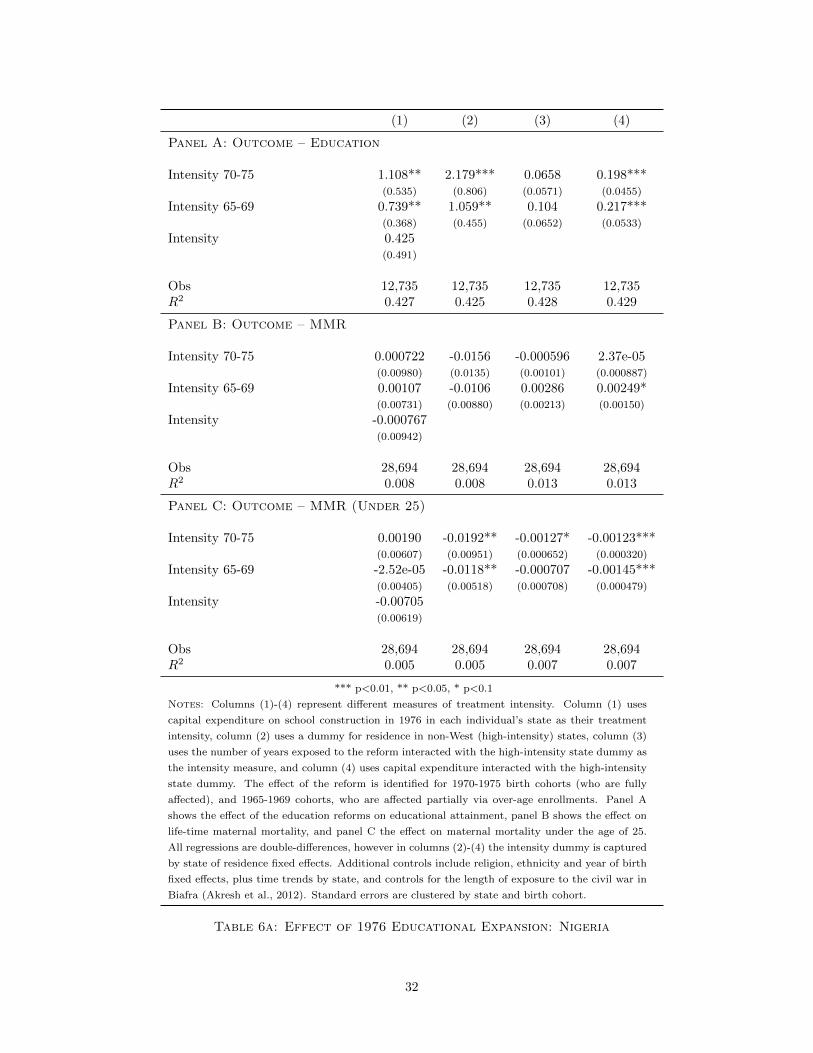
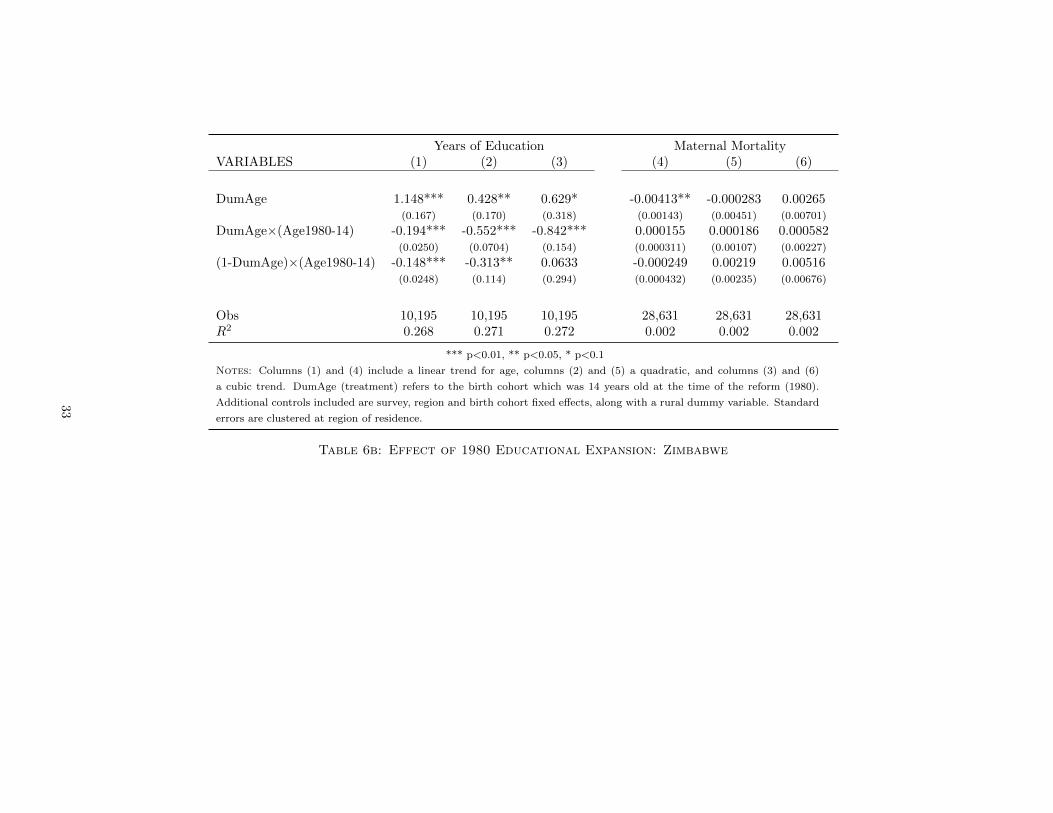
(4). Turning to the true reforms, we find that in all cases these significantly increased educational
attainment. In Nigeria the effect of residing in a high-intensity state (column 2 of Table 6a) is
approximately 2.2 additional years of education. The effect of extensions in schooling availability
due to independence in Zimbabwe is approximately 1.1 additional years,12 and the effect of the
changes in the structure of the KCPE was an additional 0.95 years of education on average for
female students.
Turning to the reduced form effect of these reforms on maternal mortality, we see that in two
of the three cases: Nigeria and Zimbabwe the reforms significantly reduce maternal mortality
in the treated cohorts. The exception here is Kenya, where we find a weakly positive (but not
significantly different from zero) effect. The lack of a result in this country is perhaps unsurprising
for two reasons. Firstly the educational expansion occurred at a relatively high level (between
seven and eight years), while our earlier results suggest that the effect of education on maternal
mortality is greatest when the educational expansion occurs at low levels. Secondly, the DHS
data on maternal mortality from Kenya is by far the noisiest, with large fluctuations by birth
cohort over the range of the treatment period.
In the case of Nigeria we find statistically and economically significant reductions in maternal
mortality by the age of 25 in response to the reform. Depending on the treatment examined,
the effect is between a 1 and 2% reduction in total mortality (or between 1 and 2 less women
in 100 dying in child birth). In the case of Zimbabwe we find a slightly smaller effect of a
0.4% reduction in total mortality. Once again, it is perhaps not surprising that the effect of
the Zimbabwe reform is smaller than the effect of the Nigeria reform, given that the Nigeria
reform occured at the primary level, while the Zimbabwe reform largely increased educational
attainment at the high school level. We can calculate the approximate effect of an additional year
of education by dividing the “second stage” effect of the reform on maternal mortality by the
“first stage” effect of the reform on education in years. Using the preferred estimates from Tables
6a and 6b, this gives an estimate of −0.0192/2.179 = −0.0088 and −0.00413/1.148 = −0.0036
respectively.
12This is very similar (and not significantly different) to the 1.252 years estimated by Aguero and Bharadwaj(2010) using only two waves of the Zimbabwean DHS.
18

How do these estimates compare with the cross-country estimates reported earlier? It turns
out that they match up rather unexpectedly well with cross-country estimates for the effect
of additional years of education. Recall that the cross-country estimates use WHO maternal
mortality ratios which are maternal deaths per live birth while the country specific estimates
use DHS maternal mortality rates which are maternal deaths per woman. In order to provide a
rough comparison, we use recent data (Central Intelligence Agency, 2012) on fertility per woman
for Zimbabwe and Nigeria to convert the maternal deaths per woman estimates calculated in
the paragraph above, to deaths per birth. These figures of 3.61 and 5.38 births per woman
(respectively), result in per-birth estimates of 0.0088/5.38 = 0.00164, and 0.0036/3.61 = 0.00010.
These correspond to an effect of 164 deaths per 100,000 live births (for an expansion at the lower
primary level), and 10 deaths per live birth for an expansion in high school. When we use the
years of schooling results from table 8b (column 8), we find that an expansion in schooling from
1 to 2 years results in a reduction in MMR of 150.5 deaths per 100,000 births, and an expansion
from 7 to 8 years results in a reduction of 14.75 deaths per 100,000 births: quite close to the
country-specific results from Nigeria and Zimbabwe.
6 Conclusion
In the last two decades, maternal mortality has declined sharply (by 50%) and education has
risen sharply. The analysis in this paper suggests that some part of the decline in maternal
mortality may be attributed to the rise in education. Using the cross-country data sample, we
use the changes in maternal mortality, education and the control variables in the analysis between
1990 and 2010 to crudely simulate the contribution of education. In this twenty year period, the
average percent of women with no formal education has fallen from 22 to 13%. Applying this
reduction of 9% to the estimates in Table 3 suggests that education will have led to a decline
in the maternal mortality ratio of 105 deaths per 100,000 births (unconditional) or about 71
(conditional upon health services and fertility which, we noted, are correlated with education).
The actual decline in the maternal mortality ratio in the same twenty year period in our sample is
119. This suggests that education gains in this period can explain roughly half or possibly more
of the observed decline in maternal mortality. Compare this with the role of attended births.
The percentage of attended births has risen from 72% to 82%. Our estimates suggest that this
will have led to a decline in MMR of 15 per 100,000 births. These simulations are only suggestive
but the evidence overall does suggest that the rapid growth in education in developing countries
may have made a substantial and largely unrecognised contribution to the dramatic declines in
maternal mortality witnessed in recent years.
19
Figures
Figure 1: Educational Attainment by Region: 1990-2010
46
810
12
Years
of E
ducation
1990 1995 2000 2005 2010Year
Advanced Economies East Asia
Europe/Central Asia LAC
MENA South Asia
SSA
Figure 2: Maternal Mortality Ratio by Region: 1990-2010
0200
400
600
800
MM
R
1990 1995 2000 2005 2010Year
Advanced Economies East Asia
Europe/Central Asia LAC
MENA South Asia
SSA
20
Figure 3: Maternal Mortality and Education: Functional Form
0500
1000
1500
2000
0 5 10 15Years of Schooling
MMR Fitted Values (linear)
Fitted Values (quadratic)
Notes to figure: Each point represents a country average of maternal deaths per 100,000 births.Education data is for women aged 15−39.
21
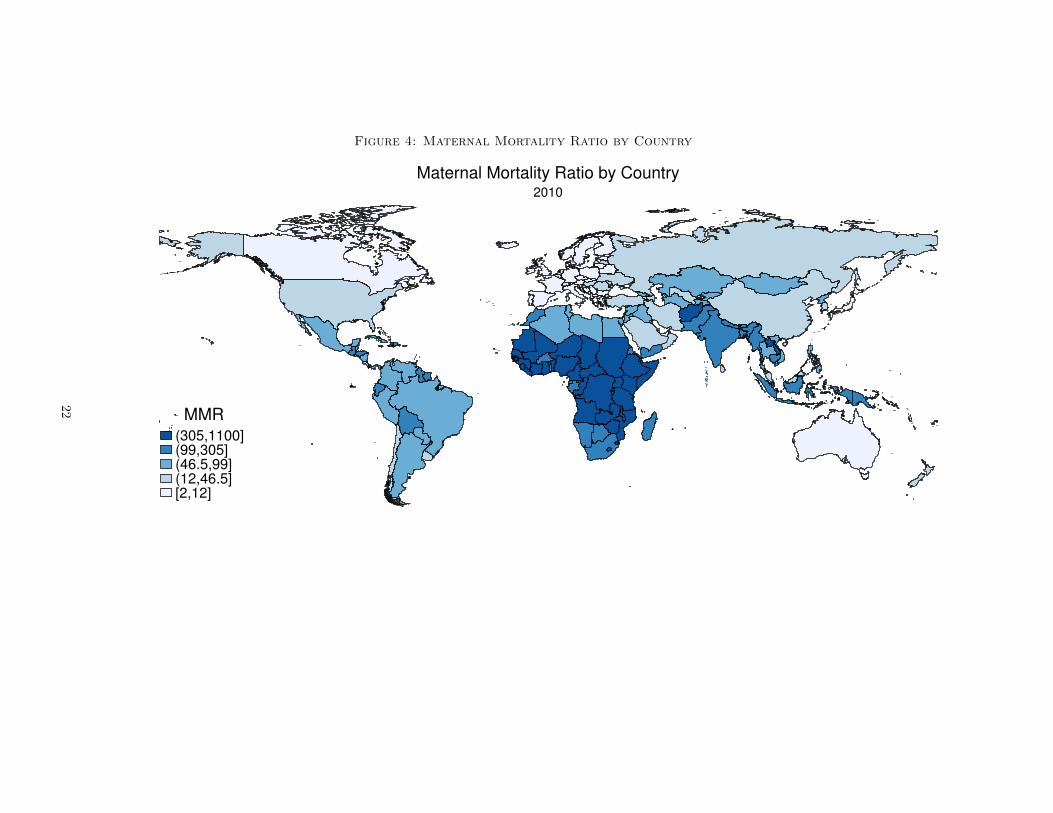
Figure 4: Maternal Mortality Ratio by Country
(305,1100](99,305](46.5,99](12,46.5][2,12]
MMR
2010
Maternal Mortality Ratio by Country
22
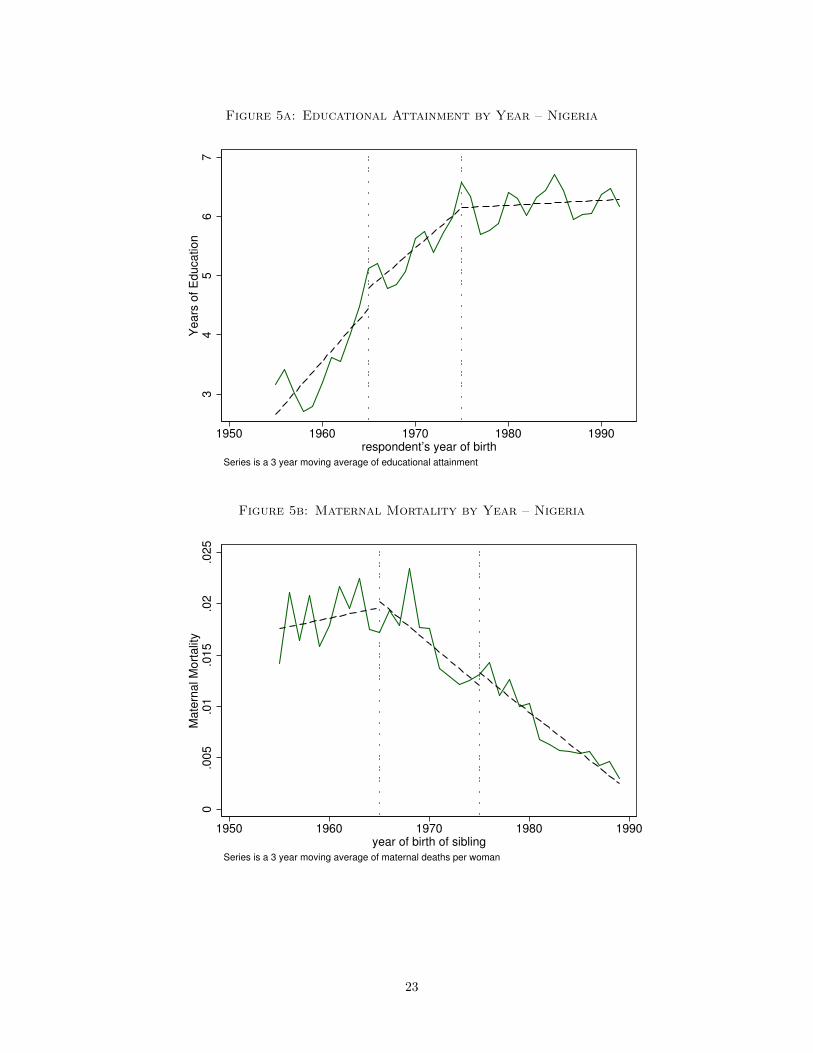
Figure 5a: Educational Attainment by Year – Nigeria
34
56
7Y
ears
of E
ducation
1950 1960 1970 1980 1990respondent’s year of birth
Series is a 3 year moving average of educational attainment
Figure 5b: Maternal Mortality by Year – Nigeria
0.0
05
.01
.015
.02
.025
Mate
rnal M
ort
alit
y
1950 1960 1970 1980 1990year of birth of sibling
Series is a 3 year moving average of maternal deaths per woman
23
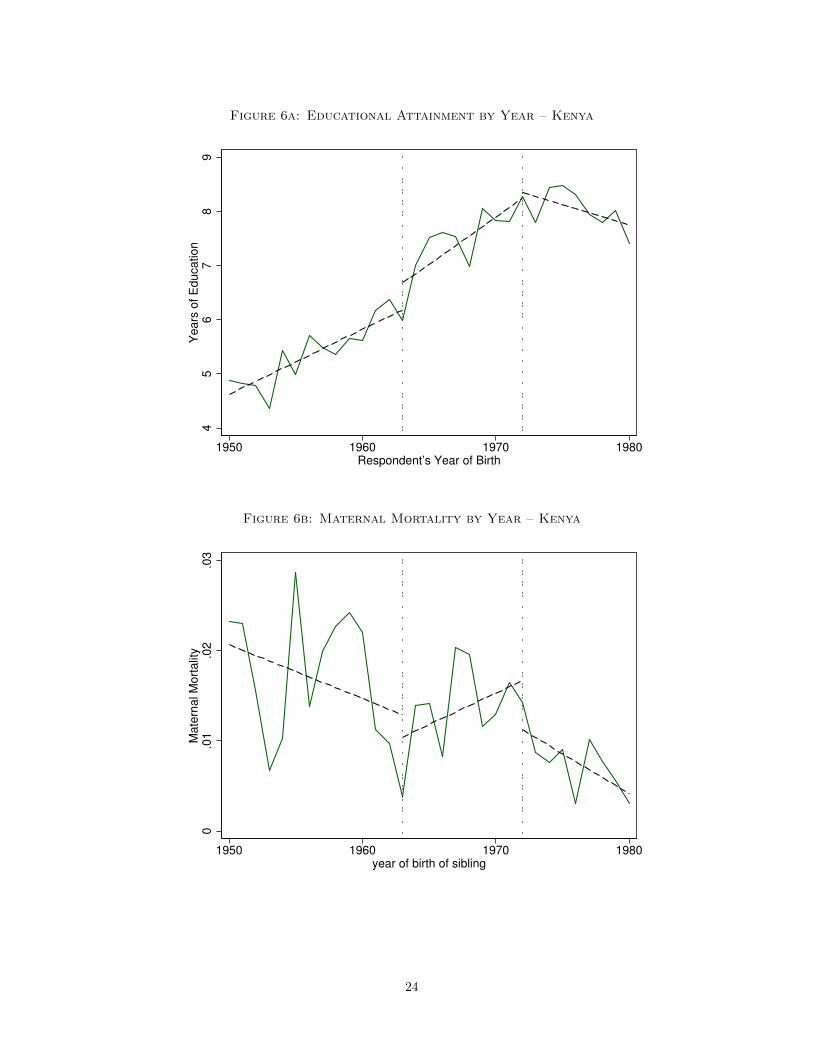
Figure 6a: Educational Attainment by Year – Kenya
45
67
89
Years
of E
ducation
1950 1960 1970 1980Respondent’s Year of Birth
Figure 6b: Maternal Mortality by Year – Kenya
0.0
1.0
2.0
3M
ate
rnal M
ort
alit
y
1950 1960 1970 1980year of birth of sibling
24
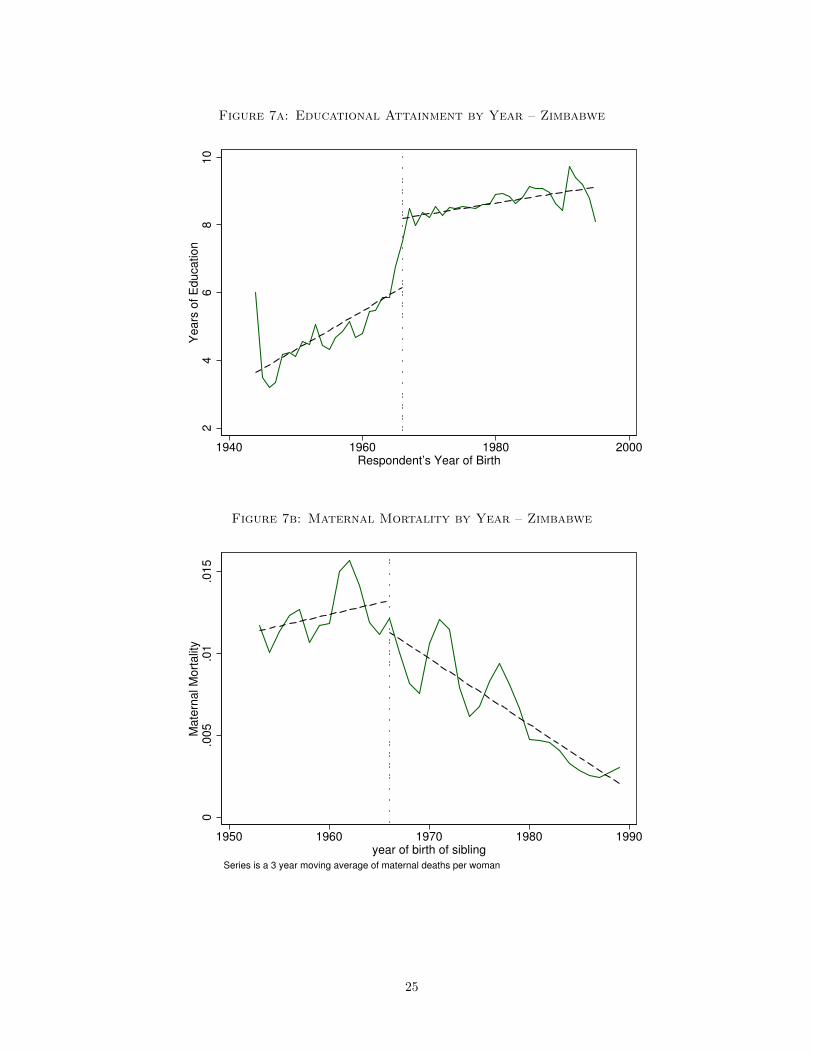
Figure 7a: Educational Attainment by Year – Zimbabwe
24
68
10
Years
of E
ducation
1940 1960 1980 2000Respondent’s Year of Birth
Figure 7b: Maternal Mortality by Year – Zimbabwe
0.0
05
.01
.015
Mate
rnal M
ort
alit
y
1950 1960 1970 1980 1990year of birth of sibling
Series is a 3 year moving average of maternal deaths per woman
25
Tables
Country Year Expansion Treatment Years Control Years
Indonesia 1973-78 Primary school construction 1968-72 1957-62Nigeria 1976 Universal Primary Education 1970-75 1956-61Zimbabwe 1980 High school education expansion 1966 1965Kenya 1985 Additional year of primary school post-1972 pre-1963Botswana 1986 High school year rearrangement pre-1970, post 1982 1974Sierra Leone 2001 Free Primary Education 1990-93 1980-86
Table 1: Educational Experiments: treatment and control groups
Variable Obs Mean Std. Dev. Min Max
Maternal Mortality 710 220.58 300.88 2.00 1900.00ln(Maternal Mortality) 710 4.30 1.65 0.69 7.55GDP per capita 702 9189.71 13870.86 64.36 104512.20ln(GDP per capita) 702 7.97 1.65 4.16 11.56Teen Births 670 55.68 46.12 2.80 220.56Immunization 690 84.75 15.90 18.00 99.00Percent Attended Births 450 77.29 27.59 0.00 100.00Fertility 718 3.16 1.68 0.89 8.66Population 670 4.05+07 1.44+08 95150 1.34+09
Education - FemaleTotal Years of Education 730 7.95 3.22 0.41 13.82Years of Primary Education 730 4.72 1.68 0.30 8.84Years of Secondary Education 730 2.84 1.70 0.05 7.14Years of Tertiary Education 730 0.38 0.38 0.00 2.03Percent No Education 730 17.51 23.23 0.02 94.25Percent Primary 730 25.10 18.59 0.00 86.70Percent Secondary 730 44.98 23.93 1.20 99.13Percent Tertiary 730 12.40 12.33 0.08 65.01
Education - AllPercent No Education 730 14.42 19.17 0.01 83.57Total Years of Education 730 8.13 2.83 1.13 13.54Years of Primary Education 730 4.88 1.48 0.87 8.85Years of Secondary Education 730 2.89 1.57 0.10 7.14Years of Tertiary Education 730 0.36 0.33 0.00 1.86
Notes: Maternal mortality is expressed in terms of deaths per 100,000 live births. Immuniza-
tion is expressed as the percent of children of ages 12-23 months who are immunized against
diphtheria, pertussis and tetanus (DPT). Fertility represents births per woman, and teen births
are expressed as the number of births per 1000 women between the ages of 15–19.
Table 2a: Summary Statistics - Cross Country
26
Variable Obs Mean Std. Dev. Min Max
Panel A – NigeriaYears of Education 13221 4.822 5.349 0 22Investment per Capita 12748 0.881 0.545 0.014 2.195Non-West State 13235 0.828 0.377 0 1Year of Birth (education) 13235 1968.329 5.119 1956 1975Maternal Mortality 25354 0.019 0.137 0 1Under 25 Maternal Mortality 29676 0.006 0.074 0 1Year of Birth (MM) 29967 1968.472 5.381 1956 1975
Panel B – ZimbabweYears of Education 10195 7.023 3.788 0 21High School Enrollment 10195 0.439 0.496 0 1Treated 10201 0.622 0.485 0 1Year of Birth (education) 10201 1966.128 4.786 1956 1974Maternal Mortality 23699 0.013 0.115 0 1Under 25 Maternal Mortality 28631 0.003 0.055 0 1Year of Birth (MM) 28842 1966.023 4.736 1957 1974
Panel C – KenyaYears of Education 13712 7.168 4.149 0 23Treated 13712 0.575 0.443 0 1Year of Birth (education) 13712 1968.389 8.147 1950 1980Maternal Mortality 22738 0.014 0.116 0 1Under 25 Maternal Mortality 25616 0.006 0.076 0 1Year of Birth (MM) 25686 1967.686 7.770 1950 1980
Notes: Year of birth (education) refers to the birth cohorts of respondents to the DHS
surveys for whom we observe educational attainment. Year of birth (MM) refers to the birth
cohorts in the maternal mortality data, who are sisters of DHS respondents. In panel A
investment per capita refers to federal funds dispersed for school construction in 1976 (in
naira). We do not observe this for the state Abuja which has existed since 1991 only. In all
panels maternal mortality and under 25 maternal mortality refers deaths due to pregnancy
divided by the total number of women.
Table 2b: Summary Statistics – Natural Experiments
27
(1) (2) (3) (4) (5) (6) (7) (8)VARIABLES MMR MMR MMR MMR MMR MMR MMR MMR
Primary Education (% Population) -10.48*** -11.21*** -9.311*** -9.280*** -8.540*** -8.127*** -7.653*** -7.030***(1.397) (1.676) (1.639) (1.638) (1.730) (1.812) (2.256) (2.087)
Secondary Education (% Population) -9.454*** -9.865*** -6.633*** -6.621*** -5.810*** -5.092*** -4.469* -3.881*(1.288) (1.350) (1.670) (1.673) (1.706) (1.878) (2.307) (2.085)
Tertiary Education (% Population) -10.37*** -11.77*** -5.918** -6.025** -5.565** -5.111** -4.670* -4.232*(1.421) (1.556) (2.534) (2.521) (2.363) (2.472) (2.648) (2.453)
year==1995 -7.806 -9.034 -1.246 -0.973 1.797 -3.266(12.27) (12.77) (12.17) (12.04) (13.70) (14.08)
year==2000 -24.58 -26.09 -14.11 -11.73 -6.262 -9.631(18.32) (19.04) (17.10) (17.21) (20.35) (20.43)
year==2005 -47.33** -53.45* -29.80 -30.54 -23.22 -20.39(22.98) (27.54) (23.61) (23.15) (26.57) (26.31)
year==2010 -73.55** -83.85** -58.52* -57.19* -48.50 -36.02(29.64) (39.22) (33.54) (32.63) (36.01) (35.59)
log GDP per capita 10.67 7.476 12.41 10.12 7.619(20.47) (20.20) (20.07) (19.49) (19.45)
Immunization (DPT) -2.448** -2.238** -2.138** -2.099**(0.944) (0.891) (0.903) (0.906)
Attended Births -1.455* -1.258 -1.504*(0.856) (0.796) (0.806)
Fertility 16.53 3.622(24.95) (25.49)
Teen births 1.706*(0.865)
Constant 1,034*** 1,095*** 862.3*** 782.5*** 941.1*** 947.0*** 838.2*** 765.8**(105.7) (120.1) (133.5) (213.8) (208.0) (202.4) (292.8) (297.0)
Observations 710 428 428 428 428 428 428 428R2 0.329 0.459 0.493 0.494 0.531 0.544 0.546 0.556Number of Countries 142 108 108 108 108 108 108 108
*** p<0.01, ** p<0.05, * p<0.1
Notes: All regressions include fixed-effects by country. For the full list of countries by year see table 7. Results are for the percent of the female population
between the ages of 15 and 39 with each level of education in each country. A full description of control variables is available in section 4, and as the note
to table 2a. Heteroscedasticity robust standard errors are shown.
Table 3: Cross-Country Results of MMR and Female Educational Attainment
28
(1) (2) (3) (4) (5) (6) (7)
Advanced East Asia Europe and Latin Amer- Middle East South Sub-SaharanVARIABLES Economies and the Central ica and the and North Asia Africa
Pacific Asia Caribbean Africa
Primary Education (% Population) -1.961*** -3.938 4.958 -4.592 0.271 -1.142 -7.789(0.292) (6.844) (3.223) (3.235) (1.794) (8.602) (5.649)
Secondary Education (% Population) -2.011*** -2.942 6.244 -3.796 -0.282 -0.184 7.034(0.330) (8.726) (4.051) (3.140) (2.056) (16.06) (8.223)
Tertiary Education (% Population) -1.962*** 15.79 7.201 -3.551 -2.878 41.47 -14.02(0.369) (21.47) (4.413) (4.345) (2.023) (49.24) (15.44)
Constant 204.7*** 432.7 -531.9 531.9* 152.0 612.9 864.5**(31.26) (746.3) (367.4) (284.9) (105.8) (438.7) (339.1)
Observations 78 42 67 83 34 23 101R2 0.713 0.667 0.512 0.402 0.600 0.912 0.680Number of Countries 18 11 16 20 12 6 25
*** p<0.01, ** p<0.05, * p<0.1
Notes: All regressions include fixed-effects by country. Results are for average years of education of females between the ages of 15 and 39 in each country.
Results are reported for specification (2) from table 3 which includes country and year fixed effects. Standard errors are clustered by country.
Table 4a: Cross-Country Results of MMR and Female Educational Attainment By Region
29
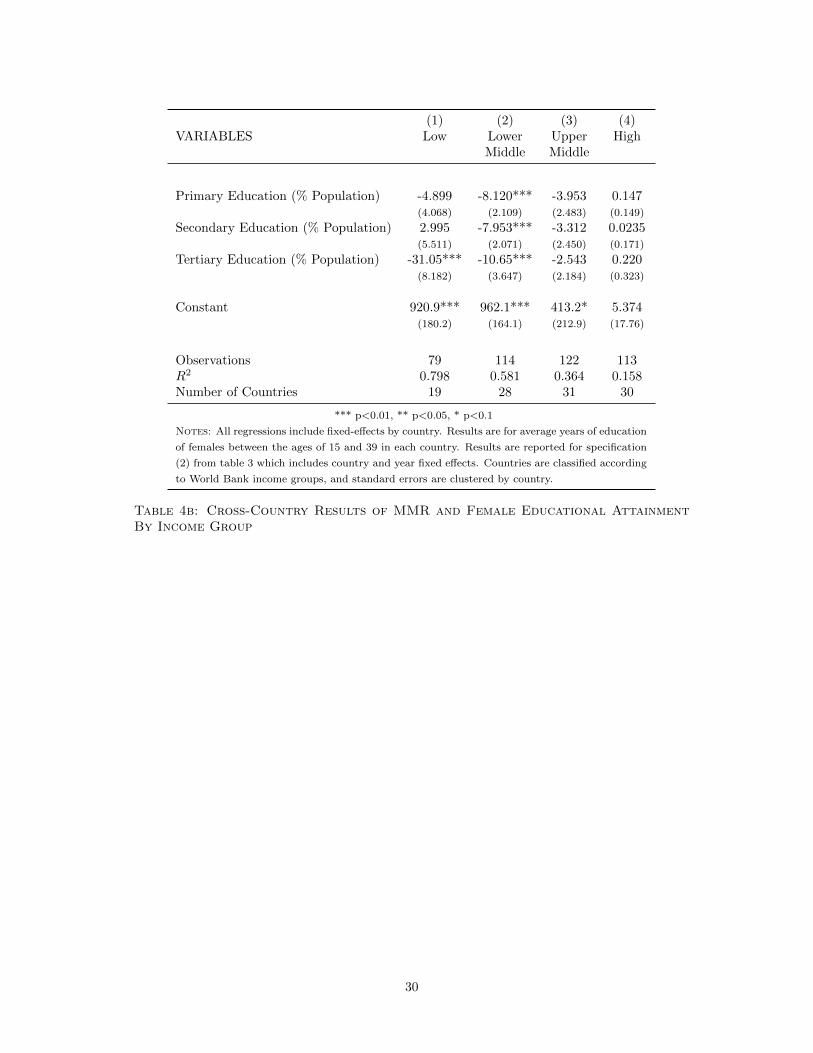
(1) (2) (3) (4)VARIABLES Low Lower Upper High
Middle Middle
Primary Education (% Population) -4.899 -8.120*** -3.953 0.147(4.068) (2.109) (2.483) (0.149)
Secondary Education (% Population) 2.995 -7.953*** -3.312 0.0235(5.511) (2.071) (2.450) (0.171)
Tertiary Education (% Population) -31.05*** -10.65*** -2.543 0.220(8.182) (3.647) (2.184) (0.323)
Constant 920.9*** 962.1*** 413.2* 5.374(180.2) (164.1) (212.9) (17.76)
Observations 79 114 122 113R2 0.798 0.581 0.364 0.158Number of Countries 19 28 31 30
*** p<0.01, ** p<0.05, * p<0.1
Notes: All regressions include fixed-effects by country. Results are for average years of education
of females between the ages of 15 and 39 in each country. Results are reported for specification
(2) from table 3 which includes country and year fixed effects. Countries are classified according
to World Bank income groups, and standard errors are clustered by country.
Table 4b: Cross-Country Results of MMR and Female Educational AttainmentBy Income Group
30
(1) (2) (3) (4) (5)VARIABLES Fertility Immunization Percent Attend ln(GDP p.c.) Teen Births
Primary Education (% Population) -0.0183*** 0.0147*** 0.0144*** 0.00913*** -0.0116***(0.00157) (0.00282) (0.00241) (0.00144) (0.00263)
Secondary Education (% Population) -0.0323*** 0.0267*** 0.0321*** 0.0197*** -0.0262***(0.00103) (0.00190) (0.00148) (0.00117) (0.00181)
Tertiary Education (% Population) -0.0370*** 0.0238*** 0.0326*** 0.0460*** -0.0289***(0.00151) (0.00229) (0.00274) (0.00241) (0.00209)
Constant 2.362*** -1.845*** -2.227*** -1.687*** 1.844***(0.0788) (0.180) (0.148) (0.0656) (0.169)
Observations 718 690 450 702 670R2 0.713 0.416 0.682 0.563 0.477Effect Size 0.049 s.d. 0.030 s.d. 0.036 s.d. 0.004 s.d. 0.054 s.d.
*** p<0.01, ** p<0.05, * p<0.1
Notes: Each regression includes fixed effects by country, and heteroscedasticity robust standard errors. Each dependent variable has
been transformed to a z-score by subtracting its global mean and dividing by its standard deviation. Education measures are for the
female population between 15 and 39. For discussion of the effect size, see section 5.1.2.
Table 5: Correlations between Education and Health/Development Outcomes
31
(1) (2) (3) (4)
Panel A: Outcome – Education
Intensity 70-75 1.108** 2.179*** 0.0658 0.198***(0.535) (0.806) (0.0571) (0.0455)
Intensity 65-69 0.739** 1.059** 0.104 0.217***(0.368) (0.455) (0.0652) (0.0533)
Intensity 0.425(0.491)
Obs 12,735 12,735 12,735 12,735R2 0.427 0.425 0.428 0.429
Panel B: Outcome – MMR
Intensity 70-75 0.000722 -0.0156 -0.000596 2.37e-05(0.00980) (0.0135) (0.00101) (0.000887)
Intensity 65-69 0.00107 -0.0106 0.00286 0.00249*(0.00731) (0.00880) (0.00213) (0.00150)
Intensity -0.000767(0.00942)
Obs 28,694 28,694 28,694 28,694R2 0.008 0.008 0.013 0.013
Panel C: Outcome – MMR (Under 25)
Intensity 70-75 0.00190 -0.0192** -0.00127* -0.00123***(0.00607) (0.00951) (0.000652) (0.000320)
Intensity 65-69 -2.52e-05 -0.0118** -0.000707 -0.00145***(0.00405) (0.00518) (0.000708) (0.000479)
Intensity -0.00705(0.00619)
Obs 28,694 28,694 28,694 28,694R2 0.005 0.005 0.007 0.007
*** p<0.01, ** p<0.05, * p<0.1
Notes: Columns (1)-(4) represent different measures of treatment intensity. Column (1) uses
capital expenditure on school construction in 1976 in each individual’s state as their treatment
intensity, column (2) uses a dummy for residence in non-West (high-intensity) states, column (3)
uses the number of years exposed to the reform interacted with the high-intensity state dummy as
the intensity measure, and column (4) uses capital expenditure interacted with the high-intensity
state dummy. The effect of the reform is identified for 1970-1975 birth cohorts (who are fully
affected), and 1965-1969 cohorts, who are affected partially via over-age enrollments. Panel A
shows the effect of the education reforms on educational attainment, panel B shows the effect on
life-time maternal mortality, and panel C the effect on maternal mortality under the age of 25.
All regressions are double-differences, however in columns (2)-(4) the intensity dummy is captured
by state of residence fixed effects. Additional controls include religion, ethnicity and year of birth
fixed effects, plus time trends by state, and controls for the length of exposure to the civil war in
Biafra (Akresh et al., 2012). Standard errors are clustered by state and birth cohort.
Table 6a: Effect of 1976 Educational Expansion: Nigeria
32
Years of Education Maternal MortalityVARIABLES (1) (2) (3) (4) (5) (6)
DumAge 1.148*** 0.428** 0.629* -0.00413** -0.000283 0.00265(0.167) (0.170) (0.318) (0.00143) (0.00451) (0.00701)
DumAge×(Age1980-14) -0.194*** -0.552*** -0.842*** 0.000155 0.000186 0.000582(0.0250) (0.0704) (0.154) (0.000311) (0.00107) (0.00227)
(1-DumAge)×(Age1980-14) -0.148*** -0.313** 0.0633 -0.000249 0.00219 0.00516(0.0248) (0.114) (0.294) (0.000432) (0.00235) (0.00676)
Obs 10,195 10,195 10,195 28,631 28,631 28,631R2 0.268 0.271 0.272 0.002 0.002 0.002
*** p<0.01, ** p<0.05, * p<0.1
Notes: Columns (1) and (4) include a linear trend for age, columns (2) and (5) a quadratic, and columns (3) and (6)
a cubic trend. DumAge (treatment) refers to the birth cohort which was 14 years old at the time of the reform (1980).
Additional controls included are survey, region and birth cohort fixed effects, along with a rural dummy variable. Standard
errors are clustered at region of residence.
Table 6b: Effect of 1980 Educational Expansion: Zimbabwe
33
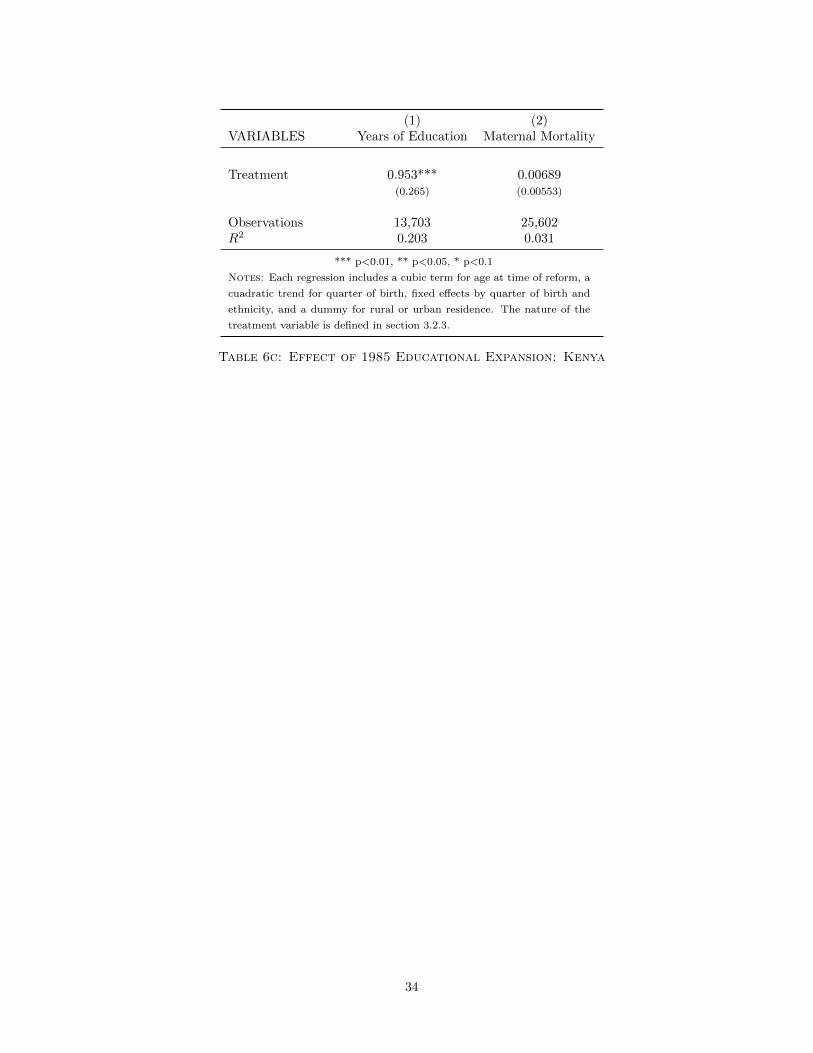
(1) (2)VARIABLES Years of Education Maternal Mortality
Treatment 0.953*** 0.00689(0.265) (0.00553)
Observations 13,703 25,602R2 0.203 0.031
*** p<0.01, ** p<0.05, * p<0.1
Notes: Each regression includes a cubic term for age at time of reform, a
cuadratic trend for quarter of birth, fixed effects by quarter of birth and
ethnicity, and a dummy for rural or urban residence. The nature of the
treatment variable is defined in section 3.2.3.
Table 6c: Effect of 1985 Educational Expansion: Kenya
34
References
C. AbouZahr, E. Royston, and WHO. Maternal mortality: a global factbook. Technical report,
WHO/MCH/MSM/91.3, Geneva: World Health Organization, 1991.
J. Aguero and P. Bharadwaj. Do the more educated know more about health? evidence from
schooling and HIV knowledge in Zimbabwe. Mimeo, 2010.
S. Ahmed, L. Qingfeng, L. Li, and A. O. Tsui. Maternal deaths averted by contraceptive use:
an analysis of 172 countries. Lancet, 380(9837):111 – 125, 2012.
R. Akresh, S. Bhalotra, M. Leone, and U. O. Osili. War and stature: Growing up during the
nigerian civil war. American Economic Review, 102(3):273–77, May 2012.
R. J. Barro and J. W. Lee. A new data set of educational attainment in the world, 1950–2010.
Working Paper 15902, National Bureau of Economic Research, April 2010.
R. J. Barro and J. W. Lee. A new data set of educational attainment in the world, 1950–2010.
Journal of Development Economics, 104:184 – 98, September 2013.
S. Bauhoff, M. Mohanan, G. L. Forgia, K. Babiarz, and K. Singh. Impact of the chiranjeevi
yojana program on institutional deliveries and birth outcomes in gujarat, india: Difference-in-
difference analysis. Mimeograph, RAND Corporation, 2012.
Central Intelligence Agency. World fact book, Nigeria/ Zimbabwe, 2012. URL http://www.cia.
gov/library/publications/the-world-factbook.
L. Chicoine. Education and fertility: Evidence from a policy change in Kenya. Mimeo, 2011.
A. Conde-Agudelo, J. Belizan, and C. Lammers. Maternal-perinatal morbidity and mortality
associated with adolescent pregnancy in Latin America: Cross-sectional study. Am J Obstet
Gynecol., 192(2):342 – 9, February 2005.
A. Costello, D. Osrin, and D. Manandhar. Reducing maternal and neonatal mortality in the
poorest communities. BMJ: British Medical Journal, 329(7475):pp. 1166–1168, 2004.
J. Currie and E. Moretti. Mother’s education and the intergenerational transmission of human
capital: Evidence from college openings. The Quarterly Journal of Economics, 118(4):1495–
1532, November 2003.
D. Cutler, A. Deaton, and A. Lleras-Muney. The determinants of mortality. Journal of Economic
Perspectives, 20(3):97–120, Summer 2006.
D. M. Cutler and A. Lleras-Muney. Understanding differences in health behaviors by education.
Journal of Health Economics, 29(1):1–28, January 2010.
35
G. Edwards. Rapid educational expansion and primary school efficiency in Zimbabwe, 1983-9.
Development Southern Africa, 12(1):87–95, 1995.
I. T. Elo and S. H. Preston. Educational differentials in mortality: United States. Social Science
and Medicine, 42(1):47 – 57, 1996.
A. D. Foster and M. R. Rosenzweig. Technological change and the distribution of schooling:
evidence from green-revolution india. Journal of Development Economics, 74(1):87–111, June
2004.
S. Glied and A. Lleras-Muney. Health inequality, education and medical innovation. Demography,
45(3):741–761, August 2008.
D. Goldman and D. Lakdawalla. Understanding health disparities across education groups.
NBER Working Papers 8328, National Bureau of Economic Research, Inc, June 2001.
D. Goldman and P. Smith. Can patient self-management explain the health gradient? Goldman
and Smith (2002) revisited: A response to Maitra. Social Science & Medicine, 70(1):813 – 815,
2010.
E. Goodburn and O. Campbell. Reducing maternal mortality in the developing world: Sector-
wide approaches may be the key. BMJ: British Medical Journal, 322(7291):pp. 917–920, 2001.
G. T. Greco, T. Powell-Jackson, J. Borghi, and A. Mills. Countdown to 2015: assessment of
donor assistance to maternal, newborn, and child health between 2003 and 2006. Lancet, 371
(9620):1268 – 1275, 2008.
M. C. Hogan, K. J. Foreman, M. Naghavi, S. Y. Ahn, W. Mengru, S. M. Makela, A. D. Lopez,
R. Lozano, and C. J. L. Murray. Maternal mortality for 181 countries, 1980-2008: a systematic
analysis of progress towards millennium development goal 5. Lancet, 375(9726):1609 – 1623,
2010.
R. Jensen and A. Lleras-Muney. Does staying in school (and not working) prevent teen smoking
and drinking? Journal of Health Economics, 31(4):644–657, 2012.
K. S. Khan, D. Wojdyla, L. Say, A. M. Gulmezoglu, and P. F. V. Look. Who analysis of causes
of maternal death: a systematic review. The Lancet, 367(9516):1066–1074, April 2006.
A. E. Kunst and J. Mackenbach. The size of mortality differences associated with educational
level in nine industrialized countries. American Journal of Public Health, 84(6):932 – 937,
1994.
F. Lichtenberg and A. Lleras-Muney. The effect of education on medical technology adoption:
Are the more educated more likely to use new drugs? Annales d’Economie et Statistique
Special Issue in memory of Zvi Griliches, (79/80), 2005.
36
A. Lleras-Muney. The relationship between education and adult mortality in the U.S. Review of
Economic Studies, 72(1):189 – 221, 2005.
D. S. Manandhar, D. Osrin, B. P. Shrestha, N. Mesko, J. Morrison, K. M. Tumbahangphe,
S. Tamang, S. Thapa, D. Shrestha, B. Thapa, J. R. Shrestha, A. Wade, J. Borghi, H. Standing,
M. Manandhar, and A. M. de L Costello. Effect of a participatory intervention with women’s
groups on birth outcomes in nepal: cluster-randomised controlled trial. The Lancet, 364(9438):
970–979, September 2004.
C. McAlister and T. F. Baskett. Female education and maternal mortality: A worldwide survey.
J Obstet Gynaecol Can, 28(11):983–990, November 2006.
J. McCarthy and D. Maine. A framework for analyzing the determinants of maternal mortality.
Studies in Family Planning, 23(1):pp. 23–33, 1992.
E. Meara, S. Richards, and D. Cutler. The gap gets bigger: Changes in mortality and life
expectancy by education, 1981-2000. Health Affairs, 27(2):350 – 360, 2008.
U. O. Osili and B. T. Long. Does female schooling reduce fertility? Evidence from Nigeria.
Journal of Development Economics, 57:57–75, 2008.
G. C. Patton, C. Coffey, S. M. Sawyer, R. M. Viner, D. M. Haller, K. Bose, T. Vos, J. Ferguson,
and C. D. Mathers. Global patterns of mortality in young people: a systematic analysis of
population health data. The Lancet, 374(9693):881 – 92, September 2009.
T. Powell-Jackson and K. Hanson. Financial incentives for maternal health: Impact of a national
programme in Nepal. Journal of Health Economics, 31(1):271 – 84, 2012.
H. Richards and R. Barry. U.S. life tables for 1990 by sex, race, and education. Journal of
Forensic Economics, 11(1):9 – 26, 1998.
C. Ronsmans and W. J. Graham. Maternal mortality: who, when, where, and why. The Lancet,
368(9542):1189–1200, September 2006.
M. R. Rosenzweig. Why are there returns to schooling? American Economic Review, 85(2):
153–58, May 1995.
M. R. Rosenzweig and T. P. Schultz. Schooling, information and nonmarket productivity: Con-
traceptive use and its effectiveness. International Economic Review, 30(2):457–77, May 1989.
S. O. Rutstein and G. Rojas. Guide to dhs statistics. Technical report, Demographic and Health
Surveys, Calverton, Maryland, 2006.
C. Stanton, N. Abderrahim, and K. Hil. Dhs maternal mortality indicators: An assessment of
data and implications for data use. Technical report, September 1997.
37
The World Bank. The world bank data bank. http://databank.worldbank.org/ddp/home.do,
2013. Accessed: 10/08/2012.
J. Trussell and A. R. Pebley. The potential impact of changes in fertility on infant, child and
maternal mortality. Studies in Family Planning, 15(6):pp. 267–280, 1984.
WHO. Maternal mortality. Fact Sheet 348, World Health Organization, 2012.
A. Yazbeck. Challenges in measuring maternal mortality. Lancet, 370:1291 – 92, 2012.
A Data Appendix
The variable ‘Percent Attended Births’ represents the number of births attended by a skilled
physician. This variable has been constructed from World Bank data relating to births attended
by skilled health staff (http://data.worldbank.org/indicator/SH.STA.BRTC.ZS) and DHS
data constructed from the cross-country micro data. The DHS data comes from a question
regarding place of birth, where those mothers who report births in a public or private facility are
assumed to have been attended by a skilled health professional.
Given the sporadic nature of the data produced, the following procedure was followed: ‘Per-
cent Attended Births’ was set equal to the DHS microdata average for each year/country group
pair for which this observation was available. In the case that DHS data was not available and
World Bank data was, ‘Percent Attended Births’ was set equal to the rate from the World Bank
data. Given that MMR and Education data is available in 5 year periods (1990, 1995, 2000,
2005, 2010), for each of these years where the fifth year was not available but there was data in
the preceeding 5 year period, the average of the preceeding 5 year period was taken and used as
the data point in the fifth year.
38
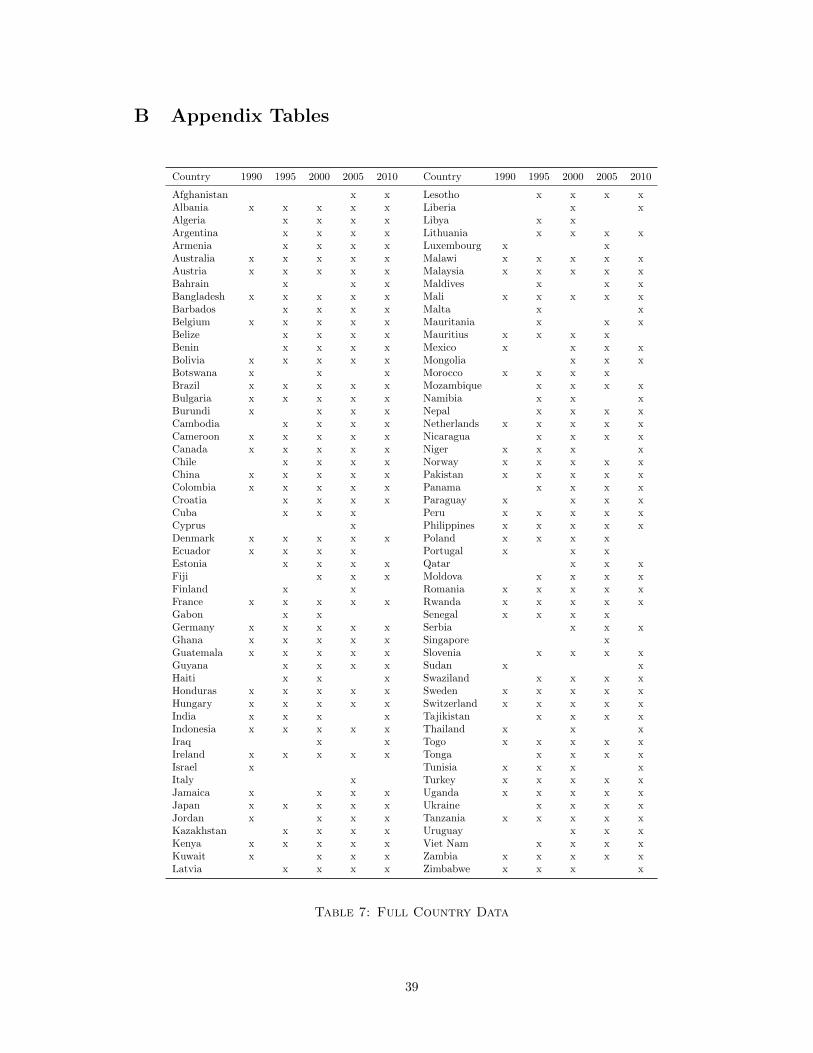
B Appendix Tables
Country 1990 1995 2000 2005 2010 Country 1990 1995 2000 2005 2010
Afghanistan x x Lesotho x x x xAlbania x x x x x Liberia x xAlgeria x x x x Libya x xArgentina x x x x Lithuania x x x xArmenia x x x x Luxembourg x xAustralia x x x x x Malawi x x x x xAustria x x x x x Malaysia x x x x xBahrain x x x Maldives x x xBangladesh x x x x x Mali x x x x xBarbados x x x x Malta x xBelgium x x x x x Mauritania x x xBelize x x x x Mauritius x x x xBenin x x x x Mexico x x x xBolivia x x x x x Mongolia x x xBotswana x x x Morocco x x x xBrazil x x x x x Mozambique x x x xBulgaria x x x x x Namibia x x xBurundi x x x x Nepal x x x xCambodia x x x x Netherlands x x x x xCameroon x x x x x Nicaragua x x x xCanada x x x x x Niger x x x xChile x x x x Norway x x x x xChina x x x x x Pakistan x x x x xColombia x x x x x Panama x x x xCroatia x x x x Paraguay x x x xCuba x x x Peru x x x x xCyprus x Philippines x x x x xDenmark x x x x x Poland x x x xEcuador x x x x Portugal x x xEstonia x x x x Qatar x x xFiji x x x Moldova x x x xFinland x x Romania x x x x xFrance x x x x x Rwanda x x x x xGabon x x Senegal x x x xGermany x x x x x Serbia x x xGhana x x x x x Singapore xGuatemala x x x x x Slovenia x x x xGuyana x x x x Sudan x xHaiti x x x Swaziland x x x xHonduras x x x x x Sweden x x x x xHungary x x x x x Switzerland x x x x xIndia x x x x Tajikistan x x x xIndonesia x x x x x Thailand x x xIraq x x Togo x x x x xIreland x x x x x Tonga x x x xIsrael x Tunisia x x x xItaly x Turkey x x x x xJamaica x x x x Uganda x x x x xJapan x x x x x Ukraine x x x xJordan x x x x Tanzania x x x x xKazakhstan x x x x Uruguay x x xKenya x x x x x Viet Nam x x x xKuwait x x x x Zambia x x x x xLatvia x x x x Zimbabwe x x x x
Table 7: Full Country Data
39
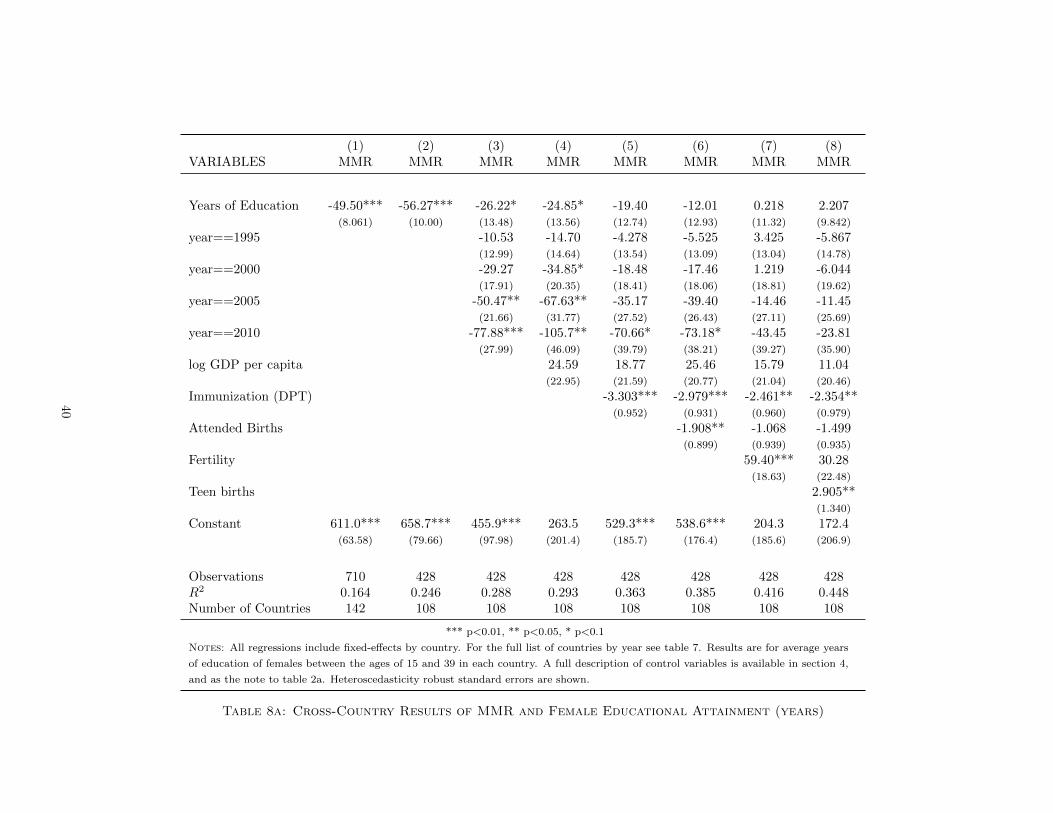
(1) (2) (3) (4) (5) (6) (7) (8)VARIABLES MMR MMR MMR MMR MMR MMR MMR MMR
Years of Education -49.50*** -56.27*** -26.22* -24.85* -19.40 -12.01 0.218 2.207(8.061) (10.00) (13.48) (13.56) (12.74) (12.93) (11.32) (9.842)
year==1995 -10.53 -14.70 -4.278 -5.525 3.425 -5.867(12.99) (14.64) (13.54) (13.09) (13.04) (14.78)
year==2000 -29.27 -34.85* -18.48 -17.46 1.219 -6.044(17.91) (20.35) (18.41) (18.06) (18.81) (19.62)
year==2005 -50.47** -67.63** -35.17 -39.40 -14.46 -11.45(21.66) (31.77) (27.52) (26.43) (27.11) (25.69)
year==2010 -77.88*** -105.7** -70.66* -73.18* -43.45 -23.81(27.99) (46.09) (39.79) (38.21) (39.27) (35.90)
log GDP per capita 24.59 18.77 25.46 15.79 11.04(22.95) (21.59) (20.77) (21.04) (20.46)
Immunization (DPT) -3.303*** -2.979*** -2.461** -2.354**(0.952) (0.931) (0.960) (0.979)
Attended Births -1.908** -1.068 -1.499(0.899) (0.939) (0.935)
Fertility 59.40*** 30.28(18.63) (22.48)
Teen births 2.905**(1.340)
Constant 611.0*** 658.7*** 455.9*** 263.5 529.3*** 538.6*** 204.3 172.4(63.58) (79.66) (97.98) (201.4) (185.7) (176.4) (185.6) (206.9)
Observations 710 428 428 428 428 428 428 428R2 0.164 0.246 0.288 0.293 0.363 0.385 0.416 0.448Number of Countries 142 108 108 108 108 108 108 108
*** p<0.01, ** p<0.05, * p<0.1
Notes: All regressions include fixed-effects by country. For the full list of countries by year see table 7. Results are for average years
of education of females between the ages of 15 and 39 in each country. A full description of control variables is available in section 4,
and as the note to table 2a. Heteroscedasticity robust standard errors are shown.
Table 8a: Cross-Country Results of MMR and Female Educational Attainment (years)
40
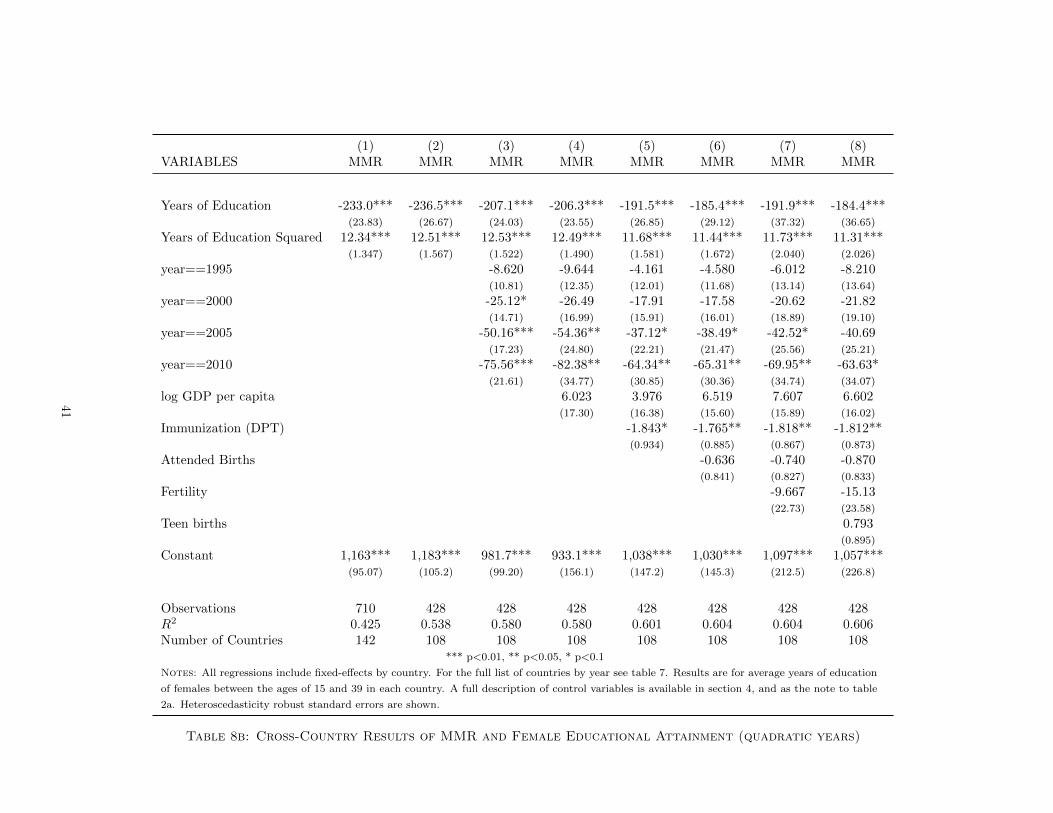
(1) (2) (3) (4) (5) (6) (7) (8)VARIABLES MMR MMR MMR MMR MMR MMR MMR MMR
Years of Education -233.0*** -236.5*** -207.1*** -206.3*** -191.5*** -185.4*** -191.9*** -184.4***(23.83) (26.67) (24.03) (23.55) (26.85) (29.12) (37.32) (36.65)
Years of Education Squared 12.34*** 12.51*** 12.53*** 12.49*** 11.68*** 11.44*** 11.73*** 11.31***(1.347) (1.567) (1.522) (1.490) (1.581) (1.672) (2.040) (2.026)
year==1995 -8.620 -9.644 -4.161 -4.580 -6.012 -8.210(10.81) (12.35) (12.01) (11.68) (13.14) (13.64)
year==2000 -25.12* -26.49 -17.91 -17.58 -20.62 -21.82(14.71) (16.99) (15.91) (16.01) (18.89) (19.10)
year==2005 -50.16*** -54.36** -37.12* -38.49* -42.52* -40.69(17.23) (24.80) (22.21) (21.47) (25.56) (25.21)
year==2010 -75.56*** -82.38** -64.34** -65.31** -69.95** -63.63*(21.61) (34.77) (30.85) (30.36) (34.74) (34.07)
log GDP per capita 6.023 3.976 6.519 7.607 6.602(17.30) (16.38) (15.60) (15.89) (16.02)
Immunization (DPT) -1.843* -1.765** -1.818** -1.812**(0.934) (0.885) (0.867) (0.873)
Attended Births -0.636 -0.740 -0.870(0.841) (0.827) (0.833)
Fertility -9.667 -15.13(22.73) (23.58)
Teen births 0.793(0.895)
Constant 1,163*** 1,183*** 981.7*** 933.1*** 1,038*** 1,030*** 1,097*** 1,057***(95.07) (105.2) (99.20) (156.1) (147.2) (145.3) (212.5) (226.8)
Observations 710 428 428 428 428 428 428 428R2 0.425 0.538 0.580 0.580 0.601 0.604 0.604 0.606Number of Countries 142 108 108 108 108 108 108 108
*** p<0.01, ** p<0.05, * p<0.1
Notes: All regressions include fixed-effects by country. For the full list of countries by year see table 7. Results are for average years of education
of females between the ages of 15 and 39 in each country. A full description of control variables is available in section 4, and as the note to table
2a. Heteroscedasticity robust standard errors are shown.
Table 8b: Cross-Country Results of MMR and Female Educational Attainment (quadratic years)
41
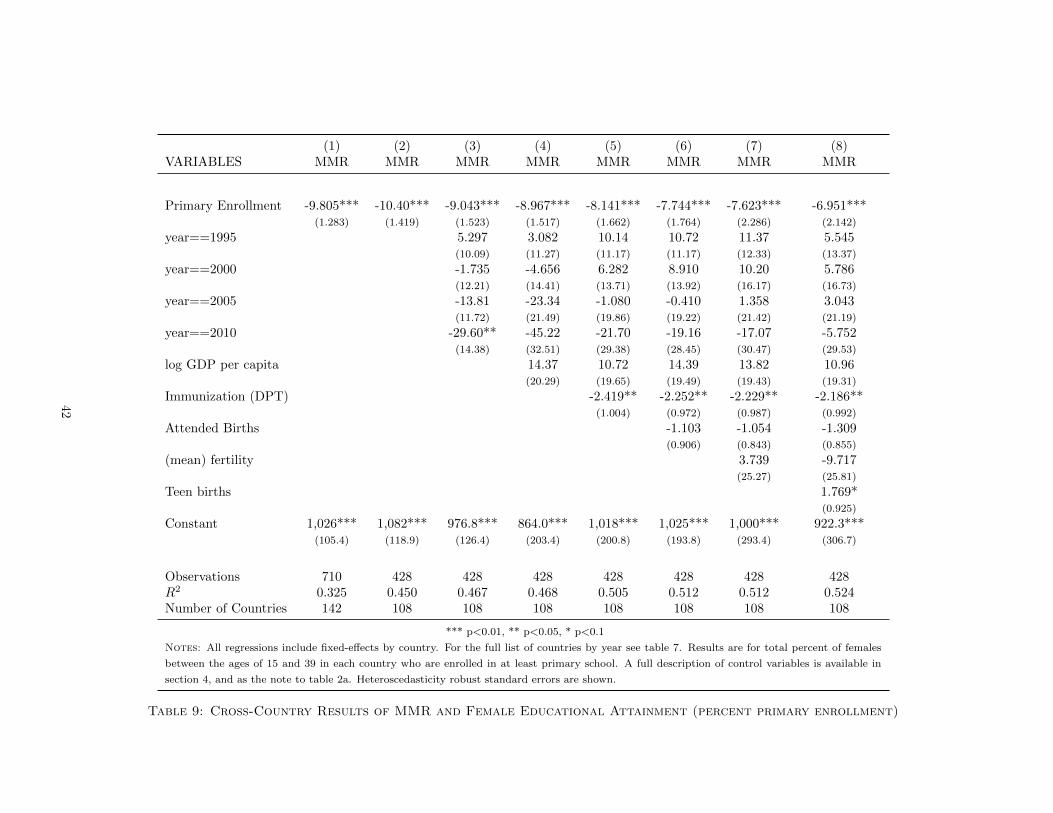
(1) (2) (3) (4) (5) (6) (7) (8)VARIABLES MMR MMR MMR MMR MMR MMR MMR MMR
Primary Enrollment -9.805*** -10.40*** -9.043*** -8.967*** -8.141*** -7.744*** -7.623*** -6.951***(1.283) (1.419) (1.523) (1.517) (1.662) (1.764) (2.286) (2.142)
year==1995 5.297 3.082 10.14 10.72 11.37 5.545(10.09) (11.27) (11.17) (11.17) (12.33) (13.37)
year==2000 -1.735 -4.656 6.282 8.910 10.20 5.786(12.21) (14.41) (13.71) (13.92) (16.17) (16.73)
year==2005 -13.81 -23.34 -1.080 -0.410 1.358 3.043(11.72) (21.49) (19.86) (19.22) (21.42) (21.19)
year==2010 -29.60** -45.22 -21.70 -19.16 -17.07 -5.752(14.38) (32.51) (29.38) (28.45) (30.47) (29.53)
log GDP per capita 14.37 10.72 14.39 13.82 10.96(20.29) (19.65) (19.49) (19.43) (19.31)
Immunization (DPT) -2.419** -2.252** -2.229** -2.186**(1.004) (0.972) (0.987) (0.992)
Attended Births -1.103 -1.054 -1.309(0.906) (0.843) (0.855)
(mean) fertility 3.739 -9.717(25.27) (25.81)
Teen births 1.769*(0.925)
Constant 1,026*** 1,082*** 976.8*** 864.0*** 1,018*** 1,025*** 1,000*** 922.3***(105.4) (118.9) (126.4) (203.4) (200.8) (193.8) (293.4) (306.7)
Observations 710 428 428 428 428 428 428 428R2 0.325 0.450 0.467 0.468 0.505 0.512 0.512 0.524Number of Countries 142 108 108 108 108 108 108 108
*** p<0.01, ** p<0.05, * p<0.1
Notes: All regressions include fixed-effects by country. For the full list of countries by year see table 7. Results are for total percent of females
between the ages of 15 and 39 in each country who are enrolled in at least primary school. A full description of control variables is available in
section 4, and as the note to table 2a. Heteroscedasticity robust standard errors are shown.
Table 9: Cross-Country Results of MMR and Female Educational Attainment (percent primary enrollment)
42
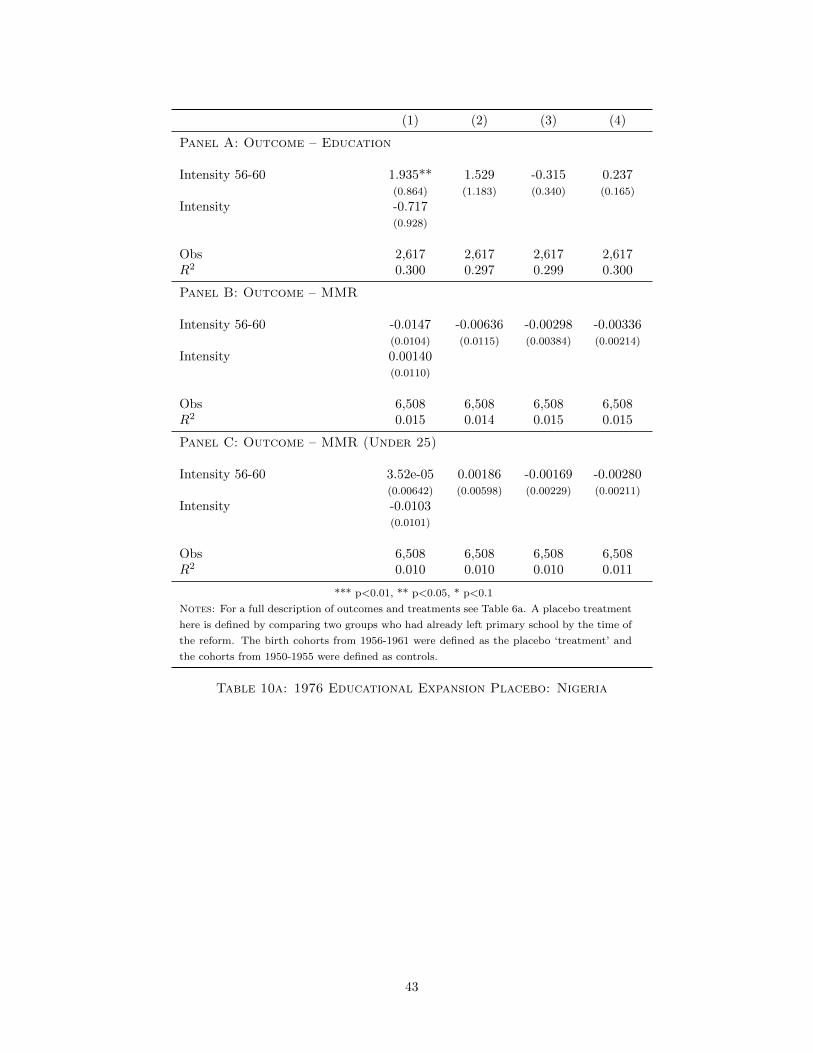
(1) (2) (3) (4)
Panel A: Outcome – Education
Intensity 56-60 1.935** 1.529 -0.315 0.237(0.864) (1.183) (0.340) (0.165)
Intensity -0.717(0.928)
Obs 2,617 2,617 2,617 2,617R2 0.300 0.297 0.299 0.300
Panel B: Outcome – MMR
Intensity 56-60 -0.0147 -0.00636 -0.00298 -0.00336(0.0104) (0.0115) (0.00384) (0.00214)
Intensity 0.00140(0.0110)
Obs 6,508 6,508 6,508 6,508R2 0.015 0.014 0.015 0.015
Panel C: Outcome – MMR (Under 25)
Intensity 56-60 3.52e-05 0.00186 -0.00169 -0.00280(0.00642) (0.00598) (0.00229) (0.00211)
Intensity -0.0103(0.0101)
Obs 6,508 6,508 6,508 6,508R2 0.010 0.010 0.010 0.011
*** p<0.01, ** p<0.05, * p<0.1
Notes: For a full description of outcomes and treatments see Table 6a. A placebo treatment
here is defined by comparing two groups who had already left primary school by the time of
the reform. The birth cohorts from 1956-1961 were defined as the placebo ‘treatment’ and
the cohorts from 1950-1955 were defined as controls.
Table 10a: 1976 Educational Expansion Placebo: Nigeria
43
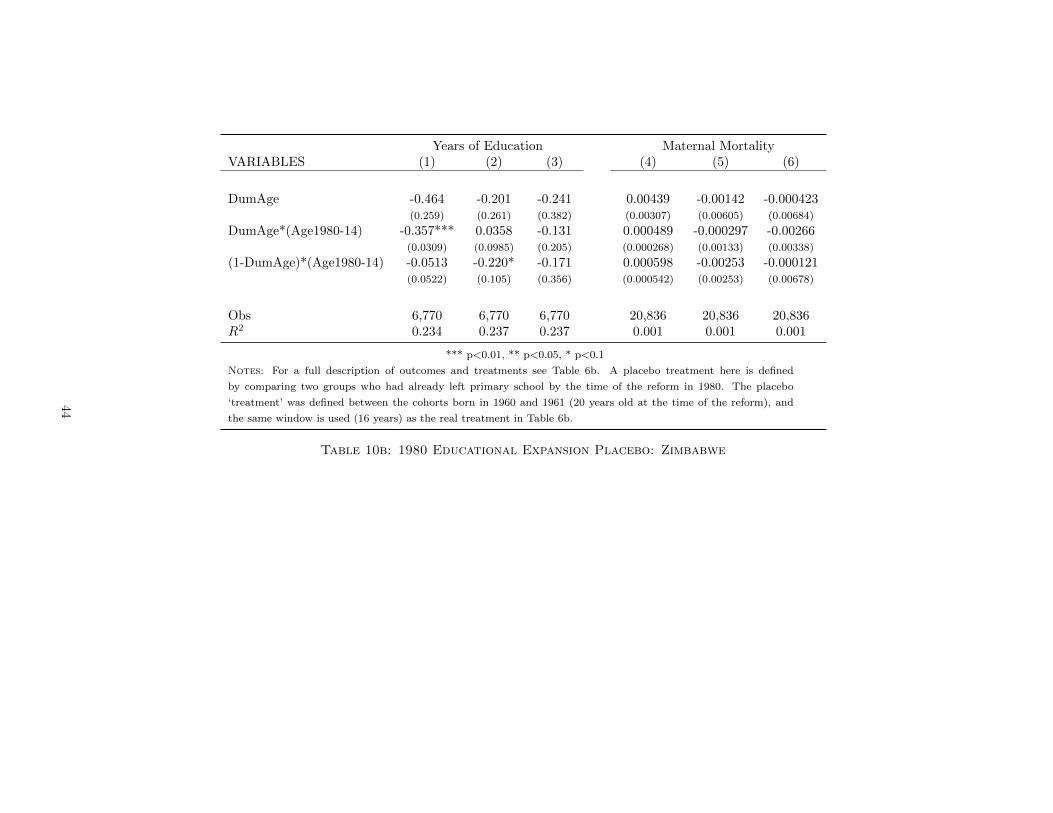
Years of Education Maternal MortalityVARIABLES (1) (2) (3) (4) (5) (6)
DumAge -0.464 -0.201 -0.241 0.00439 -0.00142 -0.000423(0.259) (0.261) (0.382) (0.00307) (0.00605) (0.00684)
DumAge*(Age1980-14) -0.357*** 0.0358 -0.131 0.000489 -0.000297 -0.00266(0.0309) (0.0985) (0.205) (0.000268) (0.00133) (0.00338)
(1-DumAge)*(Age1980-14) -0.0513 -0.220* -0.171 0.000598 -0.00253 -0.000121(0.0522) (0.105) (0.356) (0.000542) (0.00253) (0.00678)
Obs 6,770 6,770 6,770 20,836 20,836 20,836R2 0.234 0.237 0.237 0.001 0.001 0.001
*** p<0.01, ** p<0.05, * p<0.1
Notes: For a full description of outcomes and treatments see Table 6b. A placebo treatment here is defined
by comparing two groups who had already left primary school by the time of the reform in 1980. The placebo
‘treatment’ was defined between the cohorts born in 1960 and 1961 (20 years old at the time of the reform), and
the same window is used (16 years) as the real treatment in Table 6b.
Table 10b: 1980 Educational Expansion Placebo: Zimbabwe
44
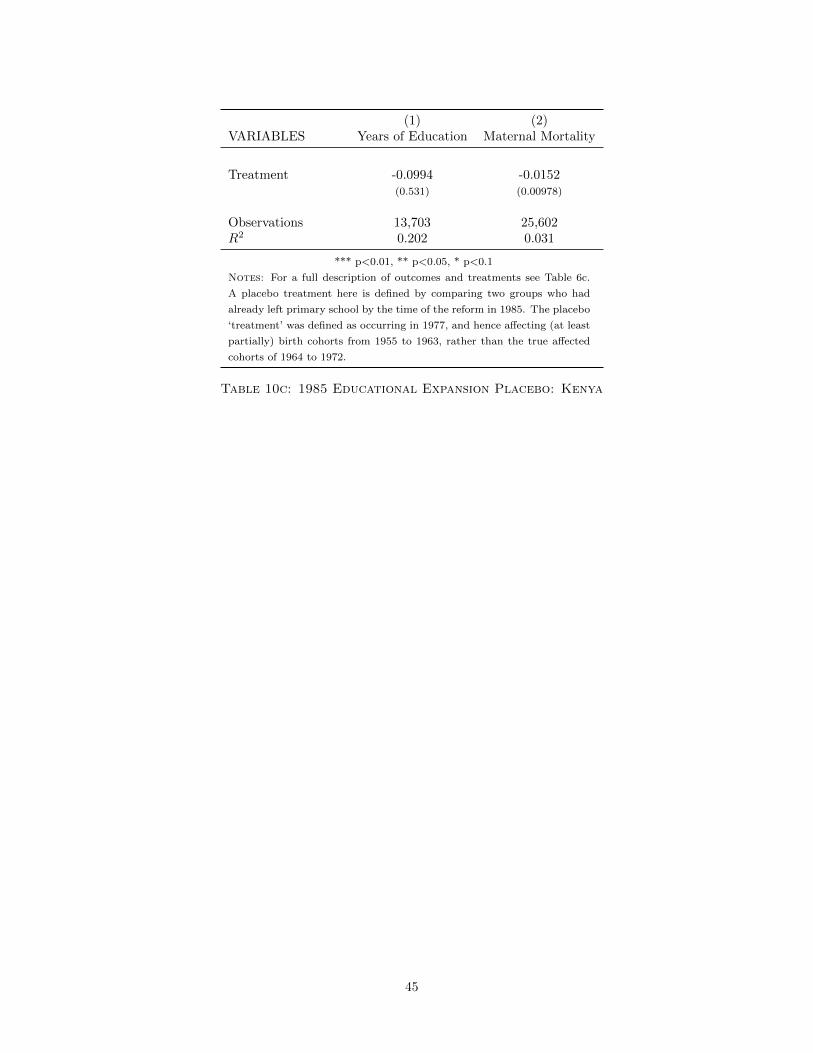
(1) (2)VARIABLES Years of Education Maternal Mortality
Treatment -0.0994 -0.0152(0.531) (0.00978)
Observations 13,703 25,602R2 0.202 0.031
*** p<0.01, ** p<0.05, * p<0.1
Notes: For a full description of outcomes and treatments see Table 6c.
A placebo treatment here is defined by comparing two groups who had
already left primary school by the time of the reform in 1985. The placebo
‘treatment’ was defined as occurring in 1977, and hence affecting (at least
partially) birth cohorts from 1955 to 1963, rather than the true affected
cohorts of 1964 to 1972.
Table 10c: 1985 Educational Expansion Placebo: Kenya
45