Embed Size (px)
Citation preview
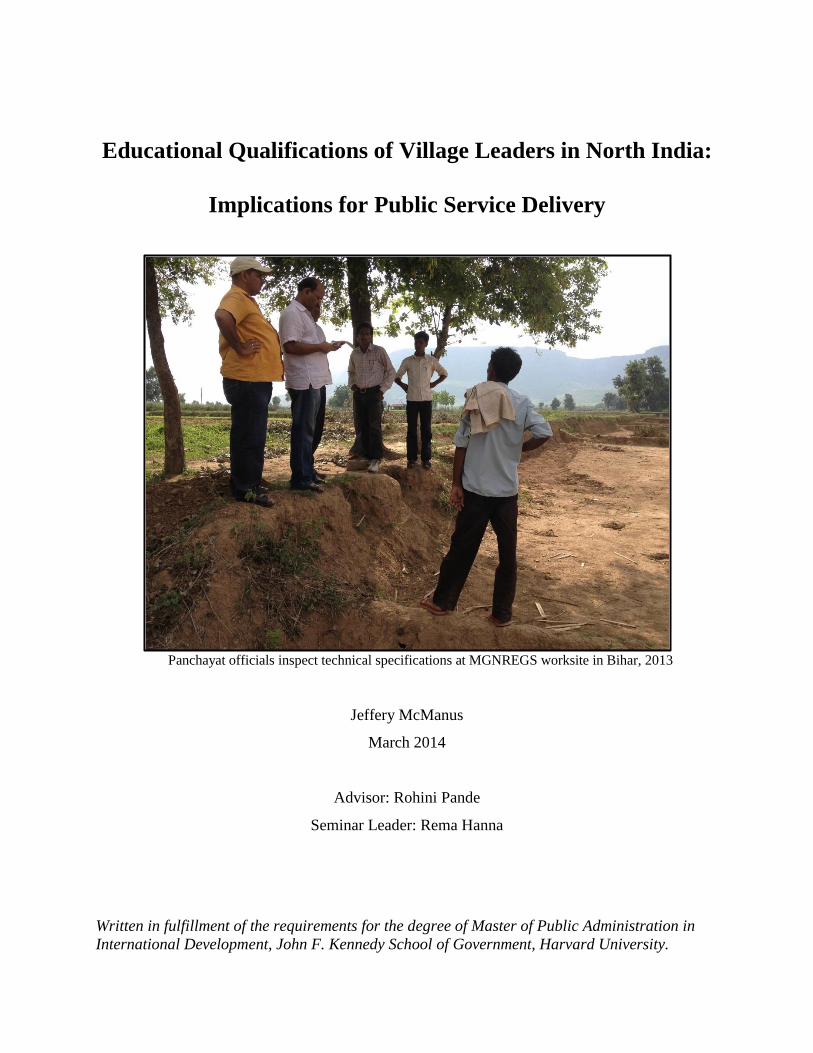
Educational Qualifications of Village Leaders in North India:
Implications for Public Service Delivery
Panchayat officials inspect technical specifications at MGNREGS worksite in Bihar, 2013
Jeffery McManus
March 2014
Advisor: Rohini Pande
Seminar Leader: Rema Hanna
Written in fulfillment of the requirements for the degree of Master of Public Administration in
International Development, John F. Kennedy School of Government, Harvard University.

Acknowledgements
I am grateful to Rohini Pande and Rema Hanna for guidance and for pushing me to think about
the issues in this policy report from new angles. I am also grateful to the Abdul Latif Jameel
Poverty Action Lab and especially Rohini Pande for exposing me to many of the topics covered
in this report through projects in Bihar, Rajasthan and Uttar Pradesh. Insights gained from these
projects are central to most of the claims in this report. Most of the empirical analysis in this
report would not have been possible without the generosity of Abhijit Banerjee, Esther Duflo,
Clement Imbert and Rohini Pande in sharing data on sarpanch candidates, voters and public
service delivery from their projects in Rajasthan. Finally, I am grateful to Kshitij Batra, Tim
Cheston, and Martin Mattsson for providing useful comments throughout the writing process.
Cover photo: MGNREGS audit in Bihar, July 2013. Author’s photo.
Executive Summary
Over the last two decades, village governments (gram panchayats or “GPs”) in India have
become increasingly responsible for delivering public services to citizens. However, local
government capacity in rural North India has been undermined by the high incidence of
uneducated village leaders (“sarpanch”). In three districts of Rajasthan, for instance, 94% of
sarpanch do not have a college degree, 83% do not have a high school degree, and 45% are
unable to read a simple paragraph written at the 2nd
grade level in the local language.
Since sarpanch play a key role in managing government programs, the lack of adequate
qualifications has resulted in sub-standard public service delivery. GPs with uneducated sarpanch
receive fewer benefits and experience more delays in large development programs like
MGNREGS. These programs may be more susceptible to political capture when leaders have
less education. Development outcomes like literacy rates grow more slowly in GPs with
uneducated sarpanch. The poorest GPs are the most adversely affected by uneducated leaders.
This policy analysis presents a dynamic supply-and-demand framework for understanding the
possible factors that have contributed to the high incidence of uneducated sarpanch. Three
interconnected factors are identified as most likely driving the problem: (1) a lack of incentives
for educated villagers to contest elections, especially due to few career options and social norms;
(2) voters undervaluing the returns to having an educated sarpanch; and (3) low educational
attainment of minority groups in GPs with gender or caste quotas.
In order to take full advantage of feedback loops between candidate and voter behavior, this
diagnosis suggests that the client should pursue a multi-pronged strategy. Four policy tools are
recommended from a catalog of options based on technical, political and administrative
considerations: (1) career incentives for former sarpanch (2) increased monitoring of GP
finances; (3) voter awareness campaigns via street theater; and (4) specialized training for
sarpanch in reserved GPs. An implementation plan is presented for two alternative scenarios,
universal scale-up and targeted scale-up, which could be funded by a 2.3-4.9% increase in the
client’s annual expenditures.
Contents
I. Introduction ................................................................................................................................. 1
II. Defining the problem: The incidence and consequence of uneducated sarpanch ...................... 1
A. The incidence of uneducated sarpanch in North India ........................................................... 1
B. Sarpanch responsibilities and necessary qualifications .......................................................... 3
C. Quantifying the impact of sarpanch education on development outcomes ............................ 4
III. Diagnosing the problem: Factors driving the incidence of uneducated sarpanch .................. 15
A. Supply-side factors ............................................................................................................... 17
1. Supply-side factors: Availability of prospective educated candidates ............................. 17
2. Supply-side factors: Restrictions preventing educated candidates from running ............. 18
3. Supply-side factors: Incentives to educated villagers to contest in elections ................... 19
B. Demand-side factors ............................................................................................................. 23
1. Demand-side factors: Voter preferences for educated sarpanch ....................................... 24
2. Demand-side factors: Voter perceived returns to having educated sarpanch ................... 24
3. Demand-side factors: Voter knowledge about candidates ................................................ 26
IV. Assessing policy options......................................................................................................... 27
A. Recommended policy options for a multi-pronged strategy ................................................ 28
1. Recommended policy option: Improve long-term career options for sarpanch ............... 29
2. Recommended policy option: Increased monitoring of GP finances ............................... 30
3. Recommended policy option: Voter awareness campaigns via street theater .................. 31
4. Recommended policy option: Training programs for sarpanch in reserved GPs ............. 32
B. Alternative policy options not recommended at this time .................................................... 33
1. Alternative policy option: Increase sarpanch pay ............................................................. 33
2. Alternative policy option: Minimum qualifications for candidate eligibility ................... 33
3. Alternative policy option: Voter awareness campaigns via other media .......................... 34
V. Implementation guidelines for a multi-pronged strategy ......................................................... 34
A. Implementation stakeholders ............................................................................................... 35
B. Testing and refining interventions ........................................................................................ 36
1. Strengthening policy design through process pilots ......................................................... 36
2. Measuring anticipated effects with impact evaluations .................................................... 37
C. Budgets for universal and targeted scale-up ........................................................................ 38
VI. Conclusion .............................................................................................................................. 40
VII. References ............................................................................................................................. 41
VIII. Appendices ........................................................................................................................... 46
1
I. Introduction
Since the formalization of the panchayati raj in the 73rd and 74th Amendments in 1993, local
village governments in India have become increasingly responsible for delivering public services
to citizens. In rural North India, decentralization has involved a tradeoff between incorporating
local beneficiary preferences into program design and devolving program management to elected
officials who often have minimal administrative or educational qualifications. While Charles
Tiebout’s model of inter-jurisdictional competition suggests that citizens can “vote with their
feet” if they are unhappy with public service delivery in their constituency, traditions and social
norms in villages restrict mobility. As India further decentralizes public service delivery, it is
therefore critical that all village governments have sufficient capacity to meet the needs and
preferences of their constituents. This starts with ensuring that all local governments have
competent leaders.
This policy analysis has been prepared for the Ministry of Panchayati Raj (MoPR), which is
committed to “Empowerment, enablement and accountability of local governments to ensure
inclusive development with social justice, and efficient delivery of services.”1 The author is
responding to the MoPR’s recent call for consultants to identify next steps for how the ministry
can strengthen the capacity of local governments in North India.2
II. Defining the problem: The incidence and consequence of uneducated sarpanch
A. The incidence of uneducated sarpanch in North India
Recent policy briefs and media reports have identified the lack of educated sarpanch3 as a key
constraint to efficient administration in local governments in North India.4 Data on sarpanch
education show that the problem is pervasive:5
1 Vision and Mission, MoPR (2013), URL
2 Engagement of Consultants, MoPR (2013), URL
3 By “sarpanch” I mean the directly-elected head of the Gram Panchayat. In some states the sarpanch is referred to
as the “pradhan” or the “mukhiya”. 4 Ghosh and Gupta (2009); The Indian Express (2010), URL
5 See Appendix 1 for a description of all datasets used in this policy analyis
2
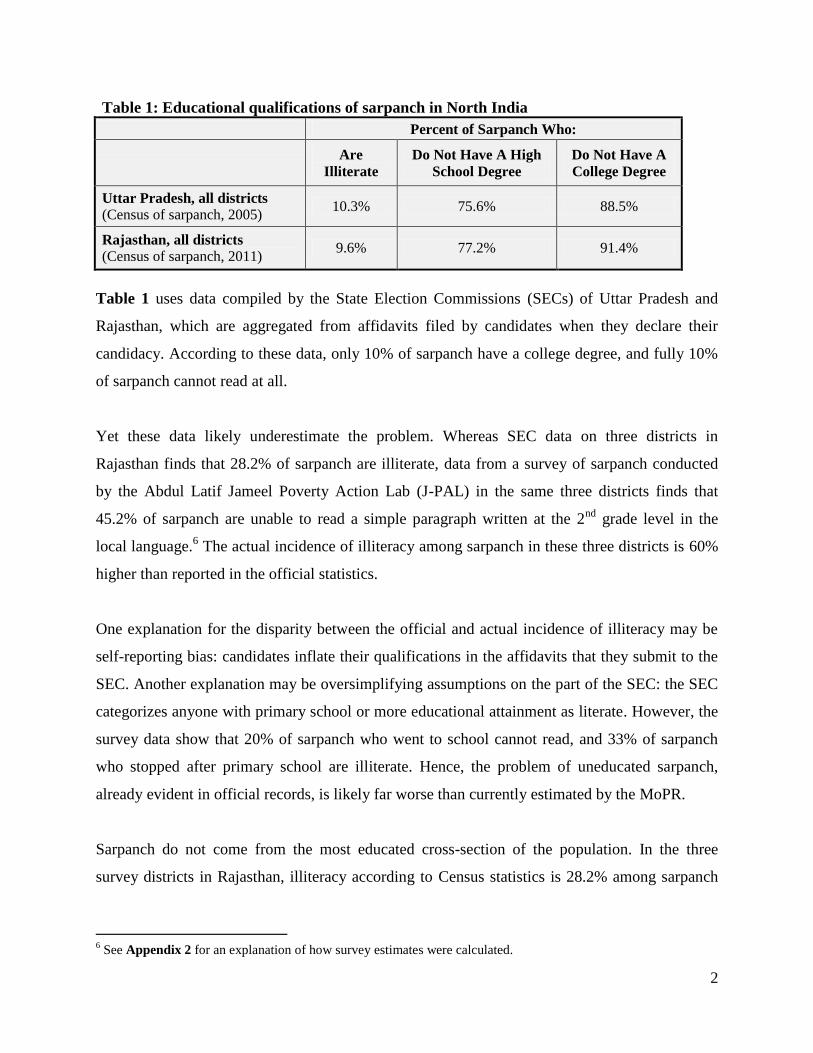
Table 1: Educational qualifications of sarpanch in North India
Percent of Sarpanch Who:
Are
Illiterate
Do Not Have A High
School Degree
Do Not Have A
College Degree
Uttar Pradesh, all districts (Census of sarpanch, 2005)
10.3% 75.6% 88.5%
Rajasthan, all districts (Census of sarpanch, 2011)
9.6% 77.2% 91.4%
Table 1 uses data compiled by the State Election Commissions (SECs) of Uttar Pradesh and
Rajasthan, which are aggregated from affidavits filed by candidates when they declare their
candidacy. According to these data, only 10% of sarpanch have a college degree, and fully 10%
of sarpanch cannot read at all.
Yet these data likely underestimate the problem. Whereas SEC data on three districts in
Rajasthan finds that 28.2% of sarpanch are illiterate, data from a survey of sarpanch conducted
by the Abdul Latif Jameel Poverty Action Lab (J-PAL) in the same three districts finds that
45.2% of sarpanch are unable to read a simple paragraph written at the 2nd
grade level in the
local language.6 The actual incidence of illiteracy among sarpanch in these three districts is 60%
higher than reported in the official statistics.
One explanation for the disparity between the official and actual incidence of illiteracy may be
self-reporting bias: candidates inflate their qualifications in the affidavits that they submit to the
SEC. Another explanation may be oversimplifying assumptions on the part of the SEC: the SEC
categorizes anyone with primary school or more educational attainment as literate. However, the
survey data show that 20% of sarpanch who went to school cannot read, and 33% of sarpanch
who stopped after primary school are illiterate. Hence, the problem of uneducated sarpanch,
already evident in official records, is likely far worse than currently estimated by the MoPR.
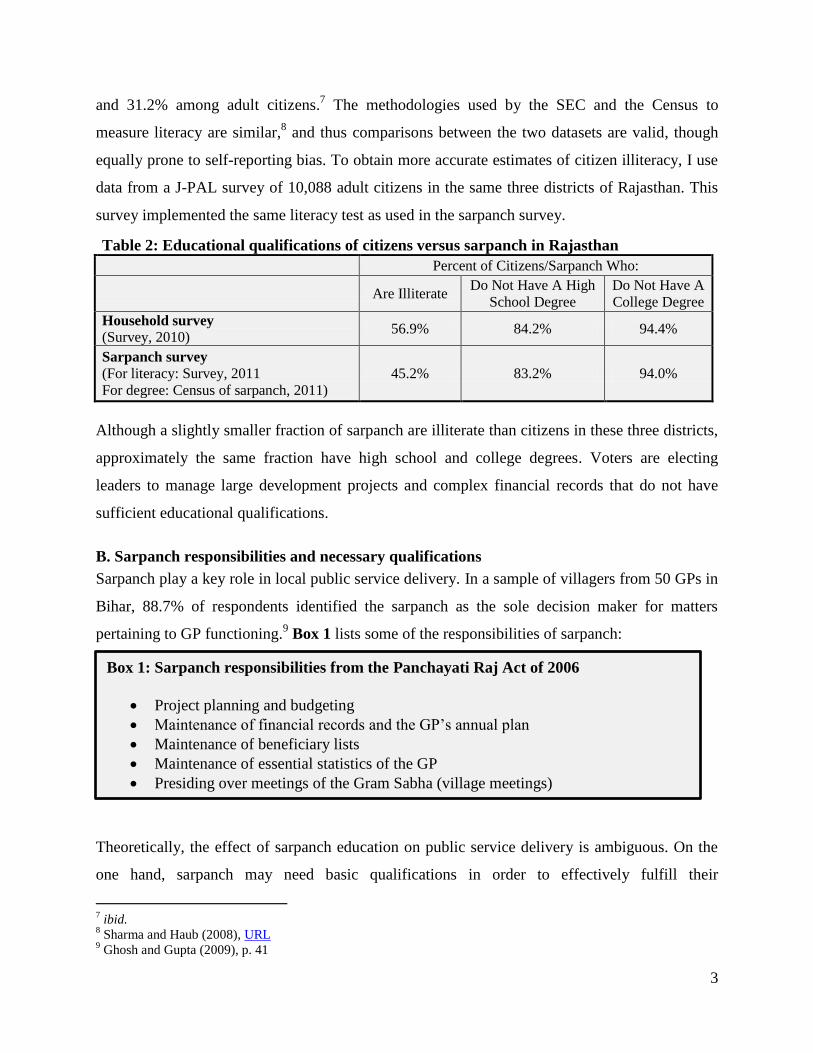
Sarpanch do not come from the most educated cross-section of the population. In the three
survey districts in Rajasthan, illiteracy according to Census statistics is 28.2% among sarpanch
6 See Appendix 2 for an explanation of how survey estimates were calculated.
3
and 31.2% among adult citizens.7 The methodologies used by the SEC and the Census to
measure literacy are similar,8 and thus comparisons between the two datasets are valid, though
equally prone to self-reporting bias. To obtain more accurate estimates of citizen illiteracy, I use
data from a J-PAL survey of 10,088 adult citizens in the same three districts of Rajasthan. This
survey implemented the same literacy test as used in the sarpanch survey.
Table 2: Educational qualifications of citizens versus sarpanch in Rajasthan
Percent of Citizens/Sarpanch Who:
Are Illiterate Do Not Have A High
School Degree
Do Not Have A
College Degree
Household survey (Survey, 2010)
56.9% 84.2% 94.4%
Sarpanch survey (For literacy: Survey, 2011
For degree: Census of sarpanch, 2011)
45.2% 83.2% 94.0%
Although a slightly smaller fraction of sarpanch are illiterate than citizens in these three districts,
approximately the same fraction have high school and college degrees. Voters are electing
leaders to manage large development projects and complex financial records that do not have
sufficient educational qualifications.
B. Sarpanch responsibilities and necessary qualifications
Sarpanch play a key role in local public service delivery. In a sample of villagers from 50 GPs in
Bihar, 88.7% of respondents identified the sarpanch as the sole decision maker for matters
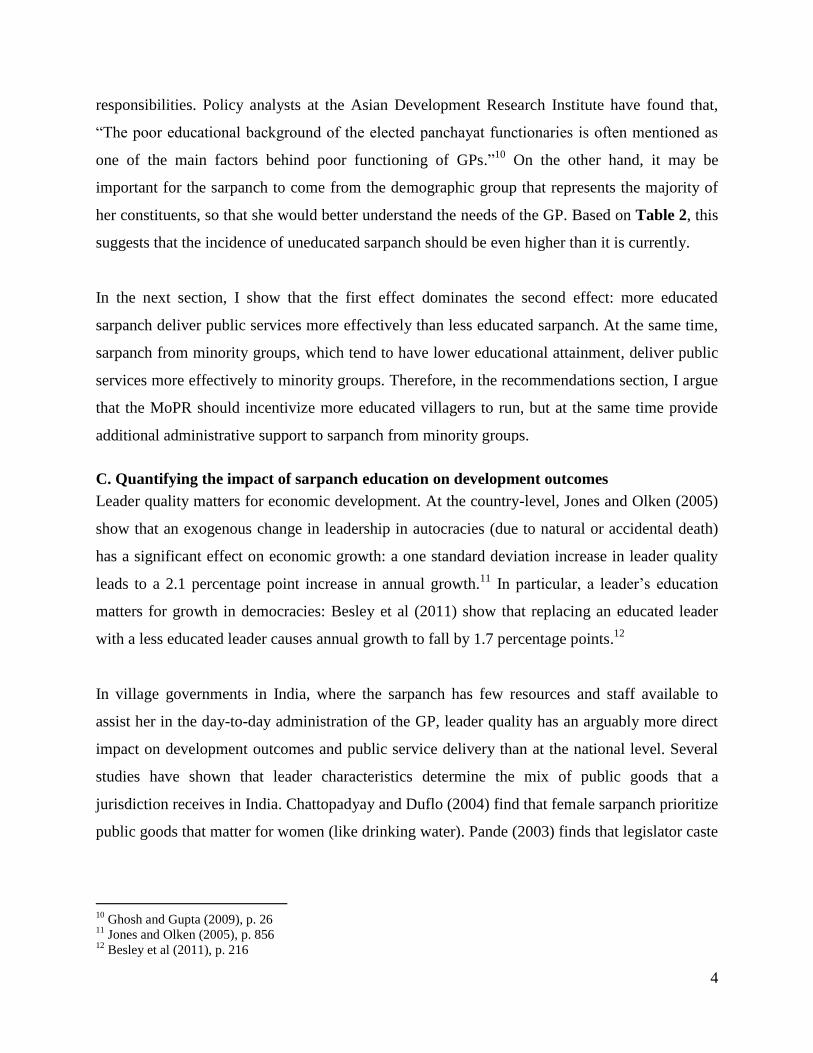
pertaining to GP functioning.9 Box 1 lists some of the responsibilities of sarpanch:
Theoretically, the effect of sarpanch education on public service delivery is ambiguous. On the
one hand, sarpanch may need basic qualifications in order to effectively fulfill their
7 ibid.
8 Sharma and Haub (2008), URL
9 Ghosh and Gupta (2009), p. 41
Box 1: Sarpanch responsibilities from the Panchayati Raj Act of 2006
Project planning and budgeting
Maintenance of financial records and the GP’s annual plan
Maintenance of beneficiary lists
Maintenance of essential statistics of the GP
Presiding over meetings of the Gram Sabha (village meetings)
4
responsibilities. Policy analysts at the Asian Development Research Institute have found that,
“The poor educational background of the elected panchayat functionaries is often mentioned as
one of the main factors behind poor functioning of GPs.”10
On the other hand, it may be
important for the sarpanch to come from the demographic group that represents the majority of
her constituents, so that she would better understand the needs of the GP. Based on Table 2, this
suggests that the incidence of uneducated sarpanch should be even higher than it is currently.
In the next section, I show that the first effect dominates the second effect: more educated
sarpanch deliver public services more effectively than less educated sarpanch. At the same time,
sarpanch from minority groups, which tend to have lower educational attainment, deliver public
services more effectively to minority groups. Therefore, in the recommendations section, I argue
that the MoPR should incentivize more educated villagers to run, but at the same time provide
additional administrative support to sarpanch from minority groups.
C. Quantifying the impact of sarpanch education on development outcomes
Leader quality matters for economic development. At the country-level, Jones and Olken (2005)
show that an exogenous change in leadership in autocracies (due to natural or accidental death)
has a significant effect on economic growth: a one standard deviation increase in leader quality
leads to a 2.1 percentage point increase in annual growth.11
In particular, a leader’s education
matters for growth in democracies: Besley et al (2011) show that replacing an educated leader
with a less educated leader causes annual growth to fall by 1.7 percentage points.12
In village governments in India, where the sarpanch has few resources and staff available to
assist her in the day-to-day administration of the GP, leader quality has an arguably more direct
impact on development outcomes and public service delivery than at the national level. Several
studies have shown that leader characteristics determine the mix of public goods that a
jurisdiction receives in India. Chattopadyay and Duflo (2004) find that female sarpanch prioritize
public goods that matter for women (like drinking water). Pande (2003) finds that legislator caste
10
Ghosh and Gupta (2009), p. 26 11
Jones and Olken (2005), p. 856 12
Besley et al (2011), p. 216
5
affects the size of transfers to programs for minority groups. Recent research from Novosad and
Asher (2012) finds that leader type has a significant effect on employment and growth.
While policy reports have identified a correlation between leader quality and functionality of
village governments in North India,13
there is little causal evidence that links sarpanch
educational qualifications to development outcomes. In the following analysis, I quantify the
impact that sarpanch education has on three GP-level indicators that play important roles in
economic development: educational attainment, the quality of management of government
programs, and the misuse of political influence for private gain.
In this analysis, I use whether the sarpanch completed high school as my indicator of education.
This indicator is used for three reasons. First, data on sarpanch educational attainment appears to
be more reliable, or at least more consistent, than data on literacy: whereas the incidence of
illiteracy is 60% higher in survey data than in SEC data, the likelihood of having a high school
degree is comparable across the two datasets. Second, it is more theoretically compelling that a
high school education would enable a sarpanch to better manage development programs than
simply being literate: whereas a sarpanch may have learned some accounting in high school, it is
unlikely that a literate sarpanch without formal education would be able to assemble a budget
more effectively than an illiterate sarpanch. Finally, the use of high school as an indicator of
education is consistent with other studies done in a similar context (e.g. Ghosh et al 2010).
Sarpanch education and GP educational attainment
One of the most direct ways that sarpanch education can affect local development is through
village educational outcomes. A more educated sarpanch may prioritize educational policies and
programs in her GP’s development agenda. One college-educated sarpanch said, "Whether it is
the men, women or children of the village, if they are educated, they will learn to fight for what
is right and if they know to read and write, [there is] little chance of them being taken for a
ride."14
A more educated sarpanch may also be a model to citizens to increase their own
educational attainment. Since the sarpanch is one of the most visible individuals in the village,
13
Ghosh and Gupta (2009), Ghosh et al (2010) 14
Pagalguy.com (2012), URL
6
her example is emulated by her supporters. If the sarpanch prioritizes education in her household,
then villagers might be “nudged” to educate their own children.
Using data on sarpanch educational attainments and GP-level literacy rates in Rajasthan, I test
the hypothesis that having a more educated sarpanch leads to better educational outcomes in the
GP. In order to account for initial GP conditions in my analysis,15
I compare the change in
literacy rates from 2001 to 2011 in GPs that elected an educated sarpanch with GPs that elected
an uneducated sarpanch. I provide the full regression tables in Appendix 3. Figure 1 presents
my results:
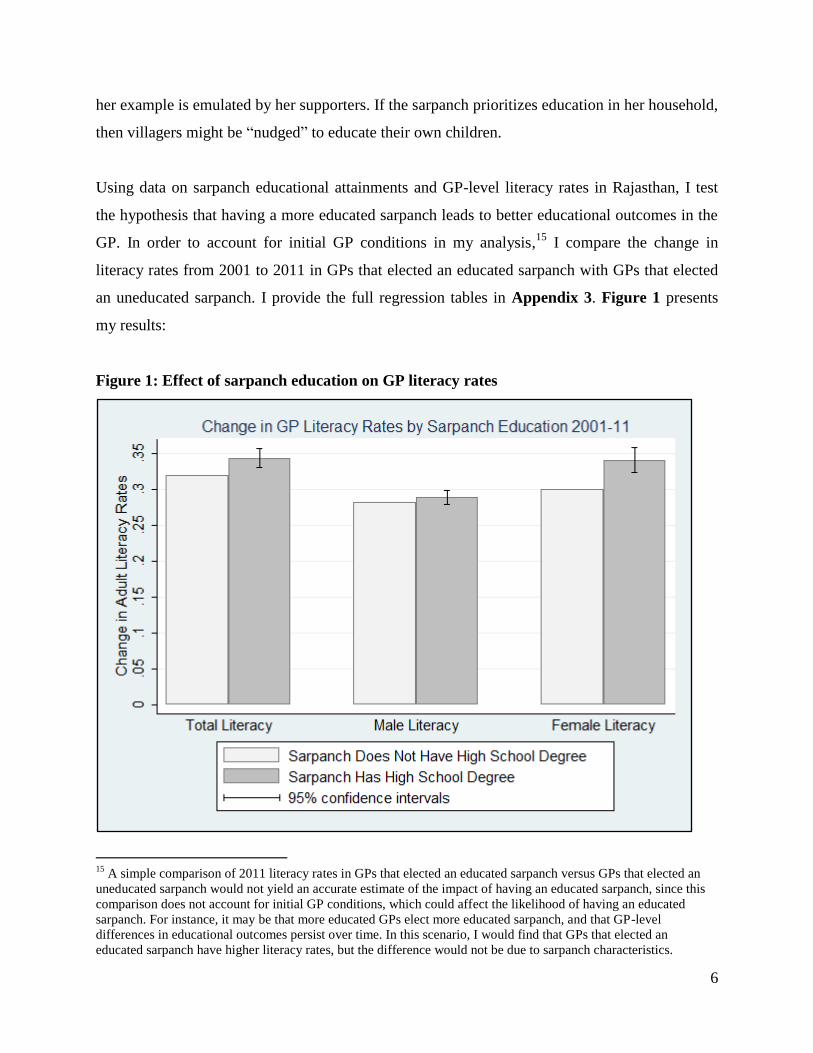
Figure 1: Effect of sarpanch education on GP literacy rates
15
A simple comparison of 2011 literacy rates in GPs that elected an educated sarpanch versus GPs that elected an
uneducated sarpanch would not yield an accurate estimate of the impact of having an educated sarpanch, since this
comparison does not account for initial GP conditions, which could affect the likelihood of having an educated
sarpanch. For instance, it may be that more educated GPs elect more educated sarpanch, and that GP-level
differences in educational outcomes persist over time. In this scenario, I would find that GPs that elected an
educated sarpanch have higher literacy rates, but the difference would not be due to sarpanch characteristics.
7
On average, GPs that elected an educated sarpanch in 2005 had 2.4 percentage points (or 7.5%)
higher growth in literacy rates than GPs that elected an uneducated sarpanch. The probability
that this finding is due to random chance, and that the two types of GPs actually have the same
growth in literacy rates, is less than 1%.
Moreover, the relationship between sarpanch education and literacy appears to be almost entirely
driven by growth in female literacy: whereas male literacy increased similarly in all GPs, female
literacy increased 4 percentage points (13.3%) faster in GPs with educated sarpanch.
This difference may in part be explained by the fact that there was simply more room for female
literacy to grow in these GPs: male literacy in 2001 was 61.3%, whereas female literacy was
only 31.0%. Another reason may have to do with where the gains in literacy are concentrated.
GPs with educated sarpanch that were reserved for female sarpanch (1/3 of all GPs) had
especially large literacy gains: 3.5 percentage points greater than literacy gains in unreserved
GPs with educated sarpanch. The gains in these reserved GPs were almost exclusively driven by
growth in female literacy: growth in female literacy was 4.8 percentage points greater in reserved
GPs that elected an educated sarpanch than in unreserved GPs that elected an educated sarpanch.
There are many channels through which an educated female sarpanch may affect female literacy
more than male literacy, such as female sarpanch’ policy preferences and the effects of female
role models on the aspirations of women. Hence, the differential responsiveness of male and
female literacy to sarpanch education appears to be, at least in part, explained by the fact that
literacy gains are concentrated in GPs with female leaders, where shifts in policy preferences and
social norms may have encouraged reductions in gender biases in educational attainment.
Figure 1 presents strong evidence that sarpanch education can affect GP-level educational
outcomes. However, it depends on the “parallel trends” assumption that GPs that elected
educated sarpanch would have had a similar increase in literacy rates (though not the same levels
of literacy) as other GPs had they not elected educated sarpanch. There may be various reasons
why this assumption may not be true. For instance, it may be that voters in certain GPs had high
educational aspirations, and that those voters elected educated sarpanch in order to help them
realize those aspirations; even had they not elected educated sarpanch, literacy in those GPs may
8
have increased more rapidly than literacy in GPs where voters did not have those aspirations. For
this reason, it would be useful to have additional evidence on this effect. While data limitations
prevent me from more robust methodologies in this section,16
I will use a quasi-experimental
approach in the next two sections to establish the link between sarpanch education and the
quality of management of government programs.
Sarpanch education and local program administration
Educated sarpanch may be more competent managers of development projects than less educated
sarpanch, and may deliver public services more efficiently. Ghosh et al (2010) find that sarpanch
education is positively correlated with the number of projects started in a GP in Bihar: sarpanch
with high school degrees started twice as many business-promotion projects as sarpanch without
high school degrees, as well as more infrastructure and development projects.17
Besley et al
(2012) show that a large anti-poverty program is more effectively targeted to low-caste and
landless households in GPs with educated sarpanch.18
In this section, I expand on these analyses
by establishing a robust causal link between sarpanch education and public program management
in the context of a large development program, the Mahatma Gandhi National Rural
Employment Guarantee Scheme (MGNREGS).
MGNREGS is the largest pay-for-work program in the world: last year, it provided 2.3 billion
person-days of work to 50 million Indian households.19
Under MGNREGS, any rural household
that requests work is legally guaranteed a job card and 100 days per year of unskilled manual
labor at a minimum wage determined by the state. MGNREGS makes up a substantial fraction of
a GP’s total budget: data from Bihar show that transfers for MGNREGS comprised 54% of the
average GP’s budget for development projects and 32% of total expenditures in 2009.20
Since
then, the program has grown rapidly, and last year the average GP in Bihar received ₹1.9 million
for MGNREGS projects,21
or 70% of total GP expenditures in 2009.
16
Specifically, I lack election data from 2005, which prevents me from using a regression discontinuity approach
that I will employ in the next section. 17
Ghosh et al (2010), p. 55 18
Besley et al (2012), p. 24 19
MGNREGS website, FY 2012-2013, URL 20
Ghosh et al (2010), pp. 145 and 155 21
MGNREGS website, Fund Flow Statement for FY 2012-2013, URL

9
The sarpanch is responsible for overseeing local administration of MGNREGS. Since the
premise of the program is demand-driven development, local leaders, especially the sarpanch,
must manage most aspects of implementation, including lobbying for projects, managing
beneficiary lists, overseeing project implementation, and ensuring that workers get paid and
materials get procured. Having an incompetent sarpanch can make the difference between
MGNREGS functioning as an effective social safety net in a GP and failing to provide sufficient
work to underemployed laborers.
A sarpanch’s ability to oversee effective implementation of MGNREGS depends on her
education. J-PAL administered a short assessment of knowledge about MGNREGS to sarpanch
in Rajasthan in 2011. The assessment tested the sarpanch’s knowledge of the program’s
provisions that are standard across GPs. The number of questions answered correctly was
strongly correlated with sarpanch educational attainment: sarpanch with a high school degree
answered on average 18% more questions correctly than sarpanch without a high school degree.
Does more education translate not only into more knowledge about the program, but into better
management as well? To answer this question, I use results from the 2010 local elections in
Rajasthan to compare MGNREGS management in GPs that elected an educated sarpanch versus
GPs that elected an uneducated sarpanch. My approach merges two datasets, collapsed to the
GP-level. First, I use SEC candidate-level vote data from the 2010 local elections, which
includes the educational attainment of candidates. Since 62% of the education data is missing for
sarpanch candidates, I use the SEC’s district-level counts of sarpanch by level of education and a
robust statistical process to fill in the missing data. Appendix 4 explains this process, called
multivariate normal imputation, in more detail. Second, I download data on indicators of
MGNREGS management from 2009 to 2013 from the MGNREGS website.22
22
Data on all MGNREGS outlays at the GP-level is available on the new Public Data Portal of the MGNREGS
website at <http://164.100.129.6/netnrega/dynamic2/DynamicReport_new4.aspx>.
10
I limit my analysis to GPs where the margin of victory between the educated candidate and the
uneducated candidate was very small (less than 5% of votes cast).23
In these cases, the election
outcome was essentially random, and unrelated to other GP characteristics (like average level of
educational attainment among voters).24
This approach therefore enables me to measure the
impact on local development outcomes specifically attributable to the sarpanch.
It is important to note that I am not able to measure the effect of sarpanch education per se on
development outcomes, but rather the effect of the type of sarpanch who tends to be educated
versus the type of sarpanch who tends to be uneducated. This subtle distinction can lead to poor
policy prescriptions if not properly understood. For instance, it may be that educated sarpanch
appear to be better managers because education is closely related to a more directly applicable
characteristic, such as political experience. In this scenario, encouraging educated villagers to
run for office may not be an effective policy tool if it only prompts educated villagers without
political experience to run. I account for this problem to some extent by including several
relevant candidate characteristics from the SEC dataset in my analysis, including caste, gender
and age. My results can therefore be interpreted as the effect of the type of sarpanch who tends
to be educated on development outcomes that is not attributable to the characteristics I account
for in my model. However, there may be other unmeasurable sarpanch characteristics, like
ambition, that are related to education and also contributing to the differential impact between
GPs that elect educated candidates and GPs that elect uneducated candidates.
I analyze two types of indicators of MGNREGS management: total MGNREGS spending, which
demonstrates how extensive the program is in the GP, and the percent of projects running behind
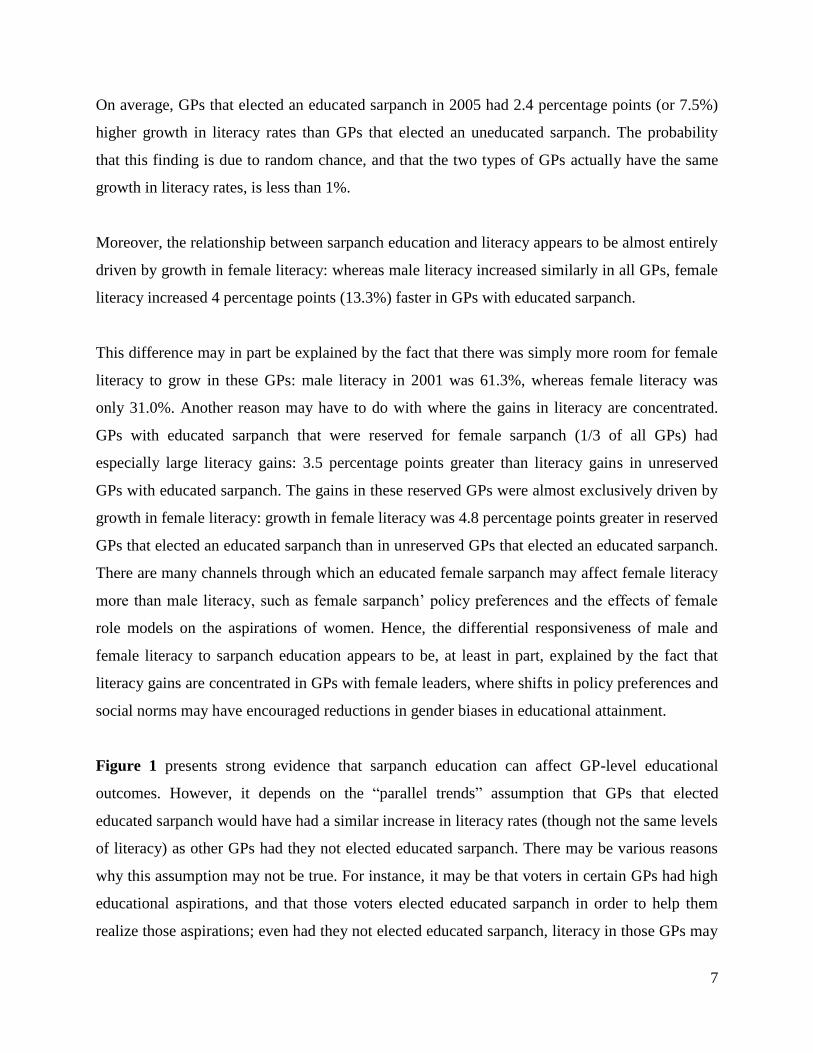
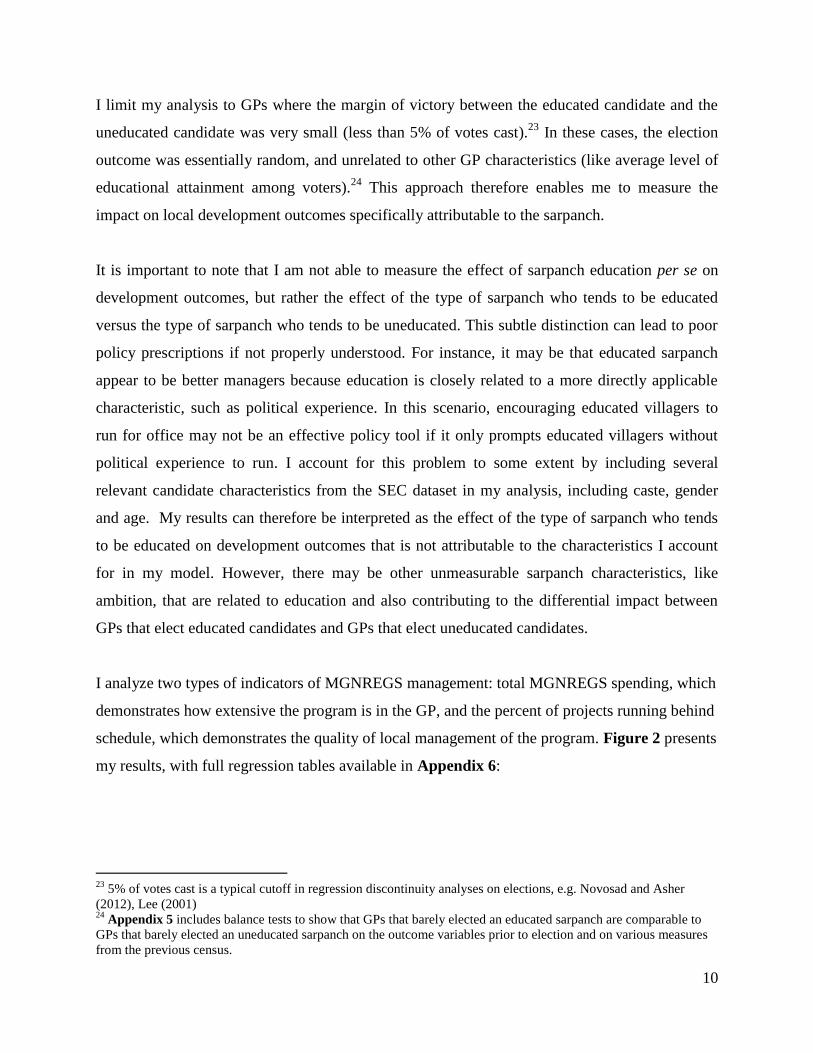
schedule, which demonstrates the quality of local management of the program. Figure 2 presents
my results, with full regression tables available in Appendix 6:
23
5% of votes cast is a typical cutoff in regression discontinuity analyses on elections, e.g. Novosad and Asher
(2012), Lee (2001) 24
Appendix 5 includes balance tests to show that GPs that barely elected an educated sarpanch are comparable to
GPs that barely elected an uneducated sarpanch on the outcome variables prior to election and on various measures
from the previous census.
11
Figure 2: Effect of sarpanch education on MGNREGS outcomes
GPs that elected a sarpanch with a high school degree received on average ₹1.08 million more in
funds in the years after the election than GPs that elected a sarpanch without a high school
degree. GPs that elected a sarpanch with a high school degree had 4.8 percentage points or
20.2% fewer projects running behind schedule in the years after the election than GPs that
elected a sarpanch without a high school degree. This evidence suggests that sarpanch education
matters for local program management.
Sarpanch education and the misuse of political influence for private gain
Another channel through which sarpanch education may affect local development outcomes is by
influencing the likelihood of the sarpanch to abuse her power in order to benefit her supporters at
the expense of the village. Besley et al (2012) offer several theories for how a sarpanch might
abuse her power to influence policy. In the self-interest model, the sarpanch uses her influence to
direct more public services to her own household. The authors find evidence for this in four
12
South Indian states: after controlling for official eligibility criteria, like wealth and caste,
sarpanch are 9.5% more likely to be selected as beneficiaries of the Below Poverty Line
program.25
In the agenda-setting model, the sarpanch uses her influence to direct more public
services to her supporters, who, due to rigid ethnic boundaries in communities in rural India,
often live nearby. I test this model below.
It is not clear from theory whether educated sarpanch are more or less likely to be corrupt than
uneducated sarpanch. On the one hand, an educated sarpanch may be more likely to be corrupt if
her education makes it easier for her to hide illicit activity. On the other hand, an educated
sarpanch is more likely to have lucrative career opportunities in the private sector; thus an
educated villager who chooses to work in the public sector may be more likely to be motivated
by altruism (and less likely to be corrupt) than an uneducated villager who chooses to work in
the public sector because she does not have lucrative private sector options.
Another possibility is that educated and uneducated sarpanch are equally motivated by altruism
but that uneducated sarpanch are more susceptible to capture by local political and landed
interests. In a recent interview with The Indian Express about issues in decentralization,
economist Pranab Bardhan related corruption to the capacity gap in GP offices:
“Capture is a big problem. It is much easier to capture a panchayat than the Lok Sabha...
The money is coming from above, and that’s where the power is… Quite often, in
villages, there is no expertise. A lot of corruption takes place because there simply isn’t
the capability to do book-keeping or auditing.”26
I test for sarpanch abusing their political influence with data from survey GPs, which includes
geo coordinates of MGNREGS projects and the coordinates of sarpanch candidates’ households.
I use ArcGIS to create buffers around each candidate’s household, then I overlay the buffers with
MGNREGS project locations. Since sarpanch are more likely to come from larger villages,
which also have more projects, a comparison of the number of projects near the sarpanch’s house
25
Besley et al (2012), p. 22 26
The Indian Express (2014), URL
13
versus losing candidates’ households would likely overstate the sarpanch effect. Instead, I use a
similar approach as with MGNREGS funds and delayed projects: I limit my sample to GPs
where the margin of victory is less than 5% of vote share, then compare the number of projects
started after the election near the winner’s house versus the number of projects near the runner-
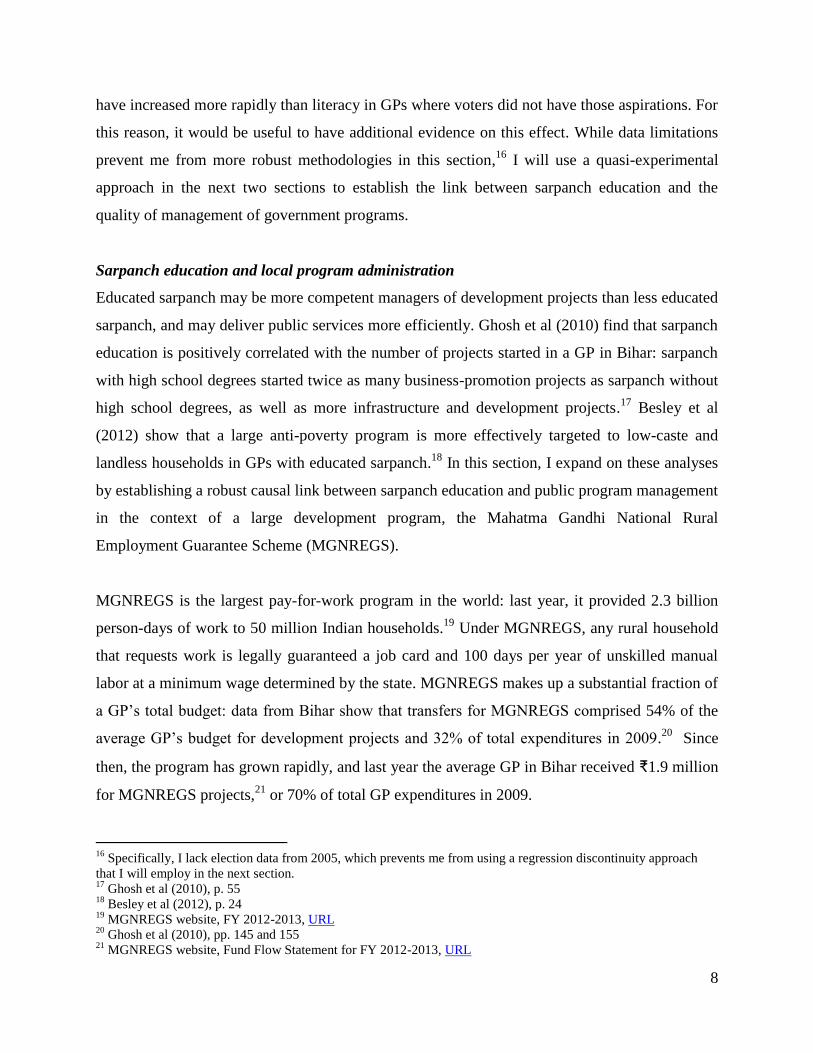
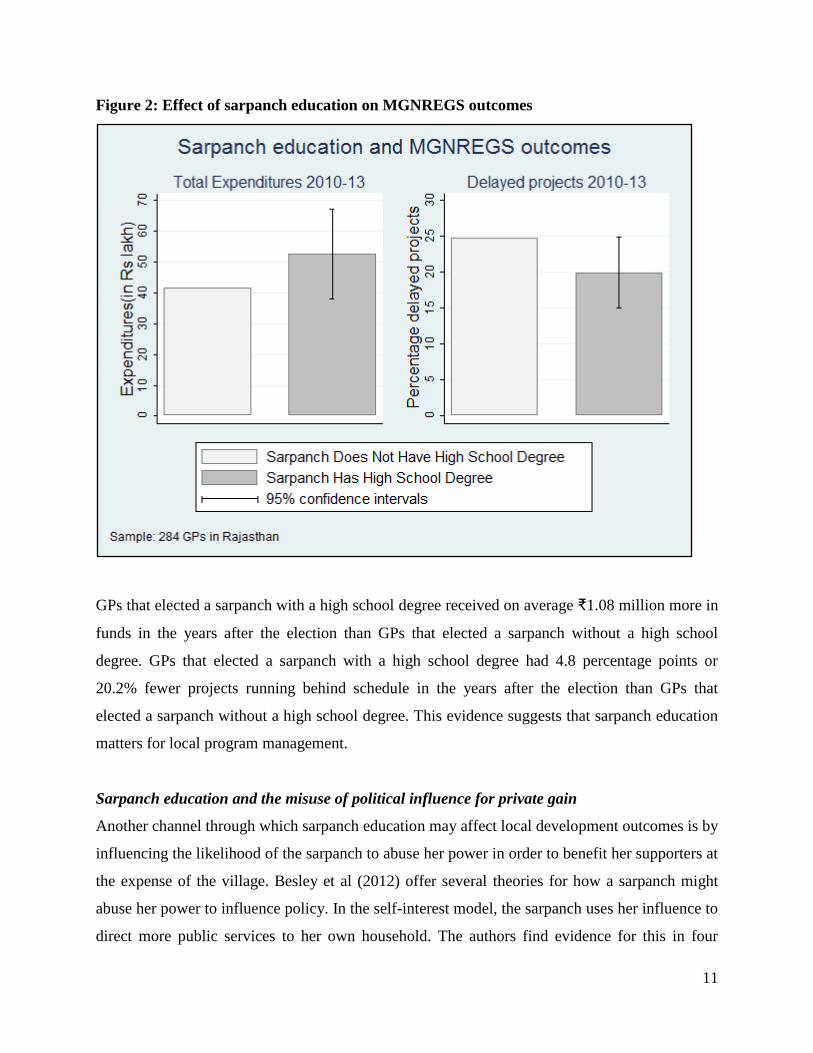
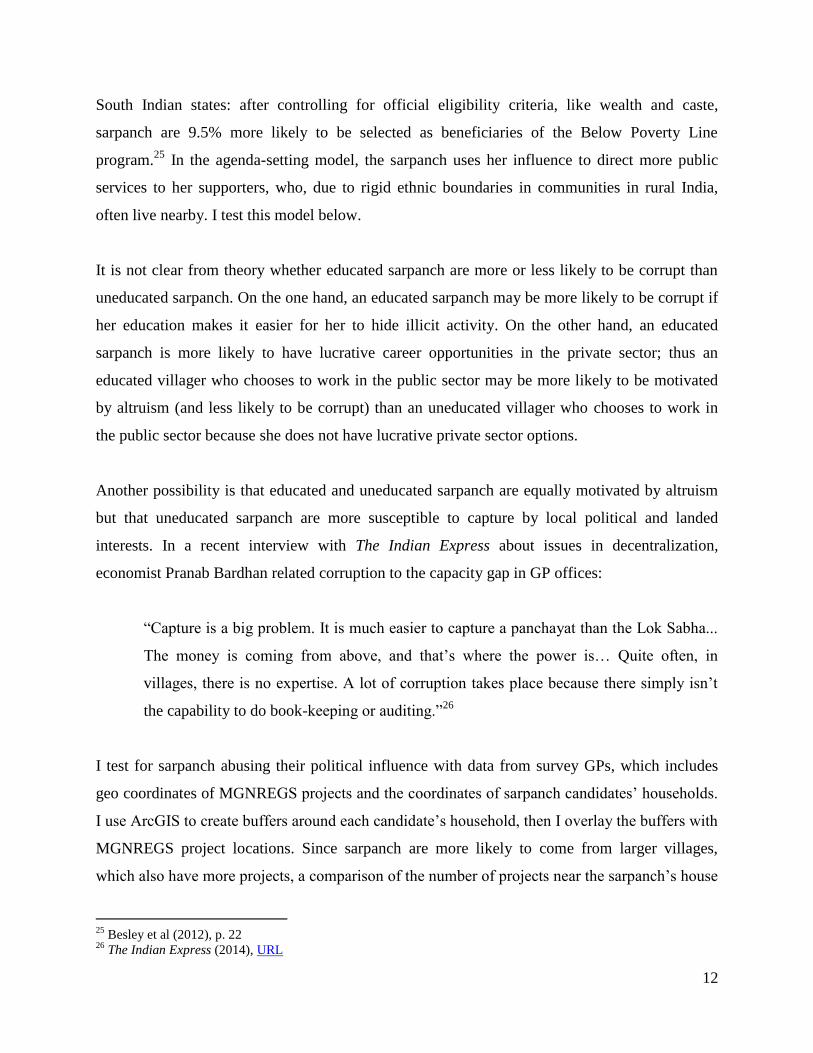
up’s house. The results are in Figure 3, with the full regression tables in Appendix 7:
Figure 3: Effect of sarpanch education on corruption in MGNREGS administration
These results confirm the agenda-setting model: significantly more MGNREGS projects are
started near the households of candidates who barely won the election than those who barely lost
the election. At the same time, more educated sarpanch are less likely to use their influence to
direct MGNREGS projects to their neighborhood. In fact, statistical tests on these results show
that the number of projects started near the households of educated winners is statistically
indistinguishable from the number of projects started near the households of educated losers,
whereas the difference in the number of projects started near the households of uneducated
14
winners versus uneducated losers is positive and statistically meaningful.27
Appendix 7 confirms
that these results are robust to whether I only look at projects in the immediate vicinity of the
sarpanch’s house (500m) or further away (1,000m).
Besley et al (2012) find a similar result in South India in the context of another government
program: More educated politicians are less likely to use their influence to secure Below Poverty
Line cards than less educated politicians, even after accounting for eligibility criteria like
income.28
The sarpanch advantage entirely disappears for sarpanch with a high school degree.29
This evidence suggests that when voters elect an uneducated sarpanch, they may be inadvertently
increasing the probability that they are also electing a sarpanch who is more susceptible to
abusing her influence or to political capture, with detrimental effects on public service delivery.
Hence, efforts by the MoPR to reduce illicit behavior could simultaneously improve the quality
of candidates who decide to run for office.
Distributional implications
The type of sarpanch that a GP elects depends partly on GP characteristics, like average
educational attainment, and thus certain types of GPs systematically choose less educated
sarpanch. This may cause certain GPs to be stuck in an “education trap”: GPs with lower average
educational attainment are more likely to elect less educated sarpanch, less educated sarpanch
invest less in education, and thus the GP has a lower future supply of educated candidates. Since
sarpanch education matters for public service delivery, this education trap could create
conditions for a poverty trap: historically less educated GPs elect less educated sarpanch, who
are inferior managers of public service delivery, leading to declining public goods and worsening
poverty with successive uneducated sarpanch.
Using evidence from J-PAL’s household survey in Rajasthan, I find that GPs with historically
worse infrastructure are more likely to elect uneducated sarpanch. The full regression results can
27
Specifically, an F-test for whether the sum of the first and third coefficients in the regression results in Appendix
7 is significantly different from zero. 28
Besley et al (2012), Table 6 Column 4 29
ibid.
15
be found in Appendix 8. When combined with Figure 3, this completes the vicious cycle of
infrastructure-poor GPs receiving worse public services and becoming still poorer. Hence, while
the problem of uneducated sarpanch is pervasive, it may have particularly detrimental and long-
lasting implications for the poorest GPs. If the MoPR has limited funds or capacity to roll out
new programs across North India, then it should focus its efforts on these GPs. I explore this
option in the “targeted” scale-up scenario described in the implementation guidelines below.
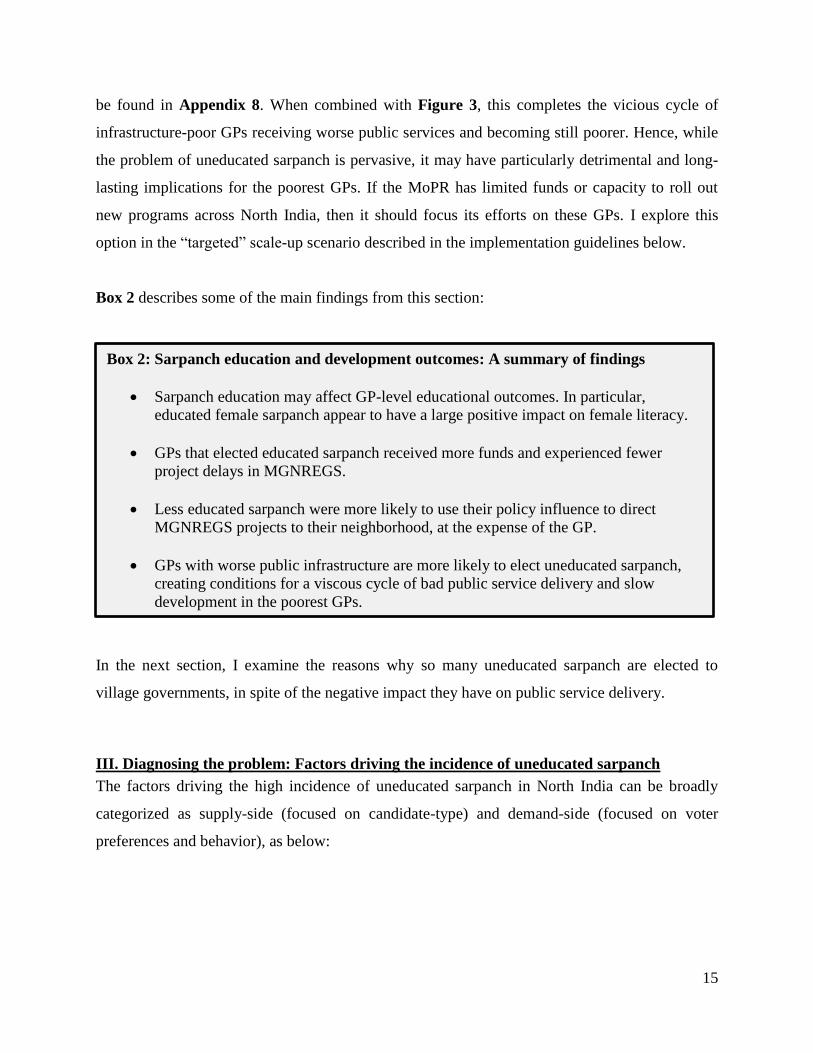
Box 2 describes some of the main findings from this section:
In the next section, I examine the reasons why so many uneducated sarpanch are elected to
village governments, in spite of the negative impact they have on public service delivery.
III. Diagnosing the problem: Factors driving the incidence of uneducated sarpanch
The factors driving the high incidence of uneducated sarpanch in North India can be broadly
categorized as supply-side (focused on candidate-type) and demand-side (focused on voter
preferences and behavior), as below:
Box 2: Sarpanch education and development outcomes: A summary of findings
Sarpanch education may affect GP-level educational outcomes. In particular,
educated female sarpanch appear to have a large positive impact on female literacy.
GPs that elected educated sarpanch received more funds and experienced fewer
project delays in MGNREGS.
Less educated sarpanch were more likely to use their policy influence to direct
MGNREGS projects to their neighborhood, at the expense of the GP.
GPs with worse public infrastructure are more likely to elect uneducated sarpanch,
creating conditions for a viscous cycle of bad public service delivery and slow
development in the poorest GPs.
16
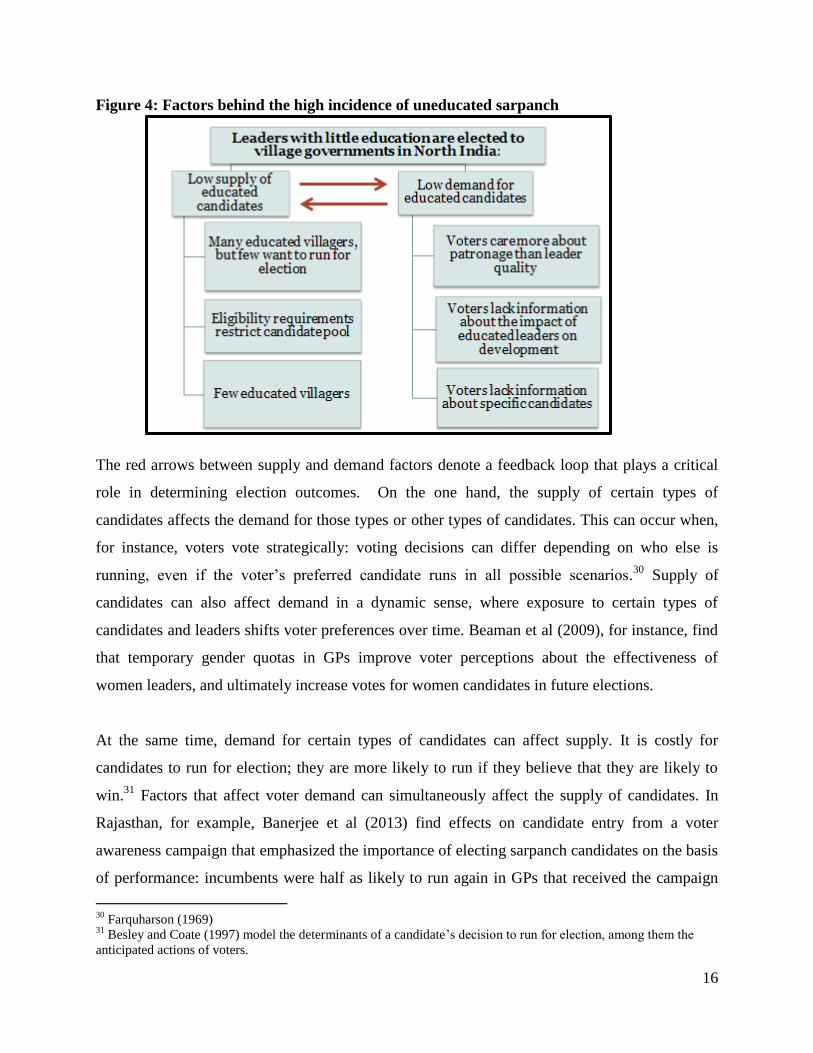
Figure 4: Factors behind the high incidence of uneducated sarpanch
The red arrows between supply and demand factors denote a feedback loop that plays a critical
role in determining election outcomes. On the one hand, the supply of certain types of
candidates affects the demand for those types or other types of candidates. This can occur when,
for instance, voters vote strategically: voting decisions can differ depending on who else is
running, even if the voter’s preferred candidate runs in all possible scenarios.30
Supply of
candidates can also affect demand in a dynamic sense, where exposure to certain types of
candidates and leaders shifts voter preferences over time. Beaman et al (2009), for instance, find
that temporary gender quotas in GPs improve voter perceptions about the effectiveness of
women leaders, and ultimately increase votes for women candidates in future elections.
At the same time, demand for certain types of candidates can affect supply. It is costly for
candidates to run for election; they are more likely to run if they believe that they are likely to
win.31
Factors that affect voter demand can simultaneously affect the supply of candidates. In
Rajasthan, for example, Banerjee et al (2013) find effects on candidate entry from a voter
awareness campaign that emphasized the importance of electing sarpanch candidates on the basis
of performance: incumbents were half as likely to run again in GPs that received the campaign
30
Farquharson (1969) 31
Besley and Coate (1997) model the determinants of a candidate’s decision to run for election, among them the
anticipated actions of voters.
17
versus GPs that did not receive the campaign, and the effect was strongest for the worst
performing incumbents (based on an index of local MGNREGS management).32
In this context,
low-performing incumbents anticipated that the voter awareness campaign would shift voter
preferences for better quality candidates, thereby reducing the likelihood that they would win and
the incentive for them to re-contest.
These feedback effects have important implications for policy: interventions that target one
factor will likely affect outcomes indirectly through other factors. This policy exercise will
attempt to identify the factors that primary and secondary evidence indicate are the most
constraining to the election of educated sarpanch, while taking into account the direct and
indirect effects that targeting those factors would have on electoral outcomes.
A. Supply-side factors
Myerson (2011) writes that, “the essential problem in building a democratic state is to develop
the nation’s supply of democratic leaders.”33
In this section, we consider whether the high
incidence of uneducated sarpanch in North India can be partly attributed to an underdeveloped
supply of high-quality prospective leaders. If this is the case, then at least one of three conditions
are likely to hold: there is a small or nonexistent pool of educated villagers, there are educated
villagers who would like to run but are restricted from doing so, or there are educated villagers
who are not restricted but choose not to run.
1. Supply-side factors: Availability of prospective educated candidates
There is little that the MoPR can do about the high incidence of uneducated sarpanch if some
GPs have no educated villagers, except to provide training and administrative support after
elections. Fortunately, this is not the case. In the J-PAL household survey, a minimum of 10.4%
of respondents in each GP were able to read a 2nd
grade level text, though in most GPs the rate
was 44% or more. Projecting the survey data to the whole GP population, I calculate that every
GP (in the sample) has at least 337 adults who can read a 2nd
grade text, and most GPs have
2,000 adults or more who can read at this level.
32
Banerjee et al (2013), p. 17 33
Myerson (2011), URL
18
There are substantially fewer villagers with high school or college degrees. However, for the
most part, every GP has some high school and college graduates. Distributions in survey districts
of literate villagers, high school graduates and college graduates are calculated using sampling
weights and shown in Appendix 9.34
While most GPs have fewer than 1,000 high school
graduates and fewer than 500 college graduates, even the least educated GPs have some educated
villagers who could run for election. Next I will explore whether these villagers are prevented
from running or they choose not to run.
2. Supply-side factors: Restrictions preventing educated candidates from running
In India, one of the core motivations for decentralization under the 73rd
amendment was
“insufficient representation of Scheduled Caste, Scheduled Tribes and women.”35
The
amendment mandates that states reserve at least 1/3 of GP seats for women and a fraction of
seats for low castes proportional to their population in the state; some states have reserved more
seats than required. While caste and female reservation rotate between GPs every five years, in
certain states up to ¾ of GPs can have restrictions on who is eligible to contest the sarpanch seat
in any given election. In the three survey districts in 2010, 47% of GPs had restrictions on the
caste of eligible candidates and 48% of GPs were reserved for women candidates. In total, 74%
of sarpanch seats were reserved either for a particular gender or caste, or both.
Gender and caste quotas have played an important role in increasing representation of minority
groups in local governments in India. Strong causal evidence has shown that quotas reduce voter
bias toward female candidates after they have been removed and increase the political
participation of women.36
Greater representation translates into policy gains for minority groups:
female sarpanch invest more than male sarpanch in public goods that matter for women, such as
drinking water and roads, and low caste politicians increase spending on welfare programs for
low caste groups.37
By increasing the political participation of minority groups, and hence by
increasing the pool of qualified candidates, gender and caste quotas are also important
instruments for improving sarpanch quality and public service delivery in the long run.
34
The value in the histogram for each GP is the expected value using sample weights; the actual value may differ
from this due to statistical noise, which is greater for larger GPs. 35
73rd
Amendment to the Constitution of India (1992), URL 36
Beaman et al (2009); Bhavnani (2009); Beaman et al (2011) 37
Chattopadhyay and Duflo (2004); Pande (2003)
19
Quotas also play an important role in reducing economic and social inequalities between
minority and majority groups in rigidly stratified communities. For instance, GPs that were
reserved for women and that elected an educated sarpanch had 4.8 percentage points greater
gains in female literacy from 2001-11 than GPs that were unreserved and elected an educated
(usually male) sarpanch (Section II.C). Chattopadyay and Duflo (2004) and Pande (2003) give
further evidence that minority leaders prioritize the policy preferences of minority groups.
In the short run, however, debates over gender and caste quotas have centered on the deleterious
effects of preventing groups with historically higher educational attainment (i.e. upper caste
men) from contesting nearly ¾ of village elections in many states. In the three survey districts,
sarpanch in reserved seats are indeed more likely to be uneducated. Whereas 85% of sarpanch in
unreserved GPs were able to read a 2nd
grade text, only 2% of sarpanch in GPs reserved for low
caste women were able to read the same text.
Although gender and caste quotas may reduce the number of educated candidates who can
contest for seats in certain GPs in the short run, they are not the root cause for the high incidence
of uneducated sarpanch. First, even in reserved GPs, there are many educated women and
minorities who could run but choose not to. In sample GPs, there are on average 248 low caste
high school graduates, 113 female high school graduates, and 22 female low caste high school
graduates. Second, even in unreserved GPs, there are many sarpanch who are uneducated: only
38.2% of sarpanch in unreserved GPs have high school degrees and 14.7% cannot read.
However, it is important to address the fact that, in the short run, sarpanch in reserved
constituencies have on average fewer educational qualifications. Additional policy instruments,
such as special trainings for minority candidates, may be critical to ensuring that the MoPR
meets its dual objectives of bolstering the capacity of local governments to deliver public
services and encouraging minority political participation.
3. Supply-side factors: Incentives to educated villagers to contest in elections
In the previous section, I showed that there are many educated villagers, from all ethnic groups
and both genders, who are living under uneducated sarpanch. Most of these villagers do not run
for office. In the typical GP in the three survey districts in 2010, 8 candidates contested the
20
sarpanch’s seat. Only 3 of these candidates could read a 2nd
grade text and only 2 had high
school degrees. In 72% of GPs, no candidate had a college degree.
a. Incentives to run: Sarpanch salary
The pay scale for sarpanch is likely one reason why more educated villagers do not run for the
position. Although pay varies by state, it is generally extremely low:
Table 3: Sarpanch pay in select states
State Pay per month: INR (USD) Source
Andhra Pradesh ₹1,500 ($24) The Hindu
Bihar ₹1,200 ($19) Bihar Times
Goa ₹4,000 ($64) Times of India
Orissa ₹1,000 ($16) The Telegraph
Punjab ₹1,200 ($19) Day and Night News
Rajasthan ₹3,000 ($48) Pagalguy.com
Tripura ₹1,000 ($16) Tripura Government
Uttar Pradesh ₹3,000 ($48) Indiankanoon.org
To put these salaries into perspective, the Planning Commission of India sets the poverty line for
rural areas at ₹816 per capita per month.38
A family of four that relies on a sarpanch salary is
living in poverty in every state but Goa. The government does not expect sarpanch to supplement
their salary with additional income: sarpanch are prohibited from holding any other job at risk of
forfeiting their office.39
Educated villagers have far more lucrative options, even within the public sector, than being
sarpanch (assuming that the official salary is their only remuneration). Panchayat teachers in
Rajasthan start at ₹9,300 per month, and senior teachers earn up to ₹34,800 per month.40
Junior
civil servants based in panchayat offices earn similar salaries. Educated villagers who move to
urban centers can make far more. When a woman gave up a corporate job in Delhi to become a
low-paying sarpanch of her family’s village, it made newspaper headlines. The woman
38
Press Note on Poverty Estimates, Planning Commission (2013), URL 39
Rajasthan Panchayati Raj Act (1994), Part 4.1, URL 40
Rajasthan Finance Department, Revision of Pay Scales (2006), URL
21
commented on the sarpanch salary, "I get ₹3,000 as salary as a sarpanch which covers nothing. I
am blessed that my family can look after me. I wonder what other sarpanch do."41
b. Incentives to run: Altruism
So if it’s not the salary, what motivates so many candidates – as high as 24 in some GPs – to run
for office? One reason may be altruism. In the J-PAL survey of sarpanch candidates, 83.9%
stated that they ran to develop the village, and 79.1% stated that they ran to improve village
infrastructure. However, it is likely that candidates exaggerate their sense of selflessness while
on the campaign trail. Hanna and Wang (2013) find that the public sector may actually attract
less altruistic people: university students in Karnataka who cheat and exhibit anti-social behavior
in laboratory games are more likely to express a preference for entering public service.42
c. Incentives to run: Illicit returns to office
Another reason that candidates may run for office is non-salary remuneration. Although sarpanch
pay is not enough to keep a family out of poverty, only 25.7% of incumbents in survey GPs feel
that they receive insufficient compensation. Some sarpanch may be making up the difference by
stealing from public coffers. Police in Bihar are tracking more than 100 sarpanch who have
become millionaires in the last five years, and 500 other sarpanch who have assets over ₹10
million.43
According to the newspaper article, these sarpanch amass wealth by siphoning off
funds from MGNREGS and other development programs, and spend much of their ill-gotten
gains to arm militias that they use to cement their power. Other sarpanch may be growing
wealthy by demanding bribes from villagers to access public service. In West Bengal, 10.2% of
households admit to paying a bribe for GP services;44
there are likely more households that are
paying bribes but do not admit this to surveyors.
Sarpanch may also profit from their position by influencing policy in ways that favor their family
and supporters, without directly stealing public funds. As demonstrated in Figure 3, sarpanch
give priority to their neighborhood when deciding where to start new MGNREGS projects.
41
Pagalguy.com (2012), URL 42
Hanna and Wang (2013), p. 19. 43
DowntoEarth.org (2013), URL 44
Beaman et al (2011), Table 5
22
d. Incentives to run: Career opportunities
For some candidates, the decision to run may have less to do with short-term returns from their
tenure as sarpanch, and more to do with the long-term payoff from starting a career in politics. In
survey districts, 2/3 of sarpanch state that they would like to run for political office in the future,
and 58% of those sarpanch state that they would like to run for a higher office, such as district
leader, state legislator, or even member of the national parliament.
However, most of these sarpanch will not be able to attain higher office, as there are few
openings and many candidates for these positions. In the J-PAL survey of 156 outgoing
sarpanch, none were successful in a bid for higher office. In fact, only 6 of the 45 sarpanch who
chose to run again for the same position were re-elected. The majority of previous sarpanch
either went back to working on their farms (56.3%) or became unemployed (27.1%). Educated
villagers can likely find better long-term options in other careers.
e. Incentives to run: Family pressures
Many candidates may run due to family pressures. In survey GPs, 69.3% of candidates said that
their decision to run was influenced by their family members. Family pressures may reflect
norms about certain families or castes participating in local politics; if this is the case, then many
villagers from other families or castes may face social obstacles to contesting in local elections.
This could lead to concentration of power in the hands of the few, or “captured democracy”, with
detrimental effects on long-term economic outcomes.45
In Rajasthan, local politics are dominated by a small number of political families. A back-of-the-
envelope calculation suggests that there are a maximum of 1 million elected leaders, past and
present, living in Rajasthan at any one time.46
According to the 2011 Census, there are 12.7
million households in the state.47
If I assume that each leader comes from a different household,
then the expected probability that someone in a random household has a relative who has held
elected office is about (1 million / 12.7 million) = 7.9%. Yet in survey GPs, 46.8% of sarpanch
45
Acemoglu and Robinson (2008) 46
Calculation: ~105,000 panch + 9,166 sarpanch + 5,280 sub-district leaders + 1,254 district leaders + 3,366 ward
councilors + 195 state representatives + 25 MP = ~ 125,000 elected leaders * 8 five-year terms = ~ 1 million.
Assumes no leader is re-elected. Counts are from the Rajasthan SEC website, Panchayat Statistics, URL. 47
2011 Census data
23
candidates have someone from their household who has held an elected position. In other words,
sarpanch candidates are at least 6 times more likely than the average villager to come from a
political household. These calculations imply that there may be a large untapped pool of
potential candidates from non-political households.
B. Demand-side factors
In this section I explore the reasons why voters may not prioritize a candidate’s education in their
voting decision. If the high incidence of uneducated sarpanch in North India can be partly
attributed to low demand for educated candidates, then either voters genuinely prefer less
educated sarpanch or they lack information that would otherwise change their voting decision.
The demand for educated candidates, in turn, may affect the supply: if demand is low, then
educated villagers may be discouraged from running.
As seen in the previous section, one factor contributing to the high incidence of uneducated
sarpanch is that many educated villagers choose to not run for election. However, some educated
candidates do run in most elections: 66.8% of GPs in the three survey districts had at least one
candidate with a high school education in the most recent elections. Most of these candidates
were not selected by voters: only 16.8% of current sarpanch in these districts have a high school
Box 3: Supply-side factors: Implications for policy
This section has highlighted the following insights that are relevant for policy:
Census and survey data show that every GP has some educated villagers from every
ethnic group. Hence, policy may be able to reduce the incidence of uneducated
sarpanch in all types of GPs, if educated villagers can be encouraged to run.
In all GPs, incentives for educated villagers, especially from historically non-political
households, appear to be a key constraint in their decision to not stand for election.
Improving the incentives for these villagers to stand for election by increasing the
appeal of the sarpanch position (though not necessarily through higher wages) may be
an effective way to reduce the incidence of uneducated sarpanch.
Sarpanch in reserved GPs have on average lower education. However, gender and
caste quotas are not the root cause of the high incidence of uneducated sarpanch, and
quotas may actually increase sarpanch quality over time, in addition to helping to
achieve other policy goals. Providing sarpanch in reserved GPs with additional
support would be a more effective long-term strategy than removing quotas.
24
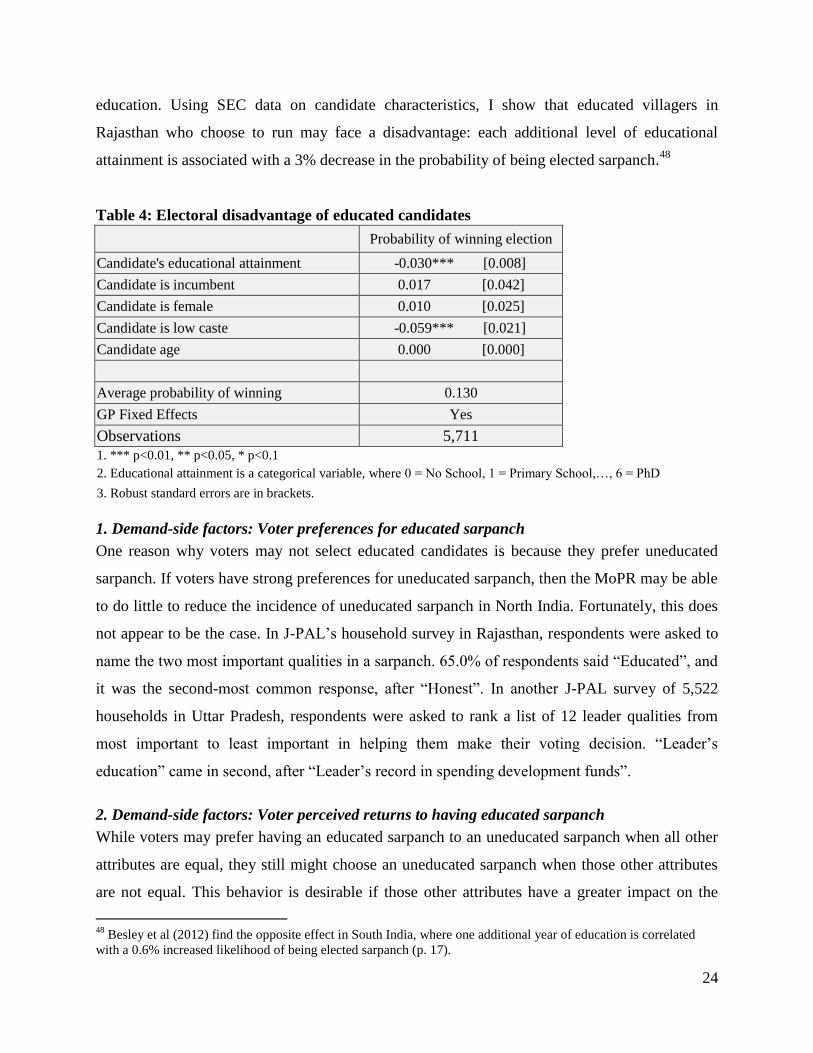
education. Using SEC data on candidate characteristics, I show that educated villagers in
Rajasthan who choose to run may face a disadvantage: each additional level of educational
attainment is associated with a 3% decrease in the probability of being elected sarpanch.48
Table 4: Electoral disadvantage of educated candidates
Probability of winning election
Candidate's educational attainment -0.030*** [0.008]
Candidate is incumbent 0.017 [0.042]
Candidate is female 0.010 [0.025]
Candidate is low caste -0.059*** [0.021]
Candidate age 0.000 [0.000]
Average probability of winning 0.130
GP Fixed Effects Yes
Observations 5,711
1. *** p<0.01, ** p<0.05, * p<0.1
2. Educational attainment is a categorical variable, where 0 = No School, 1 = Primary School,…, 6 = PhD
3. Robust standard errors are in brackets.
1. Demand-side factors: Voter preferences for educated sarpanch
One reason why voters may not select educated candidates is because they prefer uneducated
sarpanch. If voters have strong preferences for uneducated sarpanch, then the MoPR may be able
to do little to reduce the incidence of uneducated sarpanch in North India. Fortunately, this does
not appear to be the case. In J-PAL’s household survey in Rajasthan, respondents were asked to
name the two most important qualities in a sarpanch. 65.0% of respondents said “Educated”, and
it was the second-most common response, after “Honest”. In another J-PAL survey of 5,522
households in Uttar Pradesh, respondents were asked to rank a list of 12 leader qualities from
most important to least important in helping them make their voting decision. “Leader’s
education” came in second, after “Leader’s record in spending development funds”.
2. Demand-side factors: Voter perceived returns to having educated sarpanch
While voters may prefer having an educated sarpanch to an uneducated sarpanch when all other
attributes are equal, they still might choose an uneducated sarpanch when those other attributes
are not equal. This behavior is desirable if those other attributes have a greater impact on the
48
Besley et al (2012) find the opposite effect in South India, where one additional year of education is correlated
with a 0.6% increased likelihood of being elected sarpanch (p. 17).
25
sarpanch’s ability to govern than her education, or if the uneducated candidate better represents
voters’ policy preferences than the educated candidate. However, this behavior could lead to sub-
optimal electoral outcomes if it is due to voters under-valuing the returns to having an educated
sarpanch relative to other attributes, and if it results in voters systematically choosing uneducated
sarpanch over educated sarpanch.
For example, voters may undervalue a candidate’s education relative to her caste. Caste-based
voting is one of the most ubiquitous political phenomena in India, playing a prominent role in
national elections, state elections, and local elections.49
Banerjee and Pande (2009) develop a
model that shows how this kind of voting can lead to lower quality leaders being elected.
Although voters care about candidate quality, they also care whether the candidate belongs to
their ethnic group; thus, candidates from the majority ethnic group do not need to be as
competitive along quality dimensions as candidates from the minority ethnic group. The
numerical dominance of one caste and the strength of voter preference for same-caste leaders
lead to lower quality leaders being elected.50
It may be that caste-based voting helps less
educated candidates from the numerically-dominant caste group defeat more educated candidates
from minority groups.
Although there is limited evidence on voters’ perceived returns to having an educated sarpanch,
there is strong evidence that voters mis-value the returns to other candidate attributes. For
instance, Beaman et al (2009) show that male voters overvalue the impact that sarpanch gender
has on public service delivery: when asked to evaluate the hypothetical effectiveness of sarpanch
who were equivalent on all dimensions except for gender, male voters systematically judged
male sarpanch as more effective than female sarpanch.51
There is also evidence from other
contexts that households undervalue the returns from their own education to lifetime earnings.52
It is therefore reasonable to assume that voters, who mis-value the returns to other candidate
attributes and mis-value the returns to their own educational attainment, would also mis-value
49
Chandra (2004) 50
Banerjee and Pande (2009), p. 11 51
Beaman et al (2009), p. 4 52
Jensen 2010
26
the returns to a candidate’s education. Given the important policy implications such behavior
would have, additional evidence on this topic would be useful.
3. Demand-side factors: Voter knowledge about candidates
Voters may prefer educated candidates and correctly value the returns to having an educated
sarpanch, yet still fail to vote for educated candidates if they lack knowledge about specific
candidates’ attributes. This effect could be compounded by prospective candidates choosing not
to run: Caselli and Morelli (2004) show that even when voters care about candidate quality, if
they cannot accurately assess it, then higher-quality candidates do not enjoy an electoral
advantage and therefore may choose not to run.
This model may help to explain voter behavior in contexts where voters are less familiar with
candidates, such as in state-level races or national-level races. Empirical studies in several
countries have shown that voters respond to information given to them about their candidates,
shifting their vote from lower-quality to higher-quality candidates.53
For instance, Banerjee et al
(2011) printed report cards of candidates for the Delhi state legislature in 2008 in newspapers
and distributed them to a random selection of slums. The authors show that voters in treatment
slums had significantly more knowledge about their candidates, and that this translated into more
votes for better quality candidates.54
However, lack of information about candidates is unlikely to be a constraint in local elections, at
least to the extent that it is in state or national elections. Whereas state legislators in Delhi have
on average 240,000 constituents, the typical sarpanch in Rajasthan has only 5,600 constituents.55
In survey GPs in Rajasthan, 89.1% of respondents were able to correctly identify their sarpanch,
whereas only 68.2% of respondents in a survey in Uttar Pradesh were able to correctly identify
their state legislator. Moreover, sarpanch live and work in the GP that they represent, unlike state
legislators who live in the state capital and visit their constituency occasionally. 82.7% of survey
respondents in Uttar Pradesh stated that their sarpanch visits their village at least occasionally,
53
For example, see Ferraz and Finan (2008) for a natural experiment Brazil and Humphreys and Weinstein (2013)
for a randomized experiment in Uganda. 54
Banerjee et al (2011), Table 3 55
Population counts are from the 2011 Census and constituency counts are from each state’s Election Commission
website.
27
and 35.7% stated that their sarpanch visits their village daily. In contrast, 23.6% of respondents
stated that their state legislator visits their village occasionally, and only 0.3% stated that their
state legislator visits their village daily.
The next section will explore policy tools that the MoPR can use to address these factors and the
supply-side factors discussed in the previous section.
IV. Assessing policy options
The previous sections narrowed down the factors that are most likely to be contributing to the
high incidence of uneducated sarpanch to the following:
1. Educated villagers have few incentives to run, due to low pay, lack of career options, and
social norms that discourage most villagers from contesting. Educated villagers are also
less likely than uneducated villagers to be attracted by illicit gains.
2. Voters mis-value the returns to having an educated sarpanch.
3. The incidence of uneducated sarpanch is especially high in reserved GPs.
This diagnosis suggests that the MoPR should implement policies that focus on incentives for
educated candidates to run, voters’ perceived returns to having an educated sarpanch, and
additional administrative support for sarpanch in reserved GPs. Since the supply of educated
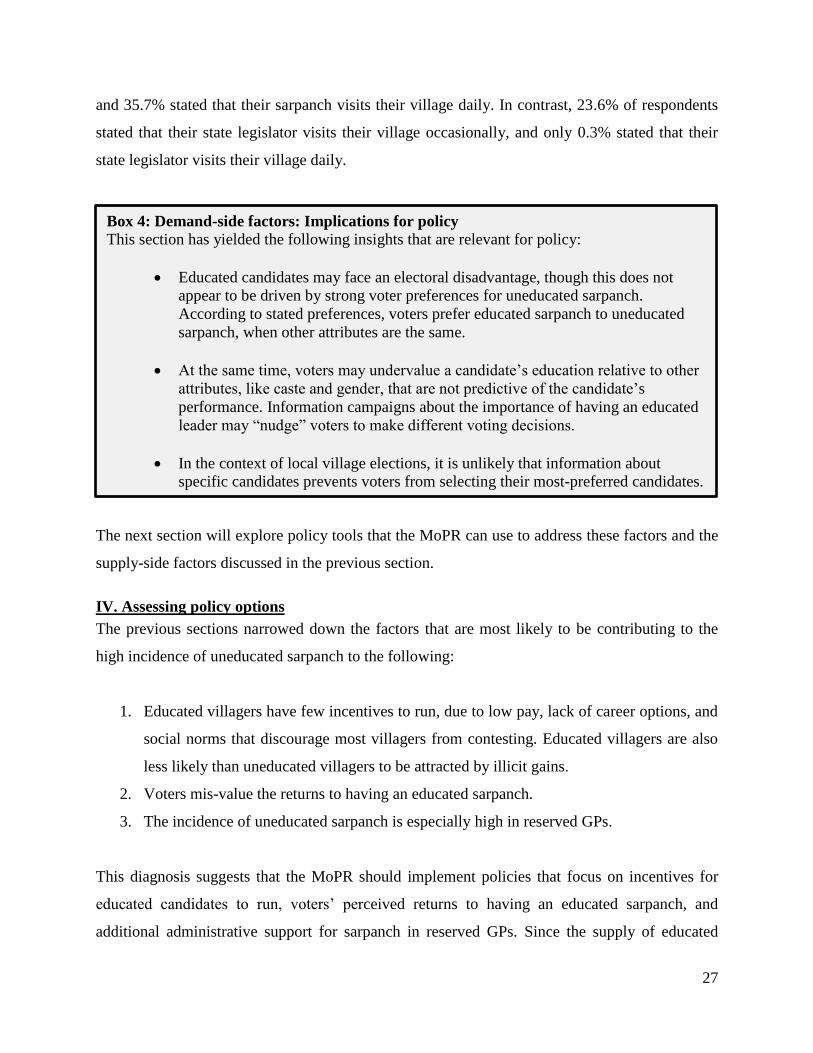
Box 4: Demand-side factors: Implications for policy
This section has yielded the following insights that are relevant for policy:
Educated candidates may face an electoral disadvantage, though this does not
appear to be driven by strong voter preferences for uneducated sarpanch.
According to stated preferences, voters prefer educated sarpanch to uneducated
sarpanch, when other attributes are the same.
At the same time, voters may undervalue a candidate’s education relative to other
attributes, like caste and gender, that are not predictive of the candidate’s
performance. Information campaigns about the importance of having an educated
leader may “nudge” voters to make different voting decisions.
In the context of local village elections, it is unlikely that information about
specific candidates prevents voters from selecting their most-preferred candidates.
28
candidates and the demand for educated sarpanch are dynamically linked, these policies may not
be as effective if they are implemented separately. For instance, incentivizing more educated
villagers to stand for election through higher pay may not immediately shift voter behavior,
which could undermine the impact of the intervention if the lack of voter response in the current
election discourages educated villagers from running in future elections. Or informing voters
about the importance of having educated leaders may not immediately affect the decisions of
educated villagers to contest, and by the time the next election comes, even if more educated
candidates are running, voters may have forgotten the awareness campaign. For these reasons, I
recommend that the MoPR pursue a multi-pronged strategy that addresses these dynamic
linkages and takes full advantage of the feedback loop between supply and demand.
In the following section, I discuss the policy tools that I believe should be a part of this strategy,
followed by a description of alternative policies that I considered but discarded for various
technical, political or administrative reasons. I conclude with guidelines for a coordinated
approach to implementing the recommended elements of this strategy.
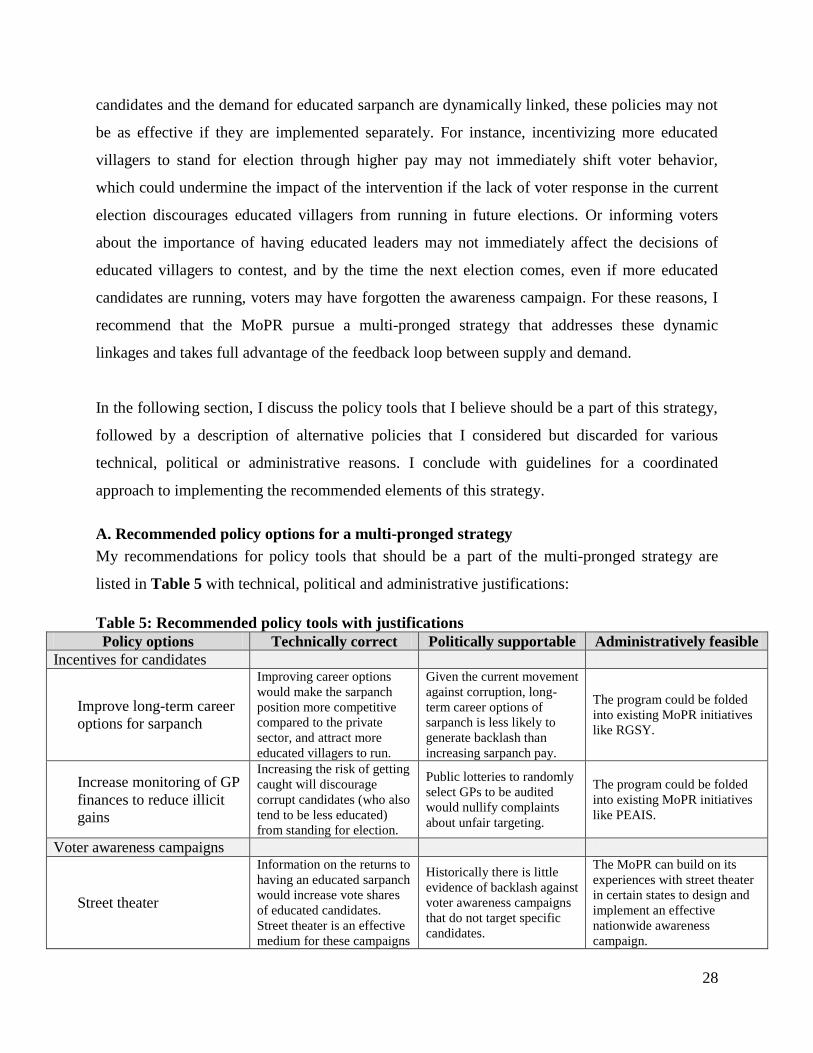
A. Recommended policy options for a multi-pronged strategy
My recommendations for policy tools that should be a part of the multi-pronged strategy are
listed in Table 5 with technical, political and administrative justifications:
Table 5: Recommended policy tools with justifications
Policy options Technically correct Politically supportable Administratively feasible
Incentives for candidates
Improve long-term career
options for sarpanch
Improving career options
would make the sarpanch
position more competitive
compared to the private
sector, and attract more
educated villagers to run.
Given the current movement
against corruption, long-
term career options of
sarpanch is less likely to
generate backlash than
increasing sarpanch pay.
The program could be folded
into existing MoPR initiatives
like RGSY.
Increase monitoring of GP
finances to reduce illicit
gains
Increasing the risk of getting
caught will discourage
corrupt candidates (who also
tend to be less educated)
from standing for election.
Public lotteries to randomly
select GPs to be audited
would nullify complaints
about unfair targeting.
The program could be folded
into existing MoPR initiatives
like PEAIS.
Voter awareness campaigns
Street theater
Information on the returns to
having an educated sarpanch
would increase vote shares
of educated candidates.
Street theater is an effective
medium for these campaigns
Historically there is little
evidence of backlash against
voter awareness campaigns
that do not target specific
candidates.
The MoPR can build on its
experiences with street theater
in certain states to design and
implement an effective
nationwide awareness
campaign.
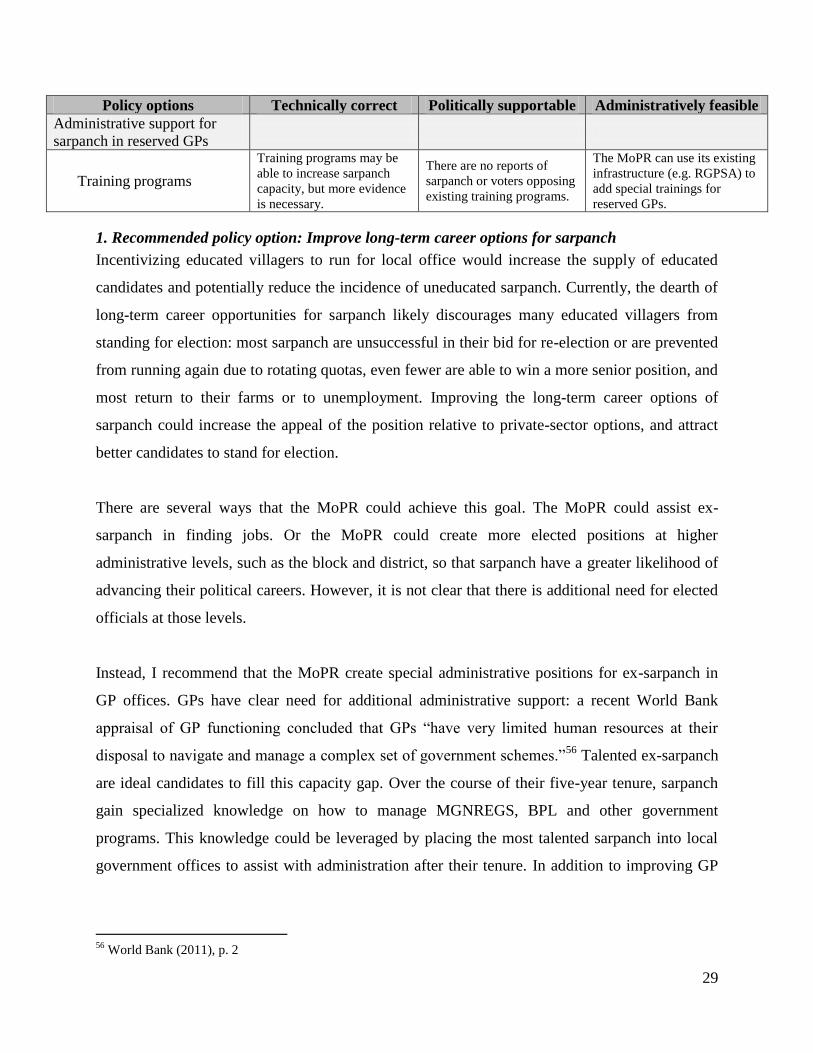
29
Policy options Technically correct Politically supportable Administratively feasible
Administrative support for
sarpanch in reserved GPs
Training programs
Training programs may be
able to increase sarpanch
capacity, but more evidence
is necessary.
There are no reports of
sarpanch or voters opposing
existing training programs.
The MoPR can use its existing
infrastructure (e.g. RGPSA) to
add special trainings for
reserved GPs.
1. Recommended policy option: Improve long-term career options for sarpanch
Incentivizing educated villagers to run for local office would increase the supply of educated
candidates and potentially reduce the incidence of uneducated sarpanch. Currently, the dearth of
long-term career opportunities for sarpanch likely discourages many educated villagers from
standing for election: most sarpanch are unsuccessful in their bid for re-election or are prevented
from running again due to rotating quotas, even fewer are able to win a more senior position, and
most return to their farms or to unemployment. Improving the long-term career options of
sarpanch could increase the appeal of the position relative to private-sector options, and attract
better candidates to stand for election.
There are several ways that the MoPR could achieve this goal. The MoPR could assist ex-
sarpanch in finding jobs. Or the MoPR could create more elected positions at higher
administrative levels, such as the block and district, so that sarpanch have a greater likelihood of
advancing their political careers. However, it is not clear that there is additional need for elected
officials at those levels.
Instead, I recommend that the MoPR create special administrative positions for ex-sarpanch in
GP offices. GPs have clear need for additional administrative support: a recent World Bank
appraisal of GP functioning concluded that GPs “have very limited human resources at their
disposal to navigate and manage a complex set of government schemes.”56
Talented ex-sarpanch
are ideal candidates to fill this capacity gap. Over the course of their five-year tenure, sarpanch
gain specialized knowledge on how to manage MGNREGS, BPL and other government
programs. This knowledge could be leveraged by placing the most talented sarpanch into local
government offices to assist with administration after their tenure. In addition to improving GP
56
World Bank (2011), p. 2
30
functioning, such a program would expand the opportunities available to the most talented
sarpanch, and potentially attract more educated villagers to run for local office.
2. Recommended policy option: Increased monitoring of GP finances
Monitoring may be an effective way for the MoPR to simultaneously reduce leakages in public
service delivery and improve the quality of elected leaders. Monitoring increases the risk of
getting caught siphoning off program benefits, like MGNREGS jobs or BPL cards, and therefore
increases the cost of corruption. Since Besley et al (2012) and Figure 3 suggest that uneducated
sarpanch are more likely than educated sarpanch to abuse their power in this way (or are more
susceptible to political capture), monitoring would discourage uneducated sarpanch from
contesting without affecting the decisions of educated sarpanch to run. Hence, the quality of the
candidate pool would increase, leading to better electoral outcomes.
In practice, the effectiveness of monitoring depends on several conditions. First, corrupt behavior
must be detectable. Second, corrupt behavior, once detected, must be punishable. Punishment
might include imprisonment or fines, though this will require legal precedents and an efficient
judiciary at the local level. A cheaper alternative may be to simply publicize the results of
monitoring and allow social sanctions or voters to punish corrupt behavior. Ferraz and Finan
(2008) show that voters in Brazil respond to revelations of corrupt behavior: corrupt mayors who
were randomly selected to be audited before municipal elections were 17% less likely to be re-
elected than corrupt mayors who were audited after elections.57
However, the effectiveness of
this channel depends on the incumbent’s prospects for re-election: Ferraz and Finan (2011b) find
that mayors serving in their first term (and thus eligible for re-election) steal 27% fewer
resources than mayors serving their second term (and thus ineligible to stand again) when
threatened with audits.58
Since many sarpanch are ineligible for re-election due to rotating
reservation, and those that are eligible face strong anti-incumbency bias, voter censure may be an
insufficient motivator to reduce corruption.
The effectiveness of monitoring also depends on the monitoring system being incorruptible.
Public monitoring systems in India have been undermined by failing to take into account the
57
Ferraz and Finan (2008), p. 705 58
Ferraz and Finan (2011b), p. 1274
31
incentives of the monitors, as with pollution audits in Gujarat, or by the monitored finding ways
around the system, as with nurse attendance in Rajasthan.59
It may be difficult for the MoPR to
guarantee the integrity of a monitoring system that spans all GPs. It may be more feasible for the
MoPR to only audit a subset of GPs, selected based on red flags in administrative records. Or the
MoPR could randomly select GPs to receive audits; if every GP has an equal likelihood of
selection, and if that likelihood is not insignificant, then random audits may be almost as
effective as comprehensive monitoring and far less costly to implement.
3. Recommended policy option: Voter awareness campaigns via street theater
Increasing voters’ perceived returns to having an educated sarpanch would increase the demand
for educated candidates and encourage more educated villagers to run for the position. The
challenge is for the MoPR to determine the appropriate media for awareness campaigns.
Fortunately, there is a large body of evidence on the impact of different types of awareness
campaigns in India.
Street theater is often used by government departments and NGOs to raise awareness about
important issues in India, such as early marriage, voter turnout, and violence against women.60
As one advertising executive says, “[Street theater] is cheap and effective, and nothing hits like a
visual medium.”61
It may be the most effective medium for the MoPR to raise awareness about
the importance of having an educated sarpanch.
Recent studies have shown that information conveyed through live street entertainment can shift
the behavior of rural Indian voters. Banerjee et al (2012) evaluate the impact of an awareness
campaign in Uttar Pradesh involving public meetings and puppet shows that discussed the
importance of voting based on development issues rather than caste. Voters in GPs that received
the awareness campaign were 6.5% less likely to vote for their caste-preferred party, and low-
caste voters were 12.0% less likely to vote for their caste-preferred party.62
Banerjee et al (2013)
evaluate the impact of an awareness campaign in Rajasthan involving street plays that discussed
59
Duflo et al (2013), Banerjee et al (2008) 60
The Guardian (2009), URL; Dawn News (2012), URL; Kickstarter.com (2013), URL 61
Chicago Tribune (2012), URL 62
Banerjee et al (2012), Table 7a
32
the sarpanch’s responsibilities in delivering public services. In GPs that received the awareness
campaign, worse-performing incumbents were less likely to stand for re-election.63
Crucially, this awareness campaign also encouraged more educated villagers to stand for election
and win: treatment GPs had on average one more literate candidate than control GPs,64
and
literate candidates in treatment GPs received on average 11.5% more share of the votes and were
14.1% more likely to win than literate candidates in control GPs.65
This evidence suggests that
giving voters information about the importance of selecting capable leaders can be an effective
way to reduce the incidence of uneducated sarpanch, and that street theater is one effective
medium for delivering that information. There is also clear political will for this kind of
intervention, since the MoPR recently stated that, “Special focus will be given to organize puppet
shows and street plays” to spread awareness.66
4. Recommended policy option: Training programs for sarpanch in reserved GPs
The policy options already discussed can be effective ways to reduce the incidence of
uneducated sarpanch in all GPs. However, given the lower rates of educational attainment among
minority groups, additional policy instruments may be critical to ensuring that the MoPR also
increases the capacity of sarpanch in reserved GPs.
Special training programs for newly-elected sarpanch may be one way to achieve this goal. Most
GP leaders already attend training sessions: in Bihar, for instance, sarpanch currently attend on
average 3 training programs for a total of 5 days.67
However, the groups that could potentially
benefit the most from training are the least likely to take it up: upper caste sarpanch get on
average 6.0 days of traning versus 2.2 days for the lowest castes, and men get on average 6.8
days of training versus 3.8 days for women.68
This suggests that there is an important gap that
the MoPR could fill in training sarpanch in reserved GPs. There is clear political will for such an
initiative: the recently-released Fifteenth Anniversary Charter on Panchayati Raj states that
63
Banerjee et al (2013), p. 1 64
ibid, p. 17 65
ibid, p. 30 66
Media and Publicity Scheme Guidelines, MoPR, URL 67
Ghosh et al (2010), Table 4.16 68
ibid.
33
“There must be specialized training programs for different groups, such as women, SC/ST (low
castes) and young representatives.”69
B. Alternative policy options not recommended at this time
In the previous section I recommended four policy tools that the MoPR could incorporate into a
multi-pronged strategy. In this section, I discuss alternative tools that policymakers sometimes
use to achieve similar goals in other contexts that I do not recommend at this time for various
technical, political and administrative reasons.
1. Alternative policy option: Increase sarpanch pay
One policy option that could incentivize more educated villagers to run for election is to increase
sarpanch pay, which is extremely low (Table 4). Evidence on the impact of increasing sarpanch
pay in India is limited,70
though evidence from other contexts shows that increasing politician
pay is only marginally effective in attracting better candidates. Ferraz and Finan (2011a) find
that a 20% increase in wages for councilors in Brazil leads to an increase of 0.2 years of
schooling for the average candidate.71
Kotakorpi and Poutvaara (2011) find that a 35% increase
in wages for members of parliament in Finland has no effect on the average education level of
male MPs, and only a small positive effect on the average education level of female MPs.72
Moreover, it may be difficult for the MoPR to justify pay raises for politicians in the current
political climate. Anna Hazare and others have led massive protests in recent years against
corruption. The impressive performance of the Aam Aadmi Party, an offshoot of Hazare’s
movement, in last year’s elections in Delhi demonstrates the popular appeal of the movement.
Given this political climate, the MoPR might face substantial resistance to politician pay raises.
2. Alternative policy option: Minimum qualifications for candidate eligibility
Minimum educational qualifications for prospective candidates would ensure that every GP has
an educated sarpanch. Eligibility restrictions have a long precedent in the panchayat system, and
69
Fifteenth Anniversary Charter on Panchayati Raj (2013), part 5.3.4 70
Since state governments change sarpanch pay for all GPs in their states at the same time, there is a lack of within-
state heterogeneity that would enable researchers to identify the causal impact of pay raises. Since very few states
publish sarpanch education data, it is also not possible to do a differences-in-differences analysis of the change in
sarpanch quality when one state changes pay and another does not. 71
Ferraz and Finan (2011a), p. 2 72
Kotakorpi and Poutvaara (2011), p. 883
34
rotating gender and caste quotas cover up to ¾ of GPs in some places. Some states have imposed
additional eligibility criteria. In Bihar, as of last year, candidates must have a toilet in order to
contest in sarpanch elections.73
However, minimum educational qualifications are not politically saleable. This is evident in that
several states, including Andhra Pradesh and Uttar Pradesh,74
have wanted to implement them
but could not get legislative approval. The primary concern is that minimum qualifications would
systematically exclude certain groups. Moreover, since educational qualifications are difficult to
verify, local elites could manipulate the rules to exclude their opponents. This has happened with
other eligibility criteria: in Gujarat, upper caste male candidates use the rule that a candidate can
have no more than two children to disqualify many of their female and low caste challengers.75
Hence, minimum educational qualifications would undermine the MoPR’s objective to increase
representation of women and minorities in local governments.76
3. Alternative policy option: Voter awareness campaigns via other media
Printed materials like pamphlets or posters might be an effective medium in urban areas, where
literacy rates are high and population density enables one distributor to cover many households
in a short length of time. However, printed materials without other forms of media (like street
theater) may be less effective in rural areas, where only 43.1% of adults can read a 2nd
grade text
(Table 2), and where villages are remote and houses are spread out. Similarly, lack of access to
electronic media may undermine a television and radio campaigns in rural India: in the Rajasthan
sample, for instance, only 22.3% of respondents have a television and 6.4% have a radio.
V. Implementation guidelines for a multi-pronged strategy
The previous section described potential policy tools for a multi-pronged strategy to address the
high incidence of uneducated sarpanch. The four recommended policy tools – career incentives
for sarpanch, increased monitoring of GP finances, voter awareness campaigns, and special
training program for sarpanch in reserved GPs – would address the key factors that are most
73
Times of India (2013), URL 74
The Hindu (2005), URL; The Indian Express (2010), URL 75
The Indian Express (2012), URL 76
73rd
Amendment to the Constitution of India (1992), URL
35
likely to be driving the policy problem. The interventions would interact to take full advantage
of, rather than be negated by, feedback loops between candidate and voter behavior.
This section presents broad guidelines for implementing this strategy. First I identify
stakeholders within the MoPR to coordinate the interventions. After that, I discuss important
steps to ensure maximum efficacy, including process pilots, impact evaluations, and iterative
experimentation of policy options. I conclude with a high-level budget, with options for cost-
sharing, for two possible scale-up scenarios: a universal scenario in which the strategy is
implemented in all GPs in North India, and a targeted scenario in which the strategy is only
implemented in high-priority GPs.
A. Implementation stakeholders
An organizational chart from the MoPR’s website is provided in Appendix 10.77
I have outlined
in red the ideal department for coordinating the recommended interventions: the Department for
Panchayat Capacity Building under the Joint Secretary for Policy Matters. This department’s
mandate includes implementing programs for training sarpanch, providing GP offices with
administrative support, and improving GP facilities. The recommended interventions in this
policy analysis could be cost-effectively integrated into these programs and take advantage of
their existing infrastructure, including regional offices and pools of experienced facilitators.
In particular, the Rashtriya Gram Swaraj Yojana (RGSY), the Panchayat Empowerment and
Accountability Incentive Scheme (PEAIS), and the Rajiv Gandhi Panchayat Sashaktikaran
Abhiyan (RGPSA) under the Department for Panchayat Capacity Building are ideal vehicles for
the proposed interventions. RGSY is responsible for providing GP offices with staff to assist
sarpanch,78
and so the program is in a unique position to create new administrative positions in
GP offices for talented former sarpanch. RGSY is also responsible for training newly elected
leaders,79
and so special training sessions for sarpanch in reserved GPs could be easily integrated
into its existing infrastructure. PEAIS is responsible for ensuring that GPs have transparent
77
Ministry of Panchayati Raj (2014), URL 78
RGSY Guidelines (2008), p. 2 79
ibid.
36
administrative systems,80
and could be expanded to accommodate additional monitoring of GP
finances. Finally, one of RGPSA’s core activities is voter awareness, and so the program has
access to a network of local NGOs that could be used to implement additional voter awareness
campaigns about the returns to having an educated sarpanch.81
One risk associated with implementing a multi-pronged strategy across different programs, even
within the same department, is lack of coordination between interventions. Since the success of
this strategy relies on the interaction of its individual elements, it will be important to ensure that
all interventions are being executed simultaneously and with similar effort. To do this, I
recommend that the MoPR form a task-force under the Joint Secretary to facilitate coordination
of interventions across programs.
B. Testing and refining interventions
1. Strengthening policy design through process pilots
While the recommended interventions are supported by technical, political and administrative
analysis, the MoPR should test and refine these ideas before scaling them nationwide. This
process will help the MoPR to strengthen the design of each intervention and ensure that
resources are not wasted on activities that are ineffective. The first step in this process is to draft
an implementation plan that addresses specific design issues: who will be involved in each step
of the process, where activities will take place, how funds will flow between administrative
levels, etc. This step will help to identify problem areas that could affect implementation. Next,
the designs should be piloted in a small number of GPs. At this stage, the purpose is not to assess
impact, but to detect and correct logistical issues that were not anticipated in design. These pilots
do not need to be conducted at a large scale, but they should be conducted in a variety of settings
(well-functioning and poor-functioning GPs, different states) to identify hurdles that may occur
in different areas. It is also important that the program responsible for scale-up conduct these
pilots, since internal processes may differ across programs.
80
PEAIS Guidelines (2005), p. 1 81
RGPSA Guidelines (2013), p. 17
37
2. Measuring anticipated effects with impact evaluations
After refining the interventions based on the process pilots, the MoPR should pilot the
interventions at a larger scale and conduct impact evaluations to test their efficacy. Researchers
from local universities or consulting firms can help the MoPR think through the designs of these
evaluations. This stage will help the MoPR to predict the likely impact of the interventions, and
determine which should be scaled-up and which should be refined further.
Ideally, the MoPR would identify a set of GPs in which to test these interventions (the number of
GPs depends on the number of interventions being tested and other factors), then use a computer
program to randomly select some of those GPs to receive the interventions (“treatment” GPs)
and some of those GPs to not receive the interventions (“control” GPs). This process helps to
mitigate the influence of other factors on differences in outcomes between treatment and control
GPs, so that any observed differences can be more confidently attributed to the interventions.
Where this is not possible, researchers can help to identify other appropriate designs. For any
design, the MoPR should be aware of what kinds of questions can and cannot be answered in
order to avoid spurious conclusions that could lead to ineffective programs being scaled-up.
Since there likely are feedback loops between supply and demand factors, the effects of the
recommended interventions are unlikely to be additive. It would be useful for the MoPR to test
different combinations of interventions in different places, in order to estimate the value added of
each element to the overall strategy. This would increase the number of GPs necessary for the
impact evaluation pilots, but the additional evidence generated from these pilots would be
valuable in crafting an effective scale-up plan.
The key outcome of interest is the proportion of GPs with educated sarpanch. However, this is a
long-run indicator that may not vary in the short-term (particularly if there are not elections
immediately following the pilots), and so there are intermediate indicators that the MoPR should
also use to gauge the success of pilots. Some of these indicators are listed in Table 6:
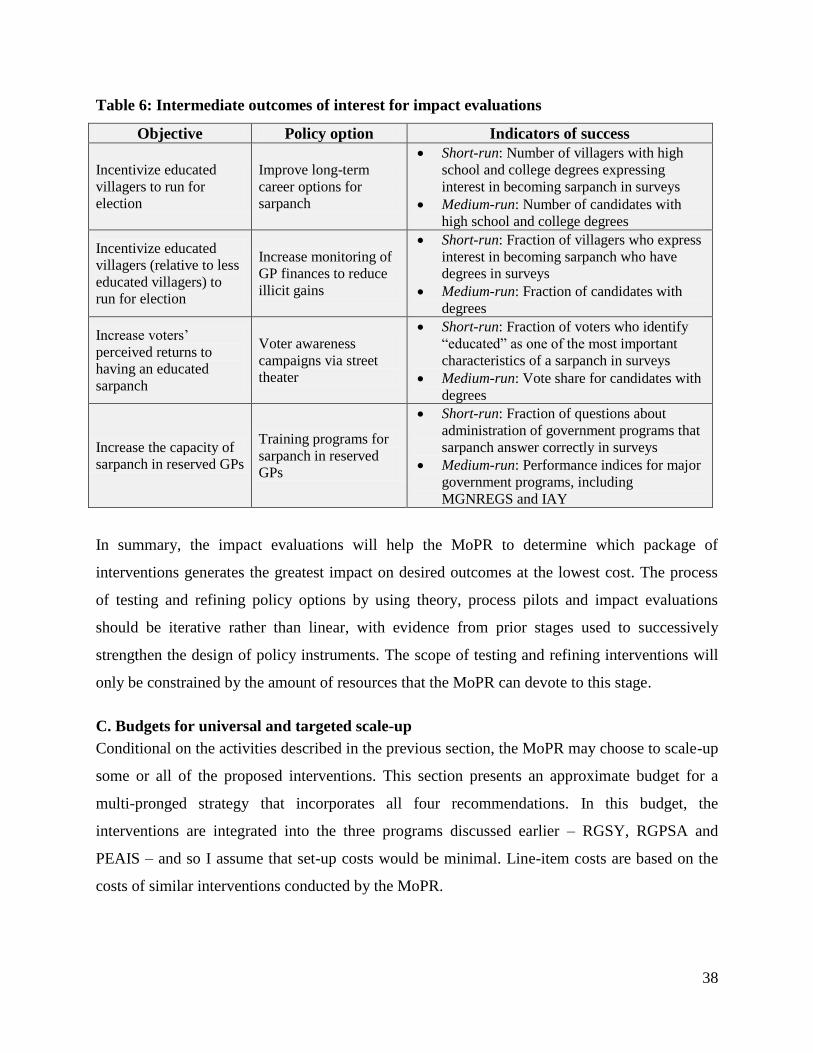
38
Table 6: Intermediate outcomes of interest for impact evaluations
Objective Policy option Indicators of success
Incentivize educated
villagers to run for
election
Improve long-term
career options for
sarpanch
Short-run: Number of villagers with high
school and college degrees expressing
interest in becoming sarpanch in surveys
Medium-run: Number of candidates with
high school and college degrees
Incentivize educated
villagers (relative to less
educated villagers) to
run for election
Increase monitoring of
GP finances to reduce
illicit gains
Short-run: Fraction of villagers who express
interest in becoming sarpanch who have
degrees in surveys
Medium-run: Fraction of candidates with
degrees
Increase voters’
perceived returns to
having an educated
sarpanch
Voter awareness
campaigns via street
theater
Short-run: Fraction of voters who identify
“educated” as one of the most important
characteristics of a sarpanch in surveys
Medium-run: Vote share for candidates with
degrees
Increase the capacity of
sarpanch in reserved GPs
Training programs for
sarpanch in reserved
GPs
Short-run: Fraction of questions about
administration of government programs that
sarpanch answer correctly in surveys
Medium-run: Performance indices for major
government programs, including
MGNREGS and IAY
In summary, the impact evaluations will help the MoPR to determine which package of
interventions generates the greatest impact on desired outcomes at the lowest cost. The process
of testing and refining policy options by using theory, process pilots and impact evaluations
should be iterative rather than linear, with evidence from prior stages used to successively
strengthen the design of policy instruments. The scope of testing and refining interventions will
only be constrained by the amount of resources that the MoPR can devote to this stage.
C. Budgets for universal and targeted scale-up
Conditional on the activities described in the previous section, the MoPR may choose to scale-up
some or all of the proposed interventions. This section presents an approximate budget for a
multi-pronged strategy that incorporates all four recommendations. In this budget, the
interventions are integrated into the three programs discussed earlier – RGSY, RGPSA and
PEAIS – and so I assume that set-up costs would be minimal. Line-item costs are based on the
costs of similar interventions conducted by the MoPR.
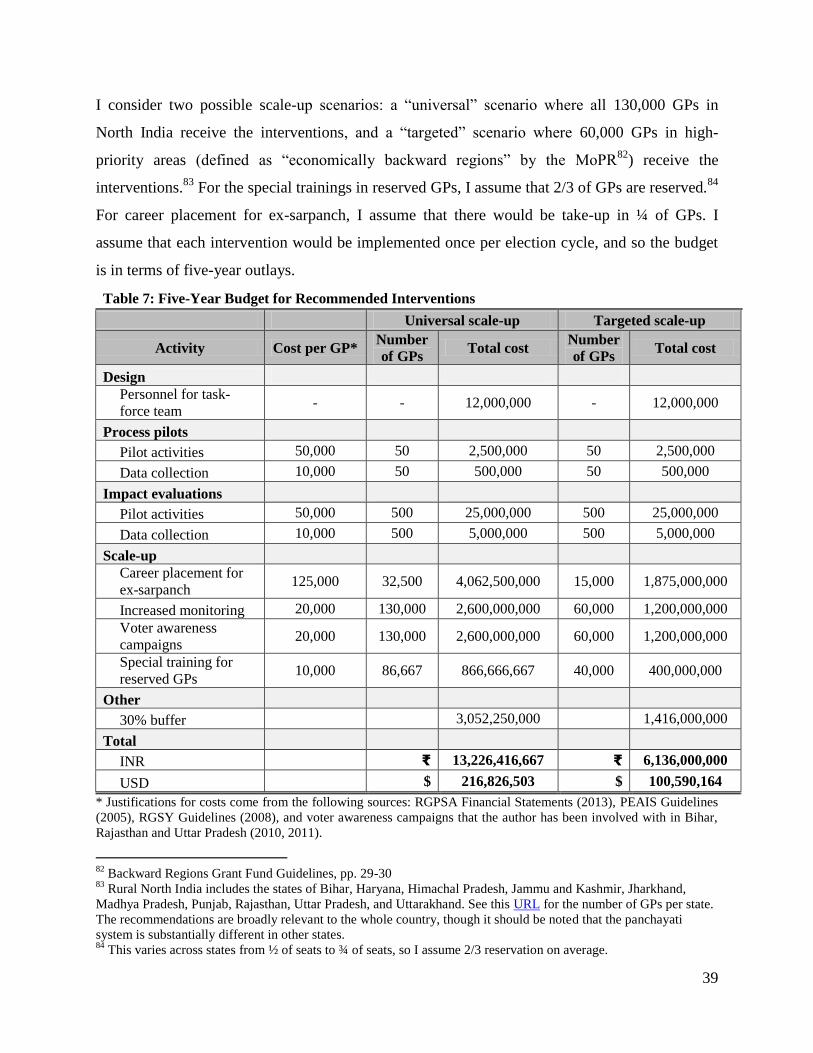
39
I consider two possible scale-up scenarios: a “universal” scenario where all 130,000 GPs in
North India receive the interventions, and a “targeted” scenario where 60,000 GPs in high-
priority areas (defined as “economically backward regions” by the MoPR82
) receive the
interventions.83
For the special trainings in reserved GPs, I assume that 2/3 of GPs are reserved.84
For career placement for ex-sarpanch, I assume that there would be take-up in ¼ of GPs. I
assume that each intervention would be implemented once per election cycle, and so the budget
is in terms of five-year outlays.
Table 7: Five-Year Budget for Recommended Interventions
Universal scale-up Targeted scale-up
Activity Cost per GP* Number
of GPs Total cost
Number
of GPs Total cost
Design
Personnel for task-
force team - - 12,000,000 - 12,000,000
Process pilots Pilot activities 50,000 50 2,500,000 50 2,500,000
Data collection 10,000 50 500,000 50 500,000
Impact evaluations Pilot activities 50,000 500 25,000,000 500 25,000,000
Data collection 10,000 500 5,000,000 500 5,000,000
Scale-up Career placement for
ex-sarpanch 125,000 32,500 4,062,500,000 15,000 1,875,000,000
Increased monitoring 20,000 130,000 2,600,000,000 60,000 1,200,000,000
Voter awareness
campaigns 20,000 130,000 2,600,000,000 60,000 1,200,000,000
Special training for
reserved GPs 10,000 86,667 866,666,667 40,000 400,000,000
Other 30% buffer
3,052,250,000
1,416,000,000
Total INR
₹ 13,226,416,667 ₹ 6,136,000,000
USD $ 216,826,503 $ 100,590,164
* Justifications for costs come from the following sources: RGPSA Financial Statements (2013), PEAIS Guidelines
(2005), RGSY Guidelines (2008), and voter awareness campaigns that the author has been involved with in Bihar,
Rajasthan and Uttar Pradesh (2010, 2011).
82
Backward Regions Grant Fund Guidelines, pp. 29-30 83
Rural North India includes the states of Bihar, Haryana, Himachal Pradesh, Jammu and Kashmir, Jharkhand,
Madhya Pradesh, Punjab, Rajasthan, Uttar Pradesh, and Uttarakhand. See this URL for the number of GPs per state.
The recommendations are broadly relevant to the whole country, though it should be noted that the panchayati
system is substantially different in other states. 84
This varies across states from ½ of seats to ¾ of seats, so I assume 2/3 reservation on average.
40
Universal scale-up would cost approximately $216 million, or $43 million per year, while
targeted scale-up would cost approximately $100 million, or $20 million per year. In
comparison, the annual budget of the MoPR in 2012 was $877 million.85
The universal scenario
represents a 4.9% increase in the annual budget, while the targeted scenario represents a 2.3%
increase in the annual budget.
Although these interventions do not require a large percentage increase in the MoPR’s budget,
cost-sharing arrangements are possible. For example, the World Bank has recently partnered
with the MoPR’s Bihar department to implement the Bihar Panchayat Strengthening Project, for
which the World Bank is providing $84 million.86
The MoPR may be able to leverage existing
relationships with donors like the World Bank to obtain additional funding for new interventions
VI. Conclusion
Sarpanch play a key role in managing government programs, and the lack of adequate
educational qualifications has resulted in sub-standard public service delivery, particularly in the
poorest GPs. This policy analysis uses a dynamic supply-and-demand framework to identify
three interconnected factors that are most likely driving the high incidence of uneducated
sarpanch: a lack of incentives for educated villagers to contest elections, especially due to few
career options and social norms; voters undervaluing the returns to having an educated sarpanch;
and low educational attainment of minority groups in GPs with gender or caste quotas. Based on
this diagnosis, I recommend a multi-pronged strategy that takes full advantage of feedback loops
between candidate and voter behavior. I show that the four recommended policy interventions
would require a 4.9% increase in the MoPR’s annual budget for universal scale-up, or a 2.3%
increase for a targeted scale-up in high-priority GPs.
85
MoPR Annual Budget (2013) 86
World Bank (2014)
41
VII. References
Acemoglu, Daron and James Robinson (2008). Persistence of Power, Elites, and Institutions.
American Economic Review 98(1): 267-293.
Banerjee, Abhijit and Rohini Pande (2009). Parochial Politics: Ethnic Preferences and Politician
Corruption. Faculty Research Working Paper Series, Harvard Kennedy School
Banerjee, Abhijit, Donald Green and Rohini Pande (2012). Can Voters be Primed to Choose
Better Legislators? Experimental Evidence from Rural India. MIT Working Paper.
Banerjee, Abhijit, Esther Duflo, Clement Imbert and Rohini Pande (2013). Entry, Exit and
Candidate Selection: Evidence from India. 3ie Draft Grantee Final Report.
Banerjee, Abhijit, Esther Duflo and Rachel Glennerster (2008). Putting a Band-Aid on a Corpse:
Incentives for Nurses in the Indian Public Health Care System. Journal of the European
Economic Association 6(2-3): 487-500
Banerjee, Abhijit, Selvan Kumar, Rohini Pande and Felix Su (2011). Do Informed Voters Make
Better Choices? Experimental Evidence from Urban India. Working paper, MIT
Beaman, Lori, Esther Duflo, Rohini Pande and Petia Topalova (2011). Political Reservation and
Substantive Representation: Evidence from Indian Village Councils. India Policy
Forum, Brookings and NCAER, forthcoming
Beaman, Lori, Raghabendra Chattopadhyay, Esther Duflo, Rohini Pande and Petia Topalova
(2009). Powerful Women: Does Exposure Reduce Bias?. The Quarterly Journal of
Economics 124(4): 1497-1540
Besley, Timothy and Stephen Coate (1997). An Economic Model of Representative Democracy.
The Quarterly Journal of Economics 112(1): 85-114.
Besley, Timothy, Jose G. Montalvo and Marta Reynal-Querol (2011). Do Educated Leaders
Matter? The Economic Journal 121(554): 205-227
Besley, Timothy, Rohini Pande and Vijayendra Rao (2012). Just Rewards? Local Politics and
Public Resource Allocation in South India. World Bank Economic Review 26(2): 191-
216.
Bhavnani, Rikhil R. (2009). Do Electoral Quotas Work after They Are Withdrawn? Evidence
from a Natural Experiment in India. American Political Science Review 103(1): 23-35
The Bihar Times (2013). Bihar cabinet doubles allowance for local body representatives.
<http://www.bihartimes.in/Newsbihar/2013/June/newsbihar06June3.html>
42
Census of India (2011). Primary Census Abstract,
<http://www.censusindia.gov.in/pca/default.aspx>
Census of India (2011). Village-level data. <http://journeyman-data.com/census2011/>
Chandra, Kanchan (2004). Why Ethnic Parties Succeed: Patronage and Ethnic Headcounts in
India. Cambridge: Cambridge University Press.
Chattopadhyay, Raghabendra and Esther Duflo (2004). Women as Policy Makers: Evidence
from a Randomized Policy Experiment in India. Econometrica 72(5): 1409-1443
The Chicago Tribune (2012). Indian street plays tackle topics from rape to drinking.
<http://articles.chicagotribune.com/2012-04-23/news/sns-rt-india-play-pixl3e8fd8dc-
20120423_1_indian-street-street-theatre-new-delhi>
Constitution of India, 73rd
Amendment (1992).
<http://indiacode.nic.in/coiweb/amend/amend73.htm>
Dawn.com (2012). Street theater – where India communicates with society.
<http://www.dawn.com/news/713077/street-theatre-where-india-communicates-with-
society>
Day & Night News (2011). Honorarium of sarpanches doubled in Punjab.
<http://www.dayandnightnews.com/2011/09/honorarium-of-sarpanches-doubled-in-
punjab/>
DownToEarth.org (2013). Millionaire mukhiyas.
<http://www.downtoearth.org.in/content/millionaire-mukhiyas>
Duflo, Esther, Michael Greenstone, Rohini Pande and Nicholas Ryan (2013). Truth Telling by
Third-Party Auditors and the Response of Polluting Firms: Experimental Evidence from
India. The Quarterly Journal of Economics 128(4) : 1499-1545.
Farquharson, Robin (1969). Theory of Voting. Blackwell Publishers: Yale.
Ferraz, Claudio and Frederico Finan (2008). Exposing Corrupt Politicians: The Effects of
Brazil's Publicly Released Audits on Electoral Outcomes. The Quarterly Journal of
Economics 123(2): 703-745
Ferraz, Claudio and Frederico Finan (2011a). Motivating Politicians: The Impacts of Monetary
Incentives on Quality and Performance. Working Paper, PUC-Rio
Ferraz, Claudio and Frederico Finan (2011b). Electoral Accountability and Corruption: Evidence
from the Audits of Local Governments. American Economic Review 101(4): 1274-1311.
43
Finance Department of Rajasthan (2006). Revision of Pay Scales.
<http://finance.rajasthan.gov.in/spc.shtm>
Ghosh, Prabhat P and Shaibal Gupta (2009). Political and Socio-Economic Background of PRI
in Bihar. Prepared for the World Bank, Contact No 7151056
Ghosh, Prabhat P, Shaibal Gupta and Mark Rider (2010). Report on the Bihar PRI Finance
Study. Center for Economic Policy and Public Finance, ADRI, Contract No 7149024
Government of Bihar (2006). The Bihar Panchayat Raj Act.
Government of India (2008). Fifteenth Anniversary Charter of Panchayati Raj.
Government of Rajasthan (1994). The Rajasthan Panchayati Raj Act.
The Guardian (2009). Street theater brings hope for Indian women.
<http://www.theguardian.com/world/2009/jul/31/india-theatre>
Hanna, Rema and Shing-Yi Wang (2013). Dishonesty and Selection into Public Service. NBER
Working Paper Series, No. 19649.
The Hindu (2005). State moots minimum qualifications for sarpanches.
<http://www.hindu.com/2005/11/11/stories/2005111111890400.htm>
The Hindu (2012). Guaranteed to be effective. <http://www.thehindu.com/todays-paper/tp-
national/tp-karnataka/guaranteed-to-be-effective/article3369029.ece>
The Indian Express (2010). Wanted: Educated gram pradhan with no criminal past.
<http://archive.indianexpress.com/news/wanted-educated-gram-pradhan-with-no-
criminal-past/596892/>
The Indian Express (2012). 2-child norm helping to settle political scores: Study.
<http://archive.indianexpress.com/news/2child-norm-helping-to-settle-political-scores-
study/934388/>
The Indian Express (2014). Interview with Pranab Bardhan.
<http://indianexpress.com/article/opinion/columns/even-if-everyone-is-immoral-there-
are-ways-of-reducing-corruption-by-changing-institutional-rules/99/>
Jensen, Robert (2010). The (Perceived) Return to Education and the Demand for Schooling. The
Quarterly Journal of Economics 125(2): 515-548.
Jones, Benjamin F. and Benjamin A. Olken (2005). Do Leaders Matter? National Leadership and
Growth Since World War II. The Quarterly Journal of Economics 120(3): 835-864
44
Kickstarter.com (2013). Nirbhaya – Breaking the silence about violence against women.
<https://www.kickstarter.com/projects/nirbhaya/nirbhaya-award-winning-human-rights-
theatre-india>
Kotakorpi, Kaisa and Panu Poutvaara (2011). Pay for Politicians and Candidate Selection: An
Empirical Analysis. Journal of Public Economics 95(7-8): 877-885
Lee, David (2001). The Electoral Advantage to Incumbency and Voter’s Valuation of
Politicians’ Experience: A Regression Discontinuity Analysis of Elections to the U.S.
House. NBER Working Paper Series, No. 8441.
Mahatma Gandhi National Rural Employmentn Guarantee Scheme (MGNREGS) Website,
accessed January 2014, <http://nrega.nic.in/netnrega/home.aspx>
Ministry of Finance (2009). Thirteenth Finance Commission Report, 2010-2015.
Ministry of Panchayati Raj website, <http://www.panchayat.gov.in/>, accessed January-March
2014, including the following sub-pages:
“Annual Budget, 2012-2013”
“AR&RS Program”
“BRGF Guidelines”
“Engagement of Consultants”
“Media and Publicity Scheme Guidelines”
“PEAIS Guidelines”
“RGPSA Guidelines”
“RGSY Guidelines”
“Vision and Mission”
Myerson, Roger (2010). Toward a theory of leadership and state building. Proceedings of the
National Academy of Sciences of the United States of America 108(5): 21297-21301.
Novosad, Paul and Sam Asher (2012). Politics and Local Economic Growth: Evidence from
India. Harvard, Job Market Paper
Pagalguy.com (2012). MBA sarpanch chucks corporate job to become head of one of the most
backward villages in India. <http://www.pagalguy.com/news/mba-sarpanch-chucks-
corporate-job-become-head-one-a-8796786/>
Pande, Rohini (2003). Can Mandated Political Representation Increase Policy Influence for
Disadvantaged Minorities? Theory and Evidence from India. The American Economic
Review 93(4): 1132-1151
Planning Commission of India (2013). Press Note on Poverty Estimates, 2011-2012.
<http://planningcommission.nic.in/news/pre_pov2307.pdf>
45
Sharma, O.P. and Carl Haub (2008). Examining Literacy Using India’s Census. Population
Reference Bureau,
<http://www.prb.org/Publications/Articles/2008/censusliteracyindia.aspx>
State Election Commission Websites, accessed January 2014, including:
Jharkhand SEC, <http://www.jharkhand.gov.in/New_Depts/sec/sec_fr.html>
Rajasthan SEC, <http://www.rajsec.rajasthan.gov.in/>
Uttar Pradesh SEC, < http://sec.up.nic.in/electionanalysis.aspx >
West Bengal SEC, <http://www.wbsec.gov.in/>
The Times of India (2013). No toilet? Can’t contest Bihar local body polls, Nitish Kumar says.
<http://articles.timesofindia.indiatimes.com/2013-11-20/india/44283759_1_toilets-nitish-
kumar-nirmal-bharat-abhiyan>
World Bank (2004). India: Fiscal Decentralization to Rural Governments. Rural Development
Unit, South Asia Region, Report No. 26654-IN. January 7, 2004.
World Bank (2011). Project Information Document, Appraisal Stage for the Bihar Panchayat
Strengthening Project. Report No. AB6127.
World Bank (2014). Bihar Panchayat Strengthening Project. Project Website:
<http://www.worldbank.org/projects/P102627/india-bihar-panchayat-strengthening-
project?lang=en>
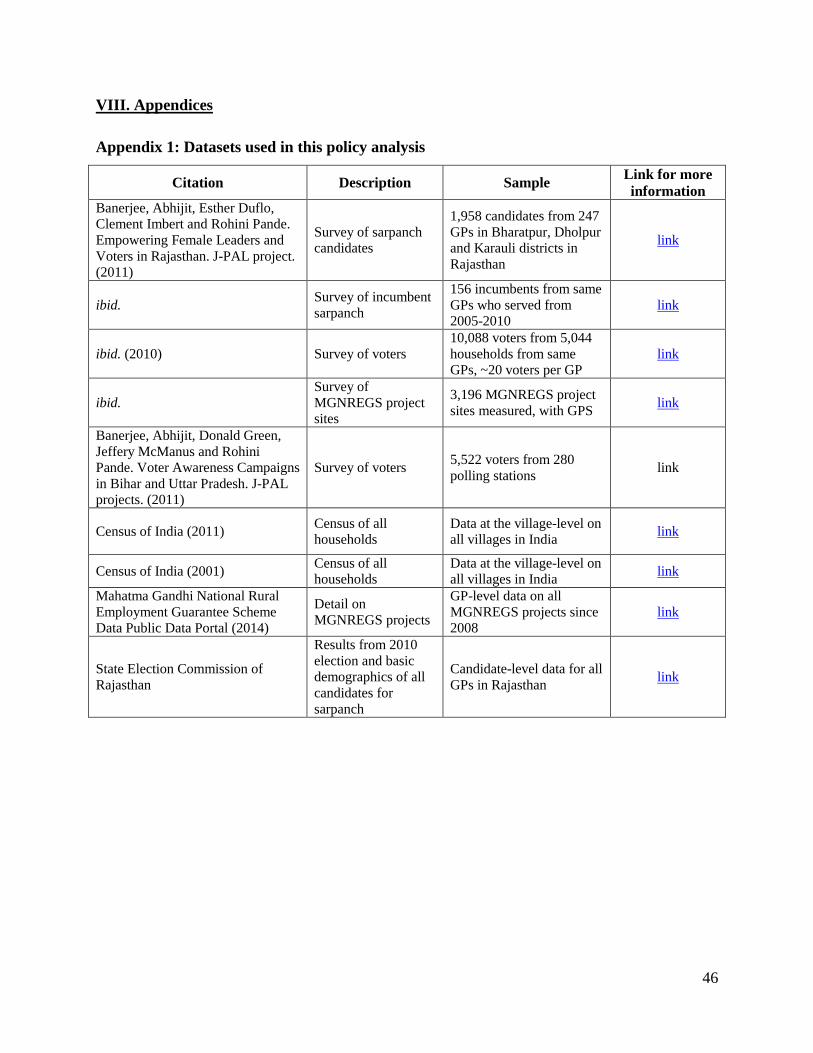
46
VIII. Appendices
Appendix 1: Datasets used in this policy analysis
Citation Description Sample Link for more
information
Banerjee, Abhijit, Esther Duflo,
Clement Imbert and Rohini Pande.
Empowering Female Leaders and
Voters in Rajasthan. J-PAL project.
(2011)
Survey of sarpanch
candidates
1,958 candidates from 247
GPs in Bharatpur, Dholpur
and Karauli districts in
Rajasthan
link
ibid. Survey of incumbent
sarpanch
156 incumbents from same
GPs who served from
2005-2010
link
ibid. (2010) Survey of voters
10,088 voters from 5,044
households from same
GPs, ~20 voters per GP
link
ibid.
Survey of
MGNREGS project
sites
3,196 MGNREGS project
sites measured, with GPS link
Banerjee, Abhijit, Donald Green,
Jeffery McManus and Rohini
Pande. Voter Awareness Campaigns
in Bihar and Uttar Pradesh. J-PAL
projects. (2011)
Survey of voters 5,522 voters from 280
polling stations link
Census of India (2011) Census of all
households
Data at the village-level on
all villages in India link
Census of India (2001) Census of all
households
Data at the village-level on
all villages in India link
Mahatma Gandhi National Rural
Employment Guarantee Scheme
Data Public Data Portal (2014)
Detail on
MGNREGS projects
GP-level data on all
MGNREGS projects since
2008
link
State Election Commission of
Rajasthan
Results from 2010
election and basic
demographics of all
candidates for
sarpanch
Candidate-level data for all
GPs in Rajasthan link
47
Appendix 2: Survey estimates of sarpanch literacy
The GPs in the J-PAL survey were selected randomly from among all GPs that were not reserved
for women in 2010. Hence, the data from winners in the candidate survey provides an unbiased
estimate of sarpanch literacy in unreserved GPs. To get an estimate of sarpanch literacy in GPs
reserved for women, I used data from the incumbent survey for the subsample of GPs that had
been reserved in the previous round (2005 – 2010). To account for the fact that literacy might
have increased during this time period, I added to this estimate the change in literacy rates
among incumbents who were elected to unreserved GPs and the literacy rate of winners in the
candidate survey.
The final estimate of sarpanch literacy of sarpanch literacy in these districts was calculated as:
(Fraction of GPs Reserved for Women) * (Literacy Estimate for Sarpanch in GPs Reserved for
Women) + (Fraction of GPs Not Reserved for Women) * (Literacy Estimate for Sarpanch in GPs
Not Reserved for Women)
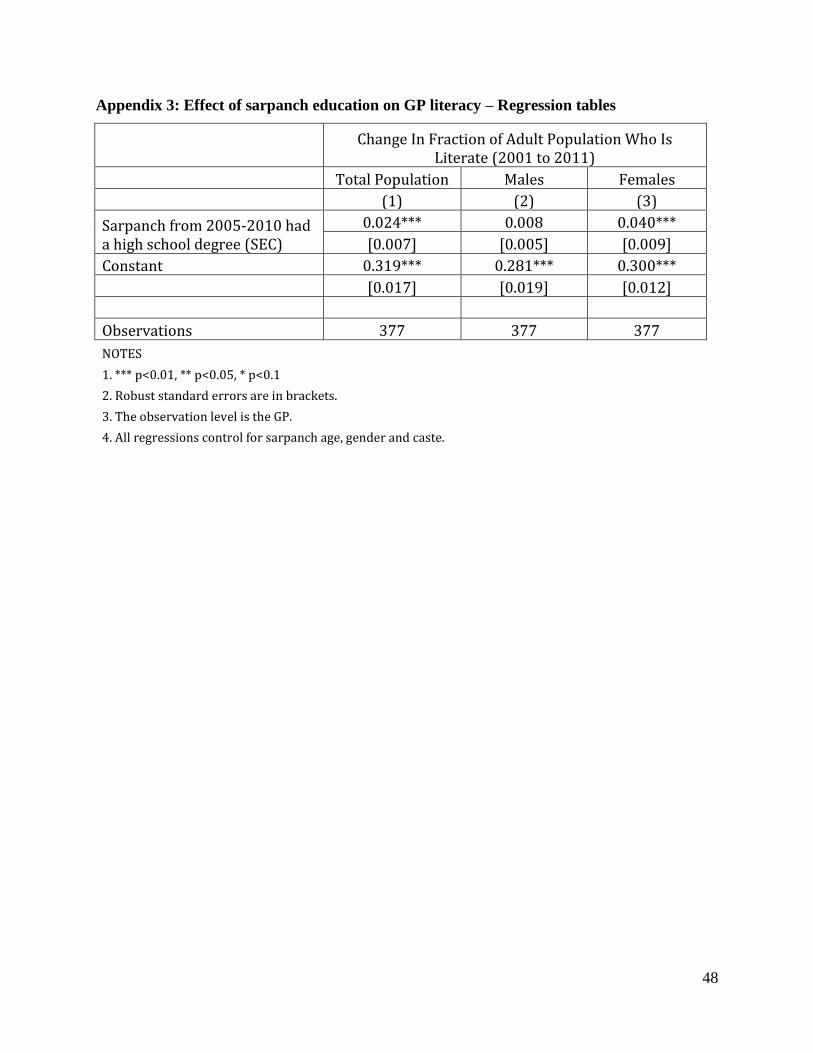
48
Appendix 3: Effect of sarpanch education on GP literacy – Regression tables
Change In Fraction of Adult Population Who Is
Literate (2001 to 2011)
Total Population Males Females
(1) (2) (3)
Sarpanch from 2005-2010 had a high school degree (SEC)
0.024*** 0.008 0.040***
[0.007] [0.005] [0.009]
Constant 0.319*** 0.281*** 0.300***
[0.017] [0.019] [0.012]
Observations 377 377 377
NOTES
1. *** p<0.01, ** p<0.05, * p<0.1
2. Robust standard errors are in brackets.
3. The observation level is the GP.
4. All regressions control for sarpanch age, gender and caste.

49
Appendix 4: Missing data imputation for education of sarpanch candidates
The data on education levels of sarpanch candidates comes from two sources at the Rajasthan
State Election Commission: a candidate-level dataset that is missing education data for 62.8% of
candidates, and a panchayat samiti (sub-district)-level dataset with the number of sarpanch in
each category of educational attainment.
To impute missing data in the candidate-level dataset, I followed the following steps:
1. Regress candidate education level on gender, caste and age for non-missing observations
2. Get predicted probabilities of candidate levels for winners and losers.
3. Using SEC counts for sarpanch education by PS, impute missing education for sarpanch:
a. For each PS, construct list of education levels of sarpanch
b. Subtract the number of sarpanch with each education level in that PS that is not
missing education.
c. For all sarpanch in a PS who are missing education, sort in order of lowest
predictive probability to highest.
d. Assign from PS list to dataset of missing sarpanch
4. Impute missing data for losers: For each PS, match each loser’s predicted probability
with the closest winner’s predicted probability in that PS, then assign the loser the same
education level as that winner.
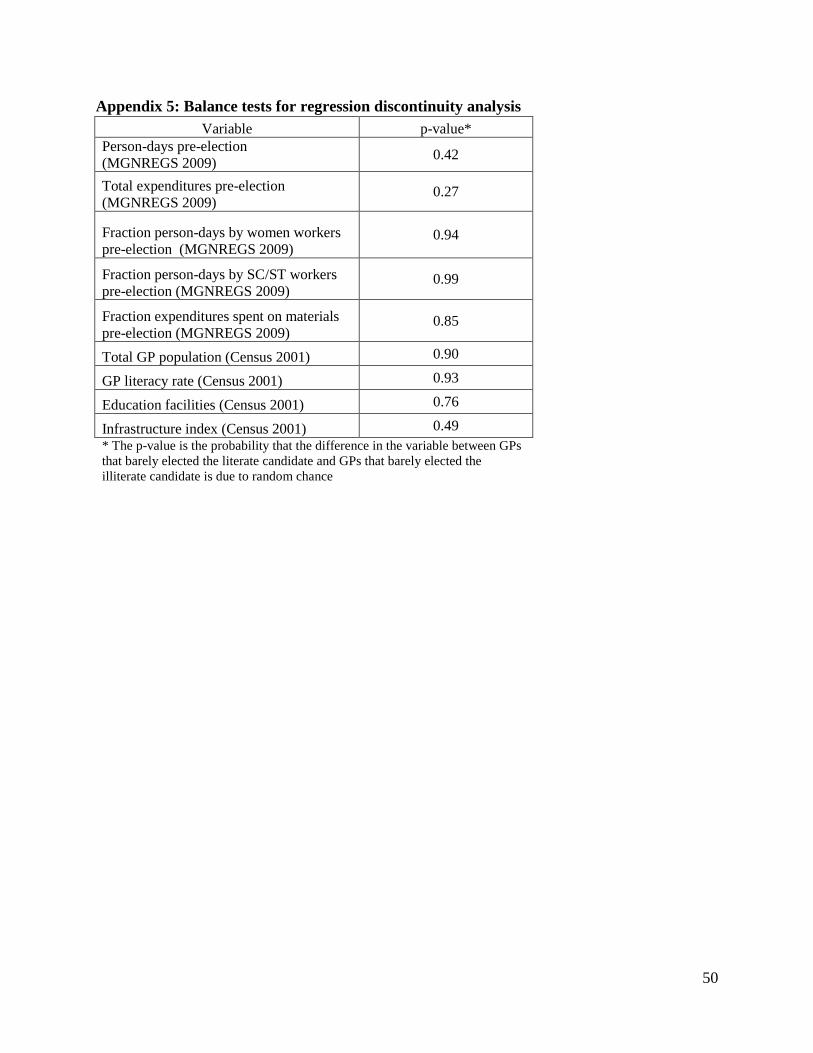
50
Appendix 5: Balance tests for regression discontinuity analysis
Variable p-value*
Person-days pre-election
(MGNREGS 2009) 0.42
Total expenditures pre-election
(MGNREGS 2009) 0.27
Fraction person-days by women workers
pre-election (MGNREGS 2009) 0.94
Fraction person-days by SC/ST workers
pre-election (MGNREGS 2009) 0.99
Fraction expenditures spent on materials
pre-election (MGNREGS 2009) 0.85
Total GP population (Census 2001) 0.90
GP literacy rate (Census 2001) 0.93
Education facilities (Census 2001) 0.76
Infrastructure index (Census 2001) 0.49
* The p-value is the probability that the difference in the variable between GPs
that barely elected the literate candidate and GPs that barely elected the
illiterate candidate is due to random chance
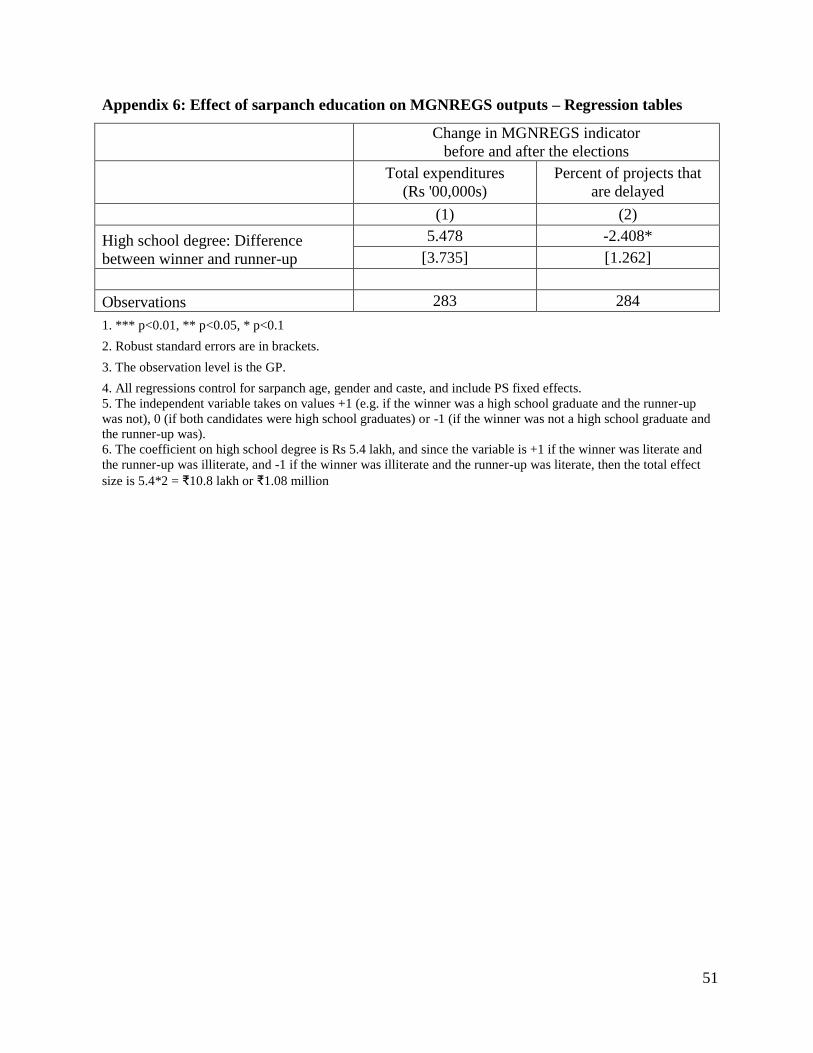
51
Appendix 6: Effect of sarpanch education on MGNREGS outputs – Regression tables
Change in MGNREGS indicator
before and after the elections
Total expenditures
(Rs '00,000s)
Percent of projects that
are delayed
(1) (2)
High school degree: Difference
between winner and runner-up
5.478 -2.408*
[3.735] [1.262]
Observations 283 284
1. *** p<0.01, ** p<0.05, * p<0.1 2. Robust standard errors are in brackets.
3. The observation level is the GP. 4. All regressions control for sarpanch age, gender and caste, and include PS fixed effects.
5. The independent variable takes on values +1 (e.g. if the winner was a high school graduate and the runner-up
was not), 0 (if both candidates were high school graduates) or -1 (if the winner was not a high school graduate and
the runner-up was).
6. The coefficient on high school degree is Rs 5.4 lakh, and since the variable is +1 if the winner was literate and
the runner-up was illiterate, and -1 if the winner was illiterate and the runner-up was literate, then the total effect
size is 5.4*2 = ₹10.8 lakh or ₹1.08 million
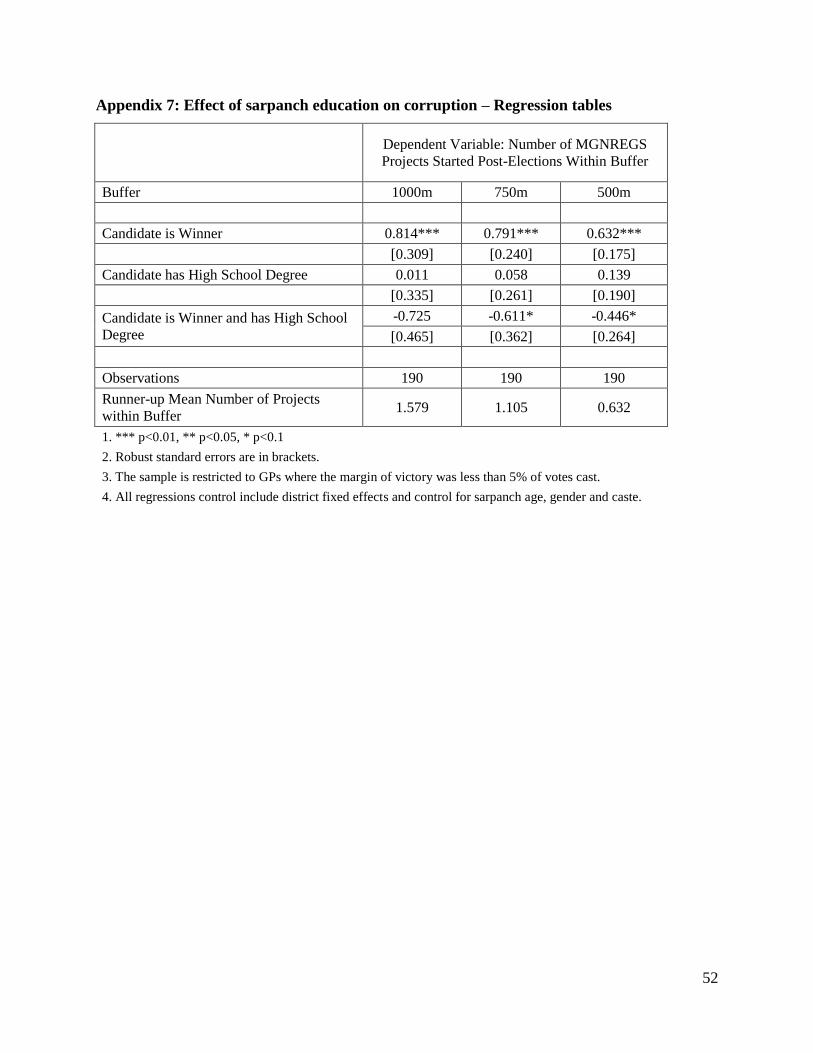
52
Appendix 7: Effect of sarpanch education on corruption – Regression tables
Dependent Variable: Number of MGNREGS
Projects Started Post-Elections Within Buffer
Buffer 1000m 750m 500m
Candidate is Winner 0.814*** 0.791*** 0.632***
[0.309] [0.240] [0.175]
Candidate has High School Degree 0.011 0.058 0.139
[0.335] [0.261] [0.190]
Candidate is Winner and has High School
Degree
-0.725 -0.611* -0.446*
[0.465] [0.362] [0.264]
Observations 190 190 190
Runner-up Mean Number of Projects
within Buffer 1.579 1.105 0.632
1. *** p<0.01, ** p<0.05, * p<0.1
2. Robust standard errors are in brackets.
3. The sample is restricted to GPs where the margin of victory was less than 5% of votes cast.
4. All regressions control include district fixed effects and control for sarpanch age, gender and caste.
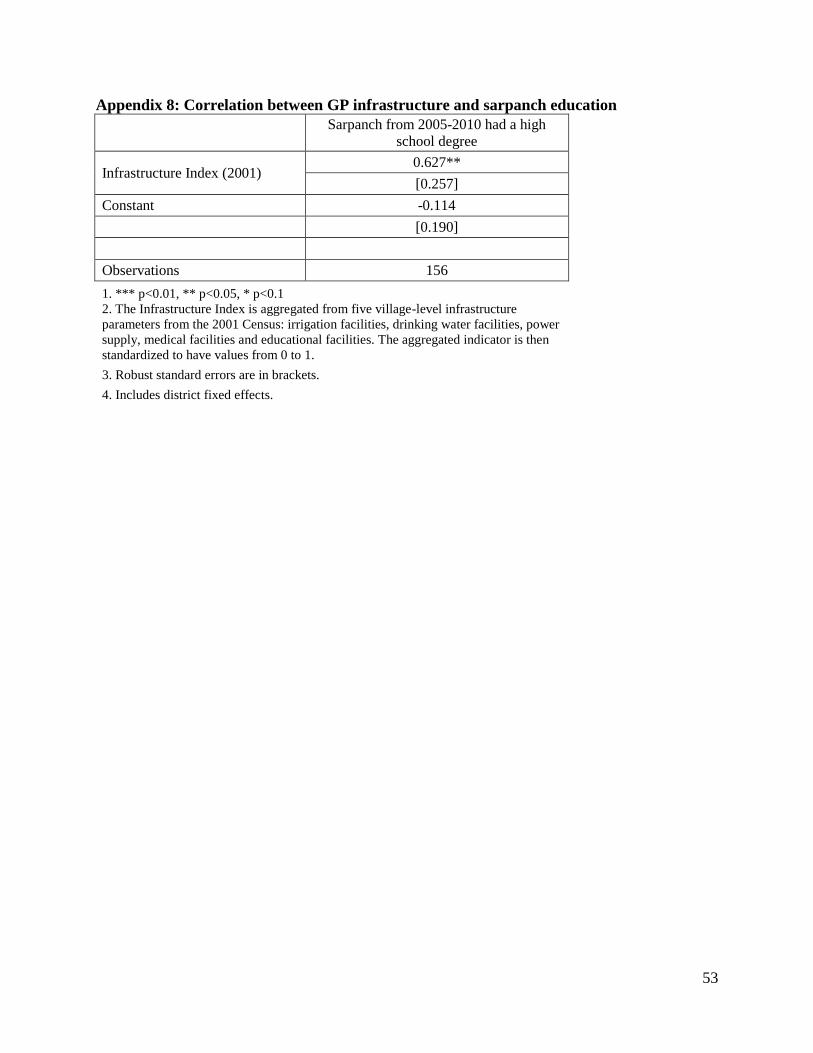
53
Appendix 8: Correlation between GP infrastructure and sarpanch education
Sarpanch from 2005-2010 had a high
school degree
Infrastructure Index (2001) 0.627**
[0.257]
Constant -0.114
[0.190]
Observations 156
1. *** p<0.01, ** p<0.05, * p<0.1
2. The Infrastructure Index is aggregated from five village-level infrastructure
parameters from the 2001 Census: irrigation facilities, drinking water facilities, power
supply, medical facilities and educational facilities. The aggregated indicator is then
standardized to have values from 0 to 1.
3. Robust standard errors are in brackets.
4. Includes district fixed effects.
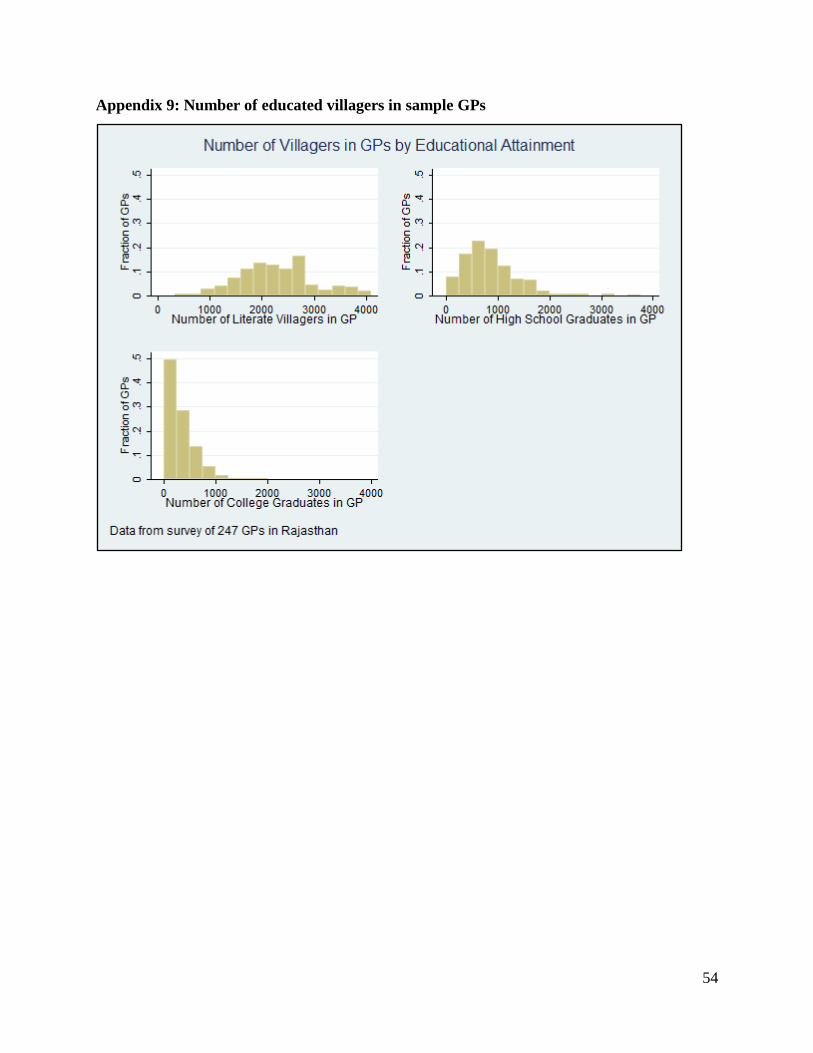
54
Appendix 9: Number of educated villagers in sample GPs
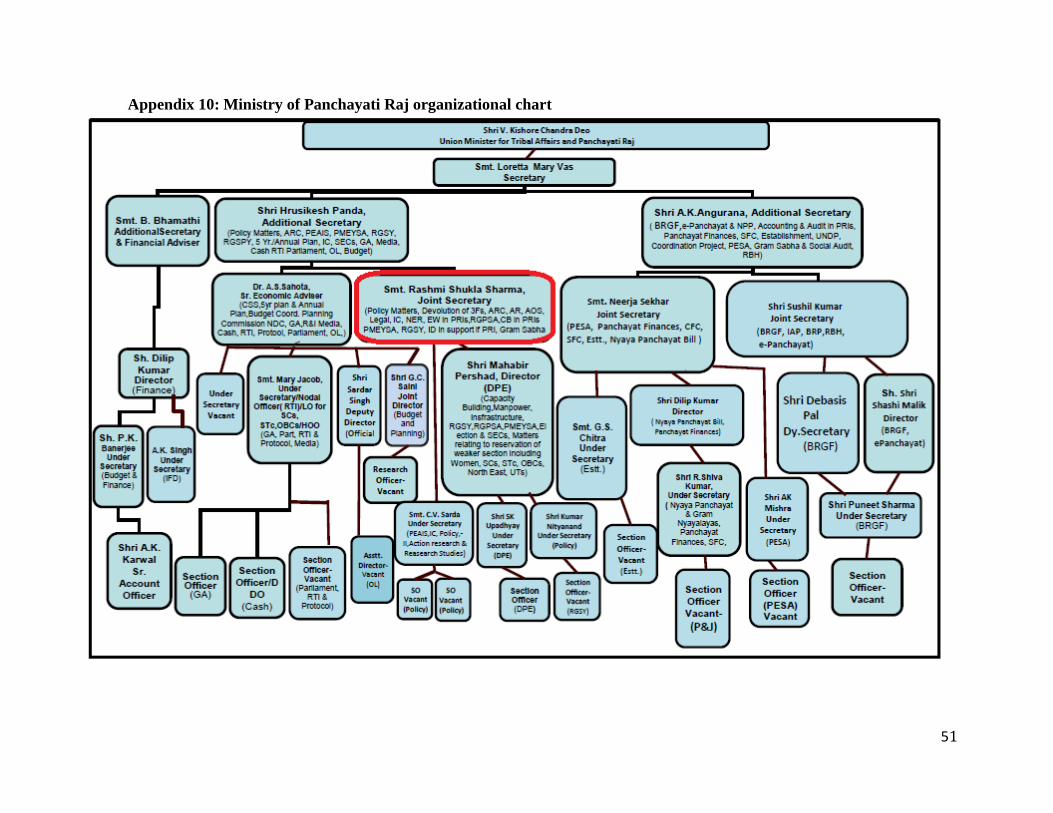
51
Appendix 10: Ministry of Panchayati Raj organizational chart