Embed Size (px)
Citation preview

Educational Research and ReviewsVolume 10 Number 5 10 March, 2015ISSN 1990-3839

ABOUT ERR Educational Research and Reviews (ISSN 1990-3839) is published bi-monthly (one volume per year) by Academic Journals. Educational Research and Reviews (ERR) is an open access journal that publishes high-quality solicited and unsolicited articles, in English, in all areas of education including education policies and management such as Educational experiences and mental health, the effect of land tenure system on resource management, Visualization skills and their incorporation into school curriculum, Gender, education and child labour etc. All articles published in ERR are peer-reviewed.
Contact Us
Editorial Office: [email protected]
Help Desk: [email protected]
Website: http://www.academicjournals.org/journal/ERR
Submit manuscript online http://ms.academicjournals.me/.

Editors
Prof. Peter Massanyi Slovak University of Agriculture, Faculty of Biotechnology and Food Sciences, Department of Animal Physiology Tr. A. Hlinku 2, SK-949 76 Nitra, Slovak Republic Slovak Republic. Prof. Name Mostafa El-Sheekh Faculty of Science, Tanta University, Tanta 31527, Egypt Egypt. Prof. Minghua Zhou Nankai University No. 94, Road Weijin, Nankai District, Tianjin 300071, China China. Prof. Muhammad Abdul Rauf United Arab Emirates University United Arab Emirates. Prof. Shao Hongbo Qingdao University of Science Technology Zhengzhou Road 53, Qingdao266042, China China. Prof. Ghasem D. Najafpour Oshirvani University of Technology Babol, Iran Iran.
Prof. Toyin Ayodele Arowolo Department of Environmental Management & Toxicology College of Environmental Resources Management University of Agriculture P.M.B. 2240 Abeokuta 110001 Ogun State Nigeria. Dr. Xue Song Wang Department of Chemical Engineering, Huaihai Institute of Technology, PR. China CangWu Road 59#, Lianyungang, Jiangsu, PR. China China. Dr. Mohamed Nageeb Rashed Aswan Faculty of Science, South Valley University, Aswan, Egypt. Prof. Hamayun Khan Department of Chemistry Islamia College University Peshawar-25120, Pakistan.

Editorial Board
Prof. García Mayo, María del Pilar Departamento de Filología Inglesa y Alemana y de Traducción e Interpretación Universidad del País Vasco (UPV/EHU) Paseo de la Universidad 5 01006 Vitoria- Spain Dr. Faisal Manzoor Arain C-5, Block # 7, Gulshan-e-Iqbal, Karachi 75300, Pakistan. Prof. Frank Witlox Ghent University – Department of Geography Krijgslaan 281, S8 B-9000 Gent Belgium. Prof. Georgios D. Sideridis University of Cret Department of Psychology Rethimno, 74100 Greece. Prof. Mutendwahothe Walter Lumadi North West University Private Bag x 2046 Mmabatho 2735 South Africa.. Dr. Miriam McMullan Faculty of Health and Social Work University of Plymouth Plymouth PL6 8BH Dr. Jitendra Pandey Banaras Hindu university Environmental Science Division, Department of Botany, Banaras Hindu university, Varanasi – 221005, India. Prof. Moshe Barak Graduate Program for Science and Technology Education Ben-Gurion University of the Negve, Beer Sheva 84105 Israel Dr. Boniface Francis Kalanda Malawi Social Action Fund Private Bag 351 Lilongwe Malawi
Dr. Hiam Zein Psychology and Education Lebanese American University P.O.Box: 13-5053.Chouran-Beirut, 1120 2801-Lebanon Lebanon Dr. Joel O. Eriba Faculty of Education Benue State University, Makurdi Nigeria. Prof. Bingjun Yang School of Foreign Languages, Southwest University, Beibei, Chongqing 400715, P. R. China, China Dr. Ernest W. Brewer The University of Tennessee, Educational Administration and Supervision, 324A Claxton Addition, Knoxville, Tennessee Prof. Gail Derrick Regent University School of Education 1000 Regent University Drive Virginia Beach, VA 23464. Dr. Evridiki Zachopoulou Department of Early Childhood Care and Education, P.O. Box 141, Sindos 57400, Thessaloniki, Greece. Prof. Michael Omolewa Nigerian Permanent Delegation to UNESCO Rue Miollis 75015, Paris. Dr. Francesco Pastore Research fellow, IZA Bonn Assistant Professor, Seconda Università di Napoli Palazzo Melzi, Piazza Matteotti, 81055, Santa Maria Capua Vetere (Caserta) Italy Dr. Syed Iftikhar Hussain Shah Technical Education and Vocatio TEVTA Secretariat, 96-H Gulberg-II, Lahore Pakistan.

ARTICLES
Research Articles A study on preschool children’s name writing and writing readiness skills 512
Effects of using invention learning approach on inventive abilities: A mixed method study 523 Paisan Wongkraso, Somsong Sitti and Araya Piyakun The effect of the courses of school experience and teaching practice on primary school mathematics teachers 531 Aksu Hasan Huseyin Comparison of communal sex roles of female sports students studying in different universities in Turkey 541 Zinnur Gerek An analysis of the relationship between organizational communication and organizational cynicism according to teachers’ perceptions in Turkey 547 Ahmet AYIK Influence of web-aided cooperative learning environment on motivation and on self-efficacy belief in Biology teaching 556
Educational Research and Reviews
Table of Contents: Volume 10 Number 5 10 March, 2015

Educational Research and Reviews
Table of Contents: Volume 10 Number 5 10 March, 2015
ARTICLES Research Articles Mathematics education and democracy education 566
Investigation of the relationship between physical activity level and healthy life-style behaviors of academic staff 577
The investigation of science process skills of science teachers in terms of some variables 582
Study of mothers’ anxieties related to their children’s future 595
Improving graduate students’ learning through the use of Moodle 604
An investigation of high school seniors’ assertiveness levels based on their demographic characteristics 615

Educational Research and Reviews
Table of Contents: Volume 10 Number 5 10 March, 2015
ARTICLES Research Articles Challenges students’ face in their transition from primary to secondary school and the interventions schools take to ease the transition 622
Turkish pre-service social studies teachers’ perceptions of “Good” citizenship 634
The problem- 641 Veysel The effects of basketball basic skills training on gross motor skills development of female children 648
The perception of gifted students’ parents about the term of giftedness 654

ARTICLES Research Articles Determination of secondary school students’ cognitive structure, and misconception in ecological concepts through word association test 660
Turkish as a foreign language learners’ awareness and use of morphology in guessing the meanings of unknown words from context: A case study 675
The relationship between secondary school students’ mathematics anxiety and self-regulation 684
The new approach to sport medicine: 3-D reconstruction 691
Educational Research and Reviews
Table of Contents: Volume 10 Number 5 10 March, 2015

Vol. 10(5), pp. 512-522, 10 March, 2015 DOI: 10.5897/ERR2015.2070 Article Number: DA5928151073 ISSN 1990-3839 Copyright © 2015Author(s) retain the copyright of this article http://www.academicjournals.org/ERR
Educational Research and Reviews
Full Length Research Paper
A study on preschool children’s name writing and writing readiness skills
Özlem Şimşek Çetin
Kırıkkale University, Education of Faculty, Kırıkkale, Turkey.
Received 01 January, 2015; Accepted 10 February, 2015
The purpose of this work is to analyze the name writing and writing readiness levels of preschoolers in terms of various variables and to identify the relationship between children’s name writing skill and writing readiness levels. To that end, name-writing and writing-readiness skills of 204 preschoolers at the ages of 3, 4 and 5 were examined using observation forms. Results revealed that children’s name writing skills were similar in terms of school type and gender yet they differed based on their age. Writing readiness scores showed no significant difference in relation to children’s gender but significant differences were observed in school type and age. Writing readiness levels were higher among children who were able to write their full names and lower among those who just scribbled randomly. Key words: Preschool children, nursery, kindergarten, emergent literacy, name writing, writing readiness.
INTRODUCTION In literate communities young children often come into contact with various written texts. They see various written language on television programs, in story books and in the newspapers. As a result, many children naturally have an idea about written symbols (Ho, 2011). Children’s reading and writing development begins before they begin to learn formal reading and writing, which is explained by the concept of emergent literacy. Developmental literacy includes children’s knowledge, skills and attitudes in relation to reading and writing before they begin formal reading-writing instruction (Puranik and Lonigan, 2012). It is crucial in terms of emergent literacy that children encounter materials such as paper, pencil and book. Preschoolers actively explore the link between oral and written language within a rich
literacy environment. Children of preschool age therefore are an active constructivist of literacy (Brenneman et al., 1996).
Preschool children acquire writing skill through real life experiences (Morrow, 2007). During this age, children’s behaviors of making scribbles and signs are not random, non-relevant literacy drawings but an indispensable part of the literacy development (Lopez, 2011). Writing is a developmental process. Writing skills in preschool children can be observed in several ways such as recording ideas for someone else or for oneself, performing physical movement of handwriting or imitating this behavior, forming letters or letter-like shapes, copy-ing words or letters and writing words. Communication is the goal of writing. Children comprehend the goal of
E-mail: [email protected] Authors agree that this article remain permanently open access under the terms of the Creative Commons Attribution License 4.0 International License

writing by being supported by the adults whom they see writing (Ranweiller, 2004). For preschool children, drawing, scribbling and mark making are believed to be a way of communication and self-expression. All these symbolic representations play a central role in literacy development of children. It is thought that development of writing and drawing is indispensable (Yang and Noel, 2006). Most children, usually before they are 3,5 - 4 years old, use similar marks to write and draw pictures and cannot distinguish the difference between them (Treiman and Yin, 2011). Mark making and scribbling are observed staring from infancy and toddlerhood (Dunst and Gorman, 2009). At about 1 - 2, 5 years old, children make random scribbles. Random scribbling is followed by controlled scribbling. During controlled scribbling, children say that they are drawing or writing. Children later begin to identify the objects they draw by a name (for instance, the child says s/he has drawn a flower). It is a milestone in terms of abstract thinking that children begin to put a name to their marks because this is an indication for children that real objects can be symbolized through marks. Around 2,5 – 3 years old, children begin to distinguish between drawing and writing (Baghban, 2007). At four, they are more skilled and learn that print is written from left to right along a line. When children are asked to draw a picture during this age, they use any part of the paper but when asked to write they tend to write from left to right along a line (Love et al., 2007). Brenneman et al. (1996) found a difference between writing and drawing among the preschoolers who had a mean age of 64.4 months and were`not taught how to write before. These children mostly preferred to use crayons while drawing and used a larger area on the paper. However, when writing they used a more limited area, drew lines from left to right and made shorter marks. Name writing in preschool One of the most important indicators for preschool literacy development is children’s skill of name writing (Puranik and Lonigan, 2012). This suggests evidence that children have discovered both oral and written language (Haney et al., 2003). In their daily life, children often come across materials with their names on them (Treiman and Broderick, 1998). Children during preschool realize their names and the letters in their names. They can distinguish their names among other words and are usually able to write their names (Both-de and Bus, 2010; Strickland and Shanahan, 2004; Puranik et al., 2012; Treiman et al., 2007). Children’s name-writing skill also contributes to other literacy skills and plays a role in children’s identifying and writing other words (Levin et al., 2005). It is important that children have some basic knowledge about writing and its function before they start writing and they learn it by
Özlem 513 focusing on their names (Puranik et al., 2011). Name-writing, therefore, affects children’s print awareness and helps them understand the direction and form of the print and the shapes of the letters (Aram and Biron, 2004). Not only does name-writing have an important place in children’s literacy development but it can also be used as a means to assess their literacy development because name-writing includes both mechanical skills and concep-tual skills (names and sound of the letters, alphabetic principles and so on) (Drouin and Harmon, 2009). Previous research shows that preschool children have the skill of name-writing and this skill improves with age. Diamond (2008) investigated name-writing skills of 4 year-old children throughout the school year and found that their name-writing skills showed a significant difference at the beginning of the year. Over half of the children started to write their names until the end of the school year. Villaume and Wilson (1989) reported that most of the 3 year-old children and all of those 4 year-olds were able to write their names. Levin et al. (2005) investigated name-writing skills of the children aged 2-5 in Israel and Holland. It was seen that children were able to write their names at an early age in both languages and name writing skills improved with age in both cultures. Chan and Louie (1992) carried out a study with 60 Chinese children aged 2-6 and found age as an important factor in name-writing; 3 year-old children could distinguish the difference between drawing and print and used only one character when writing their names while children of 5 years old used all the characters correctly. Both-de and Bus (2010) reported that 65% of the children aged 4-5.5 could write their names in a legible manner and 27% managed to write one or more letters following the initial letter in their names. Cabell et al. (2009) found that 65% of normally-developed children of fours years old could write all the letters in their names correctly while 26% could write three or more letters of their names. Writing readiness skills in preschool Writing is composed of physical, intellectual, develop-mental and interactive processes. Physical process of writing (motor skills) includes skills like holding a pencil, drawing a line, hand movements and writing from left to right (Güneş, 2007). Writing is a complex process requiring more than one sensory system (visual and motor), movement system (planning, sequencing and checking movement) and muscular system (holding the pencil at the appropriate distance) (Berninger et al., 2006). Writing requires coordination of the hand muscles and the visual perception of the letters accurately. Coordination of hand muscles is essential to write words at a certain position and to write letters and use writing tools accurately. Besides these motor skills, a well-developed cognition is also necessary for the writing skill. Fine motor skills and eye-hand coordination are required

514 Educ. Res. Rev. for common daily skills such as folding, painting, writing and cutting papers. Delay in skills requiring fine motor movements might cause problems in writing (Ho, 2011). Holding the pencil correctly affects flow and pace of the writing. A good posture and holding the paper still using the helping hand are important in writing (Havens, 2002). Moreover, for the development of writing skills, children need to be aware of concepts like writing, right, left, line, up, down and italic, know that print goes from left to right and from top to bottom on the page and draw lines of the letters smoothly and in the correct direction. Several problems like holding the pencil the wrong way, getting tired easily and feeling reluctant to write might be seen among children lacking these skills (Yangın, 2007). Significance of the study Name-writing is related to both cognitive and motor skill development because it indicates that children not only realize the form of writing but they also understand its function. It also relates to literacy perception, namely cognitive development. Children’s name writing is an indicator of their literacy development; in fact it is more of a way to construct literacy (Bloodgood, 1999). This skill as being important in preschool children’s literacy development has been investigated in a large amount of research (Bloodgood, 1999; Chan and Louie, 1992; Estabrook, 2013; Justice et al., 2005; Levin et al., 2005; Treiman et al., 2007; Villaume and Wilson, 1989; Welsh et al., 2003; Yang and Noel, 2006; Yin and Treiman, 2013). When the objectives to support the writing skills of the preschoolers in Turkey are taken into consideration, it is seen that it is the motor skills that are mostly emphasized and there are no name-writing activities and no researches conducted on name-writing. Yet, name-writing is really important in the development of writing. It emerges developmentally in children and is a significant indicator for children’s construction of literacy. Therefore, name-writing skills of preschoolers were analyzed in connection with various variables in the present study. Results from this study are considered important in the sense of presenting the development of writing skills among preschool children. This study also examined the writing readiness skills – another component of writing skill – in terms of various factors. Evaluated under the title of writing readiness skills, these skills included good posture, holding the pencil correctly, holding the paper correctly, keeping a comfortable eye-paper distance, direction of the writing and line completion. The study in this sense is considered important as it shows the effects on children of the objectives included in preschool program and children’s levels of writing readiness skills in primary school. Although development is holistic, cognitive and motor developments are approached as two distinct domains.
There are scarcely any researches analyzing the relation-ship between these two domains among normally developed children (Berninger et al., 2006; Ho, 2011). Previous researches mostly focused on the relationship of name-writing with other literacy skills such as phonological awareness, knowledge of letters and print awareness (Blair and Savage, 2006; Drouin and Harmon, 2009; Haney et al., 2003; Justice et al., 2005; Puranik and Lonigan, 2012; Puranik et al., 2011; Welsh et al., 2003). For that reason, the present study analyzed the connection between name writing and writing readiness as two distinct aspects of writing development in pre-school children. In this regard, it is believed the study will contribute to the field. Purpose of the study This study has three goals; the first is to evaluate the name-writing skills of preschool children in relation to their gender, school type and age. The second is to investigate writing readiness levels of children by gender, school type and age. And finally it intends to determine the relationship between name-writing skills and writing readiness levels. METHOD Participants The study sample was selected randomly. It was formed by selecting 10% of the children (n: 2334) from public kindergartens and nurseries affiliated to the Ministry of National Education in the province center of Kırıkkale during the 2012-2013 school year. In total, 233 children were recruited. Data from 204 participating children were eligible. The number of the children attending a nursery was 106 (51%) and the number of those attending kindergarten was 98 (49%). Of these children 107 (52%) were girls and 97 (48%) were boys. Of these children 111 (54.4%) were 5 years old, 71 (34.8%) were 4 years old and 22 (10.8%) were 3 years old. Data-collection tools Checklist for the evaluation of the writing readiness skills of pre-school children The checklist is composed of an assessment form including three lines to prepare children for adjacent italic writing and a personal record form where the researcher records his/her observations. In the checklist children receive a score of 1 when they exhibit the appropriate behavior and 0 for the inappropriate one. The overall score ranges from 0 to 11 in the checklist. It is thought that writing readiness skills of children increase as the scores on the checklist increase. Child-sized table and chairs were used in the implementation process. The checklist was administered to each child and took approximately 10 min. Test-retest reliability of the questionnaire (n: 55) was .90, with inter-rater reliability coefficients (n: 55) ranging from .32 to 1.00 (Alisinanoğlu and Şimşek, 2013).

Observation form for preschool name writing An Observation Form for Preschool Name Writing was developed by the researcher. Observation forms used in other studies to evaluate the name writing skills of preschool children were analyzed (Bloodgood, 1999; Haney et al., 2003; Estabrook, 2013; Haney, 2002; Ho, 2011; Molfese et al. 2006; Sulzby et al., 1989, Gerde et al., 2012). Items of the observation form were determined following the literature review. Views of the instructors from the field of preschool education were used to modify the items. In the assessment of name-writing skills, 25 of the data forms were selected randomly for reliability and rated by two different persons. The percentage of agreement was 91%. Name writing skills were scored as follows: refusal to write (0 point), random scribbling (1 point), scribble writing (2 points), making letter-like shapes (3 points), writing a letter or letters randomly (4 points), writing the initial name letter only (5 points), writing two or more name letters randomly (6 points), writing two or more name letters in sequence (7 points), writing all name letters in sequence (8 points), correct spelling of the full name (9 points). Data collection Prior authorization was obtained from the Ministry of National Education for the study. Then, pre-interviews were conducted with school administrators and teachers and parental consent forms were obtained for the children. The research data was collected by the researcher. In a quiet environment with child-sized table and chairs, sheets of paper were handed out and children were asked to complete the lines. The researcher, meanwhile, completed the observation form. A blank sheet of paper was provided for each of the children for them to evaluate their name-writing skills; and they were asked to write their names in a given time by asking “Can you write your name?” They were scored on the name-writing task after they finished writing their names. RESULTS Analyses of the name-writing skills An Observation Form for Preschool Name Writing was used to evaluate children’s name writing skills. Frequen-cies and percentages were calculated for children’s name writing skills and they are presented in Table 1.
As can be seen in Table 1, only 2% of children (n=4) were able to write their full names. It was found that 9.8% (n=20) of the children refused to write, 1% (n=2) were observed scribbling randomly and 1.5% (n=3) did scribble writing, 14.2% (n=29) of the children made letter-like shapes and 10.3% (n=21) wrote a letter/letters randomly. On the other hand 11.3% (n=23) of the children wrote the initial name letter only while 7.8% (n=16) wrote two or more letters of their names randomly and 6.9% (n=14) wrote two or more letters of their names in sequence, 35% (n=72) of the children were able to write their full names.
Also, distribution of children’s name writing skills was examined in relation to their gender, school type and age. Distribution of name writing skills by gender is shown in Table 2 and Figure 1.
The data from Table 2 and Figure 1 indicate that name
Özlem 515 Table 1. Frequencies and percentages for name writing skills. Name writing f % Refusal to write 20 9,8 Random scribbling 2 1,0 Scribble writing 3 1,5 Making letter-like shapes 29 14,2 Writing a letter/letters randomly 21 10,3 Writing the initial name letter only 23 11,3 Writing two or more name letters randomly 16 7,8 Writing two or more name letters in sequence 14 6,9 Writing all name letters in sequence 72 35,3 Correct spelling of the full name 4 2,0 Total 204 100,0
writing skills of girls and boys share similarities. Girls (41.1%), as compared to boys (28.9%), displayed the skill of writing all name letters more often. Table 3 and Figure 2 show the frequencies and percentages of name-writing skills by school type.
The data of Table 3 and Figure 2 demonstrate that there is a similarity between name-writing skills of the children attending nurseries and those from kindergarten. It was found that 1.9% of the nursery children and 2% of the children attending kindergarten managed to write their full names. On the other hand 8.5% of the nursery children and 11.2% of the kindergarten children refused to write. Frequencies and percentages by children’s age are given in Table 4 and Figure 3.
As Table 4 and Figure 3 show, 3 year–old children’s skill of writing two or more letters of their names and also their skill of writing their full names were not as good as those of 4 and 5 year-old children. It was seen that those who could spell their names correctly were mostly 5 year-old children (45.9%), who were followed by 4 year-olds (25.4%) and 3 year-olds (13,6%). As to making letter-like shapes, the number of 3 year-old children (36.4%) was higher than 4 year-olds (16.9%) and 5 year-old children (8.1%). Analysis of writing readiness skills A checklist including 11 items was used to determine the writing readiness levels of children. Frequencies and percentages were calculated based on whether children performed the tasks specified on the checklist. The results are presented in Table 5.
The results reported in Table 5 revealed that, in general, children could display all the writing-readiness skills except I10 and I11. It was found that 51.5% of the children demonstrated the skill specified by item 10 while the skill required by item 11 was displayed by only 35.8% of the children; 64.2% of them failed to carry out this task. It was seen that the children mostly completed the tasks

516 Educ. Res. Rev.
Table 2. Frequencies and percentages of name-writing skills by gender.
Name writing Girls Boys f % f %
Refusal to write 8 7.5 12 12.4 Random scribbling 1 .9 1 1.0 Scribble writing 2 1.9 1 1.0 Making letter-like shapes 15 14.0 14 14.4 Writing a letter/letters randomly 10 9.3 11 11.3 Writing the initial name letter only 9 8.4 14 14.4 Writing two or more name letters randomly 8 7.5 8 8.2 Writing two or more name letters in sequence 7 6.5 7 7.2 Writing all name letters in sequence 44 41.1 28 28.9 Correct spelling of the full name 3 2.8 1 1.0Total 107 100.0 97 100.0
Figure 1. Frequencies and percentages of name-writing skills by gender.
Table 3. Frequencies and percentages of name-writing skills by school type.
Name writingNursery Kindergarten f % f %
Refusal to write 9 8.5 11 11.2 Random scribbling 1 .9 1 1.0 Scribble writing 3 2.8 0 0.0 Making letter-like shapes 19 17.9 10 10.2 Writing a letter/letters randomly 11 10.4 10 10.2 Writing the initial name letter only 13 12.3 10 10.2 Writing two or more name letters randomly 7 6.6 9 9.2 Writing two or more name letters in sequence 5 4.7 9 9.2 Writing all name letters in sequence 36 34.0 36 36.7 Correct spelling of the full name 2 1.9 2 2.0 Total 106 100.0 98 100.0
of I5 (96.6%) and I1 (95.1%). Descriptive statistics for the scores children achieved on the checklist are presented in Table 6.
As understood from Table 6, while there were children who could accomplish all the tasks of the checklist (11.00), there were also children who could complete

Özlem 517
Figure 2. Frequencies and percentages of name-writing skills by school type.
Table 4. Frequencies and percentages of name-writing skills by age.
Name writing 5 years old 4 years old 3 years old f % f % f %
Refusal to write 9 8.1 6 8.5 5 22.7 Random scribbling 0 0.0 2 2.8 0 0.0 Scribble writing 0 0.0 2 2.8 1 4.5 Making letter-like shapes 9 8.1 12 16.9 8 36.4 Writing a letter or letters randomly 8 7.2 11 15.5 2 9.1 Writing the initial name letter only 13 11.7 8 11.3 2 9.1 Writing two or more name letters randomly 11 9.9 5 7.0 0 0.0 Writing two or more name letters in sequence 8 7.2 6 8.5 0 0.0 Writing all name letters in sequence 51 45.9 18 25.4 3 13.6 Correct spelling of the full name 2 1.8 1 1.4 1 4.5 Total 111 100.0 71 100.0 22 100.0
Figure 3. Frequencies and percentages of name-writing skills by age.

518 Educ. Res. Rev.
Table 5. Frequencies and percentages for the checklist items.
Items Yes
No
f % f % I1 (Posture) 194 95.1 10 4.9 I2 (Holding pencil correctly) 149 73.0 55 27.0 I3 (Holding pencil at correct distance) 150 73.5 54 26.5 I4 (Holding paper correctly) 146 71.6 58 28.4 I5 (Using helping hand to hold paper still ) 197 96.6 7 3.4 I6 (Distance between eye and writing material) 170 83.3 34 16.7I7 (Direction of writing; left to right) 180 88.2 24 11.8 I8 (Direction of writing; top to bottom) 155 76.0 49 24.0 I9 (1stline completion) 129 63.2 75 36.8 I10 (2nd line completion) 105 51.5 99 48.5 I11 (3rd line completion) 73 35.8 131 64.2
Table 6. Descriptive statistics for writing-readiness skills.
Writing readiness
Number of items N Lowest Highest
SD 11 204 0.00 11.00 8.08 2.05
Table 7. Independent samples t-test results for gender comparisons. Gender N
SS t p Girls 107 8,18 1,87
0,725
0,469 Boys 97 9,97 2,23
none of the 11 tasks specified in the checklist (0.00). The mean score children achieved in the writing-readiness test was 8.08. It could be argued that children had a high level of writing readiness skill since the mean value calculated was closer to the highest score than to the lowest one. It was found that writing-readiness levels of children were above the average. Independent samples t-test was conducted to determine whether writing-readiness skills of children differed or not based on their gender. The results can be seen in Table 7.
According to the results of Table 7, no significant difference was found between writing-readiness levels of girls and boys (p>0.05). In other words, writing-readiness levels of girls and boys were similar. Independent samples t-test was conducted to see whether writing-readiness skills of children showed a significant difference in relation to their school type. The results are presented in Table 8.
As can be seen in Table 8, children’s writing-readiness levels differed significantly according to the types of their school (p<0,05). Mean scores indicate that writing
Table 8. Independent samples t-test results for school types. School type N
SD t p Nursery 106 7.80 2.31
2.019
0.045* Kindergarten
98 8,38 1,69
* p<0,05. readiness levels of the children attending kindergarten (8.38) were significantly higher than those of the children attending nurseries (7.80). In other words, the difference of 0.58 points between children’s writing-readiness levels was significant in favor of those attending kindergarten.
A one-way analysis of variance was performed in order to determine whether statistically significant differences existed between the groups with respect to their age. The results are given in Table 9.
Table 9 shows that a significant difference existed between the writing-readiness levels of at least two of the age groups which were 5, 4 and 3 year olds (p<0,05). A multiple comparison (LSD) test was used to test between which two groups there was a significant difference. The results are shown in Table 10.
LSD test results in Table 10 show a similarity but no significant difference between writing-readiness levels of 3 and 4 year-old children (p>0,05).Writing-readiness levels of 5 year-olds were significantly higher than those of 3 and 4 year-old children (p<0,05).
Özlem 519
Table 9. Results of the one-way analysis of variance for children’s age.
Source of variance Sum of squares sd Mean of squares F p Inter-group 50,860 2 25,430
6,374
,002*
Intra-group 801,885 201 3,989
Total 852,745 203
*p<0,05.
Table 10. LSD results for writing-readiness levels based on age. Age (I) Age (J) Mean Difference (I-J) SE p
5 4 .93998(*) .30353 .002 3 1.16790(*) .46613 .013
4 5 -.93998(*) .30353 .002 3 .22791 .48737 .641
3 5 -1.16790(*) .46613 .013 4 -.22791 .48737 .641
* p<0.05
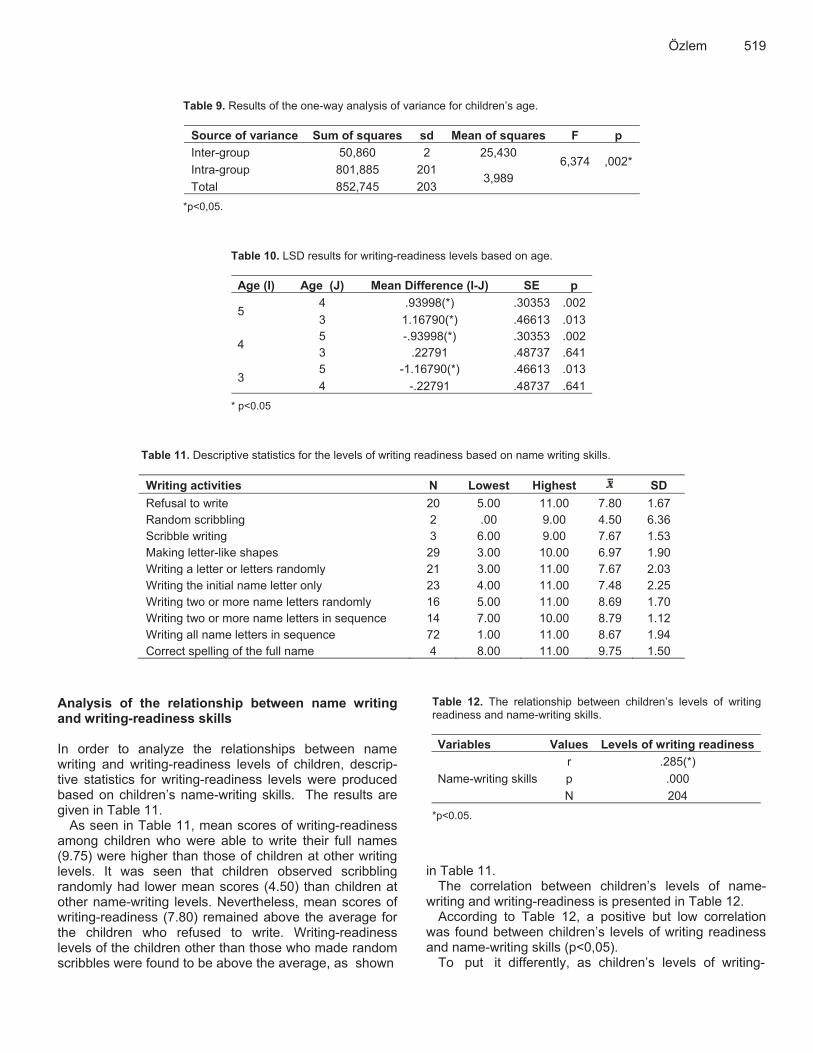
Table 11. Descriptive statistics for the levels of writing readiness based on name writing skills. Writing activities N Lowest Highest
SD Refusal to write 20 5.00 11.00 7.80 1.67 Random scribbling 2 .00 9.00 4.50 6.36 Scribble writing 3 6.00 9.00 7.67 1.53 Making letter-like shapes 29 3.00 10.00 6.97 1.90 Writing a letter or letters randomly 21 3.00 11.00 7.67 2.03 Writing the initial name letter only 23 4.00 11.00 7.48 2.25 Writing two or more name letters randomly 16 5.00 11.00 8.69 1.70 Writing two or more name letters in sequence 14 7.00 10.00 8.79 1.12 Writing all name letters in sequence 72 1.00 11.00 8.67 1.94 Correct spelling of the full name 4 8.00 11.00 9.75 1.50
Analysis of the relationship between name writing and writing-readiness skills In order to analyze the relationships between name writing and writing-readiness levels of children, descrip-tive statistics for writing-readiness levels were produced based on children’s name-writing skills. The results are given in Table 11.
As seen in Table 11, mean scores of writing-readiness among children who were able to write their full names (9.75) were higher than those of children at other writing levels. It was seen that children observed scribbling randomly had lower mean scores (4.50) than children at other name-writing levels. Nevertheless, mean scores of writing-readiness (7.80) remained above the average for the children who refused to write. Writing-readiness levels of the children other than those who made random scribbles were found to be above the average, as shown
Table 12. The relationship between children’s levels of writing readiness and name-writing skills. Variables Values Levels of writing readiness
Name-writing skills r .285(*) p .000 N 204
*p<0.05. in Table 11.
The correlation between children’s levels of name-writing and writing-readiness is presented in Table 12.
According to Table 12, a positive but low correlation was found between children’s levels of writing readiness and name-writing skills (p<0,05).
To put it differently, as children’s levels of writing-

520 Educ. Res. Rev. readiness increased, their writing skills tended to increase slightly. DISCUSSION This study has three goals regarding the writing skills of preschool children. Firstly, it aims to examine the name-writing skills of children and determine whether these skills differ significantly based on the variables of gender, school type and age. Secondly, it attempts to investigate their writing-readiness levels in relation to their gender, school type and age. And finally it aims to determine the relationship between name-writing skills and writing readiness levels. In the first place, name-writing skills and writing readiness levels of children were analyzed in relation to the variables of gender, school type and age. Their name-writing skills and writing-readiness levels were then compared.
Name-writing skill in children is considered to be one of the most important indicators of literacy skills (Haney et al., 2003; Puranik and Lonigan, 2012). This study therefore examined the development of preschool children’s name-writing skill as being an important aspect of literacy development and it was concluded that children were able to write their names during this age. Results of the present study are supported by those of previous studies. A large body of research has shown that preschoolers with different cultural backgrounds and language structures have the ability to write their names though they do not know formal reading and writing (Both-de and Bus, 2010; Cabell et al., 2009; Chan and Louie, 1992; Levin et al. 2005; Treiman et al., 2007; Villaume and Wilson, 1989; Yin and Treiman, 2013). In this study, it was seen that children were able to write the letters in their names and 35% of them were able to write all the letters of their names in the correct order. Preschool education program in Turkey does not include activities to teach letters and writing (MEB, 2013: 44). This once more shows that writing development in preschoolers is not only a developmental trait but is also affected by the environmental stimuli.
Another result of the present study was that there was a similarity in name-writing between girls and boys. Previous research found different results regarding the effect of gender on writing skills. Haney et al. (2003) reported that gender does not have a significant effect on name-writing while Puranik et al. (2012) found that girls are more successful in letter-writing than boys. Justice et al. (2005) also reported a similar result that girls had higher scores, as compared to boys, in relation to name-writing skills.
According to the results of this study, there was a similarity between name-writing skills of the children attending kindergarten and those of the children attend-ing nurseries. No study was found in the literature that focuses on the effect of school type on the name-writing
skills of children. More studies, therefore, are needed that examine the effect of school type on name-writing skill.
In this study it was observed that name writing skills develop with age and the tasks writing the initial name letter only, writing two or more name letters and writing two or more name letters in sequence were better per-formed by 5 year-old children than those 3 and 4 year-old ones. Other research also confirmed that name-writing develops with age (Bloodgood, 1999; Chan and Louie, 1992; Estabrook, 2013; Justice et al., 2005; Villaume and Wilson, 1989; Welsh et al., 2003; Yang and Noel, 2006; Yin and Treiman, 2013). Results indicated that children’s writing-readiness levels remained above the average. Çelenk (2008) reported that preschool education helps children gain valuable experiences for primary education and has an impact on their levels of writing readiness. Given the preschool education program in Turkey (MEB, 2006; MEB, 2013), this is an expected result because preschool teachers, within the scope of reading-writing activities, are expected to have their children do activities in relation to use of pencil hand skills (holding pencil correctly, pencil control, drawing, painting, cutting, folding, kneading, sticking). Results of the study revealed that age plays in impor-tant role in writing-readiness skills. It was found that age was a significant factor in writing readiness and writing-readiness scores of 5 year-old children were higher than those of 3 and 4 year-olds. Previous research showed that skills concerning movement and posture and also writing skills develop with age (Havens, 2002; Trivette et al., 2013).
As in the name-writing skills, age is an important factor in writing-readiness level. Writing readiness level is also a developmental trait, so it is thought to show a significant difference based on age. Yet, the effect of the education programs in preschool institutions should not be disregarded as writing-readiness activities are mostly carried out by 5 year-olds. As a result, it could be argued that both developmental and environmental factors play a role in higher levels of writing readiness among 5 year-old children. Another result from the present study is that there is a significant difference in the writing-readiness level in favor of the children attending kindergarten. The goal of kindergarten education is to prepare children for primary education. Accordingly, activities such as pencil holding and drawing lines for writing-readiness to support writing skills are observed more often in kindergarten than in nurseries. It could be argued therefore that although the same program is used in nurseries and classes, the differences in the implementation of the program are likely to affect children’s skills of writing readiness. As reported by Rowe and Neitzel (2010), children’s interests and their interactions with materials and other people have an impact on the activities they do, which results in differences in their writing experiences. So, it could be

suggested that educational opportunities provided for children seem effective in their writing-readiness skills. In this study, name-writing skills of children attending nurseries were found to be similar to those of children attending kindergarten, yet there was a significant difference in writing-readiness in favor of nursery-class children. The relationship between children’s name-writing skill and other literacy skills was examined in previous studies (Justice et al., 2005; Puranik and Lonigan, 2012). A significant correlation was found between name-writing and phonological awareness by Blair and Savage (2006), between letter-knowledge (naming lower cases and upper cases, recognizing letters and letter sounds) and name-writing by Drouin and Harmon (2009) and between name-writing and recogniz-ing meaningful and meaningless words by Haney et al. (2003). Puranik et al. (2011) found a relationship between name-writing skill and print-knowledge. According to the results of the study conducted by Welsh et al. (2003), name-writing skill develops concurrently with print and phonological awareness. Therefore, supporting children’s name-writing skill is considered important in the sense of improving their literacy skills. In this study, the writing-readiness levels of preschool children (good posture, holding the pencil correctly, holding the paper correctly, keeping an appropriate eye-paper distance, direction of the writing, line completion) were examined based on their name-writing skills. It was found that writing-readiness levels of the children scribbling randomly were lower than those of other children while the children who were able to write their full names had higher mean scores of writing readiness when compared to other children. A positive but low correlation was detected between the children’s levels of writing readiness and their name-writing skills. As children’s levels of writing-readiness increased, their writing skills tended to increase slightly, which is considered natural because both name-writing and writing-readiness develop with age. Results from previous studies showed a relationship between the name-writing skills of preschoolers and their skills concerning physical aspect of writing (motor skills). Gerde et al. (2012) found that preschool motor skills account for 11.8% of name-writing skills. In another study, Havens (2002) detected a positive correlation between name-writing skills and motor and postural skills. There are also studies suggesting that there is no significant relationship between name-writing and motor skills. For example, a study by Ho (2011) found no statistically significant relationship between fine-motor skills and name-writing skill.
It was also seen that children refused to write, which is a striking result of the study. Ho (2011) found that 11.3% of children (N:73) reported that they did not want to write and it was underlined that this stage has a central role in children’s writing development and it should not be regarded as the first stage but at a more advanced stage in children’s writing development. A similar finding was
Özlem 521 also reached in this study; 20% of the children did not want to write. It was observed that writing-readiness scores of these children were higher when compared to those who randomly scribbled, made writing-like scribbles, drew letter-like shapes, wrote a letter/letters randomly and wrote the initial name letter only. This could be interpreted as that the children who refused to write have a higher level of print awareness. Conclusion The present study showed that preschool children’s name-writing skill – or in other words, realizing and writing the letters in their names – is a developmental quality and is observed in children though not included in the education program. Name-writing skill as an impor-tant skill in children’s learning to write and read needs to be integrated into the preschool education program and activities should be planned as a part of daily activities. It was seen in the study that children had a high level of writing-readiness. It is evident that activities carried out as a part of preschool program to develop children’s writing-readiness skills have supported motor skill of children’s. In the study, a connection was found between children’s writing-readiness level and their name-writing skills. Therefore, development of children’s writing skills should be evaluated adopting a holistic approach and the education program should be shaped accordingly. An important limitation of this study is that it does not discuss the effect of literacy environment on name-writing and writing-readiness skills. Educational opportunities provided for children at home and school play a crucial role in children’s writing development. Future studies can help determine the effect of literacy environment created at home and school on children’s writing development and the effect of current name-writing and writing-readiness skills on the future reading and writing skills of children. Conflict of Interests The author has not declared any conflict of interest. REFERENCES Alisinanoğlu F, Şimşek Ö (2013). Validity and reliability study of the
control list for the evaluatıon of the writing readiness skills of pre-school children. Kastamonu Educ. J. 21(3):1163-1176.
Aram D, Biron S (2004). Joint storybook reading and joint writing interventions among low SES preschoolers: Differential contributions to early literacy. Early Childhood Res. Q. 19(4):588-610.
Baghban M (2007). Scribbles, labels, and stories: The role of drawing in the development of writing. Young Children 62(1):20–26.
Berninger VW, Rutberg JE, Abbott RD, Garcia N, Anderson-Youngstrom M, Brooks A, Fulton C (2006). Tier 1 and tier 2 intervention for handwriting and composing. J. Sch. Psychol. 44(1): 3-39.

522 Educ. Res. Rev. Blair R, Savage R (2006). Name writing but not environmental print
recognition is related to letter-sound knowledge and phonological awareness in pre-readers. Read. Writ. 19(9): 991–1016.
Bloodgood J (1999). What’s in a name? Children’s name writing and literacy acquisition. Read. Res. Q. 34: 342–367.
Both-de Vries AC, Bus AG (2010). The proper name as starting point for basic reading skills. Read. Writ. 23(2): 173–187.
Brenneman K, Massey C, Machado SF, Gelman R (1996). Young children’s plans differ for writing and drawing. Cognit. Dev. 11(3): 397-419.
Cabell SQ, Justice LM, Zucker TA, McGinty AS (2009). Emergent name-writing abilities of preschool-age children with language impairment. LSHSS 40: 53-66.
Chan L, Louie L (1992). Developmental trend of Chinese preschool children in drawing and writing. J. Res. Childhood Educ. 6: 93-99.
Çelenk S (2008). Level of readiness for reading and writing education among first grade students of primary schools. Abant İzzet Baysal Univ. Educ. J. 8(1):83-90.
Diamond KE, Gerde HK, Powell DR (2008). Development in early literacy skills during the pre-kindergarten year in Head Start: Relations between growth in children's writing and understanding of letters. Early Childhood Res. Q. 23:467–478,
Drouin M, Harmon J (2009). Name writing and letter knowledge in preschoolers: Incongruities in skills and the usefulness of name writing as a developmental indicator. Early Childhood Res. Q. 24: 263–270.
Dunst CJ, Gorman E (2009). Development of infant and toddler mark making and scribbling. CELL Rev. 2(2): 1-16.
Estabrook E (2013). The relationship between home literacy experiences and preschool emergent writing skills. Unpublished master's thesis, University of Pittsburgh: Pittsburgh.
Gerde HK, Skibbe LE, Bowles RP, Martoccio TL (2012). Child and home predictors of children’s name writing. Child Dev. Res. 20(12):1-12.
Güneş F (2007). Ses temelli cümle yöntemi ve zihinsel yapılandırma. (1 edt). Ankara: Nobel Yayıncılık.
Haney M, Bissonnette V, Benkhen K (2003). Relationship Among Name Writing Skills and Early Literacy Development in Kindergarten Children. Child Study J. 33 (2):99-116.
Haney MR (2002). Name writing: a window into the emergent literacy skills of young children, Early Childhood Educ. J. 30(2): 101–5.
Havens MC (2002). Emergent writing in precshool. Unpublished doctoral dissertion. The State University of New Jersey: New Jersey.
Ho CA (2011). Major developmental characteristics of children's name writing and relationships with fine motor skills and emergent literacy skills. Unpublished doctoral dissertion. The University of Michigan: Michigan.
Justice LM, Invernizzi M, Geller K, Sullivan AK (2005). Descriptive-developmental performance of at-risk preschoolers on early literacy tasks. Read. Psychol. 26:1–25.
Levin I, Both-De Vries A, Aram D, Bus A (2005). Writing starts with own name writing: From scribbling to conventional spelling in Israeli and Dutch children. Applied Psycholinguistics 26(3):463–477.
Lopez E (2011). Assessing spanish early writing development of preschool english language learners and its link to english early writing development. Unpublished doctoral dissertion. Texas A&M University: Texas.
Love A, Susan BM, Buell MJ. (2007). Writing: empowering literacy. Young Children 62(1):12-19.
MEB (2006). Okul öncesi eğitim programı. Ankara: Milli Eğitim Bakanlığı.
MEB (2013). Okul öncesi eğitim programı. Milli Eğitim Bakanlığı (tegm.meb.gov.tr/dosya/okuloncesi/ooproram.pdf)
Molfese VJ, Beswick J, Molnar A, Jacobi-Vessels J (2006). Alphabetic
skills in preschool: A preliminary study of letter naming and letter writing. Dev. Neuropsychol. 29:5–19.
Morrow LM (2007). Developing Literacy in preschool. Guilford press, New york.
Puranik C S, Petscher Y, Lonigan CJ (2012). Dimensionality and reliability of letter writing in 3- to 5-year-old preschool children, Learning and Individual Differences . doi:10.1016/j.lindif.2012.06.011.
Puranik C, Lonigan C (2012). Name-writing proficiency, not length of name, is associated with preschool children’s emergent literacy skills. Early Childhood Res. Q. 27:284–294.
Puranik C, Lonigan C, Kim Y (2011). Contributions of emergent literacy skills to name writing, letter writing, and spelling in preschool children. Early Childhood Res. Q. 26:465–474.
Ranweiller LW (2004). Preschool readers and writters early literacy for strategies. Michigan: High Scope Press.
Rowe DW, Neitzel C (2010). Interest and agency in 2- and 3-year-olds’ participation in emergent writing. Read. Res. Q. 45: 169-195.
Strickland DS, Shanahan T (2004) Laying the groundwork for literacy-Preliminary findings from the National Early Literacy Panel. Educ. Leadersh. 6: 74–77.
Sulzby E, Barnhart J, Hieshima J (1989). Technical Report No. 20: Forms of writing and rereading from writing: A preliminary report. (Retrieved May 21, 2007 from www.writingproject.org/Resources/techreports.html
Treiman R, Broderick V (1998). What’s in a name? Children’s knowledge about the letters in their own names. J. Experiment. Child Psychol. 70:97–116.
Treiman R, Cohen J, Mulqueeny K, Kessler B, Schechtman S (2007). Young children’s knowledge about printed names. Child Dev. 78 (5):1458 – 1471.
Treiman R, Yin L (2011). Early differentiation between drawing and writing in Chinese children. J. Experiment. Child Psychol. 108: 786–801.
Trivette CM, Hamby DW, Dunst CJ, Gorman E (2013) Emergent writing among young children from twelve to sixty months of age. CELL Rev. 6(2):1-18.
Villaume SK, Wilson LC (1989). Preschool children’s explorations of letters in their own names. Applied Psycholinguistics 10(3):283–300.
Welsch JG, Sullivan A, Justice LM (2003). That’s my letter!: What preschoolers’ name writing representations tell us about emergent literacy knowledge. J. Lit. Res. 35(2):757–776.
Yang H, Noel AM (2006). The developmental characteristics of four- and five-year-old pre-schoolers’ drawing: An analysis of scribbles, placement patterns, emergent writing, and name writing in archived spontaneous drawing samples. J. Early Childhood Lit. 6(2): 145–162.
Yangın B (2007). The degree of readiness for writıing educatıon of six year olds in pre-school education. Hacettepe Unıv. Education J. Educ. 32:294 – 305.
Yin L, Treiman R (2013). Name writing in Mandarin-speaking children. J. Experiment. Child Psychol. 116:199–215.

Vol. 10(5), pp. 523-530, 10 March, 2015 DOI:10.5897/ERR2015.2117 Article Number: 977B72E51077 ISSN 1990-3839 Copyright © 2015Author(s) retain the copyright of this article http://www.academicjournals.org/ERR
Educational Research and Reviews
Full Length Research Paper
Effects of using invention learning approach on inventive abilities: A mixed method study
Paisan Wongkraso1*, Somsong Sitti and Araya Piyakun
Faculty of Education, Mahasarakham University, Mahasarakham, Thailand.
Received 03 February, 2015; Accepted 18 February, 2015
This study aims to enhance inventive abilities for secondary students by using the Invention Learning Approach. Its activities focus on creating new inventions based on the students’ interests by using constructional tools. The participants were twenty secondary students who took an elective science course that provided instructional units integrated with the Invention Learning Approach for 40 h, over a period of 20 weeks. A mixed-method approach was used to investigate and analyze the data. The results of this study indicated a significant increase in their inventive abilities. The qualitative data reported that students benefited from learning by this approach. Findings of this study can be used to determine how innovation and creativity can be fostered through the Invention Learning Approach teaching students how to be more innovative while solving real world problems. Key words: Invention Learning Approach, inventive abilities, invention course, mixed methods.
INTRODUCTION Competitiveness and productivity of an economy drive innovation, which continuously translates into patents for inventions. Developed nations have the largest number of invention patents. On the other hand, firms in developing nations request fewer patents. For example, more than 90% of patents applied for and granted by the Thai Patent Office are to foreign residents. Only a small number of patents are granted to local residents (STI Policy Office. 2011). Therefore, developing innovation abilities will allow developing nations to be more competitive in the global market (The Lemelson-MIT Program, 2003).
Thus, from clear needs and apparent trends, we have to prepare our people, especially the younger generation, to develop personal competitiveness and productivity in
innovation, which will strengthen our societal ability to invent. Until now, regular schools have neglected to encourage students who have innate creativity to be innovative and produce new inventions. Rule et al. (2009) state that published research on efforts to improve children’s inventive skills, especially at the secondary level, is almost nonexistent. Students must not be overlooked, but their latent ability to invent something new should be developed and supported at the national level. In order to do so, first, there should be research conducted in the development of an invention learning approach for children (The Lemelson-MIT Program, 2003).
Despite the fact that people everywhere have an innate ability to invent creatively, educators have largely ignored
*Corresponding author. E-mail: [email protected]. Tel: +66 (8) 5677368. Authors agree that this article remain permanently open access under the terms of the Creative Commons Attribution License 4.0 International License

524 Educ. Res. Rev. teaching invention, in spite of its role in transforming our world (Wiener, 1993). People think there is great mystery in inventing something (Gorman et al., 1995). However, Shlesinger (1980) stated, “If people-including children could be taught, for example, how to play a musical instrument, why couldn’t they be taught to invent? We can teach children to use their imagination to build a better world, to notice a problem, and fix it, to dream up a way life easier, and make it.” On the other hand, understanding how to teach students to become inventors is perplexing.
Currently, inventions are being used more to teach many disciplines. Several studies suggest that educational invention helps students gain content knowledge in subject areas (Westberg, 1996; Plucker and Gorman, 1999; Rule et al., 2009). In addition, Plucker and Gorman (1999) have suggested that teaching to invent plays a positive role in both learning and motivation. According to Rule et al. (2009), teaching students how to invent can increase students’ interests in engineering and science. Invention is multidisciplinary and covers many technical areas like science, math, engineering, design, and technology. Teaching students how to create inventions also provides them with an opportunity to identify how all the parts of a complex system interact and depend upon each other (Matinez and Stager, 2013). Many invention contests and programs have emerged over the two past decades. For instance, many schools supported “Invention Conventions”, the United States Patent and Trademark Office (USPTO) created the “Inventive Thinking Curriculum Project” (United States Department of Commerce (DOC), 1997), the National Science Teachers’ Association (NSTA) supported the “Young Inventors Awards” (Frankovitset al., 2002), and “Camp Invention” a hands-on creative science invention camp experimented with hundreds of partner schools (Saxon et al., 2003). In Thailand, the Ministry of Education has sponsored the “Young Scientific Invention Competition” yearly since 1991. Therefore, many Thai schools have tried to teach their students to create inventions for the competition. However, based on our interview of 40students and their teachers from the Young Scientific Invention Competition in 2012, we found that the students were not taught in their classrooms to create their own inventions. The supervisors guided all of the students in the creating of their inventions. Additionally, most of the ideas for the inventions came from the supervisors (Wongkraso et al., 2013).
Many previous studies have researched the effective-ness of the ways for teaching to invent including studying lives of inventors in order to teach students (McCormick, 1984), building Rube Goldberg-type inventions (Kuehn, 1985; Kuehn and Krockover, 1986), using step-by-step inventor approach programs (Shlesinger, 1982, 1987b), and scientific process skill programs or thinking skills
(Kuehn and Krockover, 1986; Westberg, 1996; Rule et al., 2009). All of these programs, while enhancing students’ motivation and helping them learn group interaction process skills in invention, showed limited success in improving inventive abilities. However, Kuehn and Krockover (1986) and Rule et al. (2009) showed that their teaching the science of invention positively influenced the students’ inventive abilities. Unfortunately, these studies have been researched very little among secondary school students for teaching invention. The brief review of relevant literature on teaching invention shows finding ways to improve secondary school students’ inventive abilities for high-quality inventions is extremely important. This study was thus undertaken to ascertain if teaching invention by using the Invention Learning Approach would positively affect the inventive abilities of secondary students (mean age 15 years old). The specific research question is: Does manipulating the inventive learning approach influence students’ inventive abilities? METHODOLOGY Participants This study used the strategy of convenience sampling to select participants from Nong Sung Samukkhiwittaya School in the Province of Mukdahan, Thailand. Twenty secondary students (mean age 15 years old) who showed interest and enrolled in an elective science course participated in this study (Male: 9, 45%; Female: 11, 55%). They have no previous experience in creating any inventions before this experiment. Approval was obtained from the school principal and the students’ parents for this study to be conducted. Procedure This study used the embedded experimental model of mixed methods research as shown in Figure 1. The mixed methods model is characterized as having qualitative data embedded within an experimental design (Creswell and Plano Clark, 2007). This study embedded the qualitative data during the interventions as well as in follow-up in-depth interviews after each quantitative creative invention performance test. This design denoted the intertwined relationship between qualitative and quantitative methods as a whole. In other words, a qualitative method could not stand by itself as an independent study, but served as a supplementary part for the quantitative methodology.
The total time to implement and collect data of the intervention was forty hours (over a period of20 weeks) during the second semester of the 2013 academic year. The experiment was divided into three phases including pre-intervention, intervention, and post-intervention.
In Phase I: Pre-intervention, both quantitative and qualitative data were gathered to identify students’ inventive abilities. This was accomplished by using the Creative Invention Performance Assessment (CIPA) instrument (pre-test).In order to explain and extend the quantitative findings, narrative data from the follow-up interviews with all students were collected after the analysis of test scores. To evaluate inventive abilities in the pretest and posttest,

Wongkraso et al. 525
Figure 1. The embedded design: embedded experimental model of mixed methods research.
the participants were assigned to invent products in 4 h by using materials that were prepared by the researchers. Three experts, who have experience in graded inventions (see Instruments), graded the pretest and posttest. Follow-up in-depth interviews were conducted with all the participants after the quantitative data collection.
In Phase II: Intervention, the researchers implemented the learning activities (eight lesson plans) by using the Invention Learning Approach in the elective science course. The course involved application of the scientific method to scientifically invent projects. The main requirement of this course was to complete invention projects. Abundant qualitative data were collected through video-taping the intervention period, researcher’s observation and field notes, informal interviews, and participants’ written work. The strategy of content analysis of qualitative data (Henwood and Pidgeon, 1994; Lyons and Coyle, 2007; Boeije, 2010) was used to generate themes with the purpose of explaining and supplementing the quantitative data of the posttest. Data triangulation was implemented (Lincoln and Guba, 1985); while using the different sources to gather data: informal interviews, the researchers’ documented observations of the students’ actions and statements, students’ portfolios, students’ invention logbooks, and students’ written work.
In Phase III: Post-intervention, data collection processes were similar to Phase I; both quantitative data from the post-test and qualitative data from the follow-up interviews with participants were gathered. However, the interview questions shifted focus to highlight the changes in the participants’ performance in the effectiveness of the intervention. The interviews assisted in identifying whether the participants made progress throughout the intervention and what changes occurred within their performance. The rationale of this design approach was that quantitative data gauged exactly what problems and weaknesses existed in students’ inventive abilities. Materials The Invention Learning Approach This Invention Learning Approach was a credit-bearing elective science course offered by Nong Sung Samukkhiwittaya School. We attempted to develop an elective science course that was in accordance with Shlesinger’s (1982, 1987a) approach of using step-by-step inventor approach programs. The researchers also developed this approach based on the in-depth interviewing of 10 Thai inventors and field studies of three Thai “Best Practice Schools” in teaching and learning invention. All stages of the approach attempted to motivate students and enhance their abilities to create new inventions, especially in the context of science. This
learning approach, based on the idea of Constructionism allows students to learn about a subject by ‘learning-by-designing’ and ‘learning-by-making’, guides teachers as well as the schools (Papert, 1993). Constuctionism is meaningful and transferable learning in which students are given opportunities to construct inventions that answer a perceived need, using technology, improving the students’ inventive abilities, and preparing them to become good inventors in the future. Students can develop their knowledge by making their own inventions (Westberg, 1996; Rule et al., 2009). The Invention Learning Approach contains seven stages: Problem identifying to choose topics/products: Students have to find problems needing a solution. This stage teaches students how to listen for complaints and to recognize inconvenient situations for people in the real world to choose their topics. A good invention starts with an idea for something that may make people’s lives easier or more efficient. Searching for data/resources: Students collect as much data as possible related to the problem area in order to solve the problem. They must find out if their idea for an invention is original. They need to do research in magazines, catalogs, and on the Internet. They cannot invent products that have already been invented. Imagining: Students use imagination or creative thinking techniques such as brainstorming or lateral thinking to solve the problem. Designing/planning: Students prepare a model of their inventions to plan good forms and structures. They also prepare materials for the products based on the prototype. By doing this, students can be reassured that their products’ plan/design is correct, thus increasing the likelihood that their invention will work. Their drawing does not have to be perfect, but it should be adequate for them to use to build a working product. Creating inventions: Students create their products based on their prototypes or plans for their inventions by using the materials they have prepared in the Designing/planning stage. Implementing: Students test their own inventions. The students should test their inventions several times in as real a situation as possible. Students should be made aware that the inventions might not work the first time. Adjusting inventions: After the Implementing stage, students have to improve their inventions from problem identification. Repeat Designing/planning, Creating inventions, and Implementing stages until the inventions work. In the learning activities by using the Invention Learning Approach, students were required to design inventions and maintain a learning portfolio that represented what they learned as they worked on their invention projects. Students began by defining and identifying their invention proposal projects. Then students submitted papers on
qual during
intervention
qual before
intervention
qual after
intervention
intervention QUAN premeasure
QUAN postmeasure
Interpretation based on
QUAN(qual) results

526 Educ. Res. Rev.
Table 1. Overview of eight lessons taught to students.
Lessons of the elective science course based on the invention learning approach Lesson One: Science and Scientific Invention Description: Students learn the definition of inventions and the relationship between science and invention called ‘scientific invention’, hear inventors’ stories about their inventions, and see good examples of students’ scientific inventions. Lesson Two: Problem identifying to choose topics/products: Description: This lesson teaches students how to listen for complaints and to recognize inconvenient situations for people in the real world to choose their topics. Students learn problem-finding techniques. Lesson Three: Searching for data/resources Description: Students collect as much scientific data and principles as possible related to the problem area in order to solve the problem. They must find out if their idea for an invention is original. They need to do research in magazines, catalogs, and on the Internet. They cannot invent products that have already been invented. Lesson Four: Imagining Description: Students use imagination or creative thinking techniques such as brainstorming or lateral thinking to solve the problem. Lesson Five: Designing/planning Description: Students sketch and experiment with designs and learn how to use assistant tools or grain technical assistance for making models or prototypes. They also prepare materials for the products based on the prototype. By doing this, students can be reassured that their products’ plan/design is correct, thus increasing the likelihood that their invention will work. Their drawing does not have to be perfect, but it should be adequate for them to use to build a working product. Following good designing/planning techniques will save them a great deal of time and effort. Lesson Six: Creating inventions Description: Students create their products based on their prototypes or plans for their inventions by using the materials they have prepared. Lesson Seven: Implementing and adjusting inventions Description: Students test their own inventions. The students should test their inventions several times in as real a situation as possible. Students should be made aware that the inventions might not work the first time. After testing their inventions, students have to improve their inventions using problem identification. Lesson Eight: Share and Protect Your Inventions Description: Students learn about outlets for their inventions. They also learn how to protect their inventions by patenting them. Students present their invention to the public on ‘The Invention Day’.
their project proposals, which showed their problem delineation and proposed solutions, to the class for discussions and critique sessions. Constant feedback from the other students and the teacher helped them improve their invention projects. The teacher guided, advised, and monitored the improvement of the students’ projects from the problem identification and project design to the invention creating and testing. Table 1 shows an outline of eight lessons used in the elective science course based on the Invention Learning Approach. Data collection and data analysis The data in this study were used to answer the research question. Quantitative data collected from pre-test, and post-test were analyzed to answer the research question: Does manipulating the Invention Learning Approach influence students’ inventive abilities? To identify whether the intervention was successful in improving students’ inventive abilities levels within the intervention, nonparametric statistics: Wilcoxon signed-rank test was conducted.
In addition to quantitative data, the method of content analysis of qualitative data collected from follow-up interviews explained and supplemented the initial quantitative results. Semi-structured interviews were used to reveal in-depth information related to the students’ inventive abilities results. The method of content analysis (Zhang and Wildemuth, 2009) was utilized in order to categorize themes that appeared similar in content. This method of analysis revealed a number of themes relating to students’ attitudes and opinions towards the invention learning experience. Each of these themes will now be discussed with examples from the database used as illustrations. Instruments The creative invention performance assessment (CIPA) The Creative Invention Performance Assessment is a performance test simulating components of inventive abilities. The CIPA consists of 13 criteria of two dimensions including process abilities

(5 criteria) and product abilities (8 criteria).The researchers adapted the assessment form based on Besemer and Treffinger (1981) and Wongwanich (2004).This form is an authentic assessment using rubric scoring, analytic score. The student product assessment form of Besemer and Treffingerand Polson Enterprises is an assessment form used for assessing students’ creative inventions including product quality, usefulness, feasibility, the safety of products, consumption/wastage, novelty, and resolution. This form can be used to assess any of the students’ inventions. The performance assessment form of Wongwanich is also an authentic assessment used for assessing students’ skills, including efficiency of the process and accuracy of the process. The 13 criteria with four-point rating scales developed by the researchers are listed with the judgments: very low, low, medium, or high for each item. Examples of the 13 criteria representing the process and product abilities are: Process Issue The student works with quality performance. The student works safely. The student manages his/her time effectively. Product Issue The invention shows a unique solution to a want or need. The invention does not have any negative impact. The invention is the simplest and most attractive it can be. Descriptive analyses will be conducted to obtain mean and standard deviations for inventive abilities levels. The scores will be grouped on the following scale:
Very Low abilities: 1 through 1.50 Low abilities: 1.51 through 2.50 Medium abilities: 2.51 though 3.50 High abilities: 3.51 though 4.00
These scores are based on a cut-off system developed by the researchers. The total score will be identified as very low, low, medium, or high inventive abilities levels. Through review by 7 experts, content validity of CIPA was conducted.
The raters’ report for the test indicated that the test measured what they purported to measure. The CIPA test was modified based on pilot test results with 20 students who possessed similar backgrounds and were required to have the same amount of an elective science course as those who participated in the present study. All of them have previous experience in developing their own inventions. The students had no problem understanding the assignment in the CIPA; the same CIPA materials were used in the test.
Three experts, who were formerly referees of the “Young Scientific Invention Competition”, evaluated the students’ inventive abilities using the CIPA in the pilot study. A Pearson correlation coefficient was calculated for the relationship among the three experts’ evaluating the inventive abilities in the pilot study of the CIPA. A positive correlation was found between Expert 1 and Expert 2, Expert 1 and 3,r = .748, p < .01, r = .751, p <.01, respectively. Another positive correlation was found between Experts 2 and 3, r = .694, p < .01.
The relationship analysis shows that the experts’ assessment of inventive abilities by using CIPA correlates significantly with each other. Results Descriptive Statistics and Levels of Inventive Abilities in
Wongkraso et al. 527 Pre-Post Test Means, standard deviations and levels of participants’ inventive abilities are presented in Table 2.
Table 2 shows that there is an increase in mean scores in every inventive abilities component. Similarly, the experts’ judgment indicated that the post-test levels (Medium) of the students were also higher than pre-test levels in every inventive abilities component. As explained before, the students performed better in the post-test than in the pre-test (Very Low). The comparison of students’ inventive abilities in pre-post tests Table 3 shows the result for nonparametric statistics: Wilcoxon signed-rank test indicated the post-test scores of students’ inventive abilities were significantly higher than pre-test scores at the .01 level. The comparison of pre-and post-test students’ inventive abilities scores on individual growth Figure 2 shows the difference of the inventive abilities scores of each student before and after learning through the Invention Learning Approach. As shown in Figure 2, students’ inventive abilities were significantly improved after the intervention period. Students also had increased levels of inventive abilities after learning through the Invention Learning Approach.
Given the quantitative findings that the intervention displayed performance growth in inventive abilities over time, a qualitative analysis examined the underlying causes and potential undergirding evidence. Using a qualitative analysis on the narratives produced from the transcripts of the follow-up interviews, the findings seem to indicate that students improved in their performance during the intervention phase. The words expressed by the interview participants were a clear indication of their inventive abilities. The theme indicates that these students were able to plan and think creatively. Quotes from participants that support this theme: I think learning in this course helped me a lot to create my quality product. I never knew before how to invent any inventions, but following this process it is not hard for me. I also had many creative ideas to create other inventions. The results of the interview showed that 95.0% or 19 of participants agreed that the Invention Learning Approach was systematic and easy to use. For example, two students revealed the following: I think it [Invention Learning Approach] worked well because it helped me to create my own invention, even though I had a hard time starting or finding my topic. It

528 Educ. Res. Rev. Table 2. Means, standard deviations and levels of inventive abilities in pre-post tests.
Inventive abilities components Full score Pretest Posttest
S.D. Level S.D. Level Process abilities Quality of performance 4 1.34 0.54 Very Low 3.23 0.53 Medium Time management 4 2.02 0.57 Low 3.65 0.64 High The development plan 4 1.30 0.49 Very Low 3.20 0.55 Medium Safety at work 4 1.36 0.43 Very Low 3.20 0.36 Medium Depletion of resources 4 1.36 0.57 Very Low 3.44 0.60 Medium Total 4 1.41 0.45 Very Low 3.24 0.51 Medium Product abilities Product quality 4 1.30 0.44 Very Low 3.16 0.56 Medium Usefulness 4 1.99 0.22 Low 2.80 0.41 Medium Feasibility 4 1.25 0.55 Very Low 3.03 0.60 Medium Product safety 4 2.00 0.00 Low 3.40 0.68 Medium Consumption/wastage 4 1.18 0.44 Very Low 3.11 0.39 Medium Novelty 4 1.20 0.36 Very Low 2.92 0.59 Medium Resolution 4 1.19 0.43 Very Low 2.88 0.57 Medium Elaboration 4 1.89 0.37 Low 3.23 0.48 Medium Total 4 1.46 0.41 Very Low 3.15 0.54 Medium
Table 3.The comparison of students’ inventive abilities in pre-post tests. Inventive abilities N Mean rank Sum of ranks Z Negative ranks 0 .00 .00
3.921** Positive ranks 20 10.50 210.00
**at the .01 level of significance.
Figure 2.The comparison of pre- and post-test students’ inventive abilities scores on individual growth.

was not difficult to do. The method taught us directly and systematically. It is not hard to use. The other student also revealed: I believe that this method [Invention Learning Approach] in this class is really an effective way for teaching how to invent inventions. Also I think for invention projects, a working project is fantastic because everyone has their own useful project that we could not get in another course. Some students found that the Invention Learning Approach not only helped them to increase their inventive abilities, but also increased their levels of self-esteem and self-efficacy in inventive abilities. For example, one student revealed the following: I did so badly in the pretest. I used to think my abilities about inventions were so bad. I was not an outgoing person. I do not always feel confident in myself to do any assignments. I have learned in this class. I learned a lot about how to work like an inventor. I felt that working on the invention projects and in learning groups helped to build up my self-esteem. One student who attained one of the highest overall averages in inventive abilities also revealed: By working on the invention project, the process in this course not only helped me to create my interesting inventions, but also made me comfortable. I feel good when learning in this course. It helped me to reduce my stress when I had difficult situations, especially when I produced original ideas. It gave me a chance to believe that I have the ability to do something like a great inventor did. A result of the interviews found that the Invention Learning Approach also helped the participants generate more inventive ideas and inventions (100% participants said “Agree”). Like other inventors, the participants also know how to invent creative products. The students’ responses revealed that learning through the Invention Learning Approach is helpful for enhancing inventive abilities to facilitate their creative performance. The participants seemed confident in what they had done and who they had become. On the other hand, 90.0% (n = 18) of the participants were determined to have had positive overall attitudes toward their inventive learning experience and 10.0% (n = 2) were regarded as being ambivalent. One student declared, “I have really enjoyed this course, especially working on the invention projects. I feel it has given me an opportunity to invent a useful product.”Yet another student reasoned, “By working in this class, my stress and anxiety was reduced because I
Wongkraso et al. 529 feel more free and comfortable to do my own job than other subjects like Math or English. We just focus only in our invention projects. We don’t worry about any exams.” DISCUSSION The main question addressed in this study was whether the use of the Invention Learning Approach would improve inventive abilities. The quantitative data revealed that participants had significant growth in inventive abilities over intervention time, which was consistent with findings in previous invention studies (Shlesinger, 1980; Westberg, 1996; Roll, 2009). The post-test scores of students’ inventive abilities were significantly higher than pre-test scores. This was because the students were allowed to focus on designing and inventing their own individual invention projects based on the idea of Constructionism that allows students to learn about a subject by ‘learning-by-designing’ and ‘learning-by-making’ (Papert, 1993). This finding is in agreement with Westberg’s (1996) findings, which showed that the students who received instruction in the inventing process developed a significantly greater number of inventions than students who received only an introduction. Additionally, this research illustrated the fact that the Invention Learning Approach based on Constructionism can be a powerful starting point in developing learning environments and technology. According to the learning outcomes, it is suitable to teach students with the Invention Learning Approach because this learning approach provides them with an opportunity to plan, design, conduct, and invent their own interesting projects. The quantitative findings were supported by the qualitative analysis. The qualitative findings portrayed the participants’ viewpoints and experiences with respect to how the Invention Learning Approach assisted with their inventive thinking. Conclusion This study outlines an approach to teaching invention. The aim of the research was to present and prove the new concept of the Invention Learning Approach. As defined in this paper, the Invention Learning Approach is a specific learning approach that supports invention discovery via knowledge creation, adaptation, and exploits. Thus, the question regarding the nature of knowledge behind inventions becomes essential.
To conclude, both qualitative and quantitative results indicated that the students developed their inventive abilities during the elective science course by using the Invention Learning Approach. This study’s Invention Learning Approach can be further extended to other courses and subjects. It is proven by this research that

530 Educ. Res. Rev. students’ inventive abilities can be improved. In the future, research can be conducted to understand other aspects of learning, such as creative thinking, cooperative learning, and so forth in the context of invention learning. Additionally, we hope this research has provided some fundamental understanding for future research. ACKNOWLEDGEMENT This study was part of a curriculum development project, undertaken jointly by the Promotion of Teaching Science and Technology (IPST) and the Faculty of Education, Mahasarakham University. We would like to thank the Institute for the Promotion of Teaching Science and Technology (IPST) and the Faculty of Education, Mahasarakham University for their financial support. Conflict of Interests The author(s) have not declared any conflict of interests. REFERENCES Besemer SP, Treffinger DJ (1981). Analysis of creative products:
Review and synthesis. J. Creat. Beha., 15:158-178. http://dx.doi.org/10.1002/j.2162-6057.1981.tb00287.x
Boeije H (2010). Analysis in Qualitative Research. London: SAGE Publications.
Creswell JW, Plano Clark VL (2007). Designing and Conducting Mixed Methods Research. Thousand Oaks, CA: Sage.
Frankovits N, Luton LG, Evans G (2002). Craftsman/NSTA young inventors awards program teachers guide. Third edition.ERIC Document Reproduction Service No. ED 462 299.
Gorman ME, Richards LG, Scherer WT, Kagiwada JK (1995). “Teaching Invention and Design: Multi-Disciplinary Learning Modules”. J. Eng. Educ. 84(2):175-185. http://dx.doi.org/10.1002/j.2168-9830.1995.tb00164.x
Henwood K, Pidgeon N (1994). Beyond the qualitative paradigm: A framework for introducing diversity within qualitative psychology. J. Com. Ap. So. Psy. 4:225-238. http://dx.doi.org/10.1002/casp.2450040403
Kuehn C (1985). An analysis of fifth and sixth grade students’ acquisition of the process of inventing.Dissertation Abstracts International, 46, 3672-A. (University Microfilms No. DA8529295)
Kuehn C, Krockover G (1986). An analysis of fifth and sixth grade students’ acquisition of the inventing process.ERIC Document Reproduction Service No. ED 276 618.
Lincoln YS, Guba, EG (1985). Naturalistic Inquiry. Newbury Park, CA: Sage.
Lyon E, Coyle A (2007). Analysing Qualitative Data in Psychology. London: Sage.
Martinez SL, Stager G (2013).Invent to Learn: Making, Tinkering, and
Engineering in the Classroom. Constructing Modern Knowledge Press.
McCormack A J (1984).Teaching inventiveness. Child. Educ., 60:249-255. http://dx.doi.org/10.1080/00094056.1984.10520658
Office of the Board of Science, Technology and Innovation Policy (STI Policy Office) (2011).Status of Thailand STI indicators and Policies. Bankok: STI Policy Office.
Papert S (1993). The Children’s Machine Rethinking School in the Age of the Computer. New York: Harvester Wheatsheaf.
Plucker JA, Gorman ME (1999). Invention is in the mind of the adolescent: Effects of a summer course one year later. Creat. Res. J. 12(2):141-150. http://dx.doi.org/10.1207/s15326934crj1202_6
Roll I (2009). Structured Invention Activities to Prepare Students for Future Learning: Means, Mechanisms, and Cognitive Processes.Ph.D. Thesis, Pittsburgh, PA.
Rule AR, Baldwin S, Schell R (2009). Trick-or-Treat Candy-Getters and Hornet Scare Devices: Second Graders Make Creative Inventions Related to Animal Adaptations. J. Creat. Behav., 4:149-168. http://dx.doi.org/10.1002/j.2162-6057.2009.tb01312.x
Saxon JA, Treffinger DJ, Young GC (2003). Camp invention: A creative, inquiry-based summer enrichment program for elementary students. J. Creat. Behav., 37(1):64-74. http://dx.doi.org/10.1002/j.2162-6057.2003.tb00826.x
Shlesinger BE (1980). I Teach Children to be Inventors. Educ. L. (April): 572-573.
Shlesinger BE, JR (1982). An untapped resource of inventors: Gifted and talented children. Elementary Sch. J. 82: 215-220.
Shlesinger BE, JR (1987a). How to Invent: A Text for Teachers and Students. New York: IFI/Plenum.
Shlesinger BE, JR (1987b). Teaching problem solving through invention.Voca. Educ. J., 65, 36-37.
The Lemelson-MIT Program (2003). Advancing Inventive Creativity Through Education. Workshop Report and Notes of the Discussion. Lenox, Massachusetts.
United State Department of Commerce. (1997). The Inventive Thinking Curriculum Project. Washington, DC: U.S. Patent and Trademark Office.
Westberg KL (1996). The Effects of Teaching Students How to Invent.J. Creat Behav. 30:249–267. http://dx.doi.org/10.1002/j.2162-6057.1996.tb00772.x
Wiener N (1993). Invention:The Care and Feeding of Ideas. Cambridge, MA: MIT Press.
Wongkraso P, Sitti S, Piyakun A (2013). A Study of Invention Development Process and Invention Instructional Management Process Based on Constructionism in Thailand. In C. Shoniregu, & G. Akmayeva (Eds.), Proceeding of London International Conference on Education (LICE-2013). London: Infonomics Society.
Wongwanich S (2004). Performance Testing. Bangkok: Chulalongkorn University Press.
Zhang Y, Wildemuth BM (2009). Qualitative analysis of content.In Applications of Social Research Methods to Questions in Information and Library Science, 308-319. Westport, Connecticut: Libraries Unlimited.

Vol. 10(5), pp. 531-540, 10 March, 2015 DOI:10.5897/ERR2015.2120 Article Number: 5523D1651081 ISSN 1990-3839 Copyright © 2015Author(s) retain the copyright of this article http://www.academicjournals.org/ERR
Educational Research and Reviews
Full Length Research Paper
The effect of the courses of school experience and teaching practice on primary school mathematics
teachers
Aksu Hasan Huseyin
Giresun University, Education Faculty, Department of Primary Education, Türkiye.
Received 04 February, 2015; Accepted 25 February, 2015
The aim of this study is to determine elementary mathematics teachers’ thoughts and feelings on the courses of school-experience and teacher-practice. In this study was used the qualitative research method. Those involved in the study were 20 mathematics teachers employed in formal/government primary schools in the Province of Giresun and in the town of Bulancak in the academic years of 2010-2011. As a means of data collection, a semi-constructed interview form was used in the study. The data obtained were analyzed through the content-analysis-technique. The data obtained from the study indicated that primary-school mathematics teachers were faced with such problems in the courses of school-experience and teacher-practice as experience, the physical structure and managerial affairs of the school, observation, teaching-learning process, measurement and assessment, duration, communication and worry. The data also showed that the courses of school-experience and school practice they took during their school-years provoked their interest in their jobs, provided them with a close observation of a school, its classrooms and students. Key words: School experience, teacher practice, mathematics teacher, pre-service education.
INTRODUCTION Currently, constant developments in the field of informatics, technology and values and demands changing in parallel with the ongoing developments require a great number of changes in education as well as in other fields. New tendencies in the field of learning lead to alternative measurement and evaluation techniques besides traditional learning and evaluation methods. Considering the changes in the field of education, the Ministry of Education (ME) started to apply a new primary education program in the educational year
of 2005-2006. It is the teacher who is to apply the new program, take over the role-play in the process of an efficient, effective and systematic education and training. As one of the basic indicators of quality and efficiency in education is the quality of teachers involved in educational process, the basic condition of a qualitative education is to train qualitative teachers (Chapman and Miric 2009; Adıgüzel and Sağlam, 2009; Moreira and David, 2008). The quality of teachers is of great importance in obtaining excellent students and leading
E-mail: [email protected]. Authors agree that this article remain permanently open access under the terms of the Creative Commons Attribution License 4.0 International License

532 Educ. Res. Rev. them to success.
The literature in the field provides you with great number of characteristics that a qualitative teacher should have. Some of them are self-esteem, encouragement, motivating students, using teaching activities suitable for the class, controlling the class, creativity, activities, good leadership, trustworthiness, being an organizer, good communication skills and having a good sense of humor (Pedry et al., 1998; Cullingfor, 1995; ext. Demircioğlu, 2010; Efe et al., 2008; Demirtaş and Güneş, 2004). On the other hand, training creative teachers who can think efficiently, having the ability of problem solving, being able to produce alternatives and thinking critically will facilitate applying primary education program containing new approaches (Kaur, 2008; Panizzon and Pegg, 2008). The method and technique used by teachers should be designed according to the age group taught. They should also be made to pay attention to the issue within the individual preference of students (Cross, 2009). Professionalism is the leading feature needed in teaching. However, there is no other profession that makes professionalism almost impossible except for teaching. In a clinic where there is no optician, a urologist can never do the job for an optician. Even though there is a decrease in this perception, the philosophy that anybody can become a teacher is still widespread. In addition, it is a fact that many lecturers working at the faculties of education do not have educational expertise in education (Alton, 2010, p:2). Teacher training is a comprehensive and multidimensional issue. Selection of prospective teachers, pre-service training, and application period and follow-up and evaluation studies in this period is of great importance. In-service training issues are all regarded in the concept of teacher training (Kavcar, 2002). Pre-service training plays a significant role in training qualitative teachers. These programs facilitate the transition into actual educational process from university education and provide a suitable and balanced distribution of teaching-learning activities between theory and practice (Çoban, 1999). The problem of teacher training is one of the most significant troubles of many countries. The solution for these troubles is to train quality teachers for primary education. It is the teacher who keeps the educational system working and makes children attain the behaviors desired and become a guide in forming their personalities and characters. The most important task expected from teachers is to train individuals at desired features and competency within the framework of social expectations and in terms of the objectives of national education (Özerbaş, 2009). As there are great expectations, it is necessary not to create any problems that the issue of teacher training should be taken into consideration in a serious way since teachers are social architects.
The quantity and quality of the education given at schools are the two significant topics mostly discussed in
Turkey as well as in the world. One of the leading factors that have an impact on education is the teacher. In this sense, increasing the quality of education depends primarily on the awareness of the competencies a teacher should have and then making the prospective teachers attain these competencies as pre-service education (Erdem, 2005). The reality known by most is that if teachers are not equipped with the knowledge, skills and behaviours required in the profession of teaching, the students they will train will lack of all these; since the quality and success in education is a reflection of the quality and success of the teacher (Baştürk, 2009). Therefore, the teacher and teacher training have become significant and training qualitative teachers is primarily considered within the problems.
The course of school experience is carried out as a course with one-hour theory in primary mathematics faculties and four-hour application at schools. Lecturers teach prospective teachers what to do with the activities in the courses carried out at faculties and organize discussions on the observations, applications and the draft reports prepared by them. In this way, the prospective teachers are able to know their shortcomings and have a chance to compensate for hem. As for the four-hour applications at schools, they carry out the observations, interviews and applications required for their activities they would like to do. At the end of each activity conducted at school, the prospective teachers prepare a report and present it to the lecturer (Yiğit, 2006). Therefore, the prospective teachers are able to transfer the theoretical knowledge they learned during the process of teaching and they will be prepared for the Course of Teaching Application they are to have in the following semester.
In the final year of the teacher-training school, all prospective teachers have to be involved in the Course of Teaching-Practice and School-Experience to get prepared for the profession of teaching. In the course of teaching-practice, prospective teachers have an opportunity to carry out teaching-practice in various classes in the practice-schools, learn much about the teaching program of the related field, the course books and the techniques of measurement and evaluation, and also to share and improve the experience they have during practices in order to gain the experience of teaching (YÖK, 2008). The guidance teacher or the lecturer is the person who evaluates the prospective teacher. The prospective teacher is provided with the necessary back-up and he or she tries to carry out his/her studies in line with the support that they get.
It is essential that the tripod of the guidance teacher, the college-lecturer and the prospective teacher who are the basis of the program should be conscious of the role they play and the responsibility they have taken over and work in a constant communication and in a planned and coordinated way so that the process of school experience and teaching practice carried out within the framework of

faculty – school cooperation can reach the desired success (Beck and Kosnik, 2002; Burton, 1998). This is because each leg completes and supervises the others in the system. As is known, it is due to the courses of school experience and teaching practice that prospective teachers, the most important leg of the system, are able to realize to step into the occupation, to adapt to the school and to observe the theoretical knowledge they learned at school and practice. It is of great importance to examine the views of teachers who officially work and personally experience the process in order to make the gains more active, eliminate the problems faced and make new arrangements.
The current study was carried out to determine the feelings and ideas of teachers over the courses of school experience and teaching practice. It is believed that the research would make a contribution to teachers having pre-service training. In addition, the research focused on teachers’ views on the Courses of School Experience and Teaching Practice in detail, contributing to the literature. The research will make a positive contribution to prospective teachers before they are actively involved in teaching. METHODOLOGY OF RESEARCH Research model In the research, a case study, one of the qualitative research methods, was used. Determining and solving the problems faced during the application is possible through a case study. Since the researcher is near the data, he gets to know the process and feels it closely, allowing his research to be flexible (Yıldırım and Şimşek, 2006). In such studies, the purpose is not to make a generalization, but to section the current case, to reflect the special case in a way and set a light for the future. Population and sampling In the population of the research were included totally 45 government primary schools, 30 of which are located in the Provincial Center of Giresun and 15 in Bulancak, a neighboring town. These schools were easy to transport to and formally communicate with. The research was conducted in The Fall Semester of 2010-2011 educational term. 20 mathematics teachers who work in those primary schools were involved in the sampling of the research. The sampling was randomly chosen. In fact, at the beginning of the research 25 teachers were selected, but afterwards, five out of these teachers did not want to be interviewed for a number of reasons. Out of these teachers involved in the research, 8 were men and 12 were women. The teachers interviewed were chosen from two locations to determine whether the method of alternative measurement and evaluation differed depending on the location. Data collection instrument The data were collected through a semi-structured interview to determine the views of teaches over the courses of their school experience and teaching practice. The studies carried out in the field were examined during the process of developing the form.
Huseyin 533
Related literature was examined and the questions of interview were formed in line with the knowledge obtained. The latest version of the interview form was determined by taking the views of the lecturer and primary school mathematics teachers. The latest version of the form comprised seven open-ended questions. The interviews carried out by the researchers lasted for about 20 min and the data were recorded by the researcher by writing down. The reliability of the interview was controlled by coding the data obtained by the two researchers and it was found they agreed at 82% for each question. Content validity of the questions prepared was obtained by getting the views of the experts in the fields of education and educational sciences.
Since the research was a qualitative study and the data collection instrument was made up of open-ended questions, content analysis was used to evaluate the data obtained (Türnüklü, 2000). The data collected were read line by line and they were coded. Then the codes were combined and common points were determined, so the themes (categories) that would form the main lines of the research findings were determined. The themes determined were examined in relation to each other and given in line with the wishes of the researcher. In order to support the comments made by the researcher and reflect the point of views of the participants, some quotations from the interviews were given. Following the quotations, such coding as teacher 1 and teacher 2 were made in order to determine the personal and professional features of the participants. RESULTS All the answers given by primary school mathematics teachers included in the research were analyzed in order to find common themes. Their views of school experience and teaching practice were given in Table 1 with their examples of their expressions written as two separate themes depending on their positive and negative ideas.
As given in Table 1, primary school mathematics teachers expressed 8 positive views while there were 20 other teachers with negative ideas. Among these ideas were such views saying that it was beneficial, it was the first step to the profession, it did not reserve the necessary attention, observation was boring, classical method was mostly applied and that it was tiring. In addition four other teachers pointed out that there was no coordination between the responsible teacher at the faculty of education and the counselors at the primary schools; so it caused some troubles in terms of prospective teachers.
The sub-themes under the positive views of primary education mathematics teacher are given in Table 2 with written expressions.
As given in Table 2, views were collected under 3 sub-themes. The positive view expressed by the primary school mathematics teachers were over attaining experience at teaching. Teachers pointed out that they attained experience at the courses of school experience and teaching practice; their self-esteem increased and had a chance to share experience. Secondly, mathematics teachers expressed that they had a chance to make an adequate observation over school, class, student and teachers. Another topic mentioned by the teachers was that the physical structure of the school

534 Educ. Res. Rev.
Table 1. The themes of school experience and teaching practice course.
Themes and number of teachers Sample expressions
Positive views over the course (8 Teachers)
“The courses of school experience and teaching practice contributed me much, I had experience” “I felt as a real teacher at school” “It was useful as it showed how theoretical knowledge should be turned into practice. “ It was an opportunity to see how a teacher should be”
Negative views over the course (20 Teachers)
“I believe practical courses do not have the enough attention they deserve”. “Making an observation during a whole semester bored me much” Counsellors did not have enough sufficiency at practicing schools” The fact that teacher still use direct teaching do not overlap even though teacher program changes” “Our being last grade and having other courses make the things harder” “
Table 2. Positive views regarding school experience and teaching practice. Sub-themes and teacher Sample expressions
Teaching Experience (7 Teachers)
The practical courses made a great contribution to me. I felt as if I were the real teacher”. “I had experience in teaching profession” “I had experience” “I benefitted from the experience of the teacher” “My belief to become a teacher increased” “The guidance of the teacher in the practicing school increased my attention to the profession”
Physical Condition of the School and Administrative Affairs (4 Teachers)
“ As the school I practiced at was newly constructed inner and outer facilities of it was good and it was technologically equipped”. “School playground was sufficient for the students to have a rest and there were areas to play football, basketball and volleyball.” “Technological equipment was enough it was not used adequately. “ “The Collaboration between school and faculty was good.” “Official work was completed when I went to the school”.
Observation (6 Teachers)
“I had a chance to observe educational activities closely. “The students was thinking of the courses positively” “I coincided with real problems.” “I had a chance to get to know about the school, classroom, teacher and students closely.” “I saw how to teach at the levels of the students” “ I observed how teachers behaved towards students”
was good and they did not have any problem with it, and they did not have any problem with the administrative affairs, either.
The sub-themes under the negative views of primary education mathematics teacher are given in Table 3 with written expressions.
As given in Table 3, it is clear that the views of primary school mathematics teachers concerning the courses of school experience and teaching practice were divided
into eight sub-theme categories. In terms of teaching experience, teachers expressed such ideas as insufficient and lacking application, being dull and monotonous, having no connection between theory and practice, and not paying enough attention to the courses by the guidance teacher and the prospective teacher. In addition, these teachers pointed out that the negative conditions had an impact on them and led them to thinking negatively about the profession of teaching. In

Huseyin 535 Table 3. Negative views regarding school experience and teaching practice. Sub-themes and number of teachers
Sample expressions
Teaching Experience (13 Teachers)
“Practical courses did not make so much a contribution to me. Guidance teachers are carrying out their personal things thanks to us” “This course is lacking and insufficient in terms of teaching profession. Prospective teachers go to school sometimes and they sometimes skip. Guidance teachers are happy about it. The counselors are not informed about it. Both sides seem not to have perceived the importance of the issue”. “School experience was especially so boring. I got tired of watching mostly the same things every week. “I don’t believe the practice made a contribution to me. As far as I observed, there is a great difference between what we learned and the applications at school. There is no relationship between the theory and practice”. “Lecturers regard this course as an insignificant course. They think that any lecturer can teach this course at the faculty. Some teachers are unaware of the application group, while some others do not know about the practicing schools. In short, neither the experience of the counselor, nor the guidance teacher at the school made me a contribution”. “Practicing activities made me cooler against the profession of teaching. Things I encountered at the school I went for practicing were so bad. Students were all naughty and classroom management of the teacher was so bad. Actually, I sat on egg.”
Physical Structure of the School and Administrative Affairs (8 Teachers)
“I did not learn almost anything in terms of legislation”. “The cooperation between the faculty and school are connected very late at the beginning of the semester. Naturally, it leads to problems in the procedure and make the things move very slowly. It is necessary that cooperation should be connected urgently. “There is a strict upper and lower class relation between the teachers and the administration. So this case affects us.” “We had some hesitations in entering the teachers’ room in the practicing school. Teachers behaved us like a student, not like a teacher.” “Administration and other teachers were not warm in their relations with us. They disdained to talk to us”. “The school lacked many things in terms of equipments. Therefore, teachers preferred classical methods”. “The physical structure of the school, both inside and outside was not so good. Administration did not pay attention to this. Physical environment is very important”.
Observation (10 Teachers)
“I do not want to be a teacher any more due to the negative behaviors I observed while the teacher was teaching”. “Watching mostly the same behaviors every week was boring. Instead, it is necessary to increase the practice”. “I was scared of the students. I got the idea that teaching is hard to do”. “My observation of over-undisciplined teacher and students had an impact on my views over practicing courses”. “The fact that practicing courses, which are of great importance at pre-service teaching education, were not regarded as an important topic made me think negative on teaching profession”.
Teaching – Learning Process (14 Teachers)
“Guidance teachers at schools use the presentation method as the only method”. “I have never experienced many applications of the methods and techniques we learned at school. Teachers use a uniform teaching method.” “Teachers only use such methods as question-answer and direct method”. “Teachers use traditional teaching methods at school. They strictly base on course books.” “Teachers usually cannot control the class while teaching. Classical method is that teacher writes on the board and students take notes in their notebooks. Students are noisy while teacher is writing on the board.” “The communication between students and teacher was not so good. They were in an indifferent mood mutually.” “They were not using alternative Measurement and evaluation techniques. They did not have enough experience and knowledge to apply them. They were resisting to apply the new changes proposed by the new program.”

536 Educ. Res. Rev. Table 3. Contd.
Measurement and Evaluation (10 Teachers)
“I did not have any evaluation from my counselor at the practicing school about correct and incorrect applications of me after practicing.” As the teacher at the school did not listen to us so did not make a comment on my application. Therefore, I wasn’t able to learn my mistakes. It would be good, if I had learned them. “My guidance teacher was busy with other things in the teachers’ room while I was teaching in the class. Sometime he would give the control of the class to me when he had things to do out.” “One of the things my guidance counselor lacked was that he did not make any comment after presentations. It naturally prevented me from developing.” “As my teacher did not listen to me while teaching, the form of observation was filled in formality. It is against the criteria of measurement and evaluation”. “Teachers did not read what was in the form or seldom read while filling it out”. “Teachers in the same school with different groups would give different marks and I believe that it results from the fact that they regard this course as trivial”. “Practicing takes much of my time and as we have to deal with other courses at the faculty it leads to negative results”. “Practicing is not sufficient. The time is not enough to improve my knowledge and experience”.
Duration (6 teachers)
“It is meaningful that teacher training in European countries is carried out as post graduate degree whereas it is carried out in a limited time”. “Practical courses used to be taught as “School Experience I”, “School Experience II” and “Teaching Practice”. It was decreased to two courses as “School Experience” and “Teaching Practice”. I believe that shortening the duration has a negative impact on the application”.
Communication (9 Teachers)
“The schools we were going to practice were determined a bit later. When we arrived at the school, our names had not been given to the administration. It shows that there was a lack of communication between the faculty and the school”. Counselor and the teachers at school should be more attentive and effective. Large numbers in the groups has a negative effect on the communication between the counselor and the guidance teacher.” “Teachers at schools do not know the counselors at faculties. There is a cut off in the communication. Naturally, there is an uncertainty.” “There is no communication between the counselors at the faculties. As in the courses, two teachers teach the same course but learning outcomes are totally different. They should take some precautions to increase the communication between them.” “Even though we practice at different schools, what we do doesn’t have something in common. Our friends are asked different things and we are asked different things. The difference at practicing schools is the main problem. This shows that there is a cut off in the communication.”
Problems Concerns (8 teachers)
“The guidance teachers at practicing school feel a pressure of PT (Placement Test) on them. They are even disturbed that we are in the classroom.” “As teachers teach depending on a certain plan and program, they believe that students will have harm in this program”. “The guidance teacher at the practicing school has a concern over teaching all the subjects in time.” “Fourth grade students at the faculties have an anxiety of KPSS (Civil Service Examination), so we cannot go to the practicing classes so often. Without solving this problem, I don’t believe practice will have enough attention.”
terms of physical structure and administrative affairs of the school, it was pointed out that some schools lacked many things physically, there was nothing to help them in the legislation and that there was a ranking system among the administrators, guidance teachers and prospective teachers. As for teachers, they pointed out that they got rid of the same behaviors every week, the profession of teaching was not so easy, and students were naughty and undisciplined and that their interest in the profession decreased. In terms of teaching-learning sub-theme, it was found that most of the teachers did not use teaching methods, the only things they used were
presentation and question-answer method, they did not use any other source material expect for course books and that they preferred straight and simple way of teaching and learning process. In addition, teachers pointed out that alternative measurement and evaluation techniques, which are the latest changes in the program, were not applied. Regarding the measurement and evaluation of the courses of school experience and teaching practice, teachers indicated that guidance teachers did not participate in the applications in the classroom, while some others did it in a limited way and so they did not give any feedback or kept it short as a

Huseyin 537 Table 4. Recommendations concerning the courses of school experience and teaching practice. Themes and number of teachers Sample expressions
Measurement and Evaluation (12 Teachers)
“Practicing files should be evaluated by only one person” “Evaluation criteria should be reviewed” “An measurement and evaluation unit should be established at the faculty” “Some seminars should be given to the lecturers at the faculties and the guidance teachers at schools” “Teachers with a practice group should come together at the beginning of semesters and they should determine common criteria” “Lecturers should have fewer students”
Duration (7 Teachers)
“The duration for practice should be longer” “The course of school experienced should be put in the second semester of the second year to make student like their profession” “Final year of the education should be designed as practical year as in the faculties of medicine”. “The day and hour for practice at the faculty and the day and hour of mathematics at school should be at the same time.” “All the mathematics classes at 6th, 7th and 8th grades should be visited” “In order to use the time more efficiently, there should be practice schools at the faculties of education as in the faculties of medicine.”
Communication (15 Teachers)
First of all, guidance teachers should be selected carefully. If possible, students should be allowed to choose them. “The qualities of teachers should be taken into consideration while choosing schools.” “There should be more faculty-school cooperation” “Some precautions should be taken to increase the cooperation between lecturer counselor – guidance teacher and prospective teacher. Introduction and cooperation activities should be organized”. “Students should be sent to different schools each year.”
formality. This has a negative impact on the profession of teaching.
Additionally, lecturers at the faculties pointed out that some guidance teachers did not read the practicing files, some did it partially and some others read it completely and marked the prospective teachers. Some stated that the number of prospective teachers per guidance teacher was high and that the time to evaluate was short. As for the sub-theme of duration mentioned above, six teachers pointed out that the application was short, the time was not sufficient, the number of courses should be three instead of two and the education level should be as post graduate. In the communication sub-theme, teachers expressed their views as deciding on the practicing schools very late, lack of communication between faculty and school, guidance teacher and counselor lecturer, no relation between the applications, no cooperation between lecturers, having different wishes, presence of lecturers who cannot differentiate between school experience and teaching practice.
Finally, teachers expressed that guidance teachers felt a pressure of PT upon them and had an anxiety of not completing the program in time. Also, practicing students did not pay enough attention to the courses which are of vital importance in the profession of teaching, as they are doing KPSS courses; naturally they gave the priority to civil service exams. In other words, prospective teachers cannot focus on the courses of school experience and
teaching practice adequately under the pressure of civil service exam courses. This is the reason why prospec-tive teachers are not willing to apply the courses of school experience and teaching practice.
The recommendations of primary school mathematics teachers to make the courses of school experience and teaching practice more effective and systematic are presented in Table 4 in their own expressions.
As given in Table 4, the recommendations of primary school mathematics teachers over the course of teaching practice were divided into three themes. The recommen-dation given by the teachers mostly was communication. Other recommendations were; being careful in the selection of guidance teachers, the quality of the practic-ing school, increasing the cooperation between the faculty and school administration, having an active and constant relation between lecturer and guidance teacher, keeping the evaluation criteria updated, having a center of measurement and evaluation, determining the criteria at the beginning of the semester by the lecturer and designation of fewer groups to the lecturer in order to carry out a healthier measurement and evaluation. Finally, primary school teachers recommending about the duration expressed that the duration of the application should be increased, last year should be designated as a practice year, the application day of the faculty should be at the same time with primary school courses at the school, there should be a school of practice at the

538 Educ. Res. Rev. faculties, and indicated that they believed the problems emerging in the application would be able to be solved in that way. DISCUSSION AND CONCLUSION The findings in the current study suggest that primary school mathematics teachers had more negative ideas about the course of school experience and teaching practice than positive ones. This result is an indicator that primary school mathematics teachers were not happy about the application of these courses. In a similar study, Eraslan (2009) found that teachers had some negative ideas such that they were not able to find enough opportunity at the courses of school experience and teaching practice, they could not have enough feedback regarding the applications they carried out, they could not relate basic mathematics courses and with the school mathematics; on the other hand, they had few positive ideas such that they benefitted from the courses, they were able to contact the students.
According to the data in Table 2, the positive views of the teachers over the courses of school experience and teaching practice focused on teaching experience, physical structure of the school, administrative affairs and observation. Mathematics teachers pointed out positive views such that they had experience of teaching, their interest in the profession increased, they thought the physical structure of the school was good, there was a good cooperation, they observed the school, the class, the students closely. In addition, teachers indicated that they had a chance to observe the profession closely, observed how students behaved in the real school environment; they liked the profession due to the school experience and teaching application courses. Altınok and Eskimen (2011) found in their study that teachers observed the profession closely, they were willing to do the profession and they liked it due to the application of the courses of school experience and teaching practice. Erkan and Severcan (2010) pointed out in their studies that teaching practice increased the belief that prospective teachers could carry out the profession successfully by attaining self-esteem.
Primary school teachers included in the study expressed their ideas about school experience and teaching practice and indicated their criticism clearly about the problems of experience, physical structure of the school and administrative affairs, observation, teaching and learning process, measurement and evaluation, duration, communication and anxiety (Table 3). The criticism the teachers mostly put forward about the school experience and teaching practice were that teachers use a uniform teaching method and technique; they are strictly bound to the course books; they cannot control the class; they use classical evaluation techniques, they do not apply the changes in the new
program. Özgen (2008) pointed out in their study carried out during teaching practice of the prospective teachers that prospective teachers were not able to observe the new components introduced by the new program for the mathematics course.
In addition, the fact that prospective teachers have an anxiety of KPSS (civil service exam) and that the guidance teacher at the practicing school has an anxiety of preparing the students for the PT and complete the subjects in time make the activities to be applied in the courses of school experience and teaching practice. Therefore, the courses of school experience and teaching practice do not get enough attention they deserve and teachers do not pay much attention to benefit from the applications as much as possible while they are studying. This result shows a parallel with the study carried out by Eraslan (2009).
Another result shows that teachers cannot benefit from the experience of the lecturer counselors at the faculty and the guidance teacher at the school as much as is desirable during their education. It was pointed out that practicing teachers often did not come to class and they did not give feedback in their presence in the class or give it in a limited amount. It was expressed that the faculty-school cooperation under the communication sub-theme was problematic. It was indicated that the problems were mostly experienced in the triangle of teacher, the guidance teacher at the practicing school and the lecturer counselor at the faculty. The poor coordination between faculty and school leads to late determination of the practicing schools and to the lack of communication between the institutions and people. In their study carried out to find out the problems in the course of teaching practice, Dursun and Kuzu (2008) found a result that there is a lack of communication between the lecturer and guidance teacher and this should be eliminated. This result is parallel to the ones in the current study. In another study that supported this research by Gök and Sılay (2004), they pointed out that 32% of the prospective teachers agreed that faculty-school cooperation does not go on in a healthy way. It was focused in the research that the insufficient and limited time has a negative impact on making prospective teachers attain knowledge, skill and experience in the teacher training process. Even though the preparatory education of teachers is different in various countries in different duration, prospective teachers are trained at the level of post-graduation (Şişman, 2009). In addition, it was found that physical structures of some schools were insufficient and administrators behaved prospective teachers as a student not a teacher.
As for the recommendations of primary school mathematics teachers over school experience and teaching practice courses, the recommendations put forward by the teachers over elimination of the negative things in the process are of great importance. The most striking recommendations were an increase in the

cooperation between faculty and school, cooperation between counselor and guidance teacher, being more attentive in the selection of the practicing schools. As is known, the courses of school experience and teaching practice have three important legs. These are prospective teacher, responsible lecturer at the faculty of education and guidance teacher at the practicing school. As stressed in many researchers, the lecturer at the faculty of education has to be in a very close contact with the guidance teacher at the practicing school (Maynard, 2000; Zanting et al., 2001; Gök and Sılay, 2004).
In addition, teachers recommended in the study that a unit of measurement and evaluation should be established at the faculties, seminars should be given to lecturers at the faculty and the guidance teacher over measurement and evaluation, evaluation criteria should be updated, cooperation should be made with the counselors during the evaluation. Arı and Kiraz (1999) recommended that assignment should be evaluated by just one person; Kavcar (1999) recommended that the number of prospective teacher per teacher should be decreased; while Yiğit (2006) said a general evaluation scale should be used for the school experience and teaching application.
Another striking recommendation was that the number and duration of the application courses for the school experience and teaching practice should be increased, the application should be carried out in a full season or in a semester when there are no other courses or there are not in an intense form (field studies, professional knowledge and other cultural courses), just like those applied at the last year of the faculties of medicine. This result supports the findings of the study by Özgür et al., (2009) that the duration of school experience and teaching practice should be increased.
The current work was aimed at making a general evaluation of the school experience and teaching practice courses prospective teachers take as pre-service courses. As a conclusion, primary school mathematics teachers made a great many criticisms for the school experience and teaching practice applied at schools. These views are of vital importance in terms of the fact that application studies should be carried out at faculties and schools successfully; since it is not possible to expect teachers to reach the targets by carrying out an activity they are not happy about. Depending on the fact that teachers have the key role in the process of change, it is also important for the responsible people at the faculties of education and at practicing schools to take the results obtained in the current study into consideration and eliminate the problems in terms of the efficacy of the application. These are the recommendation put forward depending on the results obtained in the current study: 1. The undergraduate program of Primary Education Mathematics Teaching Department, the programs of School Experience and Teaching Practice should be
Huseyin 539 reviewed again and some functional arrangements should be made, 2. The responsible lecturers at the faculties of education and guidance teachers at schools should be made aware of the issue through the workshops to be held at the beginning of the season 3. With the cooperation faculty and schools, prospective teacher, lecturer and guidance teacher should be made more active. 4. The number of the studies to determine the views of lecturers and guidance teachers over the courses of School Experience and Teaching Practice should be increased 5. The last year of undergraduate education could only have a content of application. Conflict of Interests The author has not declared any conflict of interests. REFERENCES Adıgüzel A, Sağlam M (2009 Program Standarts and Accreditation in
Tecaher Training, J. Educ. Faculty, Inönü University, Special Issue. 10(3):83-103.
Altınok Ş, Eskimen AD (2011). Prospective Turkish Language and Literature Teachers’ views On The Course of School-Experience I 2nd International Conference on New Trends in Education and Their Implications (27-29nApril 2011) Bildirileri. Antalyas. 1370-1376.
Arı A, Kiraz E (1999). Problems Faced in The applications of School Experience and proposals for Their Solution. Book of Presentations Concerned With Third Symposium of National Science Education Ankara: MEB Publising House. (307-310).
Baştürk S (2009). The Study of The Course of Teacher Experience in Parallel With Prospective Tecahers’ Views, Primary Educ. on Line. 8(2):439-456.
Beck C, Kosnik C (2002). Components of a Good Practicum Placement: Student Teacher Preceptions. Teacher Educ. Q. 29(2):81–98.
Burton D (1998). The Changing Role of The University Tutor within School-Based İnitial Teacher Education: İssues of Role Contingency and Complementarity within a Secondary Partnership Scheme. J. Edu. Teaching. 24(2):129–146.
Demircioğlu İH (2019). Effective Teacher, School Experience for Prospective Teachers and Teacher Experience and Tecahin Practice. (Ed.: İ.H. Demircioğlu). Ankara: Anı Yayıncılık. s.1-17.
Demirtaş H, Güneş H (2004). School Experience I-II and Activity Preparation Guide for the Courses of Teaching Practices. Ankara: Anı Publications.
Dursun ÖÖ, Kuzu A (2008). Prospective Tecahers and Teaching Staff’s Views on The problems Experienced in the Course of Teaching Practices. Journal of Ahmet keleşoğlu Education Faculty, Selçuk University. 25:159-178.
Efe R Maskan AK, Gönen S, Hevedanlı M (2008). School Experience and Teaching Practice, Anakara: Anı Publications.
Eraslan A (2009). Prospective Primary School Mathematics Tecahers’ Views on Teaching Practice. Journal of Electronics, Science and Mathematics Education, Necati Bey Education Educ. 3(1):207-221
Erdem M (2005). Introduction to Teaching As a Profession, İstanbul: Epsilon Publications.
Erkan S, Severcan S (2010). The Study of Teaching Practice in Terms of Professional Achievements in Line with the Kind of the Institution Where Pre-school Prospective Tecahers received The Course of Teaching Practice, J. Contemporary Educ. 35(376):6-14.
Chapman DW, Miric SL (2009). Education Quality in the Middle East. Int. Rev. Educ. 55:311-344.
Cross DI (2009). Alignment, Cohesion, and Change: Examining

540 Educ. Res. Rev.
Mathematics Teachers’ Belief Structures and Their Influence on Instructional Practices. J. Math Teacher Educ. 12:325-346.
Çoban A (1999). Boundires of Teacher Training When Entering A New Century, J. National Educ. 140:84-87.
Gök T, Sılay İ (2004). Problems Faced At Schools Of Prospective Tecahers’ Teaching Practice, Proposals for Their Solution, Conference of Sciences of National Education (6-9 Temmuz 2004), Malatya. İnönü University.
Kaur B (2008). Teaching and Learning of Mathematics: What really matters to Teachers and Students? ZDM Math. Educ. 40:951-962.
Kavcar C (2002). Branch Tecaher Training In the Republican Period, Ankara University: J. Sci. Educ. Faculty. 35:1-2
Kavcar N (1999). A Study on School Experience, A Book with Papers Presented at 3rd Conference of National Education of Science, Ankara: MEB Publising House (285-289)
Maynard T (2000). Learning to teach or teaching to manage mentors? Experience of school-based teacher training. Mentoring and Tutoring. 8(1):17-30.
Moreira PC, David MM (2008). Academic Mathematics and Mathematical Knowledge Need in School Teaching Practice: Some Congflicting Elements. J. Math Teacher Educ. 11:23-40.
Özerbaş MA (2009). Levels of Responsibility-Implmentation and Material-Use in the Course of Teaching Practice from Prospective Teachers’ Viewpoint. Educ. Sci. Practice. 8(16):179-196
Özgür Z, Bukova-Güzel E, Uğurel I (2009). Picture of the Process of Pre-Professional Experinece in Teaching from the Viewpoint of Prospective Tecahers. J. Educ. Faculty, İnönü University. 10 (3):231-252.
Panizzon D, Pegg J (2008). Measurement Practices: Empowering
Mathematics and Science Teachers in Rural Secondary Schools to Enhance Student Learning. Int. J. Sci. Math. Educ. 6:417-436.
Şişman M (2009). Teacher Proficiency: A Modern Discourse and Rhetoric. J. Educ. Faculty, İnönü University. 10(3):67-82.
Türnüklü A (2000). A Qualitative Research Technique To be effectively Used in Educational Science Research: Interview. Educ. Manage. 6(4):543-559.
Yıldırım A, Şimşek H (2006). Qualitative Research Methods in Social Sciences, (6th Edition), Seçkin Publication, Ankara.
Yiğit N (2006). The place and Importance of the Courses of School Experience and Teaching Practice in Teacher Training. School Experience and Teaching Practice From Theory to Practice (Ed: N. Yiğit), Trabzon: Celepler Matbaacılık. P. 2-14.
Yiğit N (2006). The Preparation and Measurement of Practice-Assignement in the Courses of School Experience School Experience and Teaching. Practice From Theory to Practice (Ed: N. Yiğit), Trabzon: Celepler Matbaacılık. P. 42-58.
Zanting A, Verloop N, Vermunt JD (2001). Student teachers' beliefs about mentoring and learning to teach during teaching practice. Bri. J. Educ. Psychol. 71:57-80.

Vol. 10(5), pp. 541-546, 10 March, 2015 DOI:10.5897/ERR2014.2036 Article Number: 0CB7A2951084 ISSN 1990-3839 Copyright © 2015Author(s) retain the copyright of this article http://www.academicjournals.org/ERR
Educational Research and Reviews
Full Length Research Paper
Comparison of communal sex roles of female sports students studying in different universities in Turkey
Zinnur Gerek
Ataturk University School of Physical Education and Sports, Erzurum, Turkey.
Received 04 December, 2014; Accepted 11 February, 2015
We investigated whether doing sports has any effect on the androgynous characteristics of women. In 15 universities from different regions of Turkey, a questionnare was administered to 341 students (170 elite sportlers from nine sport categories and 171 sedantary controls) during the 2012-2013 study period. The Bem sex role inventory was used to determine whether doing sport differentiates female students' social gender roles. There was a significant difference between subjects who do sport and those who do not in terms of masculinity and social acceptability (p<0.001), but there was no significant difference in terms of femininity (p=0.116). Female athletes are more androgynous compared to the non-sportlers. There was a significant difference between exercising and non-exercising women with regard to masculine/feminine features, and feminine/androgynous features (p<0.001) but there was no significant difference in terms of masculine/androgynous features (p=0.820). As a conclusion, in addition to its advantages for health, sports is very important for women to have a more effective place in the society in terms of gender roles. Key words: Sex roles, androgynous, sport.
INTRODUCTION A child is firstly labelled as a girl or boy by the society; then he/she begins to learn and earn cultural meanings of sex. Cultural meanings of sex are seen as gender roles. Gender role is a group of expectations associated with sex, which is defined by the society and expects from individuals to fulfill (Atay and Danju, 2012; Brahler, 2008). However, there are many differences in terms of capabilities, latent power, physical and personality even among women with women and men with men. Although there are many differences between the sexes, sometimes an individual may also carry characteristics of opposite sex in addition to his/her own characteristics.
There are different opinions about whether biological structure and environmental factors play a role in the differences between men and women or not. Also there are some different opinions about their reflection in the terminology. Some argue that the differences which are based on biological factors should be expressed with “sex”, and the differences which are based on socio-cultural factors should be expressed with “gender”. But some others claim that the differences between men and women result from both of them and it is not convenient to put forward both of them as the same reasons (Lippa, 2010; Oertelt-Prigione et al., 2010; Pryzgoda and
E-mail: [email protected] Authors agree that this article remain permanently open access under the terms of the Creative Commons Attribution License 4.0 International License

542 Educ. Res. Rev. Chrisler, 2000).
The term “sex” refers to the biological aspects of being male or female. It is a demographic category which is determined on the basis of a sex of an individual and it refers to a biological structure. The term “gender” refers to the meanings and expectations to be female or male imposed by the society and culture. Gender is the psy-chosocial characteristics, which characterize individuals as feminine or masculine. However; to distinguish sex and gender is not completely possible, because the expectations of culture (gender) from men and women are not entirely separated from the observations con-cerning about the physical body of man and woman (sex). Accordingly, the cultural configurations of gender in a sense include also biological sex. Generally it is not possible to know exactly whether some differences between men and women are biological or cultural. Essentially many variations are a result of the interaction of them (Dökmen, 2012; Rice, 1996; Lippa, 2010). Nowadays; social rules, cultural and social values continue to maintain the pressure on men and women in the configuration of sex roles.
Traditionally, Turkey has been seen as a geographical and cultural bridge between East and West. This feature has its reflections in social values too. We expect gender stereotypes in the Turkish society to be different from those of Western countries. In fact, some studies have claimed that the content of Turkish gender stereotypes can be mostly accounted for by instrumental and expressive dimensions (Gürbüz, 1985; Kağıtcıbaşı and Sunar, 1992).
The relationship between gender identity and sports is gaining interest of researchers during recent years. These studies postulate that the importance of body and physical performance during sportive experiences prepares a strong ground for constructing and proving gender identity ideologies (Koca, 2006).Also the percep-tions and values of the population play an important role in gender preferences. Majority of boys and girls will draw a male playing soccer when they are asked to draw a sports person (Colley et al., 2005).
Past studies have shown that gender identity is related to sport participation: female participants are mostly androgynous and masculine (Clément-Guillotin and Fontayne, 2011). These females engage more in masculine sports (Fontayne et al., 2001), and dropout from their activity less frequently (Guillet et al., 2000, 2006).
According to the Bem Sex Role Inventory used in our study, persons who have characteristics defined by society as feminine (emotional, insightful, kind, compas-sionate, etc.) are considered as feminine by the society. On the other hand, persons who have the characteristics defined by society as masculine (dominant, effective, courageous, ambitious, etc.) are considered as mascu-line by the society. Persons who show both masculine and feminine characteristics on a high level are described
as androgynous. Persons who show these two groups of characteristics on a low level are determined as undifferentiated.
In fact, the concept of "androgynous" indicates charac-teristics of being a human for men and women. Also it has emerged from possesing both sexes’ characteristics. Androgynous individuals show same sex role characteristics of the opposite sex as well as their own sex role characteristics. The reason for this might be acting upon the environment with possesing some feminine and masculine characteristics that adopted by society (Bem, 1974).
Sandra Lipsitz Bem has mainly done some researches in the 1970s about showing the positive aspects of androgynous individuals. She revealed that androgynous people may behave more flexible and they may more compatible sex role behaviors in different environments (Bem et al., 1976b). The concept of androgynous is very important for our age in terms of being flexible in behavioral patterns of people and maintaining their life more convenient and easier in the society. Additionally, androgyny model suggests that those with high levels of both masculinity and femininity (androgynous) are more adaptive and hence have better health (Afshin et al., 2014).
Sport is not only a physical work but also a process of adaptation and socialization to a society. Sport is a self-control mechanism. Sport is also the common denominator of many people from different societies and cultures due to its universal nature. Sport also plays an important role in the development of a democratic personality.
Thus, the athlete feels comfortable, personality and free. As the person realizes that he or she is valued, his or her self-esteem will increase and success will get maximized. There is evidence that sportive activities shape the character and have both physically as well as psychologically important effects on people (Krane and Baird, 2005).
It is of special interest whether there is any difference in the androgynous features of women according to their sportling status.
This study investigated the effect of sports on masculinity, femininity, and androgyny of women with respect to gender identity. We hypothesized that one reason for the experiences of women in sports is their gender identity and looked whether there is any connection with their gender roles and their biological status as a result of their sportive experience. In sports, sex-typed individuals (i.e., masculine males and feminine females) perceive masculine activities as more masculine than other individuals and feminine activities as more feminine (Koivula 1995; Hardin and Greer, 2009). We attempted to demonstrate the importance of sports in developing androgynous features as an important factor in positive human behaviors and to make some suggestions in the light of the findings.

MATERIALS AND METHODS Research model This is an analytical cross-sectional study designed to determine the sex roles among elite sportswomen from different universities who exercise compared with those who do not.Dependent variable of the study was the Bem sex-role inventory applied to elite female athletes studying sports in the university compared with non-exercising women of the same age.Additionally,some independent variables such as age, height, weight, exercise status, and sports category have been questioned. Study group Sample size calculation Sample size calculation was based on the main study outcome "Gender role". Feminine gender is expected to be around 38.5% (P1) among women in general population (Dökmen, 1999). Taking alpha error as 5%, 328 participants (164 in exercising group, 164 in not exercising group) are needed to find a difference in two groups (elite sportswomen vs. other women) with an effect of interest of 16% (P2=54.5%) and a power of 80.1% using the test comparing two proportions. In order to compensate for non-responders, we invited 180 elite sportswomen and 180 other women to our study (Lenth, R. V. Java Applets for Power and Sample Size [Computer software]) (Lenth, 2014). Sampling The study group has been selected from elite female students who have top level performance (contestant and/or national/international degree) during the 2012-2013 competition season in the categories of athletics, wrestling, soccer, gymnastics, skiing, handball, judo, basketball, and volleyball in Akdeniz, Ankara, Atatürk, Celal Bayar, Cumhuriyet, Ege, Erciyes, Fırat, Gazi, İstanbul, Kafkas, Karadeniz Teknik, Marmara, Selçuk, and Trakya universities (n=180) and women who were studying at Erzurum Atatürk University and had sedentary lifestyles (n=180).Consistent across countries, sport is generally accepted as a male domain (Hardin and Greer, 2009; Koivula, 1995). When considering the categories, we payed atttention to select more masculine sports. Data collection The data in this study were collected via a personal information form and Bem sex role inventory which was developed by Bem and adapted to Turkish by Kavuncu (1974) (Kavuncu, 1987). Data of 170 individuals from elite athletes group and 171 from the other group were analyzed. Personal information form A personal information form consisting of five questions was used to determine personal characteristics of participants (age, weight, height, sport participation and sport branch). Bem Sex Role Inventory Bem Sex Role Inventory has been used to determine sex role orientations of the participants in the study. The inventory is a self-
Gerek 543 rating scale and it consists of seven grade. The scale consists of 60 items in total and it consists of three different sub-scales such as "femininity", "masculinity" and "social acceptability (appreciation)” (Kavuncu, 1987). After adapted to Turkish by Kavuncu in 1987, the reliability and validity study on the Turkish version of the inventory were made by Kavuncu and Dökmen. Template Judgement Scale about sex roles which was developed by Kandiyoti, has been used as a criterion in Dökmen’s validity and reliability study. Some significant relationships have been found between the femininity and masculinity scale of Bem Sex Role Inventory and femininity and masculinity subscales of Template Judgement Scale (R= 0.51 for femininity and masculinity r = 0.63). The split halves reliability coefficient of the scale are 0.77 for femininity and 0.71 for masculinity (Dökmen, 1991).
In the inventory participants were asked to rate themselves on a scale of seven grades. The responses given to the items listed in the subscales were collected separately. After this process, the median of femininity and masculinity scores of sample were calculated. Subjects whose femininity score were above of median and masculinity score were below of median, are classified as feminine. Subjects whose masculinity score were above of median and femininity score were below of median were classified as masculine. Subjects whose both feminine score and masculinity score were above of median were classified as androgynous. Individuals whose both scores were below of median were classified as undifferentiated individuals. The research hypotheses “Androgynous characteristics of women who do sport, are not different from those who do not” was the main hypothesis of this research. Some other hypotheses were also tested like “Whether masculinity characteristics in women show any difference according to the sport or not”, “Whether femininity characteristics in women show any difference according to the sport or not”, “Whether social appreciation in women shows any difference according to the sport or not”. RESULTS AND DISCUSSION Demographic characteristics Mean ± standard deviations (SD) for numerical data were calculated. Age, height and weight averages (±SD) in women who do sport were 21.0 ± 1.8 years, 170.0 ± 8.9 cm and 59.4 ± 8.0 kg respectively; and in women who do not were 21.0 ± 2.0, 164.7 ± 5.2 ± 59.4 ± 8.0 respectively. Sport behavior and comparison of participants General mean values were determined in participants of the research with some questions about femininity, mas-culinity and social appreciation in terms of doing sport or not. The distribution of the averages for each variable was calculated and the differences were compared. There was a significant difference between subjects who do sport ond who do not in terms of points of masculinity and social acceptability. But there was no significant difference in terms of femininity (Table 1); while there was more than 1 unit difference in the masculinity domain,

544 Educ. Res. Rev.
Table 1. Comparison of Bem Sex-Role Inventory scores of participants according to sports status.
Exercise status N SD T P
Masculinity Elite athletes 170 5.39 0.67 12.57 <0.001 Sedentary 171 4.10 1.16
Femininity Elite athletes 170 5.53 0.59 1.57 0.116 Sedentary 171 5.42 0.73
Social acceptability Elite athletes 170 4.67 0.51 2.99 0.003 Sedentary 171 4.51 0.46
the differences between groups in the other domains were negligible.
When analyzing the characteristics of masculinity in Table 1, female sports students had higher values in terms of masculine role specifications than those who do not do sport. There was a significant difference between the groups in addition to this; both masculinity and femininity values were over the median. This finding proves that female sports students show androgynous features according to the criteria defined in the Bem Sex Role Inventory. As to the Bem Sex Roles Inventory femininity scores are above the median for feminine scores and masculinity scores are above the medial value for masculine scores. Our findings indicate that exercise may have a substantial positive influence on the androgynous features of women.
This finding proves that female students who do sport show androgynous characteristics according to the criteria specified in the Bem Sex Role Inventory. Persons whose femininity scores are above of median and masculinity scores are above of median are considered as androgynous according to the inventory of Bem's sex roles. Women who do sport have more femininity characteristics than those who do not, but we could not determine a significant difference in terms of femininity characteristics between the groups. There was a signifi-cant difference in terms of social appreciation between women who do sport and those who do not . Especially, positive features at lower scales were higher in women who do sport.
Chi-square test was performed to determine the significance of differences between the distributions of sex roles among women who do sport and those who do not, and significant differences were identified between the groups in terms of sex roles (Chi square = 84.695, p <0.001). A sub-group comparison was made in order to determine the differences between groups. Accordingly, there was a significant difference between exercising and non-exercising women with regard to masculine/feminine features (91.7% (n=55) of exercising vs. 36.5% (n=27) of non-exercising women were masculine; Chi Square=42.405; p<0.001), and feminine/androgynous features (4.6% (n=5) of exercising vs. 46.5% (n=47) of non-exercising women were feminine; Chi
Square=49.037; p<0.001) but there was no significant difference with regard to masculine/androgynous features (Chi square=0.052; p=0.820) (Table 2).
The sample of interest in our research was composed of university students who share the same environment. Therefore, as expected, they have some common points. However it is an important finding that communal sex roles of women who study in a university show differences according to their exercise habits.
In a more recent study conducted in Turkey, the authors found significant differences between men and women only on two masculinity items, but significant differences in 8 of 10 femininity items (Özkan and Lajunen, 2005). However, the studied population are highly selected students studying in English and thus dominating probably more Western values. Our sample, on the other hand, includes students from all geographical, cultural as well as socioeconomical layers of Turkey. Hence, it is very likely that our study is more representative of the general public.
Gender studies on sport sciences usually focus on gender role differences between subjects who are athletes and who are not. At the end, it was found that most of the athletes had more masculine features compared to the subjects who were not athletes (Koca and Aşçı, 2000; Hively and El-Alayli, 2014; Holt and Morley, 2004).
Considering these findings, it can be seen that women who exercise have stronger masculine and androgynous features whereas women who do not exercise have a more feminine or undifferentiated role. It has been determined that women who exercise have some differences when compared with women who do not exercise in terms of masculine features; women who exercise have higher masculine features than those who do not exercise. Considering that exercising women have higher masculine features together with lower feminine features is evidence for the masculine effect of sport on women when compared with women who do not exercise. Additionally, this study has demonstrated that androgenous subjects had higher scores for femininity and masculinity but subjects who are in the group of undifferentiated gender roles had lower scores for both of these features.

Gerek 545
Table 2. Distribution of sex roles according to making sport.
Masculine Feminine Androgynous Unknown Total n % n % N % n % n % Elite athletes 55 32.4 5 2.9 103 60.6 7 4.1 170 100 Sedentary 27 15.8 47 27.5 54 31.6 43 25.1 171 100 Total 82 24.0 52 15.2 157 46.0 50 14.7 341 100
Findings provide similarities in between the research results of Koca and Aşçı. In their study on the role of the gender; they indicated that masculine points of the athletes dealing with individual sports were higher than that of the other two groups; while there was no difference about the feminine points (Koca and Aşçı, 2000). Hence, it may be pronounced that there is a difference on masculine points of the practicing and non-practicing women because of the fact that practicing women are elite athletes having the properties of high level of power, endurance, competitivity and ambition which are mostly pronounced for men.
In his study, Birrel found that sport has an important effect on women's androgynous status. He reported that feminine roles among women who exercise, change towards masculine and as a result of the decrease in femininity androgynous features increase comparatively (Birrell, 1988). In another research carried out over women; it has been found out that there is no difference between practicing and non-practicing women in terms of the feminine properties while practicing women have more pronounced masculine properties compared to that of the non-practicing women (Mccutcheon and Mitchell, 1984). In the study of Gill, it has been found out that practicing women have indicated considerably less feminine properties at the level of 13-22 %; while they respond to androgynous tendency more than that of masculine tendency (Gill, 1992).
It has been observed in the answers given to the ques-tions on sub-scales determining the social acceptibility features that women who exercise exceed the mean values in terms of reliability, honesty, being serious for their jobs, tolerance, helpfulness, intimacy, hospitability, being respectful, friendly, and adaptable. On the other hand, it has been determined that they are under the average for being conservative, jealous, pessimistic, incoherent, unorganized, sulky, goship, selfish, arrogant and pretended. Therefore, it has been observed that positive aspects of social acceptibility come into prominence much more than exercise activities.
The most important result reached with this research is that women who exercise have higher levels for both masculine and feminine features. In other words, it has been determined that women who exercise have more androgynous features.
The term “androgynous” has been accepted and adopted because it is a liberal and humane selection that
has been developed against feminine and masculine con-ceptualizations of sexual standards related with mental health. Androgynous people are both more independent and more interested in population-related issues.(Bem et al., 1976a; Swenson and Ragucci, 1984). Androgyny is associated with better mobility and physical and mental health (Afshin, 2014).Gender studies which are done in the field of sport sciences are generally concentrated on the gender role differences of athletes and non-athletic people and as a result of these studies it was found that most athletes have more masculine characteristics than non-athletic people. Contemporary concepts in sports claim that engaging in sportive activities helps women to improve their masculine features together with feminine ones and support positive changes in the psychological factors (Marsh and Jackson, 1986).
Another similar study investigating gender roles of women athletes showed that 32.77 % of women athletes have androgynous gender roles, 26.88% of them have masculine gender roles, 21.84 % of them have feminine, and 22.68% have undifferentiated gender roles (Gill, 1992). In a study done with long distance runners of a school team, it was found that 17.6% of them showed feminine characteristics and 33.8% showed androgynous characteristics (Harris and Jenning, 1977).
In a study which was done in Texas University for defining gender roles of athlete females and non-athletic females, it was reported that 39% of female team athletes have androgen characteristics and 10% of these athletes have traditional feminine characteristics; 32% of non-athletic female have feminine characteristics and 27% of these non-athletic females have androgynous characteristics (Spence and Helmreich, 1978).
According to literature on gender role, females with more feminine than masculine characteristics have more gender role conflict and these are less relaxed when compared to those who are masculine and have androgynous characteristics (Miller et al., 2002; Pryzgoda and Chrisler 2000; Unger and Crawford, 1998).From the study done by Gillit it was documented that female athletes had androgynous tendency more than masculine tendency; in gender role study it was also determined that female athletes are more masculine than non-athletic females (Gill, 1992).
Finally, it is possible to say that in addition to its advantages for health, sports is very important for women in having a more effective role in the society in terms of

546 Educ. Res. Rev. gender roles. Therefore, it is an important area that should be studied whether factors leading women to do sports are physical and physiological features that come from birth, environmental factors, education etc. or whether they are due to having more prominent androgynous features. Conflict of Interests The author has not declared any conflict of interests. REFERENCES Afshin V, Beatriz A, Concepcion T, Carmen M, Beatriz M, Zunzunegui
MV (2014). The validity of the 12-item Bem Sex Role Inventory in Older Spanish Population: An Examination of the Androgyny Model, Archives of Gerontology and Geriatrics. 59:257–263.
Atay M, Danju I. (2012). Analysis of 1st grade and 5th grade textbooks and primary school students' views about personal traits in gender role in society. Cyprus International Conference on Educational Research (Cy-Icer-2012), 47, 64-73. doi: DOI 10.1016/j.sbspro.2012.06.61.
Bem SL (1974). The Measurement of Psychological Androgyny. J. Consult. Clin. Psychol, 42(2):155-162.
Bem SL, Martyna W, Watson C (1976a). Sex Typing and Androgyny - Further Explorations of Expressive Domain. J. Pers. Soc. Psychol. 34(5):1016-1023. doi: Doi 10.1037/0022-3514.34.5.1016.
Bem SL, Martyna W, Watson C (1976b). Sex Typing and Androgyny: Further Explorations of the Expressive Domain. J. Pers Soc Psychol, 34(5):1016-1023.
Birrell SJ (1988). Discourses on the Gender/Sport Relationship: From Women in Sport to Gender Relations. Exerc Sport Sci. Rev. 16:459-502.
Brahler E (2008). Gender Differences in Health Complaints: The Role of Society and Cultural Background. International J. Psychol. 43(3-4):48-48.
Clément-Guillotin C, Fontayne P (2011). Situational malleability of gender schema: The case of the competitive sport context. Sex Roles. 64:426-439. doi:10.1007/s11199-010- 9912-1.
Colley A, Berman E, Van Millingen L (2005). Age and gender differences in young people’s perceptions of sport participants. J. Appl. Social Psychol. 35:1440-1454. doi:10.1111/j.1559-1816.2005.tb02178.
Dökmen Z (1991). Bem Cinsiyet Rolü Envanterinin Geçerlik ve Güvenirlik Çalışması. Dil ve Tarih-Coğrafya Fakültesi Dergisi, 35(1):81-89.
Dökmen Z (1999). BEM Cinsiyet Rolü Envanteri Kadınsılık ve Erkeksilik Ölçekleri Türkçe Formunun Psikometrik Özellikleri Kriz dergisi. (1):27-40. doi: 10.1501/0000901.
Dökmen Z (2012). Toplumsal Cinsiyet, Sosyal Psikolojik Açıklamalar, Remzi Kitapevi (3. Baskı), s.20-29, İstanbul.
Fontayne P, Sarrazin P, Famose JP (2001). Les pratiques sportives des adolescents: Une differenciation selon le genre. [Sport practices of French teenagers: A gender differentiation]. STAPS, 22(55):23-37. doi:10/3917/sta.055.0023.
Gill DL (1992). Gender and sport behavior. In T.S. Horn (Ed.), Advances in sport psychology: Champaign, IL Human Kinetics.
Guillet E, Sarrazin P, Fontayne P (2000). "If it contradicts my gender role, I'll stop!": Introducing survival analysis to study the effects of gender typing on the time of withdrawal from sport practice: A 3-year study. Eur. Rev. Appl. Psychol. 50:417-421.
Guillet E, Sarrazin P, Fontayne P, Brustad RJ (2006). Understanding female sport attrition in a stereotypical male sport within the framework of Eccles’s expectancyvalue model. Psychology of Women Quarterly, 30:358-368. doi: 10.1111/j.1471- 6402.2006.00311.
Gürbüz E (1985). Ameasurement of sex-trait stereotypes. Unpublished
master’s thesis, Boğaziçi University, İstanbul, Turkey. Hardin M, Greer JD (2009). The influence of gender-role socialization,
media use and sports participation on perceptions of gender-appropriate sports. J. Sport Behavior, 32:207-226.
Harris DV, Jenning SE (1977). Self-Perceptions of Female Distance Runners. Annals of the New York Academy of Sciences.
Hively K, El-Alayli A (2014). "You throw like a girl:" The effect of stereotype threat on women's athletic performance and gender stereotypes. Psychol. Sport and Exercise 15(1):48-55. doi: DOI 10.1016/j.psychsport.2013.09.001.
Holt NL, Morley D (2004). Gender differences in psychosocial factors associated with athletic success during childhood. Sport Psychologist, 18(2):138-153.
Kağıtçıbaşı C, Sunar D (1992). Family and socialization in Turkey. In J. L. Roopnarine & D. B. Carter (Eds.), Annualadvances in applied developmental psychology: Vol. 5. Parentchild socialization in diverse cultures(pp. 75–88). Norwood, NJ: Ablex.
Kavuncu AN (1987). Bem Cinsiyet Rolü Envanterinin Türk Toplumuna Uyarlama Çalışması. (Unpublished master's thesis), Hacettepe University. Ankara.
Koca C, Aşçi FH (2000). Farklı Spor Branşlarında Yer Alan Bayan Sporcularda ve Sporcu Olmayanlarda Cinsiyet Rolü Eğilimi. 6. Hacettepe Spor Bilimleri Kongresi, 3-5 Kasım, Hacettepe Üniversitesi, Ankara.
Koca C (2006). Gender Relations in Physical Education and Sport. Hacettepe J. Sport Sci. 17(2), 81-99.
Koivula N (1995). Rating of Gender Appropriateness of Sports Participation: Effects of Gender-Based Schematic Processing. Sex Roles, 33:543-557. Doi: 10.1007/ BF01544679.
Krane V, Baird SM (2005). Using Ethnography in Applied Sport Psychology. J. Appl. Sport Psychol.17(2):87-107. Doi: 10.1080/10413200590932371.
Lenth RV (2014). Java Applets for Power and Sample Size. http://www.stat.uiowa.edu/~rlenth/Power
Lippa RA (2010). Sex Differences in Personality Traits and Gender-Related Occupational Preferences across 53 Nations: Testing Evolutionary and Social-Environmental Theories. Archives of Sexual Behavior. 39(3):619-636. doi: DOI 10.1007/s10508-008-9380-7.
Marsh HW, Jackson SA (1986). Multidimensional Self-Concepts, Masculinity, and Femininity as a Function of Womens Involvement in Athletics. Sex Roles, 15(7-8):391-415. doi: Doi 10.1007/Bf00287980.
Mccutcheon LE, Mitchell MF (1984). The Prediction of Running-Related Attitudes and Behaviors from the Androgynous Model. Wellness Perspectives. 1:31-34.
Miller KE, Barnes GM, Melnick MJ, Sabo DF, Farrell MP (2002). Gender and racial/ethnic differences in predicting adolescent sexual risk: Athletic participation versus exercise. J. Health Social Behav. 43(4):436-450. doi: Doi 10.2307/3090236.
Oertelt-Prigione S, Parol R, Krohn S, Preissner R, Regitz-Zagrosek V (2010). Analysis of sex and gender-specific research reveals a common increase in publications and marked differences between disciplines. Bmc Medicine, 8. doi: Artn 70 Doi 10.1186/1741-7015-8-70.
ÖzkanT, Lajunen T (2005). Masculinity Femininity and the Bem Sex Role Inventory in Turkey,Sex Roles. 52:1/2, DOI: 10.1007/s11199-005 1197-4
Pryzgoda J, Chrisler JC (2000). Definitions of gender and sex: The subtleties of meaning. Sex Roles, 43 (7-8), 553-569. doi: Doi 10.1023/A:1007123617636.
Rice FP (1996) Intimate Relationships, Marriages and Families (3rd edition) California: Mayfield Publishing.
Spence JT, Helmreich RL (1978). Masculinity and Femininity. Austin: University of Texas Press.
Swenson EV, Ragucci R (1984). Effects of sex-role stereotypes and androgynous alternatives on mental health judgments of psychotherapists. Psychological Reports. 54(2):475-481. doi: 10.2466/pr0.1984.54.2.475.
Unger R, Crawford M (1998). D.L. Anselmi, A. L. Law (Ed.). Questions of Gender: Perspectives and Paradoxes, s.18-21. Boston: McGraw-Hill.

Vol. 10(5), pp. 547-555, 10 March, 2015 DOI:10.5897/ERR2015.2124 Article Number: 69E729F51089 ISSN 1990-3839 Copyright © 2015Author(s) retain the copyright of this article http://www.academicjournals.org/ERR
Educational Research and Reviews
Full Length Research Paper
An analysis of the relationship between organizational communication and organizational cynicism according
to teachers’ perceptions in Turkey
Ahmet AYIK
Ataturk Universtiy, Kazım Karabekir Faculty of Education, Department of Educational Sciences in Turkey.
Received 04 December, 2014; Accepted 20 February, 2015
In this study, the relations between organizational communication and organizational cynicism have been analyzed. The sample of the study consists of 274 teachers working in state secondary schools in Palandöken County of Erzurum, in 2013-2014 academic year. “Organizational Cynicism Scale” and “Organizational Communication Scale” have been used to collect data. In this descriptive study, standard deviation, mean, Pearson Product-Moment Correlation coefficient and multiple linear regression analyses have been done in the analysis of the data. The results of the study show that the dimensions (cognitive, affective and behavioral) of organizational cynicism have negative and significant relations with all the dimensions of organizational communication. According to the regression analysis results, it has been found that the affective dimension of the organizational cynicism is predicted negatively and significantly by the duty based communication dimension of organizational communication, only the attitude and behavior based communication dimension of organizational communication predicts cognitive, affective and behavioral dimensions of organizational cynicism negatively and significantly. Key words: Organizational cynicism, organizational communication, teachers.
INTRODUCTION Organizational communication is an important sub-dimension of communication with its own specific studies, practical and theoretical subjects (Hogard and Ellis, 2006: 174). Organizational communication which is planned to accomplish a certain purpose, coordinated and considered as an official process (Mc Donald and Tanner, 1999: 7) has a significant role in organizations to work effectively and productively (Ekinci, 2006: 14).
Building a healthy communication within an Organization
affects the construction and culture of the organization, the relationships among the staff, technology usage, reporting, information flow, etc. This also provides the organization to reach its goals by affecting the behaviors of the personnel which increase the performance personally and productivity organizationally (Akıncı, 1998: 113). In order to develop the organizational communication, it is recommended that the following points be taken into consideration (Vecchio, 2006: cited by Bozkurt, 2010):
E-mail: [email protected]. Authors agree that this article remain permanently open access under the terms of the Creative Commons Attribution License 4.0 International License

548 Educ. Res. Rev. 1. Using an appropriate language understandable by the receiver. 2. Applying emphatic communication 3. Encouraging feedback 4. Creating a trustful climate 5. Using appropriate communication tools 6. Encouraging effective listening The quality in education should be increased in order for an education institution to accomplish the functionality expected from it (Özdemir, 2003: 45). To increase quality in education, it has gained significant importance that the satisfaction levels of the personnel working in the education institution should be increased, they should feel they have important roles in the organization, and they should be considered as important individuals (Yıldız, 2013). At this point, the communication between teachers, principals, students and other partners of education should be in high quality to increase the satisfaction of individuals and to make them feel they are important in the school. To provide qualitative communication in educational organizations, the principals can identify themselves with the teaching staff, create communication channels according to their needs and provide these channels to be open constantly, provide the teaching staff the chance and opportunity to be aware of what’s going on in the organization and to express their opinions (Gürsel, 2006: 79). It should not be forgotten that creating a democratic environment and achieving the goals effectively in a school firstly depends on mutual communication, such as principal-teacher, teacher-principal, communication and the quality of these communication processes (Celep, 2000: 41).
It has been proved by researches that the communication levels of school partners affect motivation in educational organizations (Özbek, 1998); organizational communication is effective in the management of change (Aksoy, 2005); organizational communication affects organizational commitment (Akbaş, 2008; Başyiğit, 2006; Ekinci, 2006; Erboz, 2008); there is a positive significant relationship between school culture and organizational communication (Ayık and Fidan, 2014); the perceptions about organizational communication increase as the behavior of agreeing with the decision increases (Takmaz, 2009); organizational communication affects organizational identification positively (Smidts and Von Riel, 2001); there is a positive relationship between job performance and organizational communication (Chen, Silverthorne, and Hung, 2006), and organizational communication affects job satisfaction positively (Rajesh- Irudhaya, and Suganthi, 2013; Nobile and McCormick, 2008).
It is thought that besides the fact that effectiveness of intra-organizational communication is a factor that affects the success of the organization, it also has a quiet significant effect on the psychological situations of the individuals working in the organization. It is known that as the motivation levels of the staff decrease when the
communication is not in the desired level, the staff develop several negative attitudes. One of these negative attitudes shows itself as organizational cynicism.
Cynicism is the attitude of the individual in which they are pessimistic about their latent purposes, they explain things based on disappointment, and their tendency is to pay attention to others as an instrument to take care or increase their interests (Tokgözv, 2008: 285). Organizational cynicism is defined as the negative attitude of staff towards the organization (Bedeian, 2007:10). Organizational cynicism is “a negative attitude including three components as a belief that someone believes the organization he works for has no honesty or righteousness, critical and abusive tendencies including negative beliefs, feelings and attitudes towards the organization” (Dean et al., 1998, 345).
On analyzing the literature, it is seen that the factors causing cynicism are dealt with under two titles (Karacaoğlu and İnce, 2012:79-81): Individual factors; personal characteristics are generally used as control or mediating variable. For example; age, gender, marital status, education level, period of service, etc. Organizational factors; are mostly about the policies applied in the organization. For example; violation of the psychological contract, organizational injustice, the lack of meaning of work, lack of participation in decision-making processes, lack of true support and management, the low quality of leader- member interaction, institutionalized organizational hypocrisy, etc. Almost every organization has personnel who may display cynical behaviors. It is possible that educational organizations whose input and output are humans can also have teachers, principals and other educational staff who display cynical behaviors. Catching the organizational success, implementing qualitative and productive applications in school are mostly based on the attitudes of the teachers towards the school they work. Therefore, the teachers should not display cynical behaviors or cynical behaviors that one should try to minimize or eliminate.. A teacher experiencing organizational cynicism can stop voicing ideas to improve his school, thinking that his ideas about improving the quality of his school will be futile. He/she may have the idea that his work to improve his school is not appreciated by others, or to preconceive that the school is not treating anyone equitable resulting in favoritism. He/she then fails to , believe that things are going to be OK, and become pessimistic about the future of the schools (Kalağan and Güzeller, 2010:84-85). In this sense, the teachers should get rid of these thoughts for the effectiveness of the school and organizational communication is thought to have a significant role to play. .
In analyzing the literature, it can be seen that cynicism

has three sub-dimensions. Cognitive dimension: It occurs with feelings such as anger, scorn, and condemnation and is a belief that the organization lacks righteousness (Dean et al., 1998: 345-346). Abraham (2000, p.270) stated that because cynics have the belief that organizations lack righteousness, they will not be able to display guiding behaviors to improve the prosperity of the organization, self-sacrifice, voluntariness and positive social behaviors in defending the organization. Affective dimension: It consists of strong emotional reaction such as nuisance, embarrassment (Abraham, 2000: 269). That is, it can be stated that this dimension consists of feelings such as disrespect, disdain, anger, hatred, smugness, moral corruption, disappointment and lack of confidence (Brandes, 1997: 31). Behavioral dimension: It includes pessimistic expressions of the personnel about the things happening in the organization in the future, sarcastic humors, strong critical expressions, etc. (Kutaniş and Çetinel, 2010: 188). The most common behavior of the individuals with cynical attitudes is that they have strong critical expressions about the organization. These criticisms may be in different forms, such as using open expressions about the organization’s lack of righteousness and sincerity, etc. (Brandes, 1997, p.31).
In the literature, the types of cynicism are also classified as personality (general) cynicism, social cynicism, personnel cynicism, cynicism towards organizational change and professional cynicism (Abraham, 2000; Dean et al., 1998).
To sum up, it can be said that a healthy school environment can be ensured by the teachers and the principal with less cynical behaviors. It is also thought that organizational communication is the key to prevent cynic behaviors to occur; and the higher the value of the organizational communication is, the less the value of the organizational cynicism is. When the literature is analyzed, it is suggested that the organizational cynicism can cause the organizational communication to decrease (Öncer, 2009:2), and in this case activating intra-organizational communication can prevent organizational cynicism to occur (Efilti et al., 2008; Reichers et al., 1997). In this case, it is expected that the results of this study will contribute to the literature considering that affective communication is a solution offer. In the literature, limited number of research has been done on cynicism towards change (Reichers et al., 1997) and personnel cynicism towards communication and organizational change (Qian and Daniels, 2008) among the types of cynicism. As a result of the conducted researches, it is considered that communication is both the cause of cynicism towards change and the solution process to remove this kind of cynicism (Reichers et al., 1997). Once again, it has been shown that the communication process, knowledge and the change in the relationships in the work environment have important causative effects on personnel cynicism (Daniels, 2008). As there are few researches analyzing the relationship
Ayik 549 between the organizational communication and cynicism (Tınaztepe, 2012), the results of this research are important for the literature. In this study,in which the relationship between the organizational communication and cynicism is to be analyzed, the answers to the questions below are sought: 1. What levels are the perceptions of the teachers working in secondary schools towards the organizational communication and cynicism? 2. Are there significant relationships between the perceptions of the teachers working in secondary schools towards organizational communication and their perception own cynicism? 3. Are the perceptions of the teachers working in secondary school towards organizational communication a significant predictor of organizational cynicism? METHOD Research design In this survey model study, the relationships between the perceptions of the teachers working in secondary schools towards organizational communication and cynicism are studied. In addition, as the current studies are considered to be inadequate in relating cause and effect relationship between dependent and independent variables, the relations between the variables and the prediction levels of the variables are analyzed within the study. Study group The study has been conducted on the teachers working in state schools in Palandöken County, Erzurum, Turkey, 2013-2014 academic year. The study group of this research consists of 274 teachers working in 15 secondary schools. The participants consist of 106 (38.7 %) female teachers and 168 (61.3 %) male teachers. On analyzing the distribution of the participants according to professional seniority, it is seen that 32 11.7 %) of the teachers have 1-5 year, 59 (21.5 %) of them have 6-10 year, 75 (27.4) of them have 11-15 year, 65 (23.07 %) of them have 16-20 year, and 43 (15.07 %) of them have 21 year and over professional seniority. Data collecting tools The data collection process of the study comprises two sections. The first section includes demographic information of the teachers like gender, branch and period of service in the school they work. The second section includes organizational cynicism scale to determine the perceptions about organizational cynicism and organizational communication scale to determine the perceptions about organizational communication. Organizational Cynicism Scale: “Organizational Cynicism Scale” developed by Brandes (1997) and adapted into Turkish by Erdost et al. (2007) has been used to determine the perceptions of the participants about organizational cynicism. The scale consists of 3 dimensions–cognitive, affective and behavioral-and 14 items. Cognitive dimension consists of five items, affective dimension consists of four items, and behavioral dimension consists of five items. The scale is a five-point Likert scale. Each question is graded

550 Educ. Res. Rev.
Table 1. Arithmetic means and standard deviation values related to organizational communication and organizational cynicism.
Sub-dimensions X Ss Sub-dimensions of organizational communication 1.Knowledgebased communication 3,66 .78 2. Duty based communication 3,60 .93 3. Feedback 3,63 .83 4. Attitude and behavior based communication 3.60 .76 Total 3,63 .73 Sub-dimensions of organizational cynicism 1. Cognitive Dimension 2.16 .92 2. Affective Dimension 2.22 1.0 3. Behavioral Dimension 2.31 .95 Total n = 274 2.23 .87
as “Strongly Agree”, “Agree”, “Agree Somewhat”, “Disagree” and “Strongly Disagree”. The items of the scale explain 4.19 % of the total variance. In the reliability analysis done by the researchers, Cronbach Alpha reliability coefficient for the scale in general is .94, and the coefficients are .88 for cognitive dimension, .88 for affective dimension, and .86 for behavioral dimension, respectively. Communication Scale: Data about organizational communication were collected with “Communication Scale” whose reliability and validity has been tested in “The Relation between Organizational Communication and Teachers’ Organizational Identification in General High Schools” by Erel-Yetim (2010). The scale includes 34 items related to organizational communication. Communication scale comprises knowledge based communication (6-16 items), duty based communication (1-5 items), feedback (17-23 items) and attitude and behavior based communication (24-34 items) sub-dimensions. In the research done by Yetim (2010), the internal consistency level of the scale has been determined as Cronbach alpha=.91. The factor load values of the items in this scale range between 0.47 and 0.83. In this four-structured scale, the total explained variance is 53.24 %. This explained variance is accepted to be adequate. In the reliability analysis done within this study, it has been found that the Cronbach alpha reliability coefficient of the scale is .96, and for the sub-dimension they are .83 for knowledge based communication, .90 for duty based communication, .79 for feedback and .89 for attitude and behavior based communication, respectively. Data analysis Data analysis has been done basically in two steps. In the first step, the data transferred into computer has been analyzed for missing or wrong extreme values; in the second step, the sub-problems of the study have been analyzed. In the analysis for wrong values, the values that have been submitted wrong unintentionally have been fixed. To analyze the sub-problems in the study, arithmetic mean values of the items in each sub-dimension were determined and a score for that factor was calculated. Analyses were done based on this factor. In the calculation of the relationships between variables, Pearson product-moment correlation coefficient (r) was used. However, multiple linear regression analysis was done to determine the prediction levels of the independent variables on dependent variables. In the interpretation of regression analyses, standardized
Beta (β) coefficients and t-test results related to the significance of these were considered. .05 significance score was used in the analysis of the data. FINDINGS The findings related to the perceptions of the participants about organizational communication and organizational cynicisms are indicated in Table 1.
In analyzing the distributions related to organizational communication and organizational cynicism according to teachers’ perceptions, it is seen that the highest mean in terms of organizational communication dimension is in the knowledge based communication ( X =3.66), the lowest mean is in duty based communication ( X =3.60) and attitude and behavior based communication ( X=3.60) dimensions. The highest mean score in terms of organizational cynicism is in behavioral dimension ( X=2.31) and the lowest mean score is in cognitive dimension ( X =2.16).
In the next phase of the study, two-way correlation analysis have been done to determine the relations between organizational cynicism and organizational communication according to the perceptions of teachers in the work group, and the results are indicated in Table 2.
In analyzing Table 2, it can be seen that there are significant and negative relations between the perceptions of the participating teachers about organizational communication and organizational cynicism.
After analyzing the correlation coefficients among the variables, it has been found that there are significant and negative relations between the knowledge based dimension of organizational communication and the cognitive dimension (r=-.47, p<.01), affective dimension (r=-.47, p<.01), behavioral dimension (r=-.52, p<.01) of organizational cynicism.

Ayik 551
Table 2. Correlations between organizational communication and organizational cynicism.
Sub dimensions 1 2 3 4 5 6 7 8 1.Knowledge based communication - 2.Duty based communication .68** - 3.Feedback .79** .63** - 4.Attitude and behavior based communication .80** .65** .84** - 5.Cognitive Dimension -.47** -.39** -.48** -.51** 6.Affective Dimension -.47** -.45** -.47** -.53** - 7.Behavioral Dimension -.52** -.47** -.51** -.56** .80** 8.Communication Total .89** .79** .88** -.52** -.54** -.58** - 9.Cynicism Total -.53** -.48** -.53** -.58** .88** .87** -.60 -
n = 274; *p< .01.
Table 3. Regression analysis results related to the prediction of cognitive dimension.
Variable B Sh β T p Fixed 4.559 .243 - 18.768 .000 Knowledge based communication -.110 .116 -.093 -.951 .343 Duty based communication -.062 .072 -.063 -.853 .394 Feedback -.098 .114 -.088 -.856 .393 Attitude and Behavior based communication -.395 .129 -.326 -3.069 .002*
F = 25.937; p< .01; R = .53; R2= .278.
Table 4. Multiple regression analysis results related to the prediction of affective dimension.
Variable B Sh β t p Fixed 4.893 .259 - 18.883 .000 Knowledge based communication -.065 .124 -.051 -.525 .600 Duty based communication -.177 .077 -.166 -2.301 .022*
Feedback -.028 .122 -.023 -.226 .821 Attitude and behavior based communication -.470 .137 -.359 -3.427 .001*
F = 28.640; p< .01; R = .55; R2= .299. It has been shown that there are significant negative relations between the feedback dimension of organizational communication and the cognitive (r=-.48, p<.01), affective (r=-.47, p<.01), and behavioral (r=-.51, p<.01) dimensions of organizational cynicism.
Besides, it has been found that there are significant negative relations between the attitude and behavior based communication dimension of organizational communication and cognitive (r=-.51, p<.01), affective (r=-.53, p<.01), and behavioral (r=-.56, p<.01) dimensions of organizational cynicism.
In the study, multiple regression analysis has been done between organizational communication and organizational cynicism for the prediction of organizational identification, and the results are indicated in Tables 3, 4 and 5.
The prediction of cognitive dimension Table 3 indicates the multiple linear regression analysis results related to the prediction of the cognitive dimension of organizational cynicism.
As it can be seen in Table 3, it has been found that knowledge based communication, duty based communication, feedback and attitude and behavior based communication dimensions of organizational communication have statistically significant prediction power on the cognitive dimension of organizational cynicism (F=25.937, p<.01). All the dimensions of the organizational communication together can explain 28% (R=.53, R2=28) of the change in the cognitive dimension score. Only the attitude and behavior based communication dimension (β=-.326, p<.01) of

552 Educ. Res. Rev.
Table 5. Multiple linear regression analysis results related to the prediction of behavioral dimension. Variable B Sh β t p Fixed 5,047 ,240 - 21,033 ,000 Knowledge based communication -,160 ,114 -,131 -1,396 ,164 Duty based communication -,137 ,071 -,135 -1,921 ,056 Feedback -,060 ,113 -,052 -,531 ,596 Attitude and behavior based communication -,399 ,127 -,320 -3,143 ,002*
F = 34.147; p< .01; R=.58; R2= .337. organizational communication negatively and significantly predicts the perceptions of the teachers participating in this study about cognitive dimension of the organizational cynicism. Knowledge based communication (β=-.093, p>.05), duty based communication (β=-.063, p>.05) and feedback (β=-.088, p>.05) dimensions are not only the predictor of the cognitive dimension of organizational cynicism. The prediction of affective dimension The multiple regression analysis results related to the prediction of affective dimension of organizational cynicism are indicated in Table 4.
As it is seen in Table 4, it has been found that the knowledge based communication, duty based communication, feedback and attitude and behavior based communication dimensions of organizational communication have statistically significant prediction power on the affective dimension of organizational cynicism (F=28.640, p<.01). All the dimensions of organizational communication can explain 30 % (R=.55, R2=30) of the change in the affective dimension score. The duty based communication (β=-.166, p<.01) and attitude and behavior based communication (β=-.359, p<.01) dimensions of organizational communication predict significantly and negatively the perceptions of the teachers participating in the study about the affective dimension of organizational cynicism. The knowledge based communication (β=-.051, p>.05) and feedback (β=-.023, p>.05) dimensions are not solely the predictor of the affective dimension of organizational cynicism. The Prediction of Behavioral Dimension Table 5 indicates the multiple linear regression analysis results related to prediction of the behavioral dimension of organizational cynicism.
As it is seen in Table 5, it has been found that the knowledge based communication, duty based communication, feedback and attitude and behavior based communication dimensions of organizational
communication have statistically significant prediction power on the behavioral dimension of organizational cynicism (F=34.147, p<.01). All dimensions of organizational communication together can explain 34 % (R=.58, R2=38) of the change in behavioral dimension score. Only the attitude and behavior based communication dimension (β=-.320, p<.01) of organizational communication predicts significantly and negatively the perceptions of the teachers participating in the study about the behavioral dimension of organizational cynicism. The knowledge based communication (β=-.131, p>.05), duty based communication (β=-.135, p>.05) and feedback (β=-.058, p>.05) dimensions are not solely the predictor of the behavioral dimension of organizational cynicism. The prediction of organizational cynicism The multiple linear regression analysis results related to the prediction of organizational cynicism are indicated in Table 6.
It can be seen in Table 6 that the knowledge based communication, duty based communication, feedback and attitude and behavior based communication dimensions of organizational communication have statistically significant prediction power on organizational cynicism (F=38.312, p<.01). All dimensions of organizational communication together can explain 36 % (R=.60, R2=36) of the change in organizational cynicism score. Only the attitude and behavior based communication dimension (β=-.365, p<.01) of organizational communication predicts significantly and negatively the perceptions of the teachers participating in the study about organizational cynicism. The knowledge based communication (β=-.103, p>.05), duty based communication (β=-.131, p>.05) and feedback (β=-.061, p>.05) dimensions are not solely the predictor of organizational cynicism. RESULTS, DISCUSSION AND SUGGESTIONS In this study, the relations between the perceptions of the

Ayik 553
Table 6. The multiple linear regression analysis results related to the prediction of organizational cynicism.
Variable B Sh β t p Fixed 4,829 ,216 - 22,370 ,000 Knowledge based communication -,115 ,103 -,103 -1,116 ,265 Duty based communication -,122 ,064 -,131 -1,895 ,059 Feedback -,064 ,102 -,061 -,633 ,528 Attitude and behavior based communication -,418 ,114 -,365 -3,657 ,000*
F = 38.312; p< .01; R=.60; R2= .363. teachers about organizational communication and organizational cynicism have been studied. The results of the study have proved that organizational communication is an important variable that predicts of organizational cynicism. According to the results of the study, the mean scores of the teachers’ perceptions about organizational communication are 3.63. These values show that the perceptions of secondary school teachers range highly between “Agree”. The results of the study show parallelism with studies of Erel-Yetim (2010), Okkalı (2008) and Yıldız (2013), in which the organizational communication scores of the teachers were higher than the average. Moreover it has been found that the highest perceived dimension of the organizational communication is knowledge based communication, and the lowest ones are duty based communication and attitude and behavior based communication dimensions. Aksoy (2005) stated in his study in which the perceptions of teachers and principals about organizational communication have been analyzed that motivation, communication new values, participation dimensions have been perceived moderately adequate by the sample. Tulunay (2010) in his study conducted on classroom teachers found that the organizational communication levels have been at medium level.
The results of the study show that the general mean score of the teachers’ perceptions about organizational cynicism is 2.23. This mean value shows that the perceptions of the secondary school teachers range in low level between “Disagree” of organizational cynicism. These results show similarities with the study results of Güzeller and Kalağan (2008) and Yıldız et al. (2013) in which they analyzed the attitudes of the teachers working in primary and elementary schools towards organizational cynicism. The behavioral dimension of organizational cynicism is the highest perceived dimension, and the lowest one is cognitive dimension. This evidence conforms to the research results of İçerli and Yıldırım (2012) which, have resulted that the highest perceived dimension has been behavioral and the lowest one is cognitive dimension and the study has been done on the institutions apart from educational institutions. Moreover,
in the study conducted by Arslan (2012) it has been determined that the lowest perceived dimension of organizational cynicism is cognitive dimension. On the other hand, Özgan et al. (2012) and Kasalak and Aksu (2014) have determined in their study that the cognitive dimension of organizational cynicism is the highest perceived dimension. It can be interpreted that the results may vary because the sample groups and/or the instruments are different. According to the result of the study, the cognitive dimension whose mean score has been found to be lower can be interpreted as the belief that the individuals are not honest about the institution they work in; their tendency to have intensive negative feelings and to react happens less. The results of the study show that the dimensions of organizational communication have negative and significant relations with all the dimensions (cognitive, affective and behavioral) of organizational cynicism. Tınaztepe (2012) has determined in his study about the relation between organizational cynicism and organizational communi-cation that intra-organizational communication has significant negative effects on organizational cynicism. This result can be interpreted that as the perceptions of the teachers about organizational communication increase, their perception levels about organizational cynicism decrease.
Regression analysis results explain 36 % of the total variance of organizational cynicism together with all the dimensions of organizational communication. The regression analysis results show that duty based communication dimension of organizational communi-cation predicts the affective dimension of organizational cynicism significantly and negatively. Organizational communication provides the members of the organization transfer, share and create meaning (Bakan and Büyükbeşe, 2004), and thus it provides the productivity of the organization to increase. The affective component of organizational cynicism consists of strong feelings like disdain, anger, sadness and shame (Abraham, 2000: 269). In this context, it can be said that the positive perceptions of the teachers about their duty can predict that they feel less disdain, anger, sadness and shame about their organizations.

554 Educ. Res. Rev.
Only the attitude and behavior based communication dimension of organizational communication has significantly and negatively predicted the cognitive, affective and behavioral dimensions of organizational cynicism. Current research results support the results of the studies by Reichers et al. (1997), Wanous et al., (2000), Qian and Daniels (2008), Tınaztepe (2012). According to Reichers et al. (1997), change programs that fail constantly, lack of information about change and tendency to cynicism cause the development of cynicism towards organizational change. Reichers et al. (1997) stated that among the possible reasons of organizational change are personnel’s feelings that they are uninformed, the negative attitudes of principals and union representatives, lack of communication and respect, and lack of opportunity to participate in resolution process. According to Wanous et al. (2000), cynicism towards organizational change is caused by organizational factors. These factors are pessimism about the amount of the change experienced before and the success rate of the previous change attempts, the amount of the principals’ allowance the teachers to participate in decisions and the effective role of the administration. According to the study, the role of the administrator is effective listening, providing information, communicating effectively, approaching the personnel from their view of perspectives, encouraging to participation, involving them in decisions, answering the questions, etc. Qian and Daniels (2008) have stated that communication plays a key role in the happening of employee cynicism, communication process-information and relations around the organization have important causative effects on employees’ cynicism.
The important results of the study can be summarized as:
1) Organizational communication according to teachers’ perception in secondary schools range highly interval “agree”. 2) While the knowledge based communication is the highest perceived dimension of the organizational communication, the lowest level perceived dimensions are duty based communication and attitude and behavior based communication. 3) The perception levels of the teachers working in secondary school about organiza-tional cynicism range between “disagree”, and are at low levels. 4) While the highest perceived dimension is the behavioral dimension of organizational cynicism, the lowest perceived one is cognitive dimension. 5) It has been seen that organizational communication has significant and negative relations with all the dimensions (cognitive, affective and behavioral) of organizational cynicism. 6) It has been determined that the affective dimension of the organizational cynicism significantly and negatively predicts the duty based communication dimension of organizational communication. 7) Only the attitude and behavior based communication dimension negatively and significantly predicts the cognitive,
affective and behavioral dimensions of organizational cynicism. 8) Only the attitude and behavior based com-munication dimension of organizational communication significantly and negatively predicts the perceptions of the teachers about organizational cynicism.
Based on the study results, seminars related to the importance of organizational communication and organi-zational cynicism can be given to the school principals to prevent the teachers to have cynic behaviors, attitudes and judgments. The variables of the study can be studied on different sample groups by using qualitative research methods. Conflict of Interests The author has not declared any conflict of interests. REFERENCES Abraham FR (2000). Organizational cynicism: bases and
consequences. Genetic, Social, General Psychol. Monographs. 126(3):269-292.
Akbaş B (2008). Örgütseliletişiminörgütselbağlılıküzerineetkisiüzerinebiraraştırma (YayımlanmamışYüksekLisansTezi). AfyonKocatepe Üniversitesi, Afyon karahisar.
Akıncı ZB (1998). Kurumkültürüveörgütseliletişim.İstanbul: İletişim. Aksoy İ (2005).
İlköğretimokullarındagörevyapanöğretmenlerinokuldadeğişimyönetiminingerçekleştirilmesindeörgütseliletişiminrolüneilişkinalgıları (YayımlanmamışYüksekLisansTezi). GaziÜniversitesi, Ankara.
Arslan ET (2012). SüleymanDemirelÜniversitesiİktisadiveİdariBilimlerFakültesiakademikpersoneliningenelveörgütselsinizmdüzeyi.DoğuşÜniversitesiDergisi, 13(1):12-27.
Ayık A, Fidan M (2014). İlköğretimkurumlarındaörgütseliletişimileokulkültürüarasındakiilişki.Mehmet Akif Ersoy Üniversitesi Eğitim Fakültesi Dergisi, 29:108- 134.
Bakan İ, Büyükbeşe T (2004).Örgütseliletişimileiştatminiunsurlarıarasındakiilişkiler: akademikörgütleriçinbiralanaraştırması. Akdenizİktisadiİdari Bilimler Fakültesi Dergisi, (7), 1-30.
Başyiğit A (2006). Örgütseliletişiminörgütselbağlılıküzerineetkisi. (Yayımlanmamış Yüksek Lisans Tezi). Dumlupınar Üniversitesi, Kütahya.
Bedeian A (2007). Even if the Tower is ‘Ivory’, It isn’t white: Understanding the consequences of faculty cynicism. Acad. Manage. Learn. Educ. 6:9 32.
Bozkurt F (2010). Yatılıilköğretimbölgeokullarıöğretmenlerininyöneticileriyleolanörgütseliletişimi (YayımlanmamışyüksekLisansTezi). Fırat Üniversitesi, Elazığ.
Brandes PM (1997). Organizational Cynicism: Its nature, antecedents and consequences.(Dissertation of Doctor of Philosophy).The University of Cincinnati, USA.
Celep C (2000). Eğitimdeörgütseladanmaveöğretmenler. Ankara: Anı. Chen JC, Silverthorne C, Hung JY (2006). Organization communication,
job stress, organizational commitment, and job performance of accounting professionals in Taiwan and Am. Leadership Organ. Devel. J. 27(4):242-249.
Dean JW, Brandes P,Dharwadkar R (1998). Organizational cynicism. Acad. Manage. Rev. 23:341–352.
Ecem-Yetim A (2010). Genelliselerdeörgütseliletişimileörgütselözdeşleşmearasındakiilişki.Y ayımlanmamışyükseklisanstezi,Gazi Üniversitesi, Eğitim Bilimleri Enstitüsü, Ankara.

Efilti S, Gönen YÖ, Öztürk F (2008). Örgütselsinizm:
AkdenizÜniversitesi’ndegörevyapanyöneticisekreterlerüzerindebiralanaraştırması.7. UlusalBüroYönetimive Sekreterlik Kongresi, Karadeniz Teknik Üniversitesi. 1-14.
Ekinci K (2006). Örgütseliletişimveörgütselbağlılıkarasındakiilişki(YayımlanmamışYüksekLisansTezi). Atatürk Üniversitesi, Erzurum.
Erboz G (2008). Yöneticiveişgörenarasındakiiletişiminkalitesiileörgütselbağlılıkarasındakiilişkiüzerinebiraraştırma(YayınlanmamışYüksekLisansTezi). Marmara Üniversitesi, İstanbul.
Erdost E, Karacaoğlu HK, Reyhanoğlu M (2007). ÖrgütselsinizmkavramıveilgiliölçeklerinTürkiye’dekibirfirmada test edilmesi.15. UlusalYönetimveOrganizasyonKongresi BildirilerKitabı, Sakarya Üniversitesi, 514-524.
Gürsel M (2006). Okulyönetimi (6.Baskı). Konya: Eğitim. Güzeller C, Kalağan G (2008).
ÖrgütselsinizmölçeğininTürkçeyeuyarlanmasıveçeşitlideğişkenleraçısındaneğitimörgütlerindeincelenmesi, 16.UlusalYönetimveOrganizasyonKongresiBildiriKitabı, 87-94.
Hogard E, Ellis R (2006). Using communication audit to evaluate organizational communication. University of Chester, Evaluat. Rev. 30(2):171-187.
Kalağan G, Güzeller CO (2010). Öğretmenlerinörgütselsinizmdüzeylerininincelenmesi.Pamukkale Üniversitesi Eğitim Fakültesi Dergisi. 27:83-97.
Karacaoğlu K, İnce F (2012). Brandes, DharwadkarveDean’in (1999) örgütselsinizmölçeğiTürkçeformunungeçerlilikvegüvenilirlikçalışması: kayseri organize sanayibölgesiörneği. Bus. Econ. Res. J. 3(3):77–92.
Kasalak G, BilginAksu M (2014).Araştırmagörevlilerininalgıladıklarıörgütseldesteğinörgütselsinizmileilişkisi. Kuramve Uygulamada Eğitim Bilimleri, 14(1):115-133.
Kutaniş RÖ, Çetinel E (2009). Adaletsizlikalgısısinisizmitetikler mi?:Birörnekolay. 17.YönetimveOrganizasyonKongresiKongreKitabı. Osman gazi Üniversitesi, Eskişehir. 693-699.
Mc Donald J, Tanner S (1999). Başarılıiletişim. (Çev: EmelKöymen). İstanbul: Dünya.
Nobile JJ, McCormick J (2008). Organizational communication and job satisfaction in australian catholic primary schools. Educ. Manage. Admin. Leadership 36(1):101–122.
Okkalı M (2008). İlköğretimokullarındaörgütseliletişimbecerilerininörgütselöğrenmeyeetkisininöğretmenlertarafındanalgılanması.Yayımlanmışyükseklisanstezi, Marmara Üniversitesi, Eğitim Bilimleri Enstitüsü, İstanbul.
Öncer AZ (2009). An overview of organizational cynicism and a cure suggestion: Teamwork. 2009 EABR & TLC Conference Proceedings, Prague, Czech Republic.
Özbek S (1998). İlköğretimöğretenlerininokulmüdürlerininiletişimvemotivasyonbecerilerineilişkinalgıvebeklentileri (YayımlanmamışYüksekLisansTezi). Dokuz Eylül Üniversitesi, İzmir.
Özdemir İ (2003). Öğretmenlerinişbaşındayetiştirilmesindeokulyöneticisininrolü. Kuramve Uygulamada EğitimYönetimi. 9(35):448-465.
Özgan H, Külekçi E, Özkan M (2012). Analyzing of the relationships between organizational cynicism and organizational commitment of teaching staff. International Online J. Educ. Sci. 4: 196-205.
Qian Y, Daniels TD (2008). A communication model of employee cynicism toward organizational change. Corporate Communication: Int. J. 13(3):319-332.
Rajesh-Irudhaya J, Suganthi L (2013). The satisfaction of teachers with their supervisors' interpersonal communication skills in relation to job burn-out and growth satisfaction in southern India. Manage. Educ. 27(4):128–137.
Reichers AE, Wanous JP, Austin JT (1997). Understanding and managing cynicism about organizational change.The Academy of Management Executive, 11(1):48-59.
Smidts A, Von Riel CBM (2001). The impact of employee communication and perceived external prostige on organizational identifications. Acad. Manage. J. 5(44):1051-1061.
Ayik 555 Takmaz-Uygun Ş (2009).
İlköğretimokullarındaörgütseliletişimdüzeyiileöğretmenlerinkararakatılmadavranışlarıarasındakiilişki (YayımlanmamışYüksekLisansTezi). Selçuk Üniversitesi, Konya.
Tınaztepe C (2012). Örgütiçietkiniletişiminörgütselsinizmeetkisi.OrganizasyonveYönetimBilimleriDergisi, 4, 53-63.
Tokgöz N, Yılmaz H (2008). Örgütselsinizm: EskişehirveAlanya’dakiotelişletmelerindebiruygulama. Anadolu Üniversitesi Sosyal Bilimler Dergisi, 8(2):283-305.
Tulunay, Ö (2010). Sınıföğretmenlerinintükenmişlikdüzeyleriveörgütselbağlılıkveörgütseliletişimileilişkisi: Sivas ilörneği (YayımlanmamışYüksekLisansTezi). KırıkkaleÜniversitesi, Kırıkkale.
Wanous, JP, Reichers AE, Austin JT (2000). Cynicism about organizational change measurement, antecedents, and correlates. Group Organ. Manage. 25(2):132-153.
Yetim-Erel AE (2010). Genelliselerdeörgütseliletişimileöğretmenlerinörgütselözdeşleşmeleriarasındakiilişki (YayımlanmamışYüksekLisansTezi). Gazi Üniversitesi, Ankara.
Yıldız K (2013). Öğretmenlerinörgütselözdeşleşmeleriileörgütseliletişimleriarasındakiilişkininincelenmesi. Kuramve Uygulamada Eğitim Bilimleri, 13:251-272.
Yıldız K, Akgün N, Yıldız S (2013). İşeyabancılaşmaileörgütselsinizmarasındakiilişki. J. Acad. Social Sci. Stud. 6(6):1253-1284.

Vol. 10(5), pp. 556-565, 10 March, 2015 DOI:10.5897/ERR2014.1901 Article Number: AE4F9BC51094 ISSN 1990-3839 Copyright © 2015Author(s) retain the copyright of this article http://www.academicjournals.org/ERR
Educational Research and Reviews
Full Length Research Paper
Influence of web-aided cooperative learning environment on motivation and on self-efficacy belief in
Biology teaching
Murat Hevedanlı
Dicle University Ziya Gokalp Education Faculty Department of Biology Education Diyarbakir Turkey.
Received 05 August, 2014; Accepted 18 February, 2015
The purpose of this study is to investigate the influence of the web-aided cooperative learning environment on biology preservice teachers’ motivation and on their self-efficacy beliefs in biology teaching. The study was carried out with 30 biology preservice teachers attending a state university in Turkey. In the study, the pretest-posttest research design without any control group was used. As the data collection tools, a motivation scale and a self-efficacy belief scale for biology teaching were used. The data collection tools were applied as pretest and posttest on group. During the analysis of the obtained data, paired simples t-test was used. The findings obtained demonstrated that the motivation levels of the biology preservice teachers trained in the Web-Aided Cooperative Learning Environment (WACLE) increased and that there was no significant difference regarding their self-efficacy beliefs in biology teaching. The results were discussed in the light of the literature, and related suggestions were put forward accordingly. Key words: Biology teaching, cooperative learning, web-aided learning environment, self-efficacy belief.
INTRODUCTION Use of tools in education dates back to centuries ago. The process of using tools that started in 2600 B.C. with the abacus has now become indispensable in our lives. Technological developments and scientific advances especially in the last century have led to the birth of the information society. Today, it is a must for societies to follow and adopt these dazzling developments. Every passing day, new developments are added to the previous ones. At present, the computer is considered to be the most effective technological development in education (Akkoyunlu, 1998; Arslan, 2006; Bal, 2010).
Until recent time, traditional use of computers was limited to computer-aided education, yet the infinite flexibility of the Internet has brought about a new dimension to the subject (Alptekin and Ertem, 1999). According to Barnard and Samberg (1993), the Internet has a key role in gathering students and teachers throughout the world. The Internet connects potential sources of information scattered all around the world. Wilson and Marsh (1995) point out that Internet provides students and all other users with two important opportunities: First, students can use the Internet for such
E-mail: [email protected]. Tel: 0090 532 725 83 37. Authors agree that this article remain permanently open access under the terms of the Creative Commons Attribution License 4.0 International License

purposes as communication, research, obtaining information and sharing. Secondly, Internet access removes all the boundaries for students including the school walls. The development and spread of Internet technologies has led to special acceleration in education. In recent years, with the increasing number of schools and institutions providing education via the Internet, the concepts of distant learning and e-learning have been popular (Çallı et al., 2003). On the other hand, research results demonstrate that there is a decreasing participation in virtual classes and that the e-learning method has certain deficiencies (Young, 2002; Singh, 2003). Students’ motivation decreases due to their weak interaction in the learning process when compared to face-to-face learning environments, and they thus leave without completing the course (Osguthorpe and Graham, 2003). According to Horton (2002), this problem could be overcome with the use of the mixture of traditional and web-based teaching, or Web-Aided Teaching (WAT), which refers to the traditional method of teaching accompanied by the use of Internet-based instruction as the main presentation tool.
WAT can be defined as “an environment that allows simultaneous or non-simultaneous learning not only to support the teaching-learning process when other instructional methods and techniques fail to increase students’ interest in a subject and their learning but also to share information found in different environments by using web pages as well as the equipment and software capabilities of computers” (Khan, 1997; McCormack and David, 1998; Uzunboylu, 2002; Şensoy, 2005).
In web-aided teaching, the website is designed using a strategy appropriate to the students’ characteristics after determining the content. The webpage designed can be revised and removed by improving the subject with technology support and with the help of links to other websites. Administration of the website and its application can be achieved in cooperation with experts and the teacher. Also, assessment can be done via the Internet as well. By assessing students with the help of appropriate software, they should be provided with the necessary feedback. It is possible to assess the students taking either the product or the process into consideration (Cüez, 2006). The advantages and disadvantages of web-aided teaching are as follows: the advantages include increased sources of information, decreased cost of education, reaching up-to-date information instantly, experiencing no transportation problem, being indepen-dent of the physical environment, sharing ideas and learning, having rich materials and sources, being able to follow the course in any place at any time and reviewing the lessons; as for the disadvantages, they include having no appropriate infrastructure or standards, failure to follow the course due to technical problems, no common points among students, too much information available, difficulties in preparing and distributing the course materials and the high cost of course materials
Hevedanlı 557 (Khan, 1997; McCormack and David, 1998; Sünbül, 2004).
WAT puts forward an innovative approach especially to studies on cooperative learning (Jianhua and Akahori, 2001; Hoppe, 2007). Different from traditional methods of teaching, one important feature of WAT is that there is constant communication between students as well as between students and the teacher and that the cooperation resulting from these communications has a key role in learning (Palloff and Pratt, 2007).
Cooperative learning requires students to study in small groups by helping each other’s learning in line with a common goal. Group members help each other either by teaching one another or by sharing each task. Within a group, a student’s learning is influenced by others’ learning and by their efforts (Açıkgöz, 1992). According to Demirel (2010), in the cooperative learning method, group members are supposed to know that the group is a whole and that each member is responsible for the success or failure of the group. Since a student can study with all other students instead of studying with the same students, s/he can recognize different skills and charac-teristics of each student. As there is always a dialogue and sharing in class, students take more active role in lessons. Even though there might be some students having difficulty understanding the subjects during group work, they can easily overcome such problems thanks to the cooperation within the group (Fenton, 1992).
According to Slavin (1990), if a teacher is new to the cooperative learning method, it will be better for him or her to start with the STAD technique (Student Team Achievement Division) since it is much easier to apply this technique when compared to the other techniques of the cooperative learning method. In this technique developed by Slavin, heterogeneous learning teams of four or five members are formed. The class starts with a presentation made by the teacher, and students study until making sure that all their team mates have fully understood the lesson. At the end of the class, students’ individual exam scores are calculated. Depending on the criteria previously determined, the team scores are formed. Taking the team scores into consideration, the most successful team is awarded.
In recent years, a number of researchers have adopted the computer, Internet or Internet technologies as one of the key features of cooperative learning (Garrison and Anderson, 2003; Mclnnerney and Roberts, 2004; McConnell, 2000; Hoppe, 2007). WAT, based on individual learning, has gone under change covering cooperative learning (Johnson and Johnson, 2002). This approach, which includes not only simultaneous-nonsimultaneous activities in the Internet environment but also face-to-face activities in class, is called Web-Aided Cooperative Learning (WACL) (El-Deghaidy and Nouby, 2008). Conrad and Donaldson (2004) point out that getting information via cooperative learning has a key role in creating a successful WACL. According to Palloff

558 Educ. Res. Rev. and Pratt (2007), the important points that should be taken into consideration in WACL are as follows:
1. Small group tasks, 2. Research assignments that require students to find source materials for the members of their own group, 3. A case study with the group, 4. Simulations, 5. Students’ facilitating each other’s work within the group, 6. Homework forums, 7. Nonsimultaneous discussions and discussion questions, 8. A course website that provides feedback. However, in e-learning environments and in learning that occurs in these environments, one of the difficulties experienced in practice is the self-efficacy that students are supposed to have (Graham, 2006). In literature, it is reported that individuals’ self-efficacy beliefs have important influence on their interest in instructional technologies and on their expectations regarding these technologies (Smith, 2002; Şahin, 2008).
Self-efficacy is one of the key variables in the social cognitive theory. According to Bandura, self-efficacy is a factor influential on the development of behavior and is defined as “an individual’s judgment regarding his or her own ability to organize and accomplish the necessary activities to demonstrate a certain performance” (Bandura, 1997,p.). Individuals’ expectations determine not only the start of their behavior but also their insistence on the success of their behavior. During these activities, individuals’ beliefs in their own strengths have influence on their behavior and even on whether they will demonstrate that behavior or not. According to Bandura, only the perceived efficacy is directly influential on determining the behavior, and effort is an important factor to be successful at the end of the activities. The reason is that the stronger the perceived self-efficacy belief is, the more effort the individual makes. Bandura bases self-efficacy belief on four basic sources (Senemoğlu, 1997):
1. Performance Outcomes: The most important source of self-efficacy is the performance results or past experiences. Positive and negative experiences in the past may influence individual abilities necessary to do a job. If individuals have done a job successfully before, it is likely for them to feel that they are efficient in other similar conditions. For instance, if an individual has demonstrated a good performance during an educational workshop, then he or she may have a higher level of self-efficacy and self-confidence in another similar workshop. Because the individual’s self-efficacy belief will be higher in similar subjects, he or she will try harder to achieve better results. Also, the opposite is true as well. If the individual has negative experiences, he or she will have a lower level of self-efficacy belief and demonstrate worse
performance accordingly. 2. Vicarious Experiences: Observing others’ performances, individuals can develop their own low or high levels of self-efficacies. They compare their own abilities with others’. When they see what their peers achieve or fail to do, their own self-efficacies could increase or decrease. 3. Verbal Persuasion: Positive or negative approaches to individuals’ performances are influential on self-efficacy. Encouragement and recommendations for an individual to be become successful have different effects on self-efficacy belief. Similarly, if an individual is discouraged from success, his or her self-efficacy belief is likely to decrease. 4. Physiological Feedback (Emotional Arousal): An individual’s expectation to achieve a task or to fail to do that task has influence on self-efficacy perception. For example, such emotional arousal as anxiety, palm-sweating and increasing heart-beat in cases of making a speech in front of an important group of customers influence an individual’s self-efficacy. Ashton (1984) defines self-efficacy belief as teachers’ beliefs in their abilities to influence their students’ achievements. Teachers’ self-efficacy beliefs in science teaching also influence the applications they carry out in class (Schriver and Czerniak, 1999). When compared to teachers with low levels of self-efficacy beliefs, those with high levels of self-efficacy beliefs allocate more time to science teaching and activity-based science teaching (Enochs and Riggs, 1990). Biology preservice teachers’ beliefs in increasing their students’ achievements via effective teaching methods (Result Expectation) and their beliefs in themselves to behave in a way to effective teaching (Self-Efficacy Beliefs) are important in terms of the efforts they will make in the teaching process. Thus, it will be possible not only to make predictions regarding preservice teachers’ performances and efforts in their future profession but also to revise the curriculum in a way to include changes to be made for teachers to develop themselves accordingly. Considering the fact that self-efficacy belief is likely to influence such teacher behavior as making efforts, giving feedback and teaching in the field, it could be stated that high level of self-efficacy belief in biology teaching can increase the quality of biology education to be given by preservice teachers (Savran and Çakıroğlu, 2001; Gerçek et al., 2006).
In literature, there is a great deal of research demon-strating that web-aided cooperative learning applications have positive influence on students’ achievements, views and attitudes towards lessons (Soller, 2001; Ling and Heng, 2006; Dewiyanti et al., 2007; Tseng et al., 2008; Liu and Tsai, 2008; El-Deghaidy and Nouby, 2008; Demirdağ, 2011). On the other hand, the number of studies conducted on WACLE applications in biology education is fairly limited (Vesisenaho et al., 2010).

Hevedanlı 559
Table 1. Distribution of the demographic data regarding the study group.
f %
Gender Male 24 80 Female 6 20
Do you have a computer? Yes 21 70 No 9 30
What level do you think is your computer use skill?
Very inefficient 2 6,7 Inefficient 2 6,7 Average 3 10 Efficient 21 70 Very efficient 2 6,7
What level do you think is your Internet use skill?
Very inefficient 0 0 Inefficient 6 20 Average 8 26,7 Efficient 14 46,7 Very efficient 2 6,7
For how many hours a week do you use the Internet?
Never 2 6,7 0-1 4 13,3 1-3 3 10 3-5 10 33,3 5 and longer 11 36,7
Therefore, the present study is thought to contribute to the field.
This study examined the influence of WACLE in biology education on preservice teachers’ motivations and on their self-efficacy beliefs in biology education. METHOD The pretest-posttest research design without control group has been used in the study. Study group The study was carried out with 30 students (24 female students and 6 male students) taking the fourth-grade course of “ Seed Plants Systematics Laboratory” in the department of Biology Education at Z.G. Education Faculty at Dicle University in Turkey in the Spring Term of the academic year of 2012-2013. Table 1 presents personal information about the study group.
As can be seen in Table 1, there was no obstacle to hinder the research process with respect to the study group students’ use of the Internet and computer. Data collection tools Motivation scale The scale developed by Özerbaş (2003) was made up of 30 Likert-type items, 17 of which were positive statements and 13 of which
were negative statements. The items in the motivation scale used in the study were rated as a five-point scale: “I completely agree”, “I agree”, “I am neutral”, “I disagree” and “I completely disagree”. For the original version of the scale, the Cronbach Alpha reliability coefficient was calculated as .88. For the present study, it was found to be .91. Self-efficacy belief scale for biology teaching In order to determine the biology preservice teachers’ self-efficacy beliefs in biology teaching, the Self-Efficacy Belief Scale for Biology Teaching was used. The Self-Efficacy Belief Scale for Science Teaching developed by Enochs and Riggs in 1990 was adapted into Turkish by Tekkaya et al. (2002). Atılboz (2007) transformed the scale into Self-Efficacy Belief Scale for Biology Teaching by replacing the word “Science” found in the original scale with the word “Biology”. The scale included 23 items and two sub-dimensions. Of all the items, 13 of them (2, 3, 4, 6, 7, 12, 16-22) measured the sub-dimension of “Personal Self-Efficacy”, and 10 of them (1, 5, 8, 9, 10, 11, 13, 14, 15 and 23) measured the sub-dimension of “Result Expectation”. The scale was a five-point Likert-type scale rated as 1= “I completely disagree”, 2= “I disagree”, 3= “I am neutral”, 4= “I agree” and 5= “I completely agree”. For the present study, the reliability coefficients were calculated as 0,89 for the sub-dimension of “Personal Self-Efficacy”, as 0,78 for the sub-dimension of “Result Expectation” and as 0,91 for the total scale.
Study The study was carried out within the scope of the course Seed Plants Systematics Laboratory in the Spring Term of the academic

560 Educ. Res. Rev.
Figure 1. Lesson screen.
year of 2012-2013. The application was carried out in four course-hours a week, and the process lasted 15 weeks. In order to form the online dimension of the web-aided cooperative learning environment, a website (www.webdestekli.com) was designed using Moodle LMS. Among the cooperative learning techniques, the Student Team Achievement Division (STAD) technique was used. The general features of the website used in the study were as follows: 1. Every student signed up the website by giving the necessary information and obtained a username and a password. The students used their usernames and passwords for out-of-class online access. In addition, each group obtained a separate username and password. For in-class online activities, the group username and password were used. After signing in the website, the home page appears. On the home page, the section of courses included the list of active courses and the headings of lesson units. In addition, the home page also included the calendar and presented the researcher’s contact information. 2. After signing in the website, the students could see the lesson screen made up of several sections (Figure 1). On the left, there were such sections as online users, comments, random vocabulary and updated news regarding nature. On the right was a list of recent activities, recent forum news, messages and forthcoming activities. The lesson page was designed according to the “subject draft.” Thus, in line with the course syllabus, the students were allowed to access the content related to the subject of the week before coming to class. The lesson screen gave information about the methods applied and about student behavior expected during the application. Also, a news forum for course-related announce-ments was included in the lesson screen. These announcements can be seen in the section below the heading of recent news on the right side of the lesson screen as well. For the purpose of creating a more permanent and effective learning environment while transferring the subjects, techniques appropriate to different
learning styles were used. Students could follow the subjects via the summary page, presentations, animations and videos gathered from different sources and different websites (tübitak, wikipedia and so on) related to the subject (Figure 2). In addition, dictionaries, quizzes, research subjects, forums and photo galleries related to each subject were included. 3. The students’ sign-in and sign-out times for the website and the duration of time they spent on each subject were determined by the system. With the help of such data, the teacher had the chance to warn the students concerned when necessary. Following this, the phase of forming the cooperative learning groups was put into effect. In this phase, while forming the groups, special attention was paid to heterogeneous distribution of the students into groups. For this purpose, based on the students’ achievement grades in the Fall Term course of “Seedless Plants Systematics”, the order of students’ achievement grades was determined. In addition, taking the students’ gender into consideration, they were divided six groups with five students in each. The students were informed about the group rules, and were asked to name their groups and to share the duties among themselves (technology assistant, note taker, material provider and so on).
Before the application started, the pretests were applied, and the students were given a two-hour training on the WAT environment. First of all, they were informed about the web-aided cooperative learning environment. Following this, with the help of a computer connected to the projector in class, the website was introduced, and the students practically learnt how to sign up the website and what to consider while following the activities. During the lessons, a balance was achieved between face-to-face and online environ-ments as appropriate to the course outcomes. Before coming to class, the students had the opportunity to be prepared for the lesson by examining the summary of the subject, its presentation, the subject-related videos and animations as well as other links via the Internet. First, as appropriate to the STAD technique in face-to-

Hevedanlı 561
Figure 2. Sample activity screen (teaching subjects with animations).
face environment, the lesson was briefly presented. As the students were already prepared for the lesson, the focus was mostly on the web-aided activities. Each group was provided with a laptop computer, and the students carried out the online activities. In this respect, the worksheets previously prepared were distributed to the groups. The worksheets included not only subject-related questions that required researching but also web-related duties (entering the meanings of the terms and the related photos into the dictionary regarding the subject given to each group of students, forming a photo gallery regarding the members of the subject-related families and carrying out activities like drag-and-drop via the web). As for the out-of-class activities, the students took online quizzes. In addition, the activities carried out each week were evaluated in the forum section. Once a subject was completed, another subject was made accessible. At the end of each section, the students’ personal development scores and the group scores were calculated and announced (Figure 2). As a result of the application, the group coming first was awarded. Table 2 presents the study schedule. FINDINGS Findings regarding the difference between the biology preservice teachers’ motivations before and after the application In order to determine whether there were differences between the study group of biology preservice teachers’ motivations before and after the application, the paired sample t-test was applied on the motivation scale pretest-posttest scores. The findings obtained are presented in Table 3.
When Table 3 is examined, it is seen that there was a significant difference between the study group biology preservice teachers’ motivation scale pretest ( X = 3.21) and posttest ( X = 3.88) scores (t(29) = -4.600, p <.05). Depending on this result, it could be stated that the activities carried out led to a positive change in the participants’ motivations. Findings regarding the biology preservice teachers’ pretest-posttest scores related to their self-efficacy beliefs in biology teaching In order to determine the difference between the biology preservice teachers’ self-efficacy beliefs in biology teaching before and after the application, paired samples t-test was applied The findings obtained are presented in Table 4. When Table 4 is examined, it is seen that there was no significant difference ( t(29) = -1.288, p >.05) between the study group preservice teachers’ pretest ( X = 3.65) and posttest ( X = 3.82) scores regarding their self-efficacy beliefs in biology teaching. Based on this result, it could be stated that the participants’ self-efficacy beliefs in biology teaching increased, but the increase was not found statistically significant.
In order to determine whether the difference between the sub-dimensions of “personal self-efficacy” and “result expectation” of the self-efficacy belief scale for biology

562 Educ. Res. Rev.
Table 2. Study schedule.
Week Activity 1 Introduction – Application of the Pretests 2 General Characteristics of Seeded Plants–Open Seeded Plants 3 Open Seeded Plants 4 Closed Seeded Plants-Dicotyledonae (1st Sub-class) 5 Closed Seeded Plants-Dicotyledonae (2nd Sub-class) 6 Closed Seeded Plants-Dicotyledonae (3rd Sub-class) 7 Closed Seeded Plants-Dicotyledonae (3rd Sub-class) 8 Mid-term exam 9 Closed Seeded Plants-Dicotyledonae (4th Sub-class) 10 Closed Seeded Plants-Dicotyledonae (4th Sub-class) 11 Closed Seeded Plants-Dicotyledonae (5th Sub-class) 12 Closed Seeded Plants-Dicotyledonae (6th Sub-class) 13 Closed Seeded Plants-Monocotyledonae 14 Closed Seeded Plants-Monocotyledonae 15 Application of Posttests
Table 3. Paired samples t-test results regarding the biology preservice teachers’ motivation scale pretest-posttest scores. Study group N X SS sd t P Pretest
30 3.21 0.619
29 -4.600 .000 Posttest 3.88 0.540
Table 4. Paired samples t-test regarding the comparison of the biology preservice teachers’ pretest-posttest scores related to their self-efficacy beliefs in biology teaching. Study group N X SS sd t P Pretest
30 3.65 0.400
29 -1.288 0.208 Posttest 3.82 0.629
teaching, paired samples t-test was applied on the groups’ pretest-posttest scores. The findings obtained are presented in Table 5.
When Table 5 is examined, it is seen that there was no significant difference (t(29) = -1.121, p >.05) between the study group preservice teachers’ pretest ( X = 3.79) and posttest ( X = 3.85) scores regarding the dimension of self-efficacy. In addition, no significant difference (t(29) = -1.226, p >.05) was found between the pretest score ( X = 3.46) and posttest score ( X = 3.64) for the dimension of result expectation. Depending on this result, it could be stated that the study group preservice teachers’ self-efficacy beliefs in biology teaching increased for the sub-dimensions of personal self-efficacy and result expectation, but the increase was not found statistically significant.
DISCUSSION AND CONCLUSION The purpose of this study was to examine the influence of the web-aided cooperative learning environment on students’ motivations and on their self-efficacy beliefs in biology teaching. The findings obtained in the study demonstrated that the biology preservice teachers’ motivation levels regarding the teaching-learning process in the WACL environment increased while their self- efficacy beliefs in biology teaching did not differ significantly. The findings obtained were also consistent with the participants’ views found in the forum section of the website. The participants reported that the learning environment made the lessons more entertaining; that they enjoyed working together; that the environment resulted in permanent learning; that they established

Hevedanlı 563
Table 5. Paired samples t-test results regarding the biology preservice teachers’ pretest-posttest scores related to the sub-dimensions of the self-efficacy scale.
Dimensions Group N X SS sd t P
Personal self-efficacy
Pretest 30 3.79 0.512 29 -1.121 0.272
Posttest 30 3.85 0.656
Result expectation
Pretest 30 3.46 0.494 29 -1.226 0.230
Posttest 30 3.64 0.716 stronger communication both with their friends and with the teacher; and that their motivation increased thanks to such opportunities as getting prepared before the lesson and revising after the lesson with the help of the website. In addition, it was found out that the participants’ self-efficacy beliefs in biology teaching did not differ significantly for such possible reasons as lack of use of these methods in other courses and the short duration of the application (only one academic term). Researchers claim that in short-duration studies, it is quite difficult to observe changes in students’ self-efficacy perceptions and in their attitudes towards courses (Maskan and Güler, 2004; Çepni et al., 2006; Gönen and Kocakaya, 2008).
In addition, those who design and develop web-aided courses should take it into consideration that emotions, motivations and attitudes are important components of students’ cognitive and social development. Groups of individuals who fail to emphatize with one another and to understand each other’s feelings cannot work together for a long time (Martin and Reigeluth, 1999). Andres (2002) points out that use of the class and Internet environments together in cooperative learning helps students become individuals who can structure and actively learn the information rather than passively understanding the information and that if well-structured, it could lead to a high level of motivation that cannot be achieved in traditional class environments. Blue and Tirotta (2011), in their study conducted with university students, examined the effectiveness and limitations of the tools that they defined as 21st century tools (blogs, wikis and interactive board). The results of their study revealed that the moti-vation levels of all the participating students increased and that those who failed to use the 21st century technologies were unable to develop positive attitudes at all. In literature, there is a great deal of research demon-strating that participants’ motivation levels increase in cooperative learning environments (Martin, 2005; Barbato, 2000; Bernero, 2000).
In related literature, there are also other studies reporting that web-aided or computer-aided instruction does not have any influence on students’ self-efficacy perceptions. Tataroğlu (2009) found out that use of a smart board in the course of mathematics did not cause a significant difference in students’ self-efficacies in
mathematics. Demir (2010) applied the web-aided learning circle approach in the course of physics and demonstrated that there was no significant difference in the participants’ self-efficacies in the course of physics. In another study, Akıncı and Erdem (2010) examined the student-oriented blended learning environment with respect to the students’ performance of participation in online discussions, their responsibility in management of learning and their levels of self-regulation. When the students with average levels of Internet self-efficacy belief were compared with those with high levels of Internet self-efficacy belief in terms of participation performance, no significant difference was found in-between. Lynch and Dembo (2004) examined the final grades of 94 students in blended learning environment and found no significant difference in the students’ Internet self-efficacies. All these results are consistent with those obtained in the present study.
In line with the findings obtained in this study, the following suggestions can be put forward: The study could be conducted with an application process of a longer period of time to increase preservice teachers’ self-efficacy beliefs. Considering the increasing motivation levels, this method could also be applied in different courses. In addition, entertaining applications such as competitions and puzzles could be included in the content of the webpage. Conflict of Interests The author(s) have not declared any conflict of interests. REFERENCES Açıkgöz KÜ (1992). İşbirlikli öğrenme: Kuram, araştırma, uygulama.
Malatya: Uğurel Matbaası. Akıncı A, Erdem M (2010). Öğrenci Yönetimli Karma Öğrenme
Ortamlarındaki Çevrimiçi Tartışmalara Katılımın Yönetme Sorumluluğu ve İnternet Öz-yeterliği Açısından İncelenmesi. Uluslararası Öğretmen Yetiştirme Politikaları ve Sorunları Sempozyumu II. Ankara.
Akkoyunlu B (1998). Technological developments in education. In: Ozer B (Eds.), Contemporary new technologies in education Eskisehir, Anadolu University Publications. 10(21):1-12.
Alptekin Y, Ertem O (1999). Eğitim için İnternet, İnternet için Eğitim:

564 Educ. Res. Rev. Elektronik İletişim ve Etik. Türkiye’de İnternet Konferansı.
http://inettr.org.tr/inetconf5/ tammetin/alptekin.doc. Access Date:12.03.2010.
Andres HP (2002). A Comparison of Face to Face and Virtual Software Development Teams. Team Perform. Manage. 8(1):39-48.
Arslan A (2006). Bilgisayar destekli eğitim yapmaya ilişkin tutum ölçeği. Yüzüncü Yıl Üniversitesi Eğitim Fakültesi Dergisi. 3(2):24–33.
Ashton P (1984). Teacher efficacy: A motivational paradigm for effective teacher education. J. Teacher Educ. 35:28-32.
Atılboz G (2007). Öğrenme Halkası Modelinin Biyoloji Öğretmen Adaylarının Difüzyon ve Osmoz Konularını Öğrenmeleri, Biyoloji Öğretimine Yönelik Öz-yeterlik İnançları ve Tutumları Üzerine Etkileri. Yayınlanmamış Doktora Tezi, Gazi Üniversitesi, Eğitim Bilimleri Enstitüsü, Ankara.
Bal HÇ (2010). Bilgisayarın Tarihçesi. Bilgisayar ve İnternet Kullanımı Laboratuar Uygulamaları, Murathan Yayınları, ISBN:978-605-5937-64-5, Trabzon,1-2.
Bandura A (1997). Self-Efficacy: The Exercise Of Control. New York: W.H. Freeman.
Barbato R (2000). Policy implications of cooperative learning on the achievement and attitudes of secondary school mathematics students. Unpublished doctoral dissertation. Fordham University, New York.
Barnard V, Samberg J (1993). Open Learning Environment: What Support Should They Offer? Proceeding of The International Conference on Computers in Education, Taipei, Taiwan. 156-161.
Bernero J (2000). Motivating Students in Math Using Cooperative Learning. Chicago, Illinois: Saint Xavier University, Field-Based Master’s Program.
Blue E, Tirotta R (2011). Cloud Computing and Interactive Whiteboards in Teacher Preparation. Teach Trends, 55(3):31-39.
Conrad RM, Donaldson A (2004). Engaging the Online Learner: Activities and Resources for Creative Instruction. San Francisco: Jossey-Bass, 2004.
Cüez T (2006). İlköğretim 8. Sınıflarda Fen Bilgisi Dersinde Web Tabanlı Öğretim Desteğinin Öğrenci Başarısına Etkisi. Unpublished M.A. Thesis, Institute of Educational Sciences, Dokuz Eylül University.
Çallı İ, Torkul O, Taşbaş N (2003). İnternet Destekli Öğretimde Kullanılmak Üzere Web-Erişimli Veri Tabanı Yönetim Sistemleri ile Ölçme ve Değerlendirme Sistemi Tasarımı. Third International Education Technologies Symposium, Turkish Republic of Northern Cyprus, I: 563-569.
Çepni S, Taş E, Köse S (2006). The Effect of Computer-Assisted Material on Students’ Cognitive Levels, Misconseptions and Attitudes towards Science. Computers Educ. 46 (2):192-205.
Demir C (2010). Web Destekli Öğrenme Halkası Yaklaşımı’nın Lise 3. Sınıf Öğrencilerinin Fizik (Yeryüzünde Hareket Konusu) Başarıları ve Öz-yeterlik Algılarına Etkisi. Unpublished Doctorate Thesis, Institute of Science, Dicle University, Diyarbakır.
Demirdağ B (2011). Anorganik Kimya Dersinde Web Destekli İşbirlikli Öğrenme. Unpublished Doctorate Thesis, Institute of Educatinal Sciences, Dokuz Eylül University, İzmir.
Demirel Ö (2010). Eğitimde Program Geliştirme. 11. Basım, Pagem A Yayıncılık: Ankara.
Dewiyanti S, Brand Gruwel S, Jochems W, Broers NJ (2007). Students‟ Experience With Collaborative Learning in Asynchronous Computer-Supported Collaborative Learning Environments. Computers Human Behav. 23(1):496-514.
El-Deghaidy H, Nouby A (2008). Effectiveness of a Blended E-Learning Cooperative Approach in an Egyptian Teacher Education Programme. Computers Educ. 51:988–1006.
Enochs LG, Riggs, IM (1990). Further Development of an Elementary Science Teaching Efficacy Belief Instrument: A Preservice Elementary Scale. School Sci. Math. 90(8):694-706.
Fenton CA (1992). Cooperative learning view from the inside. Contemporary Educ. 63(3):207-209.
Garrison DR, Anderson T (2003). E-Learning in the 21st century, London: RoutledgeFalmer.
Gerçek C, Yılmaz M, Köseoğlu P, Soran H (2006). Biyoloji Eğitimi Öğretmen Adaylarının Öğretiminde Özyeterlik İnançları. Ankara
Üniversitesi Eğitim Bilimleri Fakültesi Dergisi. 39(1):57-73. Gönen S, Kocakaya S (2008). Öğretim Teknolojileri ve Duyuşsal
Özelliklere Etkisi, II. Uluslararası Bilgisayar ve Öğretim Teknolojileri Sempozyumunda sunulmuş bildiri, Education Faculty, Ege University, İzmir.
Graham CR (2006). Blended Learning Systems: Definition, Current Trends, and Future Directions. The Handbook of Blended Learning Global Perspectives, Locak Designs. (Ed: C. J. Bonk; C. R. Graham). Pfeiffer.SanFrancisco. http://www.public ation share.com/graham_intro.pdf. Access Date: 05.03. 2009 .
Hoppe HU (2007). The Role of Technology in CSCL-Educational Information Technologies and Collaborative Learning. (Editors: Hoppe, H.U., Ogata, H., Soller A.). Springer Science+Business Media, LLC. New York. ISBN: 978- 0- 387- 71135-5.
Horton W (2002). Designing Web-based Training. NY: Wiley. Jianhua Z, Akahori K (2001). Proceedings of Second International
Conference on Information Technology Based Higer Education and Training. Kumamoto, Japan, July 4-6.
Johnson D, Johnson R (2002). Learning together and alone:Overview and meta-analysis. Asia Pacific J. Educ. 22(1):95–105.
Khan BH (1997). Web based instruction. Education Technology Publication. Englewood Cliffs, NJ.
Ling T, Heng YK (2006). A Case Study Of Online Collaborative Learning. Q. Rev. Distance Educ. 7(4):361-375.
Liu CC, Tsai CC (2008). An Analysis Of Peer Interaction Patterns as Discoursed by On-Line Small Group Problem-Solving Activity. Computers Educ. 50:627–639.
Lynch R, Dembo M (2004). The Relationship Between Self-Regulation and Online Learning in a Blended Learning Context. International Review of Research in Open and Distance Learning. http://www.irrodl.org/content/v5.2/lynch-dembo.html Access Date:19.03.2010.
Martin BL, Reigeluth C (1999). Affective education and the affective domain:Implications for instructional design theories and models. In C.M. Reigeluth (Ed.), Instructional design theories and model: A new paradigm of instructional theory. 3, 485-511. Hillside, NJ: Lawrance Erlbaum Associates.
Martin RL (2005). Effects of Cooperetive And Individual Integrated Learning Systems On Attitudes And Achievement In Mathematics. Unpublished doctoral dissertation. Miami, Florida: Florida International University.
Maskan AK, Güler G (2004). Kavram Haritaları Yönteminin Fizik Öğretmen Adaylarının Elektrostatik Kavram Başarısına ve Elektrostatiğe Karşı Tutumuna Etkisi. Çağdaş Eğitim Dergisi. 309:34-41.
McConnell D (2000). Implementing computer supported cooperative learning, London: Kogan Page.
McCormack C, David J (1998). Building a Web-Based Education System, John Wiley & Sons, Inc., New York, USA.
Mclnnerney JM, Roberts TS (2004). Collaborative or cooperative learning? In T.S. Roberts (Ed.) Online collaborative learning: Theory and practice, Hershey: Information Science Publishing, Idea Group Inc. 203-214.
Osguthorpe RT, Graham CR (2003). Blended Learning Environments Definitions and Directions. Q. Rev. of Distance Educ. 4(3):227-233.
Özerbaş A (2003). Bilgisayar Destekli Bağlaşık Öğretimin Öğrenci Akademik Başarısı, Motivasyon ve Transfere Etkisi. Doktora tezi. Ankara Üniversitesi Eğitim Bilimleri Enstitüsü, Ankara.
Palloff RM, Pratt K (2007). Building Online Learning Communities: Effective Strategies for The Virtual Classroom. Second Edition, San Francisco: Jossey-Bass, 2007.
Savran A, Çakıroglu J (2001). Preservice Biology Teachers’ Perceived Efficacy Beliefs In Teaching Biology. Hacettepe Üniversitesi Egitim
Fakültesi Dergisi, 21:105-112. Schriver M, Czerniak CM (1999). A Comparison of Middle And Junior
High Science Teachers Levels of Efficacy And Knowledge of Developmentally Appropriate Curriculum And Instruction, J. Sci. Teacher Educ. 10(1):21-42.
Senemoğlu N (1997). Gelişim Öğrenme ve Öğretim Kuramdan Uygulamaya, Ertem Matbaacılık, Ankara.
Singh H (2003). Building Effective Blended Learning Programs. Educ.

Technol. 43(6):51-54. http://www.bookstoread.com/framework/blended-learning.pdf.
Slavin RE (1990). Cooperative Learning: Theory, Research and Practice. Prentice Hall, New Jersey.
Smith SM (2002). Using the Social Cognitive Model to Explain Vocational Interest in Information Technology. Information Technol, Learn. Performance J. 20(1):1-9.
Soller A (2001). Supporting Social Interaction In an Intelligent Collaborative Learning System. International J. Artificial Intelligence Educ 12:40–62.
Sünbül AM (2004). Bilgisayar Uygulamaları ve Eğitim Amaçlı Kullanımı. Yıldız, R. Öğretim Teknolojileri ve Materyal Geliştirme. Nobel Yayıncılık, Page: 220. Konya.
Şahin I (2008). From the Social-Cognitive Career Theory Perspective: A College of Education Faculty Model for Explaining their Intention to Use Educational Technology. J. Educ. Comput Res. (JECR) 38(1):51-66.
Şensoy S (2005). KTÜ BÖTEB İçin Bir Web Tabanlı Eğitim Sitesi Geliştirilmesi ve Kullanılabilirliğinin İncelenmesi. Doctorate Thesis, Institute of Science, Karadeniz Technical University, Trabzon.
Tataroğlu B (2009). Matematik Öğretiminde Akıllı Tahta Kullanımının 10. Sınıf Öğrencilerinin Akademik Başarıları, Matematik Dersine Karşı Tutumları ve Öz-Yeterlik Düzeylerine Etkileri. Unpublished M.A. Thesis, Institute of Educational Sciences, Dokuz Eylül University, İzmir.
Tekkaya C, Cakiroglu J, Ozkan O (2002). Turkish pre-service science teachers’ understanding of science and their confidence in teaching it. J. Educ. Teach. 30:57-68.
Tseng KH, Chiang FK, Hsu WH (2008). Interactive processes and learning attitudes in a web-based problem-based learning (PBL) platform. Comput. Hum. Behav. 24:940–955.
Hevedanlı 565 Uzunboylu H (2002). Web Destekli İngilizce Öğretiminin Öğrenci
Başarısı Üzerindeki Etkisi. Doctorate Thesis, Institute of Educational Sciences, Ankara University, Ankara.
Vesisenaho M, Valtonen T, Kukkonen J, Havu-Nuutinen, S, Hartikainen A, Karkkainen S (2010). Blended Learning With Everyday Technologies to Activate Students’ Collaborative Learning. Sci. Educ. Int. 21 (4):272-283.
Wilson EK, Marsh II GE (1995). Social Studies and The Internet Revolutions. Social Educ. 59:198-202.
Young JR (2002). Hybrid Teaching Seeks to End the Divide Between Traditional and Online Instruction. Chronicles Higher Educ. A33. http://chronicle.com/article/Hybrid-Taching-Seeks-to/18487. Access Date: 19.11.2009.

Vol. 10(5), pp. 566-576, 10 March, 2015 DOI:10.5897/ERR2015.2081 Article Number: 753BD2A51098 ISSN 1990-3839 Copyright © 2015Author(s) retain the copyright of this article http://www.academicjournals.org/ERR
Educational Research and Reviews
Full Length Research Paper
Mathematics education and democracy education
Ömer Faruk ÇETİN
Erzincan University, Faculty of Education, Department of Elementary Mathematics Education, Erzincan/ Turkey.
Received 12 January, 2015; Accepted 4 February, 2015
Democracy is a most accepted form of government system and has a great importance for citizens by allowing them equal and active participation in common life. As its development and characteristics are important for all citizens of a country, each democratic country puts much emphasis on democracy education in its educational curricula. In recent years, some developments about democracy education in national state school in Turkey have been seen and educational goals about teaching democracy have been developed by Ministry of National Education of Turkey. This study aims to show that educational goals of mathematics education are helpful for accomplishment of learning outcomes of democracy education. In the study, it is hypothesised that a well-educated individual having the qualities of mathematics education behaves in accordance with democracy. Based on this hypothesis, goals of mathematics education were determined and researched that students having educational outcomes of these goals also achieve the outcomes of democracy education without taking any formal course in schools. Therefore, a scale about the outcomes of mathematics and democracy education was developed and applied to university students in the department of mathematics education. Findings verified the hypothesis and showed that students having educational outcomes of mathematics education have the qualities of democracy education and can play important roles in positive development process of democracy. Key words: Democracy, democracy education, mathematics education, educational outcome.
INTRODUCTION Democracy Democracy is a widespread form of government in common life and is important for all citizens of a democratic country. Keeping this common system safe and developing it in a positive way matter much to governments and citizens. Democracy is a kind of belief expression. But this expression has to be based on logic (Lindsay, 1973, p. 84). This logic is not a need of
commitment to an authority; it is actually a way of meeting the need by creating self-esteem and the power of problem-solving. This makes education essential (Ertürk, 1986, p. 3). Factors affecting democracy education There are a number of factors affecting democracy
E-mail: [email protected] Authors agree that this article remain permanently open access under the terms of the Creative Commons Attribution License 4.0 International License

education (Mahlomaholo, 2014). Though geography, history, race and age are the unchangeable factors, other factors such as education level and economic status are easiest unchangeable factors among those factors In addition there are also other factors such as religion. (Chan and Wong, 2014), gender, traditions and norms which are accepted as extremely challenging for changing. Contributions of Mathematics and Mathematics education to individual and social development In this study, the easiest one “Education level (Dewey, 1966)”, specifically mathematics education (Skovsmose, 1998) from the above factors was questioned in detail. Mathematical knowledge is one of the most reliable information of mankind. Though people have differences in religion, race, language and belief, they show a common acceptance on mathematical information. Democracy is an agreement regime. Mathematical know-ledge presenting significant contributions to agreement between people has not contradicted with any information yet. With its feature, it supports other disciplines too. Mathematical knowledge gives meaning to the aesthetic side of people (Kelsey, 2013). Therefore, other disciplines use mathematical knowledge for making their information more reliable, concrete and most accepted one. Trust is a very important goal for all societies and governments and at that point mathematical knowledge gains significance in trust. As the mathematical know-ledge is a kind of knowledge gained with successively verified knowledge, it creates differences and speediness in individuals’ thinking systems (Pinkney and Shaughnessy, 2013). These differences and speediness in thinking enable people perceive behaviours and events easily, make a quick comparison between information and values, and form new information and value judgement (Praetorius et al., 2013). The most important one, that kind of knowledge is instantly accepted by a society or discipline because mathematics is used as a criterion. In science history, any knowledge was not accepted as fast as mathematical knowledge and sometimes some knowledge even created some negative outcomes for its creators or the society. When the knowledge is supported with mathematical knowledge, it is quickly accepted by a large mass. All these features increase expectations towards mathematics and mathematics is seen as a magic wand to overcome almost all problems. People having or desiring to get this knowledge are affected negatively or positively by these expectations. Well-accepted success of mathematics can be named as the mathematics of angels. Maybe mathematics is turned truly into a magic wand when it is broadened to people’s deciding processes and desiring to live together. It can also be helpful in determining and solving undesired social events.
Çetin 567 Mathematics education and democracy education Any individual having mathematical knowledge will definitely make contributions to democracy education with acquired skills and values. This study will be based on this hypothesis. Ministry of National Education of Turkish has conducted some research on the development of democracy education and determined relevant goals (MEB, 2004) on this issue. Some of these issues were uncovered by Gürkaynak (1989) in the XIII Education Meeting of Turkish Education Association held between in 30 November - 1 December of 1989. Gürkaynak (1989) said “Democracy is not simply an action and also includes interpersonal communication as it is stated by Plato and Aristo. Then, being simply a mature is not adequate circumstance for democracy. Citizens also need some other skills like involvement, collaboration, agreement and deciding within group.”
The connection between democracy and mathematics education is not a new topic in the field of mathematics education research (Aguilar and Zavaleta, 2012). In the studies on democracy and mathematics education (Adler, 1988; Bourdieu, 1991; Büyükkaragöz, 1990; Cesar and Torres, 1997; D’Ambrosio, 1990; Dewey, 1966; Goodlad, 1994; Gömleksiz, 1988; Hannaford, 1998; Kasap et al., 2013; Küçükahmet, 1989; Savaş, 2003; Schleicher and Kase, 2000; Skovsmose, 1990; Skovsmose, 1998; Steen, 1999; Şimşek, 2000; Tate, 1996; Valero, 1997; Valero, 1999; Woodrow, 1997; Yıldırım, 1994), the effects of educational context and democracy education on mathematics education are mostly emphasised. There are also some studies proposing that individuals having the power of mathematics can make positive contribu-tions to their society (Gutstein and Peterson, 2005, p.2) and social equality and justice (eMalloy, 2008; Stemhagen, 2014). In this study, it is hypothesised that mathematics education is an adequate prerequisite for democracy education and this ascertain will be tried to be revealed in the study by being different than the other studies. However, it can also be alleged that democracy education is an adequate prerequisite for mathematics education. Therefore, further research can also be conducted for testing this contradictory ascertain. The aim of the study The study aims to determine whether the goals of democracy education can be described within the frame of the goals of mathematics education curriculum. Below sub-problem in line with this aim was questioned in this study. “With which goals of mathematics education can an individual gain some attitudes and skills of democracy education?”

568 Educ. Res. Rev. METHODOLOGY In this section, research design, study participants, instruments, data collection and analysis processes were presented in detail. Research design This study hypothesizes that an individual educated in accordance with the educational goals of mathematics education can also accomplish the goals of democracy education. A mixed method, specifically sequential exploratory strategy design, which deals with the problem in detail with two sequential phases, first qualitative and second quantitative (Creswell, 2003) was adopted in this study. In the qualitative phase, the goals of mathematics education and democracy education in the curricula as developed by the Ministry of National education were determined and associated with each other. In the quantitative phase, a form was prepared based on the associations among democracy and mathematics education and presented to the participants of the study. The participants of the study 100 university students from a faculty of education (Teacher training departments of Primary teacher, Elementary mathematics and Turkish language) and a faculty of science and letters (Department of mathematics) located in East Anatolian Region of Turkey participated in the study. University students were specifi-cally chosen for the study as they are eighteen; which means that they can behave and think freely and have a critical mental capacity of answering the questions.
The participants were determined in three steps. Firstly they were chosen according to the convenience sampling strategy which allows researchers to reach the study group easily in terms of time, money, transportation, etc. (Büyüköztürk et al., 2010). Secondly four groups of university students having different mathematics education levels were chosen from a convenient university. In the determination process of the different departments, the variable of having different levels of mathematics education background was considered and therefore maximum variation sampling which aims to reach different groups for researching different dimensions of the same problem (Büyüköztürk et al., 2010). Thirdly, equal numbers of students from each department (n:25) were randomly invited to participate in the study. Simple random sampling strategy allows participants to have equal chance of being selected for the study (Büyüköztürk et al. 2010) Instruments As a data collection instrument, “Democracy Education Scale (DES) was used and the development process of the scale is given below.
Firstly, the fifteen goals of mathematics education (MEB, 2005) were determined and then four of them (explaining mathematical ideas logically, using mathematical language appropriately for sharing, creating self-esteem and attitude towards mathematics, and accepting the power and the network relationships of mathematics) which are related to learning, learning context and learning process were removed from the study. Though there are some indirect democracy studies on above goals, there is less democracy research on the rest eleven goals which are about the outcomes of mathematics education. In this context, a test including eleven open-ended items was formed based on these eleven outcomes. The test was applied to ten teachers from different departments and each item of the test was presented with a five-
point Likert scale. The pilot study of DES was conducted with ten people from various areas such as education, law and engineering in order to test the comprehensibility. It was seen that all items were clear for understanding and the test was finished between forty and fifty minutes. Later, the test was applied to 100 students for the main study and the items having less than .300 factor loadings were removed from the test. Data collection and analysis DES was applied to students in the four classrooms at the same time in the same day and the participants freely filled the test without giving any personal data. Each test form was numbered from one to one hundred and the test items were ranged from 0 to 5 (i.e. 0=Blank item, 1=Strongly Disagree, 2= Disagree, 3=Neutral, 4= Agree, 5=Strongly Agree) in data entrance process to computer. In the data presentation, each goal of eleven goals of mathematics education was presented in tables. Each goal was accepted as a separate factor and results of factor analyses and the values of Cronbach’s Alpha were interpreted. In tables the groups (Yes= Strongly Agree and Agree, No= Strongly Disagree and Disagree, Neutral= Blank item and Neutral) were presented with percentages. The findings of the study was analysed with a descriptive approach from quantitative research methods (Yıldırım and Şimşek, 2005) and each item was descriptively analysed. FINDINGS In this section, the findings related to the relationships between the outcomes of mathematics education and the attitudes and skills gained with the democracy education were presented in tables one by one.
The attitudes and skills gained with the democracy education can be achieved by an individual educated in accordance with the first goal of mathematics education, ‘The individual will be able to understand mathematical concepts and systems, make relations between them and use these concepts and systems in daily life and other learning fields.’ These were given in Table 1.
As it is seen in Table 1, the participants said ‘Yes’ the least (45%) to the item ‘Does moral questioning’ and the most (91%) to the item ‘Apply information resources and use them’. Also they were neutral the most (43%) to the item ‘Avoid disagreement.’ and said ‘No’ the most (20%) to the item ‘Does moral questioning.’ According to factor analyses, the item ‘Applies information resources and use them’ has the least factor loading (,319) and ‘Has a culture of discussion and agreement’ has the highest factor loading (,733). Cronbach's Alpha coefficient is .893.
The attitudes and skills gained with democracy education can be achieved by an individual educated in accordance with outcomes of the third goal of mathematics education, ‘The individual will be able to make inferences about logical induction and deduction’ are given in Table 2.
As it is seen in Table 2, the participants said ‘Yes’ the least (58%) to the item ‘Is devoted to the principles of social pluralism.’ and the most (92%) to the item ‘Acknowledges and evaluates.’ Also they were neutral the most (32%) to the item ‘Believes the benefits of democratic principles, institutions and systems.’ and said ‘No’ the most (12%) to the item ‘Is devoted to the principles of social pluralism.’ According to factor analyses, the item ‘Is productive’, has the least factor loading (.312) and ‘Accepts the values of mutual understanding, collaboration, equality, justice and mutual support’ has the highest loading (,733). Cronbach's Alpha coefficient is .831.
The attitudes and skills gained with the democracy education can be achieved by an individual educated in accordance with out-comes of the fourth goal of mathematics education, ‘The I ndividual

Çetin 569
Table 1. Factor loadings and percentages with regard to the accomplishment levels of expected attitudes and skills gained with democracy education by an individual having as outcomes the first goal of mathematics education. An individual who understands mathematical concepts and systems, makes relations between them and uses these concepts and systems in daily life and other learning fields,
Factor loading
Yes Neutral No
Applies information resources and uses them. ,319 91 9 0 Finds constructive, collaborative, nonviolent, attributive and peaceful solutions for social problems. ,664 57 30 13
Is a participant. ,579 74 14 12 Acknowledges and evaluates. ,667 82 9 9 Communicates in multiple ways. ,608 63 29 8 Creates public interest. ,673 49 41 10 Avoids disagreement. ,667 47 43 10 Is linked to law, justice and equality in the differences of the world. ,670 54 35 11 Does moral questioning. ,637 45 35 20 Accepts the values of mutual understanding, collaboration, equality, justice and mutual support. ,677 60 28 12
Has a culture of discussion and agreement. ,733 71 20 9 Thinks critically. ,534 82 13 5 Does collaboration and team work. ,660 75 17 8 Struggles with prejudice and discrimination. ,577 64 26 10 Believes the benefits of democratic principles, institutions and systems. ,731 58 28 14
Table 2. Factor loadings and percentages in terms of the accomplishment levels of expected attitudes and skills gained with democracy education by an individual having as outcomes the third goal of mathematics education. An individual who can make inferences about logical induction and deduction, Factor loading
Yes Neutral No
Acknowledges and evaluates. ,369 92 7 1 Solves problems. ,544 88 10 2 Reaches the virtue of respect to the society’s values, honours, beliefs and freedom. ,602 62 31 7
Is productive. ,312 87 11 2 Is a participant. ,602 79 18 3 Believes the benefits of democratic principles, institutions and systems. ,687 60 32 8
Finds constructive, collaborative, nonviolent, attributive and peaceful solutions for social problems. ,616 73 22 5
Is a peacemaker and facilitator. ,559 64 29 7 Communicates in multiple ways. ,433 82 13 5 Has a culture of discussion and agreement. ,543 81 16 3 Thinks critically. ,554 74 21 5 Accepts the values of mutual understanding, collaboration, equality, justice and mutual support. ,694 68 22 10
Is devoted to the principles of social pluralism. ,614 58 30 12 Respects and tolerates different cultures and their contributions to humanity. ,604 70 21 9
will be able to express his/her mathematical ideas and inferences in the process of solving mathematical problem’ are given in Table 3. As it is seen in Table 3, the participants said ‘Yes’ the least (48%)
to the item ‘Is devoted to the principles of social pluralism.’ and the most (96%) to the item ‘Solves problems.’ Also they were neutral the most (41%) to the item ‘Is devoted to the principles of social

570 Educ. Res. Rev.
Table 3. Factor loadings and percentages with regard to the accomplishment levels of expected attitudes and skills gained with democracy education by an individual having the fourth goal of mathematics education. An individual who can express his/her mathematical ideas and inferences in the process of solving mathematical problems,
Factor Loading
Yes Neutral No
Is productive. ,420 92 3 5 Solves problems. ,315 96 3 2 Acknowledges and evaluates. ,472 87 8 5 Finds constructive, collaborative, nonviolent, attributive and peaceful solutions for social problems. ,603 60 28 12
Communicates in multiple ways. ,708 74 13 13 Is a peacemaker and facilitator. ,643 62 24 14 Is an active person. ,613 70 21 9 Accepts democratic leadership. ,706 52 31 17 Accepts the development of humanity as a fundamental principle. ,692 66 25 9 Avoids disagreement. ,745 56 33 11 Reaches the virtue of respect to the society’s values, honours, beliefs and freedom. ,762 55 30 15
Is a participant. ,585 77 16 7 Creates public interest. ,522 56 33 11 Is devoted to the principles of social pluralism. ,520 48 41 11 Respects and tolerates different cultures and their contributions to humanity. ,642 61 25 16
Believes the importance of the individual responsibility. ,529 83 10 5 Struggles with prejudice and discrimination. ,596 67 32 11 Does moral questioning. ,507 50 33 16 Is a systematic, careful, patient and responsible person. ,357 78 16 6
pluralism.’ and said ‘No’ the most (17%) to the item ‘Accepts democratic leadership.’ According to factor analyses, the item ‘Solves problems’ has the least factor loading (.315) and ‘Reaches the virtue of respect to the society’s values, honours, beliefs and freedom’ has the highest factor loading (.762). Cronbach's Alpha coefficient is .893.
The attitudes and skills gained with the democracy education can be achieved by an individual educated in accordance with outcomes of the sixth goal of mathematics education, ‘The individual will be able to use the skills of prediction and mental operation’ are given in Table 4.
As it is seen in Table 4, the participants said ‘Yes’ the least (43%) to the item ‘Does moral questioning’ and the most (92%) to the item ‘Solves problem.’ Also they were neutral the most (37%) to the items ‘Is linked to law, justice and equality in the differences of the world, Does moral questioning, Accepts democratic leadership’ and said ‘No’ the most (28%) to the item ‘Is linked to law, justice and equality in the differences of the world.’ According to factor analyses, the item ‘Is productive’ has the least factor loading (.348) and ‘Accepts the values of mutual understanding, collaboration, equality, justice and mutual support’ has the highest loading (.668). Cronbach's Alpha coefficient is .786.
The attitudes and skills gained with the democracy education can be achieved by an individual educated in accordance with outcomes of the seventh goal of mathematics education, ‘The individual will be able to create problem solving strategies and use them for solving daily life problems ’ are given in Table 5.
As it is seen in Table 5, the participants said ‘Yes’ the least (52%) to the item ‘Accepts democratic leadership’ and the most (89%) to
the item ‘Is a participant.’ Also they were neutral the most (39%) to the item ‘Accepts democratic leadership.’ and said ‘No’ the most (10%) to the item ‘Believes the benefits of democratic principles, institutions and systems.’ According to factor analyses, the item ‘Acknowledges and evaluates’ has the least factor loading (.345) and ‘Is linked to law, justice and equality in the differences of the world’ has the highest loading (,702). Cronbach's Alpha coefficient is .846.
The attitudes and skills gained with the democracy education can be achieved by an individual educated in accordance with outcomes of the eighth goal of mathematics education, ‘The individual will be able to form models, link the models with oral and mathematical expressions’ are given in Table 6.
As it is seen in Table 6, the participants said ‘Yes’ the least (48%) to the item ‘Accepts democratic leadership’ and the most (92%) to the item ‘Applies information resources and uses them.’ Also they were neutral the most (41%) to the item ‘Accepts democratic leadership’ and said ‘No’ the most (12%) to the item ‘Avoids disagreement.’ According to factor analyses, the item ‘Accepts democratic leadership’ has the least factor loading (.376) and ‘Avoids disagreement’ has the highest factor loading (.606). Cronbach's Alpha coefficient is 815.
The attitudes and skills gained with the democracy education can be achieved by an individual educated in accordance with outcomes of the eleventh goal of mathematics education, ‘The individual will be able to create and develop intellectual interest’ Are given in Table 7.
As it is seen in Table 7, the participants said ‘Yes’ the least (53%) to the item ‘Does moral questioning’ and the most (87%) to the

Çetin 571
Table 4. Factor loadings and percentages in terms of the accomplishment levels of expected attitudes and skills gained with democracy education by an individual having the sixth goal of mathematics education.
An individual who can use the skills of prediction and mental operation,
Factor loading
Yes Neutral No
Is productive. ,513 88 7 5 Is an active person. ,417 80 12 8 Accepts the development of humanity as a fundamental principle. ,586 60 28 12 Is linked to law, justice and equality in the differences of the world. ,571 45 37 28 Finds constructive, collaborative, nonviolent, attributive and peaceful solutions for social problems. ,538 52 35 13
Thinks critically. ,656 68 17 15 Is a peacemaker and facilitator. ,613 58 27 15 Does moral questioning. ,668 43 37 20 Avoids disagreement. ,348 49 36 15 Solves problem. ,569 92 4 4 Applies information resources and uses them. ,396 80 12 8 Acknowledges and evaluates. ,627 81 15 4 Accepts democratic leadership. ,479 51 37 12 Communicates in multiple ways. ,578 68 23 9
Table 5. Factor loadings and percentages in terms of the accomplishment levels of expected attitudes and skills gained with democracy education by an individual having the seventh goal of mathematics education.
An individual who can create problem solving strategies and use them for solving daily life problems,
Factor loading
Yes Neutral No
Is a participant. ,380 89 7 4 Believes the importance of the individual responsibility. ,561 80 14 6 Is a peacemaker and facilitator. ,469 80 16 4 Acknowledges and evaluates. ,345 88 9 3 Believes the benefits of democratic principles, institutions and systems. ,598 59 31 10 Accepts the indivisibility of human rights and freedom as a fundamental principle. ,604 66 28 6 Finds constructive, collaborative, nonviolent, attributive and peaceful solutions for social problems. ,538 80 18 2
Is linked to law, justice and equality in the differences of the world. ,702 66 27 7 Thinks critically. ,375 83 12 5 Has a culture of discussion and agreement. ,503 79 16 5 Accepts democratic leadership. ,617 52 39 9 Creates public interest. ,503 61 32 7 Avoids disagreement. ,508 66 27 7 Does moral questioning. ,666 57 36 7 Accepts the development of humanity as a fundamental principle. ,558 73 23 5 Struggles with prejudice and discrimination. ,632 65 27 8 Is an active person. ,399 85 12 3 Is a systematic, careful, patient and responsible person. ,379 88 7 5 items ‘Thinks critically and Communicates in multiple ways.’ Also they were neutral the most (35%) to the item ‘Avoids disagreement’ and said ‘No’ the most (15%) to the item ‘Does moral questioning.’ According to factor analyses, the item ‘Is an active person.’ has the
least factor loading (.367) and ‘Is a peacemaker and facilitator’ has the highest loading (,606). Cronbach's Alpha coefficient is .829.
The attitudes and skills gained with the democracy education can be achieved by an individual educated in accordance with

572 Educ. Res. Rev.
Table 6. Factor loadings and percentages in terms of the accomplishment levels of expected attitudes and skills gained with democracy education by an individual having the eighth goal of mathematics education.
An individual who can form models, link the models with oral and mathematical expressions,
Factor loading
Yes Neutral No
Is a participant. ,502 86 14 0 Accepts democratic leadership. ,589 48 41 11 Creates public interest. ,537 62 28 10 Solves problem. ,377 91 7 2 Is an active person. ,574 77 17 6 Is a peacemaker and facilitator. ,648 67 25 8 Thinks critically. ,629 87 10 3 Reaches the virtue of respect to the society’s values, honours, beliefs and freedom. ,618 60 31 9 Does collaboration and team work. ,514 78 17 2 Applies information resources and uses them. ,376 92 7 1 Accepts the development of humanity as a fundamental principle. ,573 65 28 7 Finds constructive, collaborative, nonviolent, attributive and peaceful solutions for social problems. ,598 71 24 5
Avoids disagreement. ,666 56 32 12
Table 7. Factor loadings and percentages in terms of the accomplishment levels of expected attitudes and skills gained with democracy education by an individual having the eleventh goal of mathematics education.
An individual who can create and develop intellectual interest, Factor loading
Yes Neutral No
Thinks critically. ,431 87 11 2 Is a participant. ,575 86 10 4 Communicates in multiple ways. ,466 87 10 3 Is an active person. ,367 83 11 6 Accepts democratic leadership. ,489 59 33 8 Accepts the development of humanity as a fundamental principle. ,591 67 27 6 Creates public interest. ,437 61 34 5 Is productive. ,585 74 18 8 Acknowledges and evaluates. ,609 80 13 7 Applies information resources and uses them. ,509 77 17 6 Believes the importance of the individual responsibility. ,482 70 23 11 Is linked to law, justice and equality in the differences of the world. ,517 66 26 4 Avoids disagreement. ,623 54 35 11 Does moral questioning. ,598 53 32 15 Is a peacemaker and facilitator. ,687 68 23 9 Finds constructive, collaborative, nonviolent, attributive and peaceful solutions for social problems. ,477 71 24 5
outcomes of the twelfth goal of mathematics education, ‘The individual will be able to comprehend the historical developments of mathematics, its role and value in the development of people’s ideas and its significance of the usage in other disciplines’’ are given in Table 8.
As it is seen in Table 8, the participants said ‘Yes’ the least (38%) to the item ‘Accepts democratic leadership.’ and the most (86%) to the items ‘Is productive and Applies information resources and uses them.’ Also they were neutral the most (46%) to the item ‘Accepts
democratic leadership.’ and said ‘No’ the most (18%) to the item ‘Does moral questioning.’ According to factor analyses, the item ‘Solves problem.’ has the least factor loading (.379) and ‘Finds constructive, collaborative, nonviolent, attributive and peaceful solutions for social problems.’ has the highest factor loading (.646). Cronbach's Alpha coefficient is .836.
The attitudes and skills gained with the democracy education can be achieved by an individual educated in accordance with outcomes of the thirteenth goal of mathematics education, ‘The

Çetin 573
Table 8. Factor loadings and percentages in terms of the accomplishment levels of expected attitudes and skills gained with democracy education by an individual having the twelfth goal of mathematics education. An individual who can comprehend the historical developments of mathematics, its role and value in the development of people’s ideas and its significance of the usage in other disciplines,
Factor loading Yes Neutral No
Is an active person. ,596 63 24 13 Believes the benefits of democratic principles, institutions and systems. ,596 56 28 16
Applies information resources and uses them. ,393 86 13 8 Has a culture of discussion and agreement. ,643 61 30 2 Accepts the development of humanity as a fundamental principle. ,475 70 13 8 Thinks critically. ,515 81 14 5 Solves problem. ,379 85 8 7 Is a participant. ,627 77 13 10 Reaches the virtue of respect to the society’s values, honours, beliefs and freedom. ,629 56 33 11
Accepts democratic leadership. ,640 38 46 16 Avoids disagreement. ,593 46 31 13 Is productive. ,443 86 10 4 Finds constructive, collaborative, nonviolent, attributive and peaceful solutions for social problems. ,646 46 37 7
Struggles with prejudice and discrimination. ,523 59 28 13 Does moral questioning. ,520 44 38 18
Table 9. Factor loadings and percentages in terms of the accomplishment levels of expected attitudes and skills gained with democracy education by an individual having the thirteenth goal of mathematics education.
An individual who can develop being a systematic, careful, patient and responsible person,
Factor loading
Yes Neutral No
Acknowledges and evaluates. ,517 95 3 2 Does collaboration and team work. ,329 85 10 5 Solves problem. ,555 89 9 2 Has a culture of discussion and agreement. ,662 86 10 4 Believes the importance of the individual responsibility. ,551 91 7 2 Creates public interest. ,516 60 32 8 Is a peacemaker and facilitator. ,683 80 17 3 Communicates in multiple ways. ,604 83 10 7 Is productive. ,326 82 11 7 Respects and tolerates different cultures and their contributions to humanity. ,395 83 11 6
Applies information resources and uses them. ,415 84 15 1 Accepts democratic leadership. ,474 56 30 14 Accepts the indivisibility of human rights and freedom as a fundamental principle. ,563 61 30 9
Accepts the values of mutual understanding, collaboration, equality, justice and mutual support. ,626 79 18 3
Reaches the virtue of respect to the society’s values, honours, beliefs and freedom. ,460 83 13 4
Is a systematic, careful, patient and responsible person. ,416 93 5 2 individual will be able to develop being a systematic, careful, patient and responsible person’ are given in Table 9.
As it is seen in Table 9, the participants said ‘Yes’ the least (56%)
to the item ‘Accepts democratic leadership’ and the most (95%) to

574 Educ. Res. Rev.
Table 10. Factor loadings and percentages in terms of the accomplishment levels of expected attitudes and skills gained with democracy education by an individual having the fourteenth goal of mathematics education. An individual who can make research, create knowledge and develop power of usage, Factor loading
Yes Neutral No
Solves problem. ,672 93 2 5 Applies information resources and uses them. ,681 96 2 2 Acknowledges and evaluates. ,462 94 3 3 Is productive. ,458 95 4 1 Accepts the development of humanity as a fundamental principle. ,546 69 20 11 Finds constructive, collaborative, nonviolent, attributive and peaceful solutions for social problems. ,568 71 16 13
Communicates in multiple ways. ,460 77 16 7 Thinks critically. ,614 82 13 5
the item ‘Acknowledges and evaluates.’ Also they were neutral the most (32%) to the item ‘Creates public interest.’ and said ‘No’ the most (14%) to the item ‘Accepts democratic leadership.’ According to factor analyses, the item ‘Is productive.’ has the least factor loading (.326) and ‘Is a peacemaker and facilitator’ has the highest loading (.683). Cronbach's Alpha coefficient is .805.
The attitudes and skills gained with the democracy education can be achieved by an individual educated in accordance with outcomes of the fourteenth goal of mathematics education, ‘The individual will be able to make research, create knowledge and develop power of usage’ are given in Table 10.
As it is seen in Table 10, the participants said ‘Yes’ the least (69%) to the item ‘Accepts the development of humanity as a fundamental principle’ and the most (96%) to the item ‘Applies information resources and uses them.’ Also they were neutral the most (20%) to the item ‘Accepts the development of humanity as a fundamental principle’ and said ‘No’ the most (13%) to the item ‘Finds constructive, collaborative, nonviolent, attributive and peaceful solutions for social problems.’ According to factor analyses, the item ‘Is productive’ has the least factor loading (,458) and ‘Applies information resources and uses them.’ has the highest factor loading (,681). Cronbach's Alpha coefficient is ,677.
The attitudes and skills gained with the democracy education can be achieved by an individual educated in accordance with outcomes of the fifteenth goal of mathematics education, ‘The individual will be able to link mathematics and art, and develop aesthetic feelings’ are given in Table 11.
As is seen in Table 11, the participants said ‘Yes’ the least (43%) to the item ‘Is devoted to the principles of social pluralism’ and the most (87%) to the item ‘Is productive.’ Also they were neutral the most (39%) to the item ‘Creates public interest.’ and said ‘No’ the most (20%) to the items ‘Is devoted to the principles of social pluralism and Struggles with prejudice and discrimination.’ According to factor analyses, the item ‘Is productive.’ has the least factor loading (,312) and ‘Believes the importance of the individual responsibility’ has the highest factor loading (,677). Cronbach's Alpha coefficient is .826. RESULTS, DISCUSSION AND SUGGESTIONS The first goal of mathematics education ‘The individual will be able to understand mathematical concepts and systems, make relations between them and use these concepts and systems in daily life and other learning fields.’ achieved fifteen educational outcomes of demo-
cracy education. The second goal, ‘The individual will be able to make inferences about logical induction and deduction’ achieved fourteen educational outcomes of democracy education. The third goal, ‘The individual will be able to express his/her mathematical ideas and inferences in the process of solving mathematical problems’ achieved nineteen educational outcomes of democracy education. The third goal, ‘The individual will be able to use the skills of prediction and mental operation’ achieved fourteen educational outcomes of democracy education. The fourth goal, ‘The individual will be able to create problem solving strategies and use them for solving daily life problems’ achieved eighteen educational outcomes of democracy education. The fifth goal, ‘The individual will be able to form models, link the models with oral and mathematical expressions’ achieved thirteen educational outcomes of democracy education. The sixth goal, ‘The individual will be able to create and develop intellectual interest’ achieved sixteen educational outcomes of democracy education. The seventh goal, ‘The individual will be able to comprehend the historical developments of mathematics, its role and value in the development of people’s ideas and its significance of the usage in other disciplines’ achieved fifteen educational outcomes of democracy education. The eight goal, ‘The individual will be able to develop being a systematic, careful, patient and responsible person’ achieved sixteen educational outcomes of democracy education. The ninth goal, ‘The individual will be able to make research, create knowledge and develop power of usage.’ achieved eight and the tenth goal ‘The individual will be able to link mathematics and art, and develop aesthetic feelings’ achieved seventeen educa-tional outcomes of democracy education.
In addition, findings of each item in the tables can be reviewed one by one. As the focus of this study is not interpretation of statistical knowledge reached with the separate analyses of these items, it will be adequate to give the minimum ‘Yes’ rate (38%) and ‘No’ rate (16%) for the aim of the study. This finding shows that the

Çetin 575
Table 11. Factor loadings and percentages in terms of the accomplishment levels of expected attitudes and skills gained with democracy education by an individual having the fifteenth goal of mathematics education.
An individual who can link mathematics and art, and develop aesthetic feelings, Factor loading
Yes Neutral No
Is productive. ,312 87 9 4 Believes the importance of the individual responsibility. ,677 65 24 11 Thinks critically. ,395 77 16 7 Avoids disagreement. ,537 56 28 16 Does collaboration and team work. ,640 61 24 15 Is devoted to the principles of social pluralism. ,361 43 37 20 Respects and tolerates different cultures and their contributions to humanity. ,420 80 16 4
Creates public interest. ,418 51 39 10 Is a peacemaker and facilitator. ,517 66 36 8 Is a participant. ,613 80 13 7 Is an active person. ,560 70 22 8 Does moral questioning. ,574 46 37 17 Has a culture of discussion and agreement. ,582 73 20 7 Believes the benefits of democratic principles, institutions and systems. ,555 56 33 11
Is linked to law, justice and equality in the differences of the world. ,484 65 22 13 Finds constructive, collaborative, nonviolent, attributive and peaceful solutions for social problems. ,608 70 23 7
Struggles with prejudice and discrimination. ,448 44 36 20 minimum ‘Yes’ rate of the items is higher than the ‘No’ rate. The findings also indicate that an individual educated in accordance with the goals of mathematics education can acquire the attitudes and skills of democracy education. This finding is in parallel to a number of studies’ findings. Valero (1997) found that if people educated with the goal of mathematics education including teaching democracy, they can solve the problems with mathematical knowledge when they meet two different ideologies. Valero (1999) also found that mathematics education in school has an effective role in the reinforcement for democratic social relationships. In parallel to research findings, Goodlad (1994) found that mathematics forms the spirit of democracy and moral values in shaping democracy. In addition, Hannaford (1998) found that mathematics should be taught as a tool for helping problem solving and then given within a universal logic in accordance with the goal of problem solving in all areas ranging from daily life issues to political ones. Cesar and Torres (1997) said mathema-tical knowledge is a path to the meaning of knowledge, and Steen (1999) said mathematics is a new social literacy for understanding democracy in society. Gutstein and Peterson (2005) found that the students who are aware of the power of mathematics can understand their own power in forming a democratic society and they can take active roles in society. In addition, Malloy (2008) found that the students can use their skills for social
equality and justice by using mathematics after they learn how to adapt mathematics for other cases. Considering above issues and the findings of the study, if we desire a constant positively changing democracy, we should educate individuals in society having the outcomes of mathematics education. As a last, further qualitative and quantitative research is needed on this issue especially the contents presented in tables in the findings. Such studies can be helpful for the authorities who are in charge of deciding and giving ways to education. Conflict of Interests The author has not declared any conflict of interests REFERENCES Adler J (1988). Towards democratic mathematics education in South
Africa. In Lengwitch, 3, 83–98. Aguilar MS, Zavaleta JGM (2012). On the links between mathematics
education and democracy: A literature review. Pythagoras, 33(2), Art. #164, 15 pages. http://dx.doi.org/10.4102/ pythagoras.v33i2.164
Bourdieu, P. (1991). Language and symbolic power, edited with an introduction by John B. Thompson. Cambridge: Polity Press.
Büyükkaragöz S (1990). Orta öğretimde demokrasi eğitimi [Democracy education in elementary education]. Ankara: Türk Demokrasi Vakfı Yayınları.
Büyüköztürk Ş, Kılıç ÇE, Akgün EA, Karadeniz Ş, Demirel F (2010). Bilimsel araştırma yöntemleri [Scientific research methods] (5. Baskı) Ankara: Pegem A Akademi.

576 Educ. Res. Rev. Chan YC, Wong NY (2014). Worldviews, religions, and beliefs about
teaching and learning: perception of mathematics teachers with different religious backgrounds. Educational Studies in Mathematics, 87(3):251-277.
Creswell JW (2003). Research design: Qualitative, quantitative, and mixed methods approaches (2nd ed.). Thousand Oaks, CA: Sage.
D’Ambrosio U (1990). The role of mathematics in building up a democratic society and the civilizatory mission of the European powers since the discoveries. In R. Noss, A. Brown P, Dowling P, Drake M, Harris C, Hoyles S, Mellin-Olsen (Eds.). Political Dimensions of Mathematics Education: Action and Critique. Proceedings of the First International Conference 13-21. London: Institute of Education, University of London.
Dewey J (1966). Democracy and education. New York: The Free Press.
Ertürk S (1986). Diktaci tutum ve demokrasi [Authoritative attitude and democracy]. Ankara: Yelkentepe Yayınları.
Goodlad JI (1994). Schooling U.S.A. University of Washington and Institute for educational inquiry.
Gömleksiz M (1988). Demokratik bir sınıf ortamı açısından Hacettepe Üniversitesi Eğitim Fakültesi öğretim elemanlarının ve öğrencilerinin davranışlarının değerlendirilmesi [An Evalauation of lecturers and students of attitudes in Hacettepe University, faculty of education], Unpublished master’s thesis, Hacettepe University, Ankara, Turkey.
Gutstein E, Peterson B.(Eds.) (2005). Rethinking mathematics: Teaching social justice by the numbers. Milwaukee, W1: Rethinking Schools, LTD.
Gürkaynak M (1989). Demokrasi eğitiminde boyutlar ve sorunlar: Demokrasi için eğitim [Dimensions and problems in democracy education: Democracy for education]. Türk Eğitim Derneği XIII. Eğitim Toplantısı 30 Kasım-1 Aralık, Türk Eğitim Derneği Bilim Dizisi No: 13.
Hannaford C (1998). Mathematics teaching is democratic education. ZDM, 30(6):181-187.
Kasap HÖ, Savaş R, Duru A (2013). Matematik öğretmenlerinin matematik ve demokrasi arasındaki ilişkiye ait görüşlerinin incelenmesi [The investigation of mathematics teachers’ ideas on the relationship between mathematics and democracy] Uşak Üniversitesi Sosyal Bilimler Dergisi, 6(1), 279-295.
Kelsey GA (2013). Social choice in a liberal arts mathematics course. PRIMUS, 23(2):161-172.
Küçükahmet L (1989). Democratic teacher (Unpublished master’s thesis). Gazi University, Ankara, Turkey.
Lindsay AD (1973). Demokrasinin esasları [The principles of democracy]. Millı̂ Eǧitim Basımevi.
Mahlomaholo SMG (2014). Higher education and democracy: analysing communicative action in the creation of sustainable learning environments: Part 1: exploration of the critical relationship between higher education and the development of democracy in South Africa. South African J Higher Edu., 28(3):678-696.
Malloy CE (2008). Looking throughout the world for democratic access to mathematics. In L.D. English (Ed.), Handbook of international research in mathematics education (pp. 20-31). London: Taylor and Francis/Routledge.
MEB -Milli Eğitim Bakanlığı [Ministry of National Education] (2004). Milli Eğitim Bakanlığı demokrasi eğitimi ve okul meclisleri yönergesi [The guide of democracy education and school boards of National Ministry of Education]. Retrieved from http://mevzuat.meb.gov.tr.
MEB -Milli Eğitim Bakanlığı [Ministry of National Education] (2005).
İlköğretimokulu matematik dersi 6-8. sınıflar öğretim programı [Elementary mathematics programme of 6 to 8 grades]. Ankara: MEB
Pinkney J, Shaughnessy MF (2013). Teaching critical thinking skills: A modern mandate. Int. J Acad. Res., 5(3):346-352.
Praetorius AK, Berner VD, Zeinz H, Scheunpflug A, Dresel M (2013). Judgment confidence and judgment accuracy of teachers in judging self-concepts of students. The J Edu. Res., 106(1):64-76.
Savaş E (2003). Matematik eğitimi ile demokrasi arasındaki ilişki üzerine bir çalışma [A research on the relationship between mathematic education and democracy education]. Eğitim Araştırmaları Dergisi, 11.
Schleicher D, Kaase M (2000). Mathematics and democracy. Retrieved from http://www.maa.org/ql/mathanddemocracy.html
Skovsmose O (1990). Mathematical education and democracy. Educational Studies in Mathematics, 21.
Skovsmose O (1998). Linking mathematics education and democracy: Citizenship, mathematical archaeology, mathemacy and deliberative interaction. Zentralblatt für Didaktik der Mathematik, 30(6):195-203.
Steen LA (1999). Numeracy: The new literacy for a data drenched society. Educational Leadership, 57(2):8-13.
Stemhagen K (2013). Education for Citizenship and Social Justice in the United States: The Peculiar Case of Mathematics Education. In Mulcahy D, Mulcachy D, Brock R (eds.) Education in North America. New York: Bloomsbury/Continuum.
Şimşek A (2000). Sınıfta demokrasi [Democracy in education]. Ankara: Eğitim Sen Yayınları.
Tate IV WF (1996). Mathematizing and the democracy: The need for an education that is multicultural and social reconstructionist. In C. A. Grant & ML Gomez (Eds.), Making schooling multicultural: Campus and classroom 185–201. New Jersey: Merrill.
Valero P (1997). A day to be true. Mathematics education for democracy in Colombia. Chreods, 11:49–61.
Valero P (1999). Deliberative mathematics education for social democratization in Latin America. Zentralblatt für Didaktik der Mathematik, 31(1):20-26.
Woodrow D (1997). Democratic education: Does it exist – especially for mathematics education? For the Learning of Mathematics, 17(3):11–16.
Yıldırım L (1994). İlköğretim birinci kademe öğretmenlerinin demokratik tutum ve davranışları ile öğrencilerin demokratik davranışları arasındaki ilişkilerin saptanması [Determination of the relationships between Democratic attitudes and behaviors of primary school teachers and students]. Unpublished master’s thesis, Ankara University, Ankara, Turkey.

Vol. 10(5), pp. 577-581, 10 March, 2015 DOI:10.5897/ERR2015.2083 Article Number: D8EA18551102 ISSN 1990-3839 Copyright © 2015Author(s) retain the copyright of this article http://www.academicjournals.org/ERR
Educational Research and Reviews
Full Length Research Paper
Investigation of the relationship between physical activity level and healthy life-style behaviors of
academic staff
Mutlu TURKMEN*, Ali OZKAN, Murat KUL and Taner BOZKUS
Bartın University, Physical Education and Sport College, Bartın, Turkey.
Received 1 January, 2015; Accepted 22 February, 2015
The purpose of the study was to determine the relationship of physical activity (PA) level and healthy life-style behaviors in academic staff in Bartın University, Turkey. The short form of International Physical Activity Questionnaire was administered for the determination of physical activity level of academic staff. Their PA levels were categorised as inactive, minimally active, and physically active by using MET method. For the determination of healthy life-style behaviors, Health-promoting Life-style Profile Questionnaire was used with self-actualization (SA), health responsibility (HR), exercise (E), nutrition (N), interpersonal support (IS), and stress management (SM) subscales. Results of Pearson’s Product Moment Correlation analyses indicated significant positive correlations between total physical activity level and exercise (r=0.52; p<0.01) and healthy life-style behaviors (r=0.47; p<0.01) among the study subjects. There was no significant correlation between healthy life-style behaviors and sport index of physical activity questionnaire (p>0.05). The findings of the study indicated that healthy life-style behaviors were not indicators of physical activity level of academic staff. Key words: Academic staff, health-promoting life-style, life-style profile scale, physical activity,
INTRODUCTION Physical activity level and health-poromoting life-styles are two important interrelated topics under examination. Health-promoting life-styles include activities that are focused on improving the level of well-being. Physical activities take an important role in well-being. The focus of these activities is on the development of positive potential for physical, social, mental, intellectual or spiritual health (Ebem, 2007). Considering this multi-dimensional structure of health promotion (e.g. physical, social, mental, and intellectual), the researchers identified
six health-promoting behaviors. These are social support, life appreciation, health responsibility, stress manage-ment, nutrition, and exercise (physical activity) behaviors (Walker et al., 1987; Walker and Hill-Polerecky, 1996; Physical Activity and Public Health, 1995; Esin, 1997). Therefore, it is generally accepted that physical activity (PA) can improve quality of life and is a critical component in reducing or eliminating health disparities through lowering heartbeat rate and blood pressure at rest; reducing hypertension and blood glucose; decreasing
*Corresponding author. E-mail: [email protected]. Tel: +90 312 3102060. Fax: +90 312 3106050. Authors agree that this article remain permanently open access under the terms of the Creative Commons Attribution License 4.0 International License

578 Educ. Res. Rev. fat mass; increasing lean body mass, bone mass, bone strength and muscle strength; preventing arthritis, some types of cancer and type 2 diabetes (Kramer et al., 1996; WHO, 2010; Turkish National Burden of Disease, 2004). There is also evidence that regular PA may reduce or prevent mild or moderate depression (Yıldırım, 2010). Further, with developing technology, many individuals pursue sedentary activities and become physically less active. Sedentary life-style leads to a greater risk of developing coronary heart disease, hypertension, high blood lipid profile, type 2 diabetes, obesity, and some forms of cancer, like colon and breast cancer (Turkmen et al., 2013).
Several studies found some socio-demographic variables to be related to the practice of health behaviors (Beşer et al., 2007). Duffy et al. (1986) found that age and education affected healthy life-style behaviors. More-over, with increase in age, education, work experience, status, and income, health-promoting behaviors also increased. Kuster and Fong (1993) reported that age, education, and income play important roles in promoting healthy life-style behaviors. Walker et al. (1987) stated that workers received the highest scores on self-actualization and exercise, but that they got low scores on health responsibility and stress management. Similar to this finding, Esin (1997), in her study on 450 workers, established that workers had a moderate level of healthy life-style behaviors. In addition, physical activity and exercise play important roles in prevention and improvement of mild to moderate depressive disorders, anxiety, and stress management. Regular physical activity and exercise help improve physical fitness of individuals and, therefore, promote a healthy life-style. Physical fitness is the ability of an individual to perform occupational, recreational and daily activities without becoming unduly fatigued and has components, like aerobic fitness, muscular fitness, flexibility, and body composition. However, in order for the exercise to improve physical fitness of an individual, the exercise program should have standardized principles (ACSM, 2011; Heyward, 1997; Turkmen et al., 2013)
Previous studies in health-promoting behaviors indicated a high level of risky health behaviors in the university academic staff. Specifically, sedentary life-styles and low physical activity level were the most critical findings from these studies. Other studies examining the physical activity behavior as a health-promoting factor found that physical activity level dramatically decreases from high school to the university years (Ebem, 2007). Goldfield et al. (2012) pointed out the importance of gaining healthy life-style behaviours during preschool years. Although health-promoting behaviors of the university academic staff were examined in several studies, there is a lack of knowledge about those behaviors of the students who have just entered the university. Moreover, there have been limited studies on health-promoting behaviors, such as health responsibility, self-actualization, health control, stress management,
nutrition, and exercise; also, very few health-promoting programs have been developed in Turkey (Beşer et al., 2007). The objective of this study was to examine the health-promoting behaviors, especially the physical activity levels of the academic staff in Bartın University to determine the relationship between healthy life-style behaviors and physical activity level in the study subjects. MATERIALS AND METHODS Subjects and experiment approach One hundred and two male and female academic staff members (4 professors, 5 associate professors, 24 assistant professors, 39 lecturers, 30 research assistants) in Bartın University participated in this study voluntarily. The questionnaires were self-applied by the academic staff. Mean±SD age of them was 42.4±11.03 years; height was 169.4±7.1 cm; weight was 71.3±9.7 kg; and BMI was 23.4±3.4. Before data collection, the subjects were given information comprehensibility of the questions. Health-promoting life-style profile scale The participants were asked to provide information about the demographic factors, such as age, gender, and education. Health-promoting Life-style Profile Scale was used for collecting data on their health behaviors. The scale was developed by Walker et al. (1987). It is composed of 48 items and 6 subscales and consists of questions about health-promoting behaviors. The subscales were on self-actualization (SA), health responsibility (HR), exercise (E), nutrition (N), interpersonal support (IS), and stress management (SM). The total score reflects the healthy life-style behavior. Four more items were added to the scale, and now the scale is composed of 52 items (Walker et al., 1996). Each respondent was asked to rate each item on Likerts’ 1 to 4 response scale where 1 corresponds to never, 2 sometimes, 3 often, 4 regularly. Alpha coefficient reliability of the scale was 0.92, and alpha coefficient reliability of the subscales varied from 0.70 to 0.90.
The reliability of the scale for Turkish population was tested by Esin and Akça. Alpha coefficient reliability of the scale was 0.91 in Esin’s study and 0.90 in Akça’s study. International physical activity questionnaire (IPAQ) IPAQ is a validated instrument to determine physical activity level of the participants (Craig et al., 2003). IPAQ measures the frequency, duration, and level of intensity of physical activity in the last seven days across all contexts and allows for the calculation of metabolic equivalents (MET). MET presents the weekly amount of physical activity. It is a product of frequency, duration, and intensity of the physical activity performed in the last seven days. Physical activity level was measured as hours per week (MET-hours/week) calculated according to the existing guidelines (IPAQ, 2005). Based on the self-reported MET, frequency, and intensity of the physical activity, people can be classified into groups having low, moderate and high level of physical activity.
Inactive (sedentary, low) group included the participants who reported lower than 600 MET-min/week of exercise, minimally active (moderate level of physical activity) group included the participants who reported 601-3,000 MET-min/week of exercise, and physically active group (high, recommended level) included the participants who reported more than 3,000 MET-min/week of exercise. In this study, PA levels of the participants were evaluated

Turkmen et al. 579
Table 1. Mean and standard deviation of scores of the healthy life-style behavior among the study participants.
Healthy life style behavior Mean SD Self-actualization 43.51 6.32 Health responsibility 27.52 4.60 Exercise 10.72 4.26 Nutrition 20.13 2.43 Interpersonal support 23.02 4.12 Stress management 18.25 4.39 Total score of the healthy and life-style behavior 153.28 28.14
Academic staff (n=102).
Table 2. Mean and standard deviation of the physical activity level among the study participants. International Physical Activity Qustionnaira (IPAQ) IPAQ categories Walking (3.3MET) 587.54 MET-min/week Minimally active group (moderate level of
physical activity) (601-3000 MET-min/week)
Moderate (4.0MET) 319.76 MET-min/week Vigorous (8.0MET) 345.19 MET-min/week Total IPAQ 1252.49 MET-min/week
Academic staff (n=102).
Table 3. Correlations between physical activity level and healthy life-style behaviour. Healthy life style behavior Total physical activity level Self-actualization NS Health responsibility NS Exercise 0.52** Nutrition NS Interpersonal support NS Stress management NS Total score of the healthy and life-style behavior 0.47**
Academic staff (n=102).*p<0.05; **p<0.01; NS: Non Significant. through Turkish short version of IPAQ (Öztürk, 2005). Translation and validation study of Turkish version for the university students indicated an evidence for construct validity, criterion validity (accelerometer-IPAQ short form) (r=0.30), and test-retest stability (r=0.69) (Öztürk, 2005). Statistical analyses Means and standard deviations are given as descriptive statistics, and the relationship between healthy life-style behaviors and physical activity level was evaluated by Pearson’s Product Moment Correlation Analysis. All analysers were executed in SPSS for Windows (version 16.0) and the level of statistical significance was set at p<0.05. RESULTS The healthy life-style behaviors and physical activity level
of academic staff in Bartın University as assessed in this study are displayed in Tables 1 and 2, respectively. Table 3 shows the correlations between healthy life-style behaviors and physical activity level.
Table 1 shows the healthy lif-stye behaviors of the academic staff in Bartın University. According to this table, the highest rate was reached in self-actualization sub-scale, and the lowest rate in exercise. This finding depicts the contradictory attitude of academic staff towards exercise.
According to Table 2, the academic staff in Bartın University is in minimally active group.
Results of Pearson’s Product Moment Correlation Analyses indicated significantly positive correlations between total physical activity level and exercise (r=0.52; p<0.01) and healthy life-style behaviors (r=0.47; p<0.01) in the study subjects. There was no significant correlation between healthy life-style behaviors and sport index of

580 Educ. Res. Rev. physical activity questionnaire (p>0.05). The findings of the present study indicated that healthy life-style behaviors were not an indicator of physical activity level of academic staff in the Bartın University of Turkey. DISCUSSION This study explored the relationship between physical activity levels and healthy life-style behaviors of academic staff in Bartın University. It is important to find out the relationship between physical activity and healthy life-style behavior as the results would convey the need for more efficient applications of physical activities in campus life. Physical activity is defined as any bodily movement produced by skeletal muscles that requires energy expenditure. Physical inactivity (lack of physical activity) has been identified as the fourth leading risk factor for global mortality (6% of deaths globally). Regular physical activity and exercise help improve physical fitness (aerobic fitness, muscular fitness, flexibility, and body composition) of individuals and, therefore, promote a healthy life-style (Özkan, 2011). Also, regular physical activity and exercise help improve physical fitness of individuals, thus promoting a healthy life-style.
Physical fitness is the ability of an individual to perform occupational, recreational and daily activities without becoming unduly fatigued and has components, like aerobic fitness, muscular fitness, flexibility, and body composition. However, in order for the exercise to improve physical fitness of an individual, the exercise program should have standardized principles (ACSM, 2011; Heyward, 1997). Many of the previous researches have already outlined the positive relationship between academic success and physical activity in the literature (Chomitz et al., 2009; Logan et al., 2013; Tagoe and Dake, 2011; Tomporowski et al., 2008; Turkmen et al., 2013). However, with developing technology and inten-sive workload, many individuals in academic institutions pursue sedentary activities and become physically inactive (Pirincci et al., 2008). Sedentary life-style leads to a greater risk of developing coronary heart disease, hypertension, high blood lipid profile, type 2 diabetes, obesity, and some forms of cancer, like colon and breast cancer. Many studies reported that engaging in physical activity and exercise on regular basis lowers blood pressure, improves lipoprotein profile, C-reactive protein, and other CHD biomarkers, enhances insulin sensitivity, and plays an important role in weight management (Ay et al., 2012; Knechtle, 2004; Macauley, 1994; Vail, 2005). In addition, physical activity, exercise, and healthy life-style play important roles in the prevention and improvement of mild to moderate depressive disorders and anxiety (Tsai and Liu, 2012). Conclusion The present study depicted that academic staff in Bartın
University are minimally active in terms of physical activity level and have an average score in healthy life-style behaviors. This finding is almost in line with the results of Turkish National Burden of Disease Report (2004), which highlighted that 35% of the male and 71% of the female population in Turkey have healthy life-style behaviors. More specificaly Pirincci et al.(2008) and Guler et al. (2008) reached similar findings in their researches, which were carried on academic staffs in Fırat University and Cumhuriyet University in Turkey. Therefore this study once again confirmed that academic staff need to be motivated for physical activities and necassary facilities should be added to the plans of new university campuses.
This study found strong positive correlations between physical activity levels and healthy life-style behavior subscales. Therefore, based on the citations used in this study, the incorporation of physical activity into campus life would have many beneficial effects on physical, mental, social, and psychological well-being of the academic staff. Physical activity facilities of the universities and the awareness level of the academic staff about these were found to be an important factor for them to participate in physical activity of any kind. ACKNOWLEDGEMENTS The findings of this study were taken from a research project which was financially supported by Bartın University. The author is thankful to the academic staff who participated voluntarily in this research. Conflict of Interests The author has not declared any conflict of interest. REFERENCES American College of Sports Medicine (ACSM) (2011). The
recommended quantity and quality of exercise for developing and maintaining cardiorespiratory, musculoskeletal and neurmotor fitness in apparently healthy adults: guidance for prescribing exercise. Med. Sci. Sports Exercise. 1334-1359.
Ay S, Yanikkerem E, Calim SI, Yazici M (2012). Health-promoting Lifestyle Behaviour for Cancer Prevention: a Survey of Turkish University Students. Asian Pacific J. Cancer Prevention, 13:2269-2277.
Beşer A, Bahar Z, Büyükkaya D (2007). Health Promoting Behaviors and Factors related to Life-style among Turkish Workers and Occupational Health Nurses’ Responsibilities in their Health Promoting Activities. Industrial Health, 45:151–159.
Chomitz VR, Slining MM, McGowan RJ, Mitchell SE, Dawson GF, Hacher KA (2009). Is there a relationship between physical fitness and academic achievement? Positive results from public school children in the northeastern United States. J. Sch. Health, 79: 30-37.
Craig CA, Marshall AL, Sjostrom M, Bauman AE, Booth ML, Ainsworth BE, Pratt M, Ekelund U, Yngve A, Sallis JF, Oja P (2003). International physical activity questionnaire: 12-country reliability and validity. Med. Sci. Sports Exercise 35(8):1381-1395.
Ebem Z (2007). Health Promoting Behaviors and Exercise Stages of

Change Levels of Students at Transition to University. Middle East Technical University Social Sciences Institute an Unpublished PhD Thesis, Ankara.
Esin MN (1997). Evaluation and promotion of health behaviors of industry workers. Istanbul University Health Science Institute an Unpublished PhD Thesis, Istanbul (in Turkish).
Duffy E, Rossow R, Hernandez M (1996). Correlates of health promotion activities in employed Mexican-American women. Nursing Res. 45:18–24.
Goldfield GS, Narvey A, Grattan K, Adamo KB (2012). Physical Activity Promotion in the Preschool Years: A Critical Period to Intervene. Int. J. Environ. Res. Public Health, 9, 1326-1342.
Guler G, Guler N, Kocatas S, Yildirim F, Akgul N (2008). Behaviors of Healthy Life Style of Academic Staff Who Work at A University. Cumhuriyet University J. Nursery, 12(3):18-26.
Heyward V (1997). Advanced Fitness Assessment and Exercise Prescription. Champaign: IL, Human Kinetics.
IPAQ (2005) Research committee Guidelines for data processing and analysis of International Physical Activity Questionnaire (online), Retrieved on 5 August 2013 from http://www.ipaq.ki.se.
Kazemi S, Zarei A, Khodayari A, Mohammadi S (2013). Needs Assessment of Participators in Sport Exercises of Health Stations in Tehran. Aust. J. Basic Appl. Sci. 7(4):543-545.
Knechtle B (2004). Influence of Physical Activity on Mental Well-being and Psychiatric Disorders. Schweiz Rundsch Med Prax, 93:35, 1403-1411.
Kramer MM, Wells CL (1996). Does physical activity reduce risk of estrogendependent cancer in women? Med Sci Sports Exerc., 28: 322-334.
Kuster A, Fong C (1993). Further psychometric evaluation of the Spanish language health promotion life-style profile. Nursing Res. 42, 266–9.
Logan SL, Gottlieb BH, Maitland SB, Meegan D, Spriet LL (2013). The physical Activity Scale for the Elderly (PASE) Questionnaire; Does It Predict Physical Health?. Int. J. Environ. Res. Public Health, 10:3967-3986.
Macauley E (1994). “Physical Activity and Psychosocial Outcomes” in C. Bouchard et al., eds., Physical Activity, Fitness and Health:International Proceedings and Consensus Statement, Champagne, Illinois: Human Kinetics.
Nacar E, Gacar A, Karahüseyinoğlu MF, Gündoğdu C (2013). Analysis for Sports Facilities in Sports High School in terms of Quality and Quantity (Central Anatolia Region Sample). Australian Journal of Basic and Applied Sciences, 7(2): 627-631.
Ozkan A (2011). Is Physical Activity A Key Componenet of Obesity Prevention and Treatment? 1. International Physical Activity, Nutrition and Health Congress Abstracts CD. 23-26 November, Antalya, 27-30.
Ozturk M (2005). A Research on Reliability and Validity of International Physical Activity Questionnaire and Determination of Physical Activity Level in University Students. Hacettepe University Health Science Institute an Unpublished PhD Thesis, Ankara (in Turkish).
Turkmen et al. 581
Physical Activity and Public Health – A Recommendation from the
Centers for Disease Control and Prevention and the American College of Sports Medicine (JAMA) (1995). 273:402-407.
Pirincci E, Rahman S, Durmuş AB, Erdem R (2008). Factors affecting health-promoting behaviours in academic staff. Public Health, 122, 1261 – 1263.
Tagoe HA, Dake FAA (2011). Healthy life-style behavior among Ghanaian adults in the phase of a health policy change. Globalization and Health, 7 (7), doi:10.1186/1744-8603-7-7
Tomporowski PD, Davis CL, Miller PH, Naglieri JA (2008). Exercise and children’s intelligence, cognition, and academic achievement. Educ. Psychol. Rev. 20:111-131.
Tsai Y, Liu C (2012). Factors and symptoms associated with work stress and health-promoting lifestyles among hospital staff: a pilot study in Taiwan. BMC Health Serv. Res. 12:199.
Turkish National Burden of Disease (2004). Turkish National Burden of Disease Study, Turkish Republic Ministry of Health Refik Saydam Institute and Baskent University, Retrieved July 24, 2013 from ttp://www.tusak.saglik.gov.tr/pdf/nbd/raporlar/burdenofdiseaseENG.pdf
Turkmen M, Kul M, Ocalan M, Ozkan A, Bozkus T (2013). Determination of the Relationship between Physical Activity Levels and Healthy Life-style Behaviors of University Students. Australian Journal of Basic and Applied Sciences, 7(10): 507-512.
Vail SE (2005). Promoting the Benefits of Sport: A Collection of Peer-reviewed Journal Articles and Reports (Ottawa: Federal Provincial-Territorial Sport Committee,) at 9-10, online: Sport Matters Group, <http://www.sportmatters.ca/Groups/SMG%20Resources/Reports%20and%20Surveys/2005Promoting%20the%20Benefits%20Sport.pdf.
Walker SN, Sechrist KR, Pender NJ (1987). Health promotion life-style profile development psychometrics. Nursing Res. 36: 76-80.
Walker SN, Hill-Polerecky DM (1996). Psychometric evaluation of the Health Promotion Life-style Profile II, Unpublished manuscript, University of Nebraska Medical Center.
World Health Organization (WHO) (2010). Physical Inactivity: A Global Public Health Problem, Retrieved on August 14, 2013 from http://www.who.int/dietphysicalactivity/factsheet_inactivity/en/index.html.
Yıldırım G (2010). Physical Activity Behaviors and Neighborhood Walkability Perceptions of Turkish Women in Low and High Socio-Economic Environments. Middle East Technical University Social Science Institute an Unpublished PhD Thesis, Ankara.

Vol. 10(5), pp. 582-594, 10 March, 2015 DOI:10.5897/ERR2015.2097 Article Number: F14328D51103 ISSN 1990-3839 Copyright © 2015Author(s) retain the copyright of this article http://www.academicjournals.org/ERR
Educational Research and Reviews
Full Length Research Paper
The investigation of science process skills of science teachers in terms of some variables
Bülent AYDOĞDU
Afyon Kocatepe University, Faculty of Education, Department of Science Education, Afyonkarahisar/Turkey
Received 16 January, 2015; Accepted 18 February, 2015
This study aimed to investigate basic process skills, integrated process skills and overall science process skills of science teachers in terms of some variables. This study had a survey design. The study population consisted of 170 science teachers from a province located in the Central Anatolia Region of Turkey. The study data were obtained from science process skills test arranged by Aydoğdu (2006). The results of the study showed that especially integrated process skills of science teachers were not at a satisfactory level. Other results revealed that basic process skills of science teachers differed on their in-service training on these skills and seniority whereas integrated process skills of science teachers on the frequency of use of these skills in the classroom. Finally, results indicated that overall science process skills of science teachers differed on the frequency of use of these skills in the classroom and on in-service training on these skills. This study suggests conducting some further studies to bring science process skills of science teachers to a satisfactory level. Key words: Science process skills, science teachers, seniority, gender.
INTRODUCTION Students need to reach many different types of information. Science process skills help students get this information (Burke, 1996). In order to achieve this result, students should learn the scientific research process (Gay, Mills & Airasian, 2009:5). The scientific research process can be taught using science process skills (American Association for the Advancement of Science, 1989; Feyzioğlu, Demirdağ, Akyıldız & Altun, 2012). The scientific research process can be described as identifying a problem, gathering data, analyzing the data, and interpreting the gathered results (Fraenkel & Wallen, 2006:7). Therefore, scientific research develops students’ higher level thinking skills, such as asking questions,
doing research, solving problems and communicating affectively (Cuevas, Lee, Hart, & Deaktor, 2005). Science process skills are among the most frequently used thinking skills (Gagne, 1965: 145; Aydoğdu, Tatar, Yıldız-Feyzioğlu & Buldur, 2012). Science process skills are used by scientists during their work (Mutlu and Temiz, 2013). Acquisition of these skills is one of the most important aims of science teaching (Bybee and Deboer, 1993). Therefore, not only scientists but everyone should acquire these skills (Harlen, 1999; Huppert et al., 2002). Rillero (1998) emphasizes that individuals who cannot use science process skills will have difficulty succeeding in daily life in a general sense, as the development at
E-mail: [email protected]. Tel: +90 272 228 1418. Authors agree that this article remain permanently open access under the terms of the Creative Commons Attribution License 4.0 International License

science process skills enables students to gain the skills necessary to solve everyday problems (Kazeni, 2005). These skills are not only used during education and training period but they are also used in daily life (Rillero, 1998). Harlen (1999) emphasizes that science process skills are highly important for science literacy. Similarly, Ewers (2001) reports that when science process skills are not acquired, it will be an obstacle before science literacy due to the fact that science literacy is not limited with reading and hearing, instead it requires efficient use of science process skills. As for the mentioned importance of these skills, Ferreira (2004) emphasizes the importance of science process skills in science teaching. For that reason, science teaching should be planned in a way to include teaching science process skills (Saat 2004; Yakar, 2014). Myers, Washburn and Dyer (2004) report that science process skills comprise the basis of science and thus have an important place to acquire these skills in science education. Science process skills Science process skills are the basis for scientific thinking and research (Mutlu and Temiz, 2013). Besides, science process skills are the thinking skills that we used to get information (Karamustafaoğlu, 2011). As for the definition of science process skills, these skills are defined as tools that acquire information about the world and order this information (Osborne and Freyberg, 1985; Ostlund, 1992). Tobin and Capie (1982) define science process skills as identifying a problem, formulating a hypothesis about the problem, making valid predictions, identifying and defining of variables, designing an experiment to test the hypotheses, gathering and analyzing data and presenting rational findings that support the data. These skills are handled in the related literature in two catego-ries: basic and integrated process skills (Yeany et al., 1984; Burns et al., 1985; Carey et al., 1989; Rubin and Norman, 1992; Germann, 1994; Wellington, 1994:27-28; National Research Council, 1996; Saat, 2004; Chabalengula et al., 2012). Basic process skills form the basis of integrated science process skills (Padilla, 1990; Rubin and Norman, 1992; Rambuda and Fraser, 2004). While some of the basic process skills are observing, classifying, communicating, measuring, using space/ time relationships, using figures, inferring and predicting, some of the integrated process skills are identifying the problem, identifying and controlling variables, formulating hypotheses, interpreting data, defining operationally, reading/constructing graphs and experimenting (Yeany et al., 1984; Germann et al., 1996; Padilla, 1990). Gene-rally, as students are in the concrete operational stage during preschool and primary school (1st through 4th grades). Basic process skills can be acquired from the preschool period onward while integrated process skills can begin to be acquired in secondary (5th through 8th
Aydoğdu 583 grades) school (Tobin and Capie, 1982; Ergin et al., 2005: 7). On the other hand, the formal operational stage starts in secondary school. In a study conducted by Padilla et al. (1983) it was found that there was a positive and high correlation (r=0,73) between students’ inte-grated science process skills and formal operational skills. In this context, when students go to secondary school they are expected to acquire integrated science process skills. The acquisition of science process skills becomes deeper in higher stages (Çepni and Çil, 2009: 52). The integrated process skills are the important skills for solving problems or doing science experiments (Mutlu and Temiz, 2013). Integrated science process skills require a more advanced knowledge base (Özgelen, 2012). The role of teachers in the acquisition of science process skills Harlen (1999) reports that the acquisition of science process skills at desired level is very important for students, and those students, who could not sufficiently acquire these skills, cannot comprehend the world and cannot establish necessary connections. For that reason, especially teachers should develop their students’ science process skills, content knowledge and question-ing skills which are major factors for an efficient science teaching in primary and secondary schools (K-12 grades) (Miles, 2010). This is because of the fact that having science process skills or content knowledge is highly important for the resolution of a problem. For that reason, it can be assumed that science process skills and content knowledge complete each other (Rillero, 1998). It is known that teachers should have the required know-ledge, understanding and materials to teach science process skills (Miles, 2010). However, some studies found that science process skills of teachers are generally not sufficient (Harty and Enochs, 1985; Pekmez, 2001, Aydoğdu, 2006; Karslı et al., 2009) and they rarely evaluate these skills by teaching (Oloruntegbe and Omoifo, 2000). Studies revealed that teachers having developed science process skills are more active to teach these skills in their classrooms (Downing and Gifford, 1996) and, thus, they are very effective on the skill development of students (Aydoğdu, 2006). To conclude, it is known that teachers should have sufficient science process skills and teach these skills to students efficiently (Harlen, 1999; Miles, 2010). The aim and importance of the study Regarding the results of the Trends in International Mathematics and Science Study ([TIMSS], 2011), some of Asian countries (Korea, Singapore, Japan, Hong-Kong, China) are successful. As a rapidly developing region,

584 Educ. Res. Rev. Asia-Pacific countries have similar cultural and societal concepts, traditions, and experiences (Lai et al., 2008). As we know, most of the borders of Turkey are located in Asia. But, Turkey has a low success in TIMSS exams. Regarding the results of the TIMSS-1999, Turkey was 33rd among 38 countries in the general ranking, while regarding TIMSS-2007 results, in the general ranking it was 31st among 50 countries, and regarding TIMSS-2011 results for 4th grade, Turkey ranked 36th among 50 countries, and for 8th grades it was ranked 21st among 42 countries. An analysis of the TIMSS-1999 questions showed that some of the questions were intended to evaluate students’ knowledge about scientific research and the nature of science. Turkey was 33rd in this field. The headings under scientific research and the nature of science are the scientific method (formulating a hypothe-sis, making an observation, inference, generalization), designing experiments (experimental control, materials and processes), scientific measurings (validity, repetition, experimental mistakes, consistency, scale), using scientific equipment, carrying out routine experimental processes, data collection, organization, representation (units, tables, images and graphics), and describing data and interpretation (Bağcı-Kılıç, 2003). An analysis of the content of the TIMSS-2007 questions showed that there were questions evaluating reasoning skills. Questions evaluating reasoning skills consist of problem solving, conducting analysis and synthesis, formulating a hypothesis, making predictions, designing experiments, and the planning, deducing and generalizing, and evaluating stages of an experiment (National Center for Education Statistics-NCES, 2007; Bayraktar, 2010; NCES, 2011). TIMSS-2011 questions’ content was adapted from the content of TIMSS-2007. These results indicated that in Turkey, primary school students’ knowledge of science process skills was low (NCES, 1999; 2007; 2011). In some studies about primary school students’ knowledge of science process skills in Turkey it was observed that the students’ average scores were low (Temiz, 2001; Tan and Temiz, 2003; Aydoğdu, 2006; Çakar, 2008; Hazır and Türkmen, 2008). Studies conducted in Turkey show that students at high school had poor science process skills (Dönmez and Azizoğlu, 2010; Şen and Nakipoğlu, 2012). The same was also true at the university level (Akar, 2007; Bağcı-Kılıç et al., 2009; İnan, 2010; Karslı and Ayas, 2010; Özbek et al., 2012). Teachers have great responsibilities to develop science process skills of students. To this end, science process skill levels should be known and effective variables on these levels should be determined. By analyzing studies conducted in Turkey, it can be seen that there are very few studies on science process skill levels of science teachers. For that reason, this study aims to investigate science process skills of science teachers in terms of some variables. Problem: How do basic process skills, integrated process skills, and overall science process skills of
science teachers differ in terms of some variables? Sub-Problems 1. Is there any significant difference between basic process skill and integrated process skill scores of science teachers? 2. Do basic process skills of science teachers significantly differ on their levels of interest towards learning these skills, levels of competency towards learning these skills, the frequency of use of these skills in classroom, in-service training on science process skills, gender, seniority, workplace? 3. Do integrated process skills of science teachers significantly differ on their levels of interest towards learning these skills, levels of competency towards learning these skills, the frequency of use of these skills in classroom, in-service training on science process skills, gender, seniority, workplace? 4. Do overall science process skills of science teachers significantly differ on their levels of interest towards learning these skills, levels of competency towards learning these skills, the frequency of use of these skills in classroom, in-service training on science process skills, gender, seniority, workplace? METHOD Participants The study population consisted of 170 science teachers from a village (N=25), a town (N=40), a district (N=27) and the city center (N=78) of a province located in central region of Turkey. Distribution of the participants regarding their gender, seniority and workplace is presented in Table 1. The design of the study This quantitative study was carried out as a survey, which possesses three basic characteristics: (1) the collection of data (2) from a sample (3) by asking questions, in order to describe its aspects (Fraenkel and Wallen, 2006). Instrumentation “Science Process Skills Test for Teachers-SPSTFT” arranged by Aydoğdu (2006) was used as the data collection instrument. "Science Process Skills Test for Teachers-SPSTFT" consisted of two chapters which comprised 7 scenarios and the 9-item multiple choice tests with 0.70 reliability. In these chapters, answers were explained with reasons. 9- item multiple choice test was developed by Enger and Yager (1998) and adapted into Turkish by Aydoğdu (2006). The scenarios were developed by Aydoğdu (2006) as a means of investigating other studies (Anonymous, 2006; Dana, 2001; Enger and Yager, 1998; Ergin et al, 2005). Skill areas measured with Science Process Skills Test for Teachers and maximum scores taken from these skills are presented in Table 2.
As can be seen in Table 2, SPSTFT consists of 9 justifiable multiple choice tests each of which was scored 2 points, and 7 scenarios each of which was scored 4 points. Maximum total score of this test was 46. As can be seen in Table 3, skills measured with SPSTFT were analyzed individually as basic and integrated

Aydoğdu 585
Table 1. Distribution of participants regarding their gender, seniority and workplace Variables Gender N % Seniority N % Workplace N % Male 80 47 0-5 years 21 12 Village 25 15 Female 90 53 6-10 years 25 15 Town 40 23 Total 170 100 11-15 years 46 27 District 27 16 16-20 years 47 28 City center 78 46 21 and more years 31 18 Total 170 100 Total 170 100
Table 2. Skill areas measured with SPSTFT and maximum scores to be taken from these skills.
Questions Justified multiple choice tests of SPSTFT Maximum scores to be taken from science process skills 1 Observing 2 2 Classifying 2 3 Inferring 2 4 Identifying and controlling variables 2 5 Interpreting data 2 6 Measuring 2 7 Formulating hypotheses 2 8 Experimenting 2 9 Experimenting 2 Total 18 Scenarios of SPSTFT 1 Observing 4 2 Experimenting 4 3 Formulating hypotheses and Identifying variables 4 4 Formulating hypotheses and Identifying variables 4 5 Classifying 4 6 Measuring 4 7 Experimenting 4 Total 28
process skills.
As it can be seen in Table 3, basic process skills of SPSTFT are “observing”, “classifying”, “measuring” and “inferring”; integrated process skills of SPSTFT are “formulating hypotheses”, “identifying and controlling variables”, “experimenting" and “interpreting data”. Data analyses SPSS 16.0 packet program has been used for the analysis of data gained after the applications Analysis of the data obtained from science process skills of teachers test was conducted in two stages. In the first stage, tests were evaluated by two researchers individually. The reason for such an analysis was to obtain quantity data via open-ended scenario questions in the test. In order to ensure reliability, tests were analyzed individually by two researchers during SPST evaluation. First of all, researchers analyzed 20 participants' tests individually. Regarding these analyses, coefficient of concordance between researchers was measured as 83. Afterwards, researchers gathered, compared and discussed the analyses. Finally, all data were analyzed by two researchers independently, and percentage
of concordance between researchers was measured to be 91. This percentage is regarded as reliable (Miles & Huberman, 1994).
In the second stage, the normality of the distribution of SPSTFT scores in each group was tested through normality tests. As the normality assumption was not violated, parametric tests were decided to be used in the data analysis. In the analysis of the first sub-problems of the research, related samples t test was used while factorial ANOVAs were conducted to analyze other sub-problems of the study. To do factorial ANOVA, the homogeneity of variance assumption was checked through Levene’s test and satisfied. Besides, Scheffe tests were used to make multiple comparisons. RESULTS Scores that science teachers obtained from basic and integrated process skills of SPSTFT are presented in Table 4.
As it can be seen in Table 4, teachers' success percen-tages of basic process skills and integrated process skills
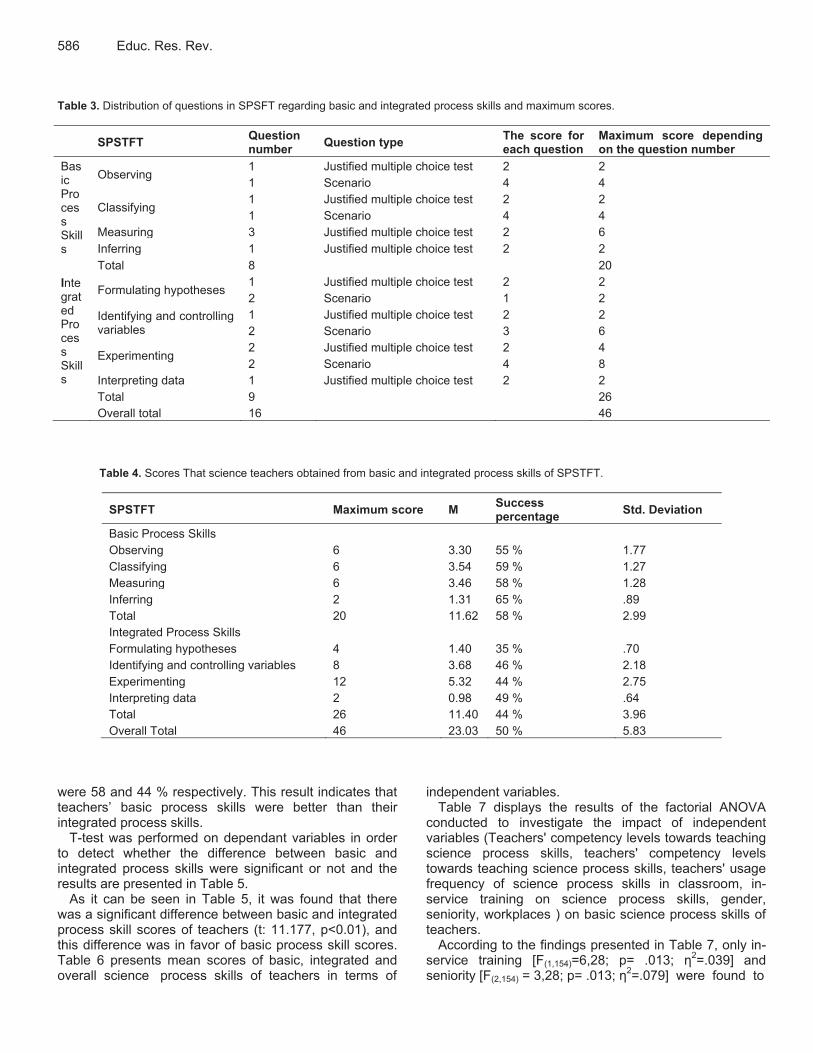
586 Educ. Res. Rev. Table 3. Distribution of questions in SPSFT regarding basic and integrated process skills and maximum scores.
SPSTFT Question number Question type The score for
each question Maximum score depending on the question number
Basic Process Skills
Observing 1 Justified multiple choice test 2 2 1 Scenario 4 4
Classifying 1 Justified multiple choice test 2 2 1 Scenario 4 4
Measuring 3 Justified multiple choice test 2 6 Inferring 1 Justified multiple choice test 2 2
Total 8 20 Integrated Process Skills
Formulating hypotheses 1 Justified multiple choice test 2 2 2 Scenario 1 2
Identifying and controlling variables
1 Justified multiple choice test 2 2 2 Scenario 3 6
Experimenting 2 Justified multiple choice test 2 4 2 Scenario 4 8
Interpreting data 1 Justified multiple choice test 2 2 Total 9 26 Overall total 16 46
Table 4. Scores That science teachers obtained from basic and integrated process skills of SPSTFT.
SPSTFT Maximum score M Success percentage Std. Deviation
Basic Process Skills Observing 6 3.30 55 % 1.77 Classifying 6 3.54 59 % 1.27 Measuring 6 3.46 58 % 1.28 Inferring 2 1.31 65 % .89 Total 20 11.62 58 % 2.99 Integrated Process Skills Formulating hypotheses 4 1.40 35 % .70 Identifying and controlling variables 8 3.68 46 % 2.18 Experimenting 12 5.32 44 % 2.75 Interpreting data 2 0.98 49 % .64 Total 26 11.40 44 % 3.96 Overall Total 46 23.03 50 % 5.83
were 58 and 44 % respectively. This result indicates that teachers’ basic process skills were better than their integrated process skills.
T-test was performed on dependant variables in order to detect whether the difference between basic and integrated process skills were significant or not and the results are presented in Table 5.
As it can be seen in Table 5, it was found that there was a significant difference between basic and integrated process skill scores of teachers (t: 11.177, p<0.01), and this difference was in favor of basic process skill scores. Table 6 presents mean scores of basic, integrated and overall science process skills of teachers in terms of
independent variables. Table 7 displays the results of the factorial ANOVA
conducted to investigate the impact of independent variables (Teachers' competency levels towards teaching science process skills, teachers' competency levels towards teaching science process skills, teachers' usage frequency of science process skills in classroom, in-service training on science process skills, gender, seniority, workplaces ) on basic science process skills of teachers.
According to the findings presented in Table 7, only in- service training [F(1,154)=6,28; p= .013; ƞ2=.039] and seniority [F(2,154) = 3,28; p= .013; ƞ2=.079] were found to

Aydoğdu 587
Table 5. T-test results of basic and integrated process skill scores of SPSTFT. Measuring N Mean Std. Deviation Result Basic process skills 170 .58 .149 t: 11.177
Sig: 0.000* p<0.01 Integrated process skills 170 .44 .152
Table 6. Mean scores of basic, integrated and overall science process skills of teachers in terms of independent variables.
Basic process skills
İntegrated process skills
Overall Science Process Skills (Basic process skills + integrated
process skills) Independent variables N M SS M SS M SS
Teachers' interest levels towards science process skills
High 46 12.50 2.61 13.19 4.27 25.69 6.00 Medium 96 12.14 2.63 11.53 3.48 23.67 4.70 Low 28 8.39 2.65 8.03 2.83 16.42 4.03
Teachers' competency levels towards teaching science process skills
High 48 12.29 2.38 12.08 3.45 24.37 5.10 Medium 83 11.93 3.01 11.78 4.24 23.72 5.90
Low 39 10.12 3.17 9.76 3.54 19.89 5.51
Teachers' usage frequency of science process skills in classroom
Very frequently 48 12.68 2.97 13.85 4.19 26.54 6.01
Sometimes 91 12.12 2.38 11.23 3.30 23.35 4.35 Never 31 8.51 2.63 8.12 2.74 16.64 3.98
In-service training on science process skills
Received 37 12.54 2.92 12.67 4.15 25.21 6.05 Not received 133 11.36 2.97 11.05 3.85 22.42 5.64
Gender Female 90 11.70 2.85 11.43 3.59 23.13 5.55 Male 80 11.53 3.15 11.37 4.36 22.91 6.16
Seniority
(0-5) years 21 13.23 1.60 12.04 4.86 25.28 5.31 (6-10) years 25 12.32 3.28 11.72 3.37 24.04 5.64 (11-15) years 46 11.82 3.23 11.50 3.95 23.32 6.52 (16-20) years 47 10.74 2.69 11.61 3.95 22.36 5.02 (21 and more) years 31 11.00 3.05 10.25 3.79 21.25 6.02
Workplaces
Village 25 11,84 3,26 11,52 3,42 23,36 5,71 Town 40 12,00 3,26 11,52 4,13 23,52 5,52 District 27 12,18 3,02 12,18 4,38 24,37 6,78 City center 78 11,16 2,72 11,03 3,91 22,20 5,66
Table 7. Results of the factorial ANOVA for the effects of the independent variables on basic science process skills.
Independent variables F Sig. Partial Eta Squared Teachers' interest levels towards science process skills 1.327 .268 .017 Teachers' competency levels towards teaching science process skills .015 .985 .000 Teachers' usage frequency of science process skills in classroom 1.473 .232 .019 In-service training on science process skills 6.285 .013* .039 Gender .140 .708 .001 Seniority 3.285 .013* .079 Workplaces .401 .753 .008
R Squared = ,344 (Adjusted R Squared = ,280).*The mean difference is significant at the 0.05 level.

588 Educ. Res. Rev.
Table 8. Post Hoc Analysis (Scheffé) for science teachers' basic process skill scores of SPSTFT regarding their seniority. SPSTFT (I) Seniority (J) Seniority Mean Difference (I-J) Std. Error Sig.
Basic process skills
0-5 years
6-10 years .91810 .86124 .888 11-15 years 1.41201 .76625 .496 16-20 years 2.49341* .76370 .034 21 and more years 2.23810 .82231 .121
6-10 years
0-5 years -.91810 .86124 .888 11-15 years .49391 .72294 .976 16-20 years 1.57532 .72023 .315 21 and more years 1.32000 .78211 .585
11-15 years
0-5 years -1.41201 .76625 .496 6-10 years -.49391 .72294 .976 16-20 years 1.08141 .60345 .525 21 and more years .82609 .67610 .827
16-20 years
0-5 years -2.49341* .76370 .034 6-10 years -1.57532 .72023 .315 11-15 years -1.08141 .60345 .525 21 and more years -.25532 .67320 .998
21 and more years
0-5 years -2.23810 .82231 .121 6-10 years -1.32000 .78211 .585 11-15 years -.82609 .67610 .827 16-20 years .25532 .67320 .998
* The mean difference is significant at the 0.05 level. have significant effects on basic science process skills of teachers. However, other independent variables (Teachers' interest levels towards science process skills, teachers' competency levels towards teaching science process skills, teachers' usage frequency of science process skills in classroom, gender, workplaces) were found to have no significant effects on basic science process skills of science teachers. Table 6 shows that teachers who have received in-service training on science process skills have significantly higher mean scores in terms of these skills. The effect size (ƞ2=.039) was found to be medium according to Cohen (1988)’s standards.
Table 8 displays significant differences between levels of the other independent variable namely, seniority as it has more than two levels. The effect size (ƞ2=.079) of the seniority variable was also found as medium.
As can be seen in Table 8, there was a significant difference between basic process skill scores of teachers in terms of 1-5 years seniority and 16-20 years seniority and this difference was in favor of teachers with 1-5 years seniority. However, it was detected that there was no significant difference in integrated process skill scores and overall science process skill scores of teachers in terms of seniority.
Table 9 displays the results of the factorial ANOVA conducted to investigate the impact of independent variables on integrated science process skills of teachers.
According to the findings presented in Table 9, only
usage frequency of science process skills in classroom [F(1,154)=6,24; p= .002; ƞ2=.075] were found to have significant effects on integratedscience process skills of teachers. However, other independent variables (Teachers' interest levels towards science process skills, teachers' competency levels towards teaching science process skills, in-service training on science process skills, gender, seniority, workplaces) were found to have no significant effects on integrated science process skills of science teachers. Table 10 displays significant differences between levels of the independent variable namely, teachers' usage frequency of science process skills in classroom as it has more than two levels. The effect size (ƞ2=.075) of variable for the teachers' usage frequency of science process skills in classroom was also found as medium.
As can be seen in Table 10, there were significant differences between integrated process skill scores of science teachers regarding their usage frequency of science process skills in classroom.
It was found that significant differences in integrated process skill scores of science teachers were in favor of those using these skills very frequently in classroom between those using these skills very frequently in classroom and those using these skills sometimes in classroom. Besides, it was found that significant differences integrated process skill scores of science teachers were in favor of those using these skills very frequently in classroom between those using these skills

Aydoğdu 589
Table 9. Results of the factorial ANOVA for the effects of the independent variables on integrated science process skills. Independent variables F Sig. Partial Eta Squared Teachers' interest levels towards science process skills .643 .527 .008 Teachers' competency levels towards teaching science process skills .573 .565 .007 Teachers' usage frequency of science process skills in classroom 6.241 .002* .075 In-service training on science process skills 3.086 .081 .020 Gender .063 .802 .000 Seniority .131 .971 .003 Workplaces .847 ,470 ,016 R Squared = ,344 (Adjusted R Squared = ,280)
* The mean difference is significant at the 0.05 level.
Table 10. Post Hoc Analysis (Scheffé) for science teachers' integrated skill scores of SPSTFT İn relation to their usage frequency of science process skills İn classroom.
SPSTFT (I) Teachers' usage frequency of science process skills in classroom
(I) Teachers' usage frequency of science process skills in classroom
Mean Difference (I-J) Std. Error Sig.
Integrated Process Skills
Very frequently
Sometimes 2.62340* .62250 .000 Never 5.72513* .80406 .000
Sometimes
Very frequently -2.62340* .62250 .000 Never 3.10174* .72570 .000
Never Very frequently -5.72513* .80406 .000 Sometimes -3.10174* .72570 .000
* The mean difference is significant at the 0.05 level.
Table 11. Results of the factorial ANOVA for the effects of the independent variables on overall science process skills.
Independent variables F Sig. Partial Eta Squared
Teachers' interest levels towards science process skills 1.366 .258 .017 Teachers' competency levels towards teaching science process skills .302 .740 .004
Teachers' usage frequency of science process skills in classroom 5.703 .004* .069 In-service training on science process skills 6.991 .009* .043 Gender .149 .700 .001 Seniority 1.028 .395 .026 Workplaces 1.021 .385 .020
R Squared = ,397 (Adjusted R Squared = ,339).* The mean difference is significant at the 0.05 level. very frequently in classroom and those using these skills never in classroom. In addition, it was found that significant differences in integrated process skill scores of science teachers were in favor of those using these skills sometimes in classroom between those using these skills sometimes in classroom and those using these skills never in classroom.
Table 11 displays the results of the factorial ANOVA conducted to investigate the impact of independent variables on overall science process skills of teachers.
According to the findings presented in Table 11, only teachers' usage frequency of science process skills in classroom [F(1,154)=5,70; p= .004; ƞ2=.069] and in-service training [F(2,154) = 6,99; p= .009; ƞ2=.043] were found to have significant effects on overall science process skills of teachers. However, other independent variables (Teachers' interest levels towards science process skills, teachers' competency levels towards teaching science process skills, gender, seniority, workplaces) were found to have no significant effects on overall science process

590
Ed
uc. R
es. R
ev.
Ta
ble
12. P
ost H
oc A
naly
sis
(sch
effé
) for
sci
ence
teac
hers
' ove
rall
scie
nce
proc
ess
skill
scor
es o
f sps
tft in
rela
tion
to th
eir u
sage
freq
uenc
y of
sci
ence
pro
cess
ski
lls in
cl
assr
oom
. SP
STFT
(I)
Tea
cher
s' u
sage
freq
uenc
y of
sc
ienc
e pr
oces
s sk
ills
in c
lass
room
(I)
Tea
cher
s' u
sage
freq
uenc
y of
sc
ienc
e pr
oces
s sk
ills
in c
lass
room
M
ean
Diff
eren
ce (I
-J)
Std.
Err
or
Sig.
Ove
rall
Scie
nce
Proc
ess
Skills
(B
asic
pro
cess
ski
lls +
inte
grat
ed
proc
ess
skills
)
Very
freq
uent
ly
So
met
imes
3.
1900
2* .8
6093
.0
01
Nev
er
9.89
651*
1.11
203
.000
So
met
imes
Very
freq
uent
ly
-3.1
9002
* .8
6093
.0
01
Nev
er
6.70
649*
1.00
365
.000
Nev
er
Very
freq
uent
ly
-9.8
9651
* 1.
1120
3 .0
00
Som
etim
es
-6.7
0649
* 1.
0036
5 .0
00
* The
mea
n di
ffere
nce
is s
igni
fican
t at t
he 0
.05
leve
l. sk
ills o
f sci
ence
teac
hers
. Ta
ble
6 sh
ows
that
teac
hers
who
hav
e re
ceiv
ed
in-s
ervi
ce tr
aini
ng o
n sc
ienc
e pr
oces
s sk
ills h
ave
sign
ifica
ntly
hig
her m
ean
scor
es in
term
s of
thes
e sk
ills.
The
effe
ct s
ize
(ƞ2 =.
043)
was
fou
nd t
o be
m
ediu
m a
ccor
ding
to
Coh
en (
1988
)’s s
tand
ards
. Ta
ble
12 d
ispl
ays
sign
ifica
nt d
iffer
ence
s be
twee
n le
vels
of
the
othe
r in
depe
nden
t va
riabl
e na
mel
y,
teac
hers
' us
age
frequ
ency
of
sc
ienc
e pr
oces
s sk
ills in
cla
ssro
om a
s it
has
mor
e th
an tw
o le
vels
. Th
e ef
fect
si
ze
(ƞ2 =.
069)
of
va
riabl
e fo
r th
e te
ache
rs'
usag
e fre
quen
cy
of
scie
nce
proc
ess
skills
in c
lass
room
was
als
o fo
und
as m
ediu
m.
As c
an b
e se
en in
Tab
le 1
2, it
was
fou
nd t
hat
sign
ifica
nt d
iffer
ence
s in
ove
rall
scie
nce
proc
ess
skill
scor
es o
f sc
ienc
e te
ache
rs w
ere
in f
avor
of
thos
e us
ing
thes
e sk
ills
very
fre
quen
tly
in
clas
sroo
m b
etw
een
thos
e us
ing
thes
e sk
ills v
ery
frequ
ently
in
clas
sroo
m a
nd t
hose
usi
ng t
hese
sk
ills s
omet
imes
in
clas
sroo
m.
Besi
des,
it
was
fo
und
that
sig
nific
ant d
iffer
ence
s in
ove
rall
scie
nce
proc
ess
skill
scor
es o
f sc
ienc
e te
ache
rs w
ere
in
favo
r of t
hose
usi
ng th
ese
skills
ver
y fre
quen
tly in
cl
assr
oom
bet
wee
n th
ose
usin
g th
ese
skills
ver
y fre
quen
tly i
n cl
assr
oom
and
tho
se u
sing
the
se
skills
nev
er in
cla
ssro
om. I
n ad
ditio
n, it
was
foun
d th
at
sign
ifica
nt
diffe
renc
es
in
over
all
scie
nce
proc
ess
skill
scor
es o
f sc
ienc
e te
ache
rs w
ere
in
favo
r of
tho
se u
sing
the
se s
kills
som
etim
es i
n cl
assr
oom
be
twee
n th
ose
usin
g th
ese
skills
so
met
imes
in
clas
sroo
m a
nd t
hose
usi
ng t
hese
sk
ills n
ever
in c
lass
room
. D
ISC
USS
ION
AN
D C
ONC
LUSI
ON
Sc
ienc
e pr
oces
s sk
ill le
vels
of
scie
nce
teac
hers
w
ere
anal
yzed
in t
wo
stag
es,
nam
ely,
bas
ic a
nd
inte
grat
ed p
roce
ss s
kills
in
orde
r to
giv
e m
ore
deta
iled
info
rmat
ion.
Th
e re
sults
of
th
e st
udy
reve
aled
tha
t sc
ienc
e te
ache
rs’
skill
leve
l w
as
48%
in b
asic
pro
cess
ski
lls a
nd 4
4% in
inte
grat
ed
proc
ess
skills
of S
PSTF
T. R
egar
ding
t-te
st, i
t was
de
tect
ed th
at th
ese
diffe
renc
es b
etw
een
basi
c an
d in
tegr
ated
pro
cess
ski
ll sc
ores
wer
e si
gnifi
cant
in
favo
r of b
asic
pro
cess
ski
lls. I
n a
stud
y co
nduc
ted
by M
iles
(201
0), i
t was
repo
rted
that
ther
e w
as n
o si
gnifi
cant
di
ffere
nce
betw
een
basi
c an
d in
te-
grat
ed p
roce
ss s
kills
of
teac
hers
; ho
wev
er,
basi
c pr
oces
s sk
ill sc
ores
wer
e hi
gher
tha
n in
tegr
ated
pr
oces
s sk
ills i
n te
rms
of m
ean
scor
es.
As i
t is
kn
own,
in
tegr
ated
pr
oces
s sk
ills
are
mor
e co
mpl
icat
ed t
han
basi
c pr
oces
s sk
ills (
DiS
imon
i, 20
02).
This
can
be
a re
ason
for t
he h
ighe
r lev
el o
f
basi
c pr
oces
s sk
ills.
In
som
e st
udie
s,
it w
as
repo
rted
that
sci
ence
pro
cess
ski
lls o
f sc
ienc
e te
ache
rs w
ere
not
suffi
cien
t (H
arty
and
Eno
chs,
19
85; P
ekm
ez, 2
001,
Ayd
oğdu
, 200
6; K
arsl
ı et a
l.,
2009
; Tü
rkm
en
and
Kand
emir,
20
11).
Stud
ies
gene
rally
sh
owed
th
at
teac
hers
do
no
t co
mpr
ehen
d sc
ienc
e pr
oces
s sk
ills
com
plet
ely
(Bur
ke, 1
996;
Dow
ning
and
File
r, 19
99).
Mut
isya
et
al.
(201
3) e
mph
asiz
ed t
hat
teac
hers
sho
uld
unde
rsta
nd s
cien
ce p
roce
ss s
kills
cog
nitiv
ely
to
mak
e th
eir
stud
ents
gai
n th
ese
skills
at a
des
ired
leve
l. Th
is s
ituat
ion
show
s th
at a
rang
e of
stu
dies
sh
ould
be
cond
ucte
d to
dev
elop
sci
ence
pro
cess
sk
ills o
f te
ache
rs.
This
situ
atio
n sh
ows
that
a
rang
e of
stu
dies
sho
uld
be c
ondu
cted
to d
evel
op
scie
nce
proc
ess
skills
of t
each
ers.
It
was
fo
und
that
th
ere
wer
e no
si
gnifi
cant
di
ffere
nces
bet
wee
n ba
sic
proc
ess
skill,
inte
grat
ed
proc
ess
skill
and
over
all
skill
scor
es o
f sc
ienc
e te
ache
rs r
egar
ding
the
ir in
tere
st l
evel
s to
war
ds
lear
ning
sci
ence
pro
cess
ski
lls.
But,
this
stu
dy s
how
ed th
at a
s in
tere
st le
vels
of
scie
nce
teac
hers
tow
ards
sci
ence
pro
cess
ski
lls
incr
ease
d, th
eir
mea
n sc
ores
for
scie
nce
proc
ess
skill
incr
ease
d as
wel
l. So
me
stud
ies
repo
rted
that
at
titud
es
of t
each
ers
tow
ards
le
arni
ng
scie
nce
proc
ess
skills
wer
e no
t su
ffici
ent
(Rad
ford
et
al.,

1992; Miles, 2010). These results show that science process skill levels have a great role to increase teachers' interest levels towards learning these skills. For that reason, teachers' interest levels towards learning science process skills should be increased.
It was found that there were no significant differences between basic process skill, integrated process skill and overall skill scores of science teachers regarding their competency levels towards teaching science process skills. But, this study showed that as competency levels of science teachers towards science process skills increased, their mean scores for science process skills increased as well. Some studies reported that teachers should primarily acquire sufficient level of science process skills in order to teach these skills efficiently to students (Mohammad, 1983; Burns, Okey, and Wise, 1985). In their study, Işık and Nakiboğlu (2011) reported that most of teachers do not know how to develop science process skills of students in classroom environment. The obtained results showed that when teachers primarily know science process skills well, they will feel more efficient to teach these skills.
It was found that there were significant differences between integrated process skill and overall skill scores of science teachers regarding their usage frequency of science process skills in classroom. This study showed that as teachers' usage frequency of science process skills in classroom increased, their science process skill levels increased as well. In a study conducted by Aydoğdu (2006), it was found that science teachers with high science process skills frequently used these skills in classroom, and science process skill levels of students in these classrooms were higher. Similarly, in a study conducted by Ailello-Nicosia and Sperandeo-Mineo Valenza (1984), the relationship between science teachers' perception of science process skills and their students' science success was analyzed. These researchers reported that there was a relationship between science teachers' perception of science process skills and their students' science success; however, understanding these skills is not sufficient for teachers, they should teach them to their students efficiently as well. It was reported that teachers who could not comprehend science process skills sufficiently could not develop a positive attitude towards these skills and thus they were less likely to teach these skills to their students (Miles, 2010). Some studies reported that teachers with integrated science process skills were more active in teaching these skills within classroom (Downing and Gifford, 1996; Aydoğdu, 2006). For that reason, teachers should acquire science process skills at desired level and use these skills actively in classroom.
It was found that there were significant differences both basic process skills and SPST total scores of science teachers who received or did not receive in-service training on science process skills and these differences were in favor of those who received in-service training. Studies reported that teachers needed in-service training
Aydoğdu 591 on science process skills (Burke, 1996; Yayla and Hançer, 2011). In a study conducted by Işık and Nakiboğlu (2011), it was reported that teachers got information about science process skills mostly in in-service training courses. Studies show that science process skills of teachers receiving in-service training develop. It is emphasized that receiving in-service training is very important for teachers, especially those having low self-esteem about teaching science process skills (Chan, 2002). To conclude, it is assumed that to subject teachers to in-service training on science process skills can be efficient for the development of their science process skills.
It was found that female science teachers had higher basic process skill, integrated process skill and overall science process skill scores; however, these differences were not statistically significant in any of the groups. In a study conducted by Aydoğdu et al. (2013), it was found that science process skill levels of classroom teachers differed by gender. This difference was in favor of female teachers. A similar study was conducted by Ercan (2007), and it was reported that science process skill levels of classroom teachers did not differ by gender.
It was found that there was a significant difference (F(4-
165)=3.46, p<0.05) between basic process skill scores of teachers in terms of 1-5 years seniority and 16-20 years seniority and this difference was in favor of teachers with 1-5 years seniority. However, it was detected that there was no significant difference between integrated process skill and overall science process skill scores of teachers in terms of seniority. In Ercan's (2007) study, it was detected that level of science process skill of primary teachers differed in favor of new teachers. However, Ofoegbu (1984) reported that primary school pupils taught by experienced teachers performed significantly higher than those taught by non-experienced teachers in science process skills acquisition (Okigbo and Okeke, 2011). Burke (1996) reported that self-esteem of teachers about teaching science process skills was different. Harlen et al. (1995) reported that new teacher had much more self-esteem about science teaching than senior teachers. In a study conducted in Morogoro province of Tanzania, it was found that self-sufficiency and science process skills of biology teachers were not sufficient (Jumanne, 2012). High level of science process skill of new teachers could result from the fact that they newly graduated from university with these skills.
However, as the science process skill levels of senior teachers decrease over time, it may be an indicator of the fact that senior teachers can not develop these skills. It can be said that low seniority pre-service teachers may gain the science process skills during “Science Teaching Course” theoretically and “Practice Teaching Course” practically. When they become teachers, those skills will be used by them. One of the reasons for low seniority teachers with high science process skills may be the new Science and Technology education program. It has been valid since 2004 as experimental activities which include

592 Educ. Res. Rev. especially science process skills were used in 2004 education program more intensively. The use of experimental activities including science process skills may contribute to the improvement of teachers’ science process skills. Low seniority teachers (having 0-5 year experience) have only used 2004 science and technology program while high seniority teachers (having more than 9 year experience) have used several different education programs (1968, 1992, 2000, and 2004 science and technology program). Especially, high seniority teachers resist the last program change which emphasizes the science process skills more. The reason for the decrease in these skills, as seniority increases, should be analyzed in a more detailed way in a further study.
It was found that there was no significant difference between total scores of basic process skill, integrated process skill and overall science process skill of teachers in terms of workplace. However, by analyzing mean scores, it was found that teachers working in district had highest science process skills score, and those working in city center had lowest score. In Ercan's (2007) study, it was reported that there were significant differences in sub groups of "formulating hypotheses" and "performing experiment" in favor of teachers working in villages, and there was no significant difference in other dimensions and in total. These results showed that teachers working in villages had high levels of science process skills. Probably, one of the reasons why teachers working in villages, town and district have high science process skills is that they have low seniority status, namely they are newly graduate teachers. The Republic of Turkey, Ministry of National Education assigns new teachers starting from villages. Ministry of National Education assigns teachers having high seniority to the city centers according to teachers’ will. As a result of this, low seniority teachers work in villages, town and district, and those teachers have high science process skills. Conflict of Interests The author(s) have not declared any conflict of interests. REFERENCES Abruscato J (2000). Teaching children science: A discovery approach
(5th ed.). Needham Heights, MA: Allyn & Bacon. Ailello-Nicosia ML, Sperandeo-MineoValenza MA (1984). The
relationship between science process abilities of teachers and science achievement of students: An experimental study. J. Res. Sci. Teach. 21:853-858.
Akar Ü (2007). Öğretmen adaylarının bilimsel süreç becerileri ve eleştirel düşünme beceri düzeyleri arasındaki ilişki [Teacher candidates' skill levels, the relationship between science process skills and critical thinking]. (Unpublished Master Thesis). Afyon Kocatepe University, Social Sciences Institute, Afyonkarahisar].
American Association for the Advancement of Science (AAAS). (1989). Science for all Americans: Procject 2061. New York: Oxford University Press.
Anonymous (2006). Process Skills. http://www.mrconant.org/. Date of retriefed: 10 Jun 2006.
Aydoğdu B (2006). İlköğretim fen ve teknoloji öğretiminde bilimsel süreç
becerilerini etkileyen değişkenlerin belirlenmesi [Identification of variables effecting science process skills in primary science and technology course]. (Unpublished Master Thesis). Dokuz Eylül University, Educational Sciences Institute, İzmir.
Aydoğdu B, Tatar N, Yıldız-Feyzioğlu E, Buldur S (2012). İlköğretim öğrencilerine yönelik bilimsel süreç becerileri ölçeğinin geliştirilmesi [Developing a science process skills scale for elementary students]. J. Theoretical Educ. Sci. 5(3):292-311.
Aydoğdu B, Erkol M, Erten N (2013). The investigation of science process skills of elementary school teachers in terms of some variables: Perspectives from Turkey. Asia-Pacific Forum on Sci. Learn. Teach. 15(1):8.
Bağcı-Kılıç G (2003). Üçüncü uluslararası matematik ve fen araştırması (TIMSS): Fen öğretimi, bilimsel araştırma ve bilimin doğası [The third international mathematics and science study (TIMSS): Science teaching, scientific research and nature of science]. J. Elementary-Online. 2(1):42–51.
Bağcı-Kılıç G, Yardımcı E, Metin D (2009). Fen Öğretiminde Değişkenler Nasıl Adlandırılabilir? [How would variables be named in science education?]. J. Abant İzzet Baysal University. 9(2):13-26.
Bayraktar Ş (2010). Uluslararası fen ve matematik çalışması (TIMSS 2007) sonuçlarına göre Türkiye’ de fen eğitiminin durumu: Fen başarısını etkileyen faktörler [Status of science education in Turkey according to the results of trends in mathematics and science study (TIMSS 2007): Factors effecting science achievement]. Ahmet Keleşoğlu J. Educ. Selçuk University. 30:249-270.
Burke SA (1996). Teacher preferences for teaching problem solving and science process skills. M.S. dissertation, Texas Woman's University, United States. ProQuest Dissertations and Theses; 1996; 18.06.2013.
Burns JC, Okey JR, Wise KC (1985). Development of an Integrated Process Skills Test: TIPS II. J. Res. Sci. Teach. 22(2):169-177.
Bybee RW, DeBoer CE (1993). Research on goals for the science curriculum. In gabel (eds.), Handbook of Research on Science Teaching and Learning. (pp. 357-387). National Science Teachers Association, New York: USA.
Carey S, Evans R, Honda M, Jay E, Unger C (1989). An experiment is when you try it and see if it works”: A study of Junior High School students' Understanding of the construction of scientific knowledge. Int. J. Sci. Educ. 11(5):514-529.
Chabalengula VM, Mumba F, Mbewe S (2012). How Pre-service Teachers’ Understand and Perform Science Process Skills. Eurasia J. Math. Sci. Technol. Educ. 8(3):167-176.
Chan MT (2002). The teaching of science process skills: primary teachers’ self-perception. Asia-Pacific J. Teacher Educ. Devel. 5(1):91-111.
Cohen J (1988). Statistical power analysis for the behavioral sciences (2nd ed.). New Jersey: Lawrence Erlbaum.
Cuevas P, Lee O, Hart J, Deaktor R (2005). Improving science inquiry with elementary students of diverse backgrounds. J. Res. Sci. Teach. 42(3):337-357.
Çakar E (2008). 5. sınıf fen ve teknoloji programının bilimsel süreç becerileri kazanımlarının gerçekleşme düzeylerinin belirlenmesi [Determination the level of students’ achievement of the science process skills acquisition of 5th grade science and technology programs]. (Unpublished Master Thesis). Süleyman Demirel University, Social Sciences Institute, Isparta].
Çepni S, Çil E (2009). Fen ve teknoloji programı ilköğretim 1. ve 2. kademe öğretmen el kitabı [Science and technology curriculum, elementary 1st and 2nd phase teacher handbook]. Pegem Akademi: Ankara.
Dana L (2001). The effects of the level of inquiry of situated secondary science laboratory activities on students' understanding of concepts and the nature of science, ability to use process skills and attitudes toward problem solving. (Unpublished doctoral dissertation). University of Massachusetts Lowell.
DiSimoni KC (2002). Using writing as a vehicle to promote and develop scientific concepts and process skills in fourth-grade students. Ph.D. dissertation, Fordham University, United States. ProQuest Digital Dissertations database. 18.06.2013.
Downing J, Gifford V (1996). An Investigation of Preservice Teachers’

Science Process Skills and Questioning Strategies Used During a Demonstration Science Discovery Lesson. J. Elementary Sci. Educ. 8(1):64-75.
Dönmez F, Azizoğlu N (2010). Meslek liselerindeki öğrencilerin bilimsel süreç beceri düzeylerinin incelenmesi: Balıkesir Örneği [Investigation of the students’ science process skill levels in vocational schools: A case of Balikesir]. Necatibey Faculty of Education Electronic J Sci. Math. Educ. 4(2):79-109.
Enger SK, Yager RE.(Eds.). (1998). Iowa Assesment Handbook. Iowa City: Science Education Center, The University of Iowa.
Ercan S (2007). Sınıf öğretmenlerinin bilimsel süreç beceri düzeyleri ile fen bilgisi öz-yeterlik düzeylerinin karşılaştırılması (Uşak ili örneği) [Comparing elementary teachers’ scientific process skills and scientific self-efficacy levels: As a sample of Uşak province]. (Unpublished Master Thesis), Afyon Kocatepe University, Social Sciences Institute, Afyonkarahisar.
Ergin Ö, Şahin-Pekmez E, Öngel-Erdal S (2005). Kuramdan uygulamaya deney yoluyla fen öğretimi [Science teaching through experiment from theory to practice]. İzmir: Dinazor Publications
Ewers TG (2001). Teacher-directed versus learning cycles methods: Effects on science process skills mastery and teacher efficacy among elementary education students. (Unpublished PhD Thesis), Timothy Gorman. University of Idaho, United States. ProQuest, UMI Dissertations Publishing, 2001. 3022333.
Fraenkel JR, Wallen NE (2006). How to Design and Evaluate Research İn Education Student Mastery Activities to accompany (6th Edition). New york: Mcgraw-Hill.
Ferreira LBM, (2004). The Role of a Science Story, Activities, and Dialogue Modelled on Philosophy for Children in Teaching Basic Science Process Skills to Fifth Graders, (Unpublished PhD Thesis). University of Montelair State.
Feyzioğlu B, Demirdağ, B., Akyıldız, M., & Altun, E. (2012). Ortaöğretim Öğrencilerine Yönelik Bilimsel Süreç Becerileri Testi Geliştirilmesi: Geçerlik ve Güvenirlik Çalışması. [Developing a Science Process Skills Test for Secondary Students: Validity and Reliability Study]. Educational Sciences: Theory & Practice. 12(3), 1887-1906.
Gagne RM (1965). The conditions of learning. New York: Holt, Rinehart and Winston, Inc.
Gay L, Mills G, Airasian P (2009). Educational Research: Competencies for Analysis and Application, Ninth Edition, NewJersey: Lawrance Erlbaum Associates, Puplishers.
Germann PJ (1994). Testing a Model of Science Process Skills Acquisition: an Interaction with Parents’ Education, Preferred Language, Gender, Science Attitude, Cognitive Development, Academic Ability, and Biology Knowledge. J. Res. Sci. Teach. 31(7):749-783.
Germann JP, Aram R, Burke G (1996). Identifying patterns and relationships among the responses of seventh grade students to the science process skills of designing experiments. J. Res. Sci. Teach. 33(1):79–99.
Harlen W (1999). Purposes and Procedures for Assessing Science Process Skills. Assessment in educ. 6(1):129-144.
Harlen W, Holroyd C, Byrne M (1995). Confidence and understanding in teaching science and technology in primary schools. Edinburgh: Scottish Council for Research in Education.
Harty H, Enochs LG (1985). Toward Reshaping the Inservice Education of Science Teachers. School Sci. Math. 85(2):125–135.
Hazır A, Türkmen L (2008). İlköğretim 5. sınıf öğrencilerinin bilimsel süreç beceri düzeyleri [The fifth grade primary school students’ the levels of science process skills]. Selçuk University: Ahmet Keleşoğlu University J. Educ. 26:81-96.
Huppert J, Lomask SM, Lazarowitz R (2002). Computer simulations in the high school: Students' cognitive stages, science process skills and academic achievement in microbiology. Int. J. Sci. Educ. 24(8): 803-822.
Işık A, Nakiboğlu C (2011). Sınıf öğretmenleri ile fen ve teknoloji dersi öğretmenlerinin bilimsel süreç becerileri ile ilgili durumlarının belirlenmesi [Determining primary school and science and technology course teachers’ knowledge of science process skills]. J. Educ. Faculty, Abant İzzet Baysal University. 11(2):145-160.
İnan, HZ (2010). Okul Öncesi Öğretmen Adaylarının Bilimsel Süreç Becerilerine İlişkin Alan Bilgileri ve Pedagojik Alan Bilgilerinin
Aydoğdu 593
İrdelenmesi.[ Examining Pre-School Education Teacher Candidates’ Content Knowledge and Pedagogical Content Knowledge]. Educational Sciences: Theory Practice. 10(4):2275-2323.
Jumanne J (2012). Teacher self efficacy in teaching science process skills: An experience of biology teachers in Morogoro – Tanzania. Lampert Academic Publishing.
Karamustafaoğlu S (2011). Improving the Science Process Skills Ability of Science Student Teachers Using I Diagrams. Eurasian J. Phys. Chem. Educ. 3(1):26-38.
Karslı F, Ayas A (2010, 23-25 September). Fen bilgisi öğretmen adaylarının bilimsel süreç becerileri konusundaki farkındalıkları ve performansları [Preservice science teachers' awareness and performance towards science process skills]. 9th National Science and Mathematics Education Congress, 23-25 September 2010, Dokuz Eylül University, İzmir.
Karslı F, Şahin C, Ayas A (2009). Determining science teachers’ ideas about the science process skills: A case study. Procedia Social Behavioral Sci. 1:890-895. doi:10.1016/j.sbspro.2009.01.158
Kazeni MMM (2005). Development and Validation of a Test Integrated Science Process Skills For the Further Education and Training Learners. (Unpublished Master Thesis), University of Pretoria South Africa.
Lai S-L, Ye R, Chang KP (2008). Bullying in Middle Schools: An Asian-Pacific Regional Study. Asia-Pacific Educ. Rev. 9(4):393-405.
Miles E (2010). In-service elementary teachers’ familiarity, interest, conceptual knowledge, and performance on science process skills. (Unpublished Master Thesis). Southern Illinois University Carbondale, USA. Available from ProQuest, UMI Dissertations Publishing, (UMI No. 1482656).
Miles MB, Huberman AM (1994). Qualitative data analysis (2nd ed.). Thousand Oaks, CA: Sage.
Mohammad İ (1983). Relationships between science process skills instruction and secondary school teachers' performance, use and attitudes toward using these skills. (Unpublished PhD Thesis). Indiana University, Indiana. Available from ProQuest, UMI Dissertations Publishing, (UMI No. 8318849).
Myers BE, Washburn SG, Dyer JE (2004). Assessing Agriculture Teachers’ Capacity for Teaching Science Integrated Process Skills. J. Southern Agricultural Educ. Res. 54(1):74-85.
Mutisya SM, Rotich S, Rotich PK (2013). Conceptual understanding of science process skills and gender stereotyping: a critical component for inquiry teaching of science in Kenya’s primary schools. Asian J. Social Sciences Humanities. 2(3):359-369.
Mutlu M, Temiz BK (2013). Science process skills of students having field dependent and field independent cognitive styles. Educ. Res. Rev. 8(11):766 -776,
National Research Council. (1996). National science education standards. Washington, DC: National Academy Press.
National Center for Education Statics [NCES] (1999). Trends in international mathematics and science study (TIMSS Retrieved April 07, 2012 http://nces.ed.gov/Timss/results99_1.asp
National Center for Education Statics [NCES] (2007). Trends in international mathematics and science study (TIMSS Retrieved May 22, 2012 http://nces.ed.gov/timss/results07_science07.asp
National Center for Education Statics [NCES] (2011). Trends in international mathematics and science study (TIMSS Retrieved April 04, 2013 http://nces.ed.gov/Timss/results11.asp.
Ofoegbu LI (1984). Acquisition of science process skills among elementary pupils in some Northern States of Nigeria. Unpublished Ph.D Thesis. Nsukka: University of Nigeria.
Okigbo EC, Okeke SOC (2011). Perceived difficulty in integrating educational objectives within the Mathematics classroom: A comparison of beginner and experienced teachers. Educ. Res. Rev. 6(3):292-298
Oloruntegbe KO, Omoifo CN (2000) Assessing Process Skills in STM Education: Going Beyond Paper and Pencil Tests. Educ. Thought. 1(1):35-44
Osborne R, Freyberg P (1985). Learning in science: The implications of children’s science. Hong Kong: Heinemann.
Ostlund KL (1992). Science process skills: Assessing hands-on student performance. New York: Addison-Wesley.
Özbek G, Çelik H, Kartal T (2012, 27-30 June). 7E öğretim modelinin

594 Educ. Res. Rev.
hipotez kurma ve değişken belirleme becerileri üzerine etkisi [The effect on formulating hypotheses and identifying variables skills of 7e teaching method]. 10th National Science and Mathematics Education Congress, 27-30 June 2012, Niğde University, Niğde.
Özgelen S (2012). Students’ Science Process Skills within a Cognitive Domain Framework. Eurasia J. Math. Sci. Technol. Educ. 8(4):283-292.
Padilla MJ (1990). The science process skills. Research Matters - to the Science Teacher. National Association for Research in Science Teaching.
Padilla M, Okey J, Dillashaw J (1983). The relationship between science process skills and formal thinking abilities. J. Res. Sci. Teach. 20:239-246.
Pekmez EŞ (2001, 7-8 September). Fen öğretmenlerinin bilimsel süreçler hakkındaki bilgilerinin saptanması [The determination of knowledge about science process skills of science process skills]. Science Education Symposium in Turkey at the beginning of the Millennium, Maltepe University, Education Faculty, 7-8 September 2001, İstanbul, 543-549.
Radford DL, DeTure LR, Doran RL (1992). A preliminary assessment of science process skills achievement of preservice elementary teachers. Paper presented at the Annual Meeting of the National Association for Research in Science Teaching, Boston, MA.
Rambuda AM, Fraser WJ (2004). Perceptions of teachers of the application of science process skills in the teaching of geography in secondary schools in the Free State province. South Afr. J. Educ. 24(1):10 – 17.
Rillero (1998) Process Skills and Content Knowledge. Science Activities: Classroom Projects and Curriculum Ideas, 35(3):3-4, DOI: 10.1080/00368129809600910
Rubin RL, Norman JT (1992). Systematic modeling versus learning cycle: comparative effects on integrated science process skills achievement. J. Res. Sci. Teach. 29:715-727.
Saat RM (2004). The acquisition of integrated science process skills in a web-based learning environment. Research in Science ve Technol. Educ. 22(1):23-40
Şen AZ, Nakipoğlu C (2012, 27-30 June). Ortaöğretim 12. sınıf öğrencilerinin bilimsel süreç becerileri düzeylerinin belirlenmesi [The determination of 12nd grade students' science process skills levels]. 10th National Science and Mathematics Education Congress, 27-30 June 2012, Niğde University, Niğde
Tan M, Temiz BK (2003). Fen öğretiminde bilimsel süreç becerilerinin yeri ve önemi [The importance and role of the science process skills in science teaching]. Pamukkale University J. Educ. 1(13):89–101.
Temiz BK (2001). Lise 1. sınıf fizik dersi programının öğrencilerin bilimsel süreç becerilerini geliştirmeye uygunluğunun incelenmesi [The Examination of appropriateness for developing students’ scientific process skills of 9th grade physics lesson curriculum]. (Unpublished Master Thesis). Gazi University, Educational Sciences Institute, Ankara.
Tobin KG, Capie W (1982). Relationships between formal reasoning
ability, locus of control, academic engagement and integrated process skills achievement. J. Res. Sci. Teach. 19:113-121.
Türkmen H, Kandemir EM (2011). Öğretmenlerin bilimsel süreç becerileri öğrenme alanı algıları üzerine bir durum çalışması [A case study on teachers' science process skills learning area perceptions]. J. Eur. Educ. 1(1):15-24.
Wellington J (1994). Secondary Science. Contemporary issues and practical approaches. London: Routledge.
Yakar Z (2014). Effect of teacher education program on science process skills of pre-service science teachers. Educ. Res. Rev. 9(1):17-23.
Yayla RG, Hançer AH (2011). Fen bilgisi öğretim programında yer alan bilimsel süreç becerileri (bsb) kazanımlarınına yönelik öğretmenler tarafindan yapılan çalışmaların incelenmesi. [The Examination of Studies done by teachers towards science process skill (sps) acquires in science curriculum]. 2nd International Conference on New Trends in Education and Their Implications. 27-29 April, 2011 Antalya-Turkey]
Yeany RH, Yap KC, Padilla MJ (1984). Analyzing hierarchical relationship among modes of cognitive reasoning and integrated science process skills. Paper presented at the Annual Meeting of the National Association for Research in Science Teaching. New Orleans, LA.

Vol. 10(5), pp. 595-603, 10 March, 2015 DOI:10.5897/ERR2014.2052 Article Number: 6764AFC51105 ISSN 1990-3839 Copyright © 2015Author(s) retain the copyright of this article http://www.academicjournals.org/ERR
Educational Research and Reviews
Full Length Research Paper
Study of mothers’ anxieties related to their children’s future
Sengul ILGAR
Istanbul University, Hasan Ali Yucel Education Faculty,Department of Primary Education Division of Preschool
Education, Istanbul, Turkey.
Received 20 January, 2015; Accepted 22 February, 2015
The purpose of this study is to study anxieties of mothers related to their children’s future. Qualitative method was used in order to study anxieties of mothers from different socio-economic levels. Sample of the study participants are 129 mothers living in Istanbul. 32 of those mothers are from upper socio-economic level, 57, from middle socio-economic level and 40, from lower socio-economic level. A half-structured interview form designed by researcher was used as data collection instrument. Descriptive analysis technique was used in interview analysis according to qualitative data analysis. İn the result of the study, anxieties about their children not having a good education, having bad friends, not having a job with which they would be happy, having health problems, not being able to find a good job are frequently observed. All mothers in lower, middle and upper socio-economic groups are anxious about their children having a good education. This was strikingly the leading factor in lower and middle socio-economic groups. Problems are the leading anxiety factor in upper socio-economic group. Mothers in lower socio-economic group did not utter anxiety about their children not maintaining family ties, not realizing their children, having no child, having no social reputation. Key words: Anxiety, anxiety about future, mothers..
INTRODUCTION Impacts of families and mothers on the development of children and adolescents are undeniable. Family may also be influential in formation, development and change of behaviors and emotions. Cassano et al. (2007) urge that child raising and family affairs influence socialization of the child and regulation of relationships. It is claimed that women take up more responsibilities than men in child care and raising (Lamb et al., 1987). The study reveals differences in proportions of emotions expressed by fathers and mothers. It was found out that mothers
express their emotions more than fathers (Halberstadt et al., 1995).
One of the emotions expressed by parents was anxiety. This influences both mother-father and parent-child relationship. Craske et al. (2010) said that anxiety is one of the most frequently used notions in social life. Several communication barriers may develop due to perspectives and judgments of parents who are unable to adjust their anxiety level (Navaro, 1993).
Anxiety is regarded from the perspective of various E-mail: [email protected]. Authors agree that this article remain permanently open access under the terms of the Creative Commons Attribution License 4.0 International License

596 Educ. Res. Rev. behaviors such as psychological and psychosomatic symptoms. General anxiety is indeed recognized as anxiety based on fear, stress, state anxiety. (Spielberger, 1976, 3-7). Researchers define anxiety as a feeling of strain increased by threat perception (Cüceloğlu, 2006; Köknel, 1989; Öner and Le Compte, 1983; Spielberger, 1989). Anxiety usually causes emotional situations such as preoccupation, inner stress, insecurity, unrest, fear, confusion and panic (Aydın and Dilmaç, 2004).
According to Öner and LeCompte (1998), anxiety may be recognized as the basic emotions of mankind because everyone feels a bit anxious in cases they perceive as dangerous. For example, tests and surgical operations may cause uneasiness and unrest to a certain extent. Such worries are usually short-term and temporary. Therefore, it is called impermanent-state anxiety. When a person perceives and interprets daily life situations in a stressful manner, it is called perpetual anxiety. In this case, perpetual anxiety may be defined as a person’s feeling worried, uneasy even when he is not faced with a clear and concrete danger.
What casuses anxiety is not the events themselves but the way they are assessed (Özer, 2011). Anxiety reaction may depend on past experience, personal features, structure and hardship of the problem, level of induced anxiety. One may react to anxiety with an effective problem solving, in which case he goes through a positive experience. He may also react with an ineffective problem solving, in which case he goes through anxiety in the form of stress, confusion, fear, physical sickness, worry and failure (Sieber, 1980:17).
Anxiety is occasionally good, but excessive and uncontrolled anxiety weakens the person and makes him lose his capabilities (Mash and Wolfe, 2002). Increased anxiety process causes people not to know what to do with their future as well as fail to decide what to do. People may feel irrevelantly as if something will happen to them in this process (Çakmak and Hedevanlı, 2005).
In his review of literature, Öngider (2011) found that anxiety level of children with divorced parents was higher than children with married parents. Similarly, anxiety level of divorced mothers was higher than married mothers. In their study to find out whether mother-child commitment with anxiety symptoms was directed by emotion regulation, Brumariu et al. (2012) found out that anxiety symptoms were related with three mentioned emotion regulations (insufficient emotional awareness, biased interpretation of emotional cases, coping methods). Queen et al. (2013) studied depression and anxiety symptoms of the youngsters in depression and their family relationships with regards to quality factor. The study found out that family relationships were more closely related to depression symptoms than anxiety symptoms. Doğru and Arslan (2008) found out that there was not a meaningful difference between education level and both state and perpetual anxiety.
Other hood is a multilateral process covering psycho-logical factors as well as biological processes. While
fulfilling their roles and responsibilities, mothers assess various factors and raise their children accordingly. It is possible to say that mothers occasionally face various risks. One of these risks is the mother’s going through anxieties related to their children. Occasional anxieties of mothers influence their children negatively. High anxiety levels of children and youngsters will cause anxious generations to appear. Therefore, it is important to draw attention to anxieties of mothers and focus on preventing them. The purpose of the study is to examine the anxieties of mothers with different socio-economic status about the future of their children.
We conducted this study to uncover the mother’s anxiety about their children’s future. In addition, this study is done with the hope that it will contribute to the upbringing of future generations with intervention and precaution.
With this study the anxiety of mothers about their children’s future is ranked according to the importance level and their economic level. It is hoped that the data obtained from this study will benefit the science, researchers and the therapists who work for anxiety treatment. METHOD Study Model This is a qualitative study designed to examine the anxieties of mothers with different socio-economic status about the future of their children. A qualitative study is defined as a study type where qualitative data collection methods such as research, observation, interviews and document analysis are used and a qualitative process is observed in order to reveal perceptions and cases integratedly in a natural atmosphere (Yıldırım and Şimşek, 2005:39). Study sample The study was carried out with data collected from 129 Istanbul-based mothers found with sampling method. While finding out these mothers, the study drew on 8 primary, elemantary and high schools in regions in Istanbul with different socio-economic features.
129 mothers were included in the study, 32 of whom from upper socio-economic level, 57 from middle socio-econoımic level and 40 mothers from lower socio-economic level. Mothers were included in the study on a voluntary basis. Data collection ınstruments and data collection The data were collected from a half-structured interview form devised by researchers and consisting of 1 open-ended question “What are your anxieties about your children’s future?”.
Interviewing is the most frequently used qualitative research method. The basic method of interview is oral communication. Qualitative researchers using interviewing method must be trained according to features, preparation and realization processes of this method. The most significant convenience of half structured interview method is that it offers more systematic and comparable information as the interview is carried out according to the interview protocol designed beforehand (Yıldırım and Şimşek, 2005).

Ilgar 597
Table 1. Distribution of mothers’ anxieties about their children’s future.
Mothers’ anxieties about their children’s future (129 mothers) F % Not having a good education 91 70,5 Having bad friends 65 50,4 Not having a job where he will be happy 52 40,3 Having health problems 49 38,0 Not finding a good job 41 31,8 Quick access to bad habits (drugs) 35 27,1 Alienation to his culture, identity 34 26,4 Insufficient financial capabilities 33 25,6 Not establishing a good family 33 25,6 Not being happy 27 20,9 Low academic success 27 20,9 Alienation to religious values 26 20,2 Not feeding naturally 25 19,4 Addiction to technology 25 19,4 Failure to express himself and lack of self-confidence 23 17,8 Not maintaining family ties 19 14,7 Exposure to bullying 13 10,1 Being alone 12 9,3 Alienation to universal ethic values 11 8,5 Not being a successfull person 11 8,5 Having no child 5 3,9 Being not as the mother wants 5 3,9 Socially unacceptable behaviour (theft, gang etc) 5 3,9 Not realizing his dreams 4 3,1 Having no social reputation 4 3,1 Being selfish 4 3,1 Having no sense of responsibility 4 3,1 Wishing to live abroad 2 1,6 Not making correct decisions 1 0,8 Failing to make the child study abroad 1 0,8 Possibility of gender change 1 0,8
For the interviews, 8 primary, elementary and high schools were specified from regions in Istanbul with different socio-economic features. Volunteered mothers from the schools with different socio-economic features were selected and taken into interview.
Interviews were carried out face to face and one by one. Mothers were asked to express situations that make them feel anxious about their children’s features. Data were analyzed with descriptive analysis approach. Data analysıs Descriptive analysis method was used while analyzing the obtained data. Purpose of descriptive analysis shapes the raw data so that the readers would be able to understand and use if they wish. In descriptive analysis, the data is summarized and interpreted according to previously specified themes. This analysis frequently gives place to direct quotations in order to strikingly reflect opinions of the people interviewed or observed (Altunısık et al., 2001; Yıldırım and Şimşek, 2005). Features that enable validity in qualitative research are inclination to research field, profound data collection through face-to-face interviews, collection of information
through observation, feedback to the field for confirmation of the obtained information and chance to collect additional information (Yıldırım and Şimşek, 2005). In this study, direct information was received from the participants through interviews and data was evaluated. FINDINGS Mothers of families with different socio-economic features gave various responses to the question asked in order to determine their anxieties about their children’s future. After these responses were analyzed through descriptive analysis technique, similar sentences in the responses were turned into articles, categorized and a table was formed. Frequency and percentage of each category is written below.As seen in Table 1, not having a good education leads the anxiety causing factors with 70.5%, which is followed by having bad friends with 50,4%.
Quick access to bad habits was expressed by 27.1% of mothers. Mothers anxiety about their children not having a job with which they will be happy (40,3%) is higher than their anxiety about not finding a good job (31.8%). Anxieties about having a low academic

598 Educ. Res. Rev.
Table 2. Distribution of upper socio-economic group mothers’ anxieties about their children’s future (32 mothers).
Mothers’ anxieties about their children’s future (32 mothers) f % Having health problems 21 65,6 Not having a good education 18 56,3 Insufficient financial capabilities 17 53,1 Not having a job with which he/she will be happy 16 50,0 Having bad friends 14 43,8 Not being happy 13 40,6 Not finding a good job 12 37,5 Not establishing a good family 12 37,5 Quick access to bad habits (drugs) 10 31,3 Failure to express himself and lack of self-confidence 8 25,0 Not feeding naturally 8 25,0 Not being a successful person 6 18,8 Being alone 5 15,6 Alienation to religious values 3 9,4 Alienation to universal ethic values 3 9,4 Not maintaining family ties 3 9,4 Addiction to technology 2 6,3 Wishing to live abroad 2 6,3 Not realizing his dreams 2 6,3 Low academic success 2 6,3 Having no social reputation 2 6,3 Not making correct decisions 1 3,1 Alienation to his culture, identity 1 3,1 Failing to make the child study abroad 1 3,1 Having no child 1 3,1
success (29.9%), alienation to religious values (20.2%) and addiction to technology (19.4%) are close to each other. Only 3.1% of mothers are anxious about their children becoming selfish and not having sense of responsibility. Only 1 of the 127 mothers stated her anxiety about the possibility of her child’s gender change.
As seen in Table 2, having health problems was the most frequently expressed reason of anxiety for mothers from upper socio-economic group with 65.6%. It is followed by anxiety about not having a good education (56.3%). Having insufficient financial capabilities in the future was expressed by 53.1% of mothers. Anxiety about their children not having a job with which they will be happy (50.0%) is higher than their anxiety about not finding a good job (37.5%). 13 mothers (40.6%) were anxious about their children of not being happy. Only 1 mother from upper socio-economic group (3.1%) was anxious about her child alienating to his cultural identity, not making correct decisions, not having a child. 2 of the 32 mothers included in the study (6.3%) were anxious about their children wishing to live abroad, not realizing their dreams, being addicted to technology while 1 mother (3,1%) stated her anxiety about failing to support her child to study abroad. Some of the responses given by the mothers to this question were as follows: M7:“I am always anxious when I think what kind of a life is waiting for my child. I always think whether he/she will be successful in the future and whether I will raise a healthy child. I get upset as I think how our family ties will be. I am worried about his happines in life.” M11:“I am worried about my child’s losing his mental and physical health due to any reason. One of my biggest anxieties is his not having a happy and peaceful marriage in the future. I am anxious
about whether he will have a job that he loves and will live better than us.” M28:“I am worried about whether my child will receive a good education in high school and higher education. I am worried about his selection of the correct job. I am anxious about bad friends, health and happiness. I am anxious about his not having the life standards that we provide him.” M31:“I am anxious about my daughter’s failing in work life and fall behind with the life standards of our family. I am worried abouther having financial problems, being able to live without family support and look to the future safely.” As seen in Table 3, not having a good education was the most frequently expressed anxiety factor for mothers from middle socio-economic group with 71.9%. It is followed by having bad friends (61.4%) and alienation to cultural identity (43.9%). Addiction to technology (29.8%), not establishing a good family (29,8%), alienation to religious values (28.1%), not maintaining family ties (28.1%) are close to each other. 19.3% of mothers are anxious about their children having insufficient financial capabilities in the future and being exposed to bullying. Though very low, being selfish (7.0%), not having sense of responsibility (7.0%), socially unacceptable behaviour (7.0%), possibility of gender change (1.8%) are among the factors that worry mothers from middle socio-economic group. Some of the responses given by the mothers to this question are as follows: M6:“I am worried about the education system because the curriculum and exams change every year. Harmful habits and easy

Ilgar 599
Table 3. Distribution of middle socio-economic group mothers’ anxieties about their children’s future (57 mothers).
Mothers’ anxieties about their children’s future (57 mothers) f % Not having a good education 41 71,9 Having bad friends 35 61,4 Alienation to his/her culture, identity 25 43,9 Having health problems 22 38,6 Not finding a good job 21 36,8 Not having a job with which he/she will be happy 21 36,8 Addiction to technology 17 29,8 Not establishing a good family 17 29,8 Alienation to religious values 16 28,1 Not maintaining family ties 16 28,1 Low academic success 15 26,3 Not being happy 13 22,8 Quick access to bad habits (drugs) 13 22,8 Insufficient financial capabilities 11 19,3 Being exposed to bullying 11 19,3 Failure to express himself and lack of self-confidence 10 17,5 Not feeding naturally 10 17,5 Not being a successful person 5 8,8 Not being as I wish 5 8,8 Alienation to universal ethic values 4 7,0 Having no child 4 7,0 Socially unacceptable behaviour (theft, gang etc) 4 7,0 Being selfish 4 7,0 Having no sense of responsibility 4 7,0 Being alone 3 5,3 Not realizing his dreams 2 3,5 Having no social reputation 2 3,5 Possibility of genderchange 1 1,8
access to them is worrying. Internet and virtual environment have developed a lot. They are very effective on children. I don’t have the control, which worries me. The possibility of not finding a job even if he/she graduates from university worries me. Habits of his/her friends and their families’ structural differences are worrying to me.” M8:”I am worried about constant changes in the school system. Whether he/she will finish his/her school, find a place in a university and have a good education worries me. Will he/she find a good job or be employed after finishing school? Will he/she make good friends? I think of ways to protect him/her from gangs in and outside school”. M9: “Education system at schools, bad friends at school, cultural alienation, health problems cause anxiety to me. I am worried about his/her not finding a job after university. Addiction to computer, mobile phone is worrying.” M23: “I am anxious about finding an educational institution to prepare him for life. Will he/she have a good education? I am also worried about him not learning traditions and forgetting his culture and identity.” M41: “Education system changes constantly, which makes me worried about my child getting a good education. I am anxious about him being influenced by his environment and doing wrong and having bad friends. Children forgetting traditions worries me. I am anxious about him not choosing a good spouse and establishing a good family.”
As seen in Table 4, not having a good education is the most important anxiety factor (80.0%) for mothers from low socio-economic group. It is followed by having bad friends (40.0%) and not having a job with which he/she will be happy with (37.5%). Mothers also expressed their concerns about their children having quick access to harmful habits (30.0%), low academic success (25.0%), not finding a good job (20.0%). 12.5% of the mothers are anxious about insufficient financial capabilities The least frequently expressed anxiety factor for mothers in low socio-economic group are not being happy (2.5%), being alone (2.5%) and socially unacceptable behaviours (2.5%). Some of the responses given by the mothers to this question were as follows: M16:“Being a mother, I try to think positively but I cannot help thinking whether my child will finish school or not. I am concerned about his/her educaion and bad friends. I am afraid of not being able to protect my child against bad habits.” M21:“I am worried about how his schools will be, whether my child will have a happy education life, how his friends will be and what kind of a work he will do. The most important of all, will he/she be a happy person?”. M33: “I am worried about my daughter not having a good education, not having a good job at the end of good education. I am worried about her not having friends and becoming a person who does not know respect, tolerance and culture.”

600 Educ. Res. Rev.
Table 4. Distribution of lower socio-economic group mothers’ anxieties about their children’s future.
Mothers’ anxieties about their children’s future (40 mothers) f % Not having a good education 32 80,0 Having bad friends 16 40,0 Not having a job with which he/she will be happy 15 37,5 Quick access to bad habits (drugs) 12 30,0 Low academic success 10 25,0 Not finding a good job 8 20,0 Alienation to his culture, identity 8 20,0 Alienation to religious values 7 17,5 Not feeding naturally 7 17,5 Addiction to technology 6 15,0 Having health problems 6 15,0 Failure to express himself and lack of self-confidence 5 12,5 Insufficient financial capabilities 5 12,5 Alienation to universal ethic values 4 10,0 Not establishing a good family 4 10,0 Being exposed to bullying 2 5,0 Not being happy 1 2,5 Being alone 1 2,5 Socially unacceptable behaviour (theft, gang etc) 1 2,5
M38:“I am worried about my child not having a good education. Quality of education is decreasing each day. There is fear of alienation from cultural and religious values. I am anxious about my child not feeding naturally.” RESULT, DISCUSSION AND SUGGESTIONS RESULT Not having a good education leads the anxiety factors for mothers participating in the study. Having bad friends is the second most common anxiety. The third anxiety factor is quick access to bad habits (drugs). Mothers are more anxious about their children having a job that will make them happy than finding a job. There was no significant difference in anxiety levels depending on educational status. Health problem is an anxiety factor in all groups. Another finding of the study is that mothers are anxious about bad friends. Only mothers from middle socio-economic group are anxious about their children being selfish and not having sense of responsibility. Exposure to bullying was uttered mostly by mothers from middle socio-economic group. Mothers from upper socio-economic group did not utter such an anxiety factor. Mothers from lower socio-economic group are anxious about this factor only to a very little extent. Mothers from lower socio-economic group are the ones who are least worried about insufficient financial capabilities.
DISCUSSION This study has dealt with mothers’ children-related anxieties in an effort to reveal anxieties of mothers with different socio-economic features. No study was dis-covered in literature with the same goal and conclusion with this study. 8 primary, elementary and high schools were selected from regions of Istanbul with different socio-economic features for the study. Volunteered mothers of students studying at these schools were selected in order to reveal their future-related anxieties.
Not having a good education leads the anxiety factors for mothers participating in the study. This may be explained by the fact that education influences many aspects of a person’s life. Education determines a person’s success in his profession, which influences his/her success in life and happiness. Therefore, we may say that mothers express educational anxieties more than others as they know this fact.
Similar results are obtained from the studies done on Turkish mothers living in the USA conducted by the researcher. Medium level and low economic level mothers stated that it is a source of anxiety for them when they cannot send their children to qualified schools because of high tuition fee (Ilgar and Topac, 2014). In other words, their children’s education is of utmost importance to the mothers.
Having bad friends is the second most common

anxiety. Mothers may feel that having bad friends will negatively affect their children’s success, attitude, behaviours and habits. The third anxiety factor is quick access to bad habits (drugs). We may conclude that mothers are anxious as drug use is more common today than before even among children and access to drugs is easier and quicker. In the researchers study conducted on Turkish mothers in the USA, drug use is stated to be the highest anxiety of high income level mothers (Ilgar and Topac, 2014). In both countries (U.S and Turkey), the higher one income gets, the more drug is used.
Mothers are more anxious about their children having a job that will make them happy than finding a job. This may be explained by the fact that a person will find a job on all accounts when he has a job that he loves.
When anxieties of mothers with different socio-economic features are considered; though the same anxieties were expressed, there were differences between their levels. Studies of Baer and Avsaroglu support this. In their study, in order to examine anxiety disorders in poor families, Baer et al. (2012) concluded that the rate of generalized anxiety disorder was higher among poor mothers and anxiety of poor mothers stems from environmental factors than psychiatric factors. In a study to specify anxiety levels of parents with mentally handicapped children, Avşaroglu (2012) found out that state and perpetual anxiety of parents with lower income was higher than that of parents with moderate income. There was no significant difference in anxiety levels depending on educational status. This study has also the qualifications to support these results. When the socio-economic level varies, the anxiety reason of mothers varies in some points as well.
All mothers in upper, middle and lower socio-economic group were anxious about their children having a good education. This anxiety is the leading anxiety factor in lower and middle socio-economic group. However, this factor is lower in mothers from upper socio-economic group. Mothers from upper socio-economic group were most worried about health problems. This may be explained by the fact that mothers from upper socio-economic group were not much concerned about having a good education as they believed their children were already having a good education as a result of their financial welfare.
Health problem was an anxiety factor in all groups. However, mothers were less anxious about health as socio-economic level falls. High socio-economic level families being more conscious may have led to this result.
Studies show that health problems and disabilities of children affect mothers’ anxiety levels. Akmese et al., (2007) studied how disability levels of children with Cerebral Palsy affect their mothers and found out that children with lower functional motor levels increased their mothers’ anxiety levels. Again, Avsaroğlu (2012) carried out a study in order to determine anxiety levels of parents
Ilgar 601 with disabled children and found out that state and perpetual anxiety of mothers is significantly higher than that of fathers. Karaman et al. (2012) carried out a study in order to determine family functions of children diagnosed with attention deficit hyperactivity disorder (ADHD) and their mothers’ depression and anxiety symptoms and found out that mothers’ depression and anxiety levels are higher than the control group.
Another finding of the study is that mothers are anxious about bad friends. This anxiety factor is highest among the mothers from middle socio-economic group. This may be explained by the fact that friends of children from middle socio-economic group are heterogenous. Mothers from lower and upper socio-economic group are not much anxious about bad friends because their children are usually in a homogenous atmosphere.
Another significant anxiety factor was the possibility of children’ salienation to their cultural identity. Mothers from upper socio-economic group had little or no anxiety about cultural alienation. This factor was most common among mothers from middle socio-economic group. This may be because these families are developing and have the potential for a class change. This development may cause loss of some cultural values. We may conclude that mothers from middle socio-economic group are in an effort to preserve cultural values.
In the research conducted on Turkish mothers in the USA, it is stated that mothers from all socio economic levels explained that their children’s alienation from Turkish culture and identity is their primary anxiety (Ilgar, 2014). However, in this study it is the anxiety explained by the mothers from medium socio-economic families. It is the natural result of continuing to live in their own culture.
Similarly, alienation from religious values, socially unacceptable behaviours (gang, theft etc) were the most common anxiety among mothers from middle socio-economic group.
Arıkan and Doğan (2013) found similar results in their study. Arıkan and Doğan (2013) found out that students had better attitude towards cultural heritage as family income increased. Students with lower income had no better attitude toward cultural heritage than students with higher income.
Only mothers from middle socio-economic group were anxious about their children being selfish and not having sense of responsibility. Wemay thinks that mothers from middle socio-economic group have high expectations from their children. We may add that they attach too much importance to several values. These anxieties were not uttered by mothers from lower and upper socio-economic group.
Exposure to bullying was uttered mostly by mothers from middle socio-economic group. Mothers from uppper socio-economic group did not utter such an anxiety factor. Mothers from lower socio-economic group were anxious about this factor only to a very little extent. It can

602 Educ. Res. Rev. be said that the medium income level families bring up their children very protectively and their children’s lack of self-confidence may leave them in easier exposition to bullying.
Their children’s exposition to bullying is stated by mothers from high and medium income families as a source of anxiety in the study conducted on Turkish mothers living in the USA (Ilgar and Topac, 2014). Findings of Kapcı’s study (2004) support the findings of this study. Kapcı concluded that there are not significant differences in terms of socio-economic level, class and gender variants, adding that children from middle socio-economic group are exposed to bullying more than others.
Mothers from lower socio-economic group did not utter anxiety about their children not maintaining family ties, not realizing their dreams, having no child, no social reputation. We may think that they pay self-realization efforts after fulfilling basic needs.
Mothers from lower socio-economic group did not utter anxiety about their children not realizing their dreams, having no social reputation. We may think that they pay self-realization efforts after fulfilling basic needs. Findings of this study confirm Maslow’s theory of needs hierarchy. Paksoy (2002) stated that while moving from bottom to top of Maslow’s needs hierarchy, the following stage is not much motivating without fulfilling the previous need stage; which means that security needs will be important after fulfilling physiological needs to a certain extent.
Mothers from lower socio-economic group were the ones who were least worried about insufficient financial capabilities. This factor worried mothers from upper socio-economic group most, followed by mothers from middle socio-economic group. Anxieties of mothers from upper socio-economic group may be explained by the fact that they may be worried about their children’s losing high living standards that they are used to. Similarly, we may adds that mothers from other socio-economic groups have worries according to their own living standards. The most important proof were the mothers from lower socio-economic group, who were the least anxious group about insufficient financial capabilities. Suggestions We may adds the following suggestions after these findings: 1. As anxious mothers will reflect their anxieties on their children, they will influence their emotional development and anxiety levels. Therefore, mothers should be trained in order to develop skills to control anxiety levels. 2. If we think that anxiety will turn into a behaviour style in time, we may concludes that psychologic aid and mother (family) aid may be given as a support. 3. Mothers should be trained to develop their communi-cation skills.
4. Psychologic counselors should be employed in order to organize school-family cooperation, monitor children’s development and inform families, contribute to cooperation through both family trainings and child-adolescent trainings. 5. Directors and teachers should cooperate with families in their institutions in order to make planning according to mothers’ needs and share this with families at the beginning of the semester. 6. Fathers should support mothers in order to reduce their anxiety and act together in child raising and decision-making processes. REFERENCES Aydın E, Dilmaç B (2004). Matematik kaygısı. In. M. Gürsel (Eds.),
Eğitime ilişkin çeşitlemeler. Konya: Eğitim Kitabevi. pp.231-241. Altunışık R, Coşkun R, Yıldırım E, Bayraktaroğlu S (2001).
Sosyalbilimlerde araştırma yöntemleri. Adapazarı: Sakarya Kitabevi. Akmeşe P, Mutlu A, Günel K (2007). Serebral paralizili çocukların
annelerinin kaygıdüzeyinin araştırılması.Çocuk Sağlığı ve Hastalıkları Dergisi, 50:236-240. www.cshd.org.tr/csh/pdf/pdf_CSH_269.
Arıkan İ, Doğan Y (2013). İlköğretim 7. sınıf öğrencilerinin kültürel mirasla ilgili başarı düzeyleri ve tutumlarının bazı değişkenlerce incelenmesi(Adıyaman Örneği).Adıyaman Üniversitesi Sosyal Bilimler Enstitüsü Dergisi. 5:29-68. dergipark.ulakbim.gov.tr/adyusbd/
Avşaroğlu S (2012). Zihinsel yetersizliğe sahip çocuğu olan anne-babalarınkaygı düzeylerinin incelenmesi. Uluslararası İnsan Bilimleri Dergisi, 9(1):533-549. www.arastirmax.com/.../bilimsel.../uluslararasi-insan-bilimleri-dergisi/9/1.
Baer J, Kim M, Wilkenfeld B (2012). Isit generalized anxiety disorder or poverty?An examination of poormothers and their children. Child Adolesc Soc Work J. 29:345–355.
Brumarıu LE, Kerns K, Seıbert A (2012). Mother–childattachment, emotion regulation, and anxiety symptoms in middle childhood. J. Int. Assoc. Relat. Res. 19:569-585.
Cassano M, Perry-Parrish C, Zeman J (2007). Influence of genderon parental socialization of children’s sadness regulation. Soc Dev. 16:210-231. onlinelibrary.wiley.com › ... › Vol 16 Issue 2 DOI: 10.1111/j.1467-9507.2007.00381.x. Issue,
Craske MG, Katharina MA, Fernandez RL, Devon Hinton MD (2010). Panıc dısorder: A revıew of DSM-IV panıc dısorder and proposals for DSM-V, Depressıon and Anxıety. 27:93-112. www.dsm5.org/.../Craske_PD%20Review.pdf
Cüceloğlu D (2006). İnsan ve davranışı:psikolojinin temel kavramları. 15thPress. İstanbul: Remzi Kitabevi.
Çakmak O, Hevedanlı M (2005). Eğitim ve fen-edebiyat fakülteleri biyoloji bölümü öğrencilerinin kaygı düzeylerinin çeşitli değişkenler açısındanincelenmesi. Elektronik Sosyal Bilimler Dergisi. 4(14):115-127.
Doğru YSS, Arslan E (2008). Engelli çocuğu olan annelerin kaygı düzeyleri ile durumluk kaygı düzeylerinin karşılaştırılması. Selçuk Üniversitesi Sosyal Bilimler Enstitüsü Dergisi. 19:543-554.
Halberstadt AG, Cassidy J, Stifter CA, Parke RD, Fox NA (1995). Self-expressiveness within the family context: Psychometric support for a new measure. Psychological Assessment, 7:93-103. https://www.hhdev.psu.edu/.../hadberstadt%20
Kapcı EG (2004). İlköğretim öğrencilerinin zorbalığa maruz kalma türünün ve sıklığının depresyon, kaygı ve benlik saygısıyla ilişkisi. Ankara Üniversitesi Eğitim Bilimleri Fakültesi Dergisi. 37(1):1-13. dergiler.ankara.edu.tr/dergiler/40/143/1007.pdf
Karaman D, Durukan İ, Kara K (2012). Dikkat eksikliği hiperaktivite bozukluğu olan çocukların aile işlevleri ile annelerinin depresyon ve anksiyete belirti düzeyleri. TAF Preventive Medicine Bulletin. 11(6):741-748.doi:10.5455/pmb.1-1343309717, www.ejmanager.com/mnstemps/1/1-1343309717.pdf
Köknel Ö (1989). Zorlanan insan. İstanbul: Altın Kitaplar Yayınevi.

Lamb ME, Joseph HP, Eric LC, James AL (1987). A biosocial
perspective on paternal behavior and involvement. In James B. Lancaster, J Altmann, A S Rossi, L R Sherrod (Eds.), Parenting across the life Span. New York: Aldine de Gruyter.
Mash EJ, Wolfe DA (2002). Abnormal child psychology. Belmont: Wadsworth Group.
Navaro L (1993). Ana-baba okulu. İstanbul: Remzi Kitabevi. Ilgar S, Topac N (2014). An ınvestigation on the anxiety of turkish
mothers living in the usa about their children’s future. Am. J. Educ. Res. 2(9):745-751. pubs.sciepub.com/education/2/9/7/
Öner N, Le Compte A (1983). Durumluk-sürekli kaygı envanteri el kitabı. İstanbul: Boğaziçi Üniversitesi Yayınları.
Öner N, Le Compte A (1998). Durumluk-sürekli kaygı envanteri el kitabı. İstanbul: BoğaziçiÜniversitesi Yayınları.
Öngider N (2011). Boşanmış ve evli ailelerden gelen anneler ile çocuklarının anksiyetedüzeylerinin karşılaştırılması. Nöropsikiyatri Arşivi. 48:66-70 www.noropsikiyatriarsivi.com/tr/makale/2817/402/Tam-Metin.
Özer K (2011). Kaygı.İstanbul: Sistem Yayıncılık. Paksoy M (2002). Çalışma ortamında insan ve toplam kalite yönetimi,
İstanbul: Santay Yayınevi. Sieber JE (1980). Defining test anxiety: Problem and approaches. In IG
Sarason (Eds), Test anxiety, theory, research and applications. New Jersey: Lawrence Erlbaum Associates Publishing.
Ilgar 603 Spielberger C (1976). Cross-cultural anxiety. New York: Distributed-
Solely by Halsted Press. Spielberger C (1989). Stress and anxiety in sport. In D. Hacfort
C,Spielberger (Eds), Anxiety in sport: An ınternational perspective. New York: Hemisphere Publishing Comparation.
Queen A, Stewart L, May J, Pincus D (2013). Mothers’ and fathers’ ratings of family relationship quality: associations with preadolescent and adolescent anxietyand depressive symptoms in a clinical sample. Child Psychiatry Hum Dev. 44:351-360.
Yıldırım A, Şimşek H (2005). Sosyal bilimlerde nitel araştırma yöntemleri. 5thPress. Ankara: Seçkin Yayıncılık.

Vol. 10(5), pp. 604-614, 10 March, 2015 DOI:10.5897/ERR2014.2052 Article Number: 069103351108 ISSN 1990-3839 Copyright © 2015Author(s) retain the copyright of this article http://www.academicjournals.org/ERR
Educational Research and Reviews
Full Length Research Paper
Improving graduate students’ learning through the use of Moodle
Olmos Susana, Mena Juanjo*, Torrecilla Eva and Iglesias Ana
University of Salamanca, Spain.
Received 19 December, 2014; Accepted 03 February, 2015
Moodle stands as an online tool that promotes enhanced learning in higher education. However, it often becomes a repository of contents instead of an interactive environment. In this paper we describe how this platform was used by university students and teachers in 104 courses and compare whether ICT-as core subject courses-use Moodle more effectively than non-ICT content related courses. A sample of 393 students answered a 20-item Likert-type questionnaire (OUS-Q) and three open questions. Descriptive statistical analyses, chi square comparisons and topical analysis were conducted. The results show that all courses include a large number of digital contents and activities. However, scores for ICT-courses were significantly higher in evaluation of assignments or video-learning. There were no noticeable differences in other factors. Qualitative data show 891 comments that were classified into five dimensions. In conclusion Moodle improved content management and interactivity but only ICT courses used it as a learning platform. Key words: Teacher education, student teachers, university teaching.
INTRODUCTION The development of multimedia resources has allowed developing new ideas about teaching-learning concepts in the current educational landscape (Friedman, 2006).
In higher education it is additionally demanded that both teachers and students use online learning resources to support the knowledge acquired from the formal face-to-face context. That is why the concept of web-based instruction or mobile learning (m-learning) is gaining popularity in Teaching Education as a way of improving daily practices (Smith, 1999; Chen and Huang, 2010; Hwang and Tsai, 2011). The types of resources are considerably varied: from discussion lists, podcasts, database of libraries, or virtual learning environments, to virtual subjects. In a way, the three main reasons that
protect the combination of e-learning and face-to-face teaching are: accessibility, flexibility, and interactivity (Rosenberg, 2001).
This extensive use of technology has resulted in many studies aiming to explore e-learning skills and the experiences that students and teachers reveal. E-learning is a new type of interactive learning in which the content to be learnt is available online and, therefore, provides an automatic feedback for students about these teaching activities (Toth et al., 2006). Consequently it creates a different way of understanding the manner in which both students and instructors interact (Bruce and Curson, 2001) which leads educational research to understand what the required characteristics are for this
*Corresponding author. E-mail: [email protected]. Authors agree that this article remain permanently open access under the terms of the Creative Commons Attribution License 4.0 International License

new generation of students (Oblinger, 2003; Hammond, 2013). Moodle as a learning management system (LMS) Schools are in permanent change, especially with the incorporation of ICT. Many teaching courses at universities offer a greater amount of online content, and some of them are a prescriptive requirement to promote virtual learning and encourage the interactions between teachers and students (Psycharis et al., 2013).
Educational research has approached the study of interactive virtual environments under different names: Course Management Systems -CMS- (Morgan, 2003), Web-Base Course Environment - WBCE (Maki and Maki, 2002), Virtual Learning Environments–VLES- (Britain and Liber, 1999) or Learning Management Systems-LMS- (Melton, 2006; Ellis, 2009).
LMS refer to an integrated set of networked and computerized tools that support online learning (Kirner et al., 2008). They are complexly didactic systems that have a platform for web-learning including (1) traditional activi-ties: presenting information, course materials, evaluating the students’ work (Yueh and Hsu, 2008) and (2) additional features such as more communication with peers and instructors, social network site membership (Pereneder et al., 2012) access to learning material, submission of assignments (Melton, 2006), and active learner-learner discussion among participants (Swan, 2001).
LMS have been used to support the three types of instruction used nowadays: face-to-face learning, on-line learning, and blended learning (DeNeui and Dodge, 2006; Conrey and Smith, 2007; Vaughan, 2007; Benyon and Mival, 2012). E-learning platforms have been distributed as either commercial software (i.e. WebCT, blackboard) or open-source software (i.e. Moodle, Drupal, Wordpress, ECMS) (Martín-Blas and Serrano-Fernández, 2009).
One of the most used LMS is Moodle (Modular Object-Oriented Dynamic Learning Environment), an open source based on pedagogical principles (Goyal and Puhorit, 2010) that incorporates several multimedia resources to manage content lessons (Moodle, 2007). Moodle complements teachers’ face-to-face teaching; it is available in more than 77 languages and present in 193 countries (Celik, 2010). The platform has become established as an online tool that allows the use of graphics, forums, chat, databases, quizzes, survey, wikis, web pages, video transmissions, and Java and Active X technologies to reinforce lessons. Besides, Moodle is expanding its use to cloud computing and mobile learning (Wang et al., 2014).
Peat and Franklin (2002) value Moodle not only for its technical applications but for the promotion of new learning among students since it facilitates an organized display of the material. Dougiamas and Taylor (2003)
Olmos et al. 605 emphasize that the fundamental value of this platform is that users can share learning objects: any digital resource that may be used to support learning (Wiley, 2000) and therefore “...must have an external structure of information to facilitate their identification, storage and retrieval: the metadata” (Rehak and Mason, 2003: 25) to accomplish that purpose.
Moodle, as e- (or b-) learning tool, extensively enables this type of learning because of these three characteristics: a. Interaction. It enhances student-student discussions (Swan et al., 2000, Picciano, 2002). Beaudoin (2001) found that students reported increased satisfaction for online courses. b. Usability. It has a variety of useful options for students such as easy installation (Katsamani et al., 2012), cus-tomization of the options (Sommerville, 2004), security and management (Chavan and Pavri, 2004), easiness of navigation; software attractiveness and users’ satisfaction (Kirner and Saraiva, 2007). c. Social presence. Moodle promotes a sense of com-munity in online courses (Sagun and Demirkan, 2009). Social presence is an essential aspect in any educational experience referring to participants’ perception on the degree they see others as true speakers in mediated communication (Gunawardena and Zittle, 1997). It has been demonstrated to be a relevant predictor of students’ perceived learning (Richardson and Swan, 2003). And, as a teaching tool, Moodle allows for (Ross, 2008) (a) The management of subject contents (documents, graphics, web pages or videos); (b) Communication with students (i.e. forums or virtual tutorials) and (c) Students’ assessment (i.e. grading or monitoring subject assignments)
However, it also requires a better management of the classroom, the change of the format of tutorials and assignments as well as a continuous engagement in student progress (Antonenko et al., 2004). Theoretical paradigms that support Moodle Unlike other similar online platforms, Moodle does not emerge from the engineering context but, on the contrary, it has an educational background (Cole and Foster, 2007). For that reason, the development of this tool is based on different theories on learning. One of these theories is related to social constructivism (Duff and Jonassen, 1992). This epistemological foundation is based on collaborative discourse (Amundsen, 1993) and the development of meaning from sharing texts and a series of social devices (e.g. Graphics, diagrams, etc.). The basic precept is that students create their own learning and teachers guide the process of the construction of knowledge. This process of interaction also allows the development of learning communities (Lave and Wenger, 1991) where the discourse enables a

606 Educ. Res. Rev. process of searching for meaning.
Nonetheless, the development of a community is often difficult, especially when it is of virtual nature because limited (or no) face-to-face interaction take place (Dawson, 2006). Although ICT help to connect participants, the simple fact of using computer-mediated communication does not necessarily facilitate the emergence of a community (Brook and Oliver, 2003).
A second model that supports the use of Moodle is the theory of the types of knowledge (Belenky et al., 1986). It highlights the existence of two different learning styles: independent knowledge and connected knowledge. The independent students adopt a critical position when faced with contents, while the connected students tend to build ideas on the basis of others through collaboration. These two types of knowledge are independent and each of us uses them without distinction in different situations. To date the argumentative and critic learning has been encouraged as the main channel, rather than a collaborative one. Moodle allows the development of connected knowledge.
Finally, there would be a third theory that justifies the use of Moodle: the theory of emancipation (Habermas, 1984) that proves how critical and collaborative thought allows for transformation of perspectives by historical and political contingencies. The best way to achieve transformative learning is to help students to examine their own beliefs, feelings and actions and to explore the existing alternatives through negotiated reflections. Moodle can be an ideal environment to foster it. Use of Moodle in higher education To date, the success of this virtual platform among the university community has been mainly based on offering a permanent repository of contents, units, assignments, and essays that can be shared at any time (Medina et al., 2014). However, it is still unclear to what extent the use of Moodle allows students and teachers to build collaborative learning, in what is the ultimate promise of educational research.
Some studies confirm that both Moodle and online materials improve learning results (Escobar-Rodríguez and Monge-Lozano, 2012; Martín-Blas and Serrano-Fernández, 2009; Núñez et al., 2011). Soyibo and Hudson (2000) argue that teachers who use web pages designed for teaching or online virtual materials increase students’ attention and participation and allow more significant learning experiences. Other authors, such as Steyaert (2005) show that both Moodle and Internet organize contents in thematic units and save time in the management of this tool for both teachers and students, whereas Peat and Franklin (2002) state that what facilitates learning is the fact that it provides students with a simple display of the syllabus.
However, it is crucial to point out that the samples of students are usually homogeneous and the methods to
explore such virtual learning experiences are based on interviews and discussion groups. Sharpe et al. (2006) have proved how students with disabilities have different virtual learning experiences from those without disabilities in the same subjects or learning situations. This conclusion can be extended to all populations bearing in mind that individual differences mean different learning patterns. If it is true, we need to use Moodle or any educational tool in a way that reflect learners’ and teachers’ voice in the experimentation with these tools is increasingly advocated (Sharpe et al., 2005).
Melton (2006) asserts that before implementing its use, the schools and educators must carefully evaluate it. Besides, it would be necessary to identify both teachers’ and students’ standpoints concerning the advantages and difficulties perceived in its use.
Weitzman et al. (2006) provide a specific guide about the factors that must be taken into account before institutionalizing a tool like Moodle: (1) defining its purpose: The universities and high education institutions need to explicitly inform both teacher Educators and graduate students (i.e. in written form) about the Moodle platform: i.e., guidelines and protocols on how to use Moodle (i.e., criteria for uploading documents or designing quizzes or questionnaires), (2) collecting information about its users, (3) generating a list of suggestions based on the feedback obtained in steps 1 and 2: The universities have to conduct preliminary studies to know the potencial users`, opinions and suggestions (4) carrying out research that show its benefits (collecting empirical evidences), and (5) choosing and implementing the tool (according to collected research evidences). It seems that educational research still needs to consolidate steps 3 and 4.
Therefore, and bearing in mind the above, the present research emerged driven by the extensive use of Moodle in higher education institutions, especially in Universities. A descriptive-exploratory study was designed to obtain first-hand inputs of the real use in a particular context such as the Faculty of Education in the University of Salamanca (Spain). Our main goal is gathering research evidence on the potential of Moodle for teaching going beyond its use as just a repository of documents.
More specifically this study aims at (1) how teachers and students of the Faculty of Education (University of Salamanca, Spain) use Moodle (named as Studium: http://moodle.usal.es) taking as reference the students’ perceptions; and (2) how the use of Moodle differs depending on the kind of subject (i.e., ICT content related subjects and Non-ICT content related subejcts). METHODOLOGY This study is part of a research project entitled: “Evaluation to optimize the use of Moodle (Studium) in the Department of Education at the University of Salamanca” reference number ID11/050. Twenty-five teachers of the University of Salamanca participated during the academic year 2012-2013.
The project followed four phases (1) Design of the questionnaires

and methodological validity; (2) Application: computerization of the online questionnaire, which was uploaded into Moodle; 3) Statistical data analysis; and (4) Final report and improvement proposals.
The tasks carried out in the four phases were distributed among three teams that assumed different responsabilities: The Coordina-tion Team (CT) organized the schedule and activities of the research project; the Area Team (AT) was responsible to construct and evaluate domain specific questions belonging to four main areas: research methods, educational technology, special educa-tion, and didactics; finally the Technical Team (TT), composed of IC technicians, was in charge of the computerization of the questionnaire. Sample The present study is based on the population of graduate students enrolled in the subjects taught by the Department of Education of the University of Salamanca in 2012/2013: ICT in Education, Didactics and Education, Attention to Diversity, Counselling, Educa-tional Intervention in Communication and Language, Educational Research Methodology, Methodological grounding for Educational Research, Special Education, and Learning Disorders.
One hundred and four subjects integrate the whole syllabus of the Department of Education, which includes two different areas of knowledge: Area of Didactics and School Organization (70 sub-jects), and Area of Research Methods in Education (34 subjects).
A non- probabilistic sample of the 393 graduate students was chosen (Arnal et al., 1992). The participants voluntarily responded to the questionnaire. Variables and data collection instruments The variables of the study were defined in the previous phase of the construction of the measuring instrument and, according to the subsequent data analysis, were divided into two groups: predicting variables (course, degree and type of subject) and criterion variables (quantity and quality of the use of Moodle). A 20-item questionnaire (Optimizing the Use of Studium Questionnaire -OUS-Q-) was constructed following the online survey process (Berends, 2006; Kerlinger and Lee, 2000) (phase 1). Then, it was applied online in all the subjects of the department (phase 2). The questionnaire was organized into seven units of contents: 1) Personal information (gender, degree, course, and subject); 2) Access to the virtual campus; 3) Training for the use of Stadium; 4) Contents; 5) Assessment; 6) Interaction, and 7) Learning. Please see Appendix A for an extract of the UOS-Q questionnaire
Experts in educational research methodology, and experts in information and communication technologies revised and modified the questionnaire until the final version was completed. Cronbach’s alpha α=0.92 was also calculated as a measure of the accuracy or stability of the answers.
The answers were arranged in a four-degree Likert scale associated to values of: (1) Completely disagree (not at all); (2) Disagree (not much); (3) Agree (quite a lot); (4) Completely agree (a lot). The neutral response was not used because we wanted the participants’ position towards the attitudinal object. According to Schuman and Presser (1996) the middle alternative (i.e. labels such as “undecided,” “uncertain,” or “indifferent”) can be associated to absence of opinion, or ambivalence about the attitude under scrutiny. Nunnally and Bernstein (1994) also indicate that there is an advantage to using a scale with no middle “undecided” position because a neutral response gives little information. Analysis The research design of this study is descriptive and correlational
Olmos et al. 607 (ex-post facto) (Kerlinger and Lee, 2000). A mixed-method approach was chosen for the analysis. A first descriptive statistical analysis was conducted for the Likert questions including frequencies, percentages, measures of central tendendy (i.e., mean scores) and measures of scatter (i.e., standard deviation). A second inferential analysis was used to search for differences between the participants enrolled in the subjects related to ICT contents: that is to say, subjects where their sillaby included learning about ICT and technological competence acquisition (group 1) and those non-related to ICT contents: there is no intended learning on ICT tools, but they are used as storage medium (group 2). Three major aspects were compared (Ross, 2008): (a) contents, (b) evaluation and (c) interaction -which correspond to the sections 4, 5 and 6 of the QUS-Q- using SPSS 19.0.
Topical analysis was followed (Grounded Theory Analysis, Corbin and Strauss, 1990) to analyze the open-ended questions relative to three dimensions: (1) Advantages of using Moodle (Question 1: List and explain positive aspects in the use of Moodle); (2) Challenges and disadvantages of the platform and (Question 2: List and explain negative aspects in the use of Moodle) (3) Enhancements (Question 3: Point out some Moodle features that improve your experience with the Moodle interface). Student’s statements (N=282) were divided into utterances (Crasborn et al., 2011) and were initially grouped into six macro-categories established by Kirner et al. (2008) for the assessment of Moodle: intuitiveness, operationability, efficiency of use, learnability, attractiveness, and user satisfaction. However, due to the level of saturation of frequencies in each of these categories, we carried out an inductive subcategorization in three additional levels. Reliability checks were done by two independent rates obtaining a coefficient of Cohen Kappa =0.79. RESULTS Quantitative study The 80.7% of the sample were women while 18.8% were men. Regarding the subjects, 34.6% of the students took courses that corresponded to subjects content related to ICT whereas .65.4% took courses whose content was not specifically focused on technology in education Contents and activities provided through the platform First of all, students were asked to rate the degree of agreement or disagreement with nine items related to the organization of the units and activities in connection with the contents and activities provided through the platform Moodle.
As shown in Table 1, participants expressed a high degree of agreement, especially in the items concerning those aspects related to the contents (i.e. organization, adaptation, updating, promoting interest, understanding). The chi-square statistic test shows that there are only significant differences between the groups 1 and 2, about to the answers in two of the items. Item 6 “I like that the teacher provides us with class presentations” (=10.296, p=0.016) and item 8 “The videos or the images selected allow us to learn in a more intuitive and dynamic way” ( =14.377, p=0.002).
2
2

608 Educ. Res. Rev. Table 1. Students’ opinion about the contents and activities uploaded in Studium (Moodle platform). Contents Group a1 (n=131)% Group a2 (n=248)%
Completely disagree Disagree Agree Completely
agree
Completely disagree Disagree Agree Completely
agree 1. There is a logic organization of the teaching units.
1.5 5.3 70.2 22.9 1.2 5.2 64.5 29.0
2. The contents are appropriate to the syllabus.
0.8 3.1 73.3 22.9 0.4 2.4 69.8 27.4
3. The contents are updated.
2.3 3.8 63.4 30.5 0.0 3.2 59.7 37.1
4. The resources uploaded by the teacher are interesting
0.0 5.3 66.4 28.2 0.8 6.0 62.5 30.6
5. Studium is an efficient tool to get relevant information related to the subject
0.8 6.9 51.1 41.2 0.4 5.6 56.9 37.1
6. I like the teacher provides the class presentations through Studium.
0.0 1.5 33.6 64.9 0.8 0.4 20.6 78.2
7. The links to web sites selected by the teacher allow us to extend the topic of study and understand it better
3.1 10.7 58.0 28.2 1.2 5.6 56.9 36.3
8. The videos or the images selected allow us to learn in a more intuitive and dynamic way
1.5 8.4 63.4 26.7 0.8 4.8 48.0 46.4
9. I am interested in checking all the resources listed in Studium
3.8 14.5 56.5 25.2 1.6 10.9 51.6 35.9
Group 1= Group of students enrolled in ICT-related subjects; and Group 2= Group of students enrolled in non ICT-related subjects. On the other hand, and according to the students’ perceptions, the results demonstrate that the teachers promoted “database”, “choice”, “survey”, “forum”, “lesson” and “assignments” as the most frequent activities in the Moodle platform. Generally speaking, a higher percentage of use is perceived in group 1. There are two
activities that are only used by group 1, the “quiz” (
=9.455; p=0.002) and the “wiki” ( =33.886, p=0.000). The least used activities are: “chat”, “diary”, “glossary”,
“Self-assessment exercises with Hot Potatoes Quiz”, “videoconference”, and “workshop”. In that respect, it should be noted that the lack of use is higher in group 2, as the percentages show. The chi-square statistic calculated in each case shows that the differences discussed are significant (sig. 0.05) in all the activities
apart from “diary” ( =0.527; p=0.468), “glossary” (=1.836; p=0.175), “Self-assessment exercises with Hot
Potatoes Quiz” ( =0.539; p= 0.463), “videoconference”
2
2
2 2
2

Olmos et al. 609
Table 2. Activities promoted in Studium by the Faculty Teachers according to the students’ opinion.
Group 1 (n=131) % Group 2 (n=248)% Chi
square P
Value Activities accomplished by the students
not at all
not much
quite a lot
a lot/ very
much
not at all
not much
quite a lot
a lot/ very
much
Download files 0.0 4.6 40.0 53.4
1.6 5.2 20.6 72.6
21.014 0.000 Database 21.4 32.8 31.3 14.5 23.0 34.3 25.8 16.9 1.400 0.705 Chat 73.3 20.6 5.3 0.8 75.8 20.6 2.8 0.8 1.550 0.671 Choice 12.2 20.6 43.5 23.7 13.3 23.8 42.3 20.6 0.869 0.833 Survey 25.2 43.5 29.0 2.3 34.3 35.1 23.4 7.3 8.763 0.033 Diary 63.4 24.4 10.7 1.5 68.1 20.2 8.5 3.2 2.412 0.491 Quiz 38.2 44.3 19.8 3.1 42.3 41.9 12.1 3.6 5.665 0.129 Forum 22.9 44.3 26.0 6.9 30.2 24.6 29.4 15.7 17.915 0.000 Glossary 48.1 22.9 21.4 7.6 47.6 29.0 18.5 4.8 2.706 0.439 Self-assessment exercises with Hot Potatoes Quiz
71.0 11.5 13.7 3.8 72.2 16.9 7.7 3.2 5.064 0.167
Lesson 12.2 9.9 42.7 35.1 14.9 11.7 33.5 39.9 3.221 0.359 Videoconference 92.4 3.8 3.1 0.8 94.8 4.8 0.4 0.0 6.709 0.082 Workshop 72.5 19.1 7.6 0.8 76.2 17.3 5.2 1.2 1.271 0.736 Assignment: submission of works or exercises
1.5 0.0 20.6 77.9 10.1 8.9 23.4 57.7 26.131 0.000
Wiki 32.8 19.8 35.9 11.5 60.5 17.7 16.1 5.6 31.423 0.000
Group 1= Group of students enrolled in ICT-related subjects; and Group 2= Group of students enrolled in non ICT-related subjects
( =0.09; p=0.758) and “workshop” ( =0.174; p=0.676). With regard to the activities done from the platform, it is significant that students of both groups have only used quite a lot or very much the activities “download files”, “choice”, “lesson”, and “assignments”. Furthermore, the use of the rest of the activities is not at all or not very frequent. As shown in Table 2, the chi-square statistic test shows that there are significant differences between both groups in the activities “download files”, “survey”, “forum” and “assignments” (sig <0.05). Assessment through the platform In this section, students showed the degree to which the teacher promoted the development of the assessment activities from Moodle, both in its approach: formative (through self-assessment) and/or summative assessment (exams), establishment of criteria, development of different activities and assessment resources, and in the communication of the results obtained by the students. On the other hand, there are significant differences in the students’ opinions (sig. <0.05) as shows the associated probability for the items 1 ( =13,846; p= 0.003), item 2 ( = 23.273; p=0.000), item 4 ( =30.026, p=0.000) and item 7 ( =12.324; p=0.006). The four of them related to
self-assessment, teacher assessment and exams and influence of those proposed activities for the final mark. Interaction through the platform In the light of the data, there are no differences among the groups (1 and 2) in the interaction dimension. Students’ answers in line with the platform allows a more fluid communication with the teacher ( =0.277, p=0.964), it encourages that tutorial with the teacher is more continuous and prolonged ( =2.470, p=0.481) and promotes the communication among students ( =1.912, p=0.591). In consequence, there are not significant differences between the groups as the results of chi-square indicate (sig < 0.05). Qualitative study In the qualitative study, a total of 282 comments were collected about the positive aspects of Moodle, 287 about the problems of the platform, and 322 about the aspects that should be improved.
Table 3 shows the analysis of the comments referred to the positive aspects of Moodle.
2 2
2
2 2
2
2
2
2

610 Educ. Res. Rev.
Table 3. Positive aspects of the use of Studium (Moodle) according to the students’ perceptions. Categories Examples f %
1. Intuitive
1.1.Access 1.1.1.Easy
Easiness of access to the information of the different classes. It has an easy access.
17 6.02
1.1.2.Permanent You always have access to the information. 3 1.06
1.2. Use 1.2.1. Simple
Studium is an easy and convenient way to see the notes or even to download them.
2 0.71
1.2.2. Fast The use [of this application] is fast. 2 0.71
2. Operative (repository)
2.1. File
2.1.1.Contents/Syllabus
You have all the information of the subjects. We can download the syllabus of the subject.
73 25.88
2.1.2.Tasks Easiness to do an activity. Studium allows me to do the activities.
4 1.41
2.1.3.Score Easiness to know the grades. I find out about the grades.
14 4.96
2.2.File submission
2.2.1. Permanent possibility to hand in the activities.
We can see the documents provided by the teachers without problems or upload our practices into Moodle. The activities are submitted quickly and at any time.
15 5.31
2.2.2.Easiness of delivery
The activities are submitted easily. Assignments and exercises are sent from home, without having to print them and to give in a copy written in longhand to the teacher.
13 4.61
2.3.Organization
2.3.1.Dates/calendar
The notices about assignment submissions, class changes, etc., are very useful. We know dates, timetables, teacher’s email…
8 2.83
2.3.2.Information about the subjects (News and tracing)
Information about dates of presentation of academic work and/or submission of activities. If the teacher wants to make a change in any of the classes, we know it immediately.
34 12.05
3. Efficiency of use (interactivity)
3.1. Communication
3.1.1.Student-teacher
Communication with the teacher is easier. There is a greater communication with teachers.
22 7.80
3.1.2.Student-student
The students can share their works with others. It allows you to be in touch with the rest of your classmates.
11 3.90
3.1.3.Everybody
It helps you a lot when you have to discuss with the rest of your classmates or ask teachers to clarify your doubts through chat. Forums are pretty productive because people are encouraged to write.
15 5.31

Olmos et al. 611
Table 3. Contd.
3.2. Resolution of doubts
3.2.1.On the part of the teacher
If I have any doubts, teachers can solve them easily. It allows us to be in touch with the teacher to solve doubts at any time.
9 3.19
3.2.2.On the part of all the users
It is an efficient method to solve doubts among all the users. It is a platform to solve doubts.
4 1.42
4. Facilitator of learning
4.1.It complements the information
4.1.1.Expansion/revision of lecture notes
It’s thanks to Studium that I can complement and expand the notes. Studium promotes a complementary learning of the subject.
5 1.77
4.1.2.Reinforcement of the teacher’s explanation
It complements teachers’ explanations. You have information, apart from the content of the subject, which facilitates your learning.
2 0.71
4.1.3. It provides alternative activities to do.
We get a better understanding of the subject due to complementary activities. It keeps me informed about complementary activities.
2 0.71
4.2.It improves understanding
4.2.1.Individual It facilitates the understanding of the subject. It helps you understand the subject.
11 3.90
4.2.2.Collective
Forums allow the collaborative construction of knowledge among the students. You learn from all your classmates’ contributions
5 1.77
5. Attractive
5.1.It is a nice application to use
5.1.1.Brightness The Studium page has a well-organized design. 1 0.35
5.1.2.Comfort
It is comfortable to organize yourself. I find it much more comfortable, since the sheets of paper can be lost.
6 2.12
5.2.It is a stimulating application
5.2.1.It involves students
It causes a more active implication in the subject. It is used to get directly involved in the different subjects.
2 0.71
5.2.2.It motivates students
It encourages motivation. It motivates students and offers them help to learn the contents.
2 0.71
TOTAL 282 100
In the positive aspects dimension five domains similar to Kirner et al. (2008) were found that were further broken down into a three-level category. Generally speaking, the operative level that contains the repository of contents, activities or assignments, and the organization of the subject include the largest number of student comments (57.05%) (dimension 2). On the other hand, 7.09% of the comments refer to Studium as a tool to facilitate learning (dimension 4) and 23.39% to promote interactivity (dimension 3). Finally, with regard to the technical
management of the tool, the aspects that refer to intuition (dimension1) and attractiveness (dimension 5) represent 8.5 and 3.89%, respectively. The highest frequencies appear in the categories of repository of contents (25.88%), better organization of the subject (12.05%), and easiness of communication between teachers and students (7.80%), which draw together the highest number of comments.
Subsequently, we present some of the conclusions that can be deduced from the abovementioned analysis. We

612 Educ. Res. Rev. also suggest improvement proposals. DISCUSSION AND CONCLUSION There are many advantages and possibilities that have been suggested about Moodle as a provider of three essential resources: (1) online contents and activities; (2) interactive and transparent assessment and (3) teacher-students fluid interaction (Ross, 2008). However, few studies demonstrate that the daily use of it can contribute to an improvement in these three dimensions.
According to the first section (online contents and activities), Connolly et al. (2007) found that online students consistently perform better than the part-time face-to-face students, obtaining the conclusion that on-line contents are strong resources for student learning.
Mentzer et al. (2007), contrary to Connolly’s et al. study, found that learning did not differ significantly between on-line and face-to-face environments, but satisfaction turned out to be lower in on-line contexts. In our study, although these two ways of teaching are not compared since Moodle is established as a complement to the face-to-face teaching, people surveyed thought that the available online contents facilitate a better update of the subject, and they were logically organized. However, they never consider this tool more valid than face-to-face teaching or as a replacement of it.
Regarding the assessment, this study reveals that the platform serves to publicize assessment criteria and to mark the assignments. However, it does not usually incorporate elements of feedback. Furthermore, it is even less frequently that self-assessment activities and exams are done through Moodle; as a consequence, the assess-ment resources of the platform are not totally profitable, and an unbalance is made evident between teaching resources (document uploads, forums of doubts, assign-ment uploads, comments, etc.) and specific assessment resources (surveys: multiple-choice, true or false, short answer, etc.). This result is in accordance with Gibbs (2006) when he states that it is necessary “to avoid the disjunction between teaching and assessment modes […] to enable formative feedback to students (a pedagogic issue)” (Gibbs, 2006: 173). Conversely, Coulby et al. (2010) proved that undergraduate students improved their level of feedback and technology skills through a competency-based assessment.
Regarding the degree of interaction, the results show how the platform promotes a fluid communication with the teacher and with other students, and a most continuous exercise of the tutorial action with the teacher. This contradicts other studies that indicate how online communication can be lower and more intermittent (not contingent). For instance, Jin (2005) noted a general lack of student participation in online discussions and the need for solutions to ameliorate this problem. Other studies go further and highlight how the essential function of Moodle is to be the facilitator of student interactive
learning (Bruce and Curson, 2001; Zenha-Rela and Carvalho, 2006; Mateo and Sangrá, 2007). More recently Fatih and Demirkan (2015) have demonstrated that collaborative digital environments promote undergraduate students’ creative processes such as idea generation and self-motivation. In all these cases, interactivity is not mere communication, but it turns into online learning opportunities. Although this study reveals that this tool facilitates learning, the predominant use of it is linked to the filing of information and interaction between users.
On the other hand, if we consider the distribution of users into the two established groups, generally speaking, the high scores showed that Moodle improves content management, course assessment and interac-tivity in education. Nonetheless, ICT Educational courses tended to use it as a dynamic platform (resource of learning) whereas non-ICT related courses used Moodle more as a static repository (support platform). That leads us to think that the content of the course is decisive to exploit all the resources offered on the platform from a didactic point of view and, thus, to achieve a change to transform the tool into a collaborative learning facilitator. However, when assessing the comments about positive aspects, in general, a high percentage of them refer to the use of the platform as a repository.
We can conclude assuming that Moodle is comple-mentary to the teaching-learning process and that it is not a replacement of it (Coskun and Arslan, 2014). Considering its current support to the classroom lessons, Moodle is not being used at its full potential. Furthermore, it has been recently demostrated that the combination of Moodle with m-learning favours collaboration online assessment and knowledge dissemination, which in turn, enable ubiquitous learning (Alier et al., 2010; Bogdanov et al., 2014) REFERENCES Alier FM, Gerrero MJ, Poch JP (2010). Towards mobile learning
applications integration with learning management systems. In Goh TT (Ed.), Multiplataform e-learning systems and technologies: mobile devices for ubiquitous ICT- based education. Hersehy, PA: IGI Global. pp.182-194
Amundsen C (1993). The evolution of theory in distance education. In Desmond Keegan (Ed.), Theoretical principles of distance education. London: Routledge. pp.61-80
Antonenko P, Toy S, Niederhauser D (2004). Modular Object-Oriented Dynamic Learning Environment: What Open Source Has to Offer. Paper presented at the Association for Educational Communications and Technology, Chicago, IL.
Arnal J, Rincón D Del, Latorre A (1992). Investigación educativa: fundamentos y metodologías 1st Edition. Barcelona: Labor.
Belenky MF, Clinchy BM, Goldberger NR, Tarule JM (1986). Women's ways of knowing. New York, NY: Basic Books.
Benyon D, Mival O (2012). Blended spaces for collaborative creativity. In designing collaborative interactive spaces workshop. 25 May. Capri, Italy. http://hci.uni-konstanz.de/downloads/dcis2012_Benyon.pdf Retrieved 08.01.15. (Access 19.01.2015).
Berends M (2006). Survey Methods in Educational Research. In Green JL, Camilla G, Elmore P B (Eds.). Handbook of Complementary Methods in Education Research. Washington: AERA.

Britain S, Liber O (1999). A Framework for Pedagogical Evaluation of
Virtual Learning Environments. http://www.jtap.ac.uk/reports/htm/jtap-041.html. (Acess 10.09.2012)
Brook C, Oliver R (2003). Online learning communities: Investigating a design framework. Aust. J. Educ.l Technol. 19(2):139-160.
Bruce B, Curson N (2001). UEA Virtual Learning Environment, P.e. report editor: Norwich.
Celik L (2010). Evaluation of the views of pre-service teachers taught with Moodle during the course named “instructional technology and material design” on the use of teaching materials. Procedia Soc. Behav. Sci. 9:1793-1797.
Chavan A, Pavri S (2004). Open Source Learning Management in Moodle. Linux J. 1(2):78-97.
Chen HR, Huang HL (2010). User acceptance of mobile knowledge management learning system: design and analysis. Educ. Technol. Soc. 13(3):70-77.
Cole J, Foster H (2007). Using Moodle: Teaching with the Popular Open Source Course Management System. London: O'Reilly.
Connolly TM, MacArthur E, Stansfield M, McLellan E (2007). A Quasi-Experimental Study of Three Online Learning Courses in Computing. Comput. Educ. 49(2):345-359.
Conrey FR, Smith ER (2007). Attitude Representation: Attitudes as Patterns in a Distributed, Connectionist Representational System. Soc. Cogn. 25(5):718-735. DOI: 10.1521/soco.2007.25.5.718
Corbin J, Strauss A (1990). Grounded theory research: procedures, canons, and evaluative criteria. Qual. Sociol. 13(1):3-21. DOI:10.1007/BF00988593
Coskun A, Arslan A (2014). Moodling English Language. Education 134(3):275-281.
Coulby C, Hennesseym S, Davie N, Fuller R (2010). The use of mobile technology for work-based assessment: the student experience. Brit. J. Educ. Technol. 42(2):251-265. DOI: 10.1111/j.1467-8535.2009.01022.x
Crasborn F, Hennissen P, Brouwer N, Korthagen F, Bergen T (2011). Exploring a two-dimensional model of mentor teacher roles in mentoring dialogues. Teach. Teach. Educ. 27:320-331. DOI: 10.1016/j.tate.2010.08.014
Dawson S (2006). Relationship between student communication interaction and sense of community in higher education. Internet High. Educ. 9(3):153-162.
DeNeui DL, Dodge TL (2006). Asynchronous Learning Networks and Student Outcomes: The Utility of Online Learning Components in Hybrid Courses. J. Instr. Psychol. 33(4):256-259.
Dougiamas M, Taylor PC (2003). Moodle: Using Learning Communities to Create an Open Source Course Management System. In D. Lassner and C. McNaught (Eds.), Proceedings of World Conference on Educational Multimedia, Hypermedia and Telecommunications 2003. Chesapeake, VA: AACE. pp.171-178
Duff TM, Jonassen DH (1992). Constructivism: New Implications for Instructional Technology. In Duffy TM and Jonassen DH. (Eds), Constructivism and the Technology of Instruction: A conversation. pp.1-16.
Ellis RK (2009). Learning Managament Systems. Alexandria, VI: American Society for Training & Development (ASTD).
Ellison NB, Steinfield C, Lampe C (2007). The benefits of facebokk “friends”: Social capital and college students’ use of online social network sites. J. Computer-Mediated Commun. 12(4):1143-1168
Escobar-Rodriguez T, Monge-Lozano P (2012). The acceptance of Moodle technology by business administration students. Comput. Educ. 58:1085-1093
Fatih A, Demirkan H (2015). Collaborative digital environments to enhance the creativity of designers. Comput. Human Behav. 42:176-186. DOI: 10.1016/j.chb.2014.03.029
Friedman TL (2006). The world is flat. The globalized world in the twenty-first century. Victoria: Penguin. (rev. ed.)
Gibbs G (2006). Why assessment is changing. In C. Bryan, y K. Clegg (Eds.), Innovative Assessment in Higher Education. London: Routledge. p. 11-22
Goyal E, Purohit S (2010). Study of Using Learning Management System in a Management Course. SIES J. Manage. 6(2):11-20.
Gunawardena CN, Zittle FJ (1997). Social presence as a predictor of satisfaction with a computer-mediated conferencing environment.
Olmos et al. 613
Am. J. Distance Educ. 11:8-26. Habermas J (1984). The Theory of Communicative Action, Vol 1:
Reason and Rationalization of Society. Cambridge, England: Polity Press.
Hammond M (2013). Introducing ICT in schools in England: Rationale and consequences. Brit. J. Educ. Technol., 45(2):191-201.
Hwang GJ, Tsai CC (2011). Research trends in mobile and ubiquitous learning: a review of publications in selected journals from 2001 to 2010. Brit. J. Educ. Technol. 42(4):65-70.
Jin SH (2005). Analyzing student-student and student-instructor interaction through multiple communication tools in web-based learning. Int. J. Instr. Media. 32(1):59-67.
Katsamani M, Retalis S, Boloudakis M (2012). Designing a Moodle Course with the CADMOS Learning Design Tool. Educ. Media Int. 49(4):317-331.
Kerlinger F, Lee H (2000). Foundations of Behavioral research. Orlando: Harcourt College Publishers.
Kirner TG, Custodio CA, Kirner C (2008). Usability evaluation of the moodle system from the teachers’ perspective. Paper presented at the IADIS International Conference e-Learning. 22-25 July. Amsterdam, The Netherlands.
Kirner TG, Saraiva AV (2007). Software Usability Evaluation: an Empirical Study. Paper presented at Proceedings of the 9th International Conference on Enterprise Information Systems. Funchal, Portugal. pp.459-465.
Lave J. Wenger E (1991). Situated Learning: Legitimate peripheral participation. New York: Cambridge University Press.
Maki WS, Maki RH (2002). Multimedia comprehension skill predicts differential outcomes of Web-based and lecture courses. J. Exp. Psychol. Appl. 8:85-98.
Martín-Blas T, Serrano-Fernández A (2009). The role of new technologies in the learning process: Moodle as a teaching tool in Physics. Comput. Educ. 52:35-44.
Mateo J, Sangrá A (2007). Designing online learning assessment through alternative approaches: facing de concerns. Eur. J. Open Distance e-Learning. pp.3-14.
Medina M, Martínez IJ, Briones AJ, Hernández E (2014). Using moodle virtual platform in teacher for secondary school teachers that have little knowledge of ICT through a working group offered by the educational administration. Paper presented at the 8th International Technology, Education and Development Conference. 10-12 March. Valencia, Spain.
Melton J (2006). The LMS Moodle: A Usability Evaluation. Prefectural University of Kumamoto, Japan.
Mentzer G, Cryan J, Teclehaimanot B (2007). Two Peas in a Pod? A Comparison of Face-to-Face and Web-Based Classrooms. J. Technol. Teach. Educ. 15(2):233-246.
Moodle (2007). Moodle Documentation. Retrieved from: <http://docs.moodle.org> (Access 12.11.2013)
Morgan G (2003). Faculty Use of Course Management Systems. (Research Study, Vol.2). Boulder, CO: EDUCASE Center for Applied Research. http://www.educase.edu/ecar/ (Access 12.11.2013).
Núñez JC, Cerezo R, Bernardo A, Rosário P, Valle A, Fernández E, Suárez N (2011). Implementation of training programs in self-regulated learning strategies in Moodle format: Results of an experience in higher education. Psicothema 23(2):274-281.
Oblinger D (2003). Boomers, Gen-Xers and Millenials: Understanding the new students. Educ. Rev. 3:37-45.
Peat M, Franklin S (2002). Supporting Student Learning: The Use of Computer-based 9. Formative Assesment Modules. Brit. J. Educ. Technol. 33(5):515-523.
Perteneder F, Grossauer C, Seifried T, Walney J, Brosz J, Tang A et al. (2012). Idea playground: When brainstorming is not enough. In Designing collaborative interactive spaces workshop, 25May. Capri, Italy. http://hci.unikonstanz.de/downloads/dcis2012_Perteneder.pdf (Access 09.01.15).
Picciano AG (2002). Beyond student perceptions: issues of interaction, presence, and performance in an online course. J. Asynchronous Learn. Networks. 6(1):21-40.
Psycharis S, Chalatzoglidis G, Kalogiannakis M (2013). Moodle as a Learning Environment in Promoting Conceptual Understanding for Secondary School Students. EURASIA J. Math. Sci. Technol. Educ.

614 Educ. Res. Rev.
9(1): 11-21. Rehak DR, Mason R (2003). Engaging with the Learning Object
Economy. In Littlejohn, Allison: Reusing Online Resources: A Sustainable Approach to E-Learning. London: Kogan Page. pp. 22-30.
Richardson J, Swan K (2003). Examining social presence in online courses in relation to students' perceived learning and satisfaction. J. Asynchronous Learn. 6(1):21-40.
Rosenberg M (2001). E-learning strategies for delivering knowledge in the digital age. Columbus: McGraw-Hill.
Ross I (2008). Moodle, la plataforma para la enseñanza y organización escolar. Ikastorratza, e- Revista de Didáctica 2:1-12. http://www.ehu.es/ikastorratza/2_alea/moodle.pdf (Access 01.04.2013)
Sagun A, Demirkan H (2009). On-line critiques in collaborative design studio. Int. J. Technol. Design Educ. 19(1):79-99. DOI: 10.1007/s10798-007-9036-2
Schuman H, Presser S (1996). Questions and answers in attitude surveys: Experiments on question form, wording and context. Thousand Oaks, CA: Sage.
Sharpe R, Benfield G, Lessner E, DeCicco E (2005). Learner Scoping Study: Final Report. http://www.jisc.ac.uk/uploaded_documents/scoping%20study%20final%20report%20v4.1.doc (Access 15.03.2013).
Sharpe R, Benfield G, Roberts G, Francis R (2006). The undergraduate experience of blended e-learning: a review of UK literature and practice undertaken for the Higher Education Academy.http://www.heacademy.ac.uk/assets/documents/research/literature_reviews/blended_elearning_exec_summary_1.pdf (Access 15.05.2013)
Smith A (1999). Web-based Training. Electronic Libr. 17:338. Sommerville I (2004). Software Engineering. MA, USA: Addison-
Wesley, Reading. Soyibo K, Hudson A (2000). Effects of Computer-assisted Instruction
(CAI) on 11th 8. Graders’ Attitudes to Biology and CAI and Understanding of Reproduction in Plants and Animals. Res. Sci. Technol. Educ. 18(2):191-199.
Steyaert J (2005). Web based higher education, the inclusion/exclusion paradox. J. Technol. Human Serv. 23(1):67-68. DOI: 10.1300/J017v23no1_05
Swan K, Shea P, Fredericksen E, Pickett A, Pelz W, Maher G (2000). Building Knowledge Building Communities: Consistency, Contact and Communication in the Virtual Classroom. J. Educ. Comput. Res. 23(4):359-83.
Swan K (2001). Virtual interaction: Design factors affecting student satisfaction and perceived learning in asynchronous online courses. Dist. Educ. 22:306-331.
Toth A, Pentelényi P, Toth P (2006). Virtual Learning Aspects of
Curriculum Development in Technical Teacher Training, in Proceedings of Intelligent Engineering Systems. IEEE: London.
Vaughan N (2007). Perspectives on Blended Learning in Higher Education. Int. J. E-Learning. 6(1):81-94.
Wang M, Chen J, Khan MJ (2014). Mobile cloud learning for higher education: A case study of Moodle in the cloud. Int. Rev. Res. Open Distance Learn. 15(2):141-149.
Weitzman L, Lewis-Bowen A, Evanchik S (2006). Using Open Source Software To Design, Develop, and Deploy a Collaborative Web Site, Part 1: Introduction and Overview. http://www-128.ibm.com/developerworks/ibm/library/i-osource1/index.html (Access 13.07.2013)
Wiley DA (2000). Connecting Learning Objects to Instructional Design Theory: A Definition, A Metaphor, and A Taxonomy. In David A. Wiley. The Instructional Use of Learning Objects: Online Version, Digital Learning Environments Research Group, Utah (USA). pp.1-35.
Yueh H, Hsu S (2008). Designing a learning management system to support instruction. Communications of the ACM. 51(4):59-63.
Zenha-Rela M, Carvalho R (2006). Work in Progress: Self Evaluation through Monitored Peer Review Using the Moodle Platform. Frontiers in Education Conference, 36th Annual, San Diego, California. pp. 28-31.

Vol. 10(5), pp. 615-621, 10 March, 2015 DOI:10.5897/ERR2014.2005 Article Number: 24BC68651109 ISSN 1990-3839 Copyright © 2015Author(s) retain the copyright of this article http://www.academicjournals.org/ERR
Educational Research and Reviews
Full Length Research Paper
An investigation of high school seniors’ assertiveness levels based on their demographic characteristics
İbrahim ÇAM
Celal Bayar University, School of Physical Education and SportsManisa, Turkey.
Received 24 November, 2014; Accepted 22 February, 2015
High school students who are in the development age or in the last class and have chance to win the university exams or disposal stage of the business life must also have a high level of assertiveness. In this context, the purpose of this research is to compare the assertiveness levels of high school seniors. The study group consists of 312 high school seniors studying at five different high schools in Manisa center. In this research, to measure the level of assertiveness, sthe Rathus Assertiveness Inventory, which was developed by Rathus (1973) and translated into Turkish in 1980 by Voltan, was used. The demographic information of the participants was obtained by using ‘Personal Information Form’. The evaluation of the datum which was gained from the test subjects in this research was done by using T-Test, one-way analysis of variance and Tukey Test. At the end of this research, statistically meaningful differences were found out in the students’ scores of assertiveness according to their respective schools. When demographic information of the students were evaluated, statistically meaningful differences in the scores of assertiveness were found with regard to education level of their parents. Statistically meaningful differences in the scores of assertiveness were not found in relation to the gender of the students, their engagement with sports and the occupation of their parents. Key words: Assertiveness, sports, high school seniors.
INTRODUCTION The number of theoretical and scientific studies has mushroomed both domestically and internationally since the 1970s in conjunction with the development of psycho-social sciences. The issue of assertiveness has been scrutinized within the framework of cultural, gender-related and occupation-related studies. The basic of social life is determined by the individual’s relationship with the environment. Individuals should establish positive and consistent relationships with other people. Alberti and Emmons (1976) mentioned three types of
behavior among people:
1. Nonassertive behavior: entails people who give up their rights, in other words, the persons who refrain from obtaining their rights. 2. Aggressive behavior: the person does not accept the rights of other people, is the rejection of the rights of others. 3. Assertive behavior: accepting one's own and others ' rights.
E-mail: [email protected]. Tel: +90 505 784 94 95. Authors agree that this article remain permanently open access under the terms of the Creative Commons Attribution License 4.0 International License

616 Educ. Res. Rev. Among these three behaviors, only the assertive behavior is positive, while the other two are negative. Assertive and aggressive behaviors are sometimes confusing. Hollands worth et al. (1977) tried to show the difference between assertiveness and aggression concepts. In this regard, Alberti and Emnos (1976) emphasized that it was needed to investigate the definitions of assertive and aggressive behavior. Tucker et al. (1983) and behavioral scientists and researchers often admit that they fell into confusion about these two issues. They said that if these two concepts cannot be gained in terms of definitional clarity, in daily life assertive behavior may continue to be labeled as aggressive behavior. The experts dealing with this issue have tried to resolve the confusion by describing the concept of assertiveness. Assertiveness was first defined by Wolpe and Lazarus (1968). Wolpe and Lazarus stated that, all socially acceptable expres-sion of the feelings and rights might be regarded as assertive behavior. Jakubowski (1973) defined it as a behavior that contains the expression of interpersonal relationships and interactions that allow being healthy, being respectful of others' rights and the individual’s feelings, beliefs and thoughts directly, sincerely and clearly.
Albert and Emmons ( 1976) define assertiveness as; a person to act in a way that will be most profitable, without having pointless anxiety in self-supported, to describe as a kind of interpersonal format that makes it possible to express their rights without violating the rights of others.
Voltan (1981) explained assertiveness as individuals to be able to explain as they themselves can transmit both positive and negative emotions, to be able to resist their desire and ability to reverse a request from the opposite. The definition of assertiveness which is used today has been described by Albert and Emmons (2002). An assertive person was described as “a person who knows well and can defend his rights ".At the same time an assertive person is one who can demonstrate his ideas, feelings, beliefs and desires and can defend his rights without violating the beliefs and rights of others, disdaining them, without affecting or attempting to use them, without threatening them. They declared that these people think that the control of their lives is in their hands, they get satisfaction from their relationship and they reach most of their purpose. According to the definition and explanations above, it is possible to say that the assertive behavior is a positive and significant behavior. Accordingly, individuals’ assertiveness properties must be developed. Because assertiveness can be learned in later times, it is also possible to teach it. Assertiveness training is necessary for individuals to increase their self-confidence and to have positive influence on their self-esteem (Whirter, 1985, Connelly and Rotella, 1991).
In assertiveness training; saying the sentences about feelings that start with "I", to compliment, accepting, acting natural, reducing anxiety which negatively affects adaptation, learning to say ‘no’, to ask questions,
expressing all kinds of feelings, to start a conversation and keep on it, to distinguish assertiveness from aggression, to become conscious of issues such as individual rights and to transfer them to others can be processed (Erkal, 1990).
Furnham (1979) has advocated that assertiveness has to do with cultural characteristics and also points out that women in eastern cultures feel obliged to be obedient and submisive. According to his thinking, individuals living in cultures which encourage individualism and competition tend to be more assertive than those who live in cultures reinforcing collectivism and obedience. In his study, Furnham (1983) explored disparities in assertive behaviour across cultures and what assertiveness entails in each. Based on this research, the level of assertiveness of Europeans is very high, that of Indians is very low and Africans is somewhere in between.
When it comes to cultural and gender studies con-ducted by authors such as Kimble et al (1984), American women of Mexican origin are found to be less assertive than American men of Mexican origin.
Alberti and Emmons, (2002) argued that many individuals and sub-groups in Latin and Spa-nish cultures have embraced ‘machoism’ so strongly that assertive-ness in men is defined almost in terms of their degree of docility, which implies that assertiveness in men has become a show of power.In another study conducted by Soto and Shaver (1982), a negative correlation was found between traditional gender roles and assertiveness when the relationship between gender roles and assertiveness of women of Puerto Rican origin living in the States was explored. In the light of this study, it can be highlighted that women born in Puerto Rican who moved to the states later and who embraced traditional structure were found to be less assertive than new generation women of Puerto Rican born in the States.
Assertiveness is also related to culture, age and culture in another study conducted by Petrie and Rotheram (1996). In this study, children of Maori origin living in New Zealand and European children were compared and children of Maori origin were found to be more assertive and independent. Besides, age is seen to play a role as well as cultural differences; and girls are seen to be less assertive than boys; and are seen to cling to traditional roles more.
In a study by Eşkin (2003), where Turkish and Swedish youth were compared in terms of their level of assertiveness, Swedish youngsters were found to be more assertive and confident. In the same study, women and men were compared in both cultures with regards to their level of assertiveness. As a result, women, contrary to popular belief were found to be more assertive, brave and confident.
Assertivess is a form of positive behaviour for any age and gender. High school students who are in the deve-lopment age or in the last class and have chance to win the university exams or disposal stage of the business life

must also have a high level of assertiveness. High school students in preparing for college or profession for four years, spend most of their time in the school environment.
Different training programs used in schools, school resources and facilities which are used by students, teacher to student and student to student relationships, and also parents and administrators’ attitudes and behaviors towards students are thought to affect socially and psychologically the high school students who are changing and developing physically.
Studies on the assertiveness levels of high school students are very limited. It is important to explore level of assertiveness in high school students, to understand reasons for low-assertiveness and offer solutions accordingly. For this reason in this study, it is aimed to investigate if the assertiveness levels of the high school seniors are affected or not by looking at their respective schools, gender, parents' education and employment status and doing sports. MATERIALS AND METHODS Study group The students of 24 different programmed high schools located in the center of Manisa form the main idea of this research (MMEM 2014). The sample group included the 312 high school senior students apart from five different high schools. These are the high schools and their purposes which are implementing different programs involved in the research. Manisa Anatolian High School: This school implements higher education preparatory program based on the students’ ability and success besides intensive foreign languages program. 72 students doing mixed programme in Manisa Anatolian High School participated in the study. Industrial Vocational High School: Students are trained as intermediate elements to the industry or can attend vocational colleges. 100 students doingin mixed programme in Industrıal Vocational High School participated in the study. Anatolian Teacher High School: Students who love the teaching profession, with knowledge of foreign languages, primarily implement teacher training higher education preparatory programs. 52 students who are doing mixed programme in Anatolian Teacher High School participated in the study. Religious Vocational High School for Girls and Boys: Officers are trained who perform religious services such as imam, teacher of oratory and Koran courses and it also applies to higher education preparatory program (Istanbul Directorate of Education 2014). 52 girls and 36 boys doing non-mixed programme in Religious Vocational High School participated in the study. Data collection In this research to measure the level of assertiveness RAE which was devoloped by Rathus (1973 and then translated into Turkish by Voltan. (1980) is used.
Çam 617
To learn about the participants’ school, sex, doing sports or not, parent's education and jobs “personal information form" is used. RAE is a total of 30-item questionnaire consisting of positive and negative expressions and it can be applied to teens and adults. Answering is held on the 6- point Likert-type scale. Rating range is between 30 and 180.
The sums of the positive and negative expressions determine the person's level of assertiveness. Extending to lower inhibitions is 30 points, while extending assertiveness top score is 180. RAE’s reliability and validity study conducted by the Voltan and reliability coefficient was 0.92, as the validity coefficient was 0.77 (Voltan, 1980; Efe et al., 2008). In this study, the reliability coefficient of Rathus Assertiveness Inventory was 0.79. Data collection method Questionnaires were used. Required permissions were taken in order to to disseminate the questionnaires. They were given to the students during their physical examination classes, with permission taken from their teachers. They were given in the last semester to the twelth grade students in line with the purpose of the questionnaire. Data analysis In this study, when comparing the t-test, Analysis of Variance (ANOVA) and Tukeytest were used. Statistical findings and percentage values are given in tables. FINDINGS 32.1% of the students who participated in the study constitute Industrial Vocational High School; 16.7 %, Anatolian Teacher High School; 16.7% ,Girls Religious High Schools; 23.1%, Manisa High School; 11.4% Reputation of Men Religious Vocational High School Students. 38.1 % were female students and 61.9 % were male students.
Only 15.1 % of the subjects were licensed athletes and 47 % of these athletes were determined to be licensed in the football industry. It was found out that 72.2 % of students’ mothers were housewives, and 76.6 % graduated from primary school; 40.2 % of their fathers were workers and 45;2 % graduated from primary school. The average level of assertiveness in last grade high students is 120.11.
As shown in Table 1 it was found out that there are statistically significant differences between assertiveness of students studying in different schools. To find out where the differences arise from in the group, the Tukey test was done and the results of this test show us that the differences were between the Boys’ Religious Vocational High School Students and Manisa High School students and between the Girls’ Religious Vocational High School and Manisa High School students. When average score is scrutinized, it is seen that students at Manisa Anatolian High School got the highest score in assertiveness whereas students at Religious Vocational High School for boys got the lowest score.

618 Educ. Res. Rev.
Table 1. Comparison of assertiveness scores of students by their schools. Schools N % Mean sd Industrial Vocational High School 100 32.05 121.41 16.27
5.27
0.00*
Anatolian Teacher High School 52 16.66 117.76 18.58 Religious Vocational High School For Girls 52 16.66 116.42 19.21 Religious Vocational High School For Boys 36 11.53 113.27 21.44 Manisa Anatolıan High School 72 23.07 126.11 17.87 Total 312 100 120.11 18.58
p<0.01.
Table 2. Comparison of students’ assertiveness levels by gender.
Gender N Mean s.d. t p Girls 119 120.15 18.15
0.02
0.98
Boys 193 120.09 18.81 Total 312 120.11 18.69
Table 3. Comparison of students’ assertiveness levels by mother's education.
Mother’s education N % ortalama s.d. F p Primary 239 76.6 118.11 18.17
6.38
0.00*
High School 52 16.6 127.57 16.54 University 21 6.8 124.42 22.47 Total 312 100 120.11 18.53
p<0.01.
Table 4. Comparison of students’ assertiveness levels by father's education.
Father’s education N % Mean sd F p Primary School 182 58.3 117.69 18.27
3.93
0.02*
High School 70 22.4 124.30 16.33 University 60 19.3 122.58 20.72 Total 312 100 120.11 18.53
p<0.05.
As shown in Table 2, there were no significant diffe-rence of assertiveness scores between boys and girls.
As shown in Table 3 mother’s education status affects the level of assertiveness of the students statistically. With the Tukey test, significant differences of the assertiveness levels between the students whose mothers graduated from primary school and the students whose mothers graduated from the high school was found. It was found that the high school graduated mothers’ children’s average asertiveness scores were higher than the others. The number and rate of primary
school graduate mothers is high (n=226, %76.6) whereas the number and rate of university graduate mothers is low (n=21, %6.8).
Table 4 shows that father's educational status affects the student’s assertiveness. There were significant differences of the assertiveness levels between the students whose fathers graduated from primary school and the students whose fathers graduated from the high school. It was found that the high school graduated fathers’ children’s average asertiveness scores were higher than the others. 58.3% of students’ fathers are

Çam 619
Table 5. Comparison of assertiveness level of students’ mother's employment status.
Occupation N % Mean sd t p Housewife (non working) 241 77.2 119.35 17.84
-1.34
0.17
Working 71 22.8 122.71 20.64 Total 312 100 120.11 18.53
Table 6. Comparison of assertiveness level of students’ father's employment status.
Occupation N % Mean sd F p Unemployed 15 4.8 121.53 21.70
0.11
0.33
Worker 126 40.3 118.53 18.43 Self employed 47 15.0 122.34 15.85 Officer 78 25.0 122.79 20.13 Tradesman 28 8.9 119.71 14.15 Farmer 17 5.2 113.11 21.86 Total 311 100 120.13 18.56
Table 7. Comparison of assertiveness level of the students who are licensed or non-licensed athletes.
License N % Mean sd t p Yes 47 15 124.38 16.74
1.71
.087
No 265 85 119.36 18.76 Total 312 100 120.13 18.56
primary school graduates, whereas 19.3 % of their fathers are university graduates.
As shown in Table 5, when students' mothers’ working status was examined, it was found that 77.2 % were non-working (housewife) but 22.8 % of them were working. There were not any significant differences in the assertiveness of the children’s working and non-working mothers.
As shown in Table 6, when students' fathers’ working status was examined, it was found that 40 % of them were workers while 4.8% of them were unemployed. There were no significant differences in the assertiveness level of the seniors according to their father’s occupation. The lowest of assertiveness average scores belong to farmers’ children.
As shown in Table 7 despite the high average asertive-ness scores of students who were licensed athletes, there were no significant differences between the scores of students who did not do any sports. The number and rate of athlete students is low (n=47, %15). RESULTS AND DISCUSSION In this study the effects of assertiveness on senior high
school students were investigated according to their respective schools, gender, education and employment status of their mothers and fathers and doing sports or not.
The Article Number 15 of the basic laws of the Ministery of National Education (MNE2015) stipulates that mixed class of boys and girls is essential. However, it continues to stipulate that some schools can only consist of boys or girls depending on the type of education and facilities and difficulties. Mixed classes constitute the general picture in Turkey; nevertheless single gender classes are found in Manisa Religious Vocational High School.
The seems to be have significant differences in assertiveness levels between the students of Manisa Anatolian High School and the Religious Vocational High School for Girls and Boys.
This difference may be due to the different curriculum between schools. Schools like the Religious Vocational High School for Girls and Boys has non- mixed education system while Manisa High School has co-educational system applications. Moreover, the curriculum of Religious Vocational High Schools aims at (MNE, 2015) teaching students to be tolerant, respectful, obedient, modest, patient and tied to traditions. Thus, expectations

620 Educ. Res. Rev. of the school, teachers, society and the family result in differences in these students’ score in assertiveness. Also, school, family and environmental expectations of these students seem to have caused difference.
According to the research findings, assertiveness scores of high school seniors were compared on the basis of their gender but a significant difference was not found. Even assertiveness scores in the two sexes were almost equal.In a research with badminton players, Kırımoğlu (2008) and Aydın (1991) could not find any significant difference in assertiveness scores between the genders. Based on these results we can say that they show similar assertiveness behavior of boys and girls in this age group.In the studies of Kimble et al. (1984) and Petrie and Rotheram (1996), men were found to be more assertive whereas women were found to be more assertive in the studies of Alberti and Emmons (2002) based on Latin and Spanish cultures and of Eşkin (2003) based on Swedish youths.
According to the results of this research, there are significant differences in assertiveness scores of the students whose mothers graduated from primary school and from high school. This difference was in favor of children of whose mothers graduated from high school. In the studies of Crawford and Taylor (1999), Ekinci and Yılmaz (2001), Tekin et al (2009) and Kahriman (2005), it was found that the education of mothers has no impact of the level of assertiveness. However, the education of mothers plays a role in the level of assertiveness in this study. Dinçer and Öztunç (2009) has also found that education level of mothers brings about serious differences in level of assertiveness in high school students. As a result, it can be argued that the more educated mothers are, the higher the score of assertiveness.
According to the results of this research, there are significant differences in assertiveness scores of the students whose fathers graduated from primary school and from high school. The difference was in favor of the students whose fathers graduated from high school again. Similar studies were done by Tekin and Kapancı (2010), Ekinci and Yilmaz (2001) and Kahriman (2005) who found that when father’s education level increases, the assertiveness scores of the students also increase. This result is similar to the results of this study. The upbringing of children shapes their future as adults. If children’s deeds and remarks are supported by their families, they tend to be more expressive individuals. The support parents can give to their children depends on their education level. The better educated parents are, the more assertive their children can get in later years. Hence, the education of parents can be said to play a positive role in children being assertive. We can say these two results show us that the increase of the educational level of mothers and fathers affect their children's assertiveness positively.
Also, in this research, assertiveness scores of high school seniors who were licensed athletes in a club were
compared to unlicensed high school seniors. Although licensed seniors’ assertiveness scores were higher than the others, there was no significant difference in contrast to the expected results. Some scientists engaged in research on the effects of assertiveness in sports; Bavli 2009, Dervent (2007), Gacar and Coşkuner (2010), Tekin et al. (2009) found that the assertiveness of those who did sport was higher than the others who did not. So based on these findings, we are able to say that doing sports develops assertiveness. This may be because 11 of the 47 licensed senior athletes were from the religious vocational high school which had the lowest assertiveness scores.
In conclusion, we can say that when we compare the senior high school students’ level of assertiveness on the basis of school, the average of assertiveness scores varies from school to school. The lowest assertiveness scores were found in Religious Vocational High School for Girls and Boys, while the highest scores were found in Manisa Anatolian High School. Assertiveness scores of children increase, depending on the mother and father's education level. Students' gender, their parents are working or not, or type of their parents’ profession do not create a significant difference in children's assertiveness scores.
Although the assertiveness scores of licensed high school seniors are higher than the others, it is not at the significance level.
In order to develop assertiveness of high school students who are eager to go to college or work, they should be supported by school environment, by their parents, be encouraged to do sports and male and female students should study in the same school (mixed).Every school should provide guidance services to students and those students deemed to be insufficient in assertiveness should be supported by the school. Social activities should be organized so as to make students more expressive. REFERENCES Aydın B (1991). The analysis of level of assertiveness in terms of
gender and gender roles. MÜ J. Atatürk Fac. Educ. 3:25-36. Alberti R, Emmons M (2002). (Tranlation: Katlan, S.) Assertiveness:
Invest in yourself, Ankara: HYB Publishing. Alberti R, Emmons M (1976). Your Perfect Right. San Lois Obispo:
Impact Publishhers. Bavli Ö (2009). Investigation of the relationship between the
assertiveness level and injury situation of the adolescent athletes. F.Ü. Sağ. Bil. Med. J. 23(1):7-10.
Connelly D, Rotella RJ (1991). The social psychology of assertive communication: issues in teaching assertiveness skills to athletes. Sport Psychol. 5(1):73-87
Gacar A, Coşkuner Z (2010). Assertiveness levels through some of wrestlers examinationofthevariable angle. New World Sci. Acad. 5(3):195-203.
Crawford L, Taylor L (1999). Inhibitions, Alpha Distribution Edition Publication, Bursa.
Ekinci M, Yilmaz S (2001). The relationship between the level of self-esteem and assertiveness level of Nursing Students. Ataturk Uni. J. Nur. 4(2):1-10.

Dervent F (2007). Aggression levels of high school students and the
relationship with the participation to the sports activities (Istanbul province instance). J. Int. Hum. S. 7(1).
Dinçer F, Öztunç G (2009). Self-esteem and assertiveness levels of nursing and midwifery students, Hacettepe University Faculty of Health Sciences Nursing J. pp.22-33.
Erkal M (1990). Sociology of Sport. Ankara: National Education Publishing.
Eşkin M (2003). Self-reported assertiveness in Swedish and Turkish adolescents: A cross-cultural comparison. Scandinavian J. Psychol. 44(1):7-12
Efe M, Ozturk, F, Koparan Ş (2008). Identification of problem solving and assertiveness levels of active football referee in Bursa. Spormetre J. Phy. Edu. Sports S. VI(2):49-58 .
Furnham A (1979). Assertiveness in three cultures: Multidimensionality and cultural differences. J. Clin. Psychol. 35:522-527.
Furnham A (1983). Social difficulty in three cultures. Int. J. Psychol. 18:215-228.
Hollands worth JG, Galassi JG, Gay M (1977). The Adult Self - Expression Scale: Validation by the multitraitmultimethodprocedure. J. Clin. Psychol. 33:407-415. Istanbul Directorate of National Education 2014 http://mesbil.meb.gov.tr/genel/orgun_egitim_bilgi.html#end_mes_lisesi
Jakubowski S (1973). Facilitating the growth of women through assertiveness training. Counceling Psychol. 4:75-86.
Kahriman İ (2005). Examination of Karadeniz Technical University School of Health students ' self esteem and assertiveness level in terms of some variables. University of Cumhuriyet ,School Nur. J. pp.24-32.
Kırımoğlu H (2008). Turkey comparison of assertiveness levels between the badminton player and non-player students under 13 participated to Badminton Championships. S.Ü. BES Sci. J. 10(2):1-9.
Kimble CE, Marsh NB, Kıska AC (1984). Sex, age and cultural defferences in self-reported assertiveness, Psychol. Reports. 55:419-422.
Ministry of Turkish National Education (2015) http://mevzuat.meb.gov.tr Ministry of Turkish National Education (2015). Curriculum of Religious
Vocational High School http://ihl.meb.gov.tr Ministry of Turkish National Education (2014) http://mesbil.meb.gov.tr MMEM manisa.meb.gov.tr (2014). Petrie K, Rotheram M (1996). Patterns of social expectations among
Maori and European children in New Zealand. J. Cross-Cultural Psychol. 27(5):576-597.
Çam 621 Rathus SA (1973). 30 - Item schedule for assessing assertive behavior.
Behavior Therapy. 4:398-406. Soto E, Shaver P (1982). Sex-role traditionalism, assertiveness, and
symptoms of Puerto Rican women living in the United States. Hispanic J. Behav. Sci. 4(1):1-19.
Tekin G, Amman MT, Tekin A (2009). The effect of recreational physical exercise on depression and assertiveness levels of university students. Int. Human Sci. 6(2).
Tekin S, Kapancı İ (2010). Sosyal bilgiler eğitimi öğrencilerinin sosyo-ekonomik durumlarının atılganlık durumlarına etkisi, Celal Ba- yar Üniversitesi Sosyal Bilimler Enstitüsü Dergisi, 8(1): 51-66.
Tucker RK, Weaver RL, Redden EM (1983). Differentiating assertiveness, agressiveness and shyness: A Factor Analysiss, Psychological Reports. 53: 607-611.
Turkey Statistical Institute 2014 http://www.tuik.gov.tr Voltan N (1980). RathusAssertiveness inventory validity and reliability
study. J. Psy. 10:23-25. Voltan N. (1981). Rathus assertiveness inventory applying to students
of Hacettepe University and the findings. Hacettepe University School of Social Sciences J. p.4
Whirter MJ (1985). Communication with the adolescent and the child. Translated by N. Voltan Ankara: US – Publishing.
Wolpe J, Lazarus AA (1968). Behaviourtherapy techniques; A guide to the treatment of neuroses. Canadian Journal of Counselling and Psychotherapy.

Vol. 10(5), pp. 622-633, 10 March, 2015 DOI:10.5897/ERR2014.2055 Article Number: 7CFF2A651110 ISSN 1990-3839 Copyright © 2015Author(s) retain the copyright of this article http://www.academicjournals.org/ERR
Educational Research and Reviews
Full Length Research Paper
Challenges students’ face in their transition from primary to secondary school and the interventions
schools take to ease the transition
Wudu Melese Tarekegne
Jimma University, College of Education and Behavioral Science, Department of Teacher Education and Curriculum Studies, Ethiopia.
Received 23 December, 2014; Accepted 05 February, 2015
This study explores the major challenges that affect students’ enrollment and participation and the key measures schools take to mitigate the challenge and help students continue their education. The data were collected from 23 secondary school grade nine students in Amahara Regional State in Ethiopia using the structured questionnaires from students and teachers as well as by using semi-structured interview from school principals. The results suggest that the major challenges were family related ( opportunity cost of students, family issue such as parental conflict, taking care of family members) factors and associated with individual characteristics of students (disability, illness) are prominent ones. The study also made clear that though the effect size is very small, there is a statistically significant difference between urban and rural students in the reasons for their drop out from school. This study also highlights that schools do not facilitate conditions for poor children to be supported by NGOs or exempt them from school fees. They also do not provide food and health services for poor children. In addition, schools have no guidance and counseling or social worker who can support students when they face problems in schools. Moreover, though schools have no corporal punishment policies and procedures, schools implement other punishment techniques such as to miss class if they arrive late. Key words: Challenges, transition, intervention, primary school, secondary school.
INTRODUCTION The contribution of education towards economic development has been well recognized; as a result, developing countries and international agencies have started focusing on human investment. The role of education to economic growth has been found to be positive and significant not only in monetary terms but
also in physical terms, such as farm efficiency and labor productivity. Education has also been found to be a significant factor in the reduction of poverty, improvement in income distribution and various dimensions of social, demographic, and political development (Wood and Psachropoulos, 1995).
E-mail: [email protected]. Tel: +251-913 999 181. Authors agree that this article remain permanently open access under the terms of the Creative Commons Attribution License 4.0 International License

Considering education to be a tool of paramount importance for mobilization of human resources for sustainable socio-economic growth, the governments have been involved in formulating and implementing numerous policies to develop and improve the education system in order to make it compatible with requirements of the country. As a result, an increase in primary enroll-ment has always been a priority for every successive government. It has been a debatable issue in every era and relevant measures have been proposed and implemented, during every regime. It is a major issue in most of the developing nations (UNESCO, 2005).
Generally, no one would doubt that education is the major vehicle to development and the remedy for people’s problems. It is widely accepted that all children should receive at least primary education if human labor is to yield sustainability in the development of a country. However, there are many hindrances to popular participation at all levels of education.
Mbewe and Nampota (2007) studied the determinants of school enrollment in Malawi and found out that cost of schooling and family background characteristics such as mother’s education, urban rural residence and proportion of girls among household’s children are major barriers of school enrollment and participation.
A similar study made on the demand for primary schooling in rural Mali found that, school fees, distance to school, and school quality measured by student teacher ratio, number of books per classroom as barriers to enrollment and participation (Laugharn, 2007).
Likewise, in Ethiopian context a research report for the USAID (1993) provides a comprehensive study on the demand for schooling in rural Ethiopia. The study found out that economic constraints represented the most silent impediment to participation and persistent in primary school in rural areas.
A researcher such as Schaffner (2004)’s report undoubtedly provides the most comprehensive study on demand for schooling in Ethiopia. The result shows that the most determinant to enrollment are boys and girls labor force for activities, distance, failure, inability to offer and low quality of education.
In general, research findings show that though there are barriers of enrollment and participation at all levels of education, there are also mostly unnoticed barriers that students face when they transit from one educational level to another; for instance from primary to secondary school (Howard and Johnson, 2004)).
Research studies by Hargreaves et al. (1996) on barriers that encountered students’ during their transition from primary and high school include problems of truancy, school failure, non-compliance and inappropriate behavior. These barriers in the early years of high school can often be attributed to the radical changes that occur in students’ day-to-day lives as they make the move from one school to the next. It is argued that, in addition to the obvious changes that children experience in relation to
Tarekegne 623 such things as school size, the number of teachers and the range of new subjects, the move from primary to secondary school also involves a transition between two radically different cultures of schooling. On the one hand, the primary school culture emphasizes care and nurturance of students and offers a sense of belonging to a human-sized group. On the other hand, the culture of the secondary school is oriented towards teaching academic subjects; it emphasizes differentiation of students according to achievement and produces experiences of fragmentation and isolation rather than cohesion and bonding. The effects of changes such as these for individual students can be anxiety, confusion, lack of stability and subsequently alienation and disengagement.
Several reasons have been stated for the barriers of school enrollment and participation in Ethiopia as well as in other developing countries. However, empirical studies related to the barriers of school enrollment and participation that students face during their transition from primary to secondary education and mechanisms that schools take to alleviate those barriers in Ethiopia are quite limited. Therefore, investigating the major barriers of enrollment and participation in their transition from primary to secondary school and some intervention measures that schools take is of some importance. Research questions The major purpose of this paper is to investigate the barriers of school enrollment and participation when students transit from primary to secondary education and the main interventions measures schools take to ease the smooth transition and increase enrollment and participation. To achieve the above purpose the following research questions were formulated. These are: 1. What are the major barriers that affect students’ enrollment and participation when they transit from primary to secondary education 2. Is there any statistically significant difference in barriers between urban and rural students? 3. What are the key measures schools take to reduce the barriers and ease students’ transition? Context and school legislation This study was conducted in the selected secondary schools of Ethiopia. In Ethiopia the education system is divided into primary education which is compulsory education (grades 1-8). It has two cycles: the first cycle is basic education (grade 1-4) and second cycle is general primary education (grade 5-8). On the other hand, the secondary school (grades 9-12) has also two cycles: the first cycle (grade 9-10) is a general secondary education

624 Educ. Res. Rev. and the second cycle (grade 11-12) is preparatory education.
In Ethiopia, education is free at the primary and secondary level. Regarding the medium of instruction at primary schools, different local languages are used but at the secondary school and at higher education, English is used as a medium of instruction. At primary schools subjects taught are more of general fields or broad areas whereas at secondary schools subjects taught are discrete subjects (TGE, 1994).
Concerning educational legislation, Ethiopia has ratified major international and human rights agreements adopt-ed by the United Nations and other international organizations. It endorsed the United Nations Convention on the Rights of the Child (CRC) in 1991. In 2002, it also approved the African Charter on the Rights and Welfare of the Child (ACRWC), adopted by the Assembly of Heads of States of the Organization of African Unity, which accepted the need to act decisively to encourage and defend the rights and welfare of the African children (MOLSA, 2006).
In Ethiopia, there are laws and policy documents regarding the right to education. Some of these policy instruments are included in the Constitution of the Federal Democratic Republic of Ethiopia: the Proclamation to Define the Powers and Duties of the Central and Regional Executive Organs of the Transitional Government (Proc. No. 41) in February 1993; the Education and Training Policy/ETP of 1994; the Education Sector Strategy/ESS of 1994; and the Education Sector Development Program ESDP I-IV (MOE, 2010).
Accordingly, the Government of Ethiopia introduced a series of educational policies and strategies between 1994 and 2006. Most of them were focused on increasing access to education at all levels but with a special focus on the expansion of primary education. Most of the policy documents also speak about ensuring both access to and the quality of education throughout the country; although in practice the quality issue has remained a challenge (MOE, 2010). METHODOLOGY The research design The research design used for this study was survey research design. The survey research design is appropriate for this study because it allows collection of data from a larger number of people than is generally possible when using other method (Mertens, 1998; Best and Kahn, 2005; Kerlinger, 1986). In addition it is used to generalize from sample to a population so that inferences can be made about some characteristics, attitudes or behavior of the population. Moreover, in practice collecting data from the whole population is impractical, costly, and lengthy; thus survey study saves time and money (Bailey, 1994). Particularly, the cross sectional survey research design was used. Since cross-sectional design involves examining the effect of several groups at one point in time. This research design was used because it is economical
and helps to collect information in a shorter time frame (Cohen et al., 2007). Sample and sampling technique The population of this study is all secondary school students of Ethiopia. From the total regional states of the country one regional state was selected as sample region due to logistic reasons; then from this region two zones and again from each zone five woredas (districts) were selected by simple random sampling. Finally, from each woreda (district) all secondary schools are taken as sample schools and from each school all grade 9th students a total of 3080 students are taken as sample of the study.
In addition to the students sample school principals (23 principals) are taken through availability sampling and 24 school teachers in each school; a total of 545 teachers are taken as sample of the study by using simple random sampling techniques. Instruments of data collection The instruments used for data collection in this study were questionnaires. These instruments were developed in such a way that they maximize the possibility of generating answers to the basic research questions. Questionnaire: - To collect data from the sample students, teachers, and school principals close ended type questionnaires were prepared based on the review of literature for this study. The self administered questionnaires are appropriate for this study since the person administering the instrument has an opportunity to establish a rapport, explain the purpose of the study and explain the meaning of items that may not be clear (Best and Kahn, 2005).
The questionnaires focus on the leading questions such as the major barriers that affect students’ enrollment and participation during transition and the key measures schools take to reduce the barriers and ease students’ transition. Reliability and validity of Instruments After preparing the instruments of data collection validation of the instruments was done using experts’ review and discussion. Here some irrelevant items were discarded and some ambiguous items were modified as per the comments given by the expert. And then the issue of reliability was addressed by pilot testing of the instruments in one secondary school located in the same region and the school was excluded from the actual data collection. Then the reliability coefficient of the instrument was calculated to be .82) which is regarded as strong correlation coefficient by Jackson (2009). Then the final instruments were administered to all sample students, teachers, and principals by the researcher and enough time was given for them to fill and return them. Data analysis The survey data that were collected from teachers, school principal, and students were organized and analyzed using Statistical Packages for Social Sciences (SPSS). Descriptive statistics, mainly frequency, percentages, mean and standard deviations were used to point out some major barriers that affect students during transition as well as some measures schools take to reduce such barriers. Moreover, to see whether there is a difference in barriers between urban and rural students or not Chi-square test was used. Finally, the relevant data collected for this study were systematically organized and summaries were presented using tables and figures

Tarekegne 625
Table 1. Most common reasons for students’ absence/ drop out/ from school.
Reasons Response Rank order # %
Fees too expensive 30 0.97 10 Books and/or other supplies too expensive 22 0.71 12 Shoes/clothes/uniform for school too expensive 10 0.32 13 Transport too expensive 6 0.19 14 School too far from home 76 2.46 8 Not safe to travel to school 6 0.19 14 Lack of transport 2 0.06 16 Truancy, child does not want to go, not interested 296 9.61 3 Banned from school for behavior reasons 10 0.32 13 Banned from school due to failure 2 0.06 16 Quality of education at school (teaching and learning) poor 4 0.12 15 No sanitation facilities at school 2 0.06 16 Bullying/abuse from peers 10 0.32 13 No need for schooling for future job 2 0.06 16 Need to learn a trade/skill so went to work 28 0.90 11 Need to stay home to look after siblings 166 5.38 6 Needed for domestic and/or agricultural work at home 1080 35.06 1 Have to do paid work to earn money 102 3.31 7 It’s not appropriate for girls to go to/continue at school 2 0.06 16 Marriage 2 0.06 16 Disability, illness 718 23.31 2 Family member ill/disabled/elderly 178 5.77 5 Family issues (parent disputes/marital conflict) 282 9.15 4 Stigma and discrimination 10 0.32 13 School not accessible for seasonal reasons: river prohibits 34 1.10 9 Total 3080 100
as deemed necessary. Ethical considerations The purpose of the study was explained to the participants and they have asked their consent to answer questions in the questionnaire. The participants were also informed that the information they have provided will only be used for the study purpose and that it would not be given to a third party. Accordingly, the information that the participants provided was used only for the study purpose. In addition, the researcher ensured confidentiality by making the participants anonymous. MAJOR FINDINGS The key findings of this study are presented in three sections. The first section addresses the major barriers students’ face in their transition while the second section discusses the main measures schools take to ease their transition. The final section investigates whether there is any difference between urban and rural in major barriers or not. Thus, the presentation follows the sequence of the research question formulated at the introduction part.
The major challenges students face during transition Problems that make students to be absent from school or totally drop out from school emanate from different sources. Generally, it may come from individual student characteristics and institutional characteristics (which are associated with family, school, and community). The sample teachers were asked to mention the major challenges that lead students to be absent or drop out from school and the result is presented in Table 1.
As it can be seen from the table, six major factors are identified as common barriers of students’ enrollment and participation. According to the questionnaires, the most common reasons for drop out were the need for domestic and agricultural work at home (including chores, farm work, harvest, 35.06%; scores = 1080; rank=1). The other frequently reported reasons in order of frequency are disability, illness (23.31%) (Scores =718, rank =2); truancy child does not want to go, not interested (9.61%), (scores =296, rank =3); family issues example problems at home, parent disputes/marital conflict (9.15%), (scores =282, rank = 4); family member ill/disability/elderly (including care for this family member), and the sixth

626 Educ. Res. Rev.
Figure 1. Children sponsored by NGO in school.
Table 2. Does the school give exemptions from paying fees? (n= 23).
Options Response
# % Yes 11 46.08 No 12 53.92 Total 23 100
factor is the need to stay home to look after other siblings.
From the above result one can understand of all the categories of factors that make students to be absent/drop out from school are the family related factors particularly the opportunity cost that the parents need from students. The second major factor is related to individual characteristics of students, which is related to disability and illness, truancy (children not wanting to go to school). Measures schools take to ease students’ transition In this part of the data presentation, the main measures that schools take to ease students’ transition from primary to secondary school are presented. Particularly measures related to financial and school supply support, provision of food and health services, having school counselors and establishing clubs, adjusting school regulations and providing extra tutorials for students. Financial and school supply support Research findings continuously reveal that one of the main reasons for low students’ enrollment and participa-tion in developing countries is the cost of education in terms of cost of educational materials such as cost of books, uniforms, transportation and opportunity costs.
As a result, to boost students’ enrolment and partici-pation at all level particularly during students’ transition schools should design a mechanism of resolving this problem. The solution may lay on two approaches either
they provide financial and school supplies by themselves if they can, or they may find a non-governmental organization (NGO) who can provide support for students so as to reduce students’ drop out from school.
Accordingly, data were collected from all 23-sample schools to see to what extent schools provide such sup-port for the students; the result is presented in Figure 1.
As it is shown in the figure slightly above half (54.86%) of the school principals confirmed that there are students in their school who are supported by non-governmental organizations (NGOs). Non-government sponsorship is provided directly to individual households to support the schooling of particular children. NGO grants are provided at the school level to both support children and provide other resources / activities such as equipment or food at break times. These NGOs may pay their school fees, buy them uniform or textbooks or pay an amount for children’s living expense. But, 45% of the respondents replied that there are no children in their school who are supported by non-governmental organizations.
The second approach to help poor students is that schools can help them by waving out the payment that students pay for the school to encourage them not to drop out from school. Table 2 shows the summary of this result.
As it is mentioned above one of the measures schools take to help students and reduce students drop out from school due to financial problem is giving exemptions from paying fees or grants in cash or kind to poor children. Sample school principals were asked to what extent they exempt fee or grant in cash for students who are poor and their response in Table 2 shows that most of them (53.92%) did not support students in that way. While some (46.08%) replied that, they try to support poor students by exempting them from paying school fees or giving grant either in cash or in kind.
This result shows that schools are not willing to support poor children or they consider supporting poor children is not the responsibility of the school rather it is the respon-sibility of the other agencies such as non-governmental organizations. Providing food and health services To actively participate and learn student should get ade-quate food and good health services since malnourished and unhealthy children may not properly attend school and learn well. In order to assess the number of sample schools who provide food services in schools without requiring any payment, the principals were asked through the questionnaires and the result depicts that the great majority of the schools 21(91.5%) do not give food service for the students. Thus, students who are poor and cannot afford to buy food are unable to attend school; as a result they may be absent or drop out from school. A very few number of schools 2(8.85%) replied that they provide food for the students.
55%45% Yes
No

Tarekegne 627
Figure 2. Health service provided for the students.
Table 3. Schools provide food for children without requiring payment.
Option Response # %
Yes 2 8.85 No 21 91.15 Total 23 100 Frequency per day or per shift One times 2 100 Two times - - Three times - - Total 2 100
Even though they are small in number, those respondents who replied that they give food for students were asked about the frequency they offer food to the students per day or per shift and all of them reported that they provide once (Table 3). From the above result one can understand that the schools can not support poor children from being absent /drop out of school due to lack of food.
Health of the students is one of the great challenges in developing countries. This affects students’ enrollment and participation in schools. Thus, to enhance students’ enrollment and participation at all levels the schools should provide basic health services at the school level. In order to see to what extent do sample schools offer the basic health services the principals were asked; the result is presented Figure 2.
As it is seen in the figure, the basic health services, which are assumed available in the school, were listed and respondents were asked to say yes or no on the services provided in their school. The results show that
generally three –forth of the respondent principals confirmed that the identified services are not given in their schools. It is to say that the principals reported that the schools did not offer booster immunizations (extends the life of existing immunizations) (55.17%), tablets to kill worms or parasites which have infected children (77.87%), Vitamin A supplements (77.47%), growth moni-toring (91.07%), examination by health worker so that childhood diseases can be detected (75.65%), and oral health check (80.7%). Having school counselor and establishing clubs Students at different level particularly at the transition level may face many challenges in their education carrier. All stakeholders on children’s education should partici-pate to solve students’ problems; yet the schools next to family are the most responsible institution to help students.
Schools through various measures are expected to support students. One of the mechanisms is by assigning schools guidance and counselor or social workers who are responsible for guiding students, solve their problem, and facilitate students’ smooth transition. School coun-seling service helps students who are at the transition from primary to secondary school resolve emotional, social or behavioral problems and help them to smoothly transit to secondary school. The other way is by establishing extracurricular clubs and through it, schools can identify students’ problem, follow up, and render appropriate support to them. This is because students’ participation in extracurricular activities helps to develop more positive attitudes of school and lower probability of school dropout. As a result, respondent sample school principals were asked about it; the result is summarized in Table 4.
55.17
77.87 77.4791.07
75.65 80.7
44.83
22.12 22.538.93
24.35 19.3
0102030405060708090
100
Boos
ter
imm
uniza
tions
Tabl
ets t
o kil
lwo
rs o
rpa
rsite
s
Vita
min
Asu
pple
men
ts
Grow
thm
onito
ring
Exam
inat
ion
by h
ealth
work
ers
Oral
hea
lthch
eck
Types of health service
Perc
enta
ge
Percentage NoPercentage Yes

628 Educ. Res. Rev.
Table 4. Does the school have a counselor? (n=23).
Option Response # %
Yes 10 43.47 No 13 56.52 Total 23 100
Table 5. Schools have a club for children (n=23).
Option Response # %
Yes 15 65.51 No 8 34.78 Total 23 100
Table 4 reveals that most (56.52%) of the principals assert that their schools do not have either guidance and counselor, social worker or teacher who provides counseling service to students and is responsible for looking after their psychosocial wellbeing. However, some of (43.47%) the respondents verify that their schools have guidance and counselors.
Establishing clubs for the students that need extra support and follow up since participation in extracurricular activities is promoted by schools, can increase the school’s involvement, which leads to the development of more positive attitudes towards schools and learning. To examine to what extent schools take such strategy, participants of the study were asked through the questionnaires and the result is presented in Table 5.
Table 5 depicts that most (65.51%) of the sample school principals confirmed that they have established a club for children whom teachers have identified as needing extra support and follow up. Whereas the rest (34.49) replied that they did not. Adjusting school regulations School related factors particularly school regulations and policies are one of the barriers that affect students’ participation in schools. To alleviate such problems and encourage students’ enrolment and participation schools should take school focused measures related to making exceptions in the application of school procedures and policies.
To this effect school principals of the sample schools were asked to mention to what extent the school adjust the school regulations and the result is presented in Figure 3.
As it is shown from th figure exactly half (50%) of the school principals have reported that when students miss more than a month of school, students are not allowed to return to school until the following year, when they start again in the same grade. While 36.84% of the respon-dents reported that students are allowed to return to school and teachers assist them to catch up the work they have missed.
Similarly, respondents were asked what is the school’s regulation when students repeatedly miss classes. The responses are presented in Figure 4.
Figure 4 shows that relatively large number (40%) of the sample principals revealed that when students repeatedly miss days of school, students are allowed to return to school and teachers assist them to catch up with the work they have missed. On the other hand, 31.30% of them replied that students are allowed to return to school but are responsible for catching up with the work they have missed on their own.
On the other hand, a small number (6.10%) of principals reported that the measures that schools take if students repeatedly miss classes depend on the problem and the situation. For instance, students may be forced to bring their parents or leave school after consulting their parents. It depends upon the seriousness of the problem, and special reasons are considered.
Table 6 shows that when students arrive school late, relatively large number of the participant principals (39.13%) replied that students are allowed into the school but not allowed into class. However, relatively small proportion of the participant principals (4.34%) confirmed that students are not allowed to enter into the school. on the other hand, 30.43% of the participant school princi-pals reported that there is no punishment in their schools Related to the above issue research respondents were asked another question related to the existence of school’s regulations on the use of physical punishment and their response is summarized and presented in Table 7.
As it is seen from Table 7, the majority (60.86%) of the respondents and 30.43% reported that the school’s regulations are that no forms of physical punishment are allowed and school does not have any regulations on physical punishment respectively. On the other hand, small proportion of (4.34%) the research participants reported that teachers have complete control over what forms of punishment they use and less harsh forms of physical punishment are allowed; but harsher forms are not. Extra tutorials As it is shown in Table 8 respondents were interrogated to mention whether schools provide extra tutorial class for students particularly for those students who are new to the school and transit from one level to the next or not. The great majority of the teacher respondents (83.9%)

Tarekegne 629
Figure 3. What are the schools regulation if students miss more than a month in school.
Figure 4. School's policy if students repeatedly miss days of school.
Table 6. Types of punishment if students arrive late for school.
Measure Response # %
There is no punishment 7 30.43 Students are not allowed into the school 1 4.34 Students are allowed into the school but not allowed in to class 9 39.13 Students are allowed into school and into class but must complete another punishment after school
6 26.08
Total 23 100
Table 7. The school’s policy on physical punishment.
Measure Response # %
School does not have any regulations on physical punishment 7 30.43 Teachers have complete control over what forms of punishment they use 1 4.34 No forms of physical punishment are allowed 14 60.86 Less harsh forms of physical punishment are allowed, but harsher forms are not 1 4.34 All forms of physical punishment are allowed - - Total 23 100
37%
13%
50%
return to school andteachers assist them
return to school butstudents are responsible
not allowed until nextyear
4031.3
22.6
6.1 0
10 20 30 40 50
return to school and teachers
assist them
return to school but
students are responsible
not allowed until next year
others
Measures
Percentage
Percentage
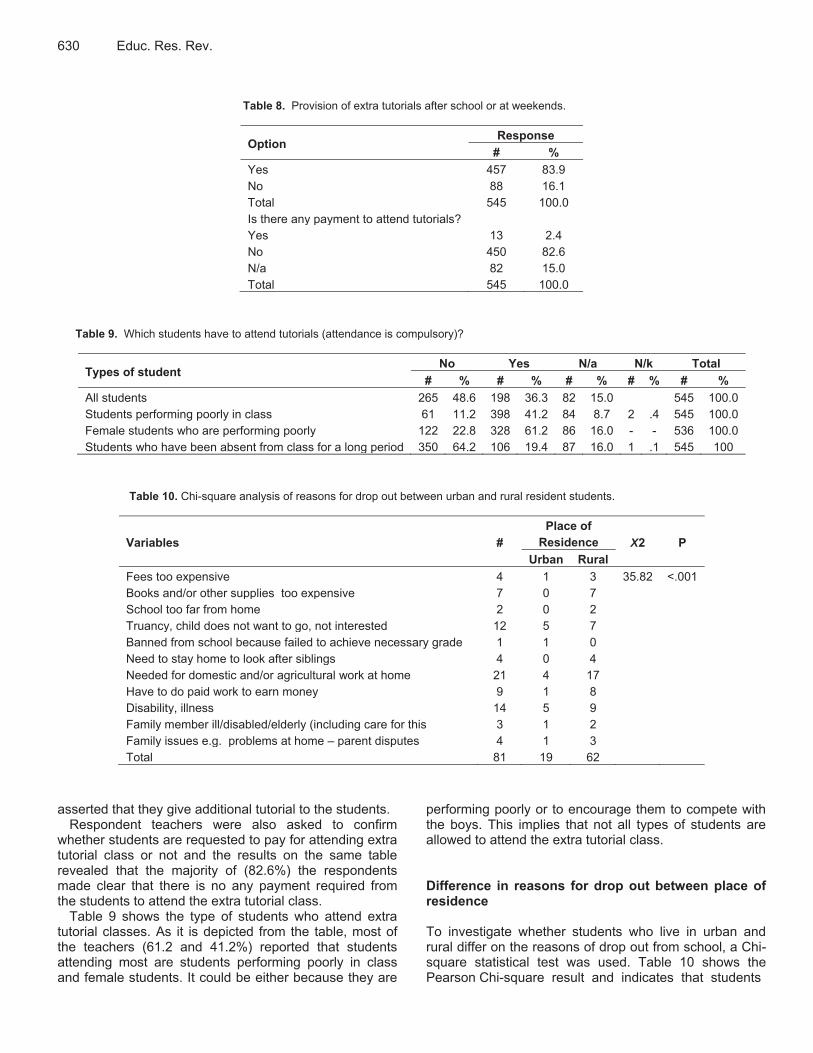
630 Educ. Res. Rev.
Table 8. Provision of extra tutorials after school or at weekends.
Option Response # %
Yes 457 83.9 No 88 16.1 Total 545 100.0 Is there any payment to attend tutorials? Yes 13 2.4 No 450 82.6 N/a 82 15.0 Total 545 100.0
Table 9. Which students have to attend tutorials (attendance is compulsory)?
Types of student No Yes N/a N/k Total # % # % # % # % # %
All students 265 48.6 198 36.3 82 15.0 545 100.0 Students performing poorly in class 61 11.2 398 41.2 84 8.7 2 .4 545 100.0 Female students who are performing poorly 122 22.8 328 61.2 86 16.0 - - 536 100.0 Students who have been absent from class for a long period 350 64.2 106 19.4 87 16.0 1 .1 545 100
Table 10. Chi-square analysis of reasons for drop out between urban and rural resident students.
Variables # Place of
Residence X2 P Urban Rural
Fees too expensive 4 1 3 35.82 <.001 Books and/or other supplies too expensive 7 0 7 School too far from home 2 0 2 Truancy, child does not want to go, not interested 12 5 7 Banned from school because failed to achieve necessary grade 1 1 0 Need to stay home to look after siblings 4 0 4 Needed for domestic and/or agricultural work at home 21 4 17 Have to do paid work to earn money 9 1 8 Disability, illness 14 5 9 Family member ill/disabled/elderly (including care for this 3 1 2 Family issues e.g. problems at home – parent disputes 4 1 3 Total 81 19 62
asserted that they give additional tutorial to the students.
Respondent teachers were also asked to confirm whether students are requested to pay for attending extra tutorial class or not and the results on the same table revealed that the majority of (82.6%) the respondents made clear that there is no any payment required from the students to attend the extra tutorial class.
Table 9 shows the type of students who attend extra tutorial classes. As it is depicted from the table, most of the teachers (61.2 and 41.2%) reported that students attending most are students performing poorly in class and female students. It could be either because they are
performing poorly or to encourage them to compete with the boys. This implies that not all types of students are allowed to attend the extra tutorial class. Difference in reasons for drop out between place of residence To investigate whether students who live in urban and rural differ on the reasons of drop out from school, a Chi-square statistical test was used. Table 10 shows the Pearson Chi-square result and indicates that students

who live in urban and rural areas are significantly different on the reasons they suggested for their drop out from schools (X2= 35.82, df= 14, n=81,p<001). Students who live in rural areas more likely than expected under the null hypothesis to mention reasons for drop out than students who live in urban areas. Phi, which indicates the strength of association between the two variables, is 0.130 and thus, the effect size is considered to be small according to Cohen (1988). This means that even though Chi-square is significant, the effect size is not large. In other words, the difference observed in reasons for students drop out from school is not strongly accounted for by being residents of rural or urban areas. DISCUSSION Based on the findings of this study, the researcher would like to discuss two issues: the major common challenges students face during transition and the action schools take to mitigate the challenges and ease students’ smooth transitions. First the barriers that make student to be absent/drop out from school would be examined. Then, the key measures schools take to help these students to continue their education would be discussed. The findings of this study have suggested that of all the factors, the family related factors are prominent challenges that force students to be absent or drop out from school. From the family related factors the dominant one is the need for domestic and agricultural work at home (including chores, farm work, harvest); family issues, example problems at home; parental dispute/ marital conflicts; family member illness/disability/elderly (including care for this family members); and the need to stay home to look after other siblings. This result shows that the family related factors particularly the structure of the family and family resources are key barriers for students drop out from school.
A close examination of the family related factors reveals that in terms of frequency the most frequently reported factor among the family related challenges is the need for domestic and agricultural work at home. This is an opportunity cost of child labor and work. Families cannot afford the loss of income or labor contribution of their children, so their children do not enroll or attend school. Supporting this result many studies around the world show that child labor as factors that reduce child schooling emerges from poorest households (Basu and Van, 1998).
In addition, the second most frequently reported challenge, which is associated with family is family issue, example problems at home and parents disputes. When there is a conflict between the father and mother at home, students may be psychological disturbed and may not be ready to learn’. This leads to students’ dropout. More important, changes in family structure, along with other potentially stressful events (such as family move,
Tarekegne 631 illness, death, adults entering and leaving the households, and marital disruptions) increase the odds of dropping out (Rumberger and Sun, 2008).
Supporting the above idea research findings of Chirtes (2010) pointed out that family structure is one of the major causes of school dropout. The author further explained that family related problems such as separation or divorce, parental detention, conflicts, parents’ death, single parenting and chronicle illness within the family cause significance trauma which finally leads to school dropout.
Individual related factors are the second dominant barriers particularly disability and illness, truancy (child not wanting to go, not interested in school). Truancy is most common when students move from primary to high school because the transition is filled with great anxiety and stress for many adolescents. Substantial research literature has emerged documenting the fact that the transition into high school is marked by increased dis-engagement and declining motivation particularly for low performing youths (National Research Council, 2004). Increased disengagement and declining motivation, in turn predict subsequent school dropout.
Substantiating the above idea Chirtes (2010) made it clear that absenteeism is determinant of students’ achievement, promotion, graduation, self-esteem, and employment potential. Clearly, students who miss school fail behind their peers in the classroom. This in turn leads to low self-esteem and increases the likelihood that at risk students will drop out of school.
The existing literature shows that all stakeholders in children’s education, particularly the schools are responsible for reducing students drop out from schools by taking various measures. The findings of this study revealed that though schools tried to support students by facilitating conditions for poor students to be helped by non-governmental organization; schools themselves do not exempt from paying fees or grants in cash or kind to poor children. The reasons may be lack of other sources of income to support the running cost of the school and support poor children. However, research findings suggest that being sponsored by the non-governmental organizations or exemptions of school fees by schools that reduce the costs of schooling ( in the form of free uniforms and textbooks, scholarship or fee exemptions, raw food grains programs), are found to be effective means of improving participation rate in developing countries (Schultz, 2004).
Provision of food and health service is other measure that schools can take to help students continue their education. The result of the study portrays that schools do not offer food for education for poor children without payment. In addition, schools do not provide common health services at the school level such as booster immunization, tablets to kill worms or parasites, Vitamin A supplements, growth monitoring, examination by health workers so childhood diseases can be detected, and oral

632 Educ. Res. Rev. health check. However, scholars argue that schools should design mechanisms that support poor children in provision of health and food services because school health and nutrition interventions are important invest-ments in boosting students’ enrollment and participation (World Bank, 2009).
Implementing flexible school regulations and policies is one measure that helps students to continue their education. The findings of this research depict that schools have regulations on students’ absenteeism that states when student is absent from school more than a month he/she is not allowed to return to school until the following year, when they start again in the same grade. On the other hand, the policy of the school on students who miss repeatedly days of school states that they are allowed to return to school and teachers assist them to catch up the work they have missed. All those school policies and regulations are hindrances for students’ enrollment and participation. Unless it is improved it is a cause for students drop out from schools. Substantiating the above idea DeLuca and Rosonbaum (2000) pointed out that bureaucratic regulations and overt actions taken by school officials can actually eliminate students from school enrollment.
Moreover, the findings show that schools do not have policy on physical or corporal punishment yet they imple-ment other punishments. For instance, when students arrive late to schools, schools have a punishment policy that allows students to enter the school compound but not allowed into class. This indicates that students are punished by letting them to miss class and catch up by themselves. This result relates with other research findings by Alexander et al. (2001) who state that schools who have rigid school polices related to students behavior and truancy often carry punishments such as suspensions or expulsions that alternatively lead to students quitting school. This implies that schools who apply rigid school policies and procedures decrease students’ enrollment and participation.
Schools at any level regardless of the level of educa-tion they offer ought to have guidance and counselor or social worker for guiding student in time of trouble; since students face a lot of problems at a school especially when they transit from one educational level to another. However, findings of the study revealed that most of the schools do not have guidance and counselor or social workers. This indicates that students find nobody when they face a problem and need consultation. This implies that lack of school guidance and counselor are one pushing factors for students to drop out from school. However, researchers such as Hayes et al. (2002) in their study pointed out that high school attrition indicates that preventive counseling, occurring before students are in crisis, reduces the risk of these students dropping out later. As a result, they suggest that schools should have counselors and school counselors ought to offer group or individual counseling with the students on a regular basis,
encourage socialization where possible and establish incentive, which are designed to reduce the tendency to drop out. CONCLUSION AND IMPLICATIONS Factors associated with institutions, particularly the family related factor which is the opportunity costs of children are the main challenges that cause children to be absent or drop out from school. Hence, the concerned bodies (school principals, parent teacher associations, and woreda/district/ educational officers) should create awareness on the part of parents about children’s education or provide orientation to parents so that they give priority to children’s education and send them to school. Besides, they should involve parents in the children’s education since they play an important role in how children perceive and cope with school, and they influence the decision children make.
The schools are either not willing to support poor students or have no adequate resources to help them not to drop out from school due to lack of financial and school supply support such as textbooks, uniforms etc. However, so as to boost enrolment and participation of students, schools should design a mechanism that helps students to fulfill the financial and school supply support, health and food services in the forms of generating income for these children. The schools may find non-governmental organizations, which work on education and create a link with these organizations and bring such support for poor children so as to not drop out from schools due to lack of school supply, malnutrition or illness.
Though schools have no corporal or physical punishment, they have rigid policies and procedures that affect students’ enrollment and participation. This implies that schools do not make exceptional on the application of school polices and procedures for these students. Nevertheless, of all stakeholders, schools have a lot of thing to do for the students not to drop out from school. One of these is adjusting school policies and procedures in such a way that it can accept, respond, and accommodate poor children. The other way could be having trained professional school guidance and counselors or social workers that can guide students with problems. In a situation where the schools have no such guidance and counselor, they can assign an experienced teacher or team of teachers that can support students in counseling.
Finally it should be remembered that though it is not as expected most schools are trying to help students through establishing extracurricular clubs for identifying students that need help and offerings extra tutorials for those students who perform poorly in class and females. This needs to be strengthened and continued by all schools.

REFERENCES Alexander KL, Entwisle DR, Olson LS (2001). Schools, Achievement,
and Inequality: A Seasonal Perspective, Educ. Eval. Policy Anal. 23(2):171-191.
Bailey DK (1994). Methods of Social Research (4th ed). New York: The Free Press.
Basu K, Van PH (1998). ‘The economics of child labor’, Am. Econ. Rev. 88(3):412-427.
Best WJ, James VK (2005). Research in Education.(9th ed). New Delhi: Prentice Hall of India.
Chirtes G (2010). A case study into the cause of school dropout. Acta Didactica Napocensia, 3(4):25-34
Cohen J (1988). Statistical Power Analysis for the Behavioral Sciences, 2nd Edition. Hillsdale: Lawrence Erlbaum.
Cohen L, Lawrence M, Keith M (2007). Research Methods in Education. London: Routledge
Deluca S, Rosenbaum JE (2000). Is housing mobility the key to welfare reform. Washington Dc: Bookings Institute center.
Hargreaves A, Earl LM, Ryan J (1996). Schooling for change: Reinventing education for early adolescents. London: Falmer Press.
Hayes RL, Nelson J, Tabin M, Pearson G, Worthy C (2002). Using school-wide data to advocate for student success. Prof. School Couns. 6(2):86-95.
Howard S, Bruce J (2004). ‘Transition From Primary To Secondary School: Possibilities and Paradoxes’ in P. Jeffery (ed.) AARE 2004 Conference Papers, Melbourne: AARE.
Kerlinger NF (1986). Foundations of Behavioral Research (3rd ed). Chicago: Holt, Rinehart and Winston, Inc.
Laugharn P (2007). Negotiating Education for Many Enrollment, Dropout and persistence in the community schools of Kolondieba, Mali. London: Institute of Education.
Mbewe MS, Nampota DC (2007). Urban Primary Schooling in Malawi: Opportunities and Challenges. Int. Handbook Urban Educ. 115-128.
Mertens MD (1998). Research Methods in Education and Psychology: Integrating Diversity with Quantitative and Qualitative Approaches. London: Sage Publications.
Tarekegne 633 Ministry of Education (2010). Education Sector Development Program
ESDP IV. Addis Ababa: Ministry of Education. Ministry of Labor and Social Affairs (MOLSA) (2006). Child Labor in
Ethiopia: Analysis of a Survey Conducted in 2001. Addis Ababa: MOLSA.
National Research Council (2004). Engaging schools: Fostering high school students’ motivation to learn. Washington, DC: National Academies Press.
Rumberger R, Sun AL (2008). Why students Drop out of school: A review of 25 Years of Research. California: University of California Santa Barbara.
Schaffner J (2004). “The Determinants of schooling investment among primary school aged children in Ethiopia” World Bank Working Paper Series, Washington: World Bank.
Schultz TP (2004). School subsidies for the poor: Evaluating the Mexican PROGRESA Poverty Program. J. Dev. Econ. 74:199-250.
Transitional Government of Ethiopia (TGE) (1994). Ethiopian Education and Training Policy. Addis Ababa: Birhanena selam printing press.
USAID (1993) Demand for schooling in Rural Ethiopia. Addis Ababa: Mega Publishing press.
UNESCO (2005). EFA Global Monitoring Report 2006, Education for All – Literacy for Life. Paris: UNESCO.
Wood HM, Psacharopoulos G (1995). Education for Development An Analysis of Investment Choice. New York: Oxford University Press
World Bank (2009). School Health and Nutrition Policy Brief. World Bank, Jakarta

Vol. 10(5), pp. 634-640, 10 March, 2015 DOI:10.5897/ERR2014.2058 Article Number: 40C89E151112 ISSN 1990-3839 Copyright © 2015Author(s) retain the copyright of this article http://www.academicjournals.org/ERR
Educational Research and Reviews
Full Length Research Paper
Turkish pre-service social studies teachers’ perceptions of “Good” citizenship
Cemil Cahit Yeşilbursa
Gazi University, Gazi Education Faculty, Ankara, Turkey.
Received 23 December, 2014; Accepted 20 February, 2015
The current study explores Turkish pre-service social studies teachers’ perceptions of “good” citizenship. The participants were 580 pre-service social studies teachers from 6 different universities in Turkey. The data were collected through an interview form having one open-ended question and analyzed according to open coding procedure. The results of the study show that Turkish pre-service social studies teachers’ perceptions of “good” citizenship are personally responsible, in other words, accordant with the traditional citizen type. Accordingly, pre-service social studies teachers mostly perceive good citizens as people who are honest, decent, loyal to the government and patriotic.
Key words: Social studies, good citizen, citizenship education, pre-service teachers. INTRODUCTION Training citizens or in other words citizenship education has been an important issue for the countries from past to present (Evans, 2006; Bellamy, 2008; Sabancı, 2008; Doğanay, 2009; Doğanay and Sarı, 2009; Rapoport, 2010; Acun et al., 2010; Quaynor, 2011; Uğurlu, 2013). While “citizen” expresses legal membership of an individual to the government or the society (Üstel, 1999; Cogan and Derricott, 2000; Doğanay, 2003; Kadıoğlu, 2006), “citizenship” includes characteristics of becoming a citizen formed from a number of rights and responsibilities (Üstel, 1999; Scott and Lawson, 2002; Cogan and Derricott, 2000; Doğanay, 2003; Faulks, 2006; Kadıoğlu, 2006; Bellamy, 2008). Citizenship is both “a dynamic concept as rights and responsibilities change over time as a result of social struggle, economic change and shifts in governing ideology” (Faulks, 2006, p. 123) and “a contested concept” (Faulks, 2006, p. 123; Kerr,
2003, p. 2). Consequently, citizenship has gone through many phases till arriving at today’s definitions and undergone many changes (Kılınç and Dere, 2013). In today’s definitions about citizenship education, it is seen that training citizens who are aware of their individual rights and responsibilities; have a certain number of universal knowledge, abilities and democratic values; arrive at agreements in the society and consider the benefits to the society; and actively participate in social and political works are emphasized (Cogan and Derricott, 2000; Kerr, 2003; Westheimer and Kahne, 2004; Evans, 2006; Kadıoğlu, 2008; Acun et al., 2010). Accordingly, “the subject of citizenship education is the characteristics of a good citizen and how to gain these characteristics” (Bakioğlu and Kurt, 2009). The general purpose of education systems is to train citizens in order to continue governments’ existence (Bellamy, 2008; Safran, 2008;
E-mail: [email protected]. Authors agree that this article remain permanently open access under the terms of the Creative Commons Attribution License 4.0 International License

Kadıoğlu, 2008; Üstel, 2011). Therefore, “the ways in which citizenship are defined ideologically by the government of the day will of course affect the form and effectiveness of citizenship education in schools” (Faulks, 2006, p. 124). Sabancı (2008) states that this situation is expressed with “good, effective and produc-tive citizen terms in education and teaching programs” (p. 29). While citizenship education is provided as a separate course in the school curriculum in some countries, it is provided through other courses such as history, geography, religious education, social studies, and moral education in some other countries (Quaynor, 2011; Saint-Martin, 2013). The definition of a good citizen changes according to the societies, governments and administra-tive systems. As a result of this, citizenship education differs from country to country and time (Bakioğlu and Kurt, 2009; Öner and Kamçı, 2013). Citizenship education in Turkey In early Turkish societies living styles were affecting their education system, such as in Huns, nomadism deter-mined their training citizen models. Huns cared about soldiery, governorship, vocational education, religious education and child rearing in their education system. Accordingly, in Huns, a good citizen should be a skillful soldier, a good organizer, have passion of independent living and have a vocational craft. These are the same for the Kök Turks as well. Apart from the Huns, Kök Turks were writing. Therefore, it is possible that they had a planned education. Different from Huns and Kök Turks, the Uighur Turks were settled. They used writing and had their own alphabet. Literacy and community’s knowledge level increased. A good citizen should be well educated. As a result of this an educated person could have a good position in government (Akyüz, 2011). However, planned citizenship education in Turkish education system started at the period of Ottoman Empire in the 1840s in parallel with the developments of the West (Üstel, 2011; MEB, 2010). In the late period of Ottoman Empire “citizenship education was highlighted in order to strengthen the ties that hold government and the citizens together”. In Turkish Republic period founded after Ottoman Empire, “training individuals who care for their country, and know about their citizenship responsibilities is one of the general purposes of Turkish national education” (MEB, 2010, p. 4). Citizenship education in Turkey is provided through different courses within historical process. Citizenship education is currently given under the scope of life sciences (1st to 3rd grades) and social studies (4th grade) at primary school, social studies at secondary school (5th, 6th and 7th grades) and “Citizenship and Democracy Education” at 8th grade. However, the contro-versy about abolishing this course from the curriculum and integrating it into other courses’ context (e.g. social studies) as it was in the past (Bakioğlu and Kurt, 2009)
Yeşilbursa 635 still continues.
In nation-state Turkey, educational planning is perform-ed by the government. Accordingly, all the courses given at schools are supposed to be in accordance with Turkish National Education Basic Law No 1739. In this law, while specifying the general purposes of national education, it is also defined which characteristics a citizen needs to attain. According to this law a good citizen should be;
1. “committed to Atatürk’s reforms and principles, his concept of nationalism as defined in the Constitution; who adopt, protect and improve the national, moral, human, spiritual and cultural values of the Turkish nation; who love and always elevate their families, homeland and nation; who are aware of their duties and responsibilities towards the Turkish Republic- which is a democratic, secular and social state ruled by law based on human rights and the basic principles defined in the beginning of the Constitution- and behave accordingly; 2. physically, mentally, morally, spiritually and emotionally have a moderate and healthy personality and mentality, independent and scientific thinking power, a wide world view; who respect human rights, appreciate enterprise and individuality; who feel responsibility towards the society; and who are constructive, creative and productive; 3. equipped with the necessary knowledge, skills, attitude and habit of working cooperatively in line with their own interests, talents and abilities” (OECD, 2005). Safran (2008) states that effective citizenship education is emphasized in the general purposes of national education and the objectives of the social studies course coincide with these features. In this case, it is possible to say that training good/effective citizens in our country is mostly assigned to the courses of life sciences and social studies and 8th grade citizenship and democracy educa-tion. When the literature is reviewed about the definitions of social studies, (MEB, 2005; Doğanay, 2003; Öztürk, 2006; NCSS, 1994; Ross, 2010; Barr et al., 1978), it is clear that educating citizens is emphasized. According to Doğanay (2003), although the general purpose of the education system in a country is educating effective citizens, this task needs to be fulfilled by mainly social studies courses in the school programs. Doğanay (2003) states that the main purpose of the social studies course in a democratic country is raising effective citizens who can improve democratic process. Sağlam (2012) expresses that primary school is a crucial step in creating citizenship awareness; and this situation raises the impor-tance of effective citizenship competences of teachers working at primary schools because the students at that stage tend to take their teachers as modal.
The courses of social studies at secondary school and citizenship and democracy education are given by social studies teachers. In this sense, it is important to reveal

636 Educ. Res. Rev. pre-service social studies teachers’ perceptions of “good” citizenship as Martin (2008) also stated “they will be social studies teachers influencing the next generation of students with their values of judgment” (p. 54–55). Similarly, Doğanay (2009) argues for the importance of exploring “how the pre-service teachers who will undertake the task of educating active citizens especially for the development of the democracy perceive them-selves in terms of citizenship perception and whether their actions coincide with their perceptions” (p. 32). Doğanay (2009) indicates that citizenship understanding in Turkey is mostly discussed theoretically; yet, more empirical evidences are needed about citizenship perception and behaviors. In this regard, the current study especially becomes more of an issue as it reveals Turkish pre-service social studies teachers’ perceptions of good citizenship. Besides, this study plays a crucial role in providing data to the field about the social studies teachers’ perceptions of good citizenship. Research on citizenship perception Doğanay (2009) states that the studies on citizenship concept or perception mostly focus on the concept of good citizen and there are many research studies on the good citizen perceptions adults, teachers and adole-scents. Westheimer and Kahne (2004) mention three types of citizenship model: “personally responsible”, “participatory” and “justice-oriented” and in their study, which was conducted with high school students and their citizenship education teachers, they presented that students of an effective curriculum adopt “participatory citizen” and “justice-oriented citizen” models. They state that “personally responsible” citizenship model is a traditional citizenship model and all the educational institutions aim at training that kind of citizens. However, they claim that “participatory” and “justice-centered” citizenship models need to be improved for an effective democracy. Kılınç and Dere (2013) revealed that high school students found social anxiety-oriented characte-ristics more important than other essential characteristics of good citizenship; knowledge-oriented characteristics are ranked as second and conservatism-oriented charac-teristics are ranked as the last in their survey study. They propounded that high school students emphasized the essential characteristics of a good citizen as caring for your country, having moral behaviors and being respect-ful to the social values. Doğanay and Sarı (2009) reported in their study with 238 high school students that while 209 of these students had traditional citizenship perceptions, 24 of them had social-active citizenship perceptions. They stated that female students had more traditional citizenship perceptions than males and students whose families were in medium-high income group mostly had social-active citizenship perceptions.
When the related literature is reviewed, it is clear that
there are a few studies on the good citizenship perceptions of pre-service social studies teachers. Martin (2008) stated in her study with pre-service primary and secondary teachers that these prospective teachers emphasized civic engagement more than political engagement and they viewed “good citizen” as someone who helps others and follows laws. Doğanay (2009) concluded, in his quantitative study with 489 pre-service teachers attending different programs, that pre-service teachers mostly adopt the concept of traditional citizenship. Moreover, the study revealed that pre-service teachers adopting social-active citizenship perception take a more active and participating role than those adopting traditional citizenship perceptions in many dimensions of active citizenship. Bakioğlu and Kurt (2009) presented, in their study with 45 teachers working at different educational levels and branches, that most of the teachers mentioned an obedient type of citizen who follows the rules while defining the citizenship as a requirement of democracy. They stated that while nearly half of the teachers in the sampling claimed they educated obedient, hesitant citizens who never interrogate, the others claimed they educated citizens suitable for the purposes of national education. With the aim of revealing “good citizenship” perceptions of primary school teachers, O’Brien and Smith (2011) set forth in their study based on the framework of Westheimer and Kahne (2004) that pre-service teachers adopt “personally responsible” citizen model. As the researches (Kılınç and Dere, 2013; O’Brien and Smith, 2011; Doğanay and Sarı, 2009; Doğanay, 2009; Martin, 2008; Westheimer and Kahne, 2004) show that both students, teacher candidates and teachers usually perceive citizenship as “personally responsible” but in order to flourish the democracy people should have “participatory” and “justice oriented” perception of citizenship (O’Brien and Smith, 2011). Because social studies teachers have crucial role in educating citizen for democratic society, pre-service social studies teachers’ perceptions of good citizenship are important. They will be effective young generations with their perceptions of good citizenship. Research question The present study aims to reveal pre-service social studies teachers’ perceptions of good citizenship. Therefore, the research question of the current study is “How do pre-service social studies teachers perceive good citizenship?” METHOD The method that the author used in the current study was derived primarily from research into pre-service teachers’ perceptions of “good” citizenship in the tradition of O’Brien and Smith (2011). The author used the quantitative data-collection techniques to obtain data. Because the author wanted to reach as many pre-service

social studies teachers as possible he used the survey method. Survey method is a research approach aiming to describe the situation in the past or present as it exists at the moment (Karasar, 2007). Participants In order to identify the participants, convenience sampling is applied. Convenience sampling is often favored by the researchers as it is easy to reach the participants and these participants are willing to take part in the study (Teddlie and Yu, 2007). As a result, the participants were chosen among the senior students attending social studies teaching programs from six different universities. These universities are located in different geographical regions of Turkey. Each university did not represent the different geographical region. In this way, the study is carried out with 580 participants. Data collection techniques Data collected by a single open-ended question. Participants were asked to answer the question “What is a good citizen?” in written form. The data were collected by the authorized faculty members of the social studies departments in the sample universities and sent to the researcher via mail. Data analysis Open coding procedure was applied for the analysis of data. In open coding procedure, the researcher presents specific categories according to the data obtained through data collection instrument (Creswell, 2007; Kemper et al., 2003). As a result of the analysis, 14 categories were revealed. As some students gave multiple answers to some questions, there is difference between the number of the students (n=580) and frequencies in the categories (f=1532). In order to verify the reliability of the study, reliability formula developed by Miles and Huberman (1994) was used. According to this, the “consensus” and “dissensus” items were specified by comparing the categories by the researcher and an expert on the field. As P=92% is calculated, the coding is accepted as reliable. RESULTS The analysis of pre-service social studies teachers’ perceptions of good citizenship is summarized in Table 1.
When Table 1 is examined, 216 (37.24%) of pre-service social studies teachers expressed that good citizenship is having honesty and ethics. Almost 1/3 of the participants stated that a good citizen is supposed to be honest at work, school, in life and relationships. Honesty is the most expressed category.We can interpret that participants think that honesty is the most important feature of a good citizen. Second category, which was expressed by 184 (31.72%) participants, is loyalty to the government, patriotism and pride about Turkey. Partici-pants highlighted that a good citizen is supposed to be proud of his/her country and loyal to the government and nation. A good citizen needs to prioritize the profits of the government and nation and not to do actions and behaviors which will destroy the unity and integrity of the
Yeşilbursa 637
Table 1. Pre-service social studies teachers’ perceptions of good citizenship. Categories F Ethics / Honesty 216 Loyalty /Pride about Turkey/Patriotism 184 Respecting others 146 Keeping up with current issues 130 Knowing and applying rights and responsibilities
122
Following laws 115 Citizenship Responsibilities (Paying taxes, voting, military service)
110
Achievement Orientation / Be Educated 106
Having critical perspective 97 Environmental Responsibility 94 Respecting and loving family 84 Community Involvement (help others, attend community events)
46
Loyalty to Ataturk’s Principles and revolutions
44
Having religious values 38 government in schismatic actions. It is expressed that a good citizen is someone who doesn’t bring damage to the government property.
146 of the participants (25.17%) described good citizenship as having respect for others. The participants identified respecting others as having respect for the ideas, beliefs and lifestyles of others. They indicated that accepting people as they are is really important for citizenship. 130 of the participants (22.41%) defined good citizenship as they could keep up with the current issues. The participants remarked that a good citizen is supposed to be interested in both the current issues of Turkey’s agenda and the issues world-wide such as wars, famine, poverty, global warming refugees, unemployment and environmental problems. 122 of the participants (21.03%) described good citizenship as they both could know and apply the rights and responsibilities. The participants expressing this view emphasized that a good citizen needs to know about his/her rights and responsibilities and apply these at the same time. They claimed that it is just not enough to know the rights; in case of need, a good citizen is supposed to know how to apply these rights or to take legal action when these rights are abused.
115 of the participants (19.82%) defined good citizen-ship as following laws. It is stated that laws are necessary for social order and thus good citizens follow the laws. The most mentioned one is traffic rules. 76 participants spoke of traffic rules. 110 of the participants (18.96%) expressed doing citizenship responsibilities such as

638 Educ. Res. Rev. paying taxes, voting and military service is necessary for good citizenship. The participants emphasized that voting is a crucial civic responsibility. Moreover, a good citizen is supposed to keep up with the political events and have opinions about the political landscape of the country. The participants delivering the idea of military service are all males. Every male over 20 is to complete his military service. Fulfilling this duty can be postponed to the older ages or men can be exempt from this duty in some conditions.
Having a critical perspective is identified as an indicator of good citizenship by 106 participants (18.27%). These participants stress that a good participant needs to interrogate the events, know to seek his/her rights, view the political events critically and not to accept everything dictated to himself/herself. It is remarked that the citizen is supposed to consider and question the causes and results of political and social events. 97 of the participants (16.72%) defined good citizenship for being successful and educated. The participants mentioning this view highlight that a good citizen is someone who is successful at work, needs to work hard and be educated. They claimed having a good job as a result of receiving education is worthy for good citizenship. Besides, it is underlined that a good citizen is supposed to become successful at work or school and then produce something new for the country.
95 of the participants (16.37%) think that good citizenship requires paying taxes. These participants emphasize paying taxes as an important civic responsibility. 84 of the participants (14.48%) indicated that good citizenship necessitates caring for and respecting family. These participants point out that a good citizen loves his/her parents and respects for them. It is explained that someone who loves his/her family will love his/her country and nation; and if he/she is a good descent, then he/she will be a good citizen. 94 (16.20%) participants stated being interested in environmental issues is a requirement of good citizenship. These participants claimed that a good citizen is sensitive to the environmental issues and responsible for the environmental problems not only in his/her own country but throughout the world. They also highlighted that a good citizen has responsibilities for animals, as well. A good citizen is supposed to protect the nature and struggle for not polluting the seas, rivers and the air. It is emphasized that being thrifty in using energy is a necessity of good citizenship.
46 participants (7.93%) identified good citizenship as working for the community or in other words serving the community. These participants stated that it is important to help elderly and disabled people in the society. Loyalty to Ataturk’s principles and revolutions is suggested by 44 pre-service teachers (7.58%). 38 of the participants (6.55%) told that having religious values is necessary for good citizenship. The participants arguing for this view stated that religious duties need to be performed.
DISCUSSION Fourteen categories emerged in this study investigating the pre-service social studies teachers’ perceptions of good citizenship. It can be said that the categories in the present study share similarities with some categories in the studies of Martin (2008) and O’Brien and Smith (2011). In addition, whereas having religious values is not involved in the studies of Martin (2008) and O’Brien and Smith (2011), it emerged in the studies of Doğanay (2009) and Kılınç and Dere (2013). Loyalty to Atatürk’s principles and revolutions showed up in this study unlike Doğanay’s (2009) and Kılınç and Dere’s (2013) studies. Atatürk is the founder of the Republic of Turkey. His revolutions while founding modern Turkey and the principles dominating the Republic of Turkey are involved in constitution of the Republic of Turkey. At the same time, these principles are included Turkish National Education Basic Law No 1739. These principles determine the direction of citizenship education in Turkey in some way. Loyalty to Atatürk’s principles and revolutions often heard by nearly all the students in each educational level is expressed by 44 pre-service teachers (7.58%) in this study. This result can be interpreted as this is not actualized with this aspect of the general purposes of Turkish national education specified in National Education Basic Law (1739). While the category of caring/respecting for the family does not show up in O’Brien and Smith’s (2011) study, it occurs in Doğanay’s (2009) “traditional citizen” model and corresponds with the questionnaire item “A good citizen fulfills his/her family responsibilities” which is included in Kılınç and Dere’s (2013) “citizen characteristics based on social anxiety”. It can be said that family is an important issue for Turkish individuals in terms of good citizenship.
When the results of the study are examined, it is clear that the categories emerging about the pre-service social studies teachers’ perceptions of good citizenship conform to the three types of citizen -personally responsible, participant, justice-oriented- developed by Westheimer and Kahne (2004). Besides, these categories match up with the traditional and social/active citizenship catego-ries defined in Doğanay’s (2009) study and Kılınç and Dere’s (2013) citizenship models of social anxiety oriented, knowledge oriented and conservatism oriented. The results of the study show that the most repeated categories are having honesty/ethics and being proud of Turkey/patriotism/loyalty. Along with these two catego-ries, the categories such as following laws, paying taxes, voting, doing military service, being educated, having respect for others, loyalty to Atatürk’s principles and the family show that pre-service social studies teachers mostly have personal responsible (Westheimer & Kahne, 2004) or traditional citizen (Doğanay, 2009) perceptions. Moreover, some participants stated that a good citizen is supposed to have a critical perspective. This category corresponds with the justice oriented citizen type of

Westheimer and Kahne (2004) and Doğanay’s (2009) social/active citizenship model. Some answers given by the participants in this category are below: “A good citizen needs to interrogate and not to accept the things dictated to him/her.” Participant #326. “Good citizenship primarily requires investigating, interrogating and considering. “A good citizen needs to make conscious decisions.” Participant #512 “A good citizen is supposed to be conscious and think about the reasons while voting and paying taxes”. Participant #192 “A good citizen should become active about the governance of the country, interrogate the decisions of country rulers and be able to criticize the laws and decisions about his/her country.” Participant #192. In addition to these answers, a significant number of participants stated that they know about their rights and responsibilities and at the same time apply them. While knowing the rights and responsibilities conforms to Kılınç and Dere’s (2013) “knowledge oriented citizen” model, applying these rights and responsibilities matches up with “justice oriented citizen” type of Westheimer and Kahne (2004). Some students’ answers in that category can be followed as: “A good citizen knows about his/her rights and responsibilities and does not hesitate to seek his/her rights.” Participant #17. “A good citizen does not stay silent against injustice and hesitate to take legal challenges.” Participant #234. “A good citizen does not stay silent against social injustice and inequality.” Participant #461. These answers can be interpreted as some students are suited for a citizenship type having a critical perspective which is defined as “justice oriented” by Westheimer and Kahne (2004). However, it can be said that when the general answers are taken into consideration, the number of pre-service teachers having this perspective is not as it was expected. Yet, personal and professional improve-ments of teachers to whom next generation of a society is commended are crucial. Tertiary education has a basic responsibility for teachers to become successful pro-fessionals (Özel, 2014). For this reason, an effective citizenship education is needed for pre-service social studies teachers to have critical perspectives. CONCLUSION AND RECOMMENDATIONS The results of the current study illustrate that pre-service social studies teachers perceive a good citizen mostly as personal responsible or in other words traditional. In similar studies conducted in Turkey, the good citizenship perceptions of students, prospective teachers and teachers mainly correspond with the personal responsible citizen type. Along with this, the studies conclude that the number of the citizen models having critical perspectives
Yeşilbursa 639 needs to be increased in order to improve democracy. Therefore, it is important for pre-service social studies teachers, who are directly concerned with citizenship education, to have active/participatory or justice centered citizenship perception. One of the most significant purposes of social studies is to educate active, productive, participatory citizens having critical perspec-tives. In order to be able to realize this purpose, pre-service social studies teachers who will teach social studies to students need to have this perspective first. Thus, as future social studies teachers will form the next generation with their citizenship perceptions, it is crucial for pre-service social studies teachers to receive citizenship education which will improve their critical per-spectives. For this reason, education and training need to be provided for pre-service social studies teachers to improve this perspective in social studies teaching programs. Conflict of Interests The author(s) have not declared any conflict of interests. ACKNOWLEDGEMENT I would like to express my gratitude to Jason L. O'Brien and Jason M. Smith for their support and assistance in preparing this paper. REFERENCES Acun İ, Demir M, Göz NL (2010). Öğretmen adaylarının vatandaşlık
yeterlikleri ile eleştirel düşünme becerileri arasındaki ilişki. J. Soc. Stud. Educ. Res. 1(1):107-123.
Akyüz Y (2011). Türk eğitim tarihi. Ankara: PegemAkademi. Bakioğlu A, Kurt T (2009). Öğretmenlerin demokrasi vatandaşlık ve
vatanseverlik algılarının nitel olarak incelenmesi. Marmara Üniversitesi Atatürk Eğitim Fakültesi Eğitim Bilimleri Dergisi, 29:19-39.
Barr RD, Barth JL, Shermis SS (1978). The nature of social studies. California: ETC Publications.
Bellamy R (2008). Citizenship: A very short introduction. Oxford: Oxford University Press
Cogan JJ, Derricott R (2000). Citizenship for the 21st century: An international perspective on education. London: Kogan Page Limited.
Creswell JW (2007). Qualitative inquiry and the research design: Choosing among five approaches. California: Sage Publications.
Doğanay A (2003). Sosyal bilgiler öğretimi. In: C. Öztürk, D. Dilek (Eds.), Hayat Bilgisi ve Sosyal Bilgiler Öğretimi. Ankara: Pegem A Yayıncılık, pp. 16–44.
Doğanay A (2009). Öğretmen adaylarının vatandaşlık algısı ve eylemlerinin siyasal toplumsallaşma bağlamında değerlendirilmesi. A. Şişman et al (Eds.), I. Uluslararası Avrupa Birliği, Demokrasi, Vatandaşlık ve Vatandaşlık Eğitimi Sempozyumu Bildirileri, 28–30 Mayıs 2009, Uşak: Uşak Üniversitesi,pp. 28-44
Doğanay A, Sarı M (2009). Lise öğrencilerinin vatandaşlık algılarına etki eden faktörlerin analizi. In: A. Şişman and at al (Eds.), I. Uluslararası Avrupa Birliği, Demokrasi, Vatandaşlık ve Vatandaşlık Eğitimi Sempozyumu Bildirileri, 28–30 Mayıs 2009,Uşak: Uşak Üniversitesi, pp. 45-62.
Evans M (2006). Educating for citizenship: What teachers say and what teachers do. Canadian J. Educ., 29(2):410-435.

640 Educ. Res. Rev. Faulks K (2006). Rethinking citizenship education in England: Some
lessons from contemporary social and political theory. Education, Citizenship and Social Justice. 1(2):123-140.
Kadıoğlu A (2006). Zaman lekesi. İstanbul: İstanbul Bilgi Üniversitesi Yayınları.
Kadıoğlu A 2008. Vatandaşlığın dönüşümü. İstanbul: Metis Yayınları. Karasar N (2007). Bilimsel araştırma yöntemi. Ankara: Bilim Kitap
Kırtasiye Yayınevi. Kemper E, Stringfield S, Teddlie C (2003). Sampling strategies in social
science research. In: A. Tashakkori, C. Teddlie (Eds.), Handbook of mixed methods in social and behavioral research. CA: Sage Publications, pp. 273-296.
Kerr D (2003). Citizenship education in England: The making of a new subject. Online J. Soc. Sci. Educ. 2:1–11.
Kılınç E, Dere İ (2013). Lise Öğrencilerinin ‘iyi vatandaş’ kavramı hakkındaki görüşleri. J. Soc. Stud. Educ. Res. 4(2): 103-124.
Martin LA (2008). Elementary and secondary teacher education students’ perspectives on citizenship. Action in Teacher Education, 30(3): 54–63.
MEB (2005). İlköğretim sosyal bilgiler dersi (6-7.Sınıflar) öğretim programı ve kılavuzu. Ankara: Talim ve Terbiye Kurulu Başkanlığı.
MEB (2010). İlköğretim vatandaşlık ve demokrasi eğitimi dersi (8.sınıf) öğretim programı. Ankara: Talim ve Terbiye Kurulu Başkanlığı.
Miles MB, Huberman AM (1994). Qualitative data analysis: An expanded sourcebook. (2nd Ed.). Thousand Oaks, California: SAGE Publications, Inc.
NCSS (1994). Expectations of exellence: Curriculum standards for Social Studies. Washington, DC: National Council for the Social Studies.
O’Brien JL, Smith JM (2011). Elementary education students’ perceptions of “good” citizenship. J. Soc. Stud. Educ. Res. 2(1):21-36.
OECD (2005). Basic Education in Turkey-Background Report. Retrieved from http://www.oecd.org/edu/school/39639642.pdf.
Özel A (2014) Department of primary education students’ opinions regarding the necessity of graduate education. Anthropologist, 17(1): 1-6.
Öztürk C (2006). Sosyal bilgiler: Toplumsal yaşama disiplinler arası bir bakış. In: C. Öztürk (Ed.), Hayat bilgisi ve sosyal bilgiler öğretimi: Yapılandırmacı bir yaklaşım. Ankara: Pegem A Yayıncılık, pp. 21-50.
Quaynor LJ (2011). Citizenship education in post-conflict context: A review of the literature. Education, Citizenship and Social Justice, 7(1): 33-57.
Rapoport A (2010). We cannot teach what we don’t know: Indiana teachers talk about global citizenship education. Education, Citizenship and Social Justice, 5(3): 179-190.
Ross EW (2010). The struggle for social studies curriculum. In: E.W.
Ross (Ed.), The social studies curriculum: Purposes, problems and possibilities. Albany, NY: State University of New York Press, pp. 3-19.
Sabancı O (2008). İlköğretim 7.sınıf öğrencilerinin sosyal bilgiler dersinde yer alan vatandaşlık konularıyla ilgili kavramsal anlamaları. Unpublished Master Thesis. Ankara: Gazi Üniversitesi.
Safran M (2008). Sosyal bilgiler öğretimine genel bir bakış. In: B Tay, A Öcal (Eds.). Özel öğretim yöntemleriyle sosyal bilgiler öğretimi. Ankara: Pegem Akademi, pp. 1-19.
Sağlam Hİ (2012). İlköğretim öğretmenlerinin etkili vatandaşlık yeterlik algılarının çeşitli değişkenler açısından incelenmesi. J. Soc. Stud. Educ. Res., 3(2):71-85.
Saint-Martin I (2013). Teaching about religions and education in citizenship in France. Education, Citizenship and Social Justice, 8(2): 151-164.
Scott D, Lawson H (2002). Citizenship, education, and the curriculum. Westport, USA: Greenwood Press.
Teddlie C, Yu F (2007). Mixed Methods sampling: A typology with examples. J. Mixed Methods Res. 1(77):77-100.
Uğurlu NB (2013). 8. sınıf Amerikan ve Türk öğrencilerinin vatandaşlık ile ilgili algılarının karşılaştırılması. Eğitim ve Bilim, 38(170):281–292.
Üstel F (1999). Yurttaşlık ve demokrasi. Ankara: Dost Kitabevi Yayınları.
Üstel F (2011). Makbul vatandaşın peşinde: II. Meşrutiyet’ten bugüne vatandaşlık eğitimi. İstanbul: İletişim Yayınları.
Westheimer J, Kahne J (2004). What kind of citizen? The politics of educating for democracy. Am. Educ. Res. J. 41(2):1-30.

Vol. 10(5), pp. 641-647, 10 March, 2015 DOI:10.5897/ERR2014.2059 Article Number: DC915BE51114 ISSN 1990-3839 Copyright © 2015Author(s) retain the copyright of this article http://www.academicjournals.org/ERR
Educational Research and Reviews
Full Length Research Paper
The problem-solving skills of the teachers ın various branches
Veysel TEMEL
Karamanoglu Mehmetbey University, Physical Education and Sports High School, Karaman, Turkey.
Received 24 December 2014; Accepted 22 February, 2015
The aim of this study was to determine the problem-solving skills of the teachers in various branches in Çat town of Erzurum Province in Turkey, using some variables. A total of 153 teachers (84 females, 69 males and age: 1.6536±0.72837) from different departments participated in the study. Problem Solving Inventory, developed by Heppner and Peterson (1982), was used to measure the problem solving skill level of the individual. For processing data, conventional statistical measures and methods were employed: Analysis of variance (ANOVA) test, tukey test, t-test, mean frequency distribution and standard deviation were computed. SPSS was used for analyzing of data. Results showed that the teachers had moderate problem-solving skills, According to course hours variables of the teachers entering, among impatient, thinking, avoidant, planned approach levels, mother occupation level between planned and thinking approach levels, the father's educational levels according to problem solving total scores and sport branches variable and among the thinking, self-confident, planned approach and problem solving total scores were statistically found meaningful difference (p<.05). Key words: Problem solving, teachers, teachers’ skills.
INTRODUCTION A teacher usually has to complete the following activities in teaching process: (1) explain the core knowledge of a problem; (2) show how to solve the problems with specific knowledge; (3) provide solutions and work examples of a problem; (4) give targeted feedback to students in the process of their trying to solve the problem; (5) recommend related activities based on students' cognitive state. Student model is the core element of ITS, based on which ITS is able to select the most suitable teaching strategies, provide related
examples according to the needs of students, and replace human teachers to some extent (Shi et al., 2002).
Skill as an advanced cognitive ability can be understood as the ability of using concepts and rules to solve problem. It is difficult to be achieved by using traditional teaching methods, such as lectures, know-ledge representation (Hwang et al., 2014). The learner should practice and strengthen the process continuously to complete the task. In teaching ICT, researchers gradually become aware of the importance of operational
E-mail: [email protected], [email protected]. Tel: +905346661111, +90338226219. Authors agree that this article remain permanently open access under the terms of the Creative Commons Attribution License 4.0 International License

642 Educ. Res. Rev. skills training and developing a variety of teaching aids systems and simulation tools, such as RCOS (Chernich et al., 1996), SOsim (Maia, 2003), in order to promote students' understanding of abstract concepts in computer courses and correct students' misconceptions. Some simulating teaching systems, such as MINIX (Herder et al., 2006; Nachos (Christopher et al., 1993) filter out the complexity of the real-life situation, so that students could understand the most basic concepts of knowledge and steps in a relatively simple context (Buendia and Cano, 2006). Web-based learning platform, such as WebCT, BlackBoard, was also used to assist the instruction, providing a wide range of learning resources. Based on the platform and resources, students were able to learn the contents of each module on demand, watching video lessons, reviewing the missing contents. To some extent, it can support students to carry out resource-based learning and achieve a better learning effect; but it still cannot support the skill acquisition in an effective way.
Problem was defined as an obstacle against available difficulties gathered by an individual to reach his target (Bingham, 1983). Keeneland described problem as the difference between the available and expected situation of something (Keeneland, 1999). According to Morgan, problem is described as the case of conflict when an individual encounters hindrance while reaching a target and finding it harder to reach the target with this hindrance; finding the best way to overcome the hindrance means solving the problem (Morgan, 1982). People face a lot of situations for solving problems in their daily lives. Problem solving involves reasoning and problem-overcoming is process that starts from the individual feeling the difficulties in reaching a target and the duration spent in finding a solution to it (Ülküer, 1988). This process aims to look for the ways to restore organism’s inner balance and to get rid of the stress through obeying the rules and decreasing the hindrances. Therefore, problem solving is a comprehensive knowledge and skill which should be learnt and obtained and it should always be enhanced (Bingham, 1983; Sungur, 1992).
According to Erden (2005), giving students problem solving skills is one of the prior goals of all educational institutions. Especially in programs depending on progressive and reconstructive philosophical movement, improving problem solving skill is the main goal of education. People need to have this skill to adapt to social life and change, to be a successful and independent person.
To Bingham (1958), teachers are responsible for seeing that capacities in the surrounding can be changed into remarkable learning situations, and adding new elements into the situation. According to Hmelo (2004) and Watts (1994) teachers help students in learning the cognitive information they need for problem solving and cooperation.
Problem solving process starts with understanding the problem or gaining awareness, and continues with the
stages of producing alternative strategies and applying by choosing amongst one of those alternatives. Lastly that chosen solution is needed to be confirmed In the following years. Tomas (1999) arranges the problem solving process in five stages: 1st Step: Define the problem 2nd Step: Collect information about source of the problem 3rd Step: Develop alternative solutions for the problem 4th Step: Choose the most suitable solution 5th Step: Apply the solution. Rather than giving information to students about how to solve an encountered problem, teachers must bring solving skill for their own problems (Karplus, 1977). There are two main approaches in problem solving. Firstly, teachers configure the information actively in cooperation groups. Secondly, student and teacher roles have changed their form. Teacher is no longer the main source of the information. What is done in cooperation is the facilitator of learning. In the learning process for them to explore, the teacher guide to discover students’ thoughts by asking open-ended questions and include them into the group process (Hmelo, 2004; Von Glasersfeld, 1991). In such atmosphere, students understand creative thinking and problem solving better, trust themselves more in creativec skills, get ready for using creative approaches more in solving professional problems and showing more creative approaches in daily life (Davis, 1980). To Duffy and Cunningham (2001) in problem solving process, students take more responsibility; become more independent and self-regulatory individuals. METHODS Study universe and sample In this study, it was aimed to investigate the problem-solving skills of the teachers working in various branches, like math, physical education and sports, history, music and English, in terms of some of the variables. The study comprised a descriptive study. The result obtained from research was restricted with 153 teachers, the study group; 168 teachers from 310 working in the central schools depending on Ministry of Education in Cat town of Erzurum province in 2014-2015 academic year were reached; but the 15 survey was excluded from evaluation. There were a total of 84 women and 69 men (Age (1.6536±0.72837) in 153 different branches ( Physical education and sports teachers, math teachers, history teachers, music teachers and english teachers). Data collection tool In the study, totally 153 teachers who were working in Cat town of Erzurum City in Turkey were given questionnaires. Problem Solving Inventory, developed by Heppner and Peterson (1982), was used to measure the problem solving skill level of the individual. The Turkish version of the problem Solving Inventory was realized by Şahin et al. (1993) and the personal information sheet of 14 questions was used.

Temel 643
Table 1. Results of teachers related to X and Ss values of problem solving sub-dimensions and total point. Sub-dimentions of problem solving inventory
n X Ss Min. Max. The max. & min.
points in the inventory
Impetuous Approach 153 33,5621 8,67000 ,00 51,00 9-54 Considering Approach 153 12,7516 4,94613 ,00 25,00 5-30 Avaidant Approach 153 16,3856 5,39752 ,00 24,00 4-24 Evaluator Approach 153 7,6601 3,13336 ,00 16,00 3-18 Self-assured Approach 153 20,7124 5,31343 ,00 32,00 7-42 Planned Approach 153 10,0850 4,02451 ,00 23,00 4-24 Total Point 153 101,1569 18,58838 ,00 129,00 32-192
Problem solving ınventory This inventory scored between 1 and 6 is Likert type and measures one’s own perceptions about one’s problem solving skills. In the course of scoring 9th, 22nd and 29th items were left aside from scoring. The 1st, 2nd, 3rd, 11th, 14th, 15th, 17th, 21st, 25th, 30th and 34th
items were scored in the inventory. The Problem Solving Inventory had six sub-dimensions which were: Impetuous Approach, Considering Approach, Avoidant Approach, Evaluator Approach, Self-assured Approach and Planned Approach. The least point was one and the utmost point was 6 in the answer key. At least, 32 and utmost 192 points could be taken in the whole Problem Solving Inventory. The total high score from the scale indicated that the individuals were perceived to be inadequate with regards to problem solving (Sahin et al., 1993). Data analysis and ınterpretation To evaluate the statistics, Statistical Package for the Social Sciences (SPSS) Windows version 21,00 package programme was used. Analysis of variance (ANOVA) test, tukey test ,t-test, mean frequency distribution and standard deviation were done.
On the first phrase of the research, demographic characteristics were analized. This study was done with the aim of presenting teachers’ problem solving skill levels who were working in Cat town of Erzurum City in Turkey. The information obtained was interpreted as follows: In the first phase of the study, the demographic features of the participating teachers were determined. According to this, 84(54.9%) participants are females and 69(45.1%) are males. The age distribution of the teachers is 76(49.7%) of which we have between 20 and 25; 54(35.3%), between 26 and 30; 23(15.0%), between 31-35 and over (Age (1.6536±0.72837).. The marital status dispersion of the teachers is: 108(70.6%) are single, 35(70.6%) are married and 10(6,5%) are engaged. The education status dispersion of the participants is: 133(86.9%) of them have a master dgree and 20(13.1%) of them graduated from university. The year of the teachers working in a school is 130(85.0%) between 1 and 5 years, 23(15.0%) between 6 and 10 years. When the teachers’ residences were analyzed, teachers living in a metropole are 53(34.6%); city, 47(30.7%); town, 38(24.8%) and village and small town, 15(9.8%). Lesson hours of the teachers are; 17(11.1%) for below 15 h, 9(5.9%) for 15 and 18 h, 21(13.7%) for 19 and 22 h, 35(22.9) for 23 and 26 h and last one is 71(46.4%) for 27 h and above. The teachers’ working schools are; 40(26.1%) in a primary school and 88(57.5%) in a secondary school, 25 (16.3%) in a high school. The father’s occupation dispersion of the participants is: 26(17.0%) of them are officials, 29(19.0%) of them are workers, 17(11.1%) of them are tradesman,18(11.8%) of them are farmers and 63(41.2%) of them are retired. The mother’s occupation
dispersion of the participants is: 15(9.8%) of them are farmers, 22(14.4%) of them are retired and great majority of them are housewives, 11.1% (116). The father’s education status dispersion of the participants is: 22(14.4%) are literates, 46(30.1%) are primary school leavers, 23(15.0%) are secondary school leavers, 42(27.5) are high school graduates and 20(13.1%) have four - year degree or two-year degree. The mother’s education status dispersion of the participants is: 18(11.8%) are illiterates; 15(9.8%), literate; 75(49.0%) graduated from primary school; 23(15.0%), graduated from secondary school and 22(14.4%) graduated from high school. Doing sports rate of the teachers is: 60(39.2%) as yes and 93 (60.8%) as no. The rate of the teachers doing individual sports is 32(20.9%) and team sports rate among the teachers is 28(18.3). On the second phase of the research, teachers’ problem solving levels were determined. FINDINGS In the second part of the study, problem solving levels of teachers were tried to be determined. In Table 1, problem solving sub-dimension and total points of teachers participating in the search were analyzed. At the end of this search, impetuous approach was found as X =33,5621 (min 9 – max 54) and
avoidant approach was X =16,3856 (min 4 – max 24). So it can be said that their points are mid-level. And also,
considering approach was X =12,7516 (min 5 – max 30)
and self-assured approach was X =20,7124 (min 7 – max 42). So it can be said that their points are over
medium level. Evaluator approach was X =7,6601 (min
3 – max 18) and planned approach was X =10,0850 (min 4 – max24). So it can be said that the irpoints are over high level. Finally, problem solving total point was X =101,1569. Problem solving total point was the
minimum score of 32 and maximum score of 192 total point of the scale; where teachers’ total point was X =101,1569 in the problem solving inventory examined,
it can be said that teachers participating in the research have mid-level problem solving skills.

644 Educ. Res. Rev.
Table 2. The Oneway Anova-test results of problem solving inventory sub-dimensions of teachers related to the lesson hour variable.
Sub-dimensions of Problem Solving Inventory Lesson hour
n
X
Ss
Sd
F
p-value
Meaningful differences Tukey test
Impetuous Approach
Less than 15 17 27,5882 5,33923
148
2,577
,040
4-1
15-18 9 32,1111 5,15860 19-22 21 34,2381 11,46257 23-26 35 34,0000 8,43661 27 and over 71 34,7606 8,42185
Considering Approach
Less than 15 17 13,6471 4,76893
148 3,095 ,018
4-3
15-18 9 17,7778 3,59784 19-22 21 13,0952 5,83871 23-26 35 12,2000 4,28266 27 and over 71 12,0704 4,86775
Avoidant Approach
Less than 15 17 13,1176 4,83325
148
4,137
,003
4-1
15-18 9 13,1111 6,73507 19-22 21 15,2857 5,01142 23-26 35 16,6286 4,40645 27 and over 71 17,7887 5,45610
Planned Approach
Less than 15 17 10,3529 3,67323
148
5,099
,001
3-2
15-18 9 13,3333 3,00000 19-22 21 12,0000 5,20577 23-26 35 10,5714 3,44952 27 and over 71 8,8028 3,64347
*p<.05.
In Table 2, problem solving sub-dimension and one way anova-test results in relation to total points were analysed whether or not they differ according to “lesson hours variable when teachers enter class”. At the end of the study, the teachers’ points in impetuous approach are respectively X =27,5882 for those who enter class less
than 15 h; X =32,1111 for between 15-18 h, X =34,2381 for between 19-22 h, X =34,0000 for
between 23-26 h and X =34,7606 for 27 h and over and a meaningful difference was found in terms of impetuous Approach points ( F:2,577 p<0,05). The teachers’ points in considering approach are respectively X =13,6471 for those who enter class less
than 15 h; X =17,7778 for between 15-18 h,
X =13,0952 for between 19-22 h, X =12,2000 for
between 23-26 h and X =12,0704 for 27 h and over and a meaningful difference was found in terms of considering approach points ( F:3,095 p<0,05).
The teachers’ points in avoidant approach are respec-
tively X =13,1176 for those who enter class less than
15 h; X =13,1111 for between 15-18 h , X =15,2857 for
between 19-22 h, X =16,6286 for between 23-26 h and X =17,7887 for 27 h and over and a meaningful
difference was found in terms of avoidant approach points ( F:4,137 p<0,05).
The teachers’ points in planned approach approach are respectively X =10,3529 for those who enter class less
than 15 h; X =13,3333 for between 15-18 h, X =12,0000 for between 19-22 h, X =10,5714 for
between 23-26 h and X =8,8028 for 27 h and over and a meaningful difference was found in terms of planned approach points ( F:5,099 p<0,05).
In Table 3, problem solving sub-dimension and oneway anova test results were analysed whether or not they differ according to “teachers’ mothers’ jobs variable ”. According to the table, the teachers’ points in Considering Approach are respectively X =10,60000 for

Temel 645
Table 3. Teachers’ mothers’ jobs variable, problem solving skills related to the total score Oneway Anova test results.
Sub-dimensions of problem solving inventory
Mother’s job
n
X
Ss
Sd
F
p-value
Meaningful differences Tukey test
Considering Approach
Farmer 15 10,6000 3,04256 150
3,419
,035
1-3
Retired 22 11,1818 4,88571 Housewife 116 13,3276 5,04377
Planned Approach
Farmer 15 9,0667 3,32666
150
3,201
,044
2-3 Retired 22 8,4091 2,90581 Housewife 116 10,5345 4,20027
*p<.05.
Table 4. Fathers’ educational status variable of the teachers, problem solving skills related to the total score anova test results. Sub-dimensions of problem solving inventory
Fathers educational status status
N
X
Ss
Sd
f
P-value
Meaningful differences tukey test
Total
Literate 22 91,4091 27,11116
148
2,760
,030
1-4
Primary school 46 100,3913 13,70398 Secondary school 23 103,7391 13,35262 High school 42 106,6905 13,22136 Associate / Bachelor degree 20 99,0500 27,04669
*p<.05.
being farmers, X =11,1818 for being retired and X =13,3276 for being housewife and a meaningful
difference was found in terms of Considering Approach points (F:3,419 p<0,05). According to the table, the teachers’ points in planned approach are respectively X =9,0667 for being farmers, X =8,4091 for being
retired and X =10,5345 for being housewife and a meaningful difference was found in terms of Considering Approach points ( F:3,201 p<0,05).
In Table 4, problem solving total points and oneway anova test results were analysed whether or not they differ according to “fathers educational status variable”. According to the table, the teachers’ points in total points are respectively X = 91,4091 for literate fathers, X = 100,3913 for those who graduated from primary school, X = 103,7391 for those who graduated from secondary
school, X = 106,6905 for those who graduated from high
school and X = 99,0500 for those having Associate / Bachelor degree and a meaningful difference was found in terms of total points ( F:2,760 p<0,05).
In Table 5, problem solving sub-dimension and t-test
results were analysed whether or not they differ according to “ sports branches which teachers do variable ”. According to the table, while the teachers’ points who do individual sports in Considering Approach are X =10,9063, the teachers’ points who do team
sports in Considering Approach are X =14,3571 and a meaningful difference was found in terms of Considering Approach points (t:0,144 p<0,05). While the teachers’ points who do individual sports in Self-assured Approach are X =18,4063, the teachers’ points who do team sports in Self-assured Approach are X =21,5357 and a meaningful difference was found in
terms of Self-assured Approach points (t:0,771 p<0,05). While the teachers’ point who do individual sports in planned Approach is X =8,0625, the teachers’ point who
do team sports in planned Approach is X =11,2857 and a meaningful difference was found in terms of planned Approach points (t:3,699 p<0,05). While the teachers’ points who do individual sports in total point is X =93,1875, the teachers’ points who do
team sports in total point is X =103,6071 and a meaning-

646 Educ. Res. Rev.
Table 5. Sports which teachers do variable, related to problem solving skills related to the sub-dimesions and total score t- test results.
Sub-dimensions of problem solving inventory Sports type n X Ss Sd t p-Value
Considering Approach Individual Sports 32 10,9063 5,40227 58
,144
,015 Team Sports 28 14,3571 5,16551
Self-assured Approach İndividual Sports 32 18,4063 6,15320 58
,771
,039 Team Sports 28 21,5357 5,16743
Planned Approach
İndividual Sports 32 8,0625 3,14117 58
3,699
,001 Team Sports 28 11,2857 4,12631
Total
Individual Sports 32 93,1875 22,76448 58
,326
,047 Team Sports 28 103,6071 15,84962
*p<.05. ful difference was found in terms of total points (t:0,326 p<0,05). RESULT AND DISCUSSION This study was carried out to find out whether or not the ability of problem solving of the teachers differed according to the variables of gender, age, marital status, educational status, professional service year, the place where he/she lives the most, secondary education institutions they worked in, father's occupation, mother’s occupation, parental education status, their active spor-tive level, lesson hours for a week and sports they do.
The results obtained in this study in order to identify problem-solving skills of the teachers were as follows; while problem solving skills of teachers participating in the study were detected in the medium level, it could be said that impetuous approach ( X =33,5621 (min 9 – max
54)) and avoidant approach ( X =16,3856 (min 4 – max
24)) were mid-level, considering approach ( X =12,7516 (min 5 – max 30)) and self-assured approach
( X =20,7124 (min 7 – max 42 )) were over medium level,
Evaluator approach ( X =7,6601 (min 3 – max 18)) and
planned approach ( X =10,0850 (min 4 – max24)) were over high level. On the other hand, A meaningful relationship was not found according to the teachers' gender, age, marital status, educational status, pro-fessional service year, the place where he/she lived the most, secondary education institutions they worked, mother’s education status, father’s occupation and their active sportive level. But, a meaningful relationship was found according to lesson hours for the week, mother’s occupation, father’s educational status and and sports
they do actively. Kir et al. (2013) carried a survey among the prospective
teachers in the pedagogical competencey program. They found that the teachers in the pedagogical formation proramme had the ability of problem solving which was over mid-level and no significant difference was found according to the variables of the place they live the longest and gender; an important difference was found according to the variables of age, marital status, familşy income and the school and the faculty they graduated from.
At the end of Akpinar’s study (2012), It is found that while there is a meaningful difference in sportsmen’s marital status, education status, parents’ education status, father’s occupation, occupation in the game, the year of playing football professionally and the age of starting sport variables, there is no meaningful difference in playing team and age variables.
Taylan applied problem solving inventory to three groups by adapting Hepper’s problem solving inventory, reliability and validity. The inventorty was applied to stu-dents who study at Ankara University, College of Science and at the end of the study a meaningful difference could not be encountered in gender and class variables but a meaningful difference was found when class and programme were taken together (Taylan, 1990).
At the end of Katkat’s study on the comparison of gender and fields of teacher candidates’ problem solving skills, a meaningful difference was not found in teacher candidates’ gender and different class variables, but a meaningful difference was encountered in types of university enrollment and types of point variables (Katkat, 2001).
At the end of Tekin et al. (2007)’s study on examining students’ problem solving skills who study at school of physical education and sport, meaningful differences were found in avoidant approach for female students, the way of considering, avoidant, evaluator, self-assured and

planned approach for students who do sport. ACKNOWLEDGMENT The authors would like to thank Assistant Professor Vedat AYAN and Assistant Professor Selahattin AKPINAR, Physical education and sports, by helping in the data acquisition. Conflict of Interests The author has not declared any conflict of interests REFERENCES Akpinar S (2012). A study on the problem solving competence of elite
female hockey players in terms of certain variables. Energy Education Science and Technology Part B: Social and Educational Studies, Volume (issue) 4(3): 1473-1482.
Bingham A (1958). Improving children’s facility in problem solving. New York: Teachers College, Columbia University. The development of problem solving skills inchildren. Trans .: A. Ferhan Oğuzkan.
Bingham A (1983). Development of Problem Solving Ability in Children. Trans .: Dr. A. Ferhan Oğuzkan, 4th edition, Ministry of Education Publications, İstanbul, Türkiye.
Buendia F, Cano JC (2006). A generative and web-based learning architecture to teach operating systems in undergraduate courses. IEEE Transactions on Education, 49(4):464–473.
Chernich R, Jamieson B, Jones D (1996). RCOS: yet another teaching operating system. Proceedings of the 1st Australasian conference on computer science education, ACM, pp. 216–222
Christopher WA, Procter SJ, Anderson TE (1993). The Nachos instructional operating system. Proceedings of the USENIX Winter 1993 Conference Proceedings on USENIX Winter Conference Proceedings, USENIX Association, pp. 4–4.
Duffy T M, Cunningham DJ (2001). Constructivism: implications for the design and delivery of instruction. the handbook of research for educational communications and technology. The Association for Educational Communications and Technology http://www.aect.org/intranet/publications/edtech/07/ index.html [02.11.2014].
Davis G (1980). The teaching of Elementary Problem Solving in Engineering and Related Fields. (Edit. Lubkin, James, L.) American Society for Engineering Education. Washington. D.C.
Erden M (2005). Introduction to Teaching Profession. Istanbul: Epsilon publishing.
Heppner PP, Peterson HC (1982). The development and implications of a personal problem-solving inventory. Journal of Counseling Psychology, 29:66-73.
Herder JN, Bos H, Gras B, Homburg P, Tanenbaum AS(2006). MINIX 3: a highly reliable, self-repairing operating system. ACM SIGOPS Operating Systems Review, 40 (3):80–89.
Hmelo S, Cindy E (2004). Problem-based learning: what and how do students learn? Educational Psychology Review. 16 (3):235- 266. September.
Hwang YH, Kuo SC, Chen BB, Ho IK (2014). Effects of an integrated concept mapping and web-based problem-solving approach on students' learning achievements, perceptions and cognitive loads. Computers & Education, 71:77–86.
Temel 647 Karplus R (1977). Science teaching and the development of reasoning.
J. Res. Sci. Teaching. 14:2. Katkat D (2001). Comparison of Prospective Teachers’ Problem Solving
Skills in terms of Gender and Fields. Unpublished Master’s Thesis. Atatürk University, School of Social Sciences, Erzurum.
Keeneland S (1999). Solving Problems Essentials. How to Books Ltd. Oxford. UK.
Kir et al. (2013). “The examination of the problem-solving skills of the prospective teachers participating in the pedagogical competence program". Intl. J. Acad. Res. Part B; 5(6):31-36.
Maia MAG (2003). Sosim: Simulator for operating systems education. Morgan CT (1982). Introduction to psychology. Trans.:Arıcı H. et al.,
Meteksan, Ankara-Turkey. Sahin N, Şahin NH, Heppner PP (1993). Psychometric Properties of
The Problem Solving Inventory in A Group of Turkish University Student. Cognit. Ther. Res. 17(3):379-385.
Shi H, Rodriguez O, Chen S, Shang Y (2002). Integrating adaptive and intelligent techniques into a web-based environment for active learning. Intelligent Systems: Technology and Applications, 4, pp. 229–260.
Sungur N (1992). Creative thinking, Acer Printing, Istanbul, Turkey. Taylan S (1990). Application of Heppner’s problem Solving Inventory,
Reliability and Validity studies. Ankara University Institute of Social Sciences, Unpublished Master Thesis, Ankara.
Tekin M, Taskin O, Kivrak AO (2007). Investigation of Problem Solving Skills of the Students studying at school of Physical Education and Sport in terms of different variables. J. Ulkumuz 4(7):57-66.
Tomas S (1999). Creative Problem-Solving: An Approach To Generating Ideas. Hospital Materiel Management Quarterly. Health & Medical Complete, 20(4):33.
Ülküer NS(1988). How do children acquire problem solving skills? Lifelong Education, n = 5.
Von GE (1991). Questions and answers about radical constructivism. scope, sequence, and coordination of secondary school science. (ed. M. K. Pearsall.) The National Science Teachers Association. Vol. II: Relevant research (169 182). (Final Draft, August 1991).
Watts M (1994). Constructivism, Re-constructivism and Task-orientated Problem-solving. The Content of Science: A Constructivist Approach to its Teaching and Learning. ed. Peter J. Fensham, Richard F. Gunstone, Richard T. White. London-Waffngton D.C.: The Falmer Press: 39-59.

Vol. 10(5), pp. 648-653, 10 March, 2015 DOI: DOI:10.5897/ERR2014.2020 Article Number: C798C0E51115 ISSN 1990-3839 Copyright © 2015Author(s) retain the copyright of this article http://www.academicjournals.org/ERR
Educational Research and Reviews
Full Length Research Paper
The effects of basketball basic skills training on gross motor skills development of female children
Betul Bayazit
Kocaeli University School Of Physical Education and Sport, Recreation Department, Umuttepe Campus, 41380, Kocaeli,
Turkey.
Received 26 November, 2014; Accepted 16 February, 2015
The purpose of this study was to investigate the effects of basketball basic skills training on gross motor skills development of female children in Turkey. For that purpose, 40 female children took part in the study voluntarily.Basketball basic skills test was used to improve the gross motor skills of the female children in the study. Also, observation form was used to determine changes with respect to the gross motor skills of the female children in the study. Locomotor, manipulative and balancing trainings in Basketball Basic Skills Test lasted for 90 min a day, 2 days a week for 12 weeks. Descriptive statistics and paired samples t test were used to analyze the data collected from the pretest and posttest. The data were analyzed by using SPSS 18.0 Package Program. Level of significance was determined to be 0.05. As a result of this study, it was found that there was a significant difference between pretest and posttest for all parameters (p<0.05). Key words: Psychomotor development, motor skills, basketball, female children.
INTRODUCTION Development is a behavior pattern (Ulgen, 1997), and also it is a complex phenomenon that integrates many structures and functions with respect to real life. Because of this integration, stages of the development process affect next stages of it directly. Development of a person is a regular and continuous change composed via learning, life and maturation (Ozer and Ozer, 2012). In the development process, all people investigate symbols in their environment by using capabilities of perception, thought and emotion (Ulgen, 1997).
Psychomotor generally describes actions that require coordination of various parts of the body. Executive control is needed to facilitate such coordination of
multiple body parts (Cheong, 2007). This view was reinforced by Jacko and Vitense (2001) who posited that cognitive function is a component of psychomotor ability, and that psychomotor ability is in fact composed of a combination of cognitive, perceptual, and physical abilities (Cheong, 2007). Motor development are closely related to physical and mental health (Roeber, 2012) because motor development is an organism movement process as parallel to physical growth and central nervous system (Sari, 2005).Understanding psychomotor development provides opportunities to improve movement abilities and to increase performance. These improvements provide positive self-esteem and emotional
E-mail: [email protected]. Authors agree that this article remain permanently open access under the terms of the Creative Commons Attribution License 4.0 International License

stability to people (Zeybek, 2009; Muratli, 1997). Motor skills may vary depending on individual differences and age (Gurocak, 2007).In this way, purpose for motor deve-lopment programs should be composed by determining suitable time and form of activities for different age groups (Ozmun and Gallahue, 2005). People use psychomotor features to improve strength, endurance, speed and coordination (Cakıroglu, 1997). Psychomotor features cover genetic abilities and abilities gained in process of development and maturation (Gunsel, 2004). In the context of development and movement, coordina-tion forms qualities of a movement or sporty technique. The more children improve their skills, the more fluency, dynamics, rhythm and reaction of them improve in positive direction (Yorulmaz, 2005).Development of motor abilities is related to individual's development as mental, emotional and social. Having high self-esteem about motor abilities gives a chance to people for becoming a compatible individual as physical and psychological (Zeybek, 2009).
A considerable numbers of children have not reached to the advanced levels of fundamental movements due to the lack of ample opportunities for exercise and physical activities, which causes them to be weak in the spe-cialized movements. Since this weakness has negative impacts on daily life activities, rectifying this weakness seems crucial (Gallahue and Ozmun, 1998). Improving motor skills of children at an optimum level is depending on opportunities, motivation and training. They can be provided to children by understanding motor skills as well as gender, mental and emotional dimensions (Koc, 2005). Moreover, movement training is a very important factor for improving personality features, establishing relationship with environment and reflecting emotion and thoughts (Ulutas, 2011). Acquisition of sports skills needs for long-term training period (Sayın, 2011), and development of motor learning capability is at high level between 8 and 13 ages (Mengutay, 2005). Especially, speed, aerobic endurance and quickness improves in this period (Taskiran, 1997). Therefore, movement training should be started at an early age for children. A child is an individual with his own original personality (Kılbas, 2001), and childhood is a period covering game and education (Yorukoglu, 1998). Childhood is just not a preparatory period for real life but also it is a life-section with its own specific requirements and purposes (Kılbas, 2001). Previous studies on development of children showed that causes of mental retardation can be divided into two broad categories: physical and cultural-familial (Haskins, 1986). Physical causes include genetic and chromosomal disorders and brain damage occurring prenatally (due to congenital infections, malnutrition, and
Bayazit 649 drug exposure) or postnatally (due to accident or illness). Cultural familial causes do not cause brain damage per se but occur due to life in a deprived, nonstimulating environment (American Psychiatric Association, 1987). Latest studies on psychomotor development showed that environment factors are very important for early brain development (Gokmen et al., 1995). Therefore, now-adays, emphasis on motor development has been increasing, and more time for its development has devoted to work in this area (Koc, 2005).
Basketball is one of the most important sports useful for developing skills, coordination and reaction time of the children (Sevim, 1991).It is apparent above that there are many benefits of basketball such as building up muscles of the body, building self-esteem, developing motor coordination and self-discipline, providing mental development and concentration, increasing flexibility, speed, and agility. In the light of the explanations about the benefits of basketball, the purpose of this study is to investigate the effects of basketball basic skills training on gross motor skills development of female children. METHOD AND MATERIALS Participants 40 healthy female children aged 11 were recruited from an elemen-tary school in Kocaeli City of Turkey. Locomotor, manipulative and balancing trainings in Basketball Basic Skills Test for improving gross motor skills of female children lasted for 90 min a day, 2 days a week for 12 weeks.In the study period, Basketball Basic Skills Test (slalom dribbling, step slide, ball handling drills, catching and shooting, one handed basketball shot), formed by the researcher evaluating similar test used in this field (Tekin, 1987), was used in the present study. Also, observation form for the gross motor skills change, developed by the researcher, was used in the present study. Observation form for determining the gross motor skills change was coded as very poor for 1, poor for 2, average for 3, good for 4 and very good for 5. Scores of gross motor skills change were given to participants according to movement ability. Parents and school director were informed about purpose, method, place and time of the study. Consent form was taken from the parents of the children for the research. Instrument Stages of basketball basic skills test 1. Slalom dribbling In this stage, each slalom was set by 5 slalom poles (1 m distance between), and participants dribble the ball through the slalom station and then back along outside the starting place. Slalom trial for each participant was made three times, and the best score was recorded by the instructure. 2. Step slide In this stage, start and finish lines were plotted with red tapes, and

650 Educ. Res. Rev.
Table 1. Descriptive statistics for stage ofslalom dribbling.
Slalom dribbling N % Slalom dribbling N %
Pretest
1 11 27,5
Posttest
1 3 7,5 2 9 22,5 2 9 22,5 3 13 32,5 3 13 32,5 4 7 17,5 4 14 35 5 - - 5 1 2,5
Total 40 100 Total 40 100
Table 2. Descriptive statistics for stage of step slide. Step slide N % Step slide N %
Pretest
1 10 25
Posttest
1 2 5 2 11 27,5 2 7 17,5 3 14 35 3 13 32,5 4 5 12,5 4 13 32,5 5 - - 5 5 12,5
Total 40 100 Total 40 100 red tapes were set with 4 m distance. Step slide trial for each participant was made three times, and the best score was recorded by the instructure. 3. Ball handling drills In this stage, ball handling drills for each participant was made three times, and the best score was recorded by the instructure. 4. Catching and shooting In this stage, catching and shooting for each participant were made three times, and the best score was recorded by the instructure. 5. One handed basketball shot In this stage, one handed basketball shot for each participant was made three times, and the best score was recorded by the instructure. Data analysis In this study, data with respect to observation form for the gross motor skills change were analyzed by using SPSS 18.0 Package Program. Descriptive statistics was used to determine average of the age with respect to participants. Also, paired samples t test was used to compare the scores of the participants between pretest and posttest.Level of significance was determined to be 0.05. FINDINGS As shown in Table 1, slalom dribbling scores were 1 (11 %27,5), 2 (9 %22,5), 3 (13 %32,5), 4 (7 %17,5) for pre-test, and 1 (3 %7,5), 2 (9 %22,5), 3 (13 %32,5), 4 (14 %35), 5(1 %2,5) for post-test.
As shown in Table 2, step slide scores were 1 (10 %25), 2 (11 %27,5), 3 (14 %35), 4 (5 %12,5) for pre-test,
and 1 (2 %5), 2 (7 %17,5), 3 (13 %32,5), 4 (13 %32,5), 5(5 %12,5) for post-test.
As shown in Table 3, ball handling drills scores were 1 (1 %2,5), 2 (11 %27,5), 3 (22 %55), 4 (6 %15) for pre-test, and 1 (1 %2,5), 2 (7 %17,5), 3 (13 %32,5), 4 (16 %40), 5(3 %7,5) for post-test.
As shown in Table 4, catching and shooting scores were 1 (5 %12,5), 2 (17 %42,5), 3 (14 %35), 4 (4 %10) for pre-test, and 1 (3 %7,5), 2 (11 %27,5), 3 (11 %272,5), 4 (12 %30), 5(3 %7,5) for post-test.
As shown in Table 5, one handed basketball shot scores were 1 (1 %2,5), 2 (13 %32,5), 3 (20 %50), 4 (6 %15) for pre-test, and 1 (1 %2,5), 2 (6 %15), 3 (13 %32,5), 4 (16 %40), 5 (4 %10) for post-test.
As shown in Table 6, there was a significant difference between pre-test score and post-test score for all parameters (p<0,05). DISCUSSION In this study carried out to investigate the effects of basketball basic skills training on gross motor skills development of female children, forty female children took part in the study voluntarily. Results of the study showed that there was a significant difference between pre-test score and post-test scores with respect to obser-vation form for the gross motor skills change (p<0.05).
Gaggioli et al. (2013) investigated the benefits of combining mental and physical training in learning a complex motor skill in basketball. In their study, sixty female university students were randomly assigned to either mental practice with physical training, or physical training alone. As a result of their study, it was found that mental practice condition with physical training improved coordination and movement accuracy, suggesting the potential effectiveness of this approach in training complex gross motor skills.Fotrousi et al. (2012) investigated the compensatory impact of mini-basketball skills on the progress of gross motor skills in children, and hence to evaluate the degree of training impact in

Bayazit 651
Table 3. Descriptive statistics for stage of ball handling drills.
Ball handling drills N % Ball handling drills N %
Pretest
1 1 2,5
Posttest
1 1 2,5 2 11 27,5 2 7 17,5 3 22 55 3 13 32,5 4 6 15 4 16 40 5 - - 5 3 7,5
Total 40 100 Total 40 100
Table 4. Descriptive statistics for stage of catching and shooting.
Catching and shooting N % Catching and shooting N %
Pretest
1 5 12,5
Posttest
1 3 7,5 2 17 42,5 2 11 27,5 3 14 35 3 11 27,5 4 4 10 4 12 30 5 - - 5 3 7,5
Total 40 100 Total 40 100
Table 5. Descriptive statistics for stage of one handed basketball shot.
One handed basketball shot N % One handed basketball shot N %
Pretest
1 1 2,5
Posttest
1 1 2,5 2 13 32,5 2 6 15 3 20 50 3 13 32,5 4 6 15 4 16 40 5 - - 5 4 10
Total 40 100 Total 40 100
Table 6. Results of the paired simple t test for all parameters.
Slalom dripling T 5.068
P 0.000* P<0.05
Step slide T 6.444
P 0.000* P<0.05
Ball handling drills T 4.210
P 0.001* P<0.05
Catching and shooting T 4.356
P 0.001* P<0.05
One handed basketball shot T 5.339
P 0.000* P<0.05
*p<0.05.
such skills in the desired performance of sports movements. In their study, girls of 7 to 10 years old participated in Test of Gross Motor Development. The results of their study showed improvements from pre-test to post-test scores in both experimental and control groups, while the experimental group significantly performed better than the control group in the post-test. Their research results indicated that the basic mini-basketball exercises had a considerable impact on the progress of the basic movements in children, who had previously experienced delays in those movements. In the same way, several studies found a significant relationship between the percent of spent times in moderate and vigorous physical activity and total gross motor skills (Haywood and Getchell, 2009; Fisher et al., 2005).Brain et al., (2006) examined the relationship between motor proficiency and physical activity in 8 to 10 years of age children. Results of their study showed that motor proficiency was positively associated with physical

652 Educ. Res. Rev. activity and inversely associated with sedentary activity in children.Kambas et al. (2012) examined the relationship between motor proficiency and pedometer-determined physical activity in 5 to 6 years of age children. The findings of their results added to the growing body of literature that considers gross motor skills as important elements of physical activity participation.
In his study, Roeber (2012) claimed that children were important given the evidence that children with motor problems were often stigmatized, with poor motor performance leading to exclusion from social activities. It was observed in his study that children had a good communication with bothpeers and researchers as well as an improvement in their basic basketball skills.Ulas (2014) found a difference between pretest and posttest results of development test conducted on experimental group in his study about the effects of educational games and instruction on the cognitive and gross motor development level of 10 to 12 years of age children. The reason for such a significant difference may be explained that girls can concentrate on tests well and they do not experience concentration problems. Dexterity in movement, speed and concentration can be developed by playing games (Fluri, 2005; Elzbieta et al., 2010).
In the 12-week study program, basic basketball skillswere learned through games, and the materials in these games used in various activities were strong stimulantfor girls. In the study carried out by Mirzeoglu et al. (2006) about the effects of computer assisted teaching on learning basketball skills, they found significant difference in experimental group in cognitive domain. In this study, though not computer assisted the fact that perception level in cognitive domain are at a desired level can be shown as another reason for success. In her study Ozcan (2005) indicated that the physical properties of the environment of sports activities are important elements in teaching motor skills. In this study, the fact that cleanliness of working environment, the materials being enough for all students and activities designed in a way to encourage children are given priority made students participate in the study and develop positive attitude towards learning. Sports acts acquired through much repetition are sports skills. Concentration and attention must be in the foreground (Sayın, 2011). In a study, it was concluded that educators are not in effective communication and interaction with children both reduced concentration and interest (Hurst, 1986). In this study, children had enough repetition for improving their gross motor skills and also they were concentrated to continue basketball basic skills program. This might have caused positive changes in gross motor skills.
Moreover, it should be recorded that there were several limitations in this study. The sample involved only female
children, this wasan obvious limitation of the current studyto explain generalizability of the study findings.
Further, the sample included only children 11 year of age, therefore, in future research,the basketball basic skills test applied in the study can be applied to different schools with a greater number of students to reach more trustable data with respect to motor behaviors. Also, design in this study could be manipulated to construct comparative studies divided into two groups (experiment and control/male and female). Conclusion The present study investigated the effects of basketball basic skills training on gross motor skills development of female children. According to data obtained in this study, basketball basic skills trainings have positive effects on gross motor skills development of female children. Basketball is one of the most popular sports in the world, and results of this study showed that it is one of the best ways to boost children’s sociability and gross motor skills. The game of basketball is a complex motor multi-structured team activity basedon the symbiosis of cyclic and acyclic movements of individual players with and without the ball (Trninic, 1995), the performance quality of which is directly related to motor-functional conditioning status (preparedness or fitness) of athletes and their body composition (Trninic et al., 2001). Hence, improving basketball basic skills of the children in overall education process may prepare them for a sporting lifestyle. In this context, it is suggested that similar programs can be developed by physical education and sport teachers at the elementary schools. Conflict of Interests The author has not declared any conflict of interest. REFERENCES American Psychiatric Association (1987). Diagnostic and Statistical
Manual of Mental Disorders. (3rd edition). American Psychiatric Association, Washington,DC:APA.
Brian HW, Leonard HE, Joan MD, Katherine EJ, Valerie AK (2006). The Relationship Between Motor Proficiency and Physical Activity in Children. Pediatricts. 118(6):1758-1765.
Cakıroglu M (1997). Training information - Training theory and systematics. Seker printing pres.(2nd edition). Ankara. Turkey.
Cheong YK (2007). Performance and movement kinematics of Mouse pointing task: perspectives from age, psychomoter ability, and visual ability. University of Oklahoma, Doctoral dissertation, Norman, Oklahoma.

Elzbieta C, Malgorzata M, Grazyna N, Halina K, Bozena Z (2010).
Motor competencies of children at the age of six as thebasis for motor education accomplishment within integrated education. Int. Sci.Congress. Perspectives In Physical Education andSport. (10th edition). Constanta. Romania.
Fisher A, Reilly J, Kelly L, Montgomery C, Williamson A, Paton J (2005). Fundamental movement skills and habitual physical activity in young children. Medicine & Science in Sports Exercise. 37:684-688.
Fluri H (2005). Recreation games and exercises. Bagırgan Publishing.(Edited by Basaran, Z.) Ankara. Turkey.
Fotrousi F, Bagherly J, Ghasemi A (2012).The compensatory impact of mini-basketball skills on the progress of fundamental movements in children. Procedia - Social Behav.Sci. 46:5206-5210.
Gaggioli A, Morganti R, Mondoni M, Antonietti A (2013). Benefits of Combined Mental and Physical Training in Learning a Complex Motor Skill in Basketball. Psychology. 4(9):A2, 1-6.
Gallahue LD, Ozmun CJ(1998). Understanding motor development. Infants, children, adolescents, adults. Boston: McGraw-Hill.
Gokmen H, Karagul T, Ascı FH (1995). Psychomotor Development. T. C. Prime Ministry, General Directorate of Youth and Sport. Publication no:139. Ankara. Turkey.
Gunsel AN (2004). Physical education and practice at the elementary school. Anı Publications. Ankara. Turkey.
Gurocak US (2007). Evaluating 60–72-month-old children attending nursery school in term of development of language and fine motor. Abant Izzet Baysal University, Institute of Social Sciences, Master’s Thesis. Bolu. Turkey.
Haskins, R. (1986). Social and culturel factors in risk assessment and mild mental retardation. In Farran DC, McKinney JD (Eds), Risk in intellectual and psychosocial development (pp.29-60). Newyork: Academic press.
HaywoodKM, Getchell N (2009). Life Span Motor Development (5th edition). Champaign, IL: Human Kinetics, USA.
Hurst VE (1986). Student attitudes toward organizational aspects of secondary school physical education programs. National Library of Canada in Aicinena, S., LateWinter. 91:48.
Jacko JA, Vitense HS (2001). A review and reappraisal of information technologies within a conceptual framework for individuals with disabilities. Universal Access in the Inf. Soci. 1:56-76.
Kambas A, Michalopoulou M, Fatouros IG, Christoforidis C, Manthou E, Giannakidou D, Venetsanou F, Haberer E, Chatzinikolaou A, Gourgoulis V, Zimmer R. (2012). The relationship between motor proficiency and pedometer-determined physical activity in young children. Pediatr. Exerc. Sci. 24(1):34-44.
KılbasS (2001).Recreation, leisure time review. Anaca Publications. Adana. Turkey.
Koc S (2005). Skills development in physical education and sport. Morpa Publications. Istanbul. Turkey.
Mengutay S (2005). Development of movement and sports in children. Morpa Culture Publications. Istanbul. Turkey.
Mirzeoglu D, Aktag I, Gocek E, Bosnak M (2006). The effects of computer-assisted instruction on training of basketball skills. J. of Sport Man. Infor. Tech. 1(2):25-34.
Muratlı S (1997). Children and sports. Bagırgan Publishing.(2nd edition). Ankara. Turkey.
Ozcan N (2005). Recommendations for a successful inclusion. www.rehabilitasion.com.
Ozer K, Ozer D (2012). Motor development in children. Nobel Publishing. (7th edition). Ankara. Turkey.
Ozmun J, Gallahue D (2005). AdaptedPhysicalEducationandSport. (Editor: Winnick J). Chapter 19. (4th edition). Motor Development. Human Kinetics.ISBN: 0-7360-5216-X. StateUniversity: 345.
Roeber B, Tober C,Bolt D, Pollak S (2012). Gross motor development in children adopted from orphanage settings. Dev. Med. Child Neur. 54(6):527-531.
Bayazit 653 Sari CS (2005). Movement and education development in preschool. J.
of Edu. in light of Sci. and Reason. 6:62. Turkey. Sayın M(2011). Movement and skill education. Coach Education
Series:7. Sports Publishing House and Bookshop. Ankara. Turkey. Sevim Y (1991).Basketball tactical-technical-training. (1stedition). Gazi
Publisher.Ankara. Turkey. Taskiran Y (1997). Hentbol Performance. Bagırgan Publishing. Ankara.
Turkey. Tekin H (1987). Measurement and evaluation in education. (5thedition).
Meso Publisher. Ankara. Trninic S (1995). Structural analysis of knowledge in basketball.
Doctoral dissertation, Faculty of Physical Education, University of Zagreb, In Croat.
Trninic S, Markovic G, Heimer S (2001). Effects of Developmental Training of Basketball Cadets Realised in the Competitive Period. Coll. Antropol. 25(2):591-604
Ulas M (2014). The effects of teaching 12-year-old children basic basketball with educational games on cognitive and psychomotor development.Gazi University, Institute of Education Sciences,Department of Physical Education and Sports Teacher,Master’s Thesis. Ankara. Turkey.
Ulgen G (1997). Educational Psychology. Aklın Publishing. Istanbul. Turkey.
Ulutas A(2011). The effect of some major games on the children’s psychomotor development at the preschool period.Inonu University, Institute of Primary Educational Sciences Department, Master’s Thesis.Malatya. Turkey.
Yorukoglu Atalay (1998). Youth Age. (10th edition), Istanbul. Turkey. Yorulmaz H (2005). Comparison of some of the physical and biomotoric
features of student at Trakya University Kırkpınar Physical Education and Sports Academy. Trakya University, Institution ofHealth Sciences, Master’s Thesis. Edirne. Turkey.
Zeybek E (2007). An investigaton about bacic motoric attributes of a group of 9 age children attending primary school in Ankara Beypazari town centre.Dumlupınar University, Institution of Social Sciences, Master’s Thesis. Kutahya.Turkey.

Vol. 10(5), pp. 654-659, 10 March, 2015 DOI:10.5897/ERR2014.2061 Article Number: 8208AB151118 ISSN 1990-3839 Copyright © 2015Author(s) retain the copyright of this article http://www.academicjournals.org/ERR
Educational Research and Reviews
Full Length Research Paper
The perception of gifted students’ parents about the term of giftedness
Esra Altıntaş1* and Şükrü İlgün2
1Faculty of Ataturk Education, Marmara University, Istanbul, Turkey.
2Education Faculty, Kafkas University, Kars, Turkey.
Received 26 December, 2014; Accepted 11 February, 2015
The purpose of this research is to present the definition of ‘giftedness’ made by the parents who have gifted children.The study is of importance for presenting the term of giftedness from parents of gifted students as a result of their experiences. Also, this study has a great importance as it allows us to have more information about gifted children, to organize educational programs according to these children, to emphasize the outstanding characteristics in gifted children and to get suitable data that can be used during the selection process of gifted children. The content analysis was used from qualitative data analysis approaches in this study. The study group of the research is consisted of 50 parents who havea gifted children. Within the scope of this research, the answers of an open–ended question ‘Can you make a definition for ‘gifted children’ by considering your own child?’ were analyzed. The answers given by parents were grouped under 3 themes. These are: Academic features, Personal features and Creativity. The term ‘giftedness’ was defined through the eyes of parents who have gifted children and it was defined precisely with the expressions of parents who closely experience gifted children. Key words: giftedness, perceptionof parents.
INTRODUCTION It is necessary to determine gifted children in the early ages. If these children were not determined, it could be possible for them to get lost in huge crowds. This means a big loss for the countries and for the development of humanity. Families have great responsibilities at this issue.They should carefully observe their children, follow their kids and share the slightest differences that they see on their children with their teachers and experts if necessary. During the early childhood, the cognitive development of the gifted children depends on the experiences that they get in their families. From this perspective, the awareness of the families who have a
gifted child regarding gifted children’s features and needs peculiar to these features facilitates the developments of the children (Özbay, 2013).
The first step for recognizing the gifted children is the phase of nomination.The nomination is mostly made by peers, parents or teachers. The most important responsibilities are often taken by parents and teachers on the basis of the child’s differences, development and skills. The nomination of the gifted students can be possible only after they are recognized by their parents and/or their teachers (Akar and Akar, 2012). What kind of helps the gifted children need educationally cannot be
*Corresponding author. E-mail: [email protected]. Authors agree that this article remain permanently open access under the terms of the Creative Commons Attribution License 4.0 International License

evaluated properly. In this case, the recognition of the components which constitutes a hint for the concept of giftedness is of great importance (Karasu, 2010).
Gifted children show the potential for performing at remarkably high levels of accomplishment when compared with others of their age, experience or environment. These children exhibit high performance capability in intellectual, creativity, and/or artistic areas, have an unusual leadership capacity or excel in specific academic fields (Jarosewich et al., 2002; Maitra and Gosain, 2009; MEB, 2006). Also Renzulli reported that gifted individuals had three elements such as having ability above normal, a high level of commitment to the task and high level of creativity (Alkan, 2013).
Generally, the most important feature of gifted children is their learning speed. These kinds of children learn speaking, reading and writing in earlier ages than others. They are always eager to learn new things with their insatiable curiosity (Karakurt, 2009). They constantly ask questions (Özbay, 2013) and interrogate everything (Ataman, 1998). They use their indefinite energies for achieving their purposes. They are both physically and mentally active (MEGEP, 2007). Gifted students pay more attention to mental operations because of their high level of intelligence and consequently their cognitive individual awareness is also higher (Narimani and Mousazadeh, 2010). They prefer to act independently, to be in decision making mechanisms and to draw a learning route in accordance with their own interests (Sak, 2009).
Perfectionist tendencies of gifted children are higher than their peers. They like taking responsibilities and discharging their responsibilities. They prefer to play on their own instead of being in a group. They are very curious. They do not obey the norms of a group. They insist on their own truths. They conflict with the authorities and they do not like if somebody imposes on them to do something. They like difficult tasks. They are persistent and decisive on the points that they believe in. They have extensive vocabulary. They have wide interests. Besides, they have features such as being creative, to be able to solve problems, solid memory and insights, to prefer new and difficult experiences, to use unique expressions. Leadership is one of the psychosocial features of gifted children. Their sense of responsibility is high and they try to accomplish their tasks with a high sense of responsibility. They can present the results of a given task with high self-confidence. They are very interested in their environ-ments and constantly ask questions. They focus more on cause effect relations of the events. They have a solid observation and logic power. They prefer to implement the rules that they bring and they want others to obey these rules (Özbay, 2013).
A research including a definition of ‘giftedness’ through the eyes of families who have a gifted child could not be found as a result of the literature scan. In general, it was
Altıntaş and İlgün 655 included to create metaphors about the concept of giftedness and the perceptions of teachers regarding the concept of giftedness. We can outline them as in the following:
Lee (1999)’s research aims to determine how teachers describe the term of giftedness. The results show that teachers understand giftedness as a series of concep-tions, namely excellence, potential, rarity, behaviour, innate ability, motivation and asynchrony.In the studies carried out by Neumeister et al. (2007), the opinions of teachers on the concept of giftedness and the characte-ristics of gifted children were taken. It appeared that teachers defined giftedness as learning easily, creativity, understanding above the average level, awareness of patterns/connections, curiosity, extensive vocabulary, self-motivation.In Moon and Brighton (2008)’s research, respondents described gifted children as possessing strong reasoning skills, a general storehouse of knowledge and facility with language, including a strong vocabulary.
In Moore (2009)’s study teachers described gifted children as having a strong desire to learn, high motivation, inquisitiveness, excitement and enormous energy. They thought that gifted children need to be pushed and challenged as far as they can go. Some teachers noticed that gifted children do not always fit in or have a lot of friends, prefer to talk with adults, are independent, and can be disorganized. Some teachers also observed that gifted children are loving, sensitive, passionate, sweet, care about others, have a sense of humour, and can be immature. Almost all the teachers in this study commented on the academic aspect of giftedness in children by noticing boredom, frustration, problem solving skills, self teaching, mastery of content, and thinking outside the box. In the study of Eraslan Çapan (2010), the metaphoric perceptions of the prospective teachers who participated in the study regarding gifted/talented students were grouped under 13 categories; 1)Showing high performance 2) Trying to improve in inappropriate conditions 3) Need special education 4) Mysterious and requiring an effort to understand 5) Valuable 6) Open to be controlled and guided 7) To be able to predict and direct future 8) Making researches and to be able to look from different perspectives to the events 9) Look different from his/her peers 10) with high capacity 11) Productive 12) Creative 13) Sophisticated.
In Akar and Akar (2012)’s research, findings indicated that primary school teachers’ perceptions about gifted-ness are inadequate for the realization and the nomination of the gifted children. The categories obtained in the scope of the research are as in the following: To have abilities/ skills/talents, to have different characteris-tics, to be successful, to have high IQ. In a study which was carried out with the parents of the gifted students, the parents stated the different features of their gifted child as to start speaking earlier than others, to start making

656 Educ. Res. Rev. regular sentences in early ages, to be active, to ask a lot of questions, to start walking earlier than others and to give logical responses to the questions (Alkan, 2013).
The study of Özsoy (2014) was carried out for demonstrating the opinions of Science and Art Centres’ teachers and parents on gifted and talented students whom they constantly interact through metaphors. As a result of this study, it was seen that the teachers and their parents in Science and Art Centre perceived the concept of ‘gifted student’ as students who have high performances, need special education, require an effort to understand, valuable, look different than their peers, have high capacity and sophisticated.In the research of Altıntaş and Özdemir (2014), the opinions of teachers about the term giftedness and the characteristics of gifted students were taken. Teachers’ answers for the open ended questions are grouped under 7 themes. They are; being different from peers, academic achievement, high capability in certain areas, creativity, personal traits, development features and congenital. When we analyzed the categories under these themes, there were 2 categories under ‘being different from peers’, 15 categories under ‘academic achievement’, 2 categories under ‘high capability in certain areas’, 5 categories under ‘creativity’ theme, 18 categories under ‘personal traits’ theme, 6 categories under ‘development features’ theme and 2 categories under ‘congenital’ theme.
The purpose of this research is to present the definition of ‘giftedness’ made by the parents who have gifted children by moving from their own child.Also, this study has a great importance as it allows us to have more information about gifted children, to organize educational programs according to these children, to emphasize the outstanding characteristics in gifted children and to get suitable data that can be used during the selection process of gifted children. By moving from these expressions, we can state the problem sentence of the study as ‘what are the perceptions of the parents who have gifted children on the term, ‘giftedness’? METHOD In this part, the research model was explained and the information about the analyses of the data which was collected through data collection tools was presented. Research model In this research, the content analysis from the qualitative data analyses approaches was used. Content analysis involves defining suitable and important examples, themes and patterns in the data. In content analysis, the observations or citations which are the samples of the topics, concepts of ideas which are similar and suitable to each other are searched.This case sometimes includes combining all the data which guide us to a certain evaluation question (Patton, 1987). Content analysis requires in-depth analysis of the collected data and it allows us to find out themes and dimensions which are not apparent. The basic purpose of the con-
tent analysis is to reach concepts and correlations which can explain the collected data. For this, it is necessary to conceptualize the collected data beforehand, later on to organize them according to appeared concepts in a logical way and to determine the themes that are explaining the data according to them. The data in qualitative studies are analyzed in 4 phases. The phases are as follows: coding the data, finding themes, organizing themes and codes and defining and interpreting the findings (Yıldırım and Şimşek, 2008). The study group The research was carried out in the fall semester of 2013-2014 academic year. The research group of the study is 50 parents (mother or father) who have gifted children. While determining the participants, convenience sampling was conducted due to some practical reasons such as ease of transportation, implemention of the study rigorously and communication. Data collection tool ‘Parents’ view form” which was prepared by the researcher for the parents of the gifted children was used within the scope of this study. ‘Parents’ view form’ is composed of 8 open ended questions. The questions were prepared by the researcher via literaure scanning. For validity of the view form, in the direction of the view of an expert some changes were made and the forms were finalized. From the view form, only the answers of the open-ended question ‘Can you make a definition for ‘gifted children’ by considering your own child?’ were considered within the scope of this study. This question is examined in a detailed way. Data analysis The data collected from the open-ended question used in ‘Parent view form’ were qualitatively analyzed. The content analysis was used in qualitative data analysis. After the answers given by the parents through considering their own children about the definition of ‘gifted child’ were categorized, they were grouped under different themes. The obtained categories and themes were presented in the form of frequency (f) and percentage (%) in tables and the necessary evaluations were made accordingly.
The data gathered from 50 parents were analyzed. While analyzing the data, an coding process was carried out by the researcher in the direction of the idea of an expert. In the coding process, the reliability of view form was calculated by the method of double coding of Miles and Huberman (1994). Firstly, the answers of 50 parents were coded by the researcher. 25 forms which include all the codes got from the analysis of all forms were selected and they were coded by an expert. The reliability of the analyzed question was 0.95. Because the reliability value is higher than 0.70, we can say that there is a compliance between scorers. RESULTS In Table 1, the answers the parents provided for the open-ended question ‘Can you make a definition of ‘gifted children’ by considering your own child?’ were divided into categories and themes through analysis.
When the table is analyzed, it is seen that the answers of the parents which they provided for the open-ended

Altıntaş and İlgün 657
Table 1. The expression of answers obtained from open ended question according to themes and categories.
Themes Categories f %
Academic features
Being eager to learn and teach 21 42 Having talking ability 39 78 High visual intelligence 38 76 Intelligent 46 92 Bookish 34 68 Having Ability to think rapidly 36 72 Learning rapidly 41 82 Development of mathematical ability in the early age 31 62 High perception 38 76 More awareness 38 76 Extensive vocabulary 32 64 Reading and writing in the early age 36 72
Personal features
Repudiation of folkways 14 28 High motivation 24 48 Hard to be understood 32 64 Eager to be first 37 74 Ability to put a mask in places where he/she enters 7 14 Leader 40 80 Independent 42 84 Talking too much 48 96 Asking questions too much 40 80 Authentic 21 42 Expressing oneself well 12 24 Messy 29 58 Ambitious 34 68 Moving too much 46 92 Kind-hearted 12 24 Having sense of justice 19 38 Impatient 45 90 Getting bored quickly 42 84 Persistent 31 62 Exciting 21 42 Perfectionist 44 88 Needing rules and disciplines 28 56 Having confidence 40 80 Modernist 29 58 Internally controlled 11 22 Logical 36 72 Emotional 24 48 Objecting too much 47 94 Hard to convince 44 88 Having his own rights 48 96 Becoming more mature 25 50 Having different interests 29 58 Having a different viewpoint 24 48 Reacting differently 12 24 Showing versatile development 19 38 Thinking like an adult 31 62

658 Educ. Res. Rev.
Table 1. Contd.
Creativity
High imagination 45 90 Curious 48 96 Repartee 42 84 Witty 31 62 Finding practical solutions 30 60 Thinking differently 31 62 Perfect humour 33 66 Pedantic 40 80
question used in the opinion form classified under 3 themes. These themes are“Academic features, Personal Features and Creativity”. The categories under the theme of “Academic features” are being eager to learn and teach, having talking ability, high visual intelligence, intelligent, bookish, having ability to think rapidly, learning rapidly, development of mathematical ability in the early age, high perception, more awareness, extensive vocabulary, reading and writing in the early age. The categories under the theme of “Personal features” are repudiation of folkways, high motivation, hard to be understood, eager to be first, ability to put a mask in places where he/she enters, leader, independent, talking too much, asking questions too much, authentic, expressing oneself well, messy, ambitious, moving too much, kind-hearted, having sense of justice, impatient, getting bored quickly, persistent, exciting, perfectionist, needing rules and disciplines, having confidence, moder-nist, internally controlled, logical, emotional, objecting too much, hard to convince, having his own rights, becoming more mature, having different interests, having a different viewpoint, reacting differently, showing versatile develop-ment, thinking like an adult. The categories under the theme of “Creativity” are high imagination, curious, repartee, witty, finding practical solutions, thinking differently, perfect humour, pedantic. Some examples from the answers of parents are as follows: “Learning rapidly, having an idea and not to hesitate to say his ideas, curious, asking questions too much, having different viewpoint, repudiation of folkways” “A child who is repartee, thinks like an adult when needed, has high perception, is interrogation, curious, makes wit” “He apprehends the subject easily and does the necessary. He speaks like an adult, because having high visual intelligence, he learned reading in the early age. “Children who apprehend easily, think differently, move too much, have a high imagination” “Moving too much, independent, having his/her own ideas, having more awareness, having a developed speech and extensive vocabulary when compared his/her
peers, reading and writing in the early ages, Development of mathematical ability in the early age.” “Expressing oneself well, asking questions too much, speaking too much, objecting too much, hard to convince, researching the reasons of the events, bookish, having his/her own rights, ability to put a mask in places where he/she enters, hard to be understood, having characteristics of a leader and confidence, having high perception and high motivation, having some abilities.” DISCUSSION, CONCLUSION AND SUGGESTIONS The answers which were given for the definition of ‘gifted child’ by parents through considering their own children were group under 3 themes. These are; academic features, personal features and creativity. There are 12 categories under academic features, 36 categories under personal features and 8 categories under creativity.
The categories under the theme of “Academic features” are being eager to learn and teach, having talking ability, high visual intelligence, intelligent, bookish, having ability to think rapidly, learning rapidly, development of mathe-matical ability in the early age, high perception, more awareness, extensive vocabulary, reading and writing in the early age.The categories under the theme of “Personal features” arerepudiation of folkways, high motivation, hard to be understood, eager to be first, ability to put a mask in places where he/she enters, leader, independent, talking too much, asking questions too much, authentic, expressing oneself well, messy, ambitious, moving too much, kind-hearted, having sense of justice, impatient, getting bored quickly, persistent, exciting, perfectionist, needing rules and disciplines, having confidence, modernist, internally controlled, logical, emotional, objecting too much, hard to convince, having his own rights, becoming more mature, having different interests, having a different viewpoint, reacting differently, showing versatile development, thinking like an adult. The categories under the theme of “Creativity” are high imagination, curious, repartee, witty, finding practical solutions, thinking differently, perfect humour, pedantic.
When the results obtained in this study are considered,
this study is parallel with the studies of Lee (1999), Neumeister et al. (2007), Moon and Brighton (2008), Moore (2009), Eraslan Çapan (2010),Akar and Akar (2012), Alkan (2013), Altıntaş and Özdemir (2014) and Özsoy (2014). As for the results, the ‘giftedness’ was defined through the eyes of parents who have gifted children and it was defined precisely with the expressions of parents who closely experience gifted children. This case has great importance as it allows us to have more information about gifted children, to organize educational programs according to these children, to emphasize the outstanding characteristics in gifted children and to get suitable data that can be used during the selection process of gifted children.
The following suggestions can be offered within the scope of this study:
1. Interviews can be conducted with the parents of gifted students for a better analysis of the answers provided by parents. 2. A seminar should be given to families about ‘being a family of a gifted child’. 3. By carrying out similar studies with more families, some demographic variables such as the educational levels of the families and their socio-economic status should be considered. 4. It is recommended to carry out similar studies with both teachers and parents and to compare the results of both studies. Conflict of Interests The authors have not declared any conflict of interests. REFERENCES Akar İ, Akar ŞŞ (2012). İlköğretim okullarında görev yapmakta olan
öğretmenlerin üstün yetenek kavramı hakkındaki görüşleri. Kastamonu Eğitim Dergisi, 20(2):423-436.
Alkan A (2013). Bilim sanat merkezine (bilsem) giden öğrencilerde velilerinin gördüğü farklılıklar. Middle Eastern & African Journal of Educational Research, 5:23-31.
Altıntaş E, Özdemir AŞ (2014). The perceptions of primary school teachers about the term of giftedness. Multidisciplinary Perspectives on Education. Arslan, H, Rata, G, Kocayörük, E & İçbay, M A (Eds). Cambridge Scholars Publishing (p. 39-46). UK.
Ataman A (1998). Üstün zekalılar ve üstün yetenekliler. Süleyman Eripek (Ed.), In Özel Eğitim (p.171-194). Anadolu Üniversitesi Yayınları. From <http://w2.anadolu.edu.tr/aos/kitap/IOLTP/1267/unite11.pdf> (Retrieved on28 August 2013).
Eraslan Çapan B (2010). Öğretmen adaylarının üstün yetenekli öğrencilere ilişkin metaforik algıları. Uluslararası Sosyal Araştırmalar Dergisi, 3(12):140-154.
Altıntaş and İlgün 659 Jarosewich T, Pfeiffer SI, Morris J (2002). Identifying gifted students
using teacher rating scales: A Review of existing ınstruments. J. Psychoeducational Assessment. 20(4):322-336.
Karasu N (2010).Üstün zeka/yetenek, dil ve konuşma bozukluğu, otizm spektrum bozukluğu. Diken İ H, (Ed.), In İlköğretimde kaynaştırma (p. 163-192). Ankara:Pegem Akademi.
Karakurt B (2009). Sınıf yönetiminde üstün zeka ve yetenekli öğrencilere yönelik öğretmen tutumu. From <http://www.egitisim.gen.tr/site/arsiv/35-2/107-sy-yetenekli-ogrenciler.pdf> (Retrieved on 20 May 2011).
Lee L (1999). Teachers’ conceptions of gifted and talented young children. High Ability Stud. 10(2):183-196.
Maitra K, Gosain Y (2009). Revisiting the concept of giftedness and its status in the post modern era. Gifted Education International, 25:318-325.
MEB (2006). Özel eğitim hizmetleri yönetmeliği. From <http://mevzuat.meb.gov.tr/html/26184_0.html> (Retrieved on 3September 2013).
MEGEP (2007). Çocuk gelişimi ve eğitimi üstün zeka ve özel yetenekli çocuklar. Mili Eğitim Bakanlığı. Ankara. From <http://cygm.meb.gov.tr/modulerprogramlar/kursprogramlari/cocukgelisim/moduller/ustunzekaveozelyetenekliler.pdf> (Retrieved on 20 May 2011).
Miles MB, Huberman AM (1994). An expanded source books qualitative data analysis. (2nd edition). London: SAGE publications.
Moon TR, Brighton CM (2008). Primary teachers’ conceptions of giftedness. J. Educ. Gifted. 31(4):447–480.
Moore EJ (2009). Teacher perceptions of academic giftedness in elementary classrooms: A study of metaphors. Unpublished Ph. D. Thesis. University of Cincinnati.
Narimani M, Mousazadeh T (2010). A comparison between the metacognitive beliefs of gifted and normal children. Procedia Social Behavioral Sci. 2:1563-1566.
Neumeister KLS, Adams CM, Pierce RL, Cassady JC, Dixon FA (2007). Fourth-grade teachers’ perceptions of giftedness: Implications for identifying and serving diverse gifted students. Ball State University J. Educ. Gifted. 30(4):479 - 499.
Özbay Y (2013). Üstün yetenekli çocuklar ve aileleri. T.C. Aile ve Sosyal Politikalar Bakanlığı Aile ve Toplum Hizmetleri Genel Müdürlüğü. From <http://www.aep.gov.tr/wp-content/uploads/2012/10/UstunYetenekliCocuklar.pdf> (Retrieved on 18 December 2014).
Özsoy Y (2014). Metaphors of science and art center students, teachers and parents regarding gifted students. Journal of Gifted Education Research, 2(1):74-87.
Patton MQ (1987). How to Use Qualitative Methods in Evaluation. Newbury Park, CA: Sage.
Sak U (2009). Üstün Zekalılar Eğitim Programları. Üstün Zekalı ve Üstün Yetenekli Öğrencilerin Eğitimlerinde Model Bir Program. (1. Baskı). Ankara: Maya.
Yıldırım A, Şimşek H (2008). Sosyal Bilimlerde Nitel Araştırma Yöntemleri. (6. Baskı). Ankara:Seçkin.

Vol. 10(5), pp. 660-674, 10 March, 2015 DOI: DOI:10.5897/ERR2014.2022 Article Number: 75A9C0051120 ISSN 1990-3839 Copyright © 2015Author(s) retain the copyright of this article http://www.academicjournals.org/ERR
Educational Research and Reviews
Full Length Research Paper
Determination of secondary school students’ cognitive structure, and misconception in ecological concepts
through word association test
Elif ÖZATA YÜCEL and Muhlis ÖZKAN
Faculty of Education, Kocaeli University, Turkey.Faculty of Education, Uludağ University, Turkey
Received 27 November, 2014; Accepted 9 February, 2015
In this study, we determined cognitive structures and misconceptions about basic ecological concepts by using “word association” tests on secondary school students, age between 12-14 years. Eighty-nine students participated in this study. Before WAT was generated, basic ecological concepts that take place in the secondary science curriculum were determined. And then these concepts; “Environment”, “species”, “habitat”, “population”, “ecosystem”, “food chain”, “substance cycle”, “biological diversity”, “environmental pollution”, “global warming”, “acid rain” and “greenhouse effect” were determined as keywords. Also, students were asked to construct a related example sentence for each keyword. Analysis of data was done in four steps: Determination of the responses given for the keywords, calculation of the Relatedness Coefficient between the keywords, formation of concept web that put forward the relation for the given responses to keywords, and analysis of constructed sentences for each keyword. In conclusion, this study put forward that most of the students had weak cognitive structure about ecological concepts. The close relations among these concepts with each other could not be built in students' cognitive structure. Most of the students' responses were superficial knowledge acquired in daily life and contained many misconceptions. Although students were aware of environmental problems, they were deficient in scientific information about reasons and effects of these problems. This case shows that we are not sufficient in environmental education and training. Key words: Cognitive structure, ecology, environmental education, misconception, word association test.
INTRODUCTION Understanding how students acquire knowledge and how they construct this knowledge in their mind is always an important issue for science education researchers. Transferring and constructing knowledge to learners’ mind have been tried to represent in terms of cognitive
structure (Tsai, 2001; Tsai and Huang, 2001, 2002; Kurt, 2013, Nakiboğlu, 2008). “Cognitive structure is a hypothetical construct referring to the organization (relationships) of concepts in memory” (Shavelson, 1974b, p. 3).
*Corresponding author. E-mail: [email protected], [email protected]. Authors agree that this article remain permanently open access under the terms of the Creative Commons Attribution License 4.0 International License

Cognitive structures that affect reconstruction of incoming stimuli contain students’ knowledge, and organization of the knowledge (Tsai, 2001). Poor cognitive structures prevent the acquisition of new knowledge meaningfully, and thus students’ academic achievement in the school and ability to apply knowledge to daily life might be influenced (Tsai and Huang, 2002). So it is important to determine students’ cognitive structure about a specific subject or concept before instructional process. Determination of students’ cognitive structure helps teacher to choose appropriate teaching strategies, and helps students to link past experience to new knowledge. Hence it can facilitate students’ conceptual development and conceptual change (Tsai, 2001; Tsai and Huang, 2002).
It is known that students do not come to learn science as they are a tabula rasa; they get the knowledge and ideas in their cognitive structure by the help of their daily experiences related to the physical world (Vosniadou and Ioannides, 1998). These prior knowledge and ideas that students generate are often contradicted with scientific facts. These are called misconceptions (Alparslan et al., 2003; Bahar, 2003). Students have to associate a subject or concept to its implication in daily life and have to structure it using the prior knowledge for a meaningful learning (Bahar, 2003; Tsai and Huang, 2002). Incomplete or wrong prior information might prevent meaningful learning; hence it becomes important to study students’ cognitive structure, and to study how to dissolve determined misconceptions in their cognitive structure (Alparslan et al., 2003; Bahar, 2003). Determination of students’ cognitive structure can expose students’ misconception, too (Tsai, 2001). Thus, it is also important in this respect.
Misconceptions can be classified as follows: preconceived notions, non-scientific beliefs, conceptual misunderstandings, vernacular misconceptions and factual misconceptions (Committee on Undergraduate Science Education, 1997). Preconceived notions are the outcomes of daily experiences. Misconceptions, for an instance, are like as many people believe that since groundwater apparently flows, the underground water must flow too (Brown and Clement, 1991). Non-scientific beliefs include views learned by students from sources other than scientific education such as myths that can cause conflicts with scientific education. Conceptual misunderstandings appear when students, during the scientific education, cannot confront their own preconceived notions and non-scientific beliefs, and fail to resolve conflicts between their beliefs and scientific reality. Some misconceptions such as “cold matter does not contain any heat” or “greenhouse gases exist in the atmosphere as a layer” can be mentioned in this case. Concepts that have different meanings, both in daily life and in science, as in the example of the concept of “work”, are misconceptions caused by the language we
Yücel and Özkan 661 use and they are called vernacular misconceptions. Factual misconceptions are learned at an early age and cannot be changed during the life-time. For example, the concept of the “setting and rising of the sun” can be the cause of a misconception by children who may think the sun is moving. However, children understand the reality of the earth’s revolution around the sun when they grow older (Buluş and Güllü 2008; Committee on Under-graduate Science Education, 1997; Sheparson et al., 2011). Cognitive structure research in the literature about ecological concepts In various studies, students’ poor cognitive structures related to ecology are determined, which are as follows: some students aged 13-15 years think that there is no interaction between living and non-living things in the ecosystem (Adeneyi, 1985). Some students, aged 11-12 years, perceive living things as major components in ecosystems and consider the role of abiotic factors less essential than living things (Prokop et al., 2007); whereas, some college students perceive that the ecosystem consists of only living organisms (Brehm et al., 1986). Also, they have some misconceptions related to population and habitat (Adeneyi, 1985; Özkan et al., 2004; Sander et al., 2006; Jordan et al., 2009).
Munson (1991) asserted that students are unable to comprehend any change in items of the ecosystem that affect the whole system, e.g. they believe that living organisms in the ecosystem can affect each other only if they have relation in food chain. Besides, most of high and secondary school students are not aware of the flow of energy among living organisms and they cannot comprehend the proper energy flow in the food chain (Griffiths and Grant, 1985; Hogan, 2000; Özkan et al., 2004; Yörek et al., 2010).
As remarked by Munson (1991), students are unable to comprehend that different species have different needs for themselves and each species has a different effect in the ecosystem. Palmer (1999) found that some students in age-groups of 11-12 years and 14-15 years have scientifically acceptable knowledge related to ecological role e.g. “one of the roles of tree is to produce oxygen that animals breathe”, but some students also have misconceptions like “bacteria have no role because many animals get sick due to them”, “butterflies have no role, and they only fly around”. Özkan et al. (2004) determined that some 7th grade (aged 12 years) students have misconceptions related to ecological roles such as “decomposers eat dead plants and animals to keep the environment clean”, and “decomposers have no effect on ecosystem because they are too small to be seen by the naked eyes”. Also, Yörek et al. (2010) exhibited similar findings in their study conducted with 9th grade school students and biology teachers.

662 Educ. Res. Rev. Besides the studies of basic ecological misconceptions, there have been various studies carried out on misconceptions in environmental problems. According to Marinopoulos, and Stavridou (2002), some of students aged 11-12 years are unaware that wastes that pollute the air cause both chemical and physical changes in the atmosphere. Further, they cannot comprehend: how acid rain is formed, how it harms the environment and humans both, and how it can have an effect not only in the polluted area but also in farther lands. Also, it has been observed that many secondary and high school students (aged 11-16) have lots of misconceptions, such as acid rain can cause the greenhouse effect and by that food may poison humans, ozone layer keeps the world warm or protects the planet from acid rains, ozone layer depletion causes greenhouse effect, and holes in the ozone layer would allow air to escape into space (Boyes and Stanisstreet, 1997, 2001; Boyes et al,. 1999; Bozkurt and Cansüngü, 2002; Selen et al., 2006). Aydın, and Coşkun (2010) asserted that some of 7th grade (aged 13 years) students define global warming as depletion or dilution of the ozone layer. Moreover, they think that the dilution of the ozone layer is because of the global warming.
There are various techniques to determine these cognitive structure and misconceptions. Extensive research has shown that cognitive structure and misconceptions related with ecology can be determined with various instruments such as open ended questions (Adeneyi, 1985; Brehm et al., 1986; Bishop and Anderson, 1990), multiple choice questions (Bishop and Anderson, 1990; Gallegos, Jerezano and Flores, 1994; Griffiths and Grant, 1985; Yörek et al., 2010), observations and interviews ( Tekkaya, Çapa and Yılmaz, 2000; Tsai and Huang, 2001; Palmer, 1999; Yörek, et al., 2010), likert type scale (Bozkurt and Cansürgü, 2002). Besides these traditional assessment techniques, some alternative assessment techniques are also used such as word association tests, concept maps, concept webs, structured grids, estimation-observation-expression, diagnostic branched tree, drawings and explanations, flow map, two-tier diagnostic tests (Kurt, 2013; Shepardson, et al. 2011, Shavelson, 1974a; Shavelson, 1974b; Tsai, 2001; Tsai and Huang, 2002). Word Association Word association, as asserted in various studies, is an effective technique that is used to determine cognitive structure, misconceptions and to reveal relations between the concepts (Bahar et al., 1999; Bahar and Özatlı, 2003; Ercan et al., 2010; Gunston, 1980; Kurt, 2013; Nakiboğlu, 2008; Shavelson, 1974a, Shavelson, 1974b; Tsai and Huang, 2002). Students recall one or two word responses about the given keyword in a specific length of time in a
word association test (WAT). The diversity of responses given for a keyword is used to determine their under-standing in any subject. An ordered response given for a keyword by a student asserts relations between the concepts in their cognitive structure, and this shows semantic proximity. The closeness between the two concepts in the cognitive structure can be revealed by the responses (Bahar and Özatlı, 2003; Tsai and Huang, 2002; Shevelson, 1974a). For example, suppose, if the word “school” is given to students as a key concept, in response to, “teacher, lesson, book, garden and friend” are the given words by the students. It can be inferred that the relation between the “school and teacher” is closer than the relation between “school and friend” in the student’s cognitive structure. The number of responses related with the key concept “school” is directly proportional to the conceptual relation in the student’s cognitive structure. Ayas (2005) emphasised that both the amount of the students’ responses and the relation of these responses with the keyword is high. This means the cognitive structure is better. However, the quality of responses and the level of association between the relations of two different concepts are more important than the number of responses.
Shavelson (1974a) determined that there are four features in the evaluation of the word association. These are as follows: the number of the responses given to the key concept, the kind of responses, order of responses, and same responses given to two different key concepts (overlapping). In order to understand the number of relations among the concepts scaled that a person relates, the number of responses given for a word is an important clue and sign to determine if the word is understood or not by the person (Bahar et al., 1999; Shavelson, 1974a). However, the kinds of given responses should be taken into consideration. For example, the other student may respond “friend, garden, fun, naughtiness, break time” when he is asked to make word associations with the concept of “school”. According to this, it can be observed that students’ responses are different even the number of responses is equal in the two examples. A variety of responses can be examined from the responses, as first student’s answers have a certain context about the school in which it has both educational and social function, but the second student does not have the same ideas about school’s educational function. The given responses to the keyword should be expected to be associated with the context. However, in the given example, the answer “naughtiness” is an unexpected response. Consequently, it would be better to keep it out of the evaluation. Besides this, Gunston (1980) determined that even word association indicates a relation between the two concepts, but it cannot be fully asserted what the relation is. Although the two different students give the same responses for a keyword, they may structure the relation between the two concepts

differently. In order to overcome this limitedness, Gunston (1980) reorganised Shavelson’s technique, in which, students construct a sentence including keyword and responses after completing the word association. He also determined that this sentence can be used in evaluating cognitive relation (Gunston, 1980). In this way, responses can be evaluated by making correct connection.
Matching responses between two key concepts show level of association between the concepts in student’s cognitive structure. Garskoff and Houston (1963) deter-mined relation between two concepts, as “Relatedness Coefficient” (RC) (Shavelson, 1974b; Bahar et al., 1999). According to this, for example, if P, Q, R and S are responses given for “Concept A”, and same responses are given for “Concept B” in the same order. This means that there is a perfect relation among these two concepts, and their relatedness concept parameter is 1. If there is no overlapping between the two concepts then there is no relation among two concepts, and their relatedness concept parameter is 0 (Shavelson, 1974b; Bahar et al., 1999). Calculation of RC is illustrated in the method.
Bahar et al. (1999) used the concept web which is prepared with the help of Cutting Point (CP) technique for the evaluation of WAT. In this technique, a frequency distribution table for the given responses is prepared for each keyword, then less than 3 or 5 numbers are accepted as CP, which is the number of most repeated response in the table. For example, the word “teacher” is the most frequent answer to the key concept “school”. CP can be accepted as 20 if this response is given by 25 students. Responses that have the frequency above 20 constitute the first line of the concept web. Responses below this frequency number are recorded to the upper part of the concept web and the concept web is completed by decreasing CP periodically in the same way (Figure 1a, 1b, 1c and 1d). From the concept web, students’ cognitive structure related with the keywords, relationship of the concept with other concepts and the responses, and misconceptions can be determined. Purpose An effective environmental education plays a big role in realising the human activities that are the underlying causes of the environmental problems. It is also essential to understand the environment as a whole by leaving the anthropocentric idea. Difficulties for students in comprehending the complexity and the intricate structure of the nature might be very crucial in order to understand, protect, and make the environment better. Thus, in this study, we determined cognitive structures and misconceptions about basic ecological concepts by using “word association” tests on secondary school students (ages 12-14 years).
Yücel and Özkan 663 METHODOLOGY Working group, data collection tool and data collection: In Turkey, environmental education is taught in different units of biology, social studies, and science lessons. But, important ecological subjects are undertaken especially in the science lesson at secondary school level. Thus, eighty-nine secondary school students, age between 12-14 years, participated in this study at the City Centre of Kocaeli, in the North-west of Turkey. To determine students’ cognitive structures and misconceptions about ecological concept, Word Association Test (WAT) was used. Before WAT was generated, basic ecological concepts that took place in the secondary science curriculum were determined. Then these concepts; "environment", "species", "habitat", "population", "ecosystem", "food chain", "substance cycle", "biological diversity", "environmental pollution", "global warming", "acid rains" and "greenhouse effect" were identified as keywords. Each individual key word was listed separately on each page where ten lines were left below for possible responses. In order to prevent confusion every keyword was written at the beginning of each line. Bahar et al. (1999) explained that repeating keywords in every line, the chain effect, in other words preceding response prevents recalling background of the keyword. Also, students were asked to construct a related example sentence related with the given keyword in order to lower WAT’s limitedness to remark correctness of relations among the given responses after every key concept. An example page layout is given below. Environment: …………………. Environment: …………………. Environment: …………………. Environment: …………………. Environment: …………………. Environment: …………………. Environment: …………………. Environment: …………………. Environment: …………………. Environment: …………………. An example sentence related with environment:…………………………………………..
It was determined that 30 s should be given for each of the keyword (Bahar et al., 1999; Nakiboğlu, 2008; Timur, 2012). However it was suggested to be more appropriate for secondary school students that the duration should be 60 s (Ercan et al., 2010). In this study, students age-group 12-14 years were considered and duration of 60 s was considered. However, the students constructed the sentences related with the key concept almost in 30 s. This study was conducted in December 2011. Students were introduced with WAT before the commencement of the study and an example was conducted with word “school”. Actual participation was performed after being sure that all the students have understood their role in the study. Analysis of data: Analysis of data was done in four steps: (1) determination of the responses given for the keywords, (2) calculation of the Relatedness Coefficient between the keywords, (3) formation of concept web that put forward the relation for the given responses to keywords, (4) analysis of constructed sentences for each keyword.
Primarily, for each keyword, response of each student is listed. Then, the number of repetition is determined for every response given for each keyword in the research group.
Garskoff and Houston (1963) used Relatedness Coefficient (RC) to determine the relation among keywords with one another (Bahar et al., 1999; Shavelson, 1974b). In RC (Table 1)

664 Educ. Res. Rev.
formula, 1)(
2nBA
RC, both the general responses that will be
displayed in two keywords and the rank order of these responses are taken into account. Calculation of RC is displayed in the example below.
The rank orders of responses are sequenced according to the increased frequency, so lower one is considered as 1. According to the Table 1, there are five different responses to the keyword “greenhouse effect” and six different responses to the keyword “global warming”. The responses: greenhouse gases, carbon dioxide and temperature rise are present in both the lists. ‘A’ is the rank order of common response in the first list; ‘B’ is the rank order in the second list. ‘n’ is the number of responses in the list containing several keywords. RC in keywords of “greenhouse effect” and “global warming” is calculated as shown in the example:
39.01)123456(
)31()62()54(1)(
2222222nBA
RC
Students’ responses that have the misconception are excluded from the study during the calculation of RC for the concepts. Students’ sentences related with the key concepts are analysed.
In forming concept web, Cut-off Point (CP) technique of Bahar et al. (1999) is used.
Finally, students’ sentences about the keyword are subjected to content analysis. Sentences constructed by students are separated into different themes like: correct scientific knowledge (CSK), affec-tive knowledge (AK), examples from daily life and/or smattering (EDL), misconception (MC) and vain/irrelevant/meaningless (VIM). Validity and reliability: The keywords used in WAT have a key role in understanding the environmental subjects, and are part of the secondary science curriculum. After that, opinions of a biology professor and a teacher who had ten years experiences in science teaching were obtained to check the content validity.
All keywords were placed on separate pages. Also, responses to be given for a keyword were set to be written in different lines. Thus, it was aimed to be highly reliable that the given responses do not affect each other and the other keywords.
During the listing process of the given responses to the keywords, written sentences were inspected; and irrelevant responses were left out from the analysis. For example, for the keyword “population”, a student answered: bicycle, pumping and air, and the example sentence was: “My friend’s bicycle tire got flat and we pumped air”. Therefore, the given response was not added to the analysis about population, and also this sentence was considered as in the theme of vain/ irrelevant/meaningless (VIM).To protect reliability two researchers encoded data independently about the sentences of responses. Data were classified according to their relation with each other; and sketch themes were determined. Then, the real themes were constructed after getting a consensus among the researchers.
And inter-rater reliability value was 97.5 %. Based on Miles and Huberman’s criterion, which is a consistency value above 0.70, is acceptable, our inter-rater reliability is quite high. Also, some examples from the students’ sentences are presented. RESULTS AND DISCUSSION Analysis of the number of given responses to the keywords: When student’s responses to the keyword analysed, it was observed that the number of responses
given to the keywords is 163 (Table 2). Given responses for the keywords “environmental pollution” and “global warming” were observed more than others. Under-standing the relation between the concepts scale what the person relates; the number of responses given for a word is an important clue and sign that the meaning of that word understood by that person (Shavelson, 1974a; Shavelson, 1974b; Bahar et al., 1999). Thus, it can be said that students can structure the concepts of environmental pollution and global warming better. It is observed that these two issues have always remained on the agenda with recently increasing environmental problems.
However, the number of responses given to the keywords "biological diversity" and "population" were lower than others. In word association test, not only number of responses but also accuracy of these responses is also important for determination of students’ cognitive structure. When the responses for the keyword were inspected, it was seen that 23 of total responses were misconception (Table 2). Most of the misconception emerged keywords “substance cycle” and “greenhouse effect”.
This means that these concepts were not constructed properly in students’ cognitive structure. Analysis of the relatedness coefficients between keywords: While determining students’ cognitive structure, besides the number of students’ responses, it is also important to put forward the relations between concepts in the students’ cognitive structures (Bahar et al., 1999; Kurt et al., 2013; Shavelson, 1974a). In a WAT, number of overlapping responses, and rank order of these responses are indicators of the semantic proximity of the keywords (Shavelson, 1974a; Bahar et al., 1999). In this study, the semantic proximity of the keywords was determined through Garskoff and Houston’s relatedness coefficients (RC) which is calculated based on overlapping responses and rank order of these responses (Table 3).
Calculated RC regarding the responses of the students indicated that keywords in cognitive structures related to each other were very limited (Table 3). According to Table 3, the relationships between keywords Population-Biological Diversity were most close in the students’ cognitive structure (RC=0.37). A relation though not strong (RC=0.22) was observed in the concept: Habitat–Environment and Species-Greenhouse Effect. Weaker relations (0.10 < RC < 0.20) were observed between: Species–Habitat, Species–Population,, Species–Biological Diversity and Acid Rain–Substance Cycle. After considering other RCs ( 0.10), it is possible to say that students almost could not bring in any relation between these concepts. Kurt et al. (2013) asserted that conceptual understanding is not only to know definition of

Yücel and Özkan 665
Figure 1a. Keyword concept web formed according to frequencies (CP 45 and above).
Figure 1b. Keyword concept web formed according to frequencies (CP 35-44).
Figure 1c. Keyword concept web formed according to frequencies (CP 25-34).

666 Educ. Res. Rev.
Figure 1d. Keyword concept web formed according to frequencies (CP 10-24).
Table 1. An example table for the frequency and rank order of the given answers.
Response f Rank order Response f Rank order Global Warming 20 5 Carbon dioxide ** 20 6 Greenhouse Gases* 17 4 Greenhouse Gases * 18 5 Fossil Fuels 10 3 Atmosphere 12 4 Carbon dioxide** 8 2 Temperature rise *** 10 3 Temperature rise *** 3 1 Water vapour 5 2 Melting of Poles 2 1
Key word = Greenhouse Effect; Keyword = Global Warming. */**/*** common response for the two keywords. the concept, but also to be aware of relations between concepts especially in biology courses which contain the micro and macro relations among concepts. Ecological concepts have a close relation with each other, inability to relate them correctly, as a consequence, prevents students from understanding the environment holistically. Analysis of the concept web: For a better understand-
ing of students’ cognitive structure about ecological concepts, the concept web was prepared (in Figure 1.a, 1.b, 1.c, and 1.d). It was figured out according to the students' responses to the keywords from higher to lower frequency. Thus, Figure 1.a is the strongest level of the web and Figure 1.d is the weakest level of the web.
Responses of CP 45 and above were given to “environ-ment”, “environmental pollution”, “habitat” and “species” (Figure 1.a), and the number of these responses was

Yücel and Özkan 667
Table 2. The number of responses given to the keywords The keyword Number of responses Number of misconceptions Environmental Pollution 25 - Global Warming 24 2 Environment 21 - Habitat 20 - Food Chain 20 1- Substance Cycle 17 6 Greenhouse Effect 16 6 Species 14 3 Ecosystem 14 3 Acid Rain 13 1 Biological Diversity 7 - Population 7 1 Total 163 23
restricted. For example tree and flower/hay/grass, which are only the living component of the environment, are given as responses related to “environment”. When the responses of CP 35–44 were analysed, it was observed that responses added about keywords as “global warming” and “food chain”, and the number of responses increased even less (Figure 1.b).
CP 25–34 for keywords “greenhouse effect”, “substance cycle” and “acid rain” was added. The relation among keywords was formed only in “environment” and “environmental pollution”. The students were not able to form a relation among other keywords yet. Responses as solid, liquid, gas about the “substance cycle” showed that students were confused between the substance cycle and the change of state (Figure 1.c).
While all of the keywords appeared only at a weakest level of the concept web (CP 10-24), the number of indicated responses was increased. In addition to the relation among the environment-environmental pollution appeared in the previous step, relation among the keywords as species-population and habitat-biological diversity could also be observed (Figure 1.d).
It was observed that students confused the concepts of the greenhouse effect and the greenhouse cultivation. While the responses of animals and plants were given for the keyword “biological diversity”, micro-organisms could not be observed (Figure 1.d). In responses given for the keyword “environment”, non-living items except air and micro-organisms from the living components were included at all. The keyword “food chain” was confused with the balanced diet. This outcome shows parallelism with the studies of Griffiths and Grant (1985), and Munson (1991). Besides this, the responses sun, energy, carnivore, herbivore, etc. were not given to the keyword “food chain”. Gallegos et al. (1994) determined that students thought that while the
food chain consists of prey and predators, it does not include producers. In contrast, in our study, it was observed in the concept webs that students gave “plants” as response for the keyword “food chain”, but they were not aware of “prey” and “predator” (Figure 1.d).
“Volcanoes” as natural reasons of “acid rain” were given as a response, but there were no examples given about the reasons of human origin by the students. Besides, a relation was suggested between the acid rain and fizzy drinks. In this step, another misconception appeared about the substance cycle indicating that there was confusion between the substance cycle and recy-cling. The responses about the variety of environmental pollution and reasons given were in CP range of 10–24. As associating environmental pollution with human, they also associated it with animals. The keyword “environ-mental pollution” was not associated with the keywords “acid rains”, “greenhouse effect” and “global warming” (Figure 1.d).
The student’s responses, even drawn in concept webs (Figure 1.a, 1.b, 1.c, and 1.d) proved that there was a weak relation among the ecological concepts displayed in Table 3. First conceptual relation Environment-Environmental Pollution only appeared in 3rd step (Figure 1.c). However, these two concepts’ RC was only 0.13 (Table 2). Other relations that appeared in the concept web was in 4th step (Figure 1.d) that was observed between the Species-Population (RC=0.19) and Habitat-Biological Diversity (RC=0.03). These findings showed that students could not conceive any relation between these concepts. If ecological concepts do not relate in students’ mind in the early grades, it might be difficult to repair this cognitive lack and develop cognitive structure.
Upon inspection of the concept webs (Figure 1.a, 1.b, 1.c, and 1.d), another issue appeared that most of the students’ responses were not scientific information, but

668 Educ. Res. Rev.
Table 3. Relatedness coefficients of keywords.
Spec
ies
Hab
itat
Popu
latio
n
Ecos
yste
m
Bio
logi
cal
Div
ersi
ty
Env
iron.
Po
llutio
n
Glo
bal
War
min
g
Aci
d
R
ains
G
. H
ouse
Ef
fect
Food
C
hain
Subs
tanc
e C
ycle
Environment 0.01 0.26 0.03 0.05 0.03 0.13 0.03 0.03 0.06 0.10 0.01 Species - 0.13 0.19 0.22 0.19 0.03 0.03 0.01 0.22 0.10 0.00 Habitat - - 0.04 0.08 0.03 0.06 0.08 0.04 0.04 0.04 0.02 Population - - - 0.08 0.37 0.01 0.02 0.02 0.02 0.03 0.00 Ecosystem - - - - 0.06 0.02 0.05 0.02 0.06 0.03 0.00 Biological Diversity - - - - - 0.01 0.01 0.00 0.05 0.04 0.00 Environmental Poll. - - - - - - 0.04 0.05 0.01 0.03 0.02 Global Warming - - - - - - - 0.04 0.03 0.02 0.03 Acid Rain - - - - - - - - 0.02 0.02 0.12 Greenhouse effect - - - - - - - - - 0.02 0.04 Food Chain - - - - - - - - - - 0,00
came from instances occurring in the daily life. Responses about ecosystem, biological diversity, population and the greenhouse effect were rare. It means that students did not have a deep understanding about these subjects in their cognitive structure (Shavelson, 1974a; Shavelson, 1974b; Bahar et al., 1999; Nakiboğlu, 2008; Gunston, 1980). For example “Science and technology/biology” related responses which were given to the keywords "population" and "greenhouse effect" showed that there were deficiencies in students’ cognitive structure even though they were aware of these concepts related with science.
It was found, upon analyses of keywords “food chain” and “acid rain” that students were not able to figure out the theoretical structure in their minds when the responses were given for these words. It was seen that studies of Marinopoulos and Stavridou (2002), Özkan et. al. (2004); Boyes and Stanisstreet (2001), Selen Darçın et. al. (2006) are support by this result, too.
The given responses related with the keyword “environ-ment” were as follows: cigarette butt, mathematics, freedom, etc.; responses related with the keyword “species” were computer, jewellers, sport, etc.; responses related with the keyword “habitat” were sound and paper; responses related with the keyword “greenhouse effect” were space and wind; all of these examples showed that students could not relate the ecological concepts in their mind correctly. Analysis of the sentences: Deficiency in cognitive structure can be observed in students’ sentences about the keywords. 32.1% of sentences that students constructed about the keywords were evaluated as vain/irrelevant/meaningless. For example, “I did not understand the meaning of population” (KW=population),
“Science course is fun” (KW=population), “I like milk and dairy products” (KW=biological diversity); sentence like these were placed in this category (Table 4).
It seems that most of the sentences (26.3%) constructed were from daily life or smattering (EDL), for example, “I saw many flowers” (KW=species); “We are taught the substance cycle in the science lesson” (KW=substance cycle), “World is trying to cope with global warming” (KW=global warming), etc. Connel et al. (1999) indicated that some young people (aged 16-17 years) think personal experiences are most trusted source of environmental information. Our findings concluded that most of the students used their knowledge gained from daily life experiences, not based on scientific information, in their sentences. Only 10.3% of the sentences contained correct scientific knowledge (CSK) (Table 3). Maximum sentences that contain CSK were for keyword “Habitat” (34.8 %); fewer sentences that contain CSK were for “Biological Diversity” (3.4 %), “Environment” (4.5 %) and “Acid Rain” (4.5 %). It is remarkable that students’ sentences about “population” contained no CSK. Sentences containing CSK are given in Table 5. The term “habitat” is not used in daily life (in Turkish). Thus, the students knew it only in scientific context, so number of sentences which included CSK was highest for this keyword. However, the terms “diversity”, “environment”, etc. might be used in different meaning in daily life and science. So this might cause conflicts in students’ cognitive structure. As well, vernacular misconceptions might also be a problem. Similarly, Jegede and Aikenhead (1999) determined that clashes between students’ life-words and science prevent them from learninh science effectively and meaningfully.
12% of the students made sentences containing affective knowledge (AK) such as “I like environment”

Yücel and Özkan 669
Table 4. Frequencies according to category of sentences related with keywords
The keyword (KW) CSK AK EDL MC VIM f % f % F % f % f %
Environment 4 4.5 49 55.1 24 27.0 10 11.2 2 2.2 Species 11 12.4 4 4.5 51 57.3 15 16.9 8 9.0 Population 0 0 0 0 9 10.1 11 12.4 69 77.5 Habitat 31 34.8 3 3.4 26 29.2 11 12.4 18 20.2 Ecosystem 5 5.6 4 4.5 9 10.1 16 18.0 55 61.8 Food Chain 18 20.2 7 7.9 19 21.3 28 31.5 17 19.1 Substance Cycle 5 5.6 5 5.6 20 22.5 19 21.3 40 44.9 Biological Diversity 3 3.4 8 9.0 10 11.2 9 10.1 59 66.3 Environmental Pollution 14 15.7 30 33.7 34 38.2 7 7.9 4 4.5 Global Warming 10 11.2 12 13.5 30 33.7 26 29.2 1 12.4 Greenhouse Effect 5 5.6 2 2.2 4 4.5 42 47.2 36 40.4 Acid rains 4 4.5 1 1.1 44 49.4 16 18.0 24 27.0 Total 110 10.3 128 12.0 281 26.3 190 17.8 343 32,1
CSK, Correct Scientific Knowledge; AK, Affective Knowledge; EDL, Examples from Daily Life or Smattering; MC, Misconception; VIM, vain/ irrelevant /meaningless.
Table 5. Examples containing correct scientific knowledge that students made. The keyword Example sentence
Environment There are lots of animal species in our environment. Environment is a place in which there are natural items such as rose, bird, tree, rock.
Species Diversity in species makes us different. Different species increase biological diversity. Species breed simply in class of their own.
Habitat Habitat means living space. Every living organism has its own living space.
Ecosystem Polar bears live in polar ecosystem. The Earth comes to my mind on the count of ecosystem.
Food Chain Lions are on the top of the food chain. Food chain means; creatures’ eating each other in order to feed.
Substance Cycle It rains thanks to substance cycle. Substance cycle does not exist in all substances.
Biological Diversity Biological diversity occurs thanks to adaptation.
Environmental Pollution If the environmental pollution cannot be prevented our living space dies out. Unplanned urbanisation causes environmental pollution.
Global Warming Icebergs are melting because of global warming. Greenhouse Effect Greenhouse effect causes global warming. Acid Rain Acid rains may occur, after the eruption of a volcano.
(KW=environment), “protect ecosystem” (KW=ecosystem)”, “biological diversity is crucial” (KW=biological diversity) (Table 4). The sentences containing misconceptions were 17.8%. The sentences containing the highest misconception were related with the keywords “greenhouse effect” (47.2%), “food chain” (31.5%), “global warming” (29.2%), and “substance cycle” (21.3%). Less misconception appeared in sentences
related with “environmental pollution” (7.9%), “biological diversity” (10.1%) and “environment” (11.2%) (Table 4).
When the sentences were inspected extensively, it was observed that students had many misconceptions about keywords (Table 6). It is inferred that students could not comprehend the complex structure of the environment. By the study of Özkan et al. (2004), it has been observed that there are similar misconceptions as the environment

670 Educ. Res. Rev. is formed only from living organisms and plants. Besides, remarking the occurrence of the sun in the environment is confused with the concept of ecosystem.
When the misconceptions about species were inspect-ed, it was observed that students confused the concept of species with subspecies, kingdom, phylum and genus. They thought species means gender. Besides, they have confusion about the concept “species” with the vernacular word “kind”. Also, Munson (1991) remarked that students cannot understand the relation that different species have their own needs and each species has different effects on ecosystem.
Another misconception is remarked in the concepts of population and inhabitants. Students could not notice that population is a biome formed from the same species inhabiting in an area. They had the misconception that all the plants and animals together is the population. This output is in agreement with the findings of Adeneyi (1985) and Tekkaya et al. (2000).
It is also remarked that students had misconceptions related with the habitat such as: it is a place that animals live; it means struggle for life; it is only a forest, and it is a place that only fish and animals live. Besides, it was observed that the concept of ecosystem was confused with habitat, biological diversity and food chain in the sentences. Also, studies performed by Adeneyi (1985), Sander et al. (2006), and Jordan et al. (2009) determined that students have misconceptions like confusing habitat with the ecosystem, and it belongs only to terrestrial/aquatic animals.
In the sentences formed about the keyword “ecosystem”, emphasis on systems that formed organs of living organisms and space showed that boundaries of the ecosystem could not be recognised. Students had a misconception like: ecosystem is formed only by living organisms. This outcome displays parallelism with the studies of Brehm et al. (1986), and Prokop et al. (2007). Another outcome is that micro-organisms as living organisms and non-living members of the ecosystem could not be recognised. Similarly, Adeneyi (1985) put forward that students are not aware of the relation among living and non-living things of ecosystem. Also, Palmer (1999), and Yörek et al. (2010) put forward that students cannot realise the role of bacteria and decomposers.
Students have confusion about concepts of food chain, food web and healthy diet. Also, a number of articles on this subject state that concept of food chain and food web is confused (Griffiths and Grant, 1985; Munson, 1991). In this study, when sentences were inspected it was observed that students did not notice food chain is formed by producers, consumers, decomposers and a flow of energy that starts from the sun. Also, Griffiths and Grant (1985), Hogan (2000), Özkan et al. (2004) and Yörek et al. (2010) determined that students could not comprehend that energy follows in the food chain.
The change of state of substance cycle in the eco-
system and substance cycle related to water cycle was also confused. Furthermore, following misconceptions were observed too: substance cycle is change of state; biological diversity occurs only in animals and plants, and human beings are entirely different from these creatures.
Misconception that students related to the environ-mental pollution was “only garbage that is thrown away causes environmental pollution”, and they had no information about other kinds of pollutants that cause serious issues. It was also observed students had inadequate information about the kinds of environmental pollution. When their sentences were analysed, it was apparent that they had misconceptions like: global warming causes depletion of the ozone layer, melting of icebergs causes global warming, or global warming is effective only in a certain area, and it is relevant to seasons. Similar outputs are remarked in studies of Aydın and Coşkun (2010) and Selen Darçın et al. (2006). Most observed misconception about the greenhouse effect is its confusion with green housing. Study of Shepardson et al. (2011) supports these findings. According to the same study, most of the students explain greenhouse effect as solar rays or heat that come from the sun. They also thought that greenhouse is a layer of gas that is not venting to atmosphere and this layer is sending these solar rays back to the earth which consequently causes heating. Besides, other misconcep-tions were also observed, e.g. it is the depletion of the ozone layer or the cause of the depletion of the ozone layer. This outcome is similar with the studies of Boyes and Stanisstreet (1997, 2001), Boyes et al. (1999), Bozkurt and Cansüngü (2002) and Selen Darçın et al. (2006).
Misconceptions among students for both, in the formation of acid rain and its effects, were observed. They believed that acid rain is formed only because of volcanoes and it burns and poisons the things it touches. In their studies, Marinopoulos and Stavridou (2002) put forward that students could not comprehend that acid rain is formed because of contaminators that can be both physical and chemical, and effective above the polluted areas. These misconceptions show that students confuse environmental problems with one another. For example, they think “greenhouse effect is the same thing as acid rain” as determined in the studies of Bozkurt and Cansüngü (2002) and Selen Darçın et al. (2006). Conclusion In conclusion, this study, which was held by using word associations, put forward that most of the students had weak cognitive structure and lots of misconceptions about ecological concepts. The close relations among these subjects with each other could not be built in students’ cognitive structure. Although students were

Yücel and Özkan 671
Table 6. Students’ sample sentences containing misconceptions
The keyword Sample sentences
Environment
A place where trees and creatures live. Laws of nature come to mind on the count of environment. Groups of plants are formed by forests. Composed of human, nature and flowers. A healthy place formed of plants, tress and the sun.
Species
Every species has its own species. There are different species of animals. For example, reptiles, mammals. Three kinds of species: humans, animals, plants. There are many genera of creatures on earth. Man and woman are species
There are many plants, animals and human on the Earth.
Population
Population is increasing gradually. All creatures are in a population. Population forms society. Animals are population.
Habitat
It is a place that creatures live. Habitat is a cave and bears live in there. Place that animals live. Habitat is a forest. Animals and fishes live in a habitat.
Ecosystem
Ecosystems are not intertwined. Ecosystem is made by planets. Humans form an ecosystem. Ecosystem is living organism’s diversity. Ecosystem is a living space Living organisms form ecosystem by eating each other.
Food Chain
We should have a regular diet to be healthy. If the food chain disappears, life becomes difficult. Most of the animals are carnivore. Food chain is formed by animals and human beings. Human beings and animals’ food chain is different. Food chain is a cycle in which one living organism eats the other.
Substance Cycle Substance cycle occurs by melting, freezing and evaporation. Paper and plastic recycling is made by machines.
Biological Diversity Animals and plants form the biological diversity. Human beings are very different from others.
Environmental Pollution Throwing butchered animals’ organs away causes environmental pollution. Pollution is separated into three parts; environmental, water and air pollution. Environmental pollution means there is garbage everywhere.
Global Warming Global warming may increase in summer. Global warming occurs because of melting icebergs. There is global warming in America.
Greenhouse Effect Greenhouse effect is the absence of the ozone layer. Greenhouse effect depletes the ozone layer. We can grow some of the fruits and vegetables faster thanks to the greenhouse effect
Acid Rain
Acid rain is poisoned. Acid rain burns things that they touch. Volcanoes erupt, then mixed with rain and this make people ill. Acid rains would not happen if there were no volcanoes.

672 Educ. Res. Rev. aware of environmental problems, they were deficient in scientific information about reasons and effects of these problems. They were not conscious of environmental problems whose effects are far and wide. This case shows that we are not sufficient in environmental education and training.
Difficulties in environmental education may emerge because of the quality and content of the curriculum and course books, which does not comply with the goals and objectives of environmental education, and gives importance to the theoretical and rote learning rather than practical education (Atasoy and Ertürk, 2008). Some difficulties in the way of an effective environmental education can be summarised as follows: explanation inconsistency of goals and principles in preparing curriculum; environmental activities are not practiced because of the need for equipment, and lack of expert teachers in environmental education (Gökdere, 2005). The other problem in the environmental education is school active-ties. There are various, but not adequate for effective environmental education. These are also important factors in environmental education: teachers as the implementers of the curriculum, their level of pedagogical content knowledge regarding the environment, guidance from teachers and parents, and news regarding the environment in the media (Erdoğan and Uşak, 2009). Hudson (2001) determined that today’s adult had more opportunities than today’s children to interact with nature directly in their childhood, but today's children can access more information about the environment through TV (documentaries, nature shows, etc.), online resources, CD-ROM, etc. However, this new information sources are not considered in the environmental education curricula. Curricula must provide a continuum of opportunities from online to hands-on (Hudson, 2001).
Most of the misconceptions determined in this study were in the “conceptual misunderstandings” category, for instance, confusions about substance cycle with the change of state, incomprehension of boundaries of the ecosystem, confusion about the concept of species, subspecies, kingdom, phylum and genus. In addition, “factual misconceptions” were frequently observed in the study. Factual misconceptions of the students, such as global warming affects only a region, environmental pollution is formed of only litter, environment consists of only animals, plants, and trees, often arise in early age because of the conversation of daily life, misinterpretation of news and what they heard, etc. Finally, in this study, several vernacular misconceptions, such as population means inhabitants, greenhouse effect means greenhouse cultivation, species means sort in colloquial language, were observed. In order to restructure their knowledge with scientific information, firstly, students’ misconceptions should be determined and classified. After that, these students should be made aware of the
misconceptions (Committee on Undergraduate Science Education, 1997). In this way, the students can be questioned for information and restructure their knowledge under the control of their teachers. IMPLICATIONS 1. This study shows that students had a week cognitive structure and had no scientific knowledge about ecolo-gical concepts. Most of the students’ responses were superficial knowledge acquired in daily life and contained many misconceptions. To work things out, teachers should consider existence of such misconceptions and reinforce students’ daily knowledge with scientific knowledge during the learning period. 2. Teachers’ should keep misconceptions in mind, not only before the education but also during the education period. It is important to correct misconceptions and prevent new ones to occur. Hence, it is important for teachers to have pedagogic infrastructure on determi-nation and elimination of misconceptions during the pre-service and in-service training. 3. Priority should be given to studies that determine effective teaching methods for improving students' cognitive structure, and break down the misconceptions. Developing effective teaching materials by various activities and experiments is also essential to provide rich teaching material to teachers. 4. It was observed that students’ level of affective knowledge about the environment and environmental problems was high. This sensibility should be used for removing students’ deficiencies about scientific fundamentals. 5. Environmental subjects and concepts have a close relation with each other. In elementary curricula, this close relation must be taught correctly, and subjects must be organised according to students’ comprehensive environments’ holistic structure. During the organisation of environmental subjects in curriculum importance of extra-curricular activities should also be kept in mind. Such extra-curricular elements can include, but are not limited to, visuals; such as documentaries, posters; real life items such as magazines, newspapers, news. They should be used to reinforce the students’ knowledge about the subject. 6. Studies determining cognitive structures, and misconceptions in biological diversity, and substance cycle are extremely restricted in the literature. More studies should be carried out for these subjects to make students’ problems clearer. 7. In this study, it has been observed that word association is an effective method to determine cognitive structures and misconceptions. Word association technique can be used in different concepts, subjects and fields.
LIMITATIONS This study aimed to put forward that students' conceptua-lization of basic ecological concepts. Word association could not exhibit the whole understanding of ecology and ecological consciousness. For example we could not determine that students are aware of the cause and effect relationship in the ecosystem or not. This was not the aim of this study, but following studies should focus on this aspect. Conflict of Interests The author has not declared any conflict of interest. REFERENCES Adeniyi EO (1985). Misconceptions of selected ecological concepts held
by some Nigerian students. J. Biological Educ. 19(4):311–316. doi: 10.1080/00219266.1985.9654758E
Alparslan C, Tekkaya C, Geban Ö (2003). Using the conceptual change instruction to improve learning, J. Biological Educ. 37(3):133-137. doi: 10.1080/00219266.2003.9655868.
Atasoy E, Ertürk H (2008). İlköğretim öğrencilerinin çevresel tutum ve çevre bilgisi üzerine bir alan araştırması. Erzincan Eğitim Fakültesi Dergisi, 10(1):105-122. Retrieved from http://eefdergi.erzincan.edu.tr/article/view/1006000671
Ayas A (2005). Kavram öğrenimi [Learning Concept]. In Çepni, S. (Ed). Fen ve teknoloji öğretimi [Teaching Science and Technol. (pp.65-90). Ankara: PegemA Yayıncılık.
Aydın F, Coşkun M (2010). Global warming perceptions of primary education 7th grade students in Turkey. World Appl. Sci. J. 10 (4):426–432. Retrieved from http://idosi.org/wasj/wasj10%284%29/9.pdf
Bahar M (2003). Misconceptions in biology education and conceptual change strategies. Educ. Sci. Theory Practice 3(1):55-64. Retrieved from https://edam.com.tr/kuyeb/en
Bahar M, Özatlı NS (2003). Kelime iletişim test yöntemi ile lise 1. sınıf öğrencilerinin canlıların temel bileşenleri konusundaki bilişsel yapılarının araştırılması. Balıkesir Üniversitesi Fen Bilimleri Enstitüsü Dergisi. 5(2):75–85. Retrieved from http://fbe.balikesir.edu.tr/dergi/
Bahar M, Johnstone AH, Sutcliffe RG (1999). Investigation of students' cognitive structure in elementary genetics through word association tests. J. Biological Educ. 33(3):134–141. doi: 10.1080/00219266.1999.9655653
Bishop, B. A. & Anderson, C. W. (1990). Student conceptions of natural selection and its role in evolution. J. Res. Sci. Teach. 27(5):415–427. doi: 10.1002/tea.3660270503
Boyes E, Stanisstreet M (1997). Children's models of understanding of two major global environmental issues (ozone layer and greenhouse effect). Res. Sci. Technol. Educ. 15(1):19-28. doi: 10.1080/0263514970150102
Boyes E, Stanisstreet M (2001). School students’ ideas about the “greenhouse effect”. Canadian J. Environ. Educ. 6(1):77-101. Retrieved from http://cjee.lakeheadu.ca/index.php/cjee/article/view/289
Boyes E, Stanisstreet M, Papantoniou VS (1999). The ideas of Greek high school students about the “ozone layer”. Sci. Educ. 83(6):724–737. doi: 10.1002/(SICI)1098-237X(199911)83:6<724::AID-SCE5>3.0.CO;2-P
Bozkurt O, Cansüngü Ö (2002). İlköğretim öğrencilerinin çevre eğitiminde sera etkisi ile ilgili kavram yanılgıları. Hacettepe Üniversitesi Eğitim Fakültesi Dergisi 23:67-73. Retrieved from http://www.efdergi.hacettepe.edu.tr/
Brehm S, Anderson CW, DuBay J (1986, June). Ecology: A teaching
Yücel and Özkan 673
module (Occasional Paper no. 94). Retrieved from http://www.eric.ed.gov/PDFS/ED273445.pdf
Brown D, Clement J (1991). Classroom teaching experiments in mechanics. In Committee on Undergraduate Science Education (1997). Science teaching reconsidered a handbook. National Washington, D.C.: Academy Pres
Buluş Kırıkkaya E, Güllü D (2008). Fifth grade students’ misconceptions about heat-temperature and evaporation – boiling. Elementary Educ. Online, 7(1):15-27. Retrieved from http://ilkogretim-online.org.tr/vol7say1/v7s1m2.pdf
Committee on Undergraduate Science Education (1997). Science teaching reconsidered a handbook. National Washington, D.C.: Academy Pres
Connel S, Fien J, Lee J, Sykes H, Yencken D (1999). If it doesn't directly affect you, you don't think about it’: A qualitative study of young people's environmental attitudes in two Australian cities. Environ. Educ. Res. 5(1):95-113. doi: 10.1080/1350462990050106
Ercan F, Taşdere A, Ercan N (2010). Kelime ilişkilendirme aracılığıyla bilişsel yapının ve kavramsal değişimin gözlenmesi. J. Turk. Sci. Educ. 7(2):136–154. Retrieved from http://www.tused.org/internet/tused/default13.asp
Erdoğan M, Uşak M (2009). Curricular and extra-curricular activities to develop the environmental awareness of young students: A case from Turkey. Educ. Sci. 11(1):73-86. Retrieved from http://hrcak.srce.hr/
Gallegos L, Jerezano M, Flores F (1994). Preconceptions and relations used by children in the construction of food chains. J. Res. Sci. Teach. 31(3):259–272. doi: 10.1002/tea.3660310306
Garskoff BE, Houston JP (1963). Measurement of verbal relatedness: an idiographic approach. Psychological Review 70(3):277-288. in Bahar, M.; Johnstone, A. H. and Sutcliffe, R. G. 1999. Investigation of students' cognitive structure in elementary genetics through word association tests. J. Biological Educ. 33(3):134–141. doi: 10.1080/00219266.1999.9655648
Griffiths AK, Grant BAC (1985). High school students’ understanding of food webs: Identification of a learning hierarchy and related misconceptions. J. Res. Sci. Teach. 22(5):421–436. doi: 10.1002/tea.3660220505
Gökdere M (2005). A study on environmental knowledge level of primary students in science education. Asia-Pacific Forum on Sci. Learn. Teach. 6(2). artical 5. Retrieved from http://www.ied.edu.hk/apfslt/v6_issue2/gokdere/
Gunston RF (1980). Word association and the description of cognitive structure. Res. Sci. Educ. 10:45-53.
Hogan K (2000). Assessing students' systems reasoning in ecology. J. Biological Educ. 35(1):22-28. doi: 10.1080/00219266.2000.9655731
Hudson SJ (2001). Challenges for environmental education: Issues and ideas for the 21st century. BioScience, 51(4): 283-288. doi: 10.1641/00063568(2001)051[0283:CFEEIA]2.0.CO;2
Jegede OJ, Aikenhead GS (1999). Transcending cultural borders: Implications for science teaching. J. Sci. Technol. Educ. 17(1):45-66. doi:10.1080/0263514990170104
Jordan R, Steven G, Demeter M, Lui L, Hmelo-Silver CE (2009). An Assessment of students' understanding of ecosystem concepts: Conflating ecological systems and cycles. Appl. Environ. Educ. Commun. 8(1):40-48. doi: 10.1080/15330150902953472
Kurt H (2013). Biology student teachers’ cognitive structure about “Living thing". Educ. Res. Rev. 8(12):871-880. doi: 10.5897/ERR2013.1408
Kurt H, Ekici G, Aksu Ö, Aktaş M (2013). Determining cognitive structures and alternative conceptions on the concept of reproduction (The Case of Pre-Service Biology Teachers). Creative Education, 4(9), 572-587. doi: 10.4236/ce.2013.49083
Marinopoulos D, Stavridou H (2002). The influence of a collaborative learning environment on primary students’ conceptions about acid rain. J. Biological Educ. 37(1):18-25. doi:10.1080/00219266.2002.9655841
Miles MB, Huberman AM (1994).Qualitative data analysis. USA: Sage Publication.
Munson HB (1991). Relationships between an individual’s conceptual

674 Educ. Res. Rev.
ecology and the individual’s conceptions of ecology. PhD diss., University of Minnesota, Minneapolis. In Munson, H. B. (1994). Ecological misconceptions. J. Environ. Educ. 25(4):30–34. doi: 10.1080/00958964.1994.9941962
Nakiboğlu C (2008). Using word associations for assessing non major science students’ knowledge structure before and after general chemistry instruction: the case of atomic structure. Chemistry Educ. Res. Practice 9:309-322. doi: 10.1039/B818466F
Özkan Ö, Tekkaya C, Geban Ö (2004). Facilitating conceptual change in students’ understanding of ecological concepts. J. Sci. Educ. Technol. 13(1):95-105. doi: 1059-0145/04/0400-0095/0
Palmer DH (1999). Exploring the link between students’ scientific and nonscientific conceptions. Sci. Educ. 83(6):639-653. doi: 10.1002/(SICI)1098-237X(199911)83:6<639::AID-SCE1>3.0.CO;2-O
Prokop P, Tuncer G, Kvasnicak R (2007). Short-term effects of field programme on students’ knowledge and attitude toward Biology: a Slovak experience. J. Sci. Educ. Technol. 16(3):247-255. doi: 10.1007/s10956-007-9044-8
Sander E, Jelemenská P, Kattmann U (2006). Towards a better understanding of ecology. J. Biological Educ. 40(3):119-123, doi:10.1080/00219266.2006.9656028
Selen Darçın E, Bozkurt O, Hamalosmanoğlu M, Köse S (2006). Misconceptions about greenhouse effect. Int. J. Environ. Sci. Educ. 1(2):104 – 115. Retrieved from http://www.ijese.com/Darcin.pdf
Shavelson RJ (1974a). Methods for examining representations of a subject matter structure in a student’s memory. J. Res. Sci. Teach. 11(3):231-249.
Shavelson RJ (April, 1974b). Some methods for. examining content structure and cognitive structure in mathematics instruction. Paper presented at the annual meeting of the American Educational Research Association. ED 090 035 Retrieved from http://files.eric.ed.gov/fulltext/ED090035.pdf on 10.30.2014
Shepardson DP, Choi S, Niyogi D, Charusombat U (2011). Seventh grade students' mental models of the greenhouse effect. Environ. Educ. Res. 17(1):1-17. doi: 10.1080/13504620903564549
Tekkaya C, Çapa Y, Yılmaz Ö (2000). Biyoloji öğretmen adaylarının
genel biyoloji konularındaki kavram yanılgıları. Hacettepe Üniversitesi Eğitim Fakültesi Dergisi 18:140-147. Retrieved from http://www.efdergi.hacettepe.edu.tr/
Timur S (2012). Examining cognitive structures of prospective preschool teachers concerning the subject “force and motion”. Educational Sciences: Theory and Practice. (Special Issue, Autumn), 3039-3049. Retrieved from http://www.edam.com.tr/kuyeb/en/
Tsai CC (2001). Probing students' cognitive structures in science: the use of a flow map method coupled with a meta-listening technique. Stud. Educ. Evalua. 27(3):257-268. doi: 10.1016/S0191-491X(01)00029-3
Tsai CC, Huang CM (2001) Development of cognitive structures and information processing strategies of elementary school students learning about biological reproduction. J. Biological Educ. 36(1):21-26. doi: 10.1080/00219266.2001.9655791
Tsai CC, Huang CM (2002). Exploring students' cognitive structures in learning science: a review of relevant methods. J. Biological Educ. 36(4):163-169. doi: 10.1080/00219266.2002.9655827
Vosniadou S, Ioannides C (1998). From conceptual development to science education: A psychological point of view. Int. J. Sci. Educ. 20(10):1213–1230. doi: 10.1080/0950069980201004
Yörek N, Uğurlu İ, Şahin M, Doğan A (2010). Qualitative investigation of Students' understanding about ecosystem and its components. Natura Montenegrina, 9(3):973-981. Retrived from http://www.pmcg.co.me/NM9/Yorek%20et%20al%20ISEM4.pdf

Vol. 10(5), pp. 675-683, 10 March, 2015 DOI:10.5897/ERR2014.2066 Article Number: CA9792351122 ISSN 1990-3839 Copyright © 2015Author(s) retain the copyright of this article http://www.academicjournals.org/ERR
Educational Research and Reviews
Full Length Research Paper
Turkish as a foreign language learners’ awareness and use of morphology in guessing the meanings of
unknown words from context: A case study
Fatih Yılmaz
Gaziosmanpasa University, Tokat/Turkey.
Received 29 December, 2014; Accepted 11 February, 2015
This study investigated Turkish as foreign language learners’ awareness and use of Turkish derivational affixes as a knowledge source in guessing the meanings of unknown words in written contexts. In addition, this study also examined the type of knowledge sources used in guessing the meaning of the unknown words. The study was conducted with the participation of 10 B1(Threshold, Pre-intermediate) which is based on Common European Framework of Reference (CEFR) for languages, level students at the Turkish Language Teaching and Application Center (TÖMER) at Gaziosmanpasa University, Turkey. The data were gathered through think aloud procedures. The participants were asked to read a passage and try to infer the meanings of 10 target words that included derivational affixes. The participants were tape-recorded during the think aloud procedures. The tape recordings were transcribed in order to analyze the data gathered from the participants. The data analysis involved reading and rereading of the tape scripts. Then, knowledge sources were identified and classified, and the participants’ successful and unsuccessful uses of Turkish morphology were examined. According to the result of the study, Turkish affixes are not effective knowledge sources in determining the meanings of unknown words. Among the knowledge sources used by the participants, Discourse/Text knowledge had the highest percentage (52.0%) and grammatical knowledge had the lowest (0.0%). The result of this study suggests that Turkish suffixes especially derivational affixes had a minimum affect in inferring the meanings of unknown words in context. Key words: Guessing strategies, knowledge sources, Turkish derivational affix, vocabulary learning.
INTRODUCTION The notion that we learn a lot of our vocabularies through reading, or more particularly comprehensible written input, is now entrenched in second and foreign language teaching (Nation and Waring, 2004). Learners naturally encounter unfamiliar words while reading a text and use
a variety of strategies to understand those unknown words. Stoller and Grabe (1995) pointed out that by becoming familiar with only a few stems, prefixes, and suffixes, students will recognize the meaning of many words; one root or affix can often provide a student with a
E-mail: [email protected]. Authors agree that this article remain permanently open access under the terms of the Creative Commons Attribution License 4.0 International License

676 Educ. Res. Rev. clue to the meaning of dozens of words. According to this idea, analyzing target word structure is one of the efficient ways to deduce the meaning of an unknown word in a text (Paribakht and Wesche, 1999).
Moreover, it is beneficial for students whose native languages are not related to the target language, to become aware of the similarities and differences of the two languages. Learners’ native language is a salient factor affecting successful guessing. According to Nation (2001), an important factor affecting guessing from context is the similarity between the learners’ native and the target language. If a learner’s L1 does not have an equivalent of a word in L2, it may be difficult for the learner to guess the meaning of that word. According to Nassaji (2003) some foreign language learners refer to native language, when guessing unknown words. Lado (1957) assumed that the student who comes in contact with a foreign language would find some features of it quite easy and others extremely difficult. Those elements that are similar to his native language will be easy for him and those elements that are different will be difficult. Turkish language learners do not use a wide variety of guessing strategies except for looking up a dictionary and asking the teacher or their classmates for the meanings of unknown words when they encounter new words while reading. This study tries to discover Turkish as foreign language learners’ morphological awareness and use of Turkish morphology as a knowledge source in attempting to guess the meaning of unfamiliar words in context.
It is almost impossible to learn a language without words; even communication, between human beings, is based on words. Therefore, teaching these words is a crucial aspect in learning a language. Both teachers and students agree that acquisition of vocabulary is a central factor in teaching a language (Walters, 2004). There are thousands of words in a language. Thus, vocabulary learning is a difficult process because it is impossible to attain mastery of all words in a language (Nation, 2001). Individual learners attempt to learn vocabulary in two ways; intentionally, through which learners learn vocabulary deliberately, and incidentally, through which learners learn new words from context. Learning from context may occur during extensive reading, while listening to stories, television, or radio, both in the first language and second language. Paribakht and Wesche (1999) revealed that most vocabulary learning occurs naturally when learners attempt to understand new words they hear or read in context. Similarly, Coady and Huckin (1997) claimed that much foreign language vocabulary learning occurs incidentally while the learner is engaged in extensive reading. Empirical studies demonstrate that reading is an effective way of learning new words (Ercan, 2009; Lau and Rao, 2013; Senoo and Yonemoto, 2014).
Through the reading process, learners encounter many unknown words. In order to overcome this problematic part of reading, learners use a variety of strategies to discover the meaning of an unknown word. Learners can
use several strategies, such as using a dictionary, receiving help from the teacher or peer, or parsing the meaning of a word from its context, to facilitate the learning of new words (Harley and Hart, 2000; Qian, 2004). Among these strategies, dictionary use and guessing strategies are widely used. According to Nation (2001), learning vocabulary through guessing from context is the most important of all sources of vocabulary learning. Many educators encourage the contextual guessing strategy, which refers to the use of background knowledge and linguistics cues to infer the meaning of unknown words (Kaivanpanah and Alavi, 2008: as cited in Huang and Eslami, 2013). If learners do not know a word, they discover its meaning by guessing from structural knowledge of the language, guessing from an L1 cognate, guessing from context, using reference materials, or asking someone (Schmitt, 1997). By and large, lexical inferencing involves the use of linguistic cues in combination with the learners’ general knowledge of the world, their awareness of context, and their relevant linguistic knowledge (Haastrup, 1991).
There are certain sources of information L2 learners frequently refer to when guessing from context. The first one is the use of sentence level grammar, from which learners deduce the syntactic category of the word. Another knowledge source used by L2 learners in order to infer the meaning of unfamiliar words is word morphology. Learners’ knowledge of L2 word morphemes (i.e. stems, and affixes such as -cı, -lık, -sız) enables them to deduce the meaning of an unknown word. Third, learners’ familiarity with the topic and theme is an important source of clues for inferring the meaning of unknown words (Pulido, 2007). Cognates are another influential factor in the guessing process. Related languages abound in cognates, such as German buch, Danish bog, and English book. Interlingual cues in a text such as loan words or cognates, and any other kind of transfer between the native language and the target language are some of the features that are available for use in inferring the meaning of unknown words from context (Carton, 1971). Intralingual clues pertain to the features of the new word and the inference maker's reliance on his/her information about phonology, orthography, morphology (the meaning of stem, prefix, and suffix), word class and collocations to guess the meaning (Riazi and Babaei, 2008).In addition, learners use their knowledge of sound relationships or the phonetic similarity between the target word and another word in the learners’ mental lexicon to guess the meaning of an unknown word (Paribakht and Wesche, 1999).
A number of factors affect students’ attempts to infer the meaning of unfamiliar words. First, text characteristics influence learners in terms of both their motivation and their success in guessing the meanings of unknown words. For example, according to Paribakht and Wesche (1999), theme-related texts appear useful for vocabulary expansion because words appear repeatedly and take on

salience, thus enriching the meanings from varied contexts.
In addition to that, the text should have a manageable difficulty level (Paribakht and Wesche, 1999). Second, cultural familiarity with the text helps learners understand the text better. Vocabulary gains are greater when participants read culturally familiar texts (Pulido, 2004). Third, word characteristics are also influential in guessing the meaning of an unknown word. Some words look as if they are composed of meaningful morphemes (Laufer, 1997). Frequency of occurrence of a word is another important factor when attempting to guess the meaning of unknown words. Sternberg (1987) pointed out that multiple occurrences of an unknown word increase the number of available cues when attempting to guess the meaning of an unfamiliar word. Another important factor affecting guessing from context is individual differences. More proficient learners are more successful guessers and use a wider variety of guessing strategies than those who are less proficient (Paribakht, 2005). In addition, a critical level of vocabulary knowledge is essential for successful use of guessing strategies (Laufer, 1997).
Finally, native language is influential on the word guessing process. Learners of related languages are more advantaged than the learners of unrelated lan-guages. Nation (2001) claimed that the similarity between the learner’s first language and the second language is an important factor affecting guessing from context. Of all the guessing strategies, morphological knowledge as a strategy has an important role in reading and inferring the meaning of unknown words. Paribakht and Wesche (1999) demonstrated that learners’ knowledge of L2 word derivations (e.g. stems and affixes) is the second most important knowledge source used in inferring the meaning of unknown words. Furthermore, Nassaji (2003) demonstrated that students use world knowledge most frequently, and the second most frequently used knowledge source in attempting to derive the meaning of unfamiliar words is morphology. Statement of the problem Incidental learning by means of guessing from context is the most important source of vocabulary learning (Nation, 2001). Learners use a variety of guessing strategies when attempting to guess the meaning of unknown words. For instance, Carlisle (2003) pointed out that morphemic awareness might be regarded as an analytic skill that involves inferences about word structure and meaning. Developing morphological awareness may become very important for readers (Carlisle, 2000). However, there have been very few studies (Mori, 2003; Parel, 2004) on the roles of L2 morphological awareness in reading. Parel (2004) also asserted that very little is known about the relationship of sensitivity to word structure to reading achievement in the second language. There has been little empirical study of Turkish as a
Yılmaz 677 foreign language learners’ awareness and use of Turkish affixes when making inferences about unknown words in written contexts. In addition to that, there has been no study comparing Turkish language learners’ awareness, use of suffixes appearing in unknown words and know-ledge sources in guessing the meaning of unknown words. But there are studies which deal with the handling of unknown vocabulary and knowledge sources in teaching English as a foreign and second language. Akpınar (2013) examined English as a Foreign Language Learners’ (EFL) handling of unknown words while reading English texts and focused on the question of whether the English language learners are aware of the strategies and knowledge sources they apply while guessing the meanings of the unknown words. Turkish EFL learners handle unknown vocabulary in various ways. Among other strategies such as consulting a dictionary for their meanings, attempting to infer their meaning from context is a popular way of handling unknown vocabulary by the learners.
İstifçi (2009) examined the lexical inferencing strategies of Turkish EFL Learners and the result of this study revealed that the students at intermediate level were more successful than the students at low-intermediate level in their guesses of the meaning of unknown words.
Turkish as a foreign language, one of the less com-monly taught languages, differs considerably from more commonly taught languages such as English, French and German. In the foreign language classrooms, vocabulary acquisition has long been a central issue for students as the grammar based main course book and the skills books are filled with new lexis that the students must acquire. However, the Turkish language learners do not use a wide variety of vocabulary learning strategies except for looking up a dictionary for the meanings of unknown words when they encounter new words while reading.
Similarly, foreign students at Gaziosmanpaşa (GOP) University do not use many of the vocabulary learning strategies in reading classes apart from looking up a dictionary and asking the teacher or their classmates. The reason for this situation could be that the students may not know most of the guessing strategies and they may not be aware of the role of Turkish morphemes as a clue to decode and infer the meaning of unfamiliar words. Moreover, the students might not be aware of many features of Turkish morphology.In this study, whether the Turkish language learners at (GOP) University use Turkish affixes as a knowledge source to infer the mean-ings of unknown words encountered in written contexts and whether they use knowledge sources in guessing the meaning of unknown words are investigated. Significance of the study There is limited research on Turkish as a foreign language students use of morphological cues as a

678 Educ. Res. Rev. knowledge source in attempting to infer the meanings of unfamiliar words in context. Thus, this study might contribute to the literature by providing a description of how or whether Turkish as a foreign language learners use morphological cues in inferring word meaning from context and which knowledge source has been used widely in guessing the meaning of unknown words. At the local level, this study will be the first on foreign students’ awareness and use of Turkish morphology as a knowledge source in order to guess the meanings of unfamiliar words in context at Gaziosmanpaşa University. This study may be beneficial to Turkish as a foreign language teachers and students in developing strategies for dealing with unknown words containing affixes. METHODOLOGY This study investigates the awareness and the use of Turkish suffixes by Turkish as foreign language learners in guessing the meaning of unfamiliar words encountered in written contexts and to find out which knowledge sources have been used in guessing the meaning of unknown words. Research questions 1. To what extent do Turkish language learners refer to Turkish derivational affixes in order to guess the meaning of an unknown word in written contexts? 2. Which knowledge sources have been used in guessing the meaning of unknown words? Setting This study was conducted at Gaziosmanpaşa University Turkish Language Teaching and Application Center (GOÜ-TÖMER). There were 29 currently enrolled students at GOÜ-TÖMER at 2014-2015 academic years. The students were at intermediate level when this study was applied. The students were exposed to 24 h of Turkish every week. They were taught grammar and the four language skills in these lessons. The researcher decided to choose participants from the most successful students according to their last proficiency exam results, because insufficient vocabulary can prevent L2 readers from constructing enough contexts to guess the meanings of unknown words (Laufer, 1997). Participants The participants were 14 intermediate level students. Since four of the students participated in the pilot study, they were not included in the main study, so the main study was conducted with ten students. Participants (6 females, 4 males) voluntarily participated in this study. They represented five different language backgrounds, including, Farsi, Arabic, Turkmen, Tajik and Swahili language. Instruments This was a fully qualitative study. A pre-test and a reading passage were the instruments used to collect data in this study. The researcher checked the pre-test about the affixes and the results revealed that many of the participants did well on the pre-test. In addition, a checklist was used just after each interview with each
Table 1. Derivational affixes in the target words.
No. Derivational affixes 1 -cı, -ci, -cu, -cü, -çı, -çi, -çu, -çü 2 –gı, -gi, -gu, -gü, -kı, -ki, -ku, -kü 3. –ca, -ce, -ça, -çe 4. –gın, -gin, –gun, -gün, -kın, -kin, -kun, -kün 5. –la, -le 6. –n- 7. –lı, -li, -lu, -lü 8. –lık, -lik, -luk, -lük 9. –sız, -siz, -suz, -süz 10. -l-
student to check whether they were aware of the affixes which appeared in the target words. The passage chosen contained 236 words, 10 of which were target words that the researcher used to focus on the use of affixes in guessing strategies.
The target words included derivational affixes and they were all content words. The target words included three adjectives, four nouns, and three verbs. Instead of real words, plausible non-words, to which affixes were attached, were used as target words in the text in order to prevent students’ possible familiarity with the words. Table 1 illustrates the derivational affixes in the target words.
Four suffixes that attach to nominal to form nominal, two suffixes that attach to nominal to form verbs, three suffixes that attach to verbs to form nominal and one suffix that attach to verb to form verb were provided in order to have many opportunities to collect data from the participants. The target words were italicized in order for participants to recognize them easily. The reading passage was adapted by Turkish language experts. The reading passage was intended to be lower than the students’ actual proficiency level in order for the participants to understand it better and make successful guesses of the meaning of unknown words in the text. The researcher had three Turkish language teachers check the appropriateness of the reading passage in terms of its reading level. Little modifications have been done according to the reviews of those experts. To further check, the researcher piloted the same text with four students assumed to be similar to the participants in the main study with respect to language proficiency and level of reading comprehension. The students were asked to attempt to guess the meanings of the italicized words. Another purpose of the pilot study was also to check whether the students understood the text well. The researcher asked the students participating in the pilot study to read the reading passage out loud to check whether they understood the text. Data analysis This study included qualitative data. Qualitative data were gathered from transcripts of the tape-recordings and the researcher’s notes taken during the think aloud protocols. Then, the researcher transcribed the tape-recordings and the data analysis was carried out on the Turkish transcripts.
Data analysis involved readings and re-readings of the trans-cripts by the researcher in order to code the types of knowledge sources used by the participants during the think aloud procedure. For coding categories, the researcher consulted the literature on vocabulary learning and lexical inference strategies (Paribakht, 1997; Nassaji, 2003). Moreover, the coding scheme the researcher used derived mainly from the data and reflected the thinking of the learners participating in the study. The researcher identified a

total of four knowledge sources including grammatical knowledge, discourse/text knowledge, morphological knowledge, and world knowledge.
In addition to that, a second rater, who is an experienced Turkish language teacher and also a native speaker of Turkish, also identified and classified the knowledge sources. Grammatical knowledge was defined as using knowledge of grammatical functions or syntactic categories. Discourse/text knowledge was defined as using knowledge about the relationships between sentences or within sentences. Morphological knowledge involved using knowledge of word formation and word structure. World knowledge has two definitions in the literature: Nassaji (2003) defines it as the general knowledge about the topic and content that goes beyond what is in the text, but Paribakht and Wesche (1999) define world knowledge as learner familiarity with the theme and topic of the text. The researcher decided to use Nassaji’s (2003) definition of world knowledge because his definition is much broader and more appropriate for this study.
To determine the degree to which participants were successful in inferencing the target words, the researcher and the second rater rated participants’ responses to each of the unknown words in the reading passage. Successful inferencing was defined as responses that were semantically and contextually appropriate, whereas unsuccessful guesses were not accurate responses semantically or contextually (Nassaji, 2003).
After determining successful and unsuccessful responses, the researcher counted both successful and unsuccessful guesses, classified the knowledge sources, calculated the percentages, and classified each participant’s responses to each italicized word he or she attempted to guess the meaning of from the context.
A think aloud technique was conducted to gather data from the participant students. The researcher met each participant in a quiet room for approximately 15 min to conduct the think aloud procedure. The participant students were asked to read a reading passage and try to infer the meanings of the 10 target words in the text. In addition, they were told to verbalize their thoughts while making inferences. The students were tape-recorded as the researcher conducted the think aloud procedure. Later, the tape-recordings were transcribed and examined in order to reveal the data.
The researcher extracted and formulated the following information: (a) identification of the words learners guessed successfully or failed to guess successfully; (b) identification of the knowledge sources the participants used in order to guess the meanings of the target words. Each participant was expected to infer the meanings of each of these words, making a total of 100 attempts to infer meaning from context; however, after examination of the transcripts, target words were ignored on 9 occasions. Thus, the number of attempts was reduced from 100 to 91, for which responses could be interpreted as inference of an unknown word. OVERALL RESULTS Table 2 shows that of the total 100 opportunities to guess from context, 62 (62.0%) were successful. Twenty-nine (29%) were unsuccessful. In addition, the researcher identified 9 ignored words whose meanings the participants did not attempt to infer in anyway. If both unsuccessful and ignored words are considered together, students were unable to infer the meanings of 38 (38.0%) words.
Table 3 summarizes the students’ responses to the unknown words in the reading passage. The reading passage included 10 plausible non-words (PNWs) which
Yılmaz 679
Table 2. Students' successful and unsuccessful guesses. n % Successful guesses 62 62.0% Unsuccessful guesses 29 29.0% Ignored words 09 9.0% Total 100 100%
were used in order to prevent students’ possible familiarity with the words. Some of the participants gave no response to some of the target words. Accordingly, the data analysis is based on 91 responses provided from the participants. With regard to an item-by-item analysis of the individual words, the results demonstrate a wide variety of differences in students’ responses to each of the individual words. For example, all of the students successfully inferred the meaning of the target words tulakçı (sanitarian) and eneldi (diminished). On the other hand, 7 participants could not guess correctly the meaning of ferimsiz.
Knowledge sources are what the learner refers to, such as world, morphological or text knowledge, when attempting to infer the meanings of unknown words (Nassaji, 2003). The analysis of the think aloud protocols showed that different categories of knowledge sources were used both successfully and unsuccessfully by the participants. Knowledge sources used included world knowledge, morphological knowledge, discourse/text knowledge, and grammatical knowledge. Sometimes the students referred to more than one knowledge source while guessing the meaning of a word.
Table 4 demonstrates the students’ use of all know-ledge sources when guessing the meanings of unknown words. Among the knowledge sources used by the participants, discourse/Text knowledge had the highest percentage (52.0%) and grammatical knowledge had the lowest (0.0%).
Table 5 illustrates the use of each suffix when the participant students attempt to guess the meanings of unknown words. Of all the Turkish morphemes appearing within the target words, the students never refer to two of the affixes: (-la,-le) and ( -sız, -siz, -suz, -süz). The students may not have been aware of these morphemes within the target words. On the other hand, (-cı, -ci, -cu, -cü, -çı, -çi, -çu, -çü) and (-ca, -ce, -ça, -çe) were the most frequently used suffix by the students in their attempts to infer the meanings of the unknown words.
In the following section, some examples of the participants’ attempts to use affixes in guessing the meanings of the unknown words are given. Knowledge source: Morphology knowledge (–ca, -ce, -ça, -çe) “…konuşmalar yabancı dillerde ve Tengçe. [ …the speech was given in foreign languages and in Tengçe so,

680 Educ. Res. Rev.
Table 3. Successful and unsuccessful inferences for unknown words.
Unknown words
Total number of responses Successful Unsuccessful Ignored
n n % n % n tulakçı 10 10 100.0 0 0.0 0 sengi 10 8 80.0 2 20.0 0 Tengçe 7 7 100.0 0 0.0 3 mangın 6 3 50.0 3 50.0 4 tışlamalıyız 10 5 50.0 5 50.0 0 yuvandı 10 10 100.0 0 0.0 0 kitirli 9 3 30.0 6 67.0 1 marlık 10 4 40.0 6 60.0 0 9ferimsiz 10 3 30.0 7 70 0 1eneldi 9 9 100.0 0 0.0 1 Total 91 62 68.1 29 31.9 9
Table 4. Students' use of knowledge sources. Knowledge source n % World Knowledge 41 31.8 Morphological Knowledge 21 16.2 Discourse/Text Knowledge 67 52.0 Grammatical Knowledge 0 0.0
Table 5. The use of each suffix.
Words n -cı, -ci, -cu, -cü, -çı, -çi, -çu, -çü 6 –gı, -gi, -gu, -gü, -kı, -ki, -ku, -kü 1 –ca, -ce, -ça, -çe 7 –gın, -gin, –gun, -gün, -kın, -kin, -kun, -kün 2 –la, -le 0 –n- 1 –lı, -li, -lu, -lü 1 –lık, -lik, -luk, -lük 2 –sız, -siz, -suz, -süz 1 -l- 1 Total 22
Tengçe might be a language, because –çe suffix makes languages, for example Turkçe (Turkish), Almanca (German), Arapça (Arabic)….]” Knowledge source: Morphology knowledge ( -cı, -ci, -cu, -cü, -çı, -çi, -çu, -çü) “…speech is given by tulakçı who has a medicine education… [speech is given by sağlıkçı (sanitarian) who has a medicine education…-çı suffix makes profession]. Knowledge source: Morphological knowledge (-sız, -siz, -suz, -süz)
“…without prescription ferimsiz drug consumption…[…without prescription insensible drug consumption. –sizsuffix that attach to nominal to form negative nominal]” The data gathered from the think aloud protocols revealed that not all of the participants used Turkish morphology as a knowledge source when inferring the meaning of the target words in the context. Participants never referred to –la, -le suffixes in their attempts to guess the meanings of the unknown words.
(–sız, -siz, -suz, -süz), (–lı, -li, -lu, -lü), (–gı, -gi, -gu, -gü, -kı, -ki, -ku, -kü), (-n) and (-l) suffixes have been used once in students’ attempts to guess the meaning of unknown words. Participant 1 was the most successful in terms of morphology use as a knowledge source. She referred to affixes five times in total and five of these were associated with correct guesses.
Some examples of the participants’ attempts to use knowledge sources in guessing the meanings of the unknown words are given here. Knowledge source: Discourse/Text knowledge “…eller su ile güzelce yuvandı ancak…. [ …the hands were yuvandı (washed) but…yuvandı might be washed because in this sentences I see hands so hands are related with washing]” “…eller su ile güzelce yuvandı ancak…. […the hands were yuvandı (washed) but…yuvandı might be washed because in this sentence I see water so water is related with washing]” “…eğitim görmüş tulakçı tarafından …. beslenme…[ …by an educated tulakçı(sanitarian)……nutrition… tulakçı might be sanitarian, or a profession related with health, so the participant used both Discourse/Text knowledge and World knowledge]” “…eğitim görmüş tulakçı tarafından …. beslenme…[ …by an educated tulakçı(sanitarian)……nutrition…

tulakçı might be medical student, or doctor, or a profession related with health, so the participant used both Discourse/Text knowledge and World knowledge]” “…sağlıklı yaşama kuralları hakkında sengi verilir. [ …sengi (information) will be given about sanitary living condition so, sengi might be information, because sengiverilir (giving information) is used together, I understand this because I know what verilir (giving) means]” Knowledge source: World knowledge “…konuşmalar yabancı dillerde ve Tengçe… [ …the speech was given in foreign languages and in Tengçe so, Tengçe might be a language, because an expert will give a speech in foreign language or any other language so as far as I remember this might be a kind of language like Turkçe (Turkish), Almanca (German), Arapça (Arabic)….]” “…konuşmalar yabancı dillerde ve Tengçe…[ …the speech was given in foreign languages and in Tengçe so, Tengçe might be a language, because I see the the word foreign language so the doctors give speech in any languages]” “…son yıllarda bilinçli ilaç kullanmama miktarı ve sayısı eneldi[ …in recent years the drug usage has been eneldi(diminished) so, eneldi might be diminished, because an recent years people are conscious about the drawbacks of drugs, people tend to use herbs for health]” “…son yıllarda bilinçli ilac kullanmama miktarı ve sayısı eneldi[ …in recent years the drug usage has been eneldi(diminished) so, eneldi might be increased, people try to use various drugs because of the developments in medicine, drugs are cheap and easily accessible]” “…sağlıklı yaşama kuralları hakkında sengi verilir. [ …sengi (information) will be given about sanitary living condition so, sengi might be information, because doctors usually gives information about sanitary living conditions]” In this study three Turkmen students use L1 knowledge source, “…eller su ile güzelce yuvandı ancak…. [ …the hands were yuvandı (washed) but…yuvandı might be washed because in my native language (Turkmen) yuvamak means to wash, which sound similar to made-up word yuvandı. DISCUSSION This study investigated the use of Turkish derivational affixes and knowledge sources by Turkish as foreign language learners in inferring the meanings of unknown words encountered in written contexts. This section will answer the research questions of this study and discuss the findings in the light of the relevant literature. 1. To what extent do Turkish language learners refer to Turkish derivational affixes in order to guess the meaning of an unknown word in written contexts?
Yılmaz 681 This research question was answered by looking at the participants’ behaviors using Turkish affixes when attempting to guess the meanings of the target words encountered in the reading passage. According to the result of the study foreign students are not successful in referring to affixes while guessing the meaning of unknown words. Paribakht (2005) stated that there is a clear relationship between vocabulary knowledge and successful inferencing. So, individual differences in terms of vocabulary knowledge might have taken a role in their use of suffixes, or some participants might have not been aware of the affixes. Nagy and Anderson (1984) also stated that morphemic awareness might be regarded as an analytic skill, which some of the participants may lack. Another reason that Turkish as a Foreign Language Learners did not often refer to Turkish morphology as a knowledge source might be the morphology of Turkish language. Turkish is an agglutinative language. Agglutination refers to the process of adding suffixes to a root-word, thus transforming a single word into a phrase or a complete sentence depending on the chain of suffixes attached (Kurtoğlu-Hotoon, 1995,p.20). Crystal (1991, p.19) stated that different languages display the characteristics of agglutination in different degrees and gives Turkish as an example of a language that largely displays agglutination. Agglutination in Turkish is due to the wide use of suffixes. These are affixed to root words to form nouns, adjectives, and verbs. It is not possible to teach all the affixes to the Turkish as foreign learners.In this study most frequently used affixes are (-cı, -ci, -cu, -cü, -çı, -çi, -çu, -çü) and (-ca, -ce, -ça, -çe) by the students in their attempts to infer the meanings of the unknown words. The reason might be that the teachers might have emphasized these affixes more in the class activities. 2. Which knowledge sources have been used in guessing the meaning of unknown words? This study showed that different categories of knowledge sources were used both successfully and unsuccessfully by the participants. Knowledge sources used included world knowledge, morphological knowledge, discourse/text knowledge, and grammatical knowledge. Sometimes the students referred to more than one knowledge source while guessing the meaning of a word. Among the knowledge sources used by the participants, Discourse/Text knowledge had the highest percentage (52.0%) and grammatical knowledge had the lowest (0.0%). World knowledge is “using knowledge of the content or the topic that goes beyond what is in the text” and Discourse/Text knowledge is “using knowledge about the relation between or within sentences and the devices that make connections between the different parts of the text” (Nassaji, 2003, p.656). In this study most of the students who use World knowledge used the Discourse/Text knowledge as well. Knowledge sources

682 Educ. Res. Rev. used by the participants, Discourse/Text knowledge (52.0%) and World knowledge (31.8%) had the highest percentages. Conclusion The results of this research revealed that Turkish language learners used a variety of knowledge sources in the process of inferencing vocabulary meaning during L2 reading, such as World knowledge, Morphological knowledge, Discourse/Text knowledge, and Grammatical knowledge. In addition, Turkish language learners made frequent erroneous guesses, and on some occasions made no guesses at all. Turkish language learners did not use grammatical knowledge, which may indicate that information about the grammatical function of the words may not help students in their attempts to infer the meanings of unfamiliar words in context (Nassaji, 2003).
The research revealed that the participants as a whole appeared to be unsuccessful referring to affixes in many of their attempts to deduce the meanings of unknown words. Thus, even though Turkish language learners appeared to experience some success in referring to affixes in their attempts to unlock the meanings of unknown words, they did not often refer to suffixes when reading. Turkish language learners did not often refer to Turkish morphology as a knowledge source might be the morphology of Turkish language. Turkish is an agglutina-tive language and largely displays agglutination.
Another reason that learners did not often refer to Turkish morphology as a knowledge source might be that they do not read a lot in the target language. There is a relationship between reading and morphological aware-ness. For example, the person who does not read very much probably will not be able to see the contribution of the affix -cı, -ci, -cu, -cü, -çı, -çi, -çu, -çü to the meaning of a person practicing a certain profession, or having a certain occupation: koruyucu ‘guardian’, öğrenci ‘student’, dilenci ‘beggar’.
Another reason that the use of affixes is not very high in inferring the meanings of target words in written context may be that the target words are not real words. The participants might have recognized and used the affixes more frequently if real words had been used instead of made-up words, because the participants might have recognized the bound stems and they could decide what part of the target word is an affix. When Turkish language learners encounter an unfamiliar word while reading, they often infer its meaning using available information and knowledge (Discourse/Text) not using Morphological knowledge for guessing the meaning of unknown words. And also grammatical function of the words did not help students in their attempts to infer the meanings of unfamiliar words in context. Implication for Further Studies Taking the limitations of the study into consideration, a
similar study should be conducted with students from different levels, because language proficiency is influen-tial in analyzing unfamiliar words. In addition, in order to reveal the successful use of affixes as a knowledge source in guessing the meanings of unknown words, a similar study may be conducted with students who have been provided with instruction in guessing strategies and Turkish morphology. Furthermore, a further study may be conducted with more students, in order to reveal more accurate results. In addition, different texts at different difficulty levels and different genres might be used for such studies. Conflict of Interests The author has not declared any conflict of interest. REFERENCES Akpınar KD (2013). Lexical Inferencing: perceptions and actual
behaviours of Turkish English as a Foreign Language Learners’ handling of unknown vocabulary.South Afr. J. Educ. 33(3).
Carlisle JF (2000). Awareness of the structure and meaning of morphologically complex words: Impact on reading. Reading and Writing: An Interdisciplinary J. 12(3-4):169-190.
Carlisle JF (2003). Morphology matters in learning to read: A commentary. Read. Psychol. 24(3/4):291.
Carton AS (1971). Inferencing: A process in using and learning language. In P. Pimsleur & T. Quinn (Eds.), The Psychology of Second Language learning. Cambridge: Cambridge University Press.
Coady J, Huckin T (1997). Second language vocabulary acquisition. The Cambridge applied linguistics series. Cambridge: Cambridge University Press.
Crystal D (1991). A dictionary of linguistics and phonetics. Oxford, England: Basil Blackwell.
de Bot K, Paribakht TS, Wesche MB (1997). Toward a lexical processing model for the study of second language vocabulary acquisition. Studies in Second Language Acquisition, 19(3):309-329.
Ercan EE (2009). Teaching Vocabulary Through Cooperative Learning. An unpublished Master dissetation, Selcuk University.
Haastrup K (1991). Lexical inferencing procedures or talking about words : Receptive procedures in foreign language learning with special reference to English. Tübingen: Gunter Narr.
Harley B, Hart D (2000). Vocabulary learning in the content-oriented second language classroom: Student perceptions and proficiency. Language Awareness, 9:78-96.
Huang S, Eslami Z (2013). The Use of Dictionary and Contextual Guessing Strategies for Vocabulary Learning by Advanced English-Language Learners. English Language Literature Stud. 3:3.
İstifçi İ (2009).Lexical Inferencing Strategies of Turkish EFL Learners. J. Language Linguistic Stud. 5:1.
Kurtoğlu-Hotoon, N. (1995). Spelling reform and Turkish. J. Simplified Spelling Society. 18:19-24.
Lado R (1957). Linguistics across cultures. Ann Arbor: University of Michigan Press.
Lau C, Rao N (2013). English Vocabulary Instruction in Six Childhood Classroom in Hong Kong. Early Child Development and Care. 183(10):1363-1380.
Laufer B (1997). What's in a word that makes it hard or easy: Some intralexical factors that affect the learning of words. In Schmitt, N. & McCarthy, M. (Eds.), Vocabulary: Description, acquisition and pedagogy. (pp. 140-155). Cambridge: Cambridge University Press.
Mori Y (2003). The roles of context and word morphology in learning new Kanji words. Modern Language J. 87(3):404-420.
Nagy W, Anderson R (1984). The number of words in printed school English. Reading Res. Q. 19:304-330.

Nassaji H (2003). L2 vocabulary learning from context: Strategies,
knowledge sources, and their relationship with success in L2 lexical inferencing. TESOL Q. 37(4):645-670.
Nation ISP (2001). Learning vocabulary in another language. Cambridge: Cambridge University Press.
Nation ISP, Waring R (2004). Second language reading and incidental vocabulary learning. Angles on the English-Speaking World. 4:181-193.
Parel R (2004). The impact of lexical inferencing strategies on second language reading proficiency. Reading Writing 17(6):847-873.
Paribakht TS (2005). The influence of first language lexicalization on second language lexical inferencing: A study of Farsi speaking learners of English as a foreign language. Language Learn. 55(4):701-748.
Paribakht TS, Wesche M (1999). Reading and 'incidental' L2 vocabulary acquisition: An introspective study of lexical inferencing. Studies in Second Language Acquisition. 21(2):195-224.
Pulido D (2004). The effect of cultural familiarity on incidental vocabulary acquisition through reading. Reading Matrix: An International Online J. 4(2):20-53.
Pulido D (2007). The relationship between text comprehension and second language incidental vocabulary acquisition: A matter of topic familiarity. Language Learning, 57(1):155.
Qian D (2004). Second language lexical inferencing: preferences, perceptions, and practices. In P. Bogaards, & B. Laufer (Eds.), Vocabulary in a second language: selection, acquisition, and testing (pp. 155-169). Philadelphia: John Benjamins Publishing Company.
Riazi A, Babaei N (2008). Iranian EFL Female Students' Lexical Inferencing and Its Relationship to Their L2 Proficiency and Reading Skill. The Reading Matrix 8(1):186-195.
Schmitt (1997). Vocabulary learning strategies. In N. Schmitt & M. McCarthy (Eds.), Vocabulary: Description, acquisition, and pedagogy (pp. 199-227). Cambridge: Cambridge University Press.
Senoo Y, Yonemoto K (2014). Vocabulary Learning Through Extensive Reading: A Case Study. Canadian J. Appl. Linguistics. 17(2):1-22.
Yılmaz 683 Sternberg RJ (1987). Most vocabulary is learned from context. In M. G.
McKeown & M. E. Curtis (Eds.), The nature of vocabulary acquisition (pp. 89-105). Hillslade, NJ: Erlbaum.
Stoller F, Grabe W (1995). Implications for L2 vocabulary acquisition and instruction from L1 vocabulary research. In T. Huckin, M. Haynes & J. Coady (Eds.), Second language reading and vocabulary learning (pp. 24-45). New Jersey: Ablex Publishing Corporation.
Walters JM (2004) Teaching the use of context to infer meaning: A longitudinal survey of L1 and L2 vocabulary research'. Language Teach. 37(4):243-252.

Vol. 10(5), pp. 684-690, 10 March, 2015 DOI:10.5897/ERR2014.1896 Article Number: 69CCBF351125 ISSN 1990-3839 Copyright © 2015Author(s) retain the copyright of this article http://www.academicjournals.org/ERR
Educational Research and Reviews
Full Length Research Paper
The relationship between secondary school students’ mathematics anxiety and self-regulation
Tevfik İŞLEYEN
Ataturk University, Kazimkarabekir, Education Faculty, Turkey.
Received 30 July, 2014; Accepted 13 February, 2015
One of the basic aims of education is to facilitate students’ learning and to make it permanent. Researching and identifying the factors which can positively or negatively affect students’ learning hold a great deal of importance in terms of actualizing learning. The aim of this study is to determine whether or not there is a relationship between elementary school students’ (5th, 6th, 7th, and 8th grades) mathematics self- regulation abilities and their mathematics anxiety. The sample of the research was composed of a total of 283 students (141 males and 142 females) who went to public school located in Erzurum. Both Mathematics Anxiety Scale and Self-Regulation Skill Scale for elementary school students were used as data collection tools of the study in which causal research design was used. SPSS 18.0 package program, the Pearson Product-Moment Correlation Coefficient Analysis and the Multilinear Regression Analysis were used in analyzing the data. In view of the obtained findings, a negative relationship was found between mathematics anxiety and self-regulation skill [r=-.27]. Key words: Mathematics Anxiety, Self-Regulation, Anxiety and Self-Regulation.
INTRODUCTION As science and technology progressively develop, our education system has been reviewed constantly and necessary changes have been applied along with these developments in order to cope with scientific and technological developments, to raise future individuals in an effective way and to provide them with high quality mathematics instruction.As it is known, education is the foundation of a country’s social, cultural and technolo-gical developments. With humanity’s transition to the information age, rapid scientific and technological developments have considerably affected the way people are designed for the future. Many occupations will require a solid foundation in the fields of mathematics, science
and computer in the future. These three necessitate mathematics-based knowledge and skills (Baykul, 1999).
One of the basic aims of education is to facilitate students’ learning and make it permanent. In this regard, researching and finding out the factors that can positively or negatively affect students’ learning hold a great importance in terms of actualizing this learning. We should not only focus on the factors that affect learning in a negative way, but also find a solution to the problems that arise from these factors. In order to narrow the scope of our context, we should highlight mathematics that is considered to be the primary course in which students usually experience difficulty. We should also pay
E-mail: [email protected] Authors agree that this article remain permanently open access under the terms of the Creative Commons Attribution License 4.0 International License

attention to students’ prejudices against mathematics. Researching the factors that affect mathematics education must be prioritized in order to facilitate mathematics learning. Mathematics is among the courses in which affective characteristics have a considerable influence on the learning-teaching process (Suinn and Edwards, 1982). Mathematics, which is considered to be an important part of education, is also a discipline which has a quality that evokes anxiety in people. Why do we experience difficulties in learning mathematics? How can we overcome mathematics anxiety and fear? Many researches conducted in the last thirty years (Aiken,1970; Izard, 1972; Tobias, 1978; Posamentier and Stepelman, 1986; Hembree, 1990; Skiba, 1990; Tobias, 1990; Bessant, 1992; Chipman, et al., 1992; Gierl and Bisanz, 1995; Campbell and Evans, 1997; Baloğlu, 1999; Zettle and Raines, 2000; Ma and Xu, 2004; Şahin, 2004 and Alkan, 2009) have set forth that some students exhibit reactions like fear, hate and anxiety against mathematics course from an elementary school level to a university level. Furthermore, it is observed that there is a wide-spread belief in our country, which argues that mathematics course is difficult (Başar et al., 2002).
Students’ academic success is based on their cognitive and affective characteristics. Problems arising from cognitive characteristics can be spotted more easily in the learning-teaching process, and it is easy to eliminate these problems. In this aspect, it is considered that cognitive behaviors are open to change (Senemoğlu, 2005). Spotting problems arising from affective characte-ristics is more difficult than those arising from cognitive characteristics, and it takes time to change these characteristics (Erden and Akman, 2011). As a result of these facts, it is important to spot students’ affective characteristics regarding the learning-teaching process earlier. Thus, after students’ affective characteristics are identified, it becomes easier to eliminate these characteristics that affect students’ success in a negative way. When students believe that they can perform mathematics and exhibit positive emotions towards mathematics course, their mathematics success increases (Yücel and Koç, 2011). On the other hand, negative emotions toward mathematics course cause a decrease in students’ mathematics success (Aiken, 1970; Çoban, 1989; Minato and Yanese, 1984). Mathematics anxiety is one of the affective characteristics that cause a decrease in students’ mathematics success (Ho, 2007; Wadlington and Wadlington, 2008; Zakaria and Nordin, 2008).
Mathematics anxiety, which is one of the factors that positively or negatively affect success in education, was first defined by Drejer and Aiken (1957) as the emotional reaction syndrome that is exhibited against the fields of mathematics and arithmetic. Although the first studies on mathematics anxiety began in the 1950s with the indivi-dual observations of mathematics teachers, education researchers did not take interest in mathematics anxiety
Işleyen 685 until the 1970s (Baloğlu, 2001). Richardson and Suinn (1972) defined mathematics anxiety as the feelings of tension that interferes with manipulating numbers and solving mathematical problems, and they conducted many researches on this issue. Hembree (1990) stated that mathematics anxiety causes a decrease in mathe-matics success and an emergence of an anxiety towards abstaining from mathematics. Therefore, mathematics anxiety is a serious problem that is mostly observed in students of early education, and its solution is not easy (Hannula, 2005). Students under the influence of such anxiety are unable to gain mathematical knowledge at a desired level and they choose to memorize the mathe-matical knowledge that they gain without internalizing and comprehending this knowledge (Işık et al., 2008). Mathematics anxiety is defined as feeling the emotions of anxiety and tension in solving mathematics problems using numbers in daily and academic life (Altun, 1994). Şahin (2000) defined mathematics anxiety as feeling the emotions of anxiety and tension in solving mathematics problems and using numbers in daily and academic life. Mathematics anxiety is one of the reasons that negatively affect an individual’s mathematics performance (Wadlington and Wadlington, 2008; Ho, 2007).
It is stated that students gain mathematics anxiety generally from the mathematics courses that they took in the past. Therefore, mathematics teachers learn how to minimize elementary school students’ mathematics anxiety using their own school experiences (Wilson and Thornton 2007). Mathematics anxiety begins in the first years of education. In addition to teachers’ attitude, parents’ attitude also constitutes an important factor in the emergence of mathematics anxiety. Children can pick up the fear and anxiety from their parents. Thus, the individual gets mathematics anxiety from teachers and parents through intuition and taking them as models (Tanyolaç, 1996). Mathematics anxiety is one of the affective variables that can prevent both learning (Fiore, 1999; Stuart, 2000) and performance (Hembree, 1990; Ho et al., 2000; Liebert and Morris, 1967; Richardson and Suinn, 1972; Wigfield and Meece, 1988).
In recent years, there were some exciting explorations related to how students can organize own nature, sources, and progress of their learning processes (Zimmerman and Schunk, 2001). Self-regulation, which is considered among the factors that affect success and academic performance the most, was defined and modeled from many theoretical perspectives (Sağırlı, et al., 2010). According to Bandura, who pioneered the social cognitive theory, self-regulation focuses on indivi-duals’ thinking on their abilities and capacity regarding the behaviors that they will exhibit (Çiltaş and Bektaş, 2009). Zimmerman, who first set forth the necessity of structuring the self-regulated learning in education, defined the self-regulated learning as a learning process incorporating the skills of organization, evaluation, ma-nagement and control that the students put into practice

686 Educ. Res. Rev. to obtain information (Cheng, 2011). Pintrich (2000) defined self-regulation as“an active and constructive process whereby students set goals for their learning and then attempt to monitor, regulate, and control their cognition, motivation and behavior, guided and constrained by their goals and contextual features of the environment”. Risemberg and Zimmerman (1992) defined self-regulation as “setting objectives, developing strategies to actualize these objectives and monitoring what they gained through these strategies”. Kauffman (2004) defined self-regulation as “learner’s effort to control and manage complicated learning activities”.
The concept of self-regulation, which means students organizing the learning process as they wish, has become the primary subject of the latest studies conducted on academic success. Many of the studies, which were conducted on self-regulation skill, set forth that there is a positive significant relationship between self-regulation based learning strategies, motivational beliefs and course success. Cervone and Pervin (2008) stated that self-regulations include specific cognitive and metacognitive abilities such as changing a behavior that is continuing, planning strategies, and tending to be a goal-setting. The common profile formed upon self-regulations is shaped as that “students play effective role in learning processes behaviorally, cognitively, and motivationally” (Zimmerman, 1986; Zimmerman and Schunk, 1989). Boekaerts et al. (2005) indicated that self-regulated learning is a kind of self-management process that is repetitive and has many variables changing environmental, cognitive, affective, and behavioral elements. Pintrich (2004) mentioned four conjectures composing a base on self-regulated learning theory to provide component process and its relation with self-regulated learning. These are as follows. First of all, it is supposed that learners are active in meaning construc-tion and goal-setting in self-regulated learning. Secondly, learners have potential of controlling their own learning. Thirdly, learning behavior is not random, instead it is purposive. Lastly, self-regulated activities have mediator role between personal and contextual characteristics and real achievement or performance.
In a study conducted by Pintrich and De Groot (1990), the relationship among motivation, learning self-regulation and classroom academic performance were examined. It has been discovered that self-regulation and intrinsic value have a positive relationship with cognitive connection and performance, and self-regulation, self-efficacy and test anxiety are the best predictors of performance.In their study conducted on mathematics course, Alcı and Altun (2007)determined that there were significant differences between students’ self-regulation and metacognition skills in terms of their gender and high school class level whereas there was no difference among these skills in terms of fields. In a study conducted by Haşlaman and Aşkar (2007), it was found that the students’ self-regulated learning strategies explained 71% of success which incorporated assigning
values, gravitating towards the external aim, setting aims, repeating, self-reflection, self-efficacy perception, endea-voring, working with others and time management. In their study, Üredi and Üredi (2005) examined predictive power of 8th grade students’ self-regulation strategies and motivational beliefs on their mathematics success. They discovered that self-regulation strategies and motivational beliefs explained 30% of the total variance regarding mathematics success, and the use of cognitive strategy is the most powerful predictive variable. Azevedo et al. (2008) investigated how self-regulation based learning and external effect with self-regulated learning affect students in multiple environment. They subjected the self-regulation based learning and external effect with self-regulated learning to 128 students who were enrolled in middle and high schools. Self-regulation based learning group with external effect learnt the self-regulation abilities with the help of special teaching software, while the others learnt them on their own. According to the analysis of the results gathered from pre-and post-tests and interviews during experimental processes, those who learnt with the help of self-regulation based learning with external effect had more knowledge than others and post-test results indicated that development of their intellectual abilities increased substantially. In a study conducted on students who were unsuccessful in mathe-matics and reading comprehension lessons, they were taught how to use self-regulation strategies on the way to follow, how to manage their understandings and how to fulfill their inadequacies when necessary. At the end of the study, it was observed that students’ achievements and self-regulation perceptions increased sharply.
Many activities can be performed in elementary educa-tion level, in which the foundations of learning are laid, for the mental development of students. Thus, students’ attitudes, interests, success and self-self-regulation skills towards mathematics course can develop. Mathematics knowledge, which has not developed at an adequate level in elementary education, may cause students to encounter difficulties in their forthcoming educational lives. Therefore, students’ anxiety towards mathematics and their self-regulated learning must be determined in their elementary education years in order for them to get mathematics instruction in the best manner. In this context, the aim of this study is to determine whether or not there is a relationship between secondary school students’ self-regulation and mathematics anxiety. METHOD Design The research was planned in a causal design in order to examine the predictive power of secondary school students’ level of anxiety towards mathematics course on their self-regulation skills. Causal design is a research design that examines cause-and-effect relationships that emerge or exist among certain variables. Causal research design is used when it is considered that the relationship between research variables is a cause-and-effect relationship

Işleyen 687
Table 1. Distribution of demographic information of the sample group. Options Total
Gender
Male Female -
n 142 141 283 % 50.2 49.8 100
Class level 5th grade 6th grade 7th grade 8th grade -
n 82 54 72 69 283 % 31.10 19.08 25.44 24.38 100
(Karadağ, 2009).Therefore, the concept of anxiety towards mathe-matics course was taken as the independent variable whereas the concept of self-regulation was taken as the dependent variable. Sample Sample of the research is composed of a total of 283 5th-6th-7th-8th grade students who were selected from a state secondary school located in Erzurum. Convenience sampling was used in the research. In convenience sampling (also called available sampling) a group of subjects is selected on basis of being accessible or expedient (McMillan and Schumacher, 2010, p.137). Information about the participants on genders in class levels of the students are given in Table 1.
There were 283 participants in this study; 142 were males and 141 of were males. Among them, 82 participants were 5th grade, 54 participants were 6th grade, 72 participants were 7th grade and 69 participants were 8th grade students. Data collection tools Mathematics anxiety scale In the study, Mathematics Anxiety Scale towards elementary school students was used to determine students’ mathematics anxiety levels. Mathematics Anxiety Scale, which was developed by Şentürk (2010) towards elementary school students and validity and reliability studies of which were also conducted by him, is composed of five sub-dimensions, namely as mathematics anxiety rooted from attitude towards mathematics (1 to 4 items), mathematics anxiety rooted from the inadequacy of self-confidence (5 to 9 items), mathematics anxiety rooted from field knowledge (10 to 13 items), learning anxiety (14 to 17 items) and exam anxiety (18 to 22 items).The scale is of 5-point Likert type. Students graded the items in the Mathematics Anxiety Scale towards elementary school students as1:I never get anxious, 2: I hardly get anxious, 3: I occasionally get anxious, 4: I frequently get anxious, 5: I always get anxious, according to in what degree students felt anxiety about the feeling, thought, and behaviors that items proposed. Then, the total score was calculated. Total score gathered was considered as each student’s mathematics anxiety score at the end. The scale is composed of 22 items. Cronbach’s Alpha value, which was calculated was .92. Self-regulation skill scale The scale, which was developed by Arslan (2008) and validity and reliability studies of which were also conducted by him, is composed of three sub-dimensions, namely as effort organization and time and study organization.The scale is of 5-point Likert type [completely disagree (1), disagree (2), partially agree (3), agree (4) and completely agree (5)]. The negative items in the scale are
calculated by being graded inversely.They were calculated as completely agree (1), agree (2), partially agree (3), disagree (4), and completely agree (5). Cronbach’s Alpha value was calculated for all sub-dimensions and the overall scale in this research was.87. Data analysis The Pearson Product-Moment Correlation Coefficient Analysis was used in finding the relationships among the scores obtained in mathematics anxiety scale and self-regulation skill scale in analyzing the data obtained from the research.The Multilinear Regression Analysis was used in determining the degree to which the scores obtained from the mathematics anxiety scale predicted the scores obtained from the self-regulation skill scale. In the analyses, sub-dimensions of mathematics anxiety scale [(i) attitudes, (ii)self-confidence, (iii) field knowledge, (iv) learning (v) exam] were taken as the independent variable whereas self-regulation skill was taken as the dependent variable. FINDINGS The results of the correlation analysis, which was con-ducted to set forth the relationship between mathematics anxiety and self-regulation skill, are given in Table 2.
When Table 2 was examined, it was concluded that there was a negative significant relationship among attitude, cognitive organization [r=-.30], effort organization [r=-.13] and time and study organization [r=-.17] which are among the sub-dimensions of mathematics anxiety. A negative significant relationship was found among self-confidence, cognitive organization[r=-.36], effort organiza-tion [r=-.11], time and study organization [r=-.22] and self-regulation skilltotal score [r=-.31] which are among the sub-dimensions of mathematics anxiety. Similarly, a relationship was found among field knowledge,cognitive organization[r=-.30], effort organization [r=-.12], time and study organization [r=-.22]and self-regulation skilltotal score [r=-.28]. A relationship was found among learning anxiety,cognitive organization[r=-.10], effort organization [r=-.07],time and study organization [r=-.12]and self-regulation skilltotal score [r=-.05]. It was found that there was a negative significant relationship was discovered among exam anxiety, cognitive organization[r=-.26], effort organization [r=-.04], time and study organization [r=-.21]and self-regulation skilltotal score [r=-.21].A negative significant relationship was found between mathematics

688 Educ. Res. Rev.
Table 2. Correlation matrix between mathematics anxiety and self-regulation skill.
Variables 1 2 3 4 5 6 7 8 9 10 1-Attitude - 2-Self-Confidence .64* - 3-Field Knowledge .55* .67* - 4-Learning .38* .46* .37* - 5-Exam .60* .70* .57* .56* - 6-Cognitive organization -.30* -.36* -.30* -.10* -.26* - 7-Effort Organization -.13* -.11* -.12* -.07* -.04* .35* - 8-Time and Study Organization -.17* -.22* -.21* -.12* -.21* .33* .54* - 9-Self-Regulation Skill [Total] -.27* -.31* -.28* -.05* -.21* .82* .80* .66* - 10-Mathematics Anxiety [Total] .76* .88* .76* .71* .87* -.32* -.08* -.23* -.27* -
η=283, *p<.01.
Table 3. Multilinear regression matrix between mathematics anxiety and self-regulation.
Individual values B SHB β t p Constant 84.231 2.412 34.924 .000 Attitude -.529 .330 -.124 -1.603 .110 Self-Confidence -.578 .245 -.219 -2.357 .019 Field Knowledge -.461 .316 -.114 -1.459 .146 Learning .439 .201 .149 2.188 .030 Exam -.018 .233 -.007 -.077 .938
η=283, R=.36, R2=.13, F=8.151, p<.01. anxiety and self-regulation skill[r=-.27].
The results of the multi-linear regression analysis, which was conducted to determine the degree to which secondary school students’ mathematics anxiety predict-ed their self-regulation skill in accordance with their perceptions, are given in Table 3. The compatibility of the scores on the variables to the regression model was found by determining that D-W (1.946), VIF (1<VIF<5) values and Q-Qplot exhibited a normal distribution.
The collective predictive power of all sub-dimensions of mathematics anxiety on self-regulation skill score was found statistically significant [F(5-277)=8.151, p<.01]. Five predictive variables can collectively explain 13% of the change in self-regulation skill score[R=.36, R2=.13]. Furthermore, when the independent variables were separately examined, it was found that the sub-dimensions of self-confidence [β=-.219] and learning anxiety [β=-.149]had the power to single-handedly explain self-regulation skill in order of importance. DISCUSSION AND CONCLUSION The study concluded that there was a negative significant relationship among attitude,cognitive organization, effort
organization and time and study organization which are among the sub-dimensions of mathematics anxiety of secondary school students. Therefore, we can state that the secondary school students, who had high level of cognitive organization, effort organization and time and study organization, had low level of attitudes.
A negative significant relationship was discovered among self-confidence,cognitive organization, effort organization, time and study organization and self-regulation skill total score which are among the sub-dimensions of mathematics anxiety.Therefore, we can state that the secondary school students, who had high level of cognitive organization, effort organization, time and study organization and self-regulation skills, had low level of self-confidence. Similarly, a negative significant relationship was discovered among field knowledge, cognitive organization, effort organization, time and study organization and self-regulation skill total score. In view of these findings, we can state that the secondary school students, who had high level of cognitive organization, effort organization, time and study organization and self-regulation skills, had low level of field knowledge.
A negative significant relationship was discovered among learning anxiety, cognitive organization, effort organization, time and study organization and self-

regulation skill total score. In view of these findings, we can state that the secondary school students, who had high level of cognitive organization, effort organization, time and study organization and self-regulation skills, had low level of learning anxiety.
It was found that there was a negative significant relationship among exam anxiety, cognitive organization, effort organization, time and study organization and self-regulation skill total score. In view of these findings, we can state that the secondary school students, who had high level of cognitive organization, effort organization, time and study organization and self-regulation skills, had low level of exam anxiety.
A negative significant relationship was also found between mathematics anxiety and self-regulation skill. Therefore, it was observed that the secondary school students, who had high level of mathematics anxiety, had low level of self-regulation skills. In their study, Üredi and Üredi found that self-regulation positively and significantly predicted mathematics success whereas exam anxiety negatively and significantly predicted mathematics success. Similarly, in a study conducted by Chye et al. (1997) on university students, it was found that there was a high level of relationship among the use of self-regulation strategy, self-efficacy and academic success. In a study conducted by Pintrich and De Groot (1990) on elementary 7th grade students, they found that self-regulation, self-efficacy and exam anxiety were important variables in predicting the students’ performance.
In a study conducted by Young and Vrongistinos (2002) on prospective teachers, they found that intrinsic objective orientation, value attached to duty, self-efficacy belief,interpretation and level of the use of metacognition strategy of the students with high level of success were higher than those of the students with low level of success.Similarly, in a study conducted by Andrew and Wialle (1998) on nursing students, they found that there were significant relationships among nursing-related academic self-efficacy, scientific self-efficacy, value attached to duty,self-efficacy for learning and perfor-mance, critical thinking, self-regulation of metacognition and academic performance.In a research conducted by Malpass,et al. (1999) on secondary school students, they found that there was a negative relationship between anxiety and mathematics success whereas there was a positive relationship between self-regulation and mathematics success.
The collective predictive power of all sub-dimensions of mathematics anxiety on self-regulation skill score was found statistically significant. Five predictive variables can collectively explain 13% of the change in self-regulation skill score. Furthermore, when the independent variables were separately examined, it was discovered that self-confidence and learning anxiety sub-dimensions had the power to single-handedly explain self-regulation skill order of importance.
It is considered that comparing the predictive power of self-regulation on success in different age groups; exami-
Işleyen 689 ning self-regulation in other courses such as science, social sciences and Turkish apart from mathematics course; and making comparisons according to subject areas are among the activities that are required in this field. Conflict of Interests The author has not declared any conflict of interest. REFERENCES Aiken LR (1970). Attitudes toward mathematics. Rev. Educ. Res.
40(4):551-596. Alcı B, Altun S (2007).Lise öğrencilerinin matematik dersine yonelik
özdüzenleme ve bilişüstü becerileri, cinsiyete, sınıfa ve alanlara göre farklılaşmakta mıdır?, Çanakkale Üniversitesi Sosyal Bilimler Enstitüsü Dergisi, 16(1):33-44.
Alkan V (2009). The relationship between teaching strategies and styles and pupils’ anxiety in mathematics at primary schools in turkey. Unpublished PhD Thesis. The University of Nottingham.
Altun M (1994).Matematik öğretimi (2.Baskı), Ak Ajans Matbaacılık, Bursa.
Andrew S, Vialle W (1998). Nursing students’ self-efficacy, self-regulated learning andacademic performance in science teaching. Paper presented at the Australian Association forResearch in Education Conference. Retrieved March 9, 2003 from <http://www.aare.edu.au/98pap/ abs98.html>.
Arslan A (2008). İşbirliğine dayalı öğrenmenin, erişiye, kalıcılığa, öz yeterlik inancına ve öz düzenleme becerisine etkisi. Unpublished doctoral dissertation, Hacettepe Üniversitesi, Ankara.
Azevedo R, Moos DC, Greene JA, Winters FI, Cromley JC (2008). Why is externally facilitated regulated learning more effective than self-regulated learning with hypermedia? Educ. Technol. Res. Devel. 56(1):45 72.
Baloğlu M (2001). How do previous mathematics courses affect mathematics anxiety, The 8th Annual Research forum of the Sigma Xi, 19 Nisan 2001, Commerce.
Başar M, Ünal M, Yalçın M(2002). İlköğretim kademesiyle başlayan matematik korkusunun nedenleri, V. Ulusal Fen Bilimleri ve Matematik Egitimi Kongresi 16-18 EylüL. ODTÜ, Ankara
Baykul Y (1999). İlköğretimde matematik öğretimi. Anı Yayıncılık, Ankara.
Bessant KC (1992). Instructional design and the development of statistical literacy. Teach. Sociol. 20:143-149.
Boekaerts M, Maes S, Karoly P (2005). Self-regulation across domains of applied psychology: Is there an emerging consensus? Applied Psychology: Int. Rev. 54(2):149–154.
Campbell K, Evans C (1997). Gender issues in the classroom: A comparison ofmathematics anxiety. Educ. 117(3): 332-339.
Cervone D, Pervin LA (2008). Personality: Theory and research. Hoboken, NJ:Wiley.
Cheng EK (2011). The Role of Self-Regulated Learning in Enhancing Learning Performance, Int. J. Res. Rev. 6(1):1-16.
Chipman SF, Krantz DH, Silver R (1992). Mathematics anxiety and science careers among able college women. Psychol. Sci. 3:292- 295.
Chye S, Walker RA, Smith I (1997). Self regulated learning in tertiary students: the role ofculture and self efficacy on strategy use and academic achievement. Annual Conference of theAustralian Association for Research in Education. Retrieved March 12, 2003 from<http://www.aare.edu.au/97pap/chyes350.htm>.
Çiltaş A, Bektaş F (2009). Sınıf öğretmenliği öğrencilerinin matematik dersine ilişkin motivasyon ve öz-düzenleme becerileri. J. Qafqaz University. 28:153-159.
Çoban A (1989). Ankara Merkez Ortaokullarındaki Son Sınıf Öğrencilerinin Matematik Dersine İlişkin Tutumları. Yayınlanmamış Yüksek Lisans Tezi, Gazi Üniversitesi, Ankara.

690 Educ. Res. Rev. Drejer RM, Aiken LR (1957). The identification of number anxiety in a
college population. J.Educ.Psychol., 48:344-351. Erden M, Akgül S (2010). İlköğretim öğrencilerinin matematik kaygısının
ve öğretmen sosyal desteğinin matematik başarısını yordama gücü. Eğitimde Kuram ve Uygulama, 6(1):3-16.
Fiore G (1999). Math-abused students: are we prepared to teach them? Math. Teacher. 92(5):403–406.
Gierl MJ, Bisanz J (1995). Anxieties and attitudes related to math in grades 3 and 6. J. Experimental Educ. 63(2):139-158.
Hannula M (2005) “Affect in mathematical thinking and learning. The Future of Mathematics Education and Mathematics Learning”. BIFEB Strobl.Austria, August,
Haşlaman T, Aşkar P (2007). Programlama Dersi ile İlgili Öz-düzenleyici ÖğrenmeStratejileri ve Başarı Arasındaki İlişkinin İncelenmesi, Hacettepe ÜniversitesiEğitim Fakültesi Dergisi, Sayı:32, Sayfa:110-122,
Hembree R (1990). The nature, effects and relief of mathematics anxiety. J. Res. Math. Educ. 21:33-46.
Ho Esther Sui-Chu (2007). Association Between Self-Related Cognition and Mathematics Performance: The Case In Hong Kong. Educ. J. 35(2):59-76.
Ho H, Senturk D, Lam AG (2000). The affective and cognitive dimensions of math anxiety: A cross-national study. J. Res. Math. Educ. 31(3):362–79.
Işık A, Çiltaş A, Bekdemir M (2008) “Matematik Eğitiminin Gerekliliği ve Önemi” Kazım Karabekir Eğitim Fakültesi, (KKEF),17.
Izard CE (1972). Patterns of Emotions: A New Analysis of Anxiety and Depression. New York: Academic Press.
Kauffman DF (2004). Self-Regulated Learning in Web-Basid Environments: İnstructional ToolsDesigned to Facilitate Cognitive Strategy Use, Metacognitve Processing and MotivationalBeliefs, J. Educ. Comput. Res. 30:139–161,
Liebert RM, Morris LW (1967). Cognitive and emotional components of test anxiety: A distinction and some initial data. Psychol. Reports. 20:975-978.
Ma X, Xu J (2004). The Causal Ordering of Mathematics Anxiety and Mathematics Achievement: A Longitudinal Panel Analysis. Journal of Adolescence, 27(2):165-179.
Malpass JR, O’Neil J, Harold F, Hocevar D (1999). Self regulation, goal orientation, selfefficacy, worry and high stakes math achievement for mathematically gifted high school students. Roeper Rev. 21(4):281-290.
McMillan JH, Schumacher S (2010). Research in education: evidence-based inquiry, 7th edition. Boston: Pearson
Minato S, Yanase S (1984). On The Relationship Between Students’s Attitudes Toward School Mathematics and Their Levels of İntelligence. Educ. Stud. Math. 15:313-320.
Pintrich PR (2000). The Role of Orientation in Self-Regulated Learning, In Boekaerts, M.,Pintrich, P.R., ve Zeidner, M. (Eds.), Handbook of Self-Regulation, (pp.451-501), SanDiego, CA: Academic Pres,
Pintrich PR, De Groot E (1990). Motivational and self regulated learning components ofclassroom academic performance. J. Educ. Psychol. 82(1):33-40.
Posamentier AS, Stepelman J (1986). Teaching secondary school mathematics. Ohio: Charles E. Merrill Publishing Company.
Richardson FC, Suinn RM (1972) “The Mathematics Anxiety Rating Scale: Psychometric Data”, J. Counsel. Psychol. 19:551–554.
Risemberg R, Zimmerman BJ (1992). Self-Regulated Learning in Gifted Students, RoeperReview, Cilt:15, Sayı:1, 98–101.
Skiba A (1990). Reviewing an old subject: Math anxiety. Math. Teacher, 84:3.
Stuart VB (2000). Math Curse or Math Anxiety?. Teach. Children Math.
6:330–40. Suinn RM, Edwards R (1982). The Measurement Of Mathematıcs
Anxiety: The Mathematıcs Anxiety Rating Scale For Adolescents-Mars-A. J. Clinical Psychol. 38:576-577.
Şahin FY (2004). Ortaöğretim öğrencilerinin ve üniversite öğrencilerinin matematik korku düzeyleri. Eğitim Bilimleri Dergisi, 3(5).
Şahin FY (2000). Matematik kaygısı, Eğitim Araştırmaları. 1(2):75-79, Şentürk B (2010). İlköğretim beşinci sınıf öğrencilerinin genel başarıları,
matematik başarıları, matematik dersine yönelik tutumları ve matematik kaygıları arasındaki ilişki. Yayınlanmamış Yüksek Lisans Tezi, Afyon Kocatepe Üniversitesi, Sosyal Bilimler Enstitüsü.
Tanyolaç G (1996). 11-12 Yaş düzeyindeki öğrencilerin korku yaygınlıklarının bazı değişkenler açısından incelenmesi, Yüksek Lisans Tezi, Hacettepe Üniversitesi Sosyal Bilimler Enstitüsü, 78s.
Tobias S (1990). Math anxiety: an update. NACADA J. 10(1):47-50. Üredi I, Üredi L (2005). İlköğretim 8.Sınıf Öğrencilerinin Öz-Düzenleme
Stratejilerive Motivasyonel İnançlarının Matematik Başarısını Yordama Gücü., MersinÜniversitesi Eğitim Fakültesi Dergisi. 1(2):250–260,.
Young SH, Vrongistinos K (2002). In-service teachers’ self-regulated learning strategiesrelated to their academic achievement. J. Instructional Psychol. 29(3):147-154.
Yücel Z, Koç M (2011). The Relationship Between The Prediction Level of Elementary School Students’ Math Achievement by Their Math Attitudes and Gender. İlköğretim Online, 10(1):133-143.
Wadlington E, Wadlington PL (2008). Helping Students with Mathematical Disabilities to Succeed. Preventing School Failure. 53(1):2-7.
Wilson S, Thornton S (2007). The factor that makes us more effective teachers": Two Pre-service Primary Teachers' Experience of Bibliotherapy, Mathematics Teacher Educ. Devel. 9:21-35.
Yuksel-Şahin F (2004). Ortaöğretim öğrencilerinin ve üniversite öğrencilerinin matematik korku düzeyleri. Eğitim Bilimleri Dergisi, 3 (5).
Yuksel-Şahin F (2000). Matematik kaygısı, Eğitim Araştırmaları, 1(2):75-79.
Zakaria E, Nordin NM (2008). The effects of mathematics anxiety on matriculation students as related to motivation and achievement. Eurasia J. Math. Sci. Technol. Educ. 4(1):27-30.
Zettle R, Raines S (2000). The relationship of trait and text anxiety with mathematics anxiety. College Student J. 34(2): 246.
Zimmerman BJ (1986). Development of self-regulated learning: Which are the key subprocesses? Contemporary Educ. Psychol. 16:307–313.
Zimmerman BJ, Schunk DH (1989). Self-regulated learning and academic achievement: Theory, research and practice. Berlin Heidelberg New York: Springer.
Zimmerman BJ, Schunk DH (Eds.). (2001). Sel-fregulated learning and academic achievement: Theoretical perspectives (2nd ed.). Mahwah, NJ:Erlbaum.

Vol. 10(5), pp. 691-694, 10 March, 2015 DOI: DOI:10.5897/ERR2014.2028 Article Number: F50254351128 ISSN 1990-3839 Copyright © 2015Author(s) retain the copyright of this article http://www.academicjournals.org/ERR
Educational Research and Reviews
Full Length Research Paper
The new approach to sport medicine: 3-D reconstruction
Alparslan İNCE
Physical Education And Sport In Schools, Ordu University Ordu, Turkey.
Received 30 November, 2014; Accepted 16 February, 2015
The aim of this study is to present a new approach to sport medicine. Comparative analysis of the Vertebrae Lumbales was done in sedentary group and Muay Thai athletes. It was done by acquiring three dimensional (3-D) data and models through photogrammetric methods from the Multi-detector Computerized Tomography (MDCT) images of the Vertebrae Lumbales sections in male Muay Thai athletes and the sedentary (control) group. 5 male Muay Thai athletes and 5 male sedentary individuals from Ordu Province participated in this study. The Vertebrae Lumbales of 5 male Muay Thai athletes and 5 sedentary (control group) participants were scanned with high-resolution MDCT devices. The resulting 2-D axial images were transferred to CD-ROMs in DICOM format and then to a PC installed with 3D-Doctor 5.0, a three dimensional modeling software. Reconstruction of the data was conducted via the 3-D rendering component of this software. All measurements were automatically calculated via the aforementioned software and Mann Whitney-U test analysis technique. SPSS 15.0 statistical package programme was used for statistical analyses. The statistical results of the vertebrae lumbales showed significant differences (P<0.05) in L1 volume (mm3), in terms of statistical aspect, in both Muay Thai athletes and sedentary participants. Meanwhile, the biometric measurements showed a more significant deformation only in the L1 segment of the Vertebrae Lumbales. Consequently, it was expected that these kinds of researches will contribute to the development of infrastructure work to be conducted on Muay Thai athletes using the MDCT technique and to the appreciation of the need for the involvement of 3-D Reconstruction Procedures in Sports Medicine.
Key words: Sports medicine, athletes, three-dimensional reconstruction. INTRODUCTION The diagnosis and treatment of diseases in vertebrae lumbales has gained fairly new dimensions due to the advancements in the field of technology and the reflection of anatomic knowledge into clinic applications. Research on this field usually comprises regulations and
implementation of national and international ethic rules whose scope gradually expands. Reducing the cadaver population to minimum levels, and promoting scientific data in training, instruction and academic studies are regarded as concepts that should not be ignored by
E-mail: [email protected]. Tel: +904522265249. Fax: +904522265239 Authors agree that this article remain permanently open access under the terms of the Creative Commons Attribution License 4.0 International License

692 Educ. Res. Rev.
Table 1. Three-dimensional analysis of lumbales vertebrae.
N Lumbal Muay Thai Sedentary Mann Whitney U Volume (mm³) Mean rank Sum of ranks Mean Rank Sum of ranks U Z P 10 L1 3.20 16.00 7.80 39.00 1.000 -2.402 .016*
anatomists. MDCT is an efficient diagnostic modality which produces two dimensional (2-D) multi-planar (horizontal, coronal, sagittal, axial etc.) images of the anatomic structure of bones and deformities (Hall, 1994). MDCT renders hundreds of 2-D multi-planar images in just seconds which may then be transformed into 3-D by means of computer software (Hu et al., 2000).
3-D geometric modeling has a widespread use in medical training along with plastic surgery, orthopedic surgery, traumatology, neurosurgical applications (Krupa et al., 2004).
Studies in the field of Muay Thai are mainly on injuries, injury rates, physiologic reactions, Muay Thai Time-Motion analysis etc. and rarely on biomechanical studies (Gartland et al., 2001; Antonio et al., 2009; Jeronimo et al., 2011).
Literature review indicates no prior study on detailed assessment and the 3-D reconstruction of CT images of Vertebrae Lumbales in Muay Thai athletes. The structure of the Vertebrae Lumbales sections acquired from sedentary group and Muay Thai Athletes by means of Multi-detector Computerized Tomography (MDCT) will be reconstructed in 3-D in order to assess the Vertebrae Lumbales of these two groups. MATERIAL AND METHODS This research was performed according to Declaration of Helsinki. In scope of the study, the Vertebrae Lumbales of 5 Muay Thai athletes and 5 sedentary (control group) participants were scanned in high-resolution (Somatom Sensation 64; Siemens Medical Solutions, Forchheim, Germany) MDCT diagnostic device.
The parameters of the MDCT device were set as follows: physical detector collimation at 32 x 0.6 mm; final section collimation at 64 x 0.6 mm; section thickness at 0.75 mm; gantry rotation timing at 330 msec; kVp at 120; mA at 300; resolution at 512 x 512 pixels; resolution spacing at 0.92 x 0.92. Dose parameters and scans were conducted based on standard protocols and literature (Prokop, 2003; Kalra et al., 2004). Scans of the control and experimental groups were conducted in supine position. The resulting 2-D axial images were transferred to CD-ROMs in DICOM format and then to a PC installed with 3D-Doctor 5.0 (Copyright© 1998-2013 Able Software Corp.), a three dimen-sional modeling software. During the segmentation process, the operational procedures applied by researchers (Bazille et al., 1994) were adopted. Table 1.
The resulting segmentation was called semi-automatic segmentation. Manual correction time took approximately 3 to 5 min / per section image. At the first phase of semi-automatic segmentation, the bone boundaries were structured automatically. After the automatic boundary segmentation; the spots, which were unable to be properly positioned on the bones, were manually corrected one by one with a PC mouse by means of interactive
boundary editing routine (Figure 1). After the manual correction was checked, the corrected boundaries of the bone surface were overlapped with automatic ones. Reconstruction of the data was conducted via the 3-D rendering component of this software (Figure 2). The volume and surface area of vertebral bones composing the Vertebrae Lumbales were automatically measured by the 3-D software.
The statistical analyses were made via Mann Whitney-U test analysis technique in SPSS 15.0 statistical package programme. Statistical significance was recorded as P < 0.05.
Statistical analysis was carried out on the 3-D biometric values of the bones as reconstructed from the Muay Thai and sedentary groups. The results from the Vertebrae Lumbales showed considerable statistical significance (P<0.05) only on the volume of the Lumbales among the L1 vertebral bones in the Muay Thai and sedentary groups. DISCUSSION To date, various research on Muay Thai athletes is been conducted (Tony and Nigel, 2012; Tony et al., 2014; Barry, 2011). However, no prior study on detailed assessment and the 3-D reconstruction of CT images of Vertebrae Lumbales in Muay Thai athletes are available. The results from the Vertebrae Lumbales showed considerable statistical significance (P<0.05) only on the volume (mm3) of the Lumbales among the L1 vertebral bones in the Muay Thai and sedentary groups. Baker and Patel (2005) informed that stress fractures and degenerative illnesses of spinal column caused waist aches. This indicates the importance of L1 value determination at this study. This assertion does not support the claims of Pettersson et al. (1998) that both muscular force and bone parameters would increase in sportsmen and those who exercise regularly. In a study conducted on elite Judo athletes and sedentary groups, Kalaycı (2008) stated that statistically the biometric rates of metacarpal and phalanges bones were larger in Judo athletes compared to sedentary group participants.
Meanwhile, all biometric measurements showed a deformation (P<0.05) only in the L1 segment of the Vertebrae Lumbales in Muay Thai athletes compared to sedentary group participants. Perspective It is believed that the biometric measurements and the 3-D images of Vertebrae Lumbales in Muay Thai athletes and other sportsmen would contribute to the appropriate therapeutic approach of orthopedists and neurologists by facilitating the diagnosis and analysis of pathologic formations (vertebral exocytose, vertebral inter-vertebral

Ince 693
Figure 1. Manually detected and corrected bone boundaries.
Figure 2. 3-D reconstruction image of the vertebrae lumbales.
hernia etc.) of these bones. Furthermore, it is believed that the models rendered by this study would also contribute to the surgical interventions in case of serious injuries in Muay Thai athletes. Meanwhile, realistic vertebral models may be developed in light of the 3-D Vertebrae Lumbales data obtained from the sedentary group participants.
It was also expected that the method used in this study and the data acquired by means of this method would broaden the point of view and provide an innovative educational approach for the students of anatomy as well as to anatomic studies in the future. Furthermore, this study is believed to make a considerable contribution to the field of sports medicine.
REFERENCES 3D-Doctor 5.0. (2014).Copyright© 1998-2013 Able Software Corp.
http://www.ablesw.com. Antonio C, Stefano V, Ivo C, Raffaele M, Filippo T, Franco M and
Alberto C (2009). Physiological rsponses and energy cost during a simulation of a Muay Thai boxing match, Applied Physiology, Nutrition and Metabolism. Vol. 34, No.2: pp. 143-150.
Baker RJ, Patel D (2005). Lower back pain in the athlete: common conditions and treatment. Pirim care. 32 (1):201-29.
Barry A. Piorkowski, Adrian Lees & Gabor J. Barton (2011). Single maximal versus combination punch kinematics, Sports Biomechanics. 10(1):1–11.
Bazille A, Guttman MA, McVeigh ER, Zerhouni EA (1994). Impact of semiautomated versus manual image segmentation errors on myocardial strain calculation by magnetic resonance tagging, Invest Radiology. 29:427–33.

694 Educ. Res. Rev. Gartland S, Malik MHA and Lovell ME (2001). Injury and injury rates in
Muay Thai kick boxing, Br. J. Sports Med. 35:308–313. Hall RK (1994). The role of CT, MRI and 3D imaging in the diagnosis of
temporomandibular joint and other or ofacial disorders in children. Australian Orthodontic J. 13:86–94.
Hu H, He HD, Foley WD, Fox SH (2000). Four multidetector-row helical CT: image quality and volume coverage speed, Radiology. 215:55–62.
Jeronimo JRS, Fabricio BDV, Luan MP, Monica YT and Emerson F (2011). Time-Motion analysis in Muay-Thai and Kick-Boxing amateur, J. Hum. Sport Exercıse. 6(3):490-496.
Kalaycı İ (2008). 3D Reconstruction of phalangeal and metacarpal bones of male judo players and sedentary men by MDCT images. J. Sports Sci. Med. 7:544-548.
Kalra MK, Maher MM, Toth TL, Hamberg LM, Blake MA, Shepard J, Saini S (2004). Strategies for CT radiation dose optimization, Radiology. 230 (3): 619-28.
Krupa P, Krsek P, Cernochova P, Molitor M (2004). 3D real modelling and CT biomodels application in facial surgery. In: Neuroradiology European Society of Neuroradiology, ISBN 0028-3940. Berlin. 141.
Pettersson U, Alfredson H, Nordström P, Henriksson K, Lorentzon R
(1998). Bone mass in female cross-country skiers, reletionship between muscle strenth and different bmd sites. Sport Medicine Unit, Orthopaedics, Universtiy of Umea. 67: 199–206.
Prokop M (2003). General principles of MDCT, Eur. J. Radiology. 45:4-10.
Tony M, Nigel B (2012). The impact of crowd noise on officiating in MuayThai: achieving external validity in an experimental setting, Front. Psychol. 3:1-7.
Tony M, Alan N, Yahya AN (2012). The Influence of Crowd Noise upon Judging Decisions in Muay Thai, Advances Physical Educ. 2(4):148-152.

Related Journals Published by Academic Journals
African Journal of History and CultureJournal of Media and Communication Studies Journal of African Studies and DevelopmentJournal of Fine and Studio ArtJournal of Languages and CultureJournal of Music and Dance
Educational Research and Reviews