Embed Size (px)
Citation preview
Educational Webinar: Evaluation tied to Return on
Investment
Wednesday, January 21, 2009National Network of Public Health Institutes
Fostering Emerging Institutes Program
Call in Number: (800) 504-8071 Call in Number: (800) 504-8071 Code: 3019823Code: 3019823
Please mute your line by pressing *6
You can un-mute your line by pressing *7
Do not put your phone on hold.
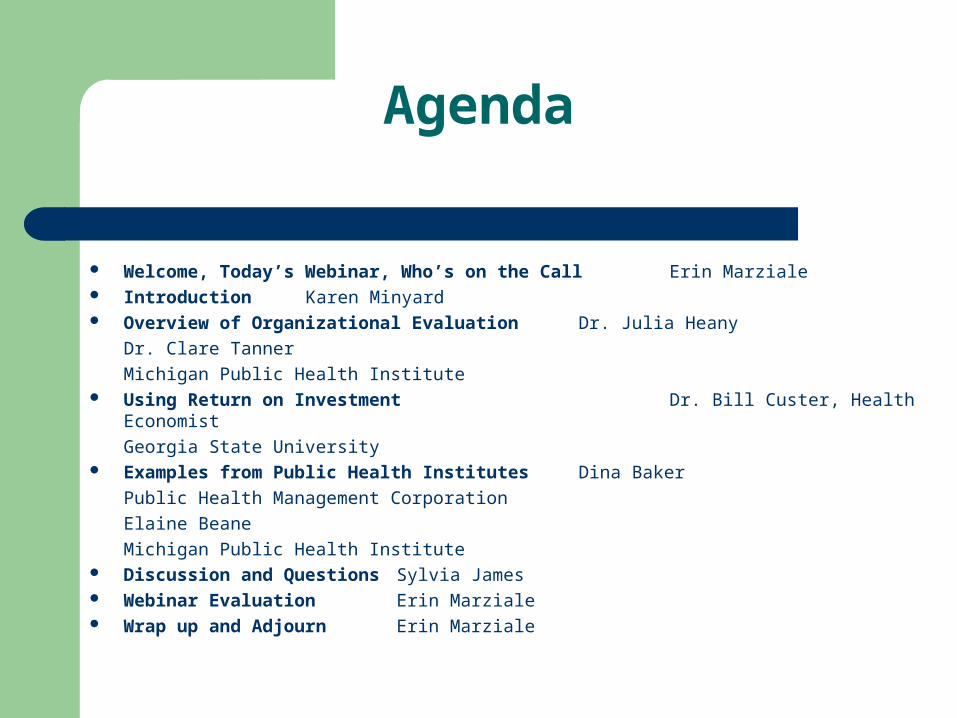
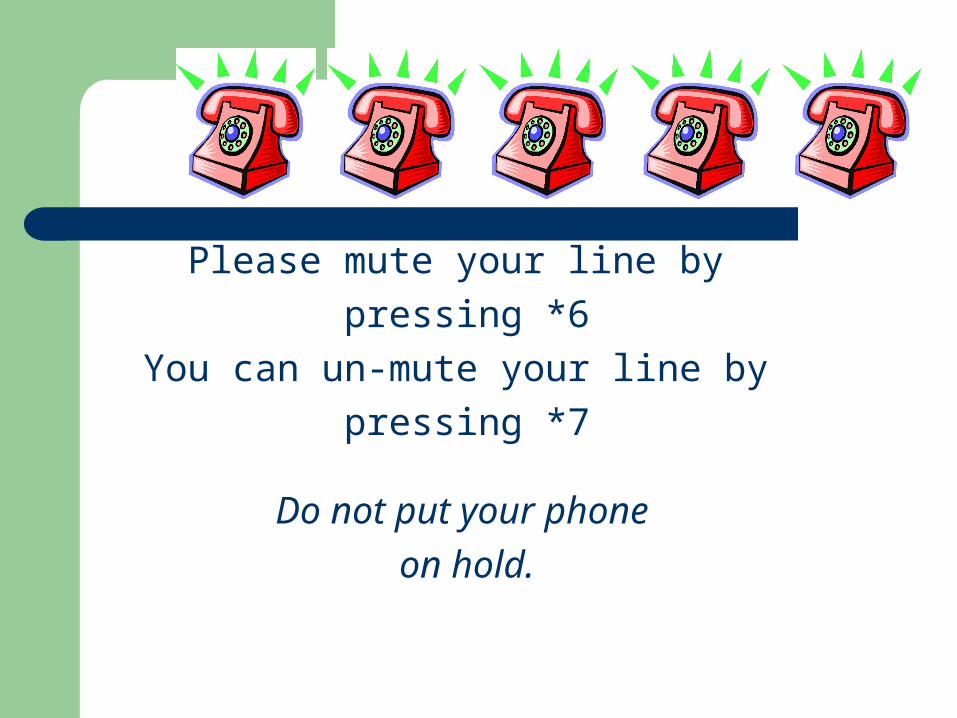
Agenda
Welcome, Today’s Webinar, Who’s on the Call Erin Marziale Introduction Karen Minyard Overview of Organizational Evaluation Dr. Julia Heany
Dr. Clare Tanner
Michigan Public Health Institute Using Return on Investment Dr. Bill Custer, Health Economist
Georgia State University Examples from Public Health Institutes Dina Baker
Public Health Management Corporation
Elaine Beane
Michigan Public Health Institute Discussion and Questions Sylvia James Webinar Evaluation Erin Marziale Wrap up and Adjourn Erin Marziale
FEIP Focus on Sustainability
Emotional Intelligence & Collaborative Leadership October 2008
Evaluations tied to ROIJanuary 2009
Communication with Multiple StakeholdersApril 2009
New Orleans Conference – Sustainability: Focus on Special Topics of InterestMay 2009
EvaluationClare Tanner, Ph.D.Julia Heany, Ph.D.
Michigan Public Health Institute
Why evaluate? To ensure a program is implemented as designed To test the assumptions that drive a program’s design To test the results of changes in a program To determine whether a program is operating
efficiently To assess the degree to which the value of achieving a
program’s goals exceeded the cost of producing them To identify whether a program achieves its intended
objectives To determine whether progress toward a program’s
goals can be related to the program
AEA’s Guiding Principles Systematic Inquiry
Evaluators conduct systematic, data-based inquiries
Competence Evaluators provide competent performance to
stakeholders Integrity/Honesty
Evaluators ensure the honesty and integrity of the evaluation process from conceptualization to dissemination and use of results
AEA’s Guiding Principles Respect for People
Evaluators respect the security, dignity, and self-worth of evaluation participants, program participants, clients, stakeholders, and the broader community
Responsibilities for General and Public Welfare Evaluators articulate and take into account the
diversity of general and public interests and values that may be related to the evaluation
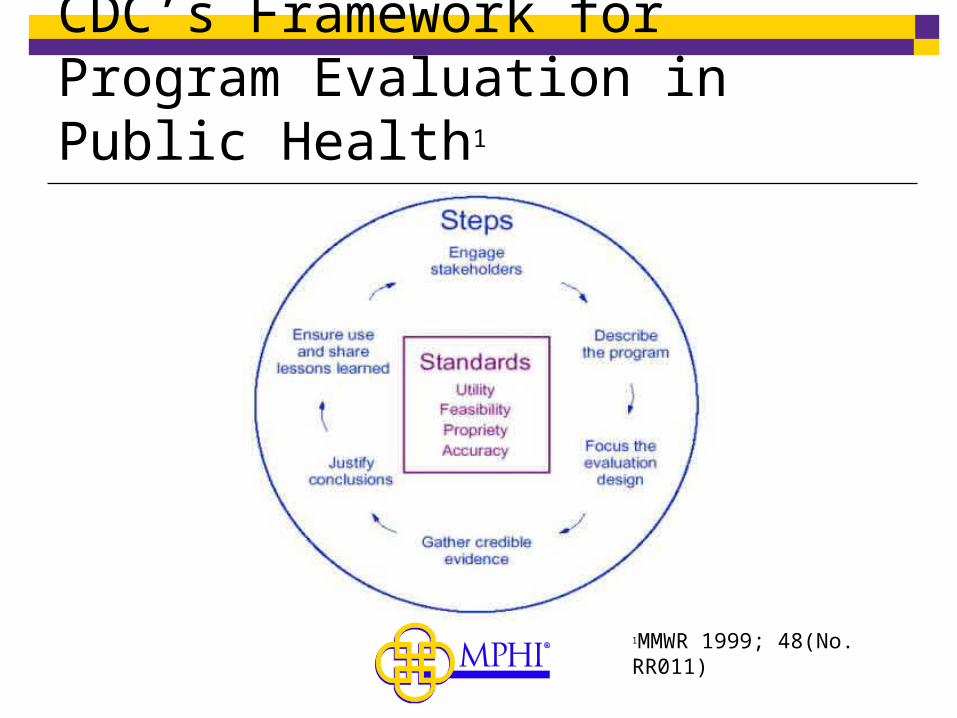
CDC’s Framework for Program Evaluation in Public Health1
1MMWR 1999; 48(No. RR011)
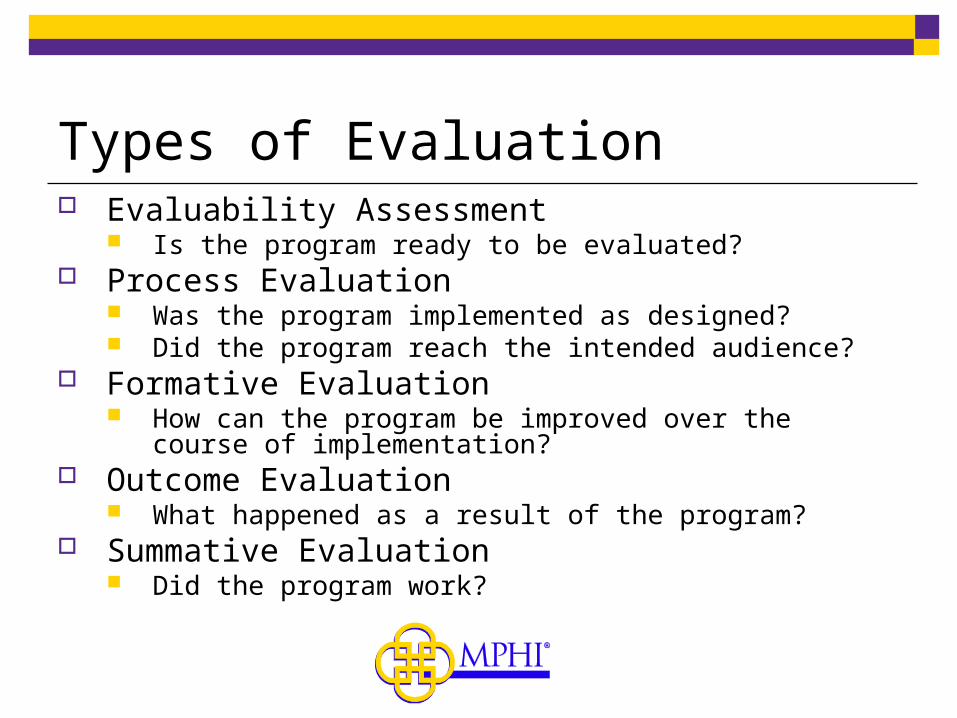
Types of Evaluation Evaluability Assessment
Is the program ready to be evaluated? Process Evaluation
Was the program implemented as designed? Did the program reach the intended audience?
Formative Evaluation How can the program be improved over the course of
implementation? Outcome Evaluation
What happened as a result of the program? Summative Evaluation
Did the program work?
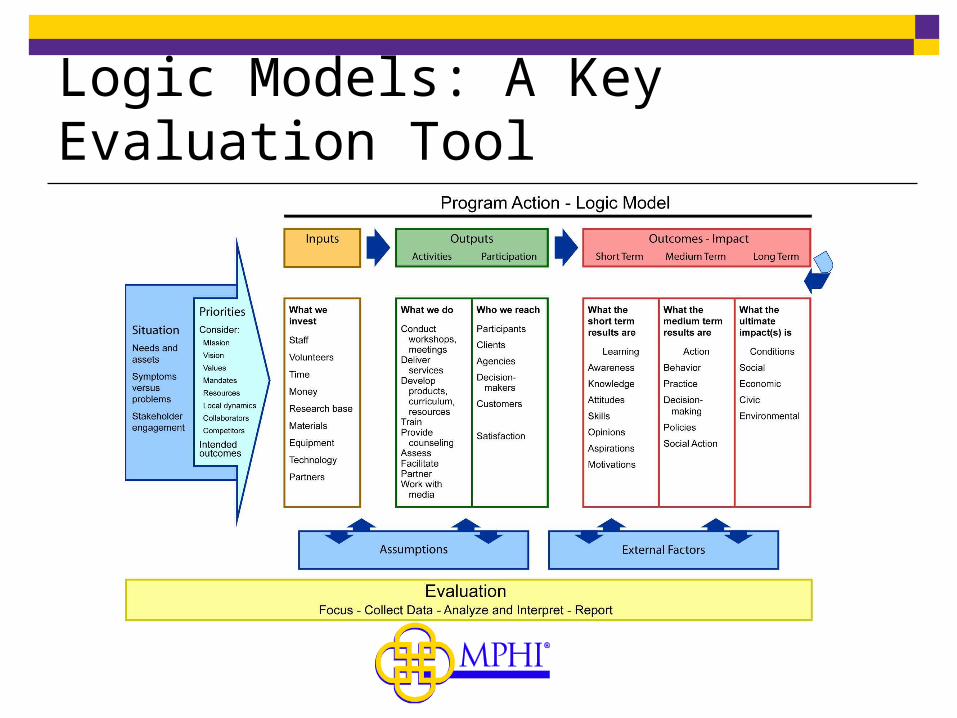
Logic Models: A Key Evaluation Tool
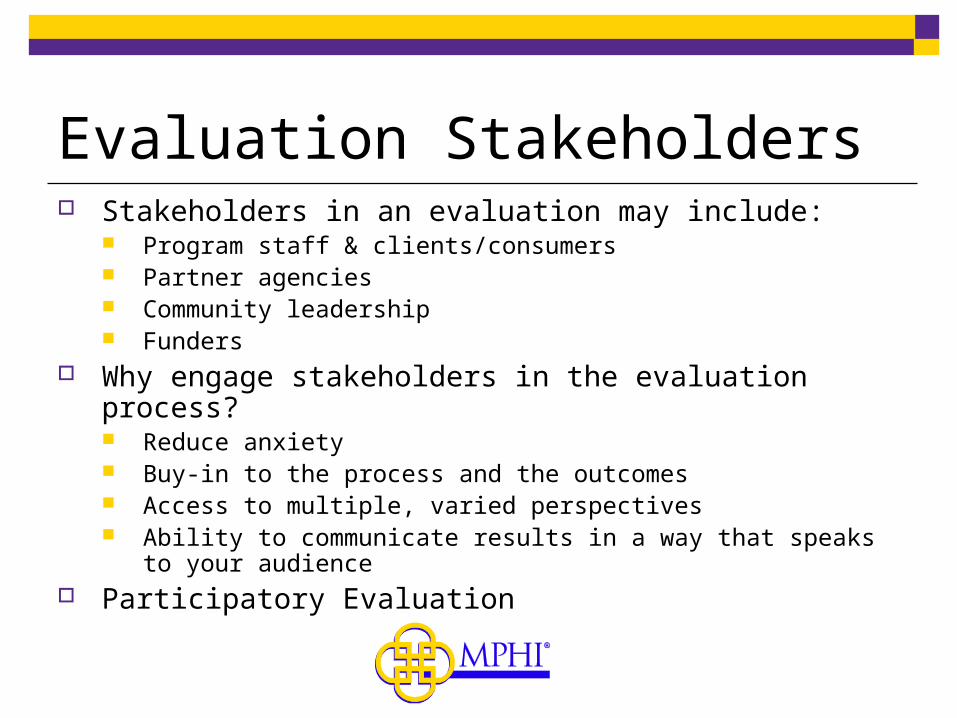
Evaluation Stakeholders Stakeholders in an evaluation may include:
Program staff & clients/consumers Partner agencies Community leadership Funders
Why engage stakeholders in the evaluation process? Reduce anxiety Buy-in to the process and the outcomes Access to multiple, varied perspectives Ability to communicate results in a way that speaks to your
audience Participatory Evaluation
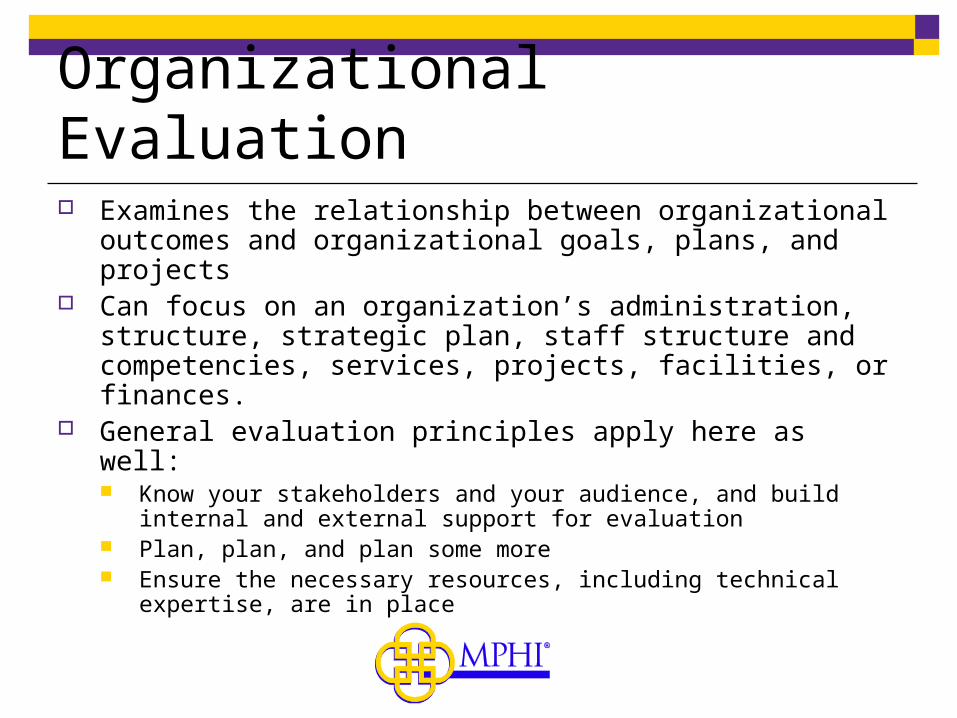
Organizational Evaluation Examines the relationship between organizational
outcomes and organizational goals, plans, and projects
Can focus on an organization’s administration, structure, strategic plan, staff structure and competencies, services, projects, facilities, or finances.
General evaluation principles apply here as well: Know your stakeholders and your audience, and build
internal and external support for evaluation Plan, plan, and plan some more Ensure the necessary resources, including technical
expertise, are in place
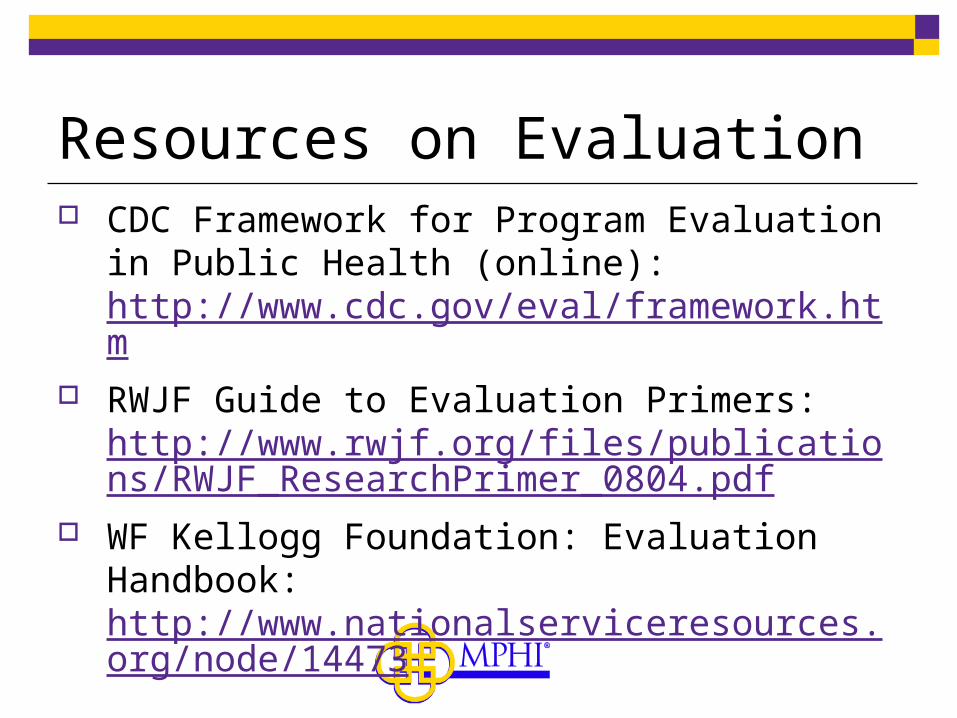
Resources on Evaluation CDC Framework for Program Evaluation in
Public Health (online): http://www.cdc.gov/eval/framework.htm
RWJF Guide to Evaluation Primers: http://www.rwjf.org/files/publications/RWJF_ResearchPrimer_0804.pdf
WF Kellogg Foundation: Evaluation Handbook: http://www.nationalserviceresources.org/node/14473
Estimating Return on Investment in Public Health
Initiatives
William Custer, Ph.DGeorgia State [email protected]
Return on Investment
Return on Community Investment: Cost-Benefit AnalysisLooks at total Social Benefit
Return on InvestmentComes from the private, for-profit sectorExamines returns to specific ‘investors’
Cost-Benefit Analysis Grew out of Public Good framework:
How to compare competing projects that provide public goods Provide return on investment estimates for public goods
Net Social Benefit= Total Social Benefit-Total Social Cost NSB= TSB-TSC The major issue is capturing all relevant costs and benefits.
Cost-Benefit Analysis: Measurement Issues
Opportunity Costs
For example: Benefits health intervention can include:Value of medical care avoidedValue of increased production when death is avoidedValue of increased production due to good healthValue of increased utility due to increased life
expectancy or better health (or both)
Cost-Benefit Analysis: Measuring Value of Life
Human Capital: income measures value Life time Earnings Do not capture non-market values
Compensating differentials: How much are people willing to pay to avoid death (or injury) Market price of safety features Risk differentials in wages reflect value of life
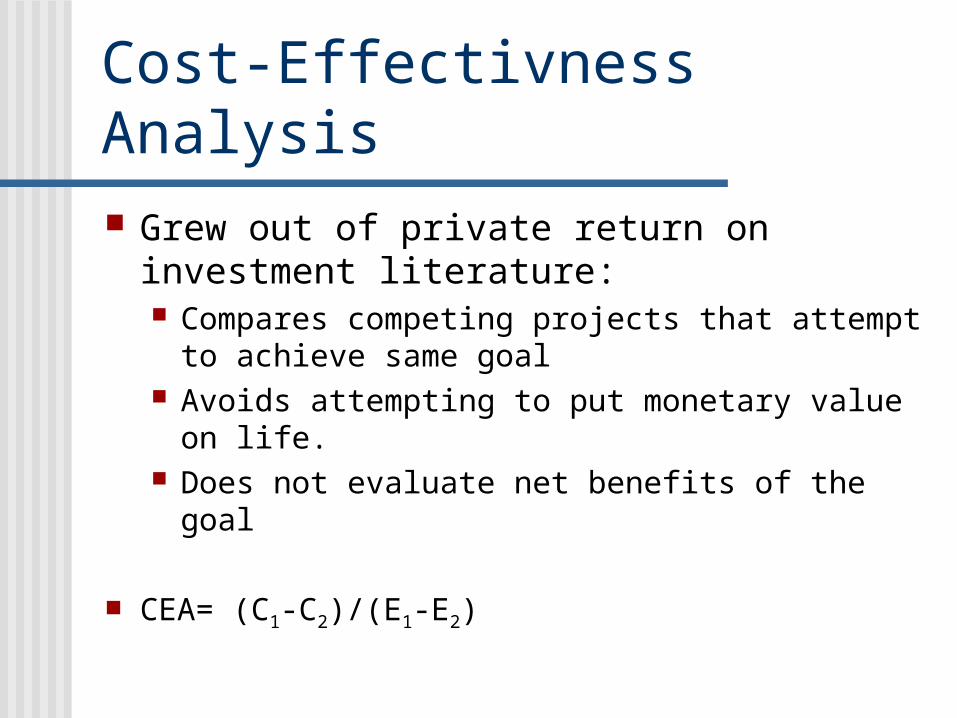
Cost-Effectivness Analysis Grew out of private return on investment
literature: Compares competing projects that attempt to
achieve same goal Avoids attempting to put monetary value on life. Does not evaluate net benefits of the goal
CEA= (C1-C2)/(E1-E2)
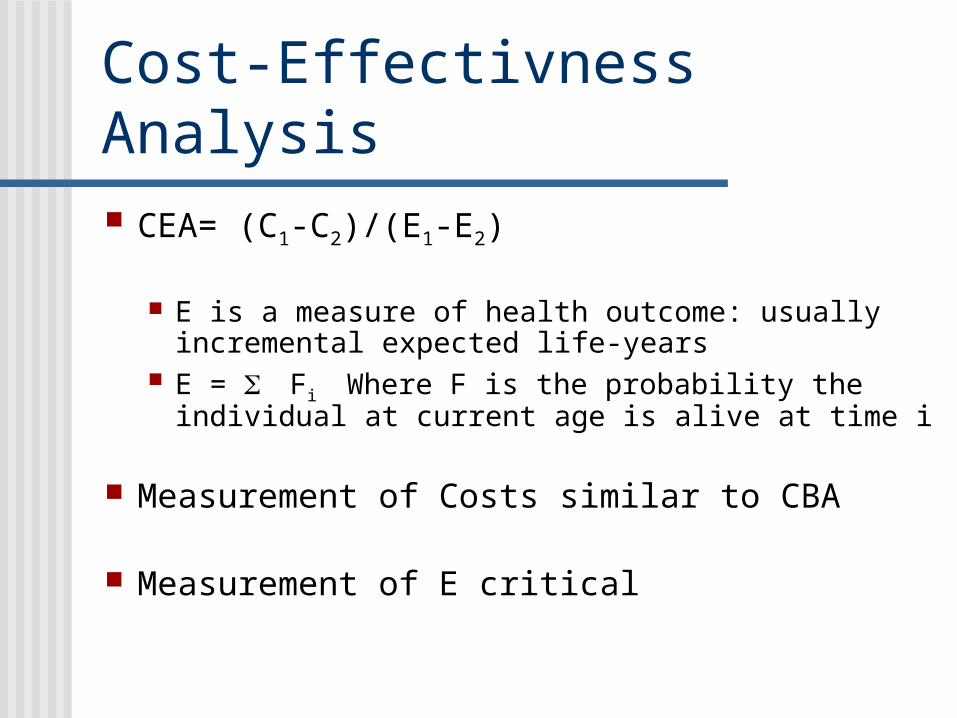
Cost-Effectivness Analysis CEA= (C1-C2)/(E1-E2)
E is a measure of health outcome: usually incremental expected life-years
E = Fi Where F is the probability the individual at current age is alive at time i
Measurement of Costs similar to CBA
Measurement of E critical
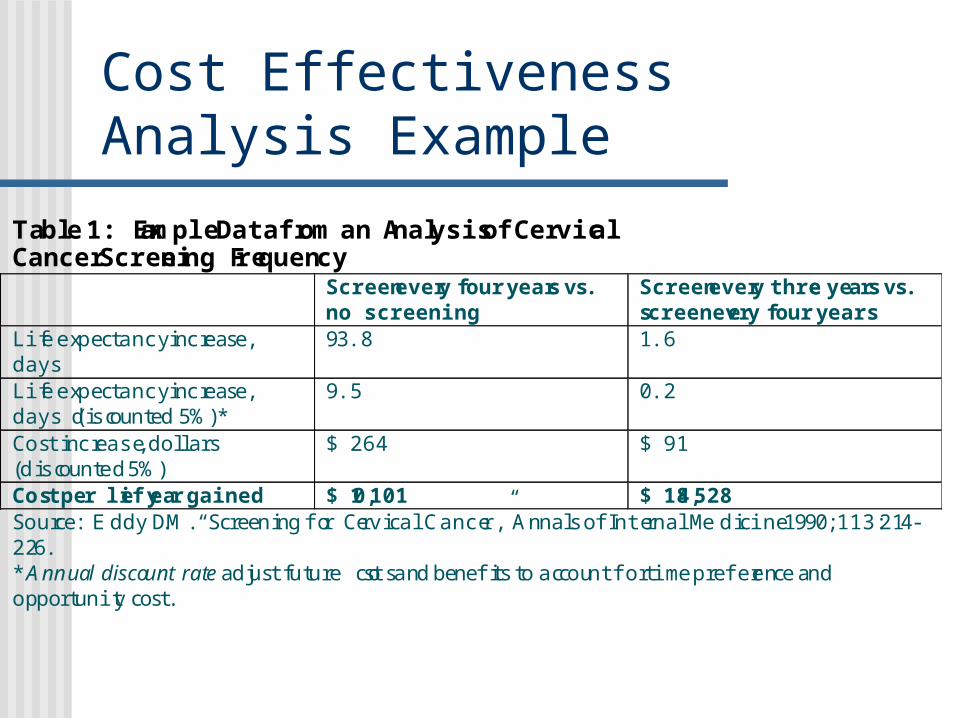
Cost Effectiveness Analysis Example
Table 1: Example Data from an Analysis of Cervical Cancer Screening Frequency Screen every four years vs.
no screening Screen every three years vs. screen every four years
Life expectancy increase, days
93.8 1.6
Life expectancy increase, days (discounted 5%)*
9.5 0.2
Cost increase, dollars (discounted 5%)
$ 264 $ 91
Cost per life year gained $ 10,101 $ 184,528 Source: E ddy D.M. “Screening for Cervical Cancer,” Annals of Internal Medicine 1990; 113: 214- 226. * Annual discount rate adjust future costs and benefits to account for time preference and opportunity cost.
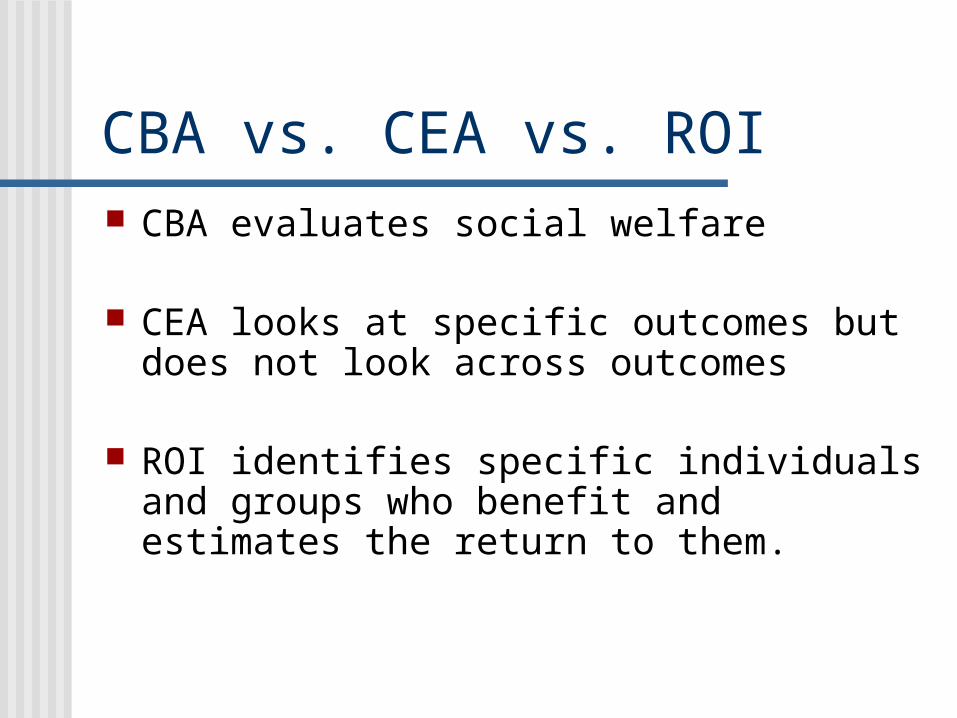
CBA vs. CEA vs. ROI CBA evaluates social welfare
CEA looks at specific outcomes but does not look across outcomes
ROI identifies specific individuals and groups who benefit and estimates the return to them.
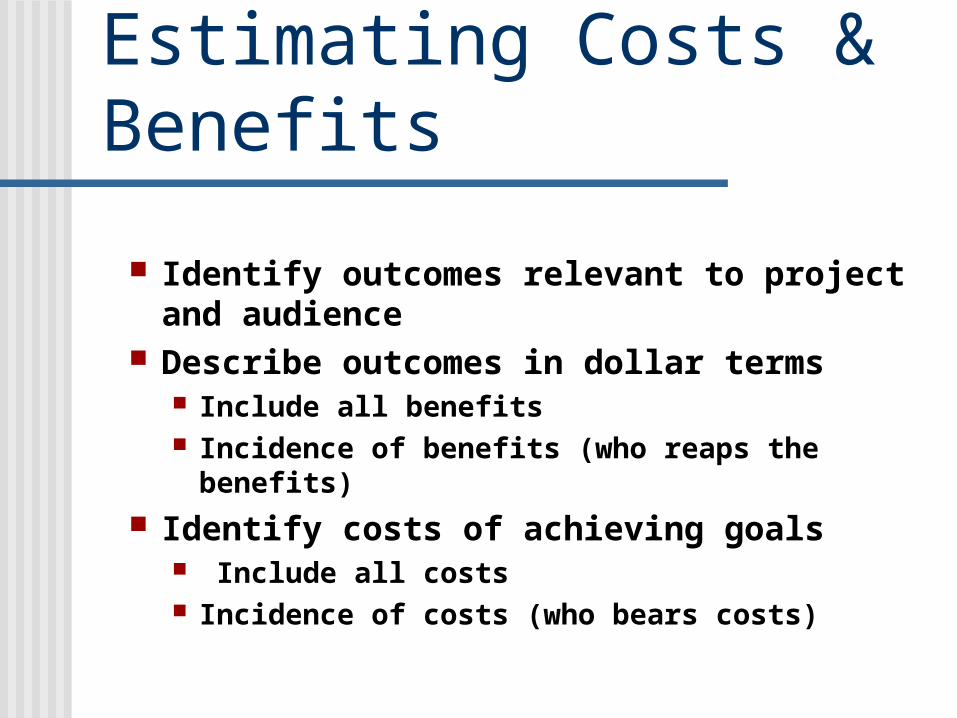
Estimating Costs & Benefits
Identify outcomes relevant to project and audience
Describe outcomes in dollar terms Include all benefits Incidence of benefits (who reaps the benefits)
Identify costs of achieving goals Include all costs Incidence of costs (who bears costs)
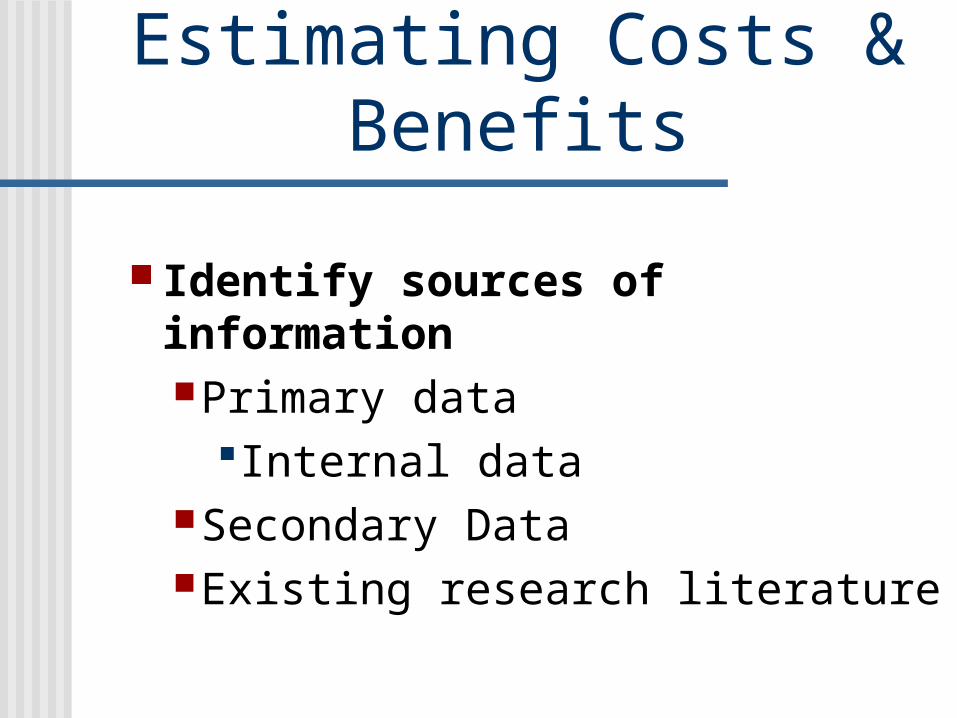
Estimating Costs & Benefits
Identify sources of informationPrimary data
Internal dataSecondary DataExisting research literature
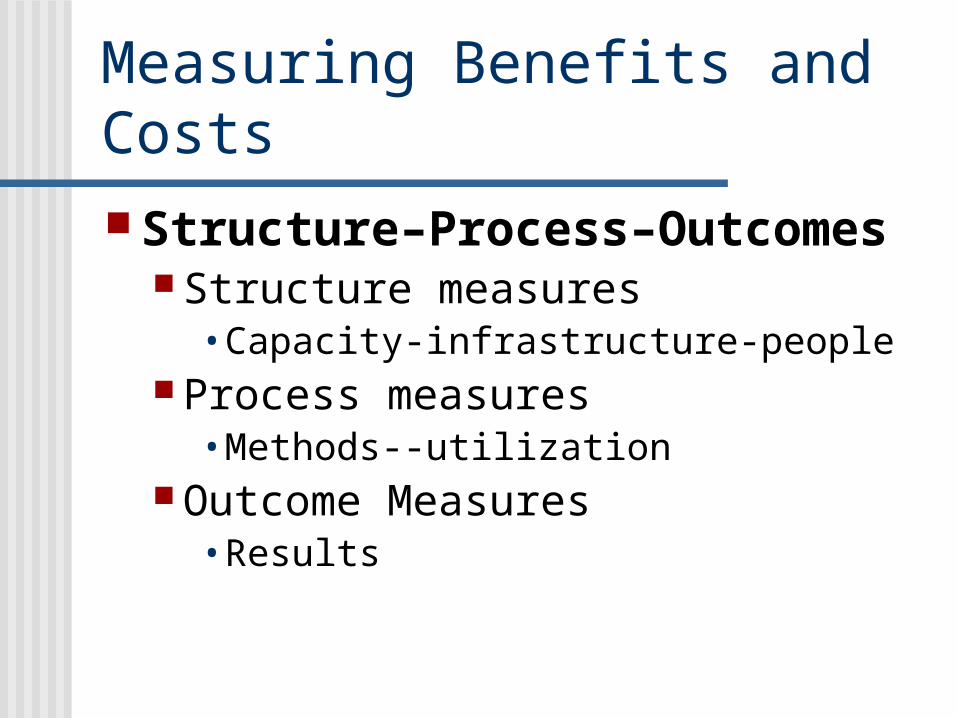
Measuring Benefits and Costs
Structure–Process–Outcomes Structure measures
• Capacity-infrastructure-people Process measures
• Methods--utilization Outcome Measures
• Results
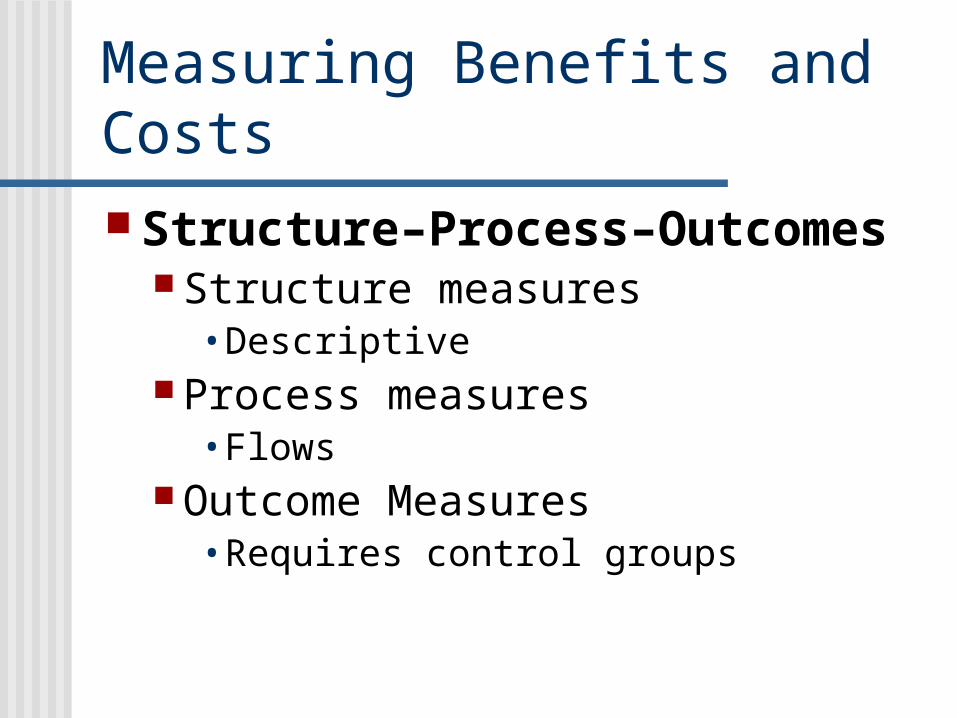
Measuring Benefits and Costs
Structure–Process–Outcomes Structure measures
• Descriptive Process measures
• Flows Outcome Measures
• Requires control groups
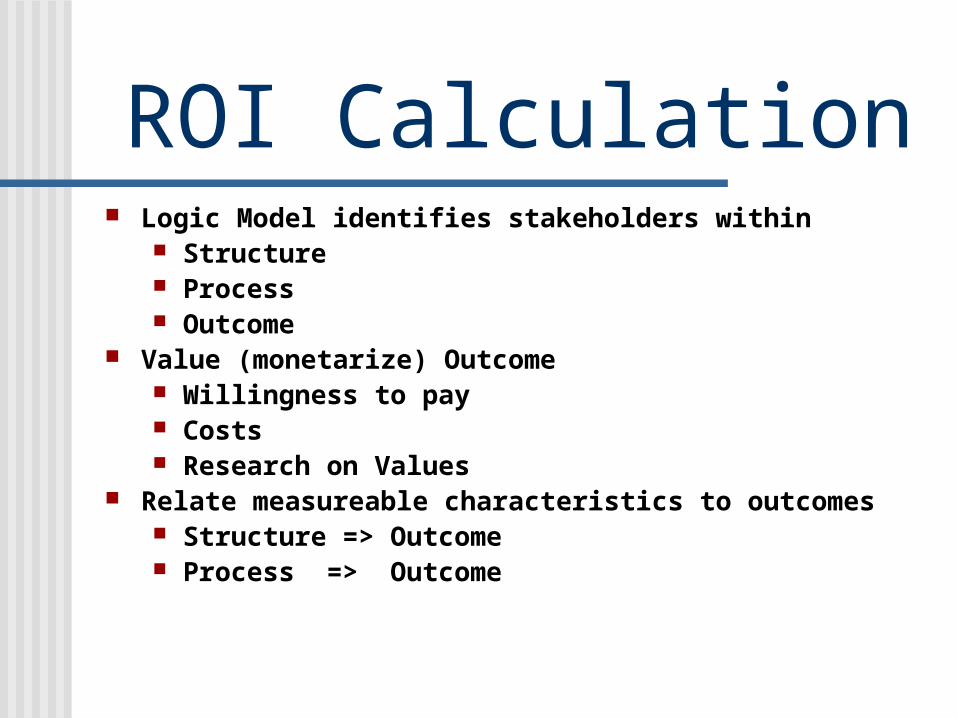
ROI Calculation Logic Model identifies stakeholders within
Structure Process Outcome
Value (monetarize) Outcome Willingness to pay Costs Research on Values
Relate measureable characteristics to outcomes Structure => Outcome Process => Outcome
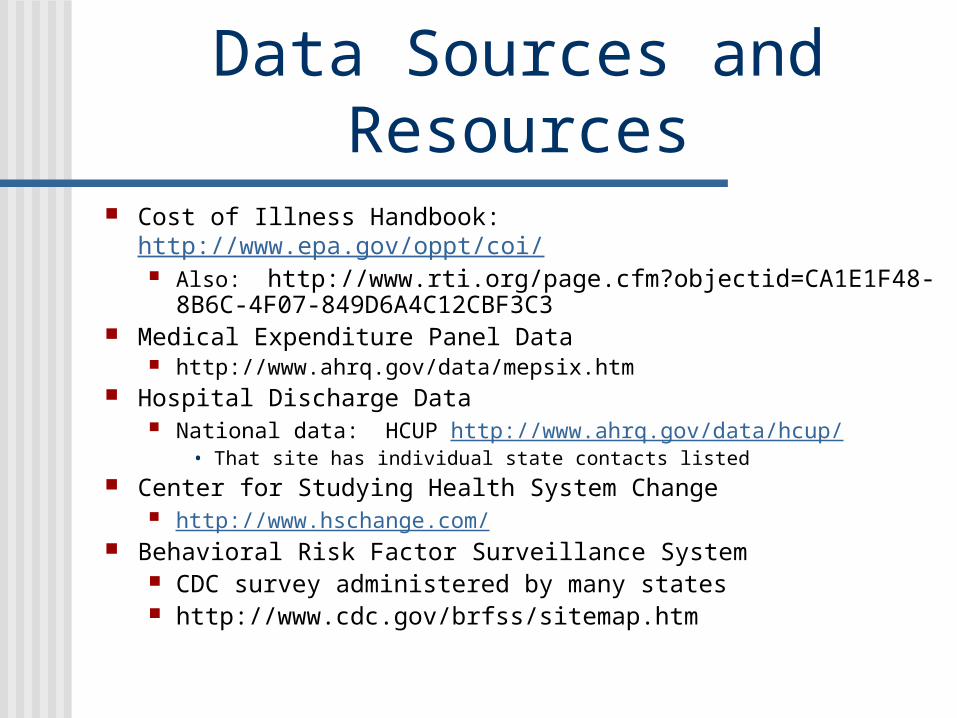
Data Sources and Resources Cost of Illness Handbook: http://www.epa.gov/oppt/coi/
Also: http://www.rti.org/page.cfm?objectid=CA1E1F48-8B6C-4F07-849D6A4C12CBF3C3
Medical Expenditure Panel Data http://www.ahrq.gov/data/mepsix.htm
Hospital Discharge Data National data: HCUP http://www.ahrq.gov/data/hcup/
• That site has individual state contacts listed Center for Studying Health System Change
http://www.hschange.com/ Behavioral Risk Factor Surveillance System
CDC survey administered by many states http://www.cdc.gov/brfss/sitemap.htm
Linking data with story-telling
What works? What could work better?
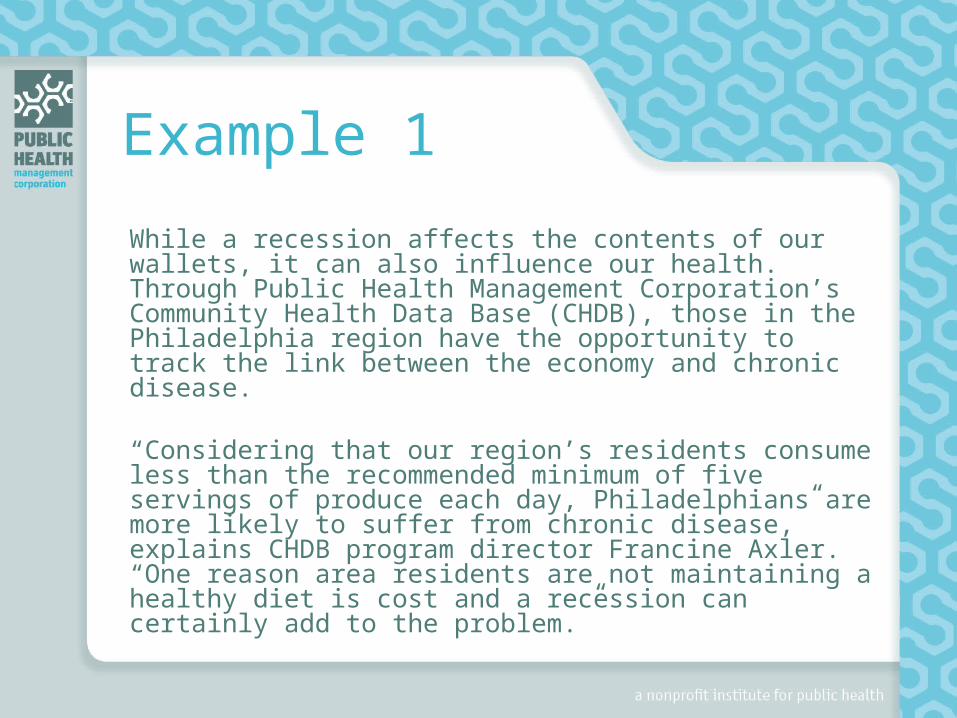
Example 1
While a recession affects the contents of our wallets, it can also influence our health. Through Public Health Management Corporation’s Community Health Data Base (CHDB), those in the Philadelphia region have the opportunity to track the link between the economy and chronic disease.
“Considering that our region’s residents consume less than the recommended minimum of five servings of produce each day, Philadelphians are more likely to suffer from chronic disease,” explains CHDB program director Francine Axler. “One reason area residents are not maintaining a healthy diet is cost and a recession can certainly add to the problem.”
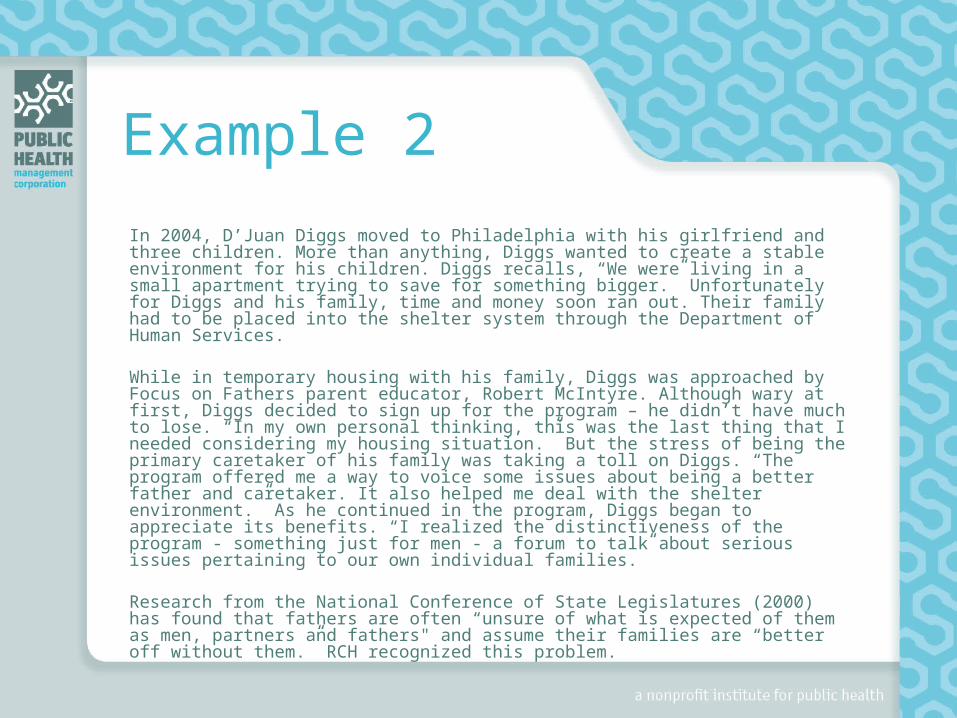
Example 2In 2004, D’Juan Diggs moved to Philadelphia with his girlfriend and three children. More than anything, Diggs wanted to create a stable environment for his children. Diggs recalls, “We were living in a small apartment trying to save for something bigger.” Unfortunately for Diggs and his family, time and money soon ran out. Their family had to be placed into the shelter system through the Department of Human Services.
While in temporary housing with his family, Diggs was approached by Focus on Fathers parent educator, Robert McIntyre. Although wary at first, Diggs decided to sign up for the program – he didn’t have much to lose. “In my own personal thinking, this was the last thing that I needed considering my housing situation.” But the stress of being the primary caretaker of his family was taking a toll on Diggs. “The program offered me a way to voice some issues about being a better father and caretaker. It also helped me deal with the shelter environment.” As he continued in the program, Diggs began to appreciate its benefits. “I realized the distinctiveness of the program - something just for men - a forum to talk about serious issues pertaining to our own individual families.”
Research from the National Conference of State Legislatures (2000) has found that fathers are often “unsure of what is expected of them as men, partners and fathers" and assume their families are “better off without them.” RCH recognized this problem.

Example 3
Seventeen-year-old Nicholas Shanks is your average, teenage boy. He spends his time playing video games with friends, watching cartoons on Saturday mornings and listening to music on his computer. But when this soft-spoken teen took the stage on June 17, 2008 to deliver his speech as valedictorian of Martin Luther King High School to 287 members of his graduating class–more than one person in the audience had tears in their eyes.
When he was in 9th grade, Nicholas and his mother, Sherri Newton, became homeless. “I lost my job,” recalls Newton, “and unemployment wasn’t paying for my rent.” When his father was laid off, according to Nicholas “things started to fall apart.”
McMillan and Ligons-Ham estimate that almost 10,000 children in the School District of Philadelphia are homeless–living in emergency shelters, transitional housing, or ‘doubled-up’ (living with other families).
Return on Investment for the Michigan Nursing Corps
Elaine Beane, Ph.D.
Michigan Public Health Institute

Discussion and Questions
Thank You!
Join us for the next FEIP educational webinar:
Communication with Multiple Stakeholders
April 14th, 2009 (3:00- 4:30 eastern)