Embed Size (px)
Citation preview

Edutactile - A tool for rapid generation of accurateguideline-compliant tactile graphics for science and mathematics
Mrinal Mech, Kunal Kwatra, Supriya Das, Piyush Chanana, Rohan Paul and M. BalakrishnanAssistive Technologies Group, Indian Institute of Technology Delhi, India
{cs5090246,ird10432,mbala}@cse.iitd.ernet.in
Abstract
In this paper the authors have presented the design and implementation of Edutactile, a cross-platform software which automates the process of creation of tactile diagrams. Edutactile providesfor automated application of guidelines or presets as well as Braille translation and thus abstractsaway the production related issues. This relieves special educators for the visually challengedfrom having to learn the workings of the graphics editing software (Photoshop, CorelDraw) whichare currently being used to produced tactile graphics and instead focus on the content of thediagram.
1 Introduction
According to WHO about 39 million people are estimated to be blind worldwide, 90% of whomlive in the developing world. Out of these, 2 million are children under the age of 15 years [1].Teaching and learning of science and mathematics is particularly challenging due to the graphical anddiagrammatic content (chemical equations, mathematical graphs etc). Increasingly, embossed tactilerepresentations are playing a significant role in assisting special educators in conveying concepts fordiagram comprehension and practice.
Tactile representation requires certain guidelines to be followed for comprehension and perceptibilityof the diagrams. These guidelines (BANA1, RNIB2) recommend/constrain the use of line types, linethicknesses and texture types.
Former, existing software solutions are general purpose graphics software (CorelDraw, Adobe Photo-shop). They have a high learning curve and are more sophisticated than what’s required. Furthermorethese software are proprietary with high licensing costs and are tied to a specific output method orproduct like braille embossing, thermoforming or swell. Additionally, current solutions mostly caterto a specific category of diagram and do not holistically address the needs of a typical special educator.
Hence, there is a need for a software that relieves the special educators from the workload of conform-ing to guidelines, braille labelling and layouts for production and hence allows them to concentrateon the quality and the expression of the diagram.
This paper presents the design and implementation of Edutactile, a cross-platform Java-based softwarewhich facilitates the creation of tactile graphics specialised for scientific and mathematical content.It automatically handles layout and formatting thus relieving special educators and enabling them to
1http://www.brailleauthority.org2http://www.rnib.org.uk
1

concentrate on the content of the diagrams. During the development, feedback was taken from specialeducators as well as visually impaired students. Initial feedback has been positive regarding both thesoftware as well as the quality of diagrams produced using it.
2 Related Work
There are commercially available software like TactileView [2] , TGD-Pro [3] etc aimed at the creationof tactile graphics but limitations arise due to their generic nature with them being tied to a specificoutput method. Further drawbacks include their proprietary nature and a high learning curve. R.E.Ladner et. al. [4] from the University of Washington present a system for automation of the graphicscreation process. Drawbacks arise as this system only converts pre-existing printed images and doesnot generate new tactile diagrams. This does not guarantee the accuracy of many of the diagrams, asthe original images might have errors.
3 System
3.1 Software Design AspectsEdutactile is built on a Java framework with the front-end GUI being implemented using Java Swingand images being rendered using the Java class Graphics2D. Tactile diagrams are input/generated inthe .svg (Scalable Vector Graphic) format. Input .svg files are preprocessed by first parsing them usingSVGSalamander3 and then by converting them to a table-like Shape data structure. Braille translation(in multiple languages) is done by an open source braille translator BrailleTrans 4.
Figure 1: Process of conversion for a standard image into a tactile graphic suited for a production method andconforming to guidelines
3https://svgsalamander.java.net/4http://alasdairking.me.uk/brailletrans/
2
Focus groups were formed during the design and development process of the system. Constant feed-back was taken from users and special educators throughout to know their needs. Keeping thesespecifications in mind, three modules have been incorporated into the system.
1. Image Converter Module - Automates the translation of a standard textbook figure into atactile version conforming to guidelines with descriptions and accessible labeling
2. Chemical Equations Module - Generates chemical equations with the help of a drag and droplibrary of commonly used chemical symbols
3. Mathematical Functions Module - Provides entry, parsing and plotting of complex mathemat-ical functions
3.2 Image Converter ModuleThe image converter module takes as input a basic .svg figure and applies guidelines as well as doestransformations like scaling, spatial decluttering, occlusion removal, braille conversion, changingedge thicknesses/textures, marking and positioning to create a better diagram. The system allows forspecifications for guidelines. Specification files can be imported and applied to a class of diagrams.Furthermore, the special educator can add annotations.
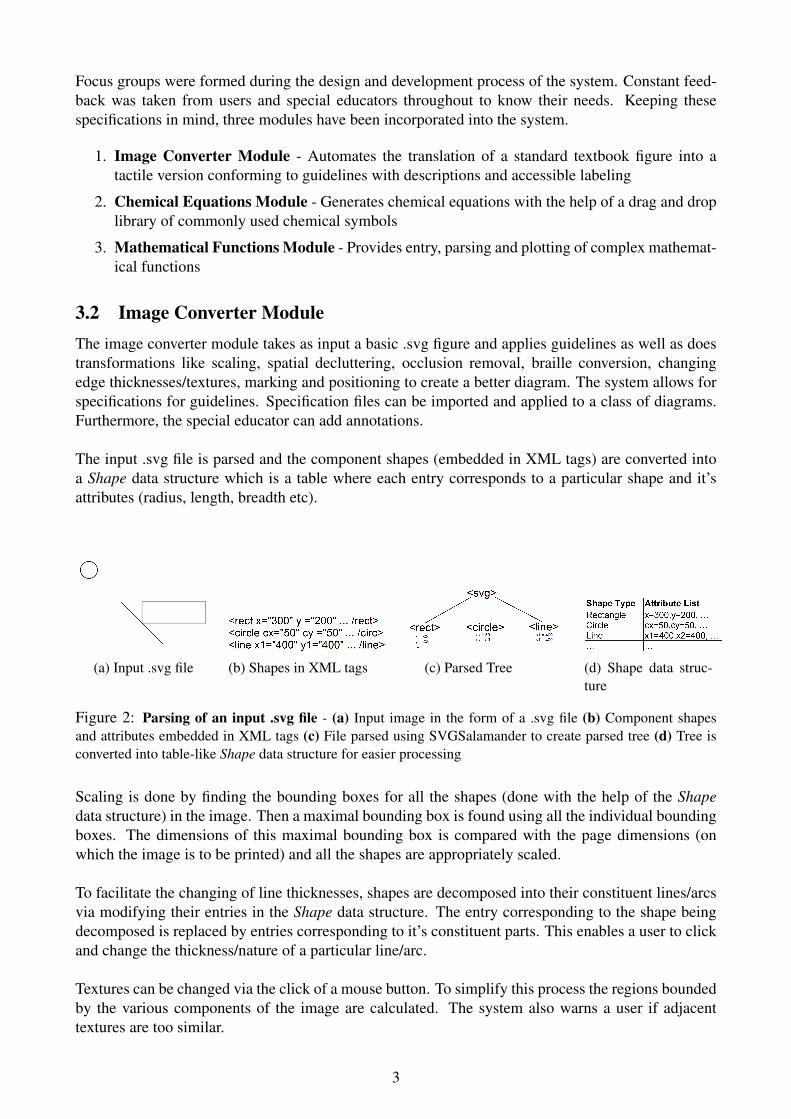
The input .svg file is parsed and the component shapes (embedded in XML tags) are converted intoa Shape data structure which is a table where each entry corresponds to a particular shape and it’sattributes (radius, length, breadth etc).
(a) Input .svg file (b) Shapes in XML tags (c) Parsed Tree (d) Shape data struc-ture
Figure 2: Parsing of an input .svg file - (a) Input image in the form of a .svg file (b) Component shapesand attributes embedded in XML tags (c) File parsed using SVGSalamander to create parsed tree (d) Tree isconverted into table-like Shape data structure for easier processing
Scaling is done by finding the bounding boxes for all the shapes (done with the help of the Shapedata structure) in the image. Then a maximal bounding box is found using all the individual boundingboxes. The dimensions of this maximal bounding box is compared with the page dimensions (onwhich the image is to be printed) and all the shapes are appropriately scaled.
To facilitate the changing of line thicknesses, shapes are decomposed into their constituent lines/arcsvia modifying their entries in the Shape data structure. The entry corresponding to the shape beingdecomposed is replaced by entries corresponding to it’s constituent parts. This enables a user to clickand change the thickness/nature of a particular line/arc.
Textures can be changed via the click of a mouse button. To simplify this process the regions boundedby the various components of the image are calculated. The system also warns a user if adjacenttextures are too similar.
3

(a) Individual bounding boxes (b) Maximal bounding box (c) Scaled image
Figure 3: Scaling of image - (a) Individual bounding boxes drawn over all shape components (b) Maximalbounding box created using individual bounding boxes (c) Scaled image is fit onto page
(a) Rectangle ABCD (b) Representation in table-likedata structure
(c) Decomposition
Figure 4: Edge/Arc Decomposition - (a) Shape component of type Rectangle corresponding to rectangleABCD (b) Representation of rectangle in the table-like Shape data structure (c) Decomposition of rectangleABCD into four line segments AB, BC, CD and DA
(a) Input image (b) Bounded areas (c) Texture changing
Figure 5: Texture Flipping - (a)Two rectangles with common region (b) Calculation of different boundedregions (c) New texture applied to particular bounded region
3.3 Chemical Equations ModuleRepresentation of chemical equations involve a specific format. Furthermore, many compounds andreactions involve specific spatial arrangements. For example, hydrocarbons like benzene etc. andseveral structural re-arrangement chemical reactions like reactions of aromatic compounds. Edutactileprovides for creation of tactile versions of such chemical equations. During the creation and editionmany operations can be performed, promoting insertion, deletion, modification and movement ofchemical symbols. Concurrently with entering chemical compounds appearing in the equations asreactants, products, precipitates and catalysts etc. - which includes selection from drop-down menus- layout and positioning is automatically handled, ensuring consistency in the diagram.
4

Figure 6: GUI for chemical equations module. The equation shown is the production of bromoaniline.
3.4 Mathematical Functions ModuleGraphs of mathematical functions are a key diagrammatic component of imparting mathematical ed-ucation. A variety of functions exist which are difficult to graph manually. Edutactile provides forinterpolation based plotting of 1D mathematical functions. The software supports polynomial, loga-rithmic, trigonometric, exponential and statistical functions as well as any combination of them eitherby mathematical operators (addition, subtraction etc) or by function composition. The mathematicalfunction plotting module takes the expression as an input that is parsed (with the help of a open sourceparser Math Expression String Parser5) and then point wise interpolated to yield the function graph.Different line types and labelings are also added. Since this module has no visual component as input,a visually challenged student may input a function string to obtain it’s 2D figure.
Figure 7: GUI for mathematical functions module. The function shown is the maximum of sin(x) and tan(x)
5http://sourceforge.net/projects/expression-tree/
5

(a) Input string (b) Expression tree (c) Function evalua-tion
(d) Graph plotting
Figure 8: Plotting of mathematical functions - (a) Mathematical function is input in form of a string (b)MESP is used to parse string and get a function (c) Function is applied to various points (corresponding topoints on the x-axis) and the obtained set of coordinates are plotted (d) A curve is interpolated through theplotted points
4 Results and EvaluationDiagrams were created using Edutactile and then produced on both braille embossers and swell paperwhich were then tested with high school students at the National Association for the Blind [5]. Thestudents were able to interpret and understand the diagrams. Detailed feedback was taken from threespecial educators about both the software as well as the diagrams produced. The tests are summarisedbelow.
4.1 User Evaluation on SoftwareThe three special educators were asked to rate the software on various criteria on a 5 point Likertscale (with 1 being the lowest possible score and 5 being a perfect score). Furthermore, they alsoassigned scores to the perceived diagram quality and output interpretability by students. The scoresare summarised below.
Figure 9: Ratings by special educators
6

Feedback from the special educators was positive, as can be seen in the universally high ratings. Theystressed on the need for such a tool, especially in the context of teaching blind children in India.
4.2 User Evaluation on DiagramsTo gauge the effectiveness of the diagrams produced, a set of six diagrams was given to three studentsand they were asked to interpret what the diagrams meant. The results are summarised below.
(a) Square (b) Circle
(c) Formation of water (d) Formation of common salt
(e) Graph of a straight line (f) Graph of y = x2
Almost all elements of all the images were located, identified and interpreted by the students. In fourinstances a student failed to interpret a particular element.
• One student interpreted the square as a rectangle.
• One student couldn’t recognize the equation of the formation of water as he didn’t know theequation (although he could tell what the reactants and products were).
• Two students failed to recognize the graph of y = x2 as both of them did not know the nature ofthe graph for that function. One interpreted it as a parabola.
It can be seen that there was a high level of understanding and apart from the first case any mistakes ininterpretation were due to the lack of knowledge of the student rather than the quality of the diagram.
7

Figure 11: Output tactile diagrams being tested by high-school students and special educators at the NationalAssociation for the Blind, New Delhi
5 Conclusion and Future WorkIn this paper, we have presented the design and development for an open source cross-platform sys-tem which amelerioates challenges faced by special educators. Hence, making it easier for specialeducators to focus on the quality and content of the diagrams. The system provides a low barrier toentry as it uses simple mouse actions for interaction. Feedback has been very positive from specialeducators and end-users during preliminary feedback. In future, we plan to improve the accessibilityand diagram generation directly for end-users. Also addition of newer functionalities is planned, e.g.,conversion of printed images into tactile drawings. A beta version has been released online 6 whichis updated regularly. Both the source code and an executable is available.
References[1] http://www.who.int/mediacentre/factsheets/fs282/en/l
[2] Tactile View, http://www.tactileview.com
[3] TGD-Pro, http://www.duxburysystems.com/tgd.asp?choice=pro
[4] R.E. Ladner, M.Y. Ivory, R. Rao, S. Burgstahler, D. Comden,S. Hahn, et al.: ”Automating tactilegraphics translation”, The7th International ACM SIGACCESS Conference on Computers andAccessibility (ASSETS), Baltimore, USA, 2005
[5] National Association for the Blind, http://www.nabindia.org
6https://github.com/assistech-iitd/Edutactile
8