Embed Size (px)
Citation preview
7/29/2019 EERI Special Earthquake Report Sept 2011 - Tohoku Japan
http://slidepdf.com/reader/full/eeri-special-earthquake-report-sept-2011-tohoku-japan 1/12
1
EERI Special Earthquake Report — September 2011
Learning from Earthquakes
Geotechnical Effects of the Mw 9.0 Tohoku, Japan, Earthquake of March 11, 2011
Teams from the Geotechnical
Extreme Events Reconnaissance(GEER) Association have contribut-
ed to reconnaissance on the geo-
technical effects of the Tohoku,
Japan, earthquake, in collaboration
and coordination with colleagues in
Japan and teams from the Earth-
quake Engineering Research Insti-
tute (EERI), the Pacic Earthquake
Engineering Research (PEER)
Center, the American Society of
Civil Engineers (ASCE), and the
Federal Highways Administration
(FHWA). A list of team membersand contributors is provided at the
end of this report. All photos are
credited to GEER 2011 unless oth-
erwise indicated.
GEER is supported by the National
Science Foundation (NSF) under
grant #CMMI-00323914. NSF has
provided additional support for
GEER-coordinated efforts on the
Tohoku earthquake through RAPID
awards to Ross Boulanger, Univer-
sity of California (UC) Davis, and
Nick Sitar, UC Berkeley, under grant
#CMMI-1138203, and to Brady Cox,
University of Arkansas, under grant
#CMMI-1138168. Additional support
for travel was provided by Fugro,
Geosyntec, Kleinfelder, and the
U.S. Geological Survey.
Introduction
The March 11, 2011, earthquake—
one of the largest in recorded his-
tory worldwide—struck along thesubduction zone interface plate
boundary between the Pacic andNorth America plates. The earth-
quake was immediately followed by
a large tsunami that inicted wide-
spread damage to modern urban
infrastructure and led to a crisis
at the Fukushima Daiichi nuclear
power plant. The world’s attention
was captured by the scale of the
devastation and by the nuclear crisis.
The geotechnical effects of this earth-
quake provide important opportunities
for learning about the seismic perfor-
mance of a wide range of geotechni-
cal systems and constructed facilities.
Facilitated by the extensive network
of strong ground motion recording
stations in the area, the unique char-
acteristics of this large earthquake,
the wide geographical area affected,
and the modern infrastructure through-
out the affected areas, scientists will
be able to gain insights into the corre-lation between ground motion charac-
teristics and the type and extent of
damage—in ways not previously pos-
sible.
This report provides a brief summary
of preliminary geotechnical observa-
tions from NSF-sponsored GEER re-
connaissance teams working with
other organizations and individuals, as
noted above. Additional details re-
garding some of these observations
are included in a series of GEER
Quick Reports available at www.
geerassociation.org. The eld teamscould not cover all the affected areas,
and avoided some locales due to on-
going humanitarian aid efforts andradiation concerns. Fuller coverage
and greater detail on the geotechni-
cal effects will emerge from the
studies currently underway in Japan.
Seismicity
The March 11 earthquake resulted
from thrust faulting along the sub-
duction zone interface plate bound-
ary between the Pacic and North American plates off the eastern
shore of Honshu. At that latitude,the Pacic plate moves approximate-
ly eastward at about 83 mm/yr rela-
tive to the North American plate.
The rupture surface extended ap-
proximately 600 km parallel to the
coast of Japan, and the maximum
slip on the rupture surface has
been estimated at about 32 m
(USGS, 2011).
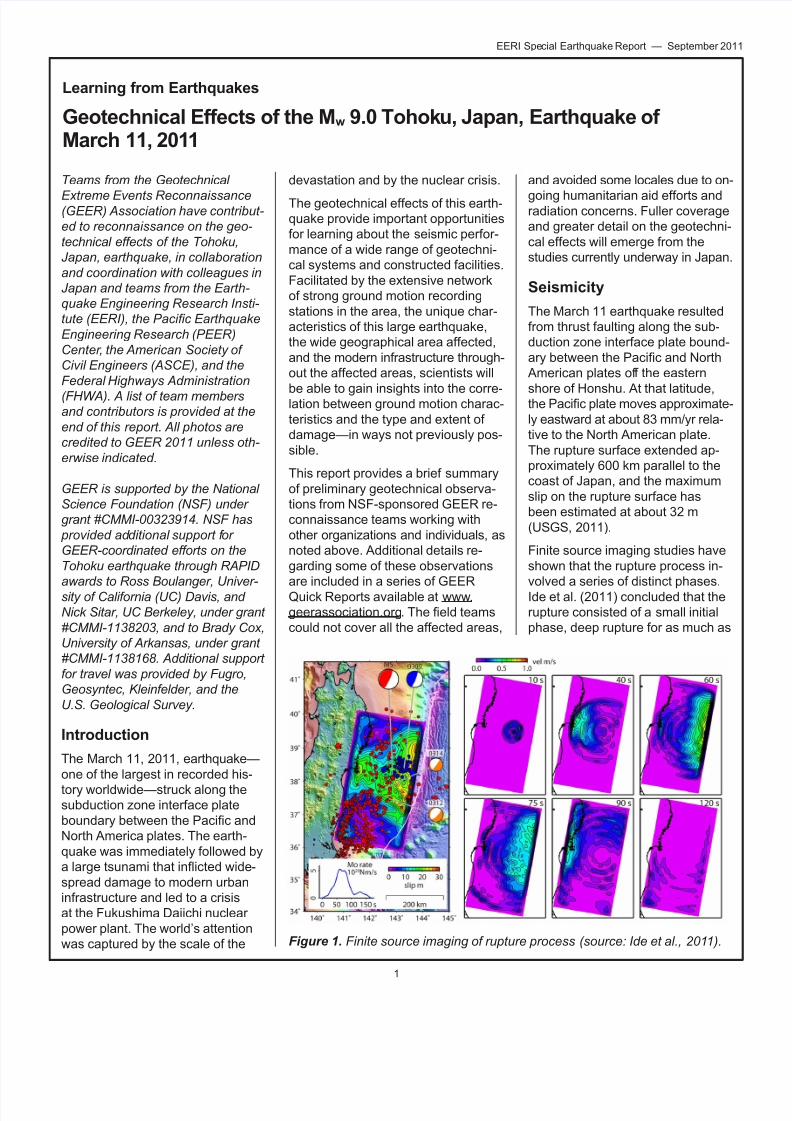
Finite source imaging studies have
shown that the rupture process in-
volved a series of distinct phases.
Ide et al. (2011) concluded that the
rupture consisted of a small initial
phase, deep rupture for as much as
Figure 1. Finite source imaging of rupture process (source: Ide et al., 2011).
7/29/2019 EERI Special Earthquake Report Sept 2011 - Tohoku Japan
http://slidepdf.com/reader/full/eeri-special-earthquake-report-sept-2011-tohoku-japan 2/12
2
EERI Special Earthquake Report — September 2011
40 sec, extensive shallow rupture
at 60-70 sec, and continuing deep
rupture lasting over 100 sec (Figure
1). They further concluded that
shallower parts of the rupture radi-
ated weakly at high frequencies,
whereas deeper parts radiated
strongly at high frequencies.
The mainshock was the most well-
recorded earthquake to date world-
wide. It produced 693 recordings at
K-Net sites (surface instruments),
496 recordings at Kik-Net vertical
arrays, and 50 recordings at build-
ings instrumented by the Japan
Building Research Institute. Initial
comparisons of strong ground mo-
tion recordings to ground motion
prediction equations (GMPE) for
subduction zone events have pro-
vided valuable insights on thecapabilities and limitations of some
GMPEs. Preliminary observations
by Boore (2011) suggest that re-
corded motions appear to decay
more rapidly than predicted by many
GMPEs. For distances less than
about 150 km, the short-period
motions were better predicted by
GMPEs than the longer-period mo-
tions. The GMPEs by Zhao et al.
(2006) and Kanno et al. (2006),
both of which were developed using
data from Japan, appear to comparebest with the recordings.
The March 11th earthquake was
preceded by a series of large fore-
shocks during the previous two
days, beginning on March 9th with an
Mw 7.2 quake approximately 40 km
from the March 11th earthquake, and
continuing with three earthquakes
greater than Mw 6 on the same day.
Aftershocks included the Mw 6.6
Hamadori earthquake of April 11th in
the shallow crust above the subduc-
tion zone and produced signicantsurface rupture.
Several recording stations produced
particularly interesting records for the
March 11th quake. A peak horizontal
ground acceleration (PGA) of 2.7 g
was recorded at the K-Net Tsukidate
(MYG004) station. The soil prole
consists of 1 m of ll (Vs ≈100 m/s)overlying 3 m of lower-velocity bed-
rock (Vs ≈240 m/s) overlying stiffer
bedrock (Vs ≈550 m/s). The
recorded motion was rich in high fre-quencies, which may partly explain
why the nearby residential and com-
mercial buildings appeared to suffer
only minor damages (Midorikawa and
Miura, 2011).
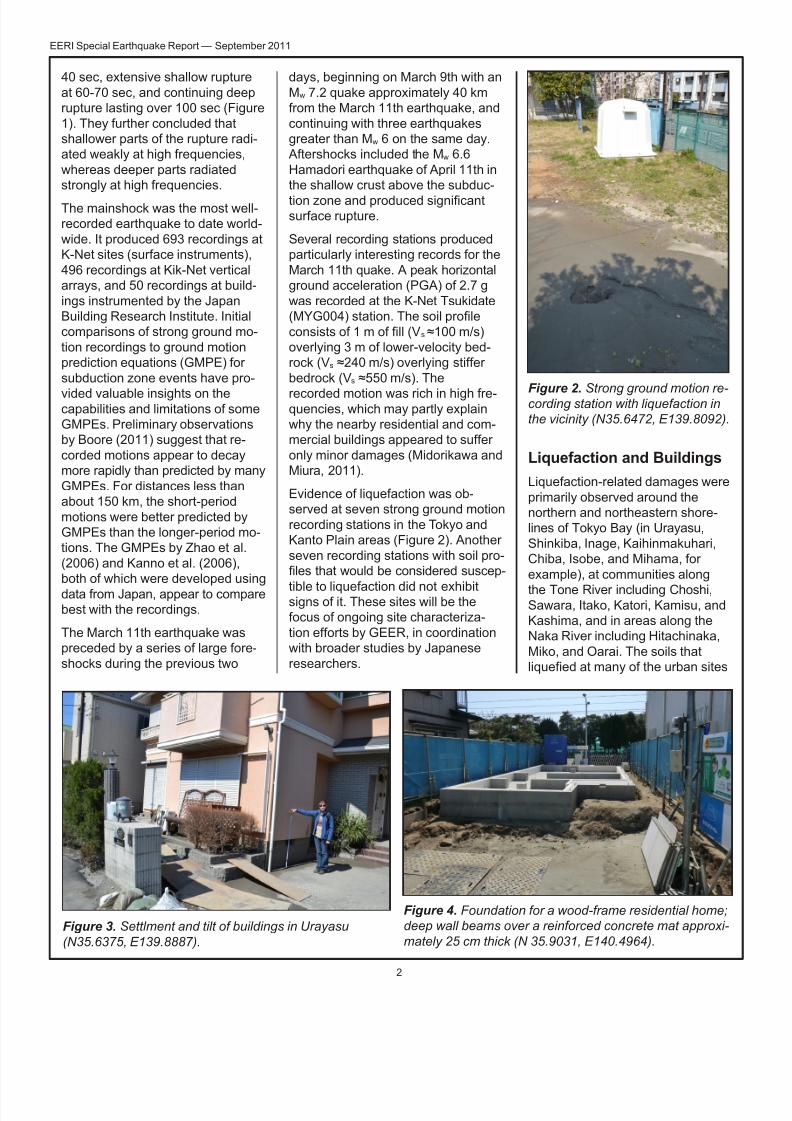
Evidence of liquefaction was ob-
served at seven strong ground motion
recording stations in the Tokyo and
Kanto Plain areas (Figure 2). Another
seven recording stations with soil pro-
les that would be considered suscep-
tible to liquefaction did not exhibitsigns of it. These sites will be the
focus of ongoing site characteriza-
tion efforts by GEER, in coordination
with broader studies by Japanese
researchers.
Liquefaction and Buildings
Liquefaction-related damages were
primarily observed around the
northern and northeastern shore-
lines of Tokyo Bay (in Urayasu,
Shinkiba, Inage, Kaihinmakuhari,
Chiba, Isobe, and Mihama, for
example), at communities along
the Tone River including Choshi,Sawara, Itako, Katori, Kamisu, and
Kashima, and in areas along the
Naka River including Hitachinaka,
Miko, and Oarai. The soils that
liqueed at many of the urban sites
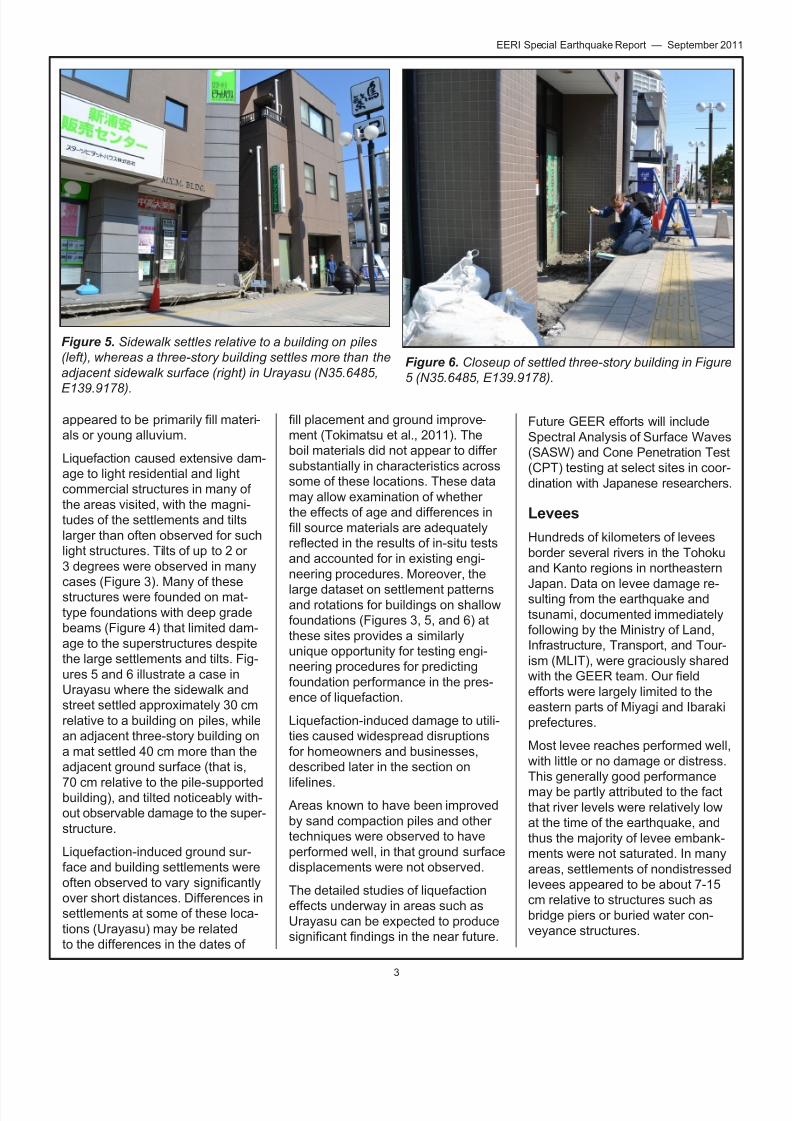
Figure 3. Settlment and tilt of buildings in Urayasu
(N35.6375, E139.8887).
Figure 4. Foundation for a wood-frame residential home;
deep wall beams over a reinforced concrete mat approxi-
mately 25 cm thick (N 35.9031, E140.4964).
Figure 2. Strong ground motion re-cording station with liquefaction in
the vicinity (N35.6472, E139.8092).
7/29/2019 EERI Special Earthquake Report Sept 2011 - Tohoku Japan
http://slidepdf.com/reader/full/eeri-special-earthquake-report-sept-2011-tohoku-japan 3/12
3
EERI Special Earthquake Report — September 2011
appeared to be primarily ll materi-
als or young alluvium.
Liquefaction caused extensive dam-
age to light residential and light
commercial structures in many of
the areas visited, with the magni-
tudes of the settlements and tilts
larger than often observed for such
light structures. Tilts of up to 2 or
3 degrees were observed in many
cases (Figure 3). Many of these
structures were founded on mat-
type foundations with deep grade
beams (Figure 4) that limited dam-
age to the superstructures despite
the large settlements and tilts. Fig-
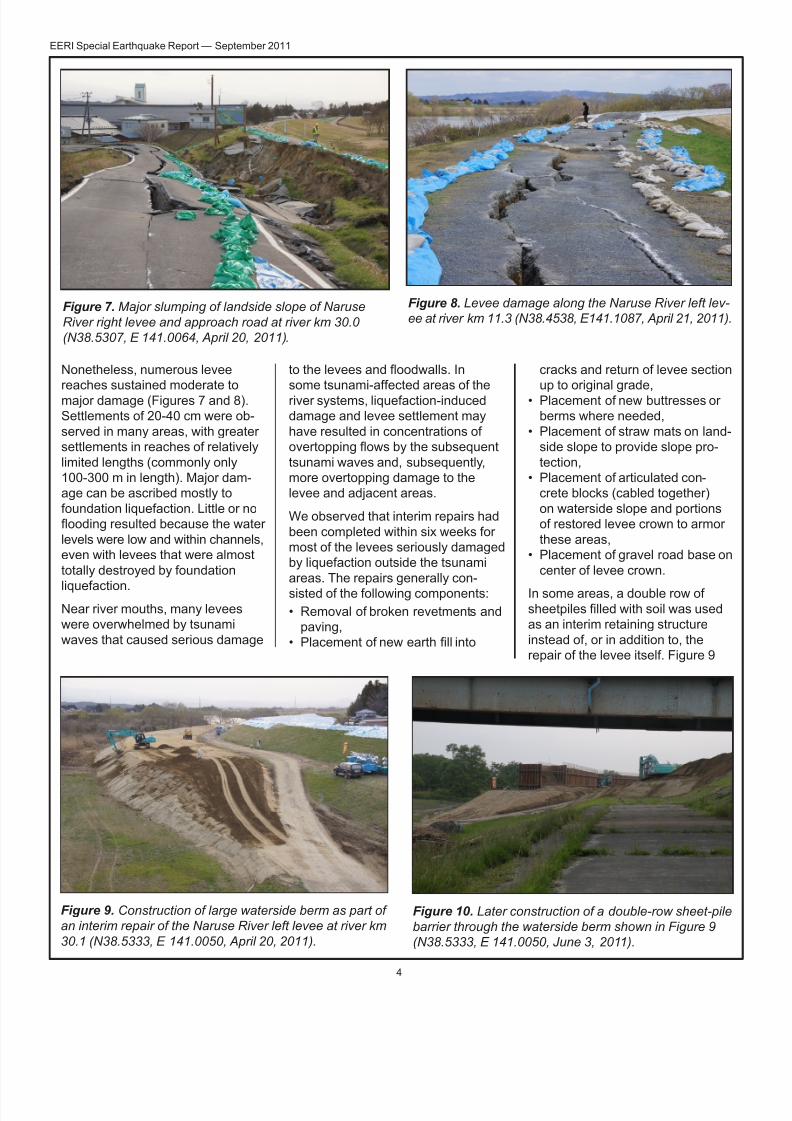
ures 5 and 6 illustrate a case in
Urayasu where the sidewalk and
street settled approximately 30 cm
relative to a building on piles, while
an adjacent three-story building on
a mat settled 40 cm more than the
adjacent ground surface (that is,
70 cm relative to the pile-supportedbuilding), and tilted noticeably with-
out observable damage to the super-
structure.
Liquefaction-induced ground sur-
face and building settlements were
often observed to vary signicantlyover short distances. Differences in
settlements at some of these loca-
tions (Urayasu) may be related
to the differences in the dates of
ll placement and ground improve-
ment (Tokimatsu et al., 2011). The
boil materials did not appear to differ
substantially in characteristics across
some of these locations. These data
may allow examination of whether
the effects of age and differences in
ll source materials are adequatelyreected in the results of in-situ testsand accounted for in existing engi-
neering procedures. Moreover, the
large dataset on settlement patternsand rotations for buildings on shallow
foundations (Figures 3, 5, and 6) at
these sites provides a similarly
unique opportunity for testing engi-
neering procedures for predicting
foundation performance in the pres-
ence of liquefaction.
Liquefaction-induced damage to utili-
ties caused widespread disruptions
for homeowners and businesses,
described later in the section on
lifelines. Areas known to have been improved
by sand compaction piles and other
techniques were observed to have
performed well, in that ground surface
displacements were not observed.
The detailed studies of liquefaction
effects underway in areas such as
Urayasu can be expected to produce
signicant ndings in the near future.
Future GEER efforts will include
Spectral Analysis of Surface Waves
(SASW) and Cone Penetration Test
(CPT) testing at select sites in coor-
dination with Japanese researchers.
Levees
Hundreds of kilometers of levees
border several rivers in the Tohoku
and Kanto regions in northeastern
Japan. Data on levee damage re-sulting from the earthquake and
tsunami, documented immediately
following by the Ministry of Land,
Infrastructure, Transport, and Tour-
ism (MLIT), were graciously shared
with the GEER team. Our eld
efforts were largely limited to the
eastern parts of Miyagi and Ibaraki
prefectures.
Most levee reaches performed well,
with little or no damage or distress.
This generally good performance
may be partly attributed to the fact
that river levels were relatively low
at the time of the earthquake, and
thus the majority of levee embank-
ments were not saturated. In many
areas, settlements of nondistressed
levees appeared to be about 7-15
cm relative to structures such as
bridge piers or buried water con-
veyance structures.
Figure 5. Sidewalk settles relative to a building on piles
(left), whereas a three-story building settles more than the
adjacent sidewalk surface (right) in Urayasu (N35.6485,
E139.9178).
Figure 6. Closeup of settled three-story building in Figure
5 (N35.6485, E139.9178).
7/29/2019 EERI Special Earthquake Report Sept 2011 - Tohoku Japan
http://slidepdf.com/reader/full/eeri-special-earthquake-report-sept-2011-tohoku-japan 4/12
4
EERI Special Earthquake Report — September 2011
Nonetheless, numerous levee
reaches sustained moderate to
major damage (Figures 7 and 8).
Settlements of 20-40 cm were ob-
served in many areas, with greater
settlements in reaches of relatively
limited lengths (commonly only
100-300 m in length). Major dam-
age can be ascribed mostly to
foundation liquefaction. Little or no
ooding resulted because the water
levels were low and within channels,
even with levees that were almost
totally destroyed by foundation
liquefaction.Near river mouths, many levees
were overwhelmed by tsunami
waves that caused serious damage
to the levees and oodwalls. Insome tsunami-affected areas of the
river systems, liquefaction-induced
damage and levee settlement may
have resulted in concentrations of
overtopping ows by the subsequent
tsunami waves and, subsequently,
more overtopping damage to the
levee and adjacent areas.
We observed that interim repairs had
been completed within six weeks for
most of the levees seriously damaged
by liquefaction outside the tsunami
areas. The repairs generally con-
sisted of the following components:
• Removal of broken revetments and
paving,
• Placement of new earth ll into
cracks and return of levee section
up to original grade,
• Placement of new buttresses or berms where needed,
• Placement of straw mats on land- side slope to provide slope pro-
tection,
• Placement of articulated con-
crete blocks (cabled together)
on waterside slope and portions
of restored levee crown to armor
these areas,
• Placement of gravel road base on
center of levee crown.
In some areas, a double row of sheetpiles lled with soil was usedas an interim retaining structure
instead of, or in addition to, the
repair of the levee itself. Figure 9
Figure 7. Major slumping of landside slope of Naruse
River right levee and approach road at river km 30.0
(N38.5307, E 141.0064, April 20, 2011).
Figure 8. Levee damage along the Naruse River left lev-
ee at river km 11.3 (N38.4538, E141.1087, April 21, 2011).
Figure 9. Construction of large waterside berm as part of
an interim repair of the Naruse River left levee at river km
30.1 (N38.5333, E 141.0050, April 20, 2011).
Figure 10. Later construction of a double-row sheet-pile
barrier through the waterside berm shown in Figure 9
(N38.5333, E 141.0050, June 3, 2011).
7/29/2019 EERI Special Earthquake Report Sept 2011 - Tohoku Japan
http://slidepdf.com/reader/full/eeri-special-earthquake-report-sept-2011-tohoku-japan 5/12
5
EERI Special Earthquake Report — September 2011
shows the construction of a large
waterside berm as part of the initial
phase of an interim repair for a
levee on the Naruse River. This
repair is on the left levee at River
Kilometer 30.1, directly across the
river from the slumping on the right
bank shown in Figure 7. As shown
in Figure 10, a double-row of sheet-piles was later placed through this
new berm.
Four levee reaches along the Na-
ruse River that had major liquefac-
tion damage during the 2003 Miyagi
North Continuation earthquake (Mw
6.2), and that had been repaired
with a mix-in-place soil cement
foundation ground improvement
technique, were inspected during
our reconnaissance. All four sites
appeared to have performed well,with no observable damage from
the apparently stronger 2011 earth-
quake sequence. Notably, two of
these sites had moderate liquefac-
tion-related levee damage directly
beyond the limits of the ground
treatment. In some cases, this
resulted in signicant transversecracks at the contact transition from
the treated to nontreated sections
of the levees. While the cost for the
2003 treatment was probably sig-
nicant, it was successful in pre-venting major liquefaction-related
damage. However, the cracks be-
tween some of the treated and non-
treated levee reaches may be an
issue that needs to be considered
and addressed in future ground
improvement projects.
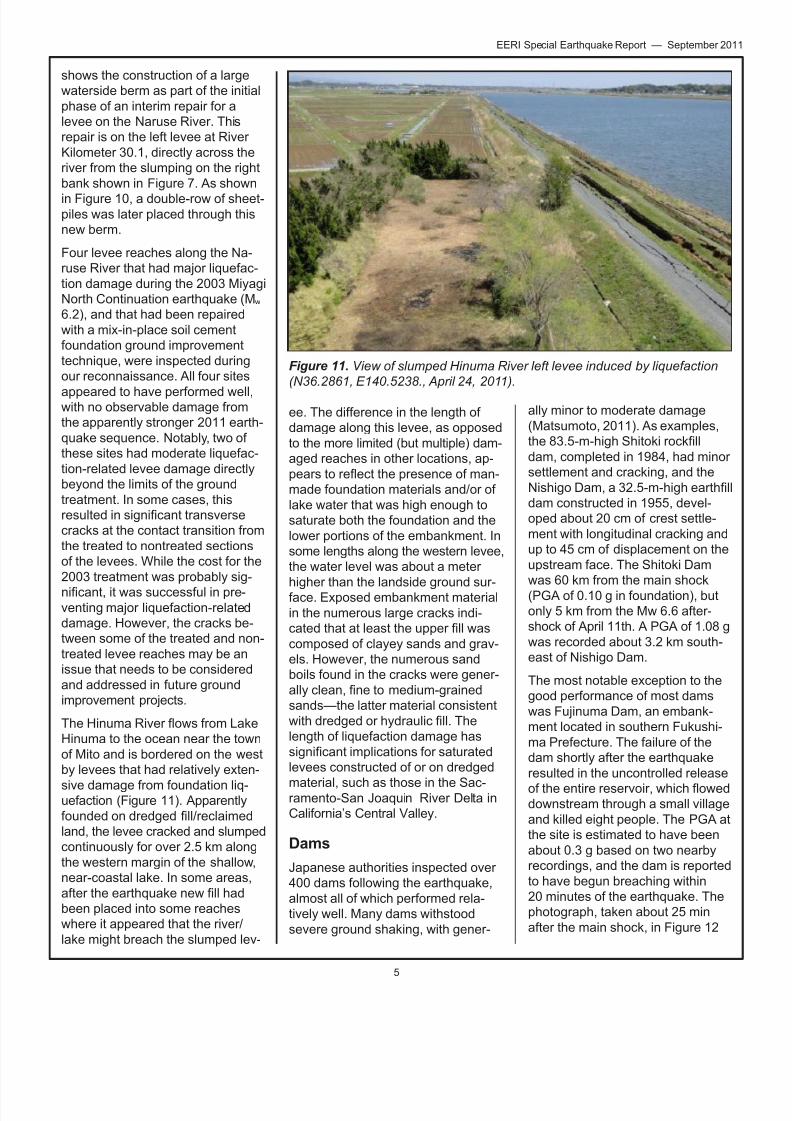
The Hinuma River ows from Lake
Hinuma to the ocean near the town
of Mito and is bordered on the west
by levees that had relatively exten-
sive damage from foundation liq-uefaction (Figure 11). Apparently
founded on dredged ll/reclaimedland, the levee cracked and slumped
continuously for over 2.5 km along
the western margin of the shallow,
near-coastal lake. In some areas,
after the earthquake new ll hadbeen placed into some reaches
where it appeared that the river/
lake might breach the slumped lev-
ee. The difference in the length of
damage along this levee, as opposed
to the more limited (but multiple) dam-
aged reaches in other locations, ap-
pears to reect the presence of man-made foundation materials and/or of
lake water that was high enough to
saturate both the foundation and the
lower portions of the embankment. In
some lengths along the western levee,
the water level was about a meter
higher than the landside ground sur-
face. Exposed embankment material
in the numerous large cracks indi-
cated that at least the upper ll was
composed of clayey sands and grav-
els. However, the numerous sand
boils found in the cracks were gener-
ally clean, ne to medium-grainedsands—the latter material consistent
with dredged or hydraulic ll. Thelength of liquefaction damage has
signicant implications for saturatedlevees constructed of or on dredged
material, such as those in the Sac-ramento-San Joaquin River Delta in
California’s Central Valley.
Dams
Japanese authorities inspected over
400 dams following the earthquake,
almost all of which performed rela-
tively well. Many dams withstood
severe ground shaking, with gener-
ally minor to moderate damage
(Matsumoto, 2011). As examples,
the 83.5-m-high Shitoki rockll
dam, completed in 1984, had minor
settlement and cracking, and the
Nishigo Dam, a 32.5-m-high earthlldam constructed in 1955, devel-
oped about 20 cm of crest settle-
ment with longitudinal cracking and
up to 45 cm of displacement on the
upstream face. The Shitoki Dam
was 60 km from the main shock
(PGA of 0.10 g in foundation), but
only 5 km from the Mw 6.6 after-
shock of April 11th. A PGA of 1.08 g
was recorded about 3.2 km south-
east of Nishigo Dam.
The most notable exception to the
good performance of most dams
was Fujinuma Dam, an embank-
ment located in southern Fukushi-
ma Prefecture. The failure of the
dam shortly after the earthquake
resulted in the uncontrolled release
of the entire reservoir, which oweddownstream through a small village
and killed eight people. The PGA at
the site is estimated to have been
about 0.3 g based on two nearby
recordings, and the dam is reported
to have begun breaching within
20 minutes of the earthquake. The
photograph, taken about 25 min
after the main shock, in Figure 12
Figure 11. View of slumped Hinuma River left levee induced by liquefaction
(N36.2861, E140.5238., April 24, 2011).

7/29/2019 EERI Special Earthquake Report Sept 2011 - Tohoku Japan
http://slidepdf.com/reader/full/eeri-special-earthquake-report-sept-2011-tohoku-japan 6/12
6
EERI Special Earthquake Report — September 2011
shows the dam being overtopped. Aphotograph of the breached section
is shown in Figure 13.
Fujinuma Dam had a maximum
height of about 18.5 m, a crest
length of 133 m, and held a maxi-
mum reservoir volume of approxi-
mately 1.5 million m³ (~1,200 acre-
feet) (Matsumoto, 2011). Construc-
tion of the dam began in 1937, was
halted during World War II, and was
then completed in 1949 (Masumoto,
2011; Towhata et al., 2011; Wikipe-dia/ DAJ, 2011). The dam had a
crest width of 6 m and an upstream
slope between 2.5H:1V and 2.8H:1V,together with small benches and a
relatively steep 1.5H:1V upper slope.The downstream slope was 2.5H:1V,with a small bench at mid-height. It
had a steepened downstream toe,
perhaps indicative of a rock or gravel
toe. Soils exposed in the breach sec-
tion included a central/upstream em-
bankment section comprised of dark
reddish brown clayey gravelly sand,
with overlying embankment lls con-
sisting of light brown clayey gravelly
sand, and a foundation consisting of an approximately 2-m-thick horizon of
black organic silt/clay overlying allu-
vium, colluvium,
and tuff bedrock.
The reservoir for Fujinuma Damwas also retained by a 15 m-high,
60 m-long auxiliary dam, which
developed a large slide in its
upstream slope (Figure 14). The
slide removed almost the entire
upstream half of the embankment
and had the appearance of a ow
slide. The geometry of the slide was
documented using LiDAR imagery
(Figure 15). There was no obvious
distress to the downstream slope of
the auxiliary dam, likely composed
of materials similar to those of themain dam, but with steeper side
slopes at about 1.8H:1V.
There were signs of minor slope
distress and failure within the soils
Figure 12. Overtopping of Fujinuma main dam
(N37.3021˚, E140.1952˚, 3:11 p.m. on March 11, 2011,
photo: M.Yoshizawa).
Figure 13. View of breach in Fujinuma main dam from
left abutment looking upstream (N37.3021˚, E140.1952˚,
March 22, 2011, photo: M.Yoshizawa).
Figure 14. View of upstream slide in Fujinuma auxiliary
dam from left abutment (N37.2995˚, E140.1956˚, photo:
M.Yoshizawa).
Figure 15. Two model surfaces were constructed for the
landslide debris and the headscarp of the auxiliary dam
failure. Both volumes balanced to approximately 11,000
m of debris.
7/29/2019 EERI Special Earthquake Report Sept 2011 - Tohoku Japan
http://slidepdf.com/reader/full/eeri-special-earthquake-report-sept-2011-tohoku-japan 7/12
7
EERI Special Earthquake Report — September 2011
around the reservoir rim. Some of
these areas were earth lls covered
with concrete revetments, and
other areas appeared to be sliver
lls atop native ground.
Our reconnaissance efforts were
too limited to allow any denitive
conclusions regarding the failureof the Fujinuma main dam or the
upstream slide in the auxiliary dam.
Nevertheless, several potential fail-
ure modes warrant close examina-
tion. The main dam’s breach ap-
peared to develop due to overtop-
ping of the lowered crest; the crest
was likely lowered due either to an
upstream slope failure resulting
from strength loss in the ll materi-
als, or a downstream slope failure
resulting from sliding on weak
foundation soils (which included athick organic paleo-soil) or sliding
through poorly compacted ll. Itis also possible that ow throughcracks along the crest or internal
erosion and seepage were respon-
sible. The auxiliary dam’s upstream
slope sliding could have been
caused directly by strength loss of
material and earthquake shaking,
or by rapid drawdown loading re-
sulting from the rapid release of
the reservoir water through the
main dam breach. Clarication of the most likely causes of each are
expected to come from additional
detailed studies.
Ports
Ports in the disaster area were heav-
ily damaged by both earthquake
shaking and the tsunami. The
northern ports of Soma, Hachinohe,
Sendai, Ishinomaki, and Onahama
were among the most heavily dam-
aged. The port at Sendai requiredmore than a week of emergency
work before it could handle its rst
relief ship on March 19th, and an-
other four weeks of work before its
rst commercial shipment on April 17th. Ports in areas south of the
disaster area did not have the same
level of tsunami-related damage,
but were still signicantly affected.The Japan Times reported that ap-
proximately 90% of the 29,000 shing
boats in the affected areas were ren-
dered unusable after the earthquake.
GEER members inspected the major
ports of Ibaraki prefecture, in the
southern portion of the affected re-
gion, including the ports of Kashima,
Oarai, Hitachinaka, and Hitachi, as
well as ports north of Sendai, includ-ing Kesennuma, Onagawa, and
Rikuzentakata, about one month after
the earthquake.
Kashima is a medium-size port in the
southern part of Ibaraki prefecture,
less than 80 km east of Tokyo. The
Japanese government began to devel-
op this port in 1963 and completed it
in 1973. The port is comprised of a
central passage that connects to two
public wharves (the North and South
Public Wharves) through the Northand South Passages. Two breakwa-
ters protect the entrance to the port.
In 2006 a container terminal went into
operation, upgrading the functions of
the port as a distribution terminal. We
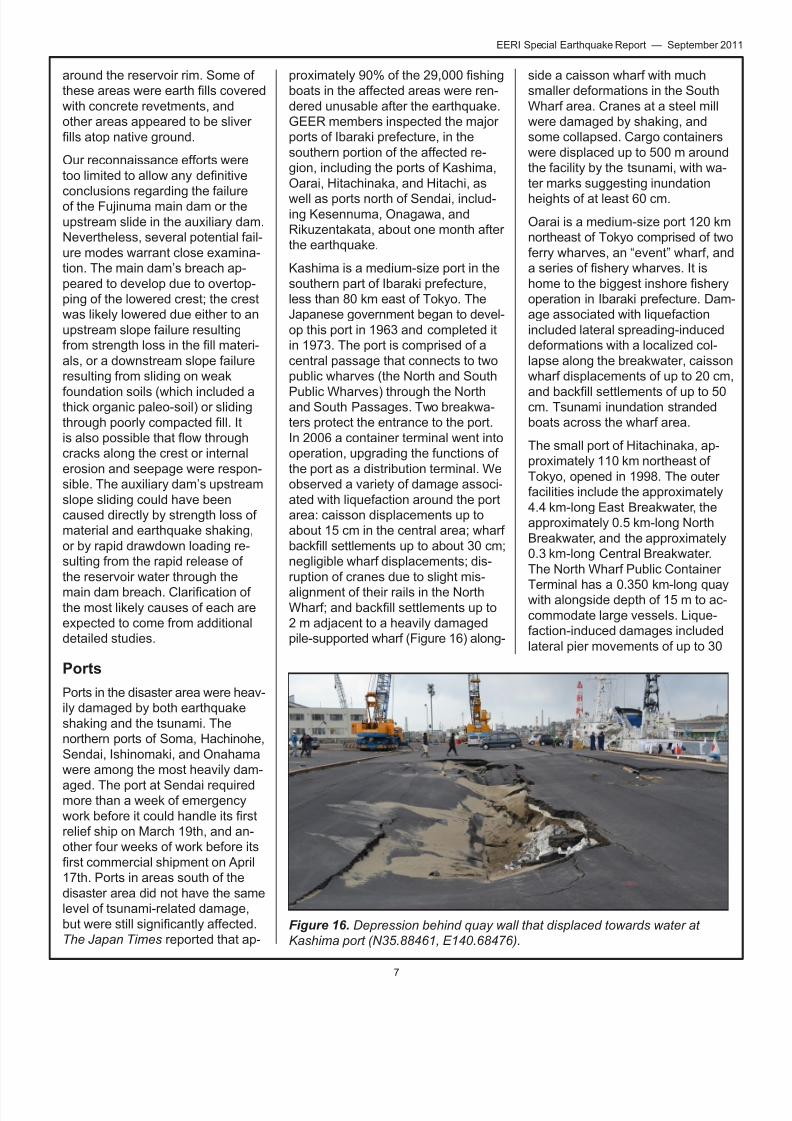
observed a variety of damage associ-
ated with liquefaction around the port
area: caisson displacements up to
about 15 cm in the central area; wharf
backll settlements up to about 30 cm; negligible wharf displacements; dis-
ruption of cranes due to slight mis-
alignment of their rails in the NorthWharf; and backll settlements up to2 m adjacent to a heavily damaged
pile-supported wharf (Figure 16) along-
side a caisson wharf with much
smaller deformations in the South
Wharf area. Cranes at a steel mill
were damaged by shaking, and
some collapsed. Cargo containers
were displaced up to 500 m around
the facility by the tsunami, with wa-
ter marks suggesting inundation
heights of at least 60 cm.
Oarai is a medium-size port 120 km
northeast of Tokyo comprised of two
ferry wharves, an “event” wharf, and
a series of shery wharves. It is
home to the biggest inshore shery
operation in Ibaraki prefecture. Dam-
age associated with liquefaction
included lateral spreading-induced
deformations with a localized col-
lapse along the breakwater, caisson
wharf displacements of up to 20 cm,
and backll settlements of up to 50cm. Tsunami inundation stranded
boats across the wharf area.
The small port of Hitachinaka, ap-
proximately 110 km northeast of
Tokyo, opened in 1998. The outer
facilities include the approximately
4.4 km-long East Breakwater, the
approximately 0.5 km-long North
Breakwater, and the approximately
0.3 km-long Central Breakwater.
The North Wharf Public Container
Terminal has a 0.350 km-long quaywith alongside depth of 15 m to ac-
commodate large vessels. Lique-
faction-induced damages included
lateral pier movements of up to 30
Figure 16. Depression behind quay wall that displaced towards water at
Kashima port (N35.88461, E140.68476).
7/29/2019 EERI Special Earthquake Report Sept 2011 - Tohoku Japan
http://slidepdf.com/reader/full/eeri-special-earthquake-report-sept-2011-tohoku-japan 8/12
8
EERI Special Earthquake Report — September 2011
cm, with associated disruption andmisalignment of crane rails, and
backll settlements of up to 1 m,
with associated differential settle-
ments affecting pavements and
structures. Water marks indicated
tsunami inundation heights of about
1.2 m.
Hitachi is a medium-size port with
cargo piers and an oil terminal;
opened in 1959, it became an active
port in 1967 and has 17 quays with
water depth up to 12 m. Liquefac-tion-induced damage included back-
ll settlements of up to 1 m, muchsmaller lateral deformations of the
wharves in most areas, and the
collapse of the northwest corner of
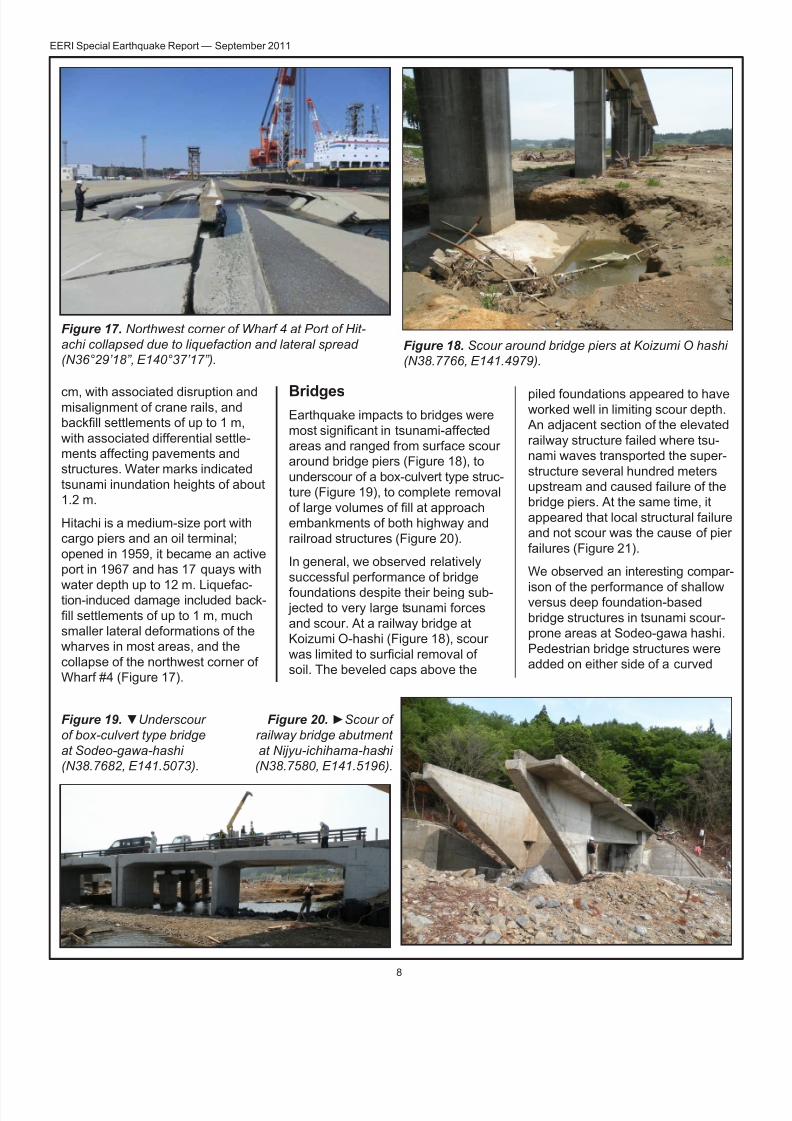
Wharf #4 (Figure 17).
BridgesEarthquake impacts to bridges were
most signicant in tsunami-affectedareas and ranged from surface scour
around bridge piers (Figure 18), to
underscour of a box-culvert type struc-
ture (Figure 19), to complete removal
of large volumes of ll at approachembankments of both highway and
railroad structures (Figure 20).
In general, we observed relatively
successful performance of bridge
foundations despite their being sub- jected to very large tsunami forces
and scour. At a railway bridge at
Koizumi O-hashi (Figure 18), scour
was limited to surcial removal of soil. The beveled caps above the
piled foundations appeared to haveworked well in limiting scour depth.
An adjacent section of the elevated
railway structure failed where tsu-
nami waves transported the super-
structure several hundred meters
upstream and caused failure of the
bridge piers. At the same time, it
appeared that local structural failure
and not scour was the cause of pier
failures (Figure 21).
We observed an interesting compar-
ison of the performance of shallowversus deep foundation-based
bridge structures in tsunami scour-
prone areas at Sodeo-gawa hashi.
Pedestrian bridge structures were
added on either side of a curved
Figure 17. Northwest corner of Wharf 4 at Port of Hit-
achi collapsed due to liquefaction and lateral spread
(N36°29’18”, E140°37’17”).Figure 18. Scour around bridge piers at Koizumi O hashi
(N38.7766, E141.4979).
Figure 19. ▼Underscour
of box-culvert type bridge
at Sodeo-gawa-hashi
(N38.7682, E141.5073).
Figure 20. ►Scour of
railway bridge abutment
at Nijyu-ichihama-hashi
(N38.7580, E141.5196).

7/29/2019 EERI Special Earthquake Report Sept 2011 - Tohoku Japan
http://slidepdf.com/reader/full/eeri-special-earthquake-report-sept-2011-tohoku-japan 9/12
9
EERI Special Earthquake Report — September 2011
highway bridge using two different
approaches: one was a shallow
foundation box-culvert type struc-
ture, and the other was a pile
foundation-supported pier type
structure. A two-opening module of
the box-culvert rotated about its
long axis and settled about 0.6 m
at one end as a result of under-
scour (Figure 19). In contrast, while
the superstructure of the pedestrianbridge on the other side of the high-
way bridge was moved upstream
by tsunami wave forces, the 0.75
m-diameter single pile foundation
elements and pile caps remained
perfectly intact, despite scour of up
to 0.6 m around the piles.
In some cases, bridge structures
were also extensively damaged,
with superstructures being moved
several hundred meters upstream
by tsunami wave forces (KoizumiO-hashi). However, often the entire
bridge structure remained intact but
inaccessible due to scour effects
on the approach structures; this
was the situation at both the Nijyu-
ichihama hashi railway bridge
(Figure 20) and the nearby high-
way bridge.
In general, limited damage was
noted to inland bridges unaffected by
the tsunami. We noted minor settle-
ment of abutments lls and bridgepiers due to strong ground motion in
several locations. At the Naruse River
Bridge, there was damage due to liq-
uefaction (river km 30.1), with differ-
ential settlements at the abutments
and differential settlements of the
piers along the main span, warping
the bridge deck. Evidence of lique-faction was observed at a few other
bridge and viaduct locations, with
the most common manifestations
being differential settlements at
abutments and sinkholes around
the piers.
Lifelines and Transportation
Water supply was suspended to ap-proximately 2.23 million households
in the damaged area; it required
over two months to restore water to
all habitable service areas. Although
much damage was caused by the
tsunami, there was widespread dis-
ruption from earthquake-induced
ground deformation. Liquefaction-
induced soil movements damaged
water treatment plants in Kashima
City (Figure 22) and Wanigawa, as
well as the Hebita and Abuta Water
Treatment Plants in Ishinomaki, anda wastewater treatment plant in
Itako City.
Eighteen wastewater treatment
plants were damaged, mainly by the
tsunami but also by shaking and liq-
uefaction-induced ground deforma-
tions. In tsunami-ravaged areas, it is
often difcult to determine whether
ground deformations resulted from
ground movements or erosion. About
922 km of sewer pipes in the Toho-
ku region were damaged by tsunamiand shaking, and aftershocks in-
creased the damage. Liquefaction-
Figure 21. Structural failure of piers at Koizumi O-hashi (N38.7754, E141.4984).
Figure 22. Liquefaction-induced differential movements around buried tanks
at a water treatment plant in Kashima City (N35.932, E140.628).
7/29/2019 EERI Special Earthquake Report Sept 2011 - Tohoku Japan
http://slidepdf.com/reader/full/eeri-special-earthquake-report-sept-2011-tohoku-japan 10/12
10
EERI Special Earthquake Report — September 2011
induced damage was common inthe lower plains (IWA, 2011), and
shaking-induced soil settlement and
tectonic subsidence of up to several
meters has resulted in ood inunda-
tion problems.
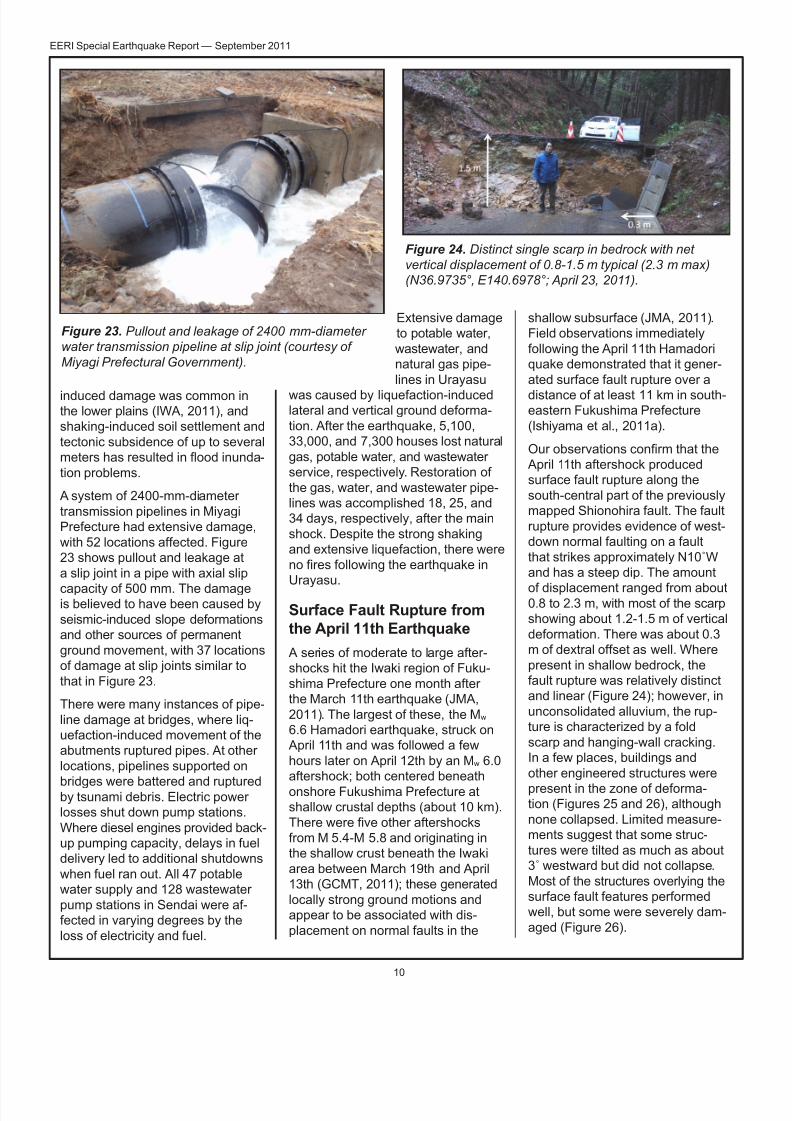
A system of 2400-mm-diameter
transmission pipelines in Miyagi
Prefecture had extensive damage,
with 52 locations affected. Figure
23 shows pullout and leakage at
a slip joint in a pipe with axial slip
capacity of 500 mm. The damageis believed to have been caused by
seismic-induced slope deformations
and other sources of permanent
ground movement, with 37 locations
of damage at slip joints similar to
that in Figure 23.
There were many instances of pipe-
line damage at bridges, where liq-
uefaction-induced movement of the
abutments ruptured pipes. At other
locations, pipelines supported on
bridges were battered and rupturedby tsunami debris. Electric power
losses shut down pump stations.
Where diesel engines provided back-
up pumping capacity, delays in fuel
delivery led to additional shutdowns
when fuel ran out. All 47 potable
water supply and 128 wastewater
pump stations in Sendai were af-
fected in varying degrees by the
loss of electricity and fuel.
Extensive damage
to potable water,
wastewater, and
natural gas pipe-
lines in Urayasu
was caused by liquefaction-inducedlateral and vertical ground deforma-
tion. After the earthquake, 5,100,
33,000, and 7,300 houses lost natural
gas, potable water, and wastewater
service, respectively. Restoration of
the gas, water, and wastewater pipe-
lines was accomplished 18, 25, and
34 days, respectively, after the main
shock. Despite the strong shaking
and extensive liquefaction, there were
no res following the earthquake inUrayasu.
Surface Fault Rupture from
the April 11th Earthquake
A series of moderate to large after-
shocks hit the Iwaki region of Fuku-
shima Prefecture one month after
the March 11th earthquake (JMA,
2011). The largest of these, the Mw
6.6 Hamadori earthquake, struck on
April 11th and was followed a few
hours later on April 12th by an Mw 6.0
aftershock; both centered beneath
onshore Fukushima Prefecture at
shallow crustal depths (about 10 km).
There were ve other aftershocksfrom M 5.4-M 5.8 and originating in
the shallow crust beneath the Iwaki
area between March 19th and April
13th (GCMT, 2011); these generated
locally strong ground motions and
appear to be associated with dis-
placement on normal faults in the
shallow subsurface (JMA, 2011).
Field observations immediately
following the April 11th Hamadori
quake demonstrated that it gener-
ated surface fault rupture over a
distance of at least 11 km in south-eastern Fukushima Prefecture
(Ishiyama et al., 2011a).
Our observations conrm that the
April 11th aftershock produced
surface fault rupture along the
south-central part of the previously
mapped Shionohira fault. The fault
rupture provides evidence of west-
down normal faulting on a fault
that strikes approximately N10˚Wand has a steep dip. The amount
of displacement ranged from about0.8 to 2.3 m, with most of the scarp
showing about 1.2-1.5 m of vertical
deformation. There was about 0.3
m of dextral offset as well. Where
present in shallow bedrock, the
fault rupture was relatively distinct
and linear (Figure 24); however, in
unconsolidated alluvium, the rup-
ture is characterized by a fold
scarp and hanging-wall cracking.
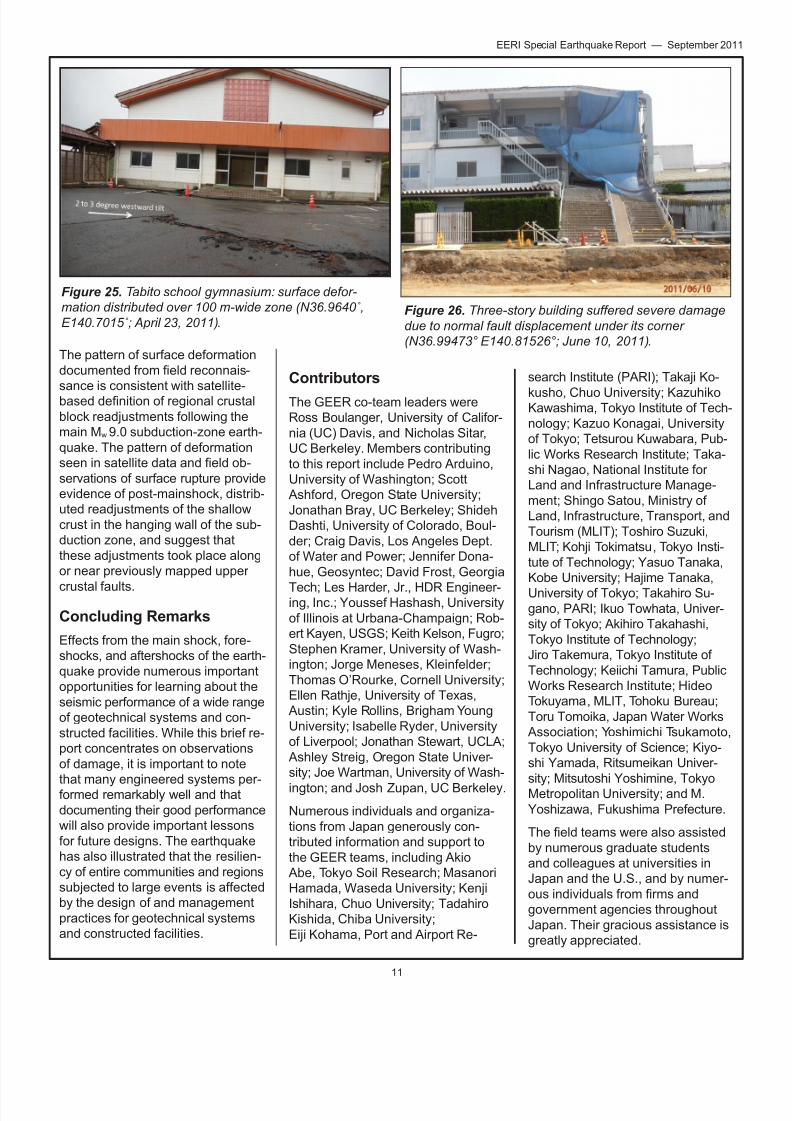
In a few places, buildings and
other engineered structures were
present in the zone of deforma-tion (Figures 25 and 26), although
none collapsed. Limited measure-
ments suggest that some struc-
tures were tilted as much as about
3˚ westward but did not collapse.
Most of the structures overlying the
surface fault features performed
well, but some were severely dam-
aged (Figure 26).
Figure 24. Distinct single scarp in bedrock with net
vertical displacement of 0.8-1.5 m typical (2.3 m max)
(N36.9735°, E140.6978°; April 23, 2011).
Figure 23. Pullout and leakage of 2400 mm-diameter
water transmission pipeline at slip joint (courtesy of
Miyagi Prefectural Government).
7/29/2019 EERI Special Earthquake Report Sept 2011 - Tohoku Japan
http://slidepdf.com/reader/full/eeri-special-earthquake-report-sept-2011-tohoku-japan 11/12
11
EERI Special Earthquake Report — September 2011
The pattern of surface deformation
documented from eld reconnais-
sance is consistent with satellite-
based denition of regional crustal
block readjustments following the
main Mw 9.0 subduction-zone earth-
quake. The pattern of deformation
seen in satellite data and eld ob-
servations of surface rupture provide
evidence of post-mainshock, distrib-
uted readjustments of the shallow
crust in the hanging wall of the sub-
duction zone, and suggest that
these adjustments took place along
or near previously mapped upper
crustal faults.
Concluding Remarks
Effects from the main shock, fore-
shocks, and aftershocks of the earth-
quake provide numerous important
opportunities for learning about the
seismic performance of a wide range
of geotechnical systems and con-
structed facilities. While this brief re-
port concentrates on observations
of damage, it is important to note
that many engineered systems per-formed remarkably well and that
documenting their good performance
will also provide important lessons
for future designs. The earthquake
has also illustrated that the resilien-
cy of entire communities and regions
subjected to large events is affected
by the design of and management
practices for geotechnical systems
and constructed facilities.
Contributors
The GEER co-team leaders were
Ross Boulanger, University of Califor-
nia (UC) Davis, and Nicholas Sitar,
UC Berkeley. Members contributing
to this report include Pedro Arduino,
University of Washington; Scott
Ashford, Oregon State University;
Jonathan Bray, UC Berkeley; Shideh
Dashti, University of Colorado, Boul-
der; Craig Davis, Los Angeles Dept.
of Water and Power; Jennifer Dona-
hue, Geosyntec; David Frost, Georgia
Tech; Les Harder, Jr., HDR Engineer-ing, Inc.; Youssef Hashash, University
of Illinois at Urbana-Champaign; Rob-
ert Kayen, USGS; Keith Kelson, Fugro;
Stephen Kramer, University of Wash-
ington; Jorge Meneses, Kleinfelder;
Thomas O’Rourke, Cornell University;
Ellen Rathje, University of Texas,
Austin; Kyle Rollins, Brigham Young
University; Isabelle Ryder, University
of Liverpool; Jonathan Stewart, UCLA;
Ashley Streig, Oregon State Univer-
sity; Joe Wartman, University of Wash-
ington; and Josh Zupan, UC Berkeley.
Numerous individuals and organiza-
tions from Japan generously con-
tributed information and support to
the GEER teams, including Akio
Abe, Tokyo Soil Research; Masanori
Hamada, Waseda University; Kenji
Ishihara, Chuo University; Tadahiro
Kishida, Chiba University;
Eiji Kohama, Port and Airport Re-
search Institute (PARI); Takaji Ko-
kusho, Chuo University; KazuhikoKawashima, Tokyo Institute of Tech-
nology; Kazuo Konagai, University
of Tokyo; Tetsurou Kuwabara, Pub-
lic Works Research Institute; Taka-
shi Nagao, National Institute for
Land and Infrastructure Manage-
ment; Shingo Satou, Ministry of
Land, Infrastructure, Transport, and
Tourism (MLIT); Toshiro Suzuki,
MLIT; Kohji Tokimatsu, Tokyo Insti-
tute of Technology; Yasuo Tanaka,
Kobe University; Hajime Tanaka,
University of Tokyo; Takahiro Su-gano, PARI; Ikuo Towhata, Univer-
sity of Tokyo; Akihiro Takahashi,
Tokyo Institute of Technology;
Jiro Takemura, Tokyo Institute of
Technology; Keiichi Tamura, Public
Works Research Institute; Hideo
Tokuyama, MLIT, Tohoku Bureau;
Toru Tomoika, Japan Water Works
Association; Yoshimichi Tsukamoto,
Tokyo University of Science; Kiyo-
shi Yamada, Ritsumeikan Univer-
sity; Mitsutoshi Yoshimine, Tokyo
Metropolitan University; and M.
Yoshizawa, Fukushima Prefecture.
The eld teams were also assisted
by numerous graduate students
and colleagues at universities in
Japan and the U.S., and by numer-
ous individuals from rms andgovernment agencies throughout
Japan. Their gracious assistance is
greatly appreciated.
Figure 25. Tabito school gymnasium: surface defor-
mation distributed over 100 m-wide zone (N36.9640˚,
E140.7015˚; April 23, 2011).Figure 26. Three-story building suffered severe damage
due to normal fault displacement under its corner
(N36.99473° E140.81526°; June 10, 2011).

7/29/2019 EERI Special Earthquake Report Sept 2011 - Tohoku Japan
http://slidepdf.com/reader/full/eeri-special-earthquake-report-sept-2011-tohoku-japan 12/12
12
EERI Special Earthquake Report — September 2011
References
Active Fault Research Group, 1991.
“Active Faults in Japan.” Uni-
versity of Tokyo Press; updated
version available online at http://
riodb02.ibase.aist.go.jp/active-
fault/
Boore, D. M., 2011. “Comparisons
of ground motions from the M 9
Tohoku earthquake with ground-
motion prediction equations
for subduction interface earth-
quakes,” www.daveboore.com,
March 31.
Dam Association of Japan, 2011.
“Fujinuma Dam–Dam Hand-
book,” referenced through Wiki-
pedia, http://damnet.or.jp/cgi-bin/
binranA/All.cgi?db4=0483
Geological Survey of Japan, 2009.
Seamless Geological Map of
Japan, 1:200,000 Detail Version,map 2009-12-01; http://riodb02.
ibase.aist.go.jp/db084/
Global Central Moment Tensor
(GCMT) Project, 2011. Global
CMT Search Catalog ; http://www.
globalcmt.org/, accessed June 4,
2011.
Ide, S., A. Baltay and G.C. Beroza,
2011. “Shallow Dynamic Over-shoot and Energetic Deep Rup-
ture in the 2011 Mw 9.0 Tohoku-
Oki Earthquake.” Sciencexpress,
www.sciencexpress.org, May 19.
International Water Association
(IWA), 2011. “Japan’s Prog-
ress with Recovery: Restoring
Services in the Disaster Zone.”
Water21, magazine of the Inter-
national Water Association, June,
pp. 12-16.
Ishiyama, T., et al., 2011a. “The
surface earthquake fault of the
11th April 2011 earthquake in
Hamadoori Fukushima Prefec-
ture,” Outreach information from
the University of Tokyo, April 13;
http://outreach.eri.u-tokyo.ac.jp/
eqvolc/201103_tohoku/eng/fuku-
shimahamadoori2/
Ishiyama, T., et al., 2011b. “The
surface earthquake fault of the 11th
April 2011 earthquake in Hamadori
Fukushima Prefecture,” Outreach
information from the University of
Tokyo, April 20; http://outreach.
eri.u-tokyo.ac.jp/eqvolc/201103_
tohoku/eng/fukushimahamadoori2/
Japan Meteorological Agency, 2011.
A strong aftershock of ‘The 2011
off the Pacic coast of TohokuEarthquake’ occurred Monday 11
April; http://www.jma.go.jp/jma/en/
News/20110411_aftershock.html
Kanno, T., et al., 2006. “A new attenu-
ation relation for strong ground mo-
tion in Japan based on recorded
data,” Bull. Seismol. Soc. Am., #96,
pp. 879–897.
Matsumoto, N., 2011, “Amended 4thQuick Report on Dams,” Japanese
Committee on Large Dams, April 4.
Midorikawa, S., and H. Miura, 2011.
“The 2011 Off the Pacic Coast of Tohoku Earthquake—Earthquake
and Ground Motions,” Center for
Urban Earthquake Engineering,
Tokyo Tech, Brieng for PEER/
EERI Reconnaissance Team, April
11.
Ministry of Land, Infrastructure, andTransportation, 2011. Brieng noteson the performance and repair of
levees damaged by the March 11,
2011, Tohoku Offshore Earthquake,
Japan.
Ryder, I., et al., in review. “Large shal-
low crustal aftershocks on previous-
ly unknown normal faults triggered
by the 2010 Maule earthquake,
Chile.” Submitted to Geophysical
Journal International , May 2011.
Takahasi, A., 2011. “Liquefaction-induced damage to levees and
embankments from the earthquake
off the Pacic coast of Tohoku
Earthquake,” brieng notes, TokyoInstitute of Technology, April 18.
Tokimatsu, K., et al., 2011. “Quick
Report on Geotechnical Problems
in the 2011 Tohoku Pacic Ocean
Earthquake,” Research Reports on
Earthquake Engineering , CUEE,
Tokyo Institute of Technology,
#118, pp. 21-47 (in Japanese).
Towhata, I., et al., 2011. “On Gigan-
tic Tohoku Pacic Earthquake in
Japan,” Earthquake News, Bulle-
tin of the International Society for
Soil Mechanics and Geotechnical Engineering , Volume 5, Issue 2,
April.
US Geological Survey, 2011. Shake
Map for 2011 Tohoku Earth-
quake, March 13, 2011. http://
earthquake.usgs.gov/earth-
quakes/shakemap/global/shake/
c0001xgp/
Wartman, J., B. Tiwari and D. Pradal,
2011. “2011 Embankment, Dams
and Slopes Committee Team
Reports on the Tohoku JapanEarthquake,” Geo-Institute,
American Society of Civil Engi-
neers; http://content.geoinstitute.
org/JapanEQ2011.html.
Wikipedia, http://en.wikipedia.org/
wiki/Fujinuma_Dam
Zhao, J. X., et al., 2006. “Attenua-
tion relations of strong ground
motion in Japan using site clas-
sication based on predominant
period,” Bull. Seismol. Soc. Am.#96, pp. 898-913.