Embed Size (px)
Citation preview
Efficiency of the CO2-concentrating mechanismof diatomsBrian M. Hopkinsona,1, Christopher L. Dupontb, Andrew E. Allenb, and François M. M. Morela,2
aDepartment of Geosciences, Princeton University, Princeton, NJ 08544; and bJ. Craig Venter Institute, San Diego, CA 92121
This contribution is part of the special series of Inaugural Articles by members of the National Academy of Sciences elected in 2009.
Contributed by François M. Morel, January 19, 2011 (sent for review October 1, 2010)
Diatoms are responsible for a large fraction of CO2 export to deepseawater, a process responsible for low modern-day CO2 concen-trations in surface seawater and the atmosphere. Like other pho-tosynthetic organisms, diatoms have adapted to these low ambientconcentrations by operating a CO2 concentratingmechanism (CCM)to elevate the concentration of CO2 at the site of fixation. We usedmass spectrometric measurements of passive and active cellularcarbon fluxes and model simulations of these fluxes to better un-derstand the stoichiometric and energetic efficiency and the phys-iological architecture of the diatom CCM. The membranes ofdiatoms are highly permeable to CO2, resulting in a large diffusiveexchange of CO2 between the cell and external milieu. An activetransport of carbon from the cytoplasm into the chloroplast is themain driver of the diatom CCM. Only one-third of this carbon flux isfixed photosynthetically, and the rest is lost by CO2 diffusion backto the cytoplasm. Both the passive influx of CO2 from the externalmedium and the recycling of the CO2 leaking out of the chloroplastare achieved by the activity of a carbonic anhydrase enzyme com-binedwith themaintenance of a low concentration of HCO3
− in thecytoplasm. To achieve the CO2 concentration necessary to saturatecarbon fixation, the CO2 is most likely concentrated within the py-renoid, an organelle within the chloroplast where the CO2-fixatingenzyme is located.
climate change | ocean acidification | phytoplankton
Diatoms evolved during the Mesozoic era and have graduallybecome major actors in the oceanic cycles of elements (1).
Their precipitation of siliceous frustules now dominates the re-verse weathering of silica, and their photosynthetic activitycontributes some 40% of modern-day oceanic primary pro-duction. Because of their large size and silica ballast, they con-tribute a major fraction of the downward flux of particulateorganic carbon and thus, a major fraction of the export of CO2to deep seawater. The low modern-day CO2 concentration insurface seawater and the atmosphere that results from thisbiological carbon pump poses a challenge to photosyntheticorganisms, including diatoms themselves. Like most photosyn-thetic organisms, they fix carbon using RubisCO as the carbox-ylating enzyme. Diatom RubisCOs suffer from the same slowturnover rate and wasteful tendency to fix O2 as other RubisCOs,and their affinity for CO2 is only marginally better (2, 3). As inother photosynthetic organisms, the main adaptation of diatomsto the gradual decrease in ambient CO2 and increase in O2 overgeological times has been the evolution of a CO2 concentratingmechanism (CCM) to elevate the concentration of CO2 at thesite of fixation by RubisCO (4–7). It is perhaps not an exagger-ation to posit that today’s atmospheric CO2 concentration is, inlarge part, determined by the efficiency of the CCM of diatoms.Despite its importance, the physiology/biochemistry of dia-
toms has been little studied compared with that of model pho-tosynthetic organisms, and the CCM of diatoms is still poorlyunderstood. Some species operate a C4-type pathway, whereasothers seem to rely on active transport of HCO3
− into thechloroplast (4–8). Active transport of inorganic carbon by theCCM is thought to account for a significant portion of cellularenergy expenditure (2). Energy expenditure on the CCM is
currently of interest, because savings from its down-regulationare likely to be responsible for the major acclimations of oceanicphytoplankton to rising CO2 over the next century.Because lipid bilayers are highly permeable to small un-
charged molecules like CO2 (9), the CCM of unicellular organ-isms like diatoms is necessarily leaky; only a fraction of the CO2molecules concentrated at the site of RubisCO end up beingfixed, and the rest are lost by diffusion. The total energetic ex-penditure to operate a CCM is, thus, the product of the energyexpended to concentrate 1 molecule CO2 at the site of fixationmultiplied by the mole ratio of CO2 transported to CO2 fixed.However, at this point, neither of these terms is known with anyprecision. At the most basic level, we do not know how perme-able to CO2 diatoms membranes really are and what barriersmay slow down the outward diffusion of CO2 (10, 11). Here, weattempt a complete characterization of inorganic carbon fluxes inmodel diatoms using membrane inlet MS (MIMS) (12) and ki-netic models of 18O isotope exchange from CO2.
ResultsOverall Strategy. The bulk of our experiments consist of timecourses of 18O depletion from labeled inorganic carbon, a pro-cess catalyzed by the presence of the enzyme carbonic anhydrase(CA) in cells. CA, which catalyzes the hydration of CO2 anddehydration of HCO3
−, plays critical roles in CCMs and ispresent in all our experimental organisms: Thalassiosira weiss-flogii, T. pseudonana, T. oceanica, and Phaedactylum tricornutum,(SI Text, Experimental Organisms). The 18O depletion data areanalyzed quantitatively using either a one- (homogenous in-tracellular compartment) or two-compartment (cytoplasm andchloroplast) model depending on the data. In a first set ofexperiments with suspensions of cells in the dark (i.e., no pho-tosynthesis), we determine the permeability of the cytoplasmicmembranes to CO2 and HCO3
−. Additional dark experimentswith a strain of P. tricornutum overexpressing a chloroplast-localized CA provide constraints on the permeability of thechloroplast envelope. A third set of experiments with P. tri-cornutum suspensions in the light is used to determine activefluxes of inorganic carbon into the cytoplasm and chloroplast.
Dark Experiments: Permeability of the Cytoplasmic Membrane. Onintroduction of dissolved inorganic carbon (DIC) labeled with13C and 18O into unlabeled water buffered at pH 8.0, the labeledspecies, CO2, HCO3
−, and CO32−, reach chemical and isotopic
equilibrium with each other within minutes. Over a time scale ofhours (Fig. 1A, left side), 18O is lost from DIC as a result of theincorporation of 16O during the hydration of CO2 by H2
16O and
Author contributions: B.M.H. and F.M.M.M. designed research; B.M.H., C.L.D., and A.E.A.performed research; B.M.H. and F.M.M.M. analyzed data; and B.M.H. and F.M.M.M.wrote the paper.
The authors declare no conflict of interest.1Present address: Department of Marine Sciences, University of Georgia, Athens,GA 30602.
2To whom correspondence should be addressed. E-mail: [email protected].
This article contains supporting information online at www.pnas.org/lookup/suppl/doi:10.1073/pnas.1018062108/-/DCSupplemental.
www.pnas.org/cgi/doi/10.1073/pnas.1018062108 PNAS Early Edition | 1 of 8
ENVIRONMEN
TAL
SCIENCE
SINAUGURA
LART
ICLE

subsequent dehydration of HCO3− (HCO3
− and CO32−, which
equilibrate rapidly with each other, are treated as a combinedpool, referred to as HCO3
−). Using MIMS, the time evolution ofCO2 species with masses 49, 47, and 45 (13C18O18O, 13C18O16O,and 13C16O16O, respectively) provides a convenient means tostudy the kinetics of the hydration/dehydration of CO2 in thepresence or absence of the enzyme CA, which catalyses the re-action (13, 14). If the experiment is carried out in the presence ofcells that contain intracellular CA, the rate of 18O loss from CO2provides information on both the kinetics of CO2/HCO3
− in-terconversion within the cell and the rate of passage of DICspecies across the cellular membrane (13). As seen on the rightside in Fig. 1A, over the first 30 s after diatoms have been addedto the assay medium (which contains the nonpenetrating in-hibitor acetazolamide to inactivate external CA in addition tobuffer and labeled DIC), there is a sudden depletion of 18O fromthe external CO2. This decrease in 49CO2 in the medium iscaused by rapid penetration of CO2 into the cells where itbecomes depleted of 18O through hydration/dehydration cyclescatalyzed by internal CA before diffusing out of the cells. Thisinitial rapid phase terminates when the various isotopic speciesof CO2, which diffuse rapidly across the external membrane, areequilibrated between the intracellular and external media. Sub-sequently, there is a further gradual depletion of 18O from CO2resulting from a loss of 18O from extracellular HCO3
−, which actsto buffer the 18O content of CO2 against depletion by CA, be-cause the HCO3
− concentration is >100× that of CO2 at pH 8.0.The loss of 18O from HCO3
− results from the backgrounduncatalyzed hydration/dehydration of DIC in the external me-dium, the diffusion of 18O-depleted CO2 out of the cell, and thepassage of HCO3
− into the cell.A quantitative analysis of the type of experimental data illus-
trated in Fig. 1Amakes it possible to calculate the cellular transfercoefficients fc and fb (cm3 s−1) of CO2 and HCO3
− across theexternal membrane of the cells and the first-order rate constantskcf and kcr (s
−1) for the CA-catalyzed rates of hydration and de-hydration of CO2/HCO3
− inside the cells (Fig. 2 and Tables 1 and2) (13). In the one-compartment model used for the analysis, CA
is considered to be homogenously distributed throughout the cell.The system of differential equations describing the behavior of18O-DIC in the presence of CA-containing cells is presented in SIText, One-Compartment Models, Passive Carbon Fluxes and TableS1 using the method by Tu et al. (13). This system is solved nu-merically by introducing in the equations appropriate geometricparameters for the cells (SI Text, Experimental Organisms). Thecalculated transfer coefficient fc of CO2 across the cellularmembrane is sufficiently large that diffusion of CO2 through thecell’s boundary layer must be taken into account to calculate thepermeability of the membrane to CO2. This is done by consid-ering that the observed fc results from two transfer processes inseries (1/fc = 1/fc–BL + 1/fc–M) and calculating the cellular transfercoefficient across the boundary layer from the diffusion co-efficient of CO2, D, and the cell’s equivalent radius, r: fc–BL = 4πDr. The membrane permeability to CO2, Pc (in cm s−1), is thenobtained as the ratio of the cellular transfer coefficient across themembrane and the surface area of the cell: Pc = fc–M/A.According to our experimental data, the cytoplasmic mem-
brane of diatoms is highly permeable to CO2. Calculated valuesof Pc range between 1.5 × 10⁻² and 5.6 × 10⁻² cm/s for the fourspecies that we studied, indicating permeabilities that are justbelow those of artificial lipid membranes (∼10−1 cm/s) (9). Thesecalculated Pc values may actually be underestimates if CA is nothomogeneously distributed within the cell as assumed. For ex-ample, CA activity may be higher in the chloroplast, in whichcase the effective radius for diffusion through the boundary layerand the coefficient fc–BL would be smaller. Regardless, it is clearthat the cytoplasmic membrane does not present a significantbarrier to CO2. As a result, a DIC uptake system that would usea transmembrane CO2 transporter would be highly inefficient—akin to pouring water into a bottomless bucket.In contrast, observed cellular transfer coefficients for passive
transport of bicarbonate, fb, are generally not significantly dif-ferent from zero. As expected for a charged molecule, HCO3
−
does not pass easily through diatom membranes. The membranesof green algae are also effectively impermeable to HCO3
− (10,11). The upper limits of the measured fb in our diatom species areseveral orders of magnitude lower than fc values, such that thepassive cellular fluxes of HCO3
− can generally be neglected, al-though the concentration of HCO3
− at pH 8 in seawater is 140×higher than CO2. When passive HCO3
−fluxes are neglected, the
simplified system of equations describing CO2 fluxes across themembrane and intracellular CA activity can be solved analytically(SI Text, One-Compartment Models, Analytical Approximation ofPassive Fluxes, Fig S1, and Table S2).In the above analysis, DIC fluxes in and out of cells in the dark
are assumed to be passive. This assumption can be tested by ex-amining how cellular DIC fluxes vary with substrate concentra-tion. In P. tricornutum, the CO2 influx is directly proportional tothe extracellular CO2 concentration up to very high values (Fig.1B), as expected for a passive flux, whether controlled by mem-brane permeability or diffusion in the boundary layer. In contrast,the CO2 flux should saturate at high concentration if it dependedon active transport. The HCO3
− influx is generally not signifi-cantly different from zero (Fig. 1C) and shows no trend with
Fig. 1. Results of dark experiments to determine passive inorganic carbonfluxes. (A) A sample fit (solid lines) of a single-compartment model, de-scribed in SI Text, One-Compartment Models, Passive Carbon Fluxes anddiagrammed in Fig. 2, to 18O-CO2 data (cells added at t = 0). Inorganic carbonfluxes, derived from the model, as a function of extracellular carbon con-centrations: (B) CO2 flux across the cytoplasmic membrane, (C) HCO3
−flux
across the cytoplasmic membrane, and (D) intracellular CA-catalyzed CO2
hydration rates. Error bars are the SE of the estimated fluxes.
Fig. 2. Diagram of one-compartment models used to determine passivecarbon fluxes and calculate kap during photosynthesis. Additional fluxesconsidered during photosynthesis are in gray and italicized.
2 of 8 | www.pnas.org/cgi/doi/10.1073/pnas.1018062108 Hopkinson et al.
HCO3− concentration, suggesting that the occasional significant
measurements are spurious. Such measurements may reflect in-complete inhibition of external CAs or damage to cell membranesduring handling rather than true membrane permeability.
Dark Experiments with Overexpressed Chloroplastic CA: Constraint onChloroplast Membrane Permeability. Because the subcellular lo-cation of CAs in diatoms is not generally known, the previousanalyses considered the cell as a single compartment to computethe minimum permeability of the cytoplasmic membrane. Torefine these results and estimate the permeability of the chlo-roplast envelope to CO2, we compared 18O exchange assays ina P. tricornutum line overexpressing PtCA1, which is a chloro-plastic β-CA (15), and the WT (Fig. 3). Greater CA activity wasclearly detected in the PtCA1 overexpresser, indicating that thelabeled DIC has access to the overexpressed CA. The system ofequations describing 18O exchange in a model with two cellularcompartments (cytoplasm and chloroplast) and passive fluxes ofboth CO2 and HCO3
− is underdetermined. Based on the resultsof the previous experiments, a simplified model in which onlyCO2 fluxes across membranes are considered was used to in-terpret the data (Fig. 3B, Fig. S2, and SI Text, Chloroplast En-velope Permeability). This assumes that the chloroplast envelope,like the diatom cytoplasmic membrane, is impermeable toHCO3
−. Only a small passive HCO3−flux across the chloroplast
envelope is possible, because a large passive flux of a chargedmolecule would break down the necessary electrical gradient be-tween the chloroplast and cytoplasm. In this simplified model,there are three unknowns (Fp, the flux of CO2 into the chloro-plast, Fxi, the CA-catalyzed rate of CO2 hydration in the cyto-plasm, and Fxp, the CA-catalyzed rate of CO2 hydration in thechloroplast) and two equations relating the model parameters to18O-CO2 observations (SI Text, Chloroplast Envelope Permeability).Because the assays with the WT and overexpresser were carriedout at the same CO2 concentrations, the rates of CO2 hydration inthe cytoplasm, Fxi, must also be the same, although the value isunknown. A possible range of values for Fp (and Fxp) can then beobtained by varying Fxi between zero and the CO2 hydration ratemeasured in the WT and minimizing error with 18O-CO2 obser-vations. Alternatively, a minimum value for Fp is obtained if Fxiis taken to be the total CA activity in the WT and Fxp = ∞.The range of calculated flux of CO2 across the chloroplast
membrane (0.4 × 10⁻¹⁶ − 2.1 × 10⁻¹⁶ mol/cell per s) is between10% and 50% of the maximal rate allowed by diffusion, implying
that this membrane is highly permeable to CO2 (SI Text, Chlo-roplast Envelope Permeability). Like the cytoplasmic membrane,the chloroplast membrane has properties similar to artificial lipidbilayers and does not present a significant barrier to CO2 diffu-sion. In what follows, we use a CO2 transfer coefficient for thechloroplast implied by the lower limit of Fp (fc = 6 × 10⁻⁹ cm3/s)to see if, by itself, the diffusion barrier created by the chloroplastmembrane could result in a sufficiently high concentration ofCO2 at the site of fixation (Discussion).If the overexpressed CA was localized solely to the pyrenoid,
our measurements could be used to constrain diffusive efflux ofCO2 from this compartment. Such localization is implied by theobservation of the overexpressed protein, which was linked toCFP, as strongly fluorescent clusters inside the chloroplaststroma (15). The localization of PtCA1 to the pyrenoid was re-cently verified with immunogold labeling. Unfortunately, somefluorescence could also be detected outside the clusters, makingit impossible to use the rate of CA-catalyzed 18O loss to calculateCO2 diffusion from the putative organelles.
Experiments in the Light: Increase in CA Activity and Active Transportof DIC. When light is turned on in a diatom suspension, oneobserves a transition phase of 30–60 s before steady state pho-tosynthesis is reached (Fig. 4). During the transition phase, thereis a rapid depletion of 18O from CO2 but little net O2 productionand no change in the total CO2 concentration, indicating no sig-nificant net CO2 flux into or out of the cells. The CCM and thy-lakoid pH gradient are presumably initiated during this timeperiod, leading to 18O depletion (Discussion). Later, during steadystate photosynthesis, O2 is produced at a constant rate, and totalCO2 is correspondingly drawn down. Because carbon is fixed froma CO2 pool depleted of 18O through exposure to CAs, 13C16O16Oaccounts for the bulk of the drawdown. The observed 18O de-pletion seen when light is turned on is commonly called light-stimulated CA activity (3, 7). This high apparent CA activity in thelight can be caused either by an actual increase in intracellularCO2 hydration/HCO3
− dehydration rates (i.e., CA activity) oractive transport of DIC into a compartment with high CA activity.Extensive analysis of experimental data shows that both processesmust be at play, and we examine them sequentially.
Increase in CA Activity. An increase in the activity of the cellularCA enzymes can plausibly be induced by light as a result of ac-tivation of CA or changes in the chemistry of cellular compart-
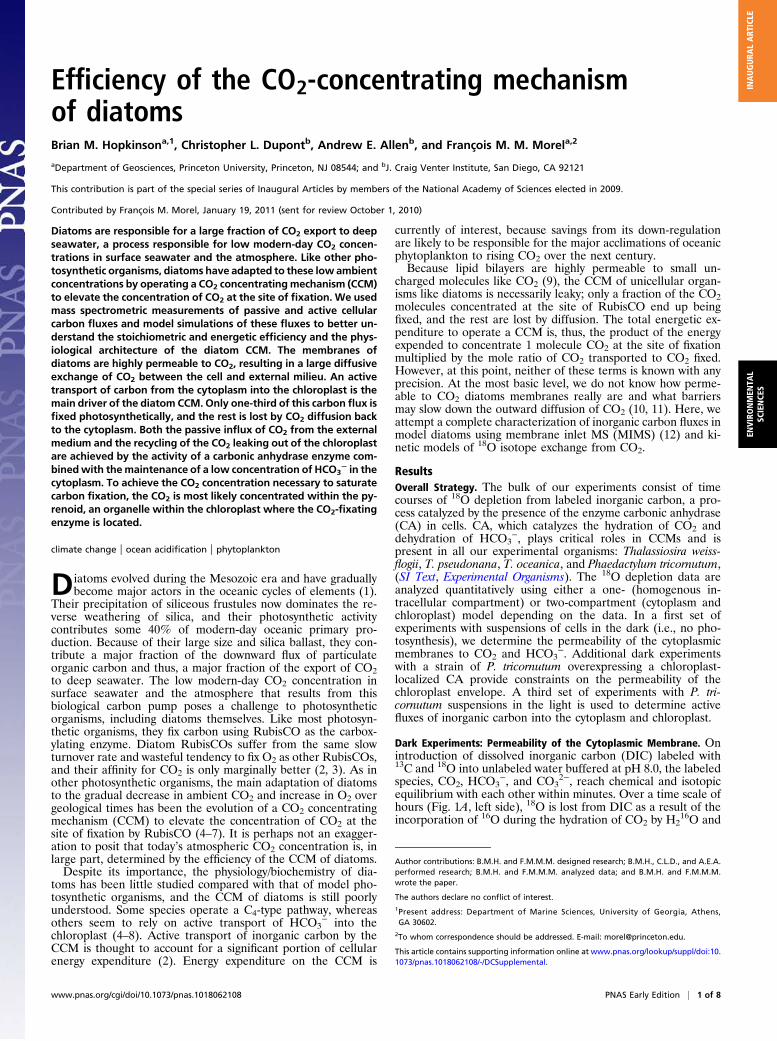
Table 1. Passive CO2 fluxes in four diatoms
Diatom fc (cm3/s) fc–BL (cm
3/s) fc–M (cm3/s) Pc (cm/s)
P. tricornutum 2.3 ± 0.4 × 10⁻⁸ 7.7 × 10⁻⁸ 3.3 ± 0.4 × 10⁻⁸ 3.1 ± 0.4 × 10⁻²
T. weissflogii 6.3 ± 3.2 × 10⁻⁸ 1.5 × 10⁻⁷ 1.1 ± 0.3 × 10⁻⁷ 2.4 ± 0.7 × 10⁻²
T. pseudonana 1.8 ± 0.6 × 10⁻⁸ 5.0 × 10⁻⁸ 2.8 ± 0.6 × 10⁻⁸ 5.6 ± 1.1 × 10⁻²
T. oceanica 1.4 ± 0.2 × 10⁻⁸ 7.5 × 10⁻⁸ 1.7 ± 0.2 × 10⁻⁸ 1.5 ± 0.2 × 10⁻²
The CO2 influx, described by the cellular transfer coefficient fc (± SD), is limited by diffusion through theboundary layer (fc–BL) and passage through the membrane (fc–M). The cytoplasmic membrane permeability toCO2 (Pc ± SD) is derived from fc–M. At least four replicate measurements were made on each organism. Errorswere propagated based on the error in fc measurements.
Table 2. Passive HCO3−fluxes in four diatoms
Diatom fb (cm3/s) fb–BL (cm3/s) fc–M (cm3/s) Pb (cm/s)
P. tricornutum 0.4 ± 1.1 × 10⁻¹¹ 4.6 × 10⁻⁸ 0.4 ± 1.1 × 10⁻¹¹ 0.4 ± 1.0 × 10⁻⁵
T. weissflogii 1.3 ± 1.2 × 10⁻¹⁰ 8.9 × 10⁻⁸ 1.3 ± 1.2 × 10⁻¹⁰ 2.9 ± 2.7 × 10⁻⁵
T. pseudonana 1.3 ± 2.0 × 10⁻¹² 3.0 × 10⁻⁸ 1.3 ± 2.0 × 10⁻¹² 2.5 ± 3.9 × 10⁻⁶
T. oceanica 0.7 ± 1.7 × 10⁻¹¹ 4.4 × 10⁻⁸ 0.7 ± 1.7 × 10⁻¹¹ 0.6 ± 1.5 × 10⁻⁵
The HCO3− influx, described by the cellular transfer coefficient fb (± SD), is limited by diffusion through the
boundary layer (fb–BL) and passage through the membrane (fb–m). The cytoplasmic membrane permability toHCO3
− (Pb ± SD) is derived from fb–m. At least four replicate measurements were made on each organism. Errorswere propagated based on the error in fb measurements.
Hopkinson et al. PNAS Early Edition | 3 of 8
ENVIRONMEN
TAL
SCIENCE
SINAUGURA
LART
ICLE

ments, particularly changes in pH. To quantify the extent of suchincrease in CA activity, we take advantage of the fact that activetransport of DIC, the other possible cause of the light-stimulatedCA activity, must saturate at high DIC concentration, whereaspassive influx of CO2 does not. In P. tricornutum, photosynthesisis saturated at ca. 500 μM DIC, and net carbon transport ratessaturate with photosynthesis in all diatoms studied (6, 7). Incontrast, the diffusion rate of CO2 increases linearly with DICconcentrations up to 12,000 μM ([CO2] = 80 μM) (Fig. 1B). Therelative contribution of active transport processes to 18O de-pletion must consequently decline as the DIC concentrationincreases. At DIC >> 500 μM (say DIC ≥ 4,000 μM) (Discus-sion), any increase in the rate of 18O depletion in the lightcompared with the dark must result from an actual increase inintracellular CA activity.
To quantify this effect, we performed 18O depletion experi-ments in P. tricornutum over a range of DIC concentrations andcalculated the apparent CA activity (kap) necessary to accountfor the data in the dark and the light. The data are analyzedusing the single-compartment model (SI Text, One-CompartmentModels, Apparent CA Activity) as diagrammed in Fig. 2. Themodel is similar to the single-compartment model used to ana-lyze passive fluxes, with the addition of terms for HCO3
− uptakein the light and photosynthesis. The rate of HCO3
− uptake iscalculated at each time point from the experimental data as thedifference between the rate of photosynthesis measured by O2production (assuming 1 CO2 fixed per O2 produced) and netCO2 uptake, itself obtained from the CO2 data corrected for theuncatalyzed rates of CO2 hydration and HCO3
− dehydration inthe external medium (SI Text, Net Photosynthesis, CO2 Uptake,and HCO3
− Uptake) (12). The value of kap, the apparent CAactivity in the cell, is obtained for each experiment by optimizingthe fit of the model calculations with the experimental data. kapserves as a single parameter to quantify the extent of 18O de-pletion in the light; it accounts for both the actual enhancementof CA activity and the effects of active transport on 18O depletion.As expected, there is a much larger difference between kap
(light) and kcf (dark) at low than at high DIC concentrations(Fig. 5). The larger enhancement of apparent CA activity in thelight at low CO2/DIC reflects the effects of active DIC transportas discussed below. The remaining enhancement at high CO2/DIC, on average, a factor of 2.3 ± 0.3 (at DIC ≥ 4,000 μM), iscaused by an actual increase in CA activity in the light. Thetimescale of the 18O depletion is too short for synthesis of newCA enzymes. Therefore, the increase in CA activity likely reflectseither a posttranslational regulation of the enzyme or a change inthe chemistry of the medium. The activity of CAs increase withpH (16, 17), and pH in the chloroplast stroma rises by 0.5–1 unitsduring photosynthesis as a result of light-driven H+ transportinto the thylakoid lumen (18, 19). This is where PtCA1 is located(15), and for the purified PtCA1, an increase of 0.5–1 pH unitswould increase its activity by 3–10× (Fig. S3). Acidification of thethylakoid lumen would also increase the uncatalyzed rate of 18Oexchange in this compartment and contribute to extracellular18O depletion. The small increases in cytoplasmic pH that havebeen measured in microalgae during photosynthesis (e.g., <0.05
Fig. 4. 18O exchange during photosynthesis in P. tricornutum. A light (150μEi/m2 per s) was turned on at t = 0. During the first ∼45 s (dashed line), 18Ois depleted from 13CO2, whereas total 13CO2 remains constant and O2 pro-duction is minimal. After this initiation phase, steady state photosynthesis isreached producing O2 at a constant rate and drawing down the total 13CO2
to support carbon fixation. Carbon fixation draws down primarily 13C16O16O,because the involvement of multiple CAs in the CCM greatly depletes 18Ofrom inorganic carbon by the time that it is fixed. The lines are the fits ofa single-compartment model that is described in SI Text, One-CompartmentModels, Apparent CA Activity and diagrammed in Fig. 2.
Fig. 3. 18O exchange in a P. tricornutum strain overexpressing PtCA1,a chloroplast localized CA. (A) A comparison of 18O depletion by WT andPtCA1 overexpressing P. tricornutum, and (B) a diagram of the model usedto interpret the data. The assay was started by adding the same concen-tration of WT or PtCA1 overexpressing cells at t = 0.
Fig. 5. 18O exchange during photosynthesis in P. tricornutum as a functionof DIC. CA activities, indicated by the hydration rate constant, in the dark(kcf) and apparent CA activities during photosynthesis (kap). Apparent CAactivity includes true CA hydration rates and other processes that deplete18O in the light such as inorganic carbon transport. The line is the kapobtained from simulations of a constant rate of HCO3
− transport into thechloroplast (9 × 10⁻¹⁷ mol/cell per s). Inset shows the ratio kap/kcf, with theline derived from the simulation of HCO3
− transport into the chloroplast.
4 of 8 | www.pnas.org/cgi/doi/10.1073/pnas.1018062108 Hopkinson et al.

pH units in the green alga, Chlamydomonas reinhardtii) (20)would not significantly alter the rates of CO2 hydration/HCO3
−
dehydration whether catalyzed or not.To account for the increased CA activity induced by light in
the analyses below, we consider that this increase occurs exclu-sively in the chloroplast in a two-compartment model of the cells(SI Text, CA Activity in the Chloroplast and Cytoplasm and TableS3). Using the chloroplast dimensions measured microscopically,chloroplast CA activity must be raised on average about 16× toachieve a rise in whole-cell CA activity by a factor of 2.3. Theexact value depends on the partitioning of CA between thechloroplast and cytoplasm, as discussed in SI Text, CA Activity inthe Chloroplast and Cytoplasm, Partitioning CA Activity, but theinterpretation of the data remains essentially the same providedthat there is sufficient CA activity in the cytoplasm to recycleleaked CO2. The expected enhancement of PtCA1 activity be-cause of the stromal pH rise can, thus, roughly account for the risein whole-cell activity at high DIC concentrations when there is nosignificant contribution from active uptake.
Active Transport of DIC. Transport of DIC across the cytoplasmicor chloroplastic membrane can deplete 18O by exposing 18O-enriched DIC to CA. 18O depletion may also be caused by so-called vectorial CA activity, the active conversion of CO2 toHCO3
− in the cytoplasm, a process that is common in cyano-bacteria (21). The details of this unidirectional hydration of CO2are not fully understood, but it results from the activity of anNAD(P)H, dehydrogenase, which may generate an alkalinepocket in the cytoplasm to drive the reaction. We investigatedthese various possibilities by comparing the experimental data tothe results of a two-compartment box model (cytoplasm andchloroplast) that incorporates each possible process in turn. Themodel (SI Text, Model for 18O Exchange During Photosynthesisand Fig. S4) is similar to the two-compartment box model usedabove except that passive HCO3
−flux across the chloroplast
membrane is allowed (assuming Pb = 4.0 × 10⁻⁶ cm/s, the valuefor the cytoplasmicmembrane), chloroplast CAactivity in the lightis enhanced as discussed in the previous section, and the minimalchloroplast Pc value determined for the PtCA1 overexpresser isused (using a higher chloroplast permeability affects the concen-trations of inorganic carbon in the model but does not alter activetransport fluxes) (Discussion). Photosynthesis occurs in the chlo-roplast at the observed time-dependent rate of O2 production.Because the cytoplasmic membrane is nearly impermeable to
HCO3−, net HCO3
− transport into the cytoplasm, which is ac-curately measured as the difference between photosynthesis andnet CO2 uptake (12), is effectively equal to gross transport.There is, thus, little leeway for adjusting HCO3
− transport rateinto the cytoplasm in the model. Unsurprisingly, if this rate isnonetheless varied, one can match the initial rise in 13C16O16O,but the model then diverges from the experimental data (Fig.6B). HCO3
− transport into the cytoplasm simply cannot explainthe measured 18O depletion.In contrast, models that consider active CO2 transport into the
cytoplasm, vectorial CA activity, or DIC transport into thechloroplast provide acceptable fits to experimental data andcould, in principle, explain the 18O depletion caused by light(Fig. 6 C–F). However, these various processes have widely dif-ferent energetic costs, and they result in widely different con-centrations of CO2 in the chloroplast, the raison-d’être of theCCM (Table 3). Vectorial CA activity and CO2 transport intothe cytoplasm are similar processes, because the active conver-sion of CO2 to HCO3
− in the cytoplasm creates an inward CO2gradient driving diffusive CO2 influx. However, neither processelevates the CO2 concentration in the chloroplast much aboveextracellular levels (Table 3), and vectorial CA activity requiresan unreasonable energetic expenditure. If vectorial CA activitywas based on NAD(P)H dehydrogenase, as in cyanobacteria(21), the rate required to explain the 18O depletion would con-sume more NADP(P)H than carbon fixation. Such a highly in-efficient process is unlikely to be used. In the case of active
transport of CO2 into the cytoplasm, the rates necessary to fit the18O data are roughly 4× the rate of photosynthesis. As thisscenario shows, DIC accumulation using a membrane-basedtransporter of CO2 is ineffective because of the high permeabilityof membranes to CO2.Transport of inorganic carbon across the chloroplast mem-
brane is also able to explain the 18O depletion data reasonablywell and does elevate the CO2 concentration in the chloroplast(Fig. 6 E and F and Table 3). Because the high CA activity in thechloroplast rapidly equilibrates CO2 and HCO3
−, transport ofCO2, HCO3
−, or a C4 compound, which is subsequently decar-boxylated, into the chloroplast is effectively equivalent. In reality,the pyrenoid is likely to be the site of CO2 elevation and whereCA is localized (Discussion), making transport of HCO3
− or a C4compound advantageous; this is because they do not diffusereadily through biological membranes. The rate of inorganiccarbon transport that best explains the excess 18O depletion wasdetermined for eight assays in which the effect of active transporton 18O depletion should be detectable (DIC between 800 and2,000 μM). The rates were quite consistent, on average, ∼3×photosynthesis, and succeeded in raising the chloroplast CO2 by2–3× external levels. Transport of carbon into the chloroplast,thus, seems the only reasonable process to explain the 18O de-pletion, because it acts as a functional CCM and does not require
Fig. 6. The effect of active transport processes on 18O-CO2. In all panels, thedata from a sample experiment on P. tricornutum are shown as open circles(blue, 13C16O16O; green, 13C18O16O; red, 13C18O18O), and model fits are solidlines. Photosynthesis was started by turning on a light at t = 0. (A) Thebackground scenario in which CA in the chloroplast is enhanced to raisewhole-cell CA activity by 2.3×. This enhanced CA activity is included in allother scenarios. (B) HCO3
− transport from the extracellular environment andinto the cytoplasm at 4 × 10⁻¹⁷ mol/cell per s. (C) Vectorial CA activity in thecytoplasm at 42 × 10−17 mol/cell per s. (D) CO2 transport from the extracel-lular environment and into the cytoplasm at 13 × 10−17 mol/cell per s. (E) CO2
transport into the chloroplast at 11 × 10−17 mol/cell per s. (F) HCO3− trans-
port into the chloroplast at 10 × 10−17 mol/cell per s.
Hopkinson et al. PNAS Early Edition | 5 of 8
ENVIRONMEN
TAL
SCIENCE
SINAUGURA
LART
ICLE
transport rates much in excess of photosynthesis; therefore, thereis no unreasonable energy expenditure.We tested if inorganic carbon transport into the chloroplast
could explain the behavior of 18O exchange as a function of DIC(Fig. 5) by simulating 18O-CO2 data using a two-compartmentmodel with a constant rate of HCO3
− transport into the chlo-roplast (9 × 10⁻¹⁷ mol/cell per s, the average modeled rate) andcalculating from those data the apparent CA activities, kap, ateach DIC concentration. The satisfactory agreement betweenthe model simulations of kap and the observations (Fig. 5) pro-vides a somewhat independent check on the validity of themodel, because the calculations are made over a range of DICconcentrations wider than that used to calculate the chloroplasticHCO3
− transport rate used in the model. This agreement alsoshows the overall coherence of our data interpretation.
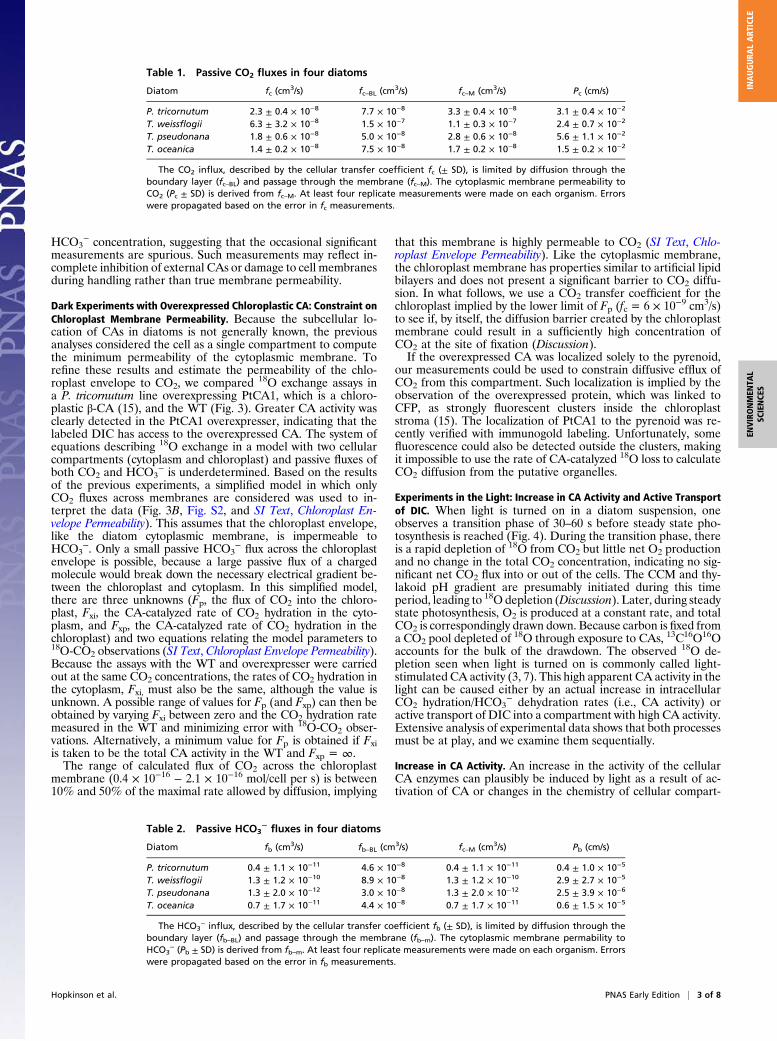
Role of Pyrenoids.Although pumping of inorganic carbon into thechloroplast elevates CO2 above ambient levels, the concen-trations are not sufficient to saturate RubisCO. The half satu-ration constant of P. tricornutum’s RubisCO for CO2 is 40 μM(3), whereas the calculated average concentration of CO2 in thechloroplast is 15–20 μM (Table 3 and Fig. 7A). We would expectthe CO2 concentration to be at least that of RubisCO’s halfsaturation constant. A higher CO2 concentration may be ach-ieved in the pyrenoids, proteinaceous bodies within the chloro-plast stroma where most of the cellular RubisCO is localized.Pyrenoids are known to be present in P. tricornutum and gen-erally, in diatoms, and they are commonly thought to play a rolein the CCM (3). The mechanism by which CO2 is produced in thepyrenoid could either be dehydration of HCO3
− by a CA, such asPtCA1, or decarboxylation of a C4 compound. In P. tricornutum,there is evidence for pyrenoid localization of other enzymesbesides PtCA1, including a putative decarboxylase, which couldbe involved in CO2 release from C4 compounds. If the pyrenoidis the primary site of CO2 elevation, then the CO2 efflux from thechloroplast that we determined would actually originate chieflyfrom the pyrenoids. Taking the number and dimensions of thepyrenoids to be those observed for the β-CA clusters of theoverexpresser (1.9 β-CA clusters with an average radius of 0.3μm) (Methods), the concentration of CO2 in the pyrenoids wouldbe only 25 μM if it escaped the pyrenoid at diffusion-limited rates(SI Text, Model for 18O Exchange During Photosynthesis). To raisethis concentration to 60 μM, moderately above RubisCO’s one-half saturation constant, the CO2 transfer coefficient from thepyrenoid would need to be 8.2 × 10⁻¹⁰ cm3/s, roughly one-tenththe diffusion-limited value.
DiscussionOur data show unequivocally that the cytoplasmic membranes ofdiatoms present a minimal barrier to CO2 diffusion (Table 1 andFig. 1B). Generalizing from our 18O exchange data from aP. tricornutum strain overexpressing a chloroplast-localized CA,we infer that this is also true of the chloroplast membrane. Suchhigh permeability to CO2 has been observed in other lipidbilayers, such as red blood cell membranes (14), although studiesof green algae indicate that their membranes inhibit CO2 passageto some extent, with CO2 permeabilities as low as 8 × 10⁻⁴ cm/sbeing reported (10, 11). Such high permeability to small un-
charged molecules presents a problem for accumulating CO2,but it is presumably also helpful in avoiding the accumulation ofO2, which would lead to high concentrations of noxious reactiveoxygen species in photosynthesizing cells.We constructed an integrated description of DIC fluxes in
P. tricornutum growing at μ= 1.3 d−1 in seawater with typical DICconditions (pH 8.15; [CO2] = 9.7 μM). This is achieved by com-bining (i) measurements of photosynthesis and net CO2 andHCO3
− uptake, (ii) estimates of DIC transport into the chloro-plast (based on 18O exchange as a function of DIC), and (iii)calculated passive carbon fluxes (based on membrane per-meabilities). As seen in Fig. 7A, there is a large diffusive exchangeof CO2 across the cytoplasmic membrane. Active transport ofDIC into the chloroplast is about 10× larger than HCO3
− trans-port across the plasmalemma and constitutes the main driver ofthe CCM. Although Fig. 7A shows this DIC flux into the chloro-plast as HCO3
− transport, we cannot distinguish the form ofcarbon transported, and transport of CO2, HCO3
−, or a C4compound, which is subsequently decarboxylated, is equivalent inour model. Approximately one-third of the DIC transported intothe chloroplast is fixed by RubisCO after conversion to CO2 by
Table 3. Model evaluation
Process Transport rate Residual [CO2]p Fold [CO2] rise
Vectorial CA activity 4.2 × 10⁻¹⁶ 1.6 × 10⁻¹⁸ 2.5 0.5CO2 transport into cytoplasm 1.3 × 10⁻¹⁶ 2.2 × 10⁻¹⁸ 7.0 1.4CO2 transport into chloroplast 1.1 × 10⁻¹⁶ 4.8 × 10⁻¹⁸ 16.1 3.2HCO3
− transport into chloroplast 1.0 × 10⁻¹⁶ 9.8 × 10⁻¹⁸ 13.7 2.7
Parameters used to evaluate the models were the rate of transport (mol/cell per s) required to best explain thedata, the residual error in the fit, and the concentration of CO2 in the chloroplast (μM). The fold rise in CO2 isrelative to the 5 μM extracellular CO2 in this assay.
Fig. 7. Inorganic carbon fluxes and concentrations in P. tricornutum. (A)Fluxes and concentrations in an average P. tricornutum cell. Average rates ofphotosynthesis and HCO3
− transport were used to simulate CO2 and HCO3−
concentrations and passive fluxes at 2,000 μM DIC (n ≥ 8). (B) Illustration ofthe proposed role of the pyrenoid. Here, the chloroplast is taken to havea greater permeability to CO2 (fc = 2.4 × 10⁻⁸ cm3/s). The rate of HCO3
−
uptake into the chloroplast (determined by reanalysis of the data repeatingthe procedure described in the text) was not significantly affected by thischange. Carbon fixation and chloroplastic CA are restricted to the pyrenoidto illustrate its likely role. The pyrenoid is given a CO2 transfer coefficient(7.9 × 10⁻¹⁰ cm3/s) required to achieve 60 μM CO2, and fluxes are calculatedbased on this transfer coefficient. HCO3
− passively diffuses into the pyrenoidand is equilibrated with CO2 by CA. HCO3
− is able to accumulate in thechloroplast, because CA is confined to the pyrenoid. Carbon fluxes are inunits of × 10−17 mol/cell per s.
6 of 8 | www.pnas.org/cgi/doi/10.1073/pnas.1018062108 Hopkinson et al.

CA. The rest diffuses as CO2 into the cytoplasm, where it is re-covered by CA-catalyzed hydration to HCO3
−.According to our results, approximately two-thirds of net
carbon uptake into P. tricornutum was supported by CO2 diffu-sion, with the remaining one-third from HCO3
− transport. Thisagrees well with measurements made by others in the same or-ganism (6). However, HCO3
− transport is often estimated tomake up a larger fraction of net uptake in other diatoms (6, 7,22). In all those studies, including ours, acetazolamide is presentduring the assays to block the activity of external CA, eCA. Thisshould have a small effect in our strain P. tricornutum, which hasno detectable extracellular CA activity. In other species with higheCA activity, its inhibition should often lead to a diffusion lim-itation of CO2 transport in the boundary layer of the cell andhence, to an underestimation of the contribution of CO2 to thetotal net carbon uptake.Although there is no way to measure directly the gross fluxes
of CO2 across the cytoplasmic membrane, an independent checkof our estimates of carbon fluxes based on 18O loss rates is givenby the 13C isotopic composition of biomass (23, 24). Assuminga RubisCO fractionation factor of −29‰, the carbon fluxesshown in Fig. 7A, which are dominated by large gross CO2 fluxes,produce a whole-cell δ13C fractionation of −20.4‰ relative toexternal CO2 (SI Text, δ
13C Composition of Biomass, Fig S5, andTable S4), similar to literature values for P. tricornutum grown atequivalent CO2 concentrations (−20.5‰ to −22.0‰) (24).The activity of a cytoplasmic CA and the maintenance of a low
concentration of HCO3− in the cytoplasm are key elements of
the diatom CCM: they allow passive influx of CO2 from theexternal medium and recycling of much of the CO2 leaking outof the chloroplast. To support the measured rate of DIC uptakeinto the chloroplast, CO2 must be converted to HCO3
− in thecytoplasm at a rate of 8.1 × 10⁻¹⁷ mol/cell per s, but the unca-talyzed rate of CO2 hydration in the cytoplasm is only ∼3 × 10⁻²⁰mol/cell per s. Seven putative CAs have been identified in thegenome of P. tricornutum (25). Two β-CAs have been localized tothe chloroplast (15), but one of the remaining proteins couldserve to scavenge leaked CO2, either within the cytoplasm oron the endoplasmic reticulum that envelops the chloroplast. InT. weissflogii, there is evidence for cytoplasmic localization ofa carbonic anhydrase, TWCA (26). Such localization of CA isa clear distinction between the CCM of diatoms and cyanobac-teria, in which expression of a CA in the cytoplasm is highlydeleterious (27).Achieving a high concentration of CO2 at the site of carbon
fixation is the central function of the CCM. There seems to belittle excess RubisCO carboxylation capacity in diatoms, suchthat near saturation of the enzyme is necessary to support ob-served carbon fixation rates (8). The CO2 concentration at thesite of fixation must, thus, be in excess of RubisCO’s half satu-ration constant, 40 μM in P. tricornutum (and similar values inother diatoms) (3). However, even if we use the minimumchloroplast permeability to CO2, the average CO2 concentrationin the chloroplast is only 20 μM (Fig. 7A). This concentration iscalculated from the diffusive CO2 efflux from the chloroplast(which is constrained by the data) on the basis of the geometriccharacteristic of the plastid and the permeability of its envelope.If a larger chloroplast CO2 permeability is used, the calculatedchloroplast CO2 concentration is even lower, but active transportrates are not affected (Fig. 7B). To first order, the membranepermeabilities used in the models affect only calculated passivecarbon fluxes and concentrations in the cell, and they have al-most no effect on derived active transport rates. This numericalresult reflects the fundamental fact that the rates of 18O de-pletion that are measured in the light require a certain carbonflux but are not directly related to intracellular carbon concen-trations. It, thus, seems that the diffusion of CO2 away from thesite of fixation by RubisCO must be somehow more limited thanin our calculation. This can result from a smaller volume inwhich the high CO2 concentration for fixation is achieved and/orfrom a greater barrier to diffusion.
It is highly likely that, in P. tricornutum, CO2 is formed in thepyrenoid where RubisCO is concentrated and carbon is fixed.The pyrenoid has a much smaller volume than the chloroplast asa whole, and because it is composed of proteins, it may be lesspermeable to CO2 than membrane-bound compartments. Cal-culations show that a smaller volume is unlikely to achieve thedesired results by itself, and it, thus, seems necessary that diffusionbe somehow constrained (SI Text,Model for 18O Exchange DuringPhotosynthesis). To raise [CO2] to 60 μM, moderately aboveRubisCO’s one-half saturation constant, the transfer coefficientaway from the pyrenoids (which we take to be identified as PtCA1clusters) would need to be roughly one-tenth the diffusion-limitedvalue. It has been suggested that protein microcompartments,such as pyrenoids or carboxysomes (28), represent a greater bar-rier to CO2 than lipid membranes. For illustration, we calculatedcarbon concentrations and fluxes in a model cell containing a py-renoid but having a higher chloroplast membrane permeability toCO2 (Fig. 7B). Compared with the model in Fig. 7A, the activeHCO3
− transport rate into the chloroplast is similar, but CO2concentrations are reduced in the bulk chloroplast while beingelevated to a concentration nearly saturating for RubisCO in thepyrenoid.HCO3
− is able to accumulate in the chloroplast, becauseCA activity is confined to the pyrenoid. As is commonly accepted,in this model, the pyrenoid plays a role analogous to that of thecyanobacterial carboxysome, where confinement of CA withRubisCO increases the efficiency of the CCM (3, 27).Overall, the CCM described by the model (Fig. 7 A or B) has
moderate stoichiometric efficiency, requiring transport of ∼3.5molecules of inorganic carbon across the chloroplast envelopefor each molecule of CO2 fixed. For comparison, the marinecyanobacterium Synechococcus sp. WH7803 transports 6 mole-cules HCO3
− per CO2 fixed, leading to CO2 efflux out of the cellat 5× the rate of photosynthesis (29). The higher intracellularCO2 concentration required by cyanobacterial RubisCO likelyincreases the CO2 gradient, decreasing CCM efficiency. InP. tricornutum, loss of actively transported carbon only occursacross the chloroplast membrane.Using the carbon fluxes that we measured, we can roughly
estimate the amount of energy expended by P. tricornutum on itsCCM and the potential savings from CCM down-regulationunder high ambient CO2. According to our model, the only en-ergy consumed by the CCM is caused by transport of DIC intothe cytoplasm and chloroplast. In a first approximation, weconsider only the carbon transport into the chloroplast, which isan order of magnitude larger than transport into the cytoplasm.If we follow Raven (2) and assume HCO3
− is transported intothe chloroplast at a cost of 1 ATP per molecule, the need totransport ∼3 HCO3
− molecules into the chloroplast per CO2fixed would double the ATP cost of carbon fixation. Transportof C4 molecules, which require 2 ATPs per C4 (30), would triplethe ATP cost of carbon fixation. A substantially lower cost oftransport, 0.5 ATP per HCO3
−, is possible if transport is drivenby an H+ or Na+ gradient. The ∼1.5–6 ATP expended on carbontransport into the chloroplast per CO2 fixed adds ∼75–300 kJ/mol CO2 fixed, raising the energetic cost of CO2 fixation by 13–51% beyond the minimum energy required to fix and reducecarbon using the Calvin cycle (hydrolysis of 3 ATP + oxidationof 2 NADPH = 590 kJ/mol) (31). A more direct constraint onthe diatom CCM’s energy demand should be obtainable frommeasurements of light use efficiency at different CO2 levels (2).Recent concern about the effects of anthropogenic CO2 re-
lease on marine ecosystems has focused attention on CCMs,because their down-regulation is thought to be the primary re-sponse of phytoplankton to rising CO2 (2). In our model, themajor energy expended by the CCM is the transport of inorganiccarbon into the chloroplast, which must compensate for thediffusive leakage of CO2 away from the point of fixation. In a firstapproximation, the energy expended should, thus, be pro-portional to the [CO2] gradient between the point of fixation andthe cytoplasm. Because the cytoplasmic membrane is highlypermeable to CO2, its concentration is approximately the same
Hopkinson et al. PNAS Early Edition | 7 of 8
ENVIRONMEN
TAL
SCIENCE
SINAUGURA
LART
ICLE

in the cytoplasm and external medium (Fig. 7), and the CO2 atthe point of fixation (say, 60 μM) is presumably maintainedconstant by regulation of the CCM. A doubling of ambient [CO2]to 20 μM would then save about 20% of the CCM expenditure,decreasing the energy expended on carbon fixation between 3%and 6%, according to our estimates above. Allocation of ener-getic savings to carbon fixation is most likely to occur underconditions where growth is limited by energy generation—e.g., inlight or iron-limited environments. In this case, the energy sav-ings from down-regulation of the CCM on doubling of ambient[CO2] could, thus, increase primary production by a few percent.Raising CO2 from current levels generally increases diatom pho-tosynthesis and growth by a similar factor, if at all (7, 32, 33).A detailed knowledge of the CCM of marine phytoplankton
should provide a link between their evolution, the changingchemistry of the atmosphere, and the surface ocean over geo-logical times. Such knowledge should also help us understandhow the ongoing increase in atmospheric CO2 will affect marineprimary production and the ecology of the plankton.
MethodsDiatom Strains and Culturing. T. weissflogii [Center for the Culture of MarinePhytoplankton (CCMP) 1336], T. pseudonana (CCMP 1335), T. oceanica(CCMP 1005), and P. tricornutum (CCMP 632) were obtained from the CCMPand maintained in Aquil medium using natural seawater (34). For experi-ments, cultures were maintained at pH 8.1 in Aquil medium using a pH statsystem, and cells were counted using a Coulter counter Z2. To generate thePtCA1 overexpresser, the PtCA1 sequence (15) was amplified and cloned intopENTR/D-TOPO (Invitrogen). The pENTR vector recombined with a pDEST
vector, containing diatom-specific promoters and terminators, was in-troduced into a native P. tricornutum (CCMP 632) by microparticle bom-bardment and transgenics selected on seawater-agar plates (35).
MIMS. 18O-labeled DIC was added to assay buffer [DIC-free artificial seawa-ter, 20 mM Bicine, pH 8.0, 100 μM acetazolamide (AZ)] in the MIMS chamber(36). 18O was monitored for ∼10 min before the addition of concentratedcells pretreated with 100 μM AZ. 18O was monitored in the dark for 10–20min and then, for ∼10 min with illumination from a tungsten lamp at 150μEi/m2 per s.
Microscopy. The distribution of overexpressed CA linked to CFP and the size ofcells and chloroplasts were determined by laser-scanning confocal micros-copy. P. tricornutum overexpressing PtCA1 was concentrated by filtrationand allowed to settle on Petri dishes with glass bottoms. The cells wereimaged using a Leica SP5 microscope detecting chlorophyll fluorescenceemission from 640 to 715 nm and CFP emission from 470 to 530 nm. Z stackswere obtained from several fields, and 3D objects were constructed andenumerated from the fluorescence intensities using image analysis software.The volumes of the CFP objects (PtCA1 clusters) were also determined, andan equivalent spherical radius calculated for each object.
ACKNOWLEDGMENTS. We thank Yan Xu for providing the purified PtCA1enzyme and Yusuke Matsuda for providing a vector containing the PtCA1sequence. We thank Nicolas Cassar and Philippe Tortell for providing valu-able comments on the work. This study was supported by National Sci-ence Foundation Grants OCE-0722374 (to A.E.A.), OCE-0727997 (to A.E.A.),and Grant OCE-0825192 (to F.M.M.) and a grant to the Princeton Environ-mental Institute from BP and Ford Motor Co.
1. Falkowski PG, et al. (2004) The evolution of modern eukaryotic phytoplankton.Science 305:354–360.
2. Raven JA (1991) Physiology of inorganic C acquisition and implications for resourceuse efficiency by marine phytoplankton: Relation to increased CO2 and temperature.Plant Cell Environ 14:779–794.
3. Badger MR, et al. (1998) The diversity and coevolution of Rubisco, plastids, pyrenoids,and chloroplast-based CO2-concentrating mechanisms in algae. Can J Bot 76:1052–1071.
4. Reinfelder JR, Kraepiel AML, Morel FMM (2000) Unicellular C4 photosynthesis ina marine diatom. Nature 407:996–999.
5. Roberts K, Granum E, Leegood RC, Raven JA (2007) C3 and C4 pathways of photo-synthetic carbon assimilation in marine diatoms are under genetic, not environmental,control. Plant Physiol 145:230–235.
6. Burkhardt S, Amoroso G, Riebesell U, Sültemeyer D (2001) CO2 and HCO3- uptake inmarine
diatoms acclimated to different CO2 concentrations. Limnol Oceanogr 46:1378–1391.7. Rost B, Riebesell U, Burkhardt S, Sültemeyer D (2003) Carbon acquisition of bloom-
forming marine phytoplankton. Limnol Oceanogr 48:55–67.8. Glover HE, Morris I (1979) Photosynthetic carboxylating enzymes in marine phyto-
plankton. Limnol Oceanogr 24:510–519.9. Gutknecht J, Bisson MA, Tosteson FC (1977) Diffusion of carbon dioxide through lipid
bilayer membranes: Effects of carbonic anhydrase, bicarbonate, and unstirred layers.J Gen Physiol 69:779–794.
10. Tu CK, Acevedo-Duncan M, Wynns GC, Silverman DN (1986) Oxygen-18 exchange asa measure of accessibility of CO2 and HCO3
- to carbonic anhydrase in Chlorellavulgaris (UTEX 263). Plant Physiol 80:997–1001.
11. Sültemeyer D, Rinast K (1996) The CO2 permeability of the plasma membrane ofChlamydomonas reinhardtii: Mass-spectrometric 18O-exchange measurements from13C18O2 in suspensions of carbonic anhydrase-loaded plasma-membrane vesicles.Planta 200:358–368.
12. BadgerMR, Palmqvist K,Yu J (1994)Measurementof CO2 andHCO3-fluxes in cyanobacteria
and microalgae during steady-state photosynthesis. Physiol Plant 90:529–536.13. Tu C, Wynns GC, McMurray RE, Silverman DN (1978) CO2 kinetics in red cell
suspensions measured by 18O exchange. J Biol Chem 253:8178–8184.14. Silverman DN, Tu CK, Roessler N (1981) Diffusion-limited exchange of 18O between
CO2 and water in red cell suspensions. Respir Physiol 44:285–298.15. Tanaka Y, Nakatsuma D, Harada H, Ishida M, Matsuda Y (2005) Localization of soluble
β-carbonic anhydrase in the marine diatom Phaeodactylum tricornutum. Sorting to thechloroplast and cluster formation on the girdle lamellae. Plant Physiol 138:207–217.
16. Silverman DN, Lindskog S (1988) The catalytic mechanism of carbonic anhydrase:Implications of a rate-limiting protolysis of water. Acc Chem Res 21:30–36.
17. Xu Y, Feng L, Jeffrey PD, Shi Y, Morel FMM (2008) Structure and metal exchange inthe cadmium carbonic anhydrase of marine diatoms. Nature 452:56–61.
18. Heldt WH, Werdan K, Milovancev M, Geller G (1973) Alkalization of the chloroplaststroma caused by light-dependent proton flux into the thylakoid space. BiochimBiophys Acta 314:224–241.
19. Kramer DM, Sacksteder CA, Cruz JA (1999) How acidic is the lumen? Photosynth Res
60:151–163.20. Braun FJ, Hegemann P (1999) Direct measurement of cytosolic calcium and pH in
living Chlamydomonas reinhardtii cells. Eur J Cell Biol 78:199–208.21. Kaplan A, Reinhold L (1999) CO2 concentrating mechanisms in photosynthetic
microorganisms. Annu Rev Plant Physiol Plant Mol Biol 50:539–570.22. Martin CL, Tortell PD (2006) Bicarbonate transport and extracellular carbonic
anhydrase activity in Bering Sea phytoplankton assemblages: Results from isotope
disequilibrium experiments. Limnol Oceanogr 51:2111–2121.23. Francois R, et al. (1993) Changes in the δ13C of surface water particulate organic
matter across the subtropical convergence in the SW Indian Ocean. Global
Biogeochem Cycles 7:627–644.24. Laws EA, Bidigare RR, Popp BN (1997) Effect of growth rate and CO2 concentration on
carbon isotopic fractionation by the marine diatom Phaeodactylum tricornutum.
Limnol Oceanogr 42:1552–1560.25. Kroth PG, et al. (2008) A model for carbohydrate metabolism in the diatom
Phaeodactylum tricornutum deduced from comparative whole genome analysis.
PLoS ONE 3:e1426.26. Morel FMM, et al. (2002) Acquisition of inorganic carbon by the marine diatom
Thalassiosira weissflogii. Funct Plant Biol 29:301–308.27. Price GD, Badger MR (1989) Expression of human carbonic anhydrase in the
cyanobacterium Synechococcus PCC7942 creates a high CO2-requiring phenotype:
Evidence for a central role for carboxysomes in the CO2 concentrating mechanism.
Plant Physiol 91:505–513.28. Dou ZC, et al. (2008) CO2 fixation kinetics of Halothiobacillus neapolitanus mutant
carboxysomes lacking carbonic anhydrase suggest the shell acts as a diffusional
barrier for CO2. J Biol Chem 283:10377–10384.29. Tchernov D, et al. (1997) Sustained net CO2 evolution during photosynthesis by
marine microorganisms. Curr Biol 7:723–728.30. Hatch MD (1987) C4 photosynthesis—a unique blend of modified biochemistry,
anatomy and ultrastructure. Biochim Biophys Acta 895:81–106.31. Blankenship RE (2002) Molecular Mechanisms of Photosynthesis (Blackwell Scientific,
Oxford).32. Riebesell U, Wolf-Gladrow DA, Smetacek V (1993) Carbon dioxide limitation of
marine phytoplankton growth rates. Nature 361:249–251.33. Tortell PD, et al. (2008) CO2 sensitivity of Southern Ocean phytoplankton. Geophys
Res Lett 35:L04605.34. Price NM, et al. (1988) Preparation and chemistry of the artificial algal culture
medium Aquil. Biol Oceanogr 6:443–462.35. Siaut M, et al. (2007) Molecular toolbox for studying diatom biology in Phaeodactylum
tricornutum. Gene 406:23–35.36. Reinfelder JR, Milligan AJ, Morel FMM (2004) The role of the C4 pathway in carbon
accumulation and fixation in a marine diatom. Plant Physiol 135:2106–2111.
8 of 8 | www.pnas.org/cgi/doi/10.1073/pnas.1018062108 Hopkinson et al.