Embed Size (px)
Citation preview

DOT/FAA/AM-98/4 Effect of an Airplane Cabin
Office of Aviation MedicineWashington, D.C. 20591
Water Spray System on HumanThermal Behavior: A TheoreticalStudy Using a 25-Node Modelof Thermoregulation
Matthew B. Wolf
Department of PhysiologyUniversity of South Carolina School of MedicineColumbia, SC 29208
Robert P. Garner
Civil Aeromedical InstituteFederal Aviation AdministrationOklahoma City, OK 73125
February 1998
Final Report
This document is available to the publicthrough the National Technical InformationService, Springfield, Virginia 22161.
U.S. Departmentof TransportationFederal AviationAdministration
NOTICE
This document is disseminated under the sponsorship ofthe U.S. Department of Transportation in the interest of
information exchange. The United States Governmentassumes no liability for the contents or use thereof.
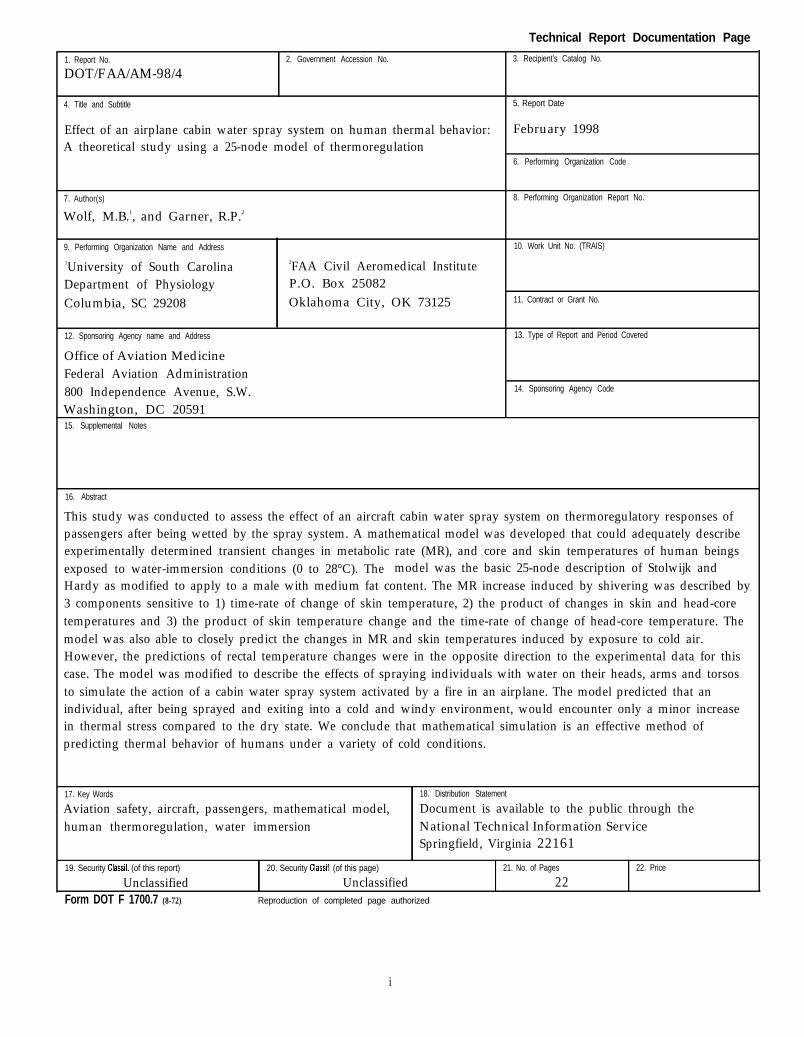
1. Report No.
DOT/FAA/AM-98/42. Government Accession No.
Technical Report Documentation Page
3. Recipient’s Catalog No.
4. Title and Subtitle
Effect of an airplane cabin water spray system on human thermal behavior:A theoretical study using a 25-node model of thermoregulation
5. Report Date
February 1998
6. Performing Organization Code
7. Author(s)
Wolf, M.B.1, and Garner, R.P.2
8. Performing Organization Report No.
9. Performing Organization Name and Address
1University of South CarolinaDepartment of PhysiologyColumbia, SC 29208
2FAA Civil Aeromedical InstituteP.O. Box 25082Oklahoma City, OK 73125
10. Work Unit No. (TRAIS)
11. Contract or Grant No.
12. Sponsoring Agency name and Address
Office of Aviation MedicineFederal Aviation Administration800 Independence Avenue, S.W.Washington, DC 2059115. Supplemental Notes
13. Type of Report and Period Covered
14. Sponsoring Agency Code
16. Abstract
This study was conducted to assess the effect of an aircraft cabin water spray system on thermoregulatory responses ofpassengers after being wetted by the spray system. A mathematical model was developed that could adequately describeexperimentally determined transient changes in metabolic rate (MR), and core and skin temperatures of human beingsexposed to water-immersion conditions (0 to 28°C). The model was the basic 25-node description of Stolwijk andHardy as modified to apply to a male with medium fat content. The MR increase induced by shivering was described by3 components sensitive to 1) time-rate of change of skin temperature, 2) the product of changes in skin and head-coretemperatures and 3) the product of skin temperature change and the time-rate of change of head-core temperature. Themodel was also able to closely predict the changes in MR and skin temperatures induced by exposure to cold air.However, the predictions of rectal temperature changes were in the opposite direction to the experimental data for thiscase. The model was modified to describe the effects of spraying individuals with water on their heads, arms and torsosto simulate the action of a cabin water spray system activated by a fire in an airplane. The model predicted that anindividual, after being sprayed and exiting into a cold and windy environment, would encounter only a minor increasein thermal stress compared to the dry state. We conclude that mathematical simulation is an effective method ofpredicting thermal behavior of humans under a variety of cold conditions.
17. Key Words
Aviation safety, aircraft, passengers, mathematical model,human thermoregulation, water immersion
18. Distribution Statement
Document is available to the public through theNational Technical Information ServiceSpringfield, Virginia 22161
19. Security Classif. (of this report)
UnclassifiedForm DOT F 1700.7 (8-72)
20. Security Classif. (of this page)
UnclassifiedReproduction of completed page authorized
21. No. of Pages
2222. Price
i


ACKNOWLEDGMENTS
We thank the Federal Aviation Administration’s William J. Hughes
Technical Center for their support of this project.
. . .111

EFFECT OF AN AIRPLANE CABIN WATER SPRAY SYSTEM
ON HUMAN THERMAL BEHAVIOR : A THEORETICAL STUDY
USING A 25-NODE MODEL OF THERMOREGULATION
INTRODUCTION
The advent of manned space flight in the 1960sspurred the development of mathematical models ofhuman temperature regulation aimed at understand-ing the response to the thermal challenge of strenuousexercise in harsh environments. In the early 1960s,Wissler (20) developed an extremely complex modelin which the body was subdivided into 250 tissueregions (each region lumped and considered as anode). In 1966, Stolwijk and Hardy (15) developed amuch simpler 8 node model which was expanded to14 nodes by Kuznetz (10) in 1968 and to 25 nodes in1971 by Stolwijk and Hardy (16). The 25-nodemodel has become the standard anatomical approachto modeling human temperature regulation. Adop-tion of the Stolwijk and Hardy approach by theNational Aeronautics and Space Administration(NASA) has pro ab bly contributed to the relativelywidespread acceptance of the Stowijk and Hardymodel.
The approach of the present study was to use the25-node model (16) to study the effect of a cabin waterspray system (CWSS) on thermoregulatory responsesof passengers after being wetted by the spray system.The aim was to see if an individual, after being sprayedwith water in an airplane, might be subjected toinjurious thermal stresses after exiting into a coldenvironment. Examination of the literature revealedexperimental and theoretical studies where minimallyclothed humans were immersed in cold water orexposed to cold air (8,14), but no studies were foundpertinent to the clothed individual being wetted andthen exposed to a cold environment. Theoretically, ifthe 25-node model could predict human thermalchanges during cold-water immersion, then it couldbe modified for use under water-spray conditions.
In 1972, Hardy (5) found that the controllerequations of the 25-node temperature regulation modelcould not accurately predict the effects of cold environ-ments on human thermal responses. As a result, in
1976, Gordon et al. (4) developed a new modelincreasing the number of nodes to 42 and substan-tially changing the form of the controller equations.This model was able to closely predict transient skinand rectal temperature changes and the increases inmetabolic rate (MR) due to cold-air exposure. How-ever, more recently, Wissler (22) found that thismodel was unsuitable for predicting cold-water im-mersion data.
The latest model of human thermoregulation wasby Tikuisis et al. (17). The model was designedspecifically to predict transient rectal temperature andMR data measured in that study under cold-immer-sion at 20 and 28°C water temperatures. They usedthe 25-node model, but updated the anatomicalparameter values for the body composition of theirexperimental subjects according to the formulas givenin Montgomery (11). Montgomery had expanded the25-node model to 61 nodes to study the thermalbehavior of divers in wet suits exposed to cold water,but he had kept the original cold controller equations.Tikuisis et al. (17) showed that these controller equa-tions were inadequate to predict their data. Therefore,they modified these equations so that the shivering-induced MR increase was sensitive to the change inskin temperature in addition to the sensitivity to theproduct of changes in skin and core temperature as inthe original Stolwijk and Hardy models (15,16).However, Tikuisis et al. never compared their modelpredictions to available data from Hayward et al. (7,8)for lower water temperatures. These data show aninitial rapid rise in MR that the Tikuisis et al. modelcan not reproduce. This finding led us to investigateother possible controller formulations.
In 1985, Wissler (23) proposed a major modifica-tion of the temperature controller for the induced MRincrease due to shivering. He suggested that the MRcontroller be composed of three components, the firstsensitive to the rate of skin cooling, the second sensi-tive to some function of changes in skin and coretemperatures and the third sensitive to the rate of core
cooling. There have been proponents of these indi-vidual factors in the control of shivering, but no onehad proposed that all three were important.
In the present study, our approach was to use the25-node model and see if a set of controller equationssimilar to those proposed by Wissler (23) for shiveringwould be sufficient to predict temperature and MRdata for cold-water immersion. Our finding was that,in general, the shivering controller equations sug-gested by Wissler had the ability to fulfill this task.Therefore, this paper will describe 1) the details of thebasic model, 2) the comparison of model predictionwith literature data and 3) the modification of themodel for application to the water-spray problem andthe model predictions for this situation.
METHODS
The anatomical model used is essentially the 25-node model of Tikuisis et al. (18), which is derivedfrom the original Stolwijk and Hardy model (16).
Tikuisis et al (18) derived new parameter values to fitthe body composition of their experimental group.Briefly, the body is subdivided into six parts: head,trunk, arms, legs, feet, and hands. Each of thesesections is further subdivided radially from the centerinto the concentric annular sections, core, muscle, fat,and skin. Including the blood volume, there are 25individual anatomical units, which are assumed ho-mogeneous and are therefore called compartments.There is a characteristic compartmental (nodal) tem-perature.
Heat flows radially via conduction between adja-cent compartments and heat is convected betweeneach compartment and the central blood pool. Thislatter process can be modulated by vasodilatation forboth muscle and skin blood flows and by vasoconstric-tion for skin blood flows. Countercurrent heat ex-change in the skin was not included. Heat transferbetween the skin and the environment occurs byevaporation (insensible and sweating), conduction,convection and radiation. Heat is produced metaboli-cally in each compartment, except the blood. Heatproduction can be increased in the cold by shivering.Heat is also lost by respiration. The passive heattransfer equations for this system are those given byStolwijk and Hardy (15).
The model anatomical parameters were for a mod-erate-fat content male as described by Tikuisis et al.(18). These parameters are weight = 79.2 kg, body fat= 17.62 kg and surface area = 1.94 m2. The parametersused for thermal conductances, capacitances, etc. aregiven in Tikuisis et al. (18).
Thermoregulatory control is via a central integra-tor, which receives information on skin and hypotha-lamic (head core) temperatures. This information is inthe form of error signals, which indicate differencesbetween the individual temperatures and their set-point values. Set-point values are determined from thesolution of the steady-state heat transfer equations forthe unclothed mathematical model under ther-moneutral conditions (ambient air temperature of28.5%). These values are unchanged throughout thesimulation process. Cold error signals from each skinsection are weighted by the fraction of total skinthermoreceptors in that section (16) and summed toproduce the integrated peripheral COLDS’ signal.
Efferent outputs from the central controller inresponse to the cold stress produce skin vasoconstric-tion and muscle vasodilatation and metabolic heatgeneration through shivering. The skin vasoconstric-tion is driven by a linear combination of the COLDSsignal and the hypothalamic temperature error as usedpreviously (16). Muscle vasodilatation is proportionalto the metabolic heat generation. What is new anddifferent in the present model is the treatment of theshivering phenomena. In 1985, Wissler (23) proposedthat metabolic heat generation due to shivering couldbe described as the sum of three components, asdescribed below. Wissler presented the general equa-tions for these components, but did not give parametervalues, even though he apparently came up with thesevalues to compare his model predictions to experimen-tal data.
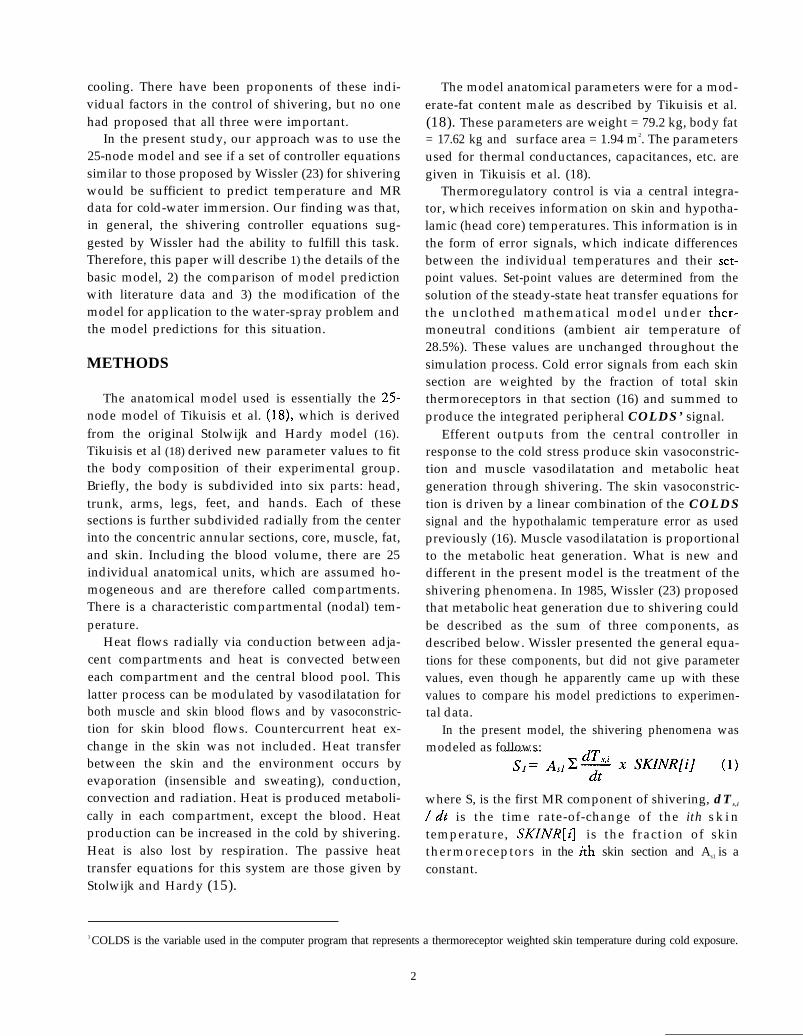
In the present model, the shivering phenomena wasmodeled as follows:
where S, is the first MR component of shivering, dTs,i
/ dt is the time rate-of-change of the ith s k i ntemperature, SKINR[i] is the fraction of skinthermoreceptors in the ith skin section and As1 is aconstant.
1 COLDS is the variable used in the computer program that represents a thermoreceptor weighted skin temperature during cold exposure.
2
(2)
where S2 is the second MR component of shivering, is the change in hypothalamic temperature fromthe set point and A, is a constant.
where S3 is the third MR component of shivering, dTh
/ dt is the time rate-of-change of hypothalamictemperature, Ks3 is a time constant and As3 is a constant.The constants for the S1 and S2 components weredetermined as described in the RESULTS section.The constants for the S3 component were determinedfrom the data shown in Tables 1 and 2, which werederived from the data of Nadel and Horvath (12).
This formulation has five significant differencesfrom that of Wissler (23). 1) Wissler proposed that all3 components were time varying since he wrote eachone as a differential equation. However, he did notoffer any experimental evidence for this assumptionwith regards to the S1 and S2 components. In theabsence of such data, we chose the simpler formulationshown above. 2) Wissler suggested that the steady-state S2 component has the form suggested by Hay-ward et al. (8). However, the data used by Hayward etal. to derive their relationship did not take intoaccount the effect of changes in core temperature onmetabolic rate as expressed in the S3 component. As aconsequence, we incorporated only the product rela-tionship of central and peripheral effects as in theHayward et al. relationship. 3) Wissler proposed thatthe S3 term be proportional to dTh / dt, but did notinclude the modifying effect of changes in skin tem-perature as in our formulation. This latter effect wassuggested by the experimental data of Nadel andHorvath (12), who found that the magnitude of themetabolic response to a centrally imposed heat debtdepended upon the skin temperature. 4) We found itnecessary to limit each of these components to somemaximum value (see RESULTS). 5) Wissler multi-plied the S2 component by a time-varying factor,which accounted for the finding that metabolic ratecontinued to increase during prolonged exposure tocold even though rectal and skin temperatures wererelatively stable. As described below, we found itnecessary to impose a limit on the S2 term that variedwith time. Therefore, our approach may produce asimilar effect as the factor used by Wissler.
The total shivering MR, CHILL, was then
C H I L L = S1+ S2+ S3
and this sum was also limited.
(4)
Simulation of head-out, cold-water immersion.When the model was to be used to describe thermal
regulation during water immersion, except for thehead-skin compartment, all other skin compartmentsno longer transferred heat to the ambient air. Instead,they now communicated with a water layer of constanttemperature. The experimental data of Hayward et al.(7,8) showed that skin temperature rapidly decreasedafter the immersion. We found that the same transientdecreases in skin temperature could be achieved (seeFig. 3) by multiplying the skin-air heat transfercoefficients by a factor of 14 to convert them to skin-water coefficients. This procedure avoided the muchmore complicated approach of Tikuisis et al. (17),which required estimation of actual heat transfercoefficients.
The water temperatures considered were 28°C and20°C to compare with the data of Tikuisis et al. (17)and 10°C and 0°C to compare to the data of Haywardet al. (7,8). Our general approach was to determine thevalue of the CHILL controller constants that gave thebest overall fit to the metabolic rate and rectal tem-perature data from these sources.
Simulation of cabin water-spray system responses.Our approach to simulating the effect of the CWSS
on human thermoregulation was to assume that thespray produces a film of water on the unclothed skin(head) of a uniform thickness. The spray, whichcontacts the clothing on other parts of the body, wetsthis clothing and causes it to “stick” to the skin, alsoproducing a uniform water layer, but thicker than forthe unclothed surface. When the individual exits theairplane and is exposed to the ambient air, waterevaporates from the layer on the head and from that inthe clothing, and the thickness of these layers de-creases. When the layer on any skin surface is fullyevaporated, heat transfer from the skin reverts to thenormal condition. In the model, heat loss (Kcal/hr)from the water layer due to evaporation is proportionalto the difference between the vapor pressures of the waterlayer and ambient air multiplied by the convective
3
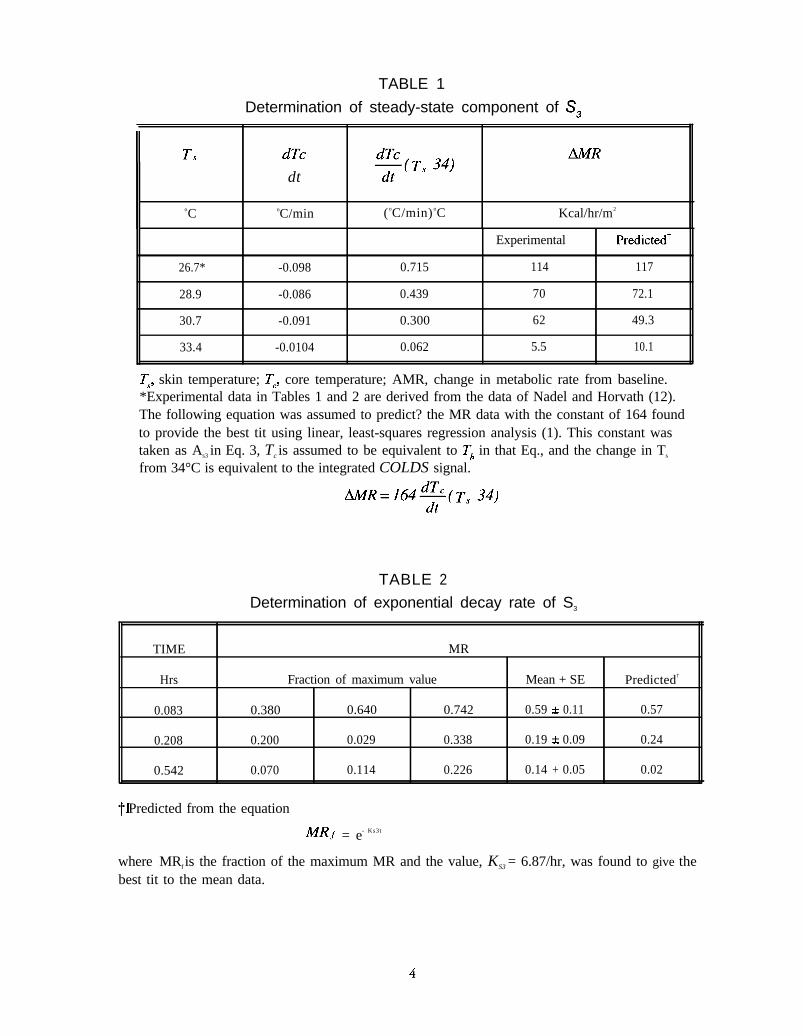
TABLE 1
Determination of steady-state component of S,
II T, dTc
dt
oC oC/min (oC/min) oC Kcal/hr/m2
26.7* -0.098 0.715
28.9 -0.086 0.439
30.7 -0.091 0.300
33.4 -0.0104 0.062
Experimental
114 117
70 72.1
62 49.3
5.5 10.1
Ts, skin temperature; Tc, core temperature; AMR, change in metabolic rate from baseline.*Experimental data in Tables 1 and 2 are derived from the data of Nadel and Horvath (12).The following equation was assumed to predict? the MR data with the constant of 164 foundto provide the best tit using linear, least-squares regression analysis (1). This constant wastaken as As3 in Eq. 3, Tc is assumed to be equivalent to Th in that Eq., and the change in Ts
from 34°C is equivalent to the integrated COLDS signal.
TABLE 2
Determination of exponential decay rate of S3
TIME MR
Hrs Fraction of maximum value Mean + SE Predicted†
0.083 0.380 0.640 0.742 0.59 0.11 0.57
0.208 0.200 0.029 0.338 0.19 + 0.09 0.24
0.542 0.070 0.114 0.226 0.14 + 0.05 0.02
Predicted from the equation
MRf = e- Ks3t
where MRf is the fraction of the maximum MR and the value, KS3 = 6.87/hr, was found to give thebest tit to the mean data.

heat-transfer coefficient between water and air (16).The rate of evaporation of the layer is this rate of heatloss divided by 0.586 cal/g (3).
Heat transfer between the skin and the water layeris by conduction. The thermal conductivity (TCSw)between the skin and the water layer of varyingthickness is determined at each instant in time usingthe approach of Tikuisis et al. (18) derived fromelementary heat-transfer theory (9) as follows:
Head (sphere)
where rw and rs are the outer radii of the water layer andskin, respectively and VW is the volume ofthe water layer.
where KS and KW are the specific thermal conductivitiesof skin and water, respectively, and rscm and rwcm are theradii to the centers of mass of skin and water,respectively.
Trunk and arms (cylinders)rw = (7)
where L is the length of the section.
TCSW = (8)
Because the water layer is relatively thin, rw,cm wasdetermined as (rs + rw)/2.
When only part of a skin segment was initially incontact with a water layer, then the skin compartmentwas subdivided into two parts: wet and dry. The wet-skin compartment was in contact with its water layerand heat transfer occurred between them. The dry-skin compartment continued to communicate withthe ambient air. Each compartment communicatedseparately with that portion of the fat layer beneath it.Similarly, the metabolism, insensible heat loss andblood flow were partitioned between these skin com-partments on the basis of the initial fraction of skinwetted. There was no heat transfer between the wet-and dry-skin compartments. The skin temperature fora partially wet segment was the average of the wet anddry temperatures, as weighted by the fraction ofthermoreceptors in each section.
The thermal effects of clothing were accounted forin the model by multiplying the heat transfer coeff-cient between skin and air by a constant (Fcl) for eachbody segment other than the head. F, takes on valuesfrom 0 (perfect insulation) to 1 (no insulation), asdescribed by Gagge and Nishi (3). For the presentstudy, Fcl was assumed to be 0.52, which represents alightly clothed individual. With this clothing fac-tor, the thermoneutral ambient temperature be-came 24.1 °C.
The effect of wind velocity was included in themodel by modifying the convective heat-transfer coef-ficient for each anatomical segment. The values givenby Tikuisis et al. are for a standard velocity of 0.1 m/sec (0.223 MPH). It was assumed that the coefficientchanges as the square root of the ratio between theambient velocity and the standard value (16).
The initial thickness of the water layer on the thoraxand arms was taken as 0.06 cm. This value gave awater-layer mass of 344 g on the thorax and 196g onthe arms if both of these areas were fully wetted. Thetotal water mass of 540 g was equivalent to the watercontent of a thoroughly wet, long sleeve, cotton shirt.The initial water layer on the head was assumed to beonly one-half as thick (0.03 cm) because it was notcovered by a layer of clothing, which would hold waterand increase the effective thickness.
From design considerations of the CWSS, it wasdecided that a maximum of 25% of the body surfacecould be wetted. The first 7% wetted would be thehead and between 7% and 25%, equal surface areaswould be wetted on both the thorax and arms. There-fore, for example, if 5% were wetted, then 5/7 of thehead area would be wetted and nothing on the trunkand arms. If 25% were wetted, the head would be100% wet, whereas only 30% and 53% of the trunkand arm surface areas, respectively, would be wettedbecause of the larger surface area of the trunk. Underthe 25% wetted condition, the initial masses of wateron the head, trunk and arms were 40g, 104g, and 104g, respectively.
Simulation methodsThe model equations were simulated using the
SCoP computer program developed at Duke Univer-sity under grant number RR1693 from the NationalInstitutes of Health, Division of Research Resources.SCoP includes a language for expressing the model infamiliar equation form, as well as a library of solvers andan interactive simulation environment. The compiled
5
model was run on a Intel microprocessor-based digitalcomputer. The integration algorithm was an adjust-able step size modified Euler method. Such an adjust-able step size method was required because of the largegradients imposed when the model was subjected torapid changes in ambient conditions.
The thermoneutral temperature for each node wasdetermined by solving the steady-state equations.This was done with the matrix inversion approachusing a commercially available computer spreadsheetprogram.
RESULTS
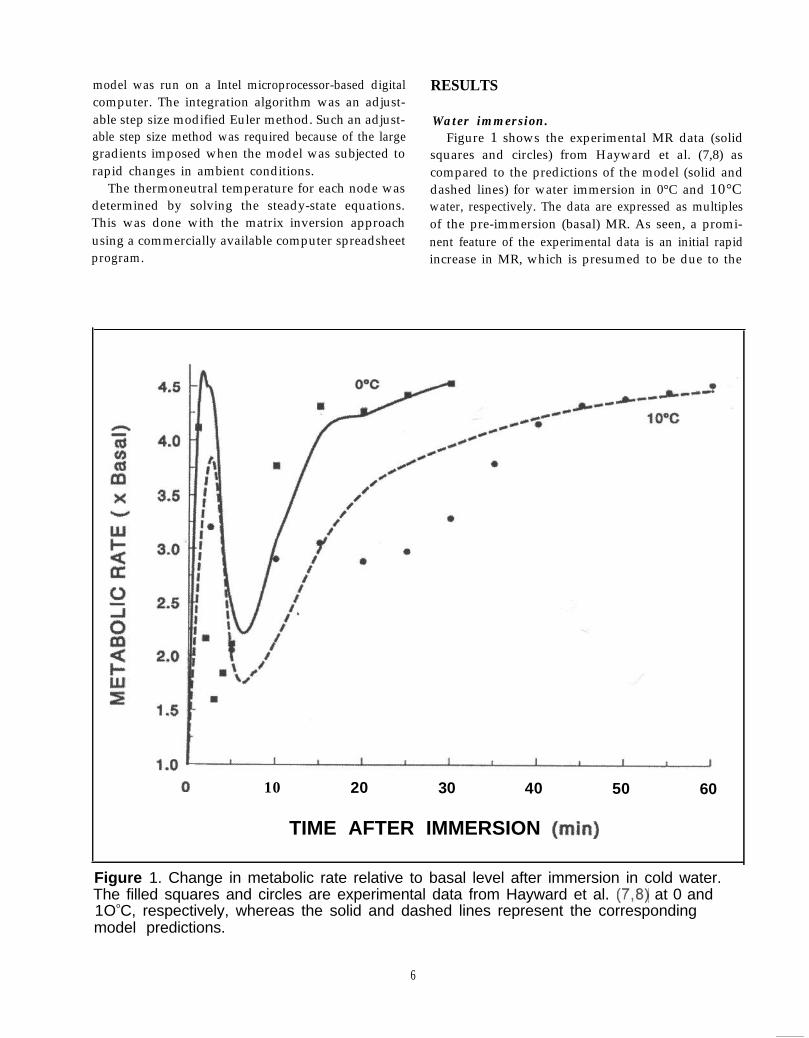
Water immersion.Figure 1 shows the experimental MR data (solid
squares and circles) from Hayward et al. (7,8) ascompared to the predictions of the model (solid anddashed lines) for water immersion in 0°C and 10°Cwater, respectively. The data are expressed as multiplesof the pre-immersion (basal) MR. As seen, a promi-nent feature of the experimental data is an initial rapidincrease in MR, which is presumed to be due to the
0 10 20 30 40 50 60
TIME AFTER IMMERSION (min)
Figure 1. Change in metabolic rate relative to basal level after immersion in cold water.The filled squares and circles are experimental data from Hayward et al. (7,8) at 0 and1OoC, respectively, whereas the solid and dashed lines represent the correspondingmodel predictions.
6
rapid decrease in skin temperature upon cold waterimmersion (see Fig. 3). However, this feature is tran-sient, as the MR falls back to much lower levels overthe next few min. At 3-5 min after immersion, the MRbegins to rise again and reaches near maximum valuesat 10 min for the 0°C water immersion. In contrast, forthe 10°C immersion, the MR plateaus at an interme-diate value (3 times basal) until ~30 min and then risesto near maximum values by 45 min. The model-predicted curves generally mimic the shape of the data;however, the very rapid fall in MR for the 0°C data(squares) after the initial peak occurs a few minuteslater in time for the model predictions (solid line) andthe plateau in the 10°C data (circles) is only roughlyapproximated by the model (dashed line). In ourattempts to predict these experimental data and thedata for higher temperatures presented below, it wasclear that inconsistencies in the data must exist;features existed in one data set not present in others.Therefore, model predictions did not exactly dupli-cate any one set, but the overall predictions were good.
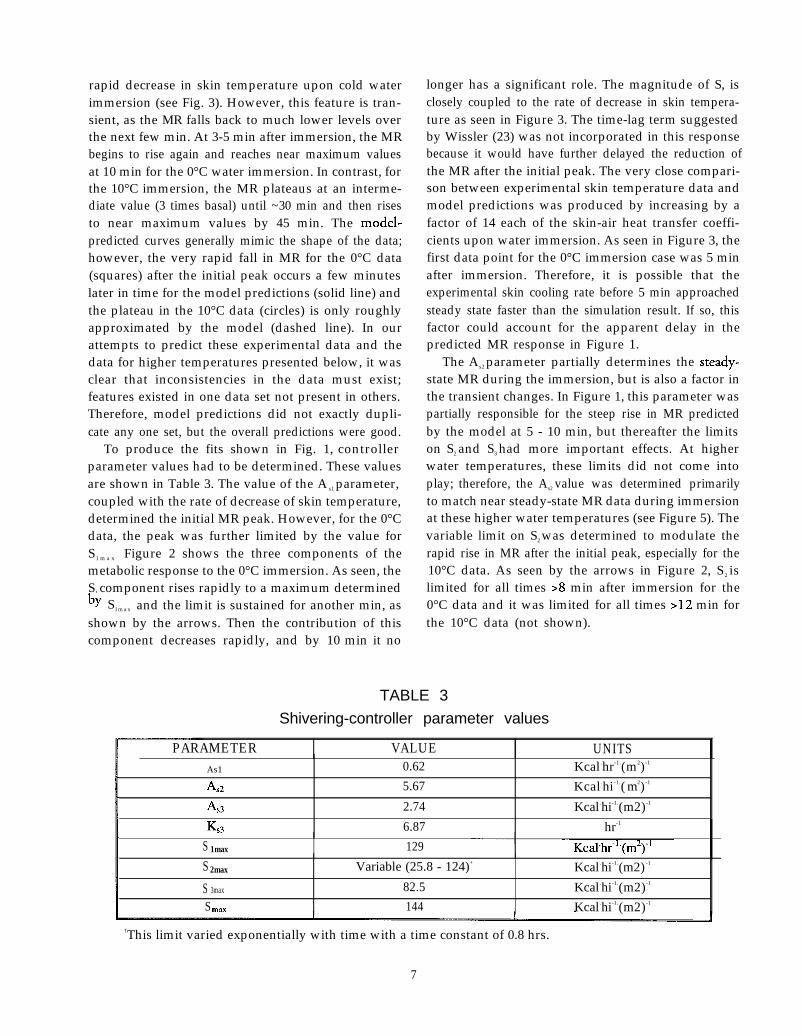
To produce the fits shown in Fig. 1, controllerparameter values had to be determined. These valuesare shown in Table 3. The value of the A s1 parameter,coupled with the rate of decrease of skin temperature,determined the initial MR peak. However, for the 0°Cdata, the peak was further limited by the value forS1 m a x Figure 2 shows the three components of themetabolic response to the 0°C immersion. As seen, theS1 component rises rapidly to a maximum determinedby S1max and the limit is sustained for another min, asshown by the arrows. Then the contribution of thiscomponent decreases rapidly, and by 10 min it no
longer has a significant role. The magnitude of S, isclosely coupled to the rate of decrease in skin tempera-ture as seen in Figure 3. The time-lag term suggestedby Wissler (23) was not incorporated in this responsebecause it would have further delayed the reduction ofthe MR after the initial peak. The very close compari-son between experimental skin temperature data andmodel predictions was produced by increasing by afactor of 14 each of the skin-air heat transfer coeffi-cients upon water immersion. As seen in Figure 3, thefirst data point for the 0°C immersion case was 5 minafter immersion. Therefore, it is possible that theexperimental skin cooling rate before 5 min approachedsteady state faster than the simulation result. If so, thisfactor could account for the apparent delay in thepredicted MR response in Figure 1.
The As2 parameter partially determines the steady-state MR during the immersion, but is also a factor inthe transient changes. In Figure 1, this parameter waspartially responsible for the steep rise in MR predictedby the model at 5 - 10 min, but thereafter the limitson S2 and S3 had more important effects. At higherwater temperatures, these limits did not come intoplay; therefore, the As2 value was determined primarilyto match near steady-state MR data during immersionat these higher water temperatures (see Figure 5). Thevariable limit on S2 was determined to modulate therapid rise in MR after the initial peak, especially for the10°C data. As seen by the arrows in Figure 2, S 2 islimited for all times >8 min after immersion for the0°C data and it was limited for all times >12 min forthe 10°C data (not shown).
TABLE 3
Shivering-controller parameter values
PARAMETER VALUE UNITSAs1
As2
As3
Ks3
0.62
5.67
2.74
6.87
Kcal .hr-1.(m2)-1
Kcal .hi-1.( m2)-1
Kcal .hi-1.(m2)-1
hr-1
S 1max 129
S2max
S 3max
Smax
Variable (25.8 - 124)+
82.5
144
Kcal .hi-1.(m2) -1
Kcal .hi-1.(m2)-1
Kcal .hi-1.(m2)-1
†This limit varied exponentially with time with a time constant of 0.8 hrs.
7
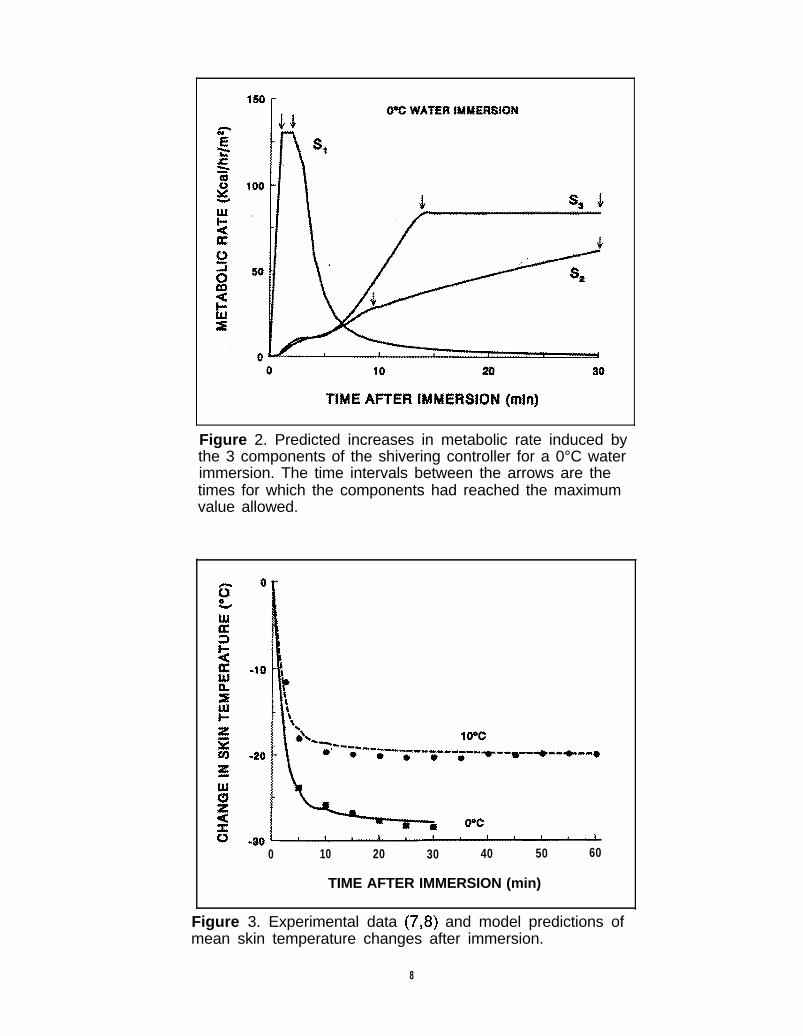
Figure 2. Predicted increases in metabolic rate induced bythe 3 components of the shivering controller for a 0°C waterimmersion. The time intervals between the arrows are thetimes for which the components had reached the maximumvalue allowed.
0 10 20 30 40 50 60
TIME AFTER IMMERSION (min)
Figure 3. Experimental data (7,8) and model predictions ofmean skin temperature changes after immersion.
8

The As3 and Ks3 parameters were determined fromthe experimental data of Nadel and Horvath (12)given in Tables 1 and 2. The resulting magnitude ofthe S3 component is shown in Figure 2. As seen, itplays the most dominant role in determining longerterm MR increases for the 0°C immersion case becausethe largest changes in the rate of decrease of coretemperature and of the decrease in skin temperatureoccur for this lowest temperature. For the 10°C im-mersion and higher temperatures, the S3 term plays aless dominant role than the S2 term in determiningincreases in MR. Also seen in Figure 2 is that it wasnecessary to limit S3 to ensure that the total MR didnot increase beyond the maximum limits shown inFigure 1. From a modeling approach, this effect alsocould have been achieved from the limit on total MR.
Hypothalamic (head-core) temperature decrease isa primary stimulus for shivering. However, this tem-perature is not generally measurable, but the relatedrectal (trunk-core) temperature is usually measured.Figure 4 shows experimental data (solid squares and
circles) of Hayward et al. (7,8) for water immersion at0°C and 10°C temperatures, respectively. As seen,after the initial 5-min period where the temperaturechange was small, the rectal temperature began to fallrapidly, and the rate of decline increased with time forboth immersion temperatures. This rapid rate ofdecline helps to produce the steep increase in the S3
component seen in Figure 2 and the absolute decreasein temperature also drives the increase in the S2
component. The model predictions (solid and dashedlines) for these temperature changes were quite good,in general, although the predicted results did not fallas rapidly as the experimental data in the later stagesof the immersions.
MR data from the study of Tikuisis et al. (17) isshown in Figure 5 for immersion at 20°C and 28°Ctemperatures. As seen, these data do not show theinitial MR peak, which is very prominent in theHayward et al. (7) study (see Figure 1). The absenceof this feature may be due to the wide spacing of thedata points (6 min apart). However, the Tikuisis et al.
TIME AFTER lMMERSlON (min)
Figure 4. Experimental data (7,8) and model predictions (trunk-coretemperature) of rectal temperature changes after immersion.
9

(17) data also look diff erent because they reach valuesof near steady-state by the first sample, in contrast tothe responses shown in Figure 1. The model predic-tions are quite close to the experimental data after >20min of immersion, but they do not show the sustainedhigh values of MR shown early in the experimentaldata. These differences in MR patterns for the differ-ent data sets make it very difficult to accurately predictthe data over the whole time range with a single set ofconstant controller parameters.
Rectal temperature changes measured by Tikuisiset al. (17) are shown in Figure 6. The 28°C immersiondata (solid circles) are predicted quite well by themodel, but the model grossly overestimates the de-crease in rectal temperature for the 20°C immersioncase. It appears that the experimental data for bothtemperatures are very close, even though the MRpatterns shown in Figure 5 are distinct. At present, we
can not reconcile this inconsistency; however, it un-derscores the necessity of comparing model predic-tions with a number of experimental data sets.
Exposure to cooled air.To see how well the model predicts thermal behav-
ior in response to a different stress, a comparison wasmade to the data of Raven and Horvath (14) forexposure to 4.7°C air as presented by Gordon et al. (4).This data set includes both MR data, as well asextensive skin temperature data, which provide acomprehensive test of the model. Figure 7 shows theMR experimental data (solid circles) and the modelprediction (solid line). It is clear that the prediction isgenerally acceptable, considering no controller param-eter adjustments were made. Skin temperature dataare shown in Figures 8 and 9. As shown, our modelunderestimates the arm-skin data significantly, whereas
Figure 5. Change in metabolic rate relative to basal level afterimmersion in cool water. The filled squares and circles areexperimental data from Tikuisis et al. (17) at 20 and 28°C,respectively, whereas the solid and dashed lines represent thecorresponding model predictions
10

Figure 6. Experimental data (17) and modelrectal temperature changes after immersion.
predictions (trunk-core temperature) of
TIME AFTER EXPOSURE TO 4.7oC AIR (min)
Figure 7. Comparison between experimental data from Gordon et al. (4) and modelpredictions of increases in metabolic rate due to exposure to cold air. The shivering-controller parameter values were unchanged from the water-immersion conditions.
11
0
-5
-10
-15
-20
Arm
TIME AFTER EXPOSURE TO 4.7°C AIR (min)
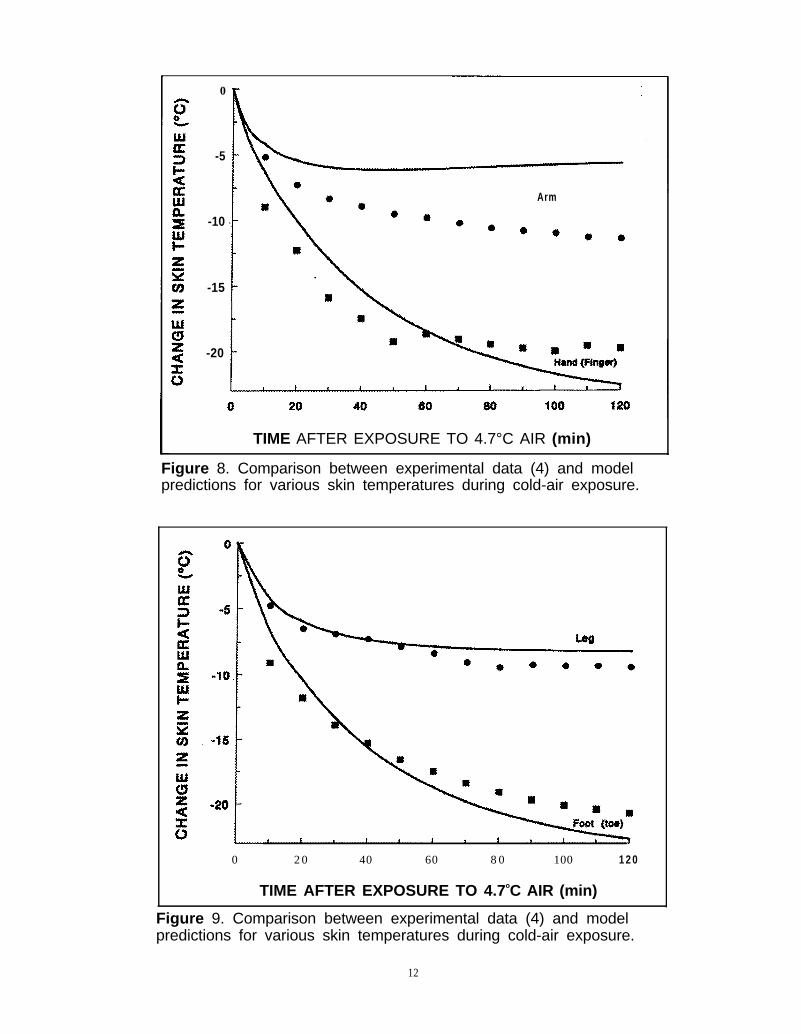
Figure 8. Comparison between experimental data (4) and modelpredictions for various skin temperatures during cold-air exposure.
0 2 0 40 60 8 0 100 120
TIME AFTER EXPOSURE TO 4.7oC AIR (min)
Figure 9. Comparison between experimental data (4) and modelpredictions for various skin temperatures during cold-air exposure.
12
the leg data are predicted quite closely. The finger andtoe data show a somewhat more rapid approach tosteady-state than the model predictions for the handand foot, but considering the anatomical difference forexperimental and predicted results, the comparison issatisfactory. It is likely that altering the partitioning ofblood flow and shivering metabolism to these sectionswould improve the fit. However, since the bodilycompositions of the experimental subjects in thevarious studies were significantly different, we decidednot to make changes to the model to make it fit any onedata set.
One significant discrepancy observed for the air-cooling data was that the experimentally measuredrectal temperature (4) increased by about 1°C duringthe 2 hrs of exposure. In contrast, the model predictionwas a 1°C decrease. At present, we can not explain thisdiscrepancy. Timbal et al. (19) also found that rectaltemperature increased when subjects were exposed tocool air, but they also found that immersion in waterdown to 24°C produced initial increases in rectaltemperature, which contrasts to the data of Tikuisis etal. (17). These differences in experimental data cannotpresently be explained.
Cabin water spray system.The next objective was to use the model to predict
thermoregulatory responses after an individual hadbeen wetted by a cabin water spray system and exposedto a cool environment. The basic model had to bemodified by adding the effects of clothing and a waterlayer next to the skin, which evaporates and draws heatfrom the skin.
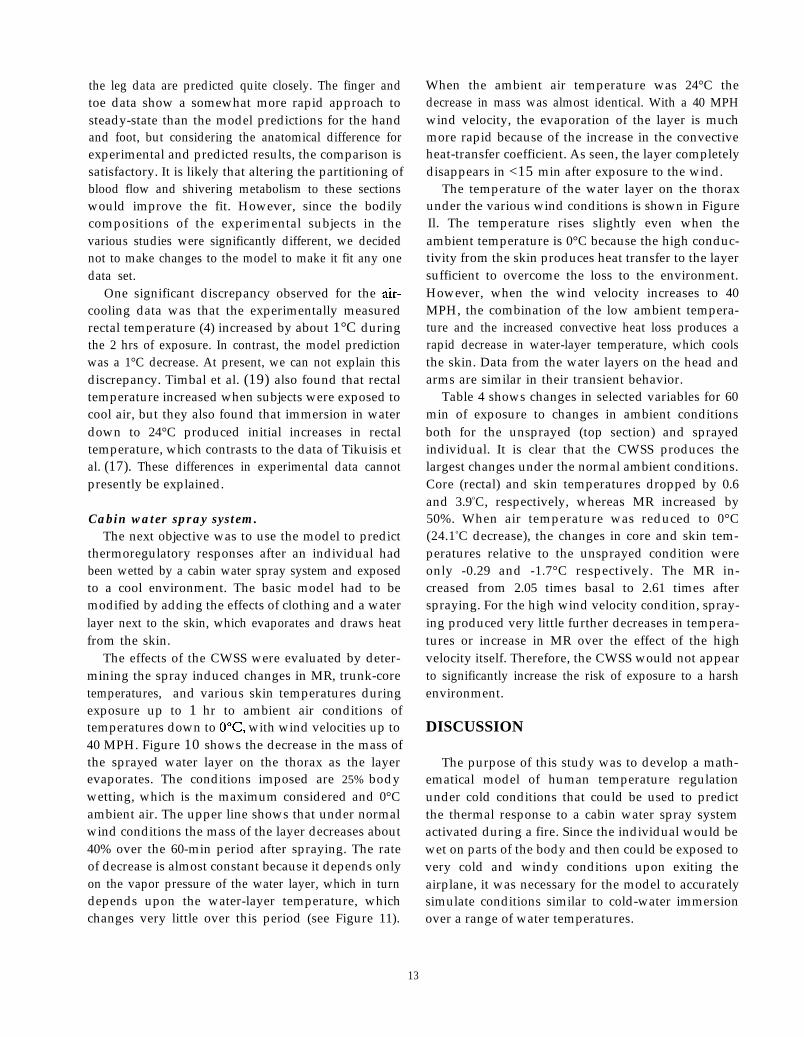
The effects of the CWSS were evaluated by deter-mining the spray induced changes in MR, trunk-coretemperatures, and various skin temperatures duringexposure up to 1 hr to ambient air conditions oftemperatures down to 0°C with wind velocities up to40 MPH. Figure 10 shows the decrease in the mass ofthe sprayed water layer on the thorax as the layerevaporates. The conditions imposed are 25% bodywetting, which is the maximum considered and 0°Cambient air. The upper line shows that under normalwind conditions the mass of the layer decreases about40% over the 60-min period after spraying. The rateof decrease is almost constant because it depends onlyon the vapor pressure of the water layer, which in turndepends upon the water-layer temperature, whichchanges very little over this period (see Figure 11).
When the ambient air temperature was 24°C thedecrease in mass was almost identical. With a 40 MPHwind velocity, the evaporation of the layer is muchmore rapid because of the increase in the convectiveheat-transfer coefficient. As seen, the layer completelydisappears in <15 min after exposure to the wind.
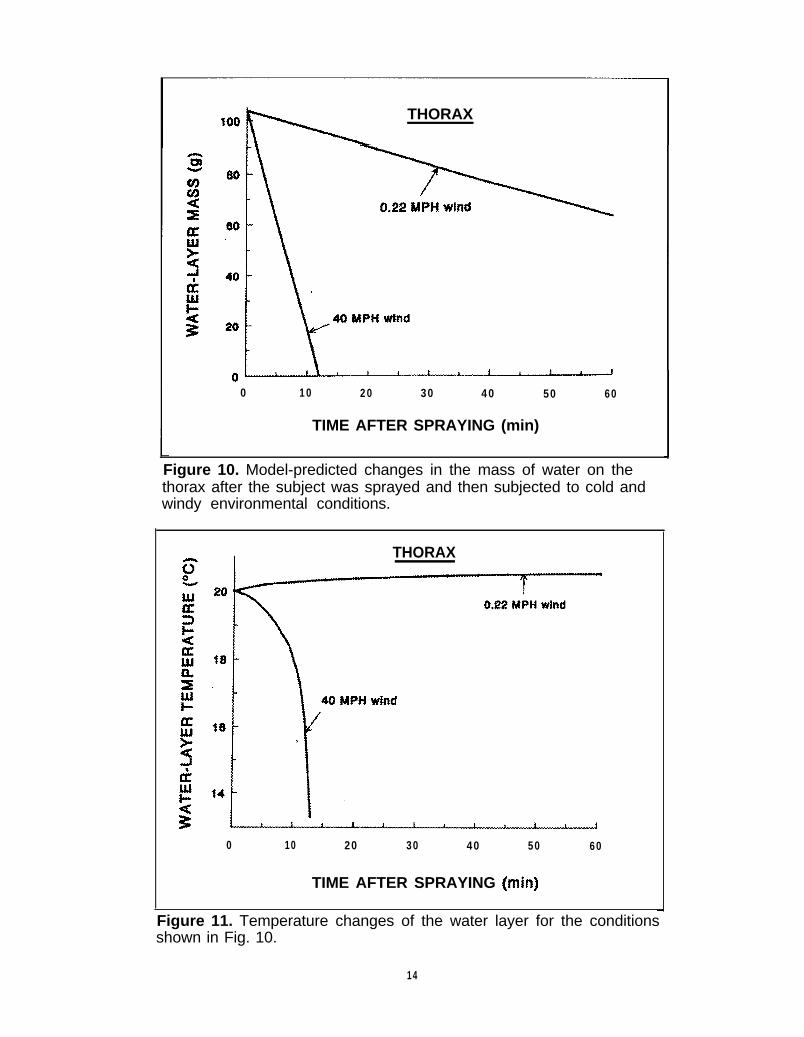
The temperature of the water layer on the thoraxunder the various wind conditions is shown in FigureIl. The temperature rises slightly even when theambient temperature is 0°C because the high conduc-tivity from the skin produces heat transfer to the layersufficient to overcome the loss to the environment.However, when the wind velocity increases to 40MPH, the combination of the low ambient tempera-ture and the increased convective heat loss produces arapid decrease in water-layer temperature, which coolsthe skin. Data from the water layers on the head andarms are similar in their transient behavior.
Table 4 shows changes in selected variables for 60min of exposure to changes in ambient conditionsboth for the unsprayed (top section) and sprayedindividual. It is clear that the CWSS produces thelargest changes under the normal ambient conditions.Core (rectal) and skin temperatures dropped by 0.6and 3.9oC, respectively, whereas MR increased by50%. When air temperature was reduced to 0°C(24.1oC decrease), the changes in core and skin tem-peratures relative to the unsprayed condition wereonly -0.29 and -1.7°C respectively. The MR in-creased from 2.05 times basal to 2.61 times afterspraying. For the high wind velocity condition, spray-ing produced very little further decreases in tempera-tures or increase in MR over the effect of the highvelocity itself. Therefore, the CWSS would not appearto significantly increase the risk of exposure to a harshenvironment.
DISCUSSION
The purpose of this study was to develop a math-ematical model of human temperature regulationunder cold conditions that could be used to predictthe thermal response to a cabin water spray systemactivated during a fire. Since the individual would bewet on parts of the body and then could be exposed tovery cold and windy conditions upon exiting theairplane, it was necessary for the model to accuratelysimulate conditions similar to cold-water immersionover a range of water temperatures.
13
THORAX
0 10 20 30 40 50 60
TIME AFTER SPRAYING (min)
Figure 10. Model-predicted changes in the mass of water on thethorax after the subject was sprayed and then subjected to cold andwindy environmental conditions.
THORAX
0 10 20 30 40 50 60
TIME AFTER SPRAYING (min)
Figure 11. Temperature changes of the water layer for the conditionsshown in Fig. 10.
14

TABLE 4
Thermal response to CWSS
We used the classic 25-node model of Stolwijk andHardy (16) with parameters modified anatomically byTikuisis et al. (18) with the general S-componentapproach of Wissler (23) for the shivering controller.This model could predict with reasonable accuracytransient data for metabolic rate, rectal and skintemperature after cold-water immersion (see Figures 1and 3-6). Therefore, it is highly likely that it canpredict with sufficient accuracy the response to skinwetting by the CWSS. The major finding was that,compared with the effects of cold-air and high-windexposure, the effect of the CWSS was relatively small(see Table 4). The greatest stress to the human thermalsystem was seen under normal environmental condi-tions, but even here, the effect was not large.
There is still considerable argument over both theanatomical description (i.e., number of nodes) and theform of the controller equations to describe humanthermal responses to cold conditions. Whereas thesearguments are unlikely to influence our conclusionthat the CWSS would have insignificant effects onairline passengers, it is important for other applica-tions that they be resolved.
The question of the number of nodes required hasbeen directly addressed only in one situation. Wissler(21) compared responses of head-core and trunk-skintemperatures in his 250-node model and the 14-nodemodel of Kuznetz (10) to a combination of air cooling
and light exercise. The important finding was that the14-node model significantly overestimated the de-crease in skin temperature. Wissler suggested that anytime thermal gradients between core and skin aresignificant, these errors would occur. There are nosimilar studies to evaluate the decrease in this error ofexpanding the model to 25-nodes, or even larger, asdid Gordon et al. (4) and Montgomery (11). In thecase of water immersion, the overestimation in the skintemperature would probably be decreased because ofthe rapid equilibration between skin and water tem-peratures, but the resulting large gradient betweenskin and core might produce similarly large errors inthe core temperatures.
The form of the controller equations for shivering isstill not settled. The original model of Stolwijk andHardy (15) postulated that the increase in MR wasdependent on the product of changes in average skintemperature and the head-core temperature. Thisassumption was not altered in their subsequent model(16) or in the changes made by Montgomery (11) toadapt the model for water immersion predictions.Gordon et al. (4) made the first substantial change.They assumed that the MR increase was sensitive to asum of three terms, each proportional to either 1) skintemperature, 2) head-core temperature, or 3) heatflux. They found controller parameter values, whichproduced close prediction of transient MR, rectal
15
temperature, and various skin temperatures duringexposure to ~5oC air. However, Wissler (21) foundthat this model was unable to predict the thermalresponse to cold-water immersion.
In 1985, Wissler (23) suggested a different three-component shivering MR controller. The MR was asum of terms proportional to 1) the time-rate ofchange of mean skin temperature (dTs/dt), 2) theproduct of the changes in mean skin temperature andcentral (core) temperature as formulated by Haywardet al. (8), and 3) the time-rate of change of centraltemperature. Wissler formulated the first component(S,) as a set of differential equations, each governingthe change in MR at different magnitudes of dTs/dt.However, he gave little justification for his assump-tions, nor did he list most of the parameter valuesrequired to use this formulation. There is substantialevidence that there is a rapid transient increase in MRcoincident with a drop in skin temperature. Thisresponse is very evident in the data of Hayward et al.(7,8) during cold-water immersion, in the data ofRaven and Horvath (14) during cold-air exposure, andin the results of Timbal et al. (19) for both cold-waterimmersion and cold-air exposure. Consequently, weincorporated this effect in the present model, but wefound that to fit the available MR data it was notnecessary to describe it by a set of differential equa-tions. Instead, as given by Eq. 1, the S1 component wassimply proportional to the sum of the weighted ratesof change of the individual skin temperatures. Thetime lags introduced by the differential equationswould have slowed the MR increase upon cooling,which was not indicated by the experimental data (seeFigure 1). In contrast, Tikuisis et al. (17) did notincorporate this effect in their model. Instead, theyhad a term proportional to skin temperature, whichthey included to produce a rapid increase in MR withskin cooling because their experimental MR data (seeFigure 5) did not show the subsequent rapid fall inMR as in the data for colder water temperatures (seeFigure 1). Perhaps it takes a certain minimum rate ofskin temperature decrease to initiate the transienteffect, or the effect was not seen in the Tikuisis et al.data because data sampling was not sufficiently rapid.
The second component (S2) proposed by Wissler(23) was taken from the findings of Hayward et al. (8)during water immersion at 10°C. They proposed thatthe steady-state MR increase observed could be de-scribed by a product relationship of changes in skin
and core temperatures. However, the changes were notrelative to normal values of these variables, but toreference values of 41-42°C presumably the values atwhich neural firing from the receptors ceases. It ispossible that this relationship is incorrect becauseHayward et al. ignored the involvement of time-varying core temperature changes during their mea-surements. In 1969, Nadel and Horvath (12) showedthat a centrally imposed heat debt resulting in asustained decrease in core temperature of ~0.1oC/mininduced a rapid increase in MR peaking at a valuedependent upon mean skin temperature, which washeld constant at different values during the MRmeasurements. At the normal skin temperature, theheat debt had no significant effect on the MR. In asubsequent paper, Nadel et al. (13) discussed thepresence of a rate component in MR increases, butthey did not formalize this component as they tried topredict only steady-state changes. Wissler (23) recog-nized that this rate effect could be important andproposed that the third component of shivering (S,)was proportional to dTc/dt, but he ignored themodulating effect of skin temperature in this formula-tion. Assuming the existence of this effect, then theMR data of Hayward et al. (7,8) must have beenaffected because core temperature was decreasingthroughout the measurement period. As a conse-quence, their expression derived for MR changes isnot valid.
In the present study, the product effect of changesin skin and core temperatures was incorporated as theS 2 component (see Eq. 2), but the changes werederived from the thermoneutral setpoint establishedprior to immersion. The effect of a time lag for thiscomponent, as produced by the differential equationformulation of Wissler (23), was not included becauseof a lack of experimental evidence for its necessity. TheS3 component was described (see Eq. 3) as a productof skin temperature change and the rate of change ofcore temperature. This component was described by adifferential equation because Nadel and Horvath (12)found that after the peak MR was reached, the MRsubsequently declined with time back to the steady-state values. The peak values and the steady-statevalues were used (see Tables 1 and 2) to derive theparameter values for this relationship. The parametervalues for the other constants (see Table 3) werederived to fit the model to experimental data, asdescribed in the RESULTS section.
16

An unusual feature in the present model was a limiton the S2 component, which varied with time (seeFigure 2). This kind of limit was necessary for themodel prediction to approximate the slower rise inMR after the initial peak. This limit became a factoronly in the lower-temperature water immersion cases.Wissler (23) suggested that the S2 component in hismodel be modified by a time-varying factor to accountfor MR increases during prolonged exposure to cold.He suggested that this effect could account for theinfluence of thermoreceptors besides those in thehypothalamus and skin. Our variable limit accom-plishes the same purpose and may represent the samephenomena. Alternatively, the time-varying limit mayrepresent an increase in thermoreceptor sensitivityafter prolonged intense stimulation.
This study has demonstrated for the first time thatthe thermal behavior of immersed humans can bepredicted for a wide range of temperatures. However,it would be desirable if the model could also beapplicable to cold-air exposure conditions, since noavailable models have been able to predict thermalbehavior for both kinds of conditions. Besides theapplication of the model of Gordon et al. (4), whichwas limited to a comparison with one data set, Haslamand Parsons (6) recently compared rectal and skintemperature predictions of two different models undercold-air exposure conditions. The models were a 2-node model of Gagge et al. (2) and the 25-nodeStolwijk and Hardy (16) model. They found thatneither of these models could describe the data withsufficient accuracy over the entire range of cold tem-peratures considered. The results of the present studyhave shown that the model can predict changes in MRand skin temperatures for the one case of cold-airexposure considered (see Figures 7-9), but the rectal(core) temperature predictions are in the oppositedirection to experimental findings (4). The reasons forthis discrepancy have not been reconciled. Timbal etal. (19) found that the changes in MR after the initialpeak occurring during water immersion of tempera-tures down to 24°C could be described as a functionof the sum of two factors, one proportional to thechange in skin temperature and the second propor-tional to rectal temperature. However, in their study,rectal temperature increased during the immersion,which is opposite to the findings of Tikuisis et al. (17)and Hayward et al. (7,8). Timbal et al. proposed thata decrease in skin temperature and an increase in rectal
temperature both acted to increase MR. However, thisrelationship did not hold for cold-air exposure, so theywere forced to assume a different relationship here,which did not contain the influence of core tempera-ture. Timbal et al. (19) were bothered by this conclu-sion that the body responds differently to the type ofthermal stress, but they were left with no alternative.The single set of controller equations developed in thepresent study is a step forward in that one does nothave to postulate different equations for differentconditions, but the direction of core temperaturechanges is still unresolved.
REFERENCES
1. Daniel, W.W. Biostatistics: A Foundation for Analysisin the Health Sciences, New York: Wiley, 1987.Ed. 4.
2. Gagge, A.P., A.P. Fobelets, and L.G. Berglund. Astandard predictive index of human response tothe thermal environment. ASHRAE Trans.92:709-31, 1986.
3. Gagge, A.P. and Y. Nishi. Heat exchange betweenhuman skin surface and thermal environment.In: Handbook of Physiology. Adaptation to theenvironment, edited by Lee, D.H.K. Bethesda:Am. Physiol. Soc., 1964, p. 69-92.
4. Gordon, R.G., R.B. Roemer, and S.M. Horvath. Amathematical model of the human temperatureregulatory system - Transient cold exposureresponse. IEEE Trans. Biomed. Eng. BME- 23 :434-44, 1976.
5. Hardy, J.D. Models of temperature regulation - areview. In: Essays on temperature regulation,Amsterdam: North-Holland, 1972, p. 163-86.
6. Haslam, R.A. and K.C. Parsons. Using computer-based models for predicting human thermalresponses to hot and cold environments. Ergo-nomics 37 :399-416, 1994.
7. Hayward, J.S. and J.D. Eckerson. PhysiologicalResponses and survival time prediction for hu-mans in ice-water. Aviat.Space Environ.Med.55 :206-12, 1984.
8. Hayward, J.S., J.D. Eckerson and M.L. Collis.Thermoregulatory heat production in man: Pre-diction equation based on skin and core tempera-tures. J.Appl.Physiol. 42:377-84, 1977.
17

9. Holman, J.P. Heat transfer, New York: McGraw- 17.
10.
11.
12.
13.
14.
15.
16.
Hi l l , 1968 . Ed . 2 .
Kuznetz, L.H. A model for the transient metabolicthermal response of man in space. NASA MannedSpacecraft Center internal note MSC-EC-R-68- 18.4:1966.
Montgomery, L.D. A model of heat transfer inimmersed man. Ann. Biomed. Eng. 2 : 19-46, 1974.
Nadel, E.R. and S.M. Horvath. Peripheral in-volvement in thermoregulatory response to animposed heat debt in man. J.Appl.Pbysiol.27 :484-8, 1969.
Nadel, E.R., S.M. Horvath, C.A. Dawson, and A.Tucker. Sensitivity to central and peripheralthermal stimulation in man. JAppl. Physiol.29 :603-9, 1970.
Raven, P.R, and S.M. Horvath. Variability ofphysiological parameters of unacclimatizedmales during a two-hour cold stress, 5°C.Int.J. Biometeorol. 1 4 :309-20, 1970.
Stolwijk, J.A.J. and J.D. Hardy. Temperatureregulation in man - A theoretical study. PflugersArch. 291 : 129-62, 1966.
Stolwijk, J.A.J. and J.D. Hardy. Control of bodytemperature. In: Handbook of physiology. Reactionto environmental agents, edited by Lee, D.H.K.Bethesda: Am. Physiol. Soc., 1977, p. 45-67.
Tikuisis, P., R.R. Gonzales and K.B. Pandolf.Thermoregulatory model for immersion of hu-mans in cold water. J.Appl.Physiol. 64 :719-27,1988.
Tikuisis, P., R.R. Gonzales and K.P. Pandolf.Human thermoregulatory model for whole bodyimmersion in water at 20 and 28°C. US ArmyRes.Inst.Env.Med. T23- 87 :l-46, 1987.
19. Timbal, J., C. Boutelier, M. Loncle and L. Bogues.Comparison of shivering in man exposed to coldin water and air. Pflugers Arch. 365 :243-8, 1976.
20. Wissler, E.H. A mathematical model of the humanthermal system. Bull.Math. Biopbys. 26 : 147-66,1964.
21. Wissler, E.H. Comparison of computed resultsobtained from two mathematical models - Asimple 14-node model and a complex 250-nodemodel. J.Physiol.Paris 63 :455-8, 1971.
22. Wissler, E.H. An Evaluation of Human ThermalModels. Part A. US Air Force. (Sci. Res. Rep.AFOSR-82-0214) 1984.
23. Wissler, E.H. Mathematical simulation of humanthermal behavior using whole body models. In:Heat transfer in medicine and biology, edited byShitzer, A. and Eberhart, R.C. New York: Ple-num, 1985, p. 325-73.
18 U.S. GOVERNMENT PRINTING OFFICE: 1998 -660-088/60057