Embed Size (px)
Citation preview
General rights Copyright and moral rights for the publications made accessible in the public portal are retained by the authors and/or other copyright owners and it is a condition of accessing publications that users recognise and abide by the legal requirements associated with these rights.
Users may download and print one copy of any publication from the public portal for the purpose of private study or research.
You may not further distribute the material or use it for any profit-making activity or commercial gain
You may freely distribute the URL identifying the publication in the public portal If you believe that this document breaches copyright please contact us providing details, and we will remove access to the work immediately and investigate your claim.
Downloaded from orbit.dtu.dk on: Feb 25, 2020
Effect of Antibiotics on Gut Microbiota, Gut Hormones and Glucose Metabolism
Mikkelsen, Kristian H; Frost, Morten; Bahl, Martin Iain; Licht, Tine Rask; Jensen, Ulrich S.; Rosenberg,Jacob; Pedersen, Oluf; Hansen, Torben; Rehfeld, Jens F.; Holst, Jens J.Published in:P L o S One
Link to article, DOI:10.1371/journal.pone.0142352
Publication date:2015
Document VersionPublisher's PDF, also known as Version of record
Link back to DTU Orbit
Citation (APA):Mikkelsen, K. H., Frost, M., Bahl, M. I., Licht, T. R., Jensen, U. S., Rosenberg, J., ... Knop, F. K. (2015). Effect ofAntibiotics on Gut Microbiota, Gut Hormones and Glucose Metabolism. P L o S One, 10(11), [e0142352].https://doi.org/10.1371/journal.pone.0142352
RESEARCH ARTICLE
Effect of Antibiotics on Gut Microbiota, GutHormones and Glucose MetabolismKristian H. Mikkelsen1,2, Morten Frost3, Martin I. Bahl4, Tine R. Licht4, Ulrich S. Jensen5,Jacob Rosenberg6, Oluf Pedersen2, Torben Hansen2,3, Jens F. Rehfeld7, Jens J. Holst2,Tina Vilsbøll1, Filip K. Knop1,2*
1 Center for Diabetes Research, Gentofte Hospital, University of Copenhagen, Hellerup, Denmark, 2 NNFCentre for Basic Metabolic Research and Department of Biomedical Sciences, Faculty of Health and MedicalSciences, University of Copenhagen, Copenhagen, Denmark, 3 Endocrine Research Unit, University ofSouthern Denmark, Odense, Denmark, 4 National Food Institute, Technical University of Denmark, Søborg,Denmark, 5 Department of Clinical Microbiology, Rigshospitalet, University of Copenhagen, Copenhagen,Denmark, 6 Department of Surgery, Herlev Hospital, University of Copenhagen, Herlev, Denmark,7 Department of Clinical Biochemistry, Rigshospitalet, University of Copenhagen, Copenhagen, Denmark
Abstract
Objective
The gut microbiota has been designated as an active regulator of glucose metabolism and
metabolic phenotype in a number of animal and human observational studies. We evalu-
ated the effect of removing as many bacteria as possible by antibiotics on postprandial
physiology in healthy humans.
Methods
Meal tests with measurements of postprandial glucose tolerance and postprandial release
of insulin and gut hormones were performed before, immediately after and 6 weeks after a
4-day, broad-spectrum, per oral antibiotic cocktail (vancomycin 500 mg, gentamycin 40 mg
and meropenem 500 mg once-daily) in a group of 12 lean and glucose tolerant males. Fae-
cal samples were collected for culture-based assessment of changes in gut microbiota
composition.
Results
Acute and dramatic reductions in the abundance of a representative set of gut bacteria was
seen immediately following the antibiotic course, but no changes in postprandial glucose
tolerance, insulin secretion or plasma lipid concentrations were found. Apart from an acute
and reversible increase in peptide YY secretion, no changes were observed in postprandial
gut hormone release.
Conclusion
As evaluated by selective cultivation of gut bacteria, a broad-spectrum 4-day antibiotics
course with vancomycin, gentamycin and meropenem induced shifts in gut microbiota
PLOS ONE | DOI:10.1371/journal.pone.0142352 November 12, 2015 1 / 14
OPEN ACCESS
Citation: Mikkelsen KH, Frost M, Bahl MI, Licht TR,Jensen US, Rosenberg J, et al. (2015) Effect ofAntibiotics on Gut Microbiota, Gut Hormones andGlucose Metabolism. PLoS ONE 10(11): e0142352.doi:10.1371/journal.pone.0142352
Editor: Maciej Buchowski, Vanderbilt University,UNITED STATES
Received: August 4, 2015
Accepted: October 19, 2015
Published: November 12, 2015
Copyright: © 2015 Mikkelsen et al. This is an openaccess article distributed under the terms of theCreative Commons Attribution License, which permitsunrestricted use, distribution, and reproduction in anymedium, provided the original author and source arecredited.
Data Availability Statement: All relevant data arewithin the paper and its Supporting Information files.
Funding: The Augustinus Foundation, the Aase ogEjnar Danielsen Foundation, the Toyota Foundation,and the 3G Center (Danish Council for StrategicResearch) gave economic support to the study. Also,this work was supported by research grants from theNovo Nordisk Foundation Center for Basic MetabolicResearch, an independent Research Center at theUniversity of Copenhagen partially funded by anunrestricted donation from the Novo NordiskFoundation. The funders had no role in study design,
composition that had no clinically relevant short or long-term effects on metabolic variables
in healthy glucose-tolerant males.
Trial Registration
clinicaltrials.gov NCT01633762
IntroductionThe human gut is populated by a dense community of microbes (the gut microbiota) thatmany-fold outnumbers our eukaryotic cell count and provides the host with an enormouscomplimentary microbial gene set (the gut microbiome). Several metabolic disease states suchas obesity and type 2 diabetes have been linked with alterations in the microbiota compositionand function [1–3], and in animal models, it has been demonstrated that the microbiotaactively contributes to a number of host metabolic pathways such as energy harvesting poten-tial, regulation of gut hormone secretion and nutrient storage [4–6].
Antibiotics cause marked short-term disturbances in the human gut microbiota, and incom-plete recovery of the microbiota to its initial composition has been found in some patients fol-lowing antibiotic treatment [7–10]. In observational studies, exposure to antibiotics has beenlinked with development of obesity and type 2 diabetes [11–13]. Moreover, a 7-day course ofvancomycin, but not ampicillin, was followed by a reduction in peripheral insulin sensitivity ina randomized controlled trial [14]. Increased body mass index (BMI) and altered levels ofappetite regulating gut hormones were found following antibiotic eradication ofHelicobacterpylori in a cohort of patients referred to upper endoscopy [15]. Decreased insulin sensitivityfollowing a one-week antibiotic course with vancomycin was reported in obese males with met-abolic syndrome, whereas no change in insulin sensitivity was observed following administra-tion of amoxicillin for one week [16]. Thus, antibiotics seem to possess the potential to affecthost metabolism by altering the gut microbiota configuration, while the physiological impor-tance and potential clinical implications of antibiotic-induced microbiota alterations remain tobe demonstrated.
We designed a prospective clinical study in order to elucidate how a short-term broad-spec-trum antibiotics course targeting intestinal bacteria affects postprandial physiology in healthyglucose tolerant male adults.
Methods
Study approval and registrationThe study was approved by the Ethical Committee in the Capital Region of Denmark (H3-2011-144, S1 File and S1 Protocol) and registered on clinicaltrials.gov (NCT01633762),although the subject enrolment began 4 months before registration on clinicaltrials.gov(unawareness). The study was conducted according to the principles of the Helsinki Declara-tion II and written informed consent was obtained from all study participants.
Study designIn addition to a screening visit the study design encompassed 5 study visits (day 0, 4, 8, 42 and180) and a 4-day 3-drug antibiotic course (see below) between the first 2 study visits (day 0 and4) composed to eradicate as many gut bacteria as possible (S1 Fig). At all 5 study visits,
Gut Microbiota and Postprandial Physiology
PLOS ONE | DOI:10.1371/journal.pone.0142352 November 12, 2015 2 / 14
data collection and analysis, decision to publish, orpreparation of the manuscript.
Competing Interests: KM holds shares in Chr.Hansen and Probi. This does not alter the authors'adherence to PLOS ONE policies on sharing dataand materials.
bodyweight, height and blood pressure were measured, health questionnaires were completedand fasting blood samples and a faecal sample were collected. In addition, on 3 of the studydays (day 0, 4 and 42) a standardised meal test with repeated blood sampling was performed.Except from keeping the diet unaltered throughout the study period, and avoiding yoghurtproducts on the 4 days preceding each visit, no dietary regulations were required.
ParticipantsTwelve healthy male volunteers were recruited (between March and September 2012) using thefollowing inclusion criteria: age 18–40 years, Caucasian ethnicity, informed written consent,glycated haemoglobin A1c (HbA1c)<43 mmol/mol (<6.1%), normal bowel function (bowelmovements 1-3/day) and fasting plasma glucose (FPG)<6.0 mmol/l. Exclusion criteriaincluded any use of antibiotics 6 months prior to inclusion, BMI<18.5 kg/m2 or>25 kg/m2,smoking, abnormal serum/plasma levels of electrolytes, lipids, creatinine, liver enzymes (ala-nine transaminase, aspartate aminotransferase, alkaline phosphatase), thyroid stimulating hor-mone or haemoglobin, any current or existing disease in the gastrointestinal system or familyhistory of inflammatory bowel disease or diabetes, lactose intolerance or coeliac disease, allergyagainst the used antibiotics or use of medication that could not be paused during the studyperiod. Subjects had a mean age of 23.4 years (standard deviation 5.3 years) at the start of thestudy.
Study visitsStudy visits were conducted between April 2012 (first participant, first visit) and April 2013(last participant, last visit). At all 5 visits, study participants arrived in the laboratory in themorning after an overnight fast, having avoided strenuous physical exercise and alcohol con-sumption for the last 24 h. Participants’ height and weight were measured after voiding.
On study visits days 0, 4 and 42 standardised liquid meal tests were performed: Participantswere sitting in a semi recumbent position in a hospital bed, blood pressure was measured(Microlife BP A100, Microlife, Widnau, Switzerland), an intravenous catheter was inserted in acubital vein for collection of blood samples and the catheterised forearm was wrapped in aheating pad (50°C) throughout the experiment in order to arterialise the venous blood. Afterbaseline sampling, participants ingested, within 5 minutes, a 2,205 kJ-liquid mixed meal(Nutridrink, Nutricia, Allerød, Denmark) with 64.4 g carbohydrate, 20.3 g fat, 21.0 g protein,and, for evaluation of gastric emptying, 1.5 g paracetamol. Blood samples were drawn 30, 15,and 0 minutes before and 15, 30, 45, 60, 75, 90, 120, 150, 180, 210 and 240 minutes after inges-tion of the mixed liquid meal. For bedside measurement of plasma glucose concentrations,blood was added to fluoride tubes and centrifuged immediately at 7,400 g for 2 minutes atroom temperature. For measurements of gut hormone concentrations in plasma, blood wascollected in chilled tubes containing ethylenediaminetetraacetic acid (EDTA) and a specificdipeptidyl peptidase 4 (DPP-4) inhibitor (valine-pyrrolidide, a gift from Novo Nordisk A/S,Bagsværd, Denmark; final concentration in sample: 0.03 mmol/l). For the analyses of insulinand C-peptide blood was sampled in dry tubes, which were left to coagulate for 20 minutes atroom temperature before centrifugation. For the analyses of C-reactive protein (CRP) and lip-ids, blood was collected in lithium-heparin tubes. All samples were centrifuged for 20 minutesat 1,200 g and 4°C except for one EDTA tube for the analysis of HbA1c. Plasma and serumfrom day 0, 4 and 42, respectively, were stored at -20°C until analysis, whereas plasma fromday 8 and 180, for practical reasons, was stored at -80°C. Resting metabolic rate was measuredfrom time 210 to 225 min after meal intake by indirect calorimetry using a tight facemask con-nected to a calorimeter, which measures the gas exchange breath-by-breath via an O2 alkali cell
Gut Microbiota and Postprandial Physiology
PLOS ONE | DOI:10.1371/journal.pone.0142352 November 12, 2015 3 / 14
and an infrared CO2 sensor (CCMexpress1, Medgraphics, St. Paul, Minnesota, USA). Meta-bolic rates are represented as averages of measures carried out every 10 second over the 15 min-ute-period. Gallbladder dimensions were determined by ultrasound examination before, 25,55, 90 and 235 minutes after meal intake using a 3.5 MHz-transducer (Logiq 9, GE Healthcare,Little Chalfont, UK). Appetite ratings (hunger, fullness, desire to eat, nausea, bloating andthirst) were assessed using validated visual analogue scales (VASs) [17,18] at baseline and with30 minute-intervals during the meal test as previously described [18]. At time point 270 min,participants were served a standardised solid ad libitummeal consisting of minced meat, pasta,corn, carrots, and green pepper (5.9 g fat/100 g, 5.6 g protein/100 g, and 17.2 g carbohydrate/100 g, corresponding to 6.1 kcal/g). The participants were instructed to eat until they felt pleas-antly satiated and intake was measured as the difference between the weight of the served mealand the remaining food. This test has been validated to reproduce spontaneous food intake[19].
On study visits day 8 and 180, blood pressure was measured in the sitting position (Micro-life BP A100, Microlife, Widnau, Switzerland) and a blood sample was taken from a cubitalvein.
Antibiotics treatmentAt the end of the day 0 meal test, participants ingested an antibiotic ‘cocktail’ containing 500mg meropenem (powder for infusion; Farmaplus, Oslo, Norway), 500 mg vancomycin (powderfor infusion; Fresenius Kabi, Bad Homburg, Germany) and 40 mg gentamicin (solution forinjection; Sandoz, Basel, Switzerland) dissolved in 150 ml of apple juice. The ‘cocktail’ was amodified version of previous protocols used for prophylactic treatment of intensive care unitpatients [20,21]. It was designed to eradicate as many gut bacteria as possible with the lowestpossible risk of side effects. None of the 3 types of antibiotics are absorbed by the healthymucosa, and therefore have no direct effects on metabolism [22–24]. On day 1, 2 and 3, partici-pants ingested the same antibiotic ‘cocktail’ at the same time of the day.
Collection of faecal samplesThe day before each of the 5 study visits, the participants collected a faecal sample into a vial(Sarstedt feces tube, 76 × 20 mm, Sarstedt, Nümbrecht, Germany), which was placed in a trans-port container (Sarstedt, Nümbrecht, Germany) and stored in the participant’s own -20°Cfreezer overnight. During the transportation to the hospital, the sample was kept frozen in athermo bag with 2 ice packs, and upon arrival in the laboratory, the sample was immediatelytransferred to a -80°C freezer.
Evaluation of diet, gastrointestinal function and health-related symptomsAt each of the 5 study days, participants completed a standardised questionnaire about theirintake of common food items, number of bowel movements per day and stool consistency(Bristol Stool Scale, with a value above 4 defined as loose stool [25]) on each of the 4 precedingdays. Diarrhoea was defined according to World Health Organization (�3 loose stools per day[26]). Participants were given a personal dairy and were asked to note any health-related symp-tom, use of medication or change in activity or eating habits throughout the study period.
Laboratory methodsPlasma glucose was measured by the glucose oxidase method, using a glucose analyzer (YellowSprings Instrument model 2300 STAT plus analyzer; YSI, Yellow Springs, Ohio, USA). Serum
Gut Microbiota and Postprandial Physiology
PLOS ONE | DOI:10.1371/journal.pone.0142352 November 12, 2015 4 / 14
insulin and C-peptide concentrations were measured using a 2-sided direct chemiluminescenceimmunoassay (ADVIA Centaur XP; Siemens, Erlangen, Germany). Plasma CRP was measuredusing an immunochemical assay, with a high-sensitive test used for CRP levels below 9.00 mg/l(Vitros 5.1 FS; Ortho Clinical Diagnostics, Johnson & Johnson Medical, Birkerød, Denmark).Plasma lipids (total cholesterol, high-density lipoprotein (HDL), and triglyceride) and paracet-amol were quantified using an enzymatic colorimetric assay (Vitros 5.1 FS; Ortho ClinicalDiagnostics, Johnson & Johnson Medical, Birkerød, Denmark). By use of Friedewald’s formulavery-low-density lipoprotein (VLDL) was calculated from the amount of triglycerides multi-plied by 0.45 and low-density lipoprotein (LDL) from the amount of total cholesterol minusthe amount of HDL and VLDL. HbA1c was measured by high Performance Liquid Chromatog-raphy (Variant II TURBO, Bio-Rad, Hercules, California, USA). Plasma concentrations ofcholecystokinin (CCK), glucose-dependent insulinotropic polypeptide (GIP), glucagon-likepeptide-1 (GLP-1) and gastrin were measured by specific radioimmunoassays, as previouslydescribed [27–29]. Peptide YY (PYY)3-36 (the major circulating molecular form of PYYgenerated by DPP-4 mediated degradation of PYY1-36) was measured by a commercial radio-immunoassay (cat#PYY-67HK, Milipore, Billerica, Massachusetts, USA) according to the man-ufacturer’s recommendations. All quality controls were within acceptable limits.
Enumeration of bacteria in faecal samples was performed by the plate counting method.From partially thawed faecal samples 0.1 g was transferred to 0.9 ml maximum recovery dilu-ent and a 10-fold dilutions series was prepared and plated on 5 different agar media for enu-meration of colony forming units (CFU). Plate count agar, McConkey agar No. 3 and Slanetzand Bartley agar (Oxoid, Roskilde, Denmark) were used for enumeration of total aerobicbacteria (and facultative anaerobes), Coliform bacteria and Enterococci respectively followingaerobic incubation at 37°C for 1, 2 or 3 days. Wilkins-Chalgren agar (Oxoid) and BSM agar(Sigma-Aldrich, Brøndby, Denmark) were used for enumeration of total anaerobic bacteriaand bifidobacteria following incubation in an anaerobic chamber for 2 or 3 days. The choice ofthe 3 specific bacterial groups was based on their taxonomic diversity (belonging to 3 differentphyla) and their natural presence in the human gut microbiota.
Concentration of vancomycin and gentamicin in faecal samples was determined by chemi-luminescent immunoassay (Architect c4000, Abbott, Chicago, Illinois, USA) [30], while faecalconcentrations of meropenem were measured indirectly using an agar-cup assay [31].
Calculations and statistical analysisStatistical analyses were carried out using SAS 9.3 (SAS Institute, Cary, North Carolina, USA).Results are reported as means and 95% confidence intervals (CI) unless otherwise stated. Forcomparison of differences between baseline value and day 4, 8, 42 and 180 values, the PROCMIXED procedure was applied with participant and day as class variables, participant as ran-dom effect and day 0 value (baseline) as reference. Faecal bacterial counts, lipid measurementsand all tAUC values were log10-transformed in order to improve the fit to the model. Test forinteraction between day and time was performed in order to see if the relationship betweentime and postprandial excursions of glucose, pancreatic hormones and gut hormones were dif-ferent on day 0, 4 and 42. If no interaction was detected, postprandial excursions of glucose,insulin and gut hormones were summarised into area under the curve (AUC) values, calculatedusing the trapezoidal rule and presented as total AUC (tAUC) values.
Gallbladder volume (V) was expressed in cm3 and calculated using the ellipsoid formula:V = 1/6 πabc, where a = maximum length, b = maximum width, and c = maximum depth, asdescribed previously [32]. Matsuda index of insulin sensitivity, insulinogenic index and oraldisposition index were calculated as described previously [33–35]. Homeostasis model
Gut Microbiota and Postprandial Physiology
PLOS ONE | DOI:10.1371/journal.pone.0142352 November 12, 2015 5 / 14
assessments of insulin resistance (HOMA2-IR) was calculated using the HOMA Calculatorversion 2013 (http://www.dtu.ox.ac.uk, accessed July 2014). An indirect measure of gastricemptying rate was obtained by calculating time-to-peak of plasma acetaminophenconcentration.
Results
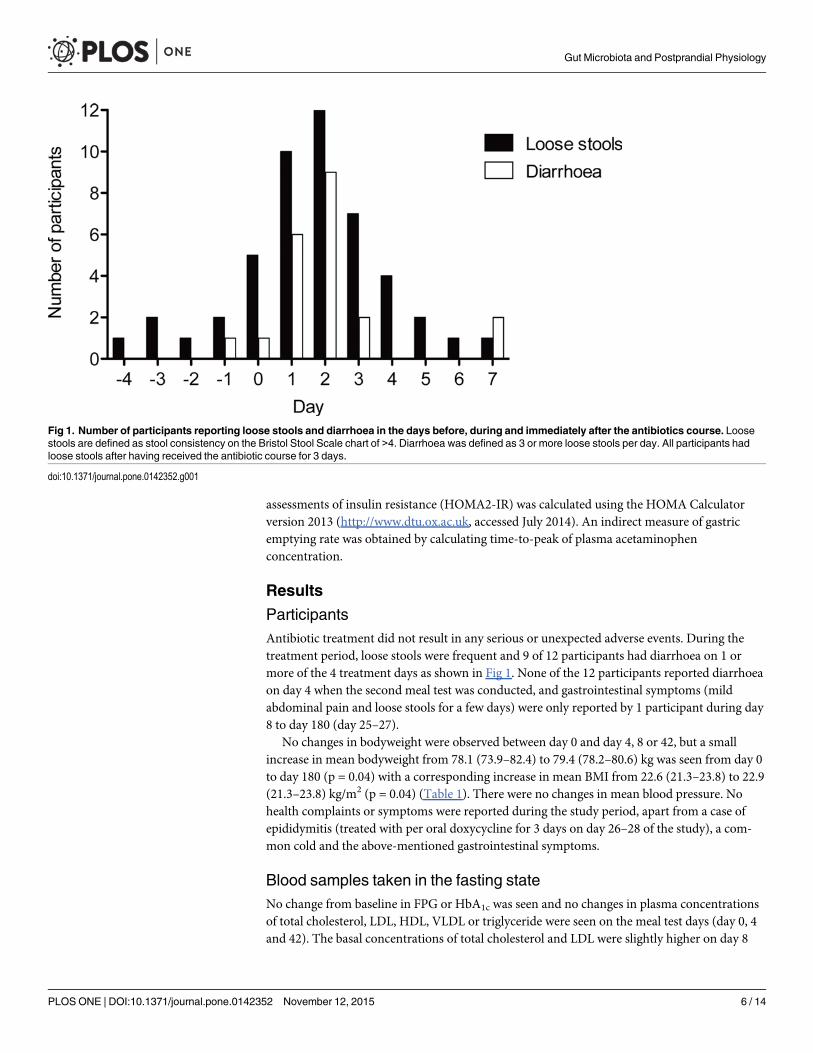
ParticipantsAntibiotic treatment did not result in any serious or unexpected adverse events. During thetreatment period, loose stools were frequent and 9 of 12 participants had diarrhoea on 1 ormore of the 4 treatment days as shown in Fig 1. None of the 12 participants reported diarrhoeaon day 4 when the second meal test was conducted, and gastrointestinal symptoms (mildabdominal pain and loose stools for a few days) were only reported by 1 participant during day8 to day 180 (day 25–27).
No changes in bodyweight were observed between day 0 and day 4, 8 or 42, but a smallincrease in mean bodyweight from 78.1 (73.9–82.4) to 79.4 (78.2–80.6) kg was seen from day 0to day 180 (p = 0.04) with a corresponding increase in mean BMI from 22.6 (21.3–23.8) to 22.9(21.3–23.8) kg/m2 (p = 0.04) (Table 1). There were no changes in mean blood pressure. Nohealth complaints or symptoms were reported during the study period, apart from a case ofepididymitis (treated with per oral doxycycline for 3 days on day 26–28 of the study), a com-mon cold and the above-mentioned gastrointestinal symptoms.
Blood samples taken in the fasting stateNo change from baseline in FPG or HbA1c was seen and no changes in plasma concentrationsof total cholesterol, LDL, HDL, VLDL or triglyceride were seen on the meal test days (day 0, 4and 42). The basal concentrations of total cholesterol and LDL were slightly higher on day 8
Fig 1. Number of participants reporting loose stools and diarrhoea in the days before, during and immediately after the antibiotics course. Loosestools are defined as stool consistency on the Bristol Stool Scale chart of >4. Diarrhoea was defined as 3 or more loose stools per day. All participants hadloose stools after having received the antibiotic course for 3 days.
doi:10.1371/journal.pone.0142352.g001
Gut Microbiota and Postprandial Physiology
PLOS ONE | DOI:10.1371/journal.pone.0142352 November 12, 2015 6 / 14
and 180 compared to day 0 (p<0.05), with no significant changes in triglyceride concentrations(Table 1). The plasma concentration of CRP was below 3 mg/l in 59 of the 60 samples, and wasunchanged by the antibiotic course (Table 1).
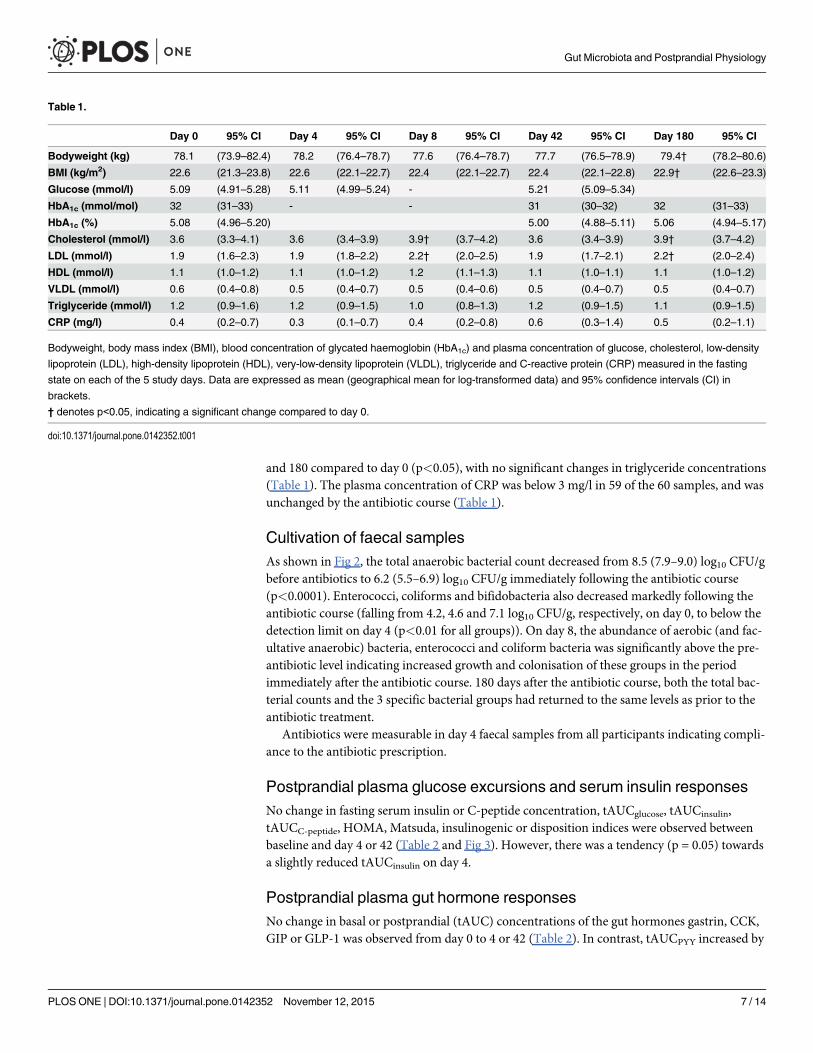
Cultivation of faecal samplesAs shown in Fig 2, the total anaerobic bacterial count decreased from 8.5 (7.9–9.0) log10 CFU/gbefore antibiotics to 6.2 (5.5–6.9) log10 CFU/g immediately following the antibiotic course(p<0.0001). Enterococci, coliforms and bifidobacteria also decreased markedly following theantibiotic course (falling from 4.2, 4.6 and 7.1 log10 CFU/g, respectively, on day 0, to below thedetection limit on day 4 (p<0.01 for all groups)). On day 8, the abundance of aerobic (and fac-ultative anaerobic) bacteria, enterococci and coliform bacteria was significantly above the pre-antibiotic level indicating increased growth and colonisation of these groups in the periodimmediately after the antibiotic course. 180 days after the antibiotic course, both the total bac-terial counts and the 3 specific bacterial groups had returned to the same levels as prior to theantibiotic treatment.
Antibiotics were measurable in day 4 faecal samples from all participants indicating compli-ance to the antibiotic prescription.
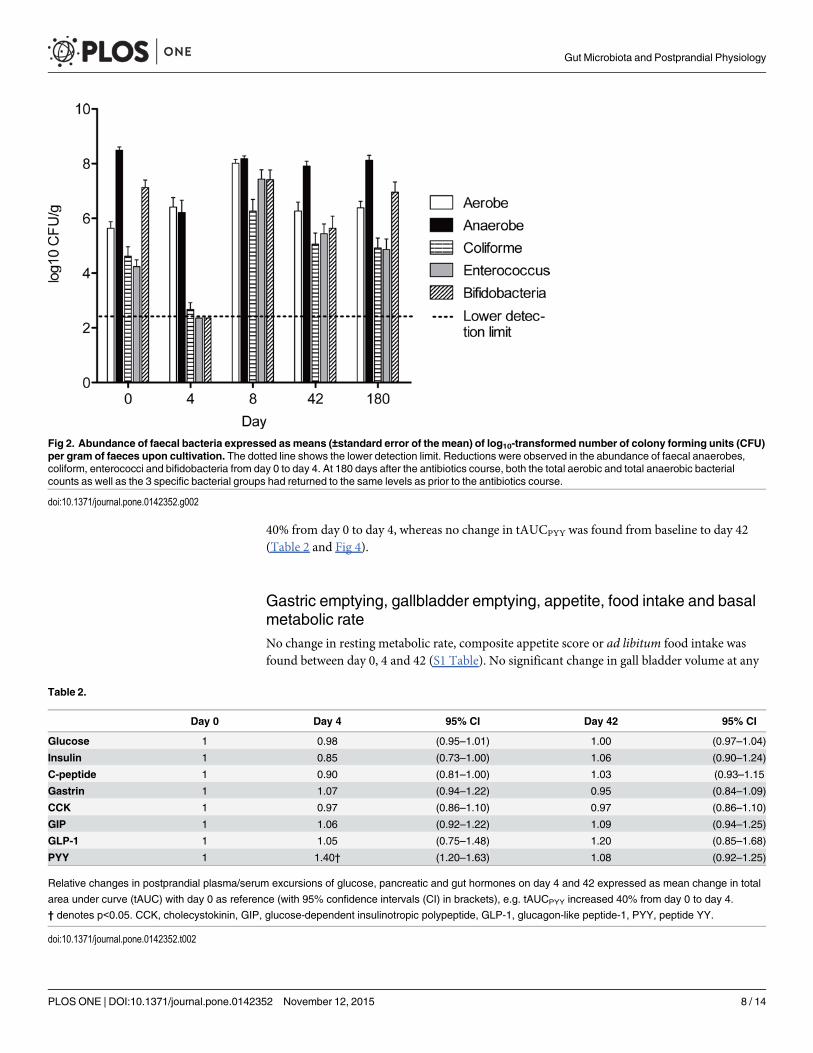
Postprandial plasma glucose excursions and serum insulin responsesNo change in fasting serum insulin or C-peptide concentration, tAUCglucose, tAUCinsulin,tAUCC-peptide, HOMA, Matsuda, insulinogenic or disposition indices were observed betweenbaseline and day 4 or 42 (Table 2 and Fig 3). However, there was a tendency (p = 0.05) towardsa slightly reduced tAUCinsulin on day 4.
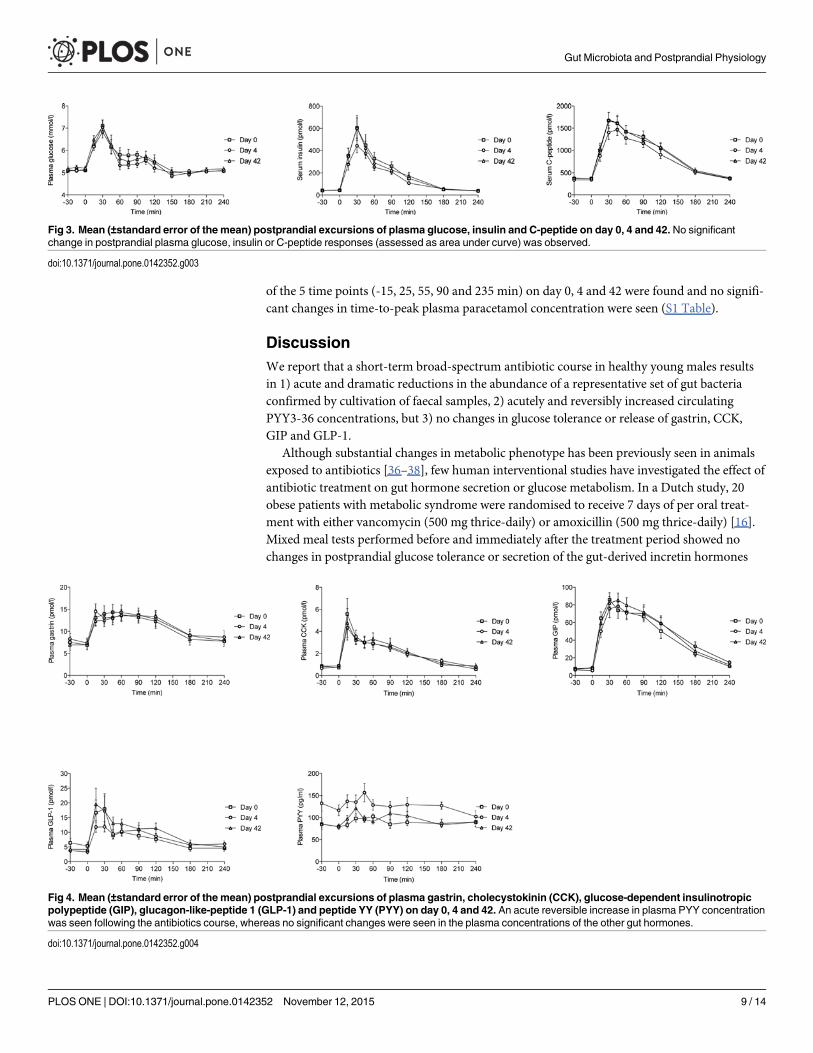
Postprandial plasma gut hormone responsesNo change in basal or postprandial (tAUC) concentrations of the gut hormones gastrin, CCK,GIP or GLP-1 was observed from day 0 to 4 or 42 (Table 2). In contrast, tAUCPYY increased by
Table 1.
Day 0 95% CI Day 4 95% CI Day 8 95% CI Day 42 95% CI Day 180 95% CI
Bodyweight (kg) 78.1 (73.9–82.4) 78.2 (76.4–78.7) 77.6 (76.4–78.7) 77.7 (76.5–78.9) 79.4† (78.2–80.6)
BMI (kg/m2) 22.6 (21.3–23.8) 22.6 (22.1–22.7) 22.4 (22.1–22.7) 22.4 (22.1–22.8) 22.9† (22.6–23.3)
Glucose (mmol/l) 5.09 (4.91–5.28) 5.11 (4.99–5.24) - 5.21 (5.09–5.34)
HbA1c (mmol/mol) 32 (31–33) - - 31 (30–32) 32 (31–33)
HbA1c (%) 5.08 (4.96–5.20) 5.00 (4.88–5.11) 5.06 (4.94–5.17)
Cholesterol (mmol/l) 3.6 (3.3–4.1) 3.6 (3.4–3.9) 3.9† (3.7–4.2) 3.6 (3.4–3.9) 3.9† (3.7–4.2)
LDL (mmol/l) 1.9 (1.6–2.3) 1.9 (1.8–2.2) 2.2† (2.0–2.5) 1.9 (1.7–2.1) 2.2† (2.0–2.4)
HDL (mmol/l) 1.1 (1.0–1.2) 1.1 (1.0–1.2) 1.2 (1.1–1.3) 1.1 (1.0–1.1) 1.1 (1.0–1.2)
VLDL (mmol/l) 0.6 (0.4–0.8) 0.5 (0.4–0.7) 0.5 (0.4–0.6) 0.5 (0.4–0.7) 0.5 (0.4–0.7)
Triglyceride (mmol/l) 1.2 (0.9–1.6) 1.2 (0.9–1.5) 1.0 (0.8–1.3) 1.2 (0.9–1.5) 1.1 (0.9–1.5)
CRP (mg/l) 0.4 (0.2–0.7) 0.3 (0.1–0.7) 0.4 (0.2–0.8) 0.6 (0.3–1.4) 0.5 (0.2–1.1)
Bodyweight, body mass index (BMI), blood concentration of glycated haemoglobin (HbA1c) and plasma concentration of glucose, cholesterol, low-density
lipoprotein (LDL), high-density lipoprotein (HDL), very-low-density lipoprotein (VLDL), triglyceride and C-reactive protein (CRP) measured in the fasting
state on each of the 5 study days. Data are expressed as mean (geographical mean for log-transformed data) and 95% confidence intervals (CI) in
brackets.
† denotes p<0.05, indicating a significant change compared to day 0.
doi:10.1371/journal.pone.0142352.t001
Gut Microbiota and Postprandial Physiology
PLOS ONE | DOI:10.1371/journal.pone.0142352 November 12, 2015 7 / 14
40% from day 0 to day 4, whereas no change in tAUCPYY was found from baseline to day 42(Table 2 and Fig 4).
Gastric emptying, gallbladder emptying, appetite, food intake and basalmetabolic rateNo change in resting metabolic rate, composite appetite score or ad libitum food intake wasfound between day 0, 4 and 42 (S1 Table). No significant change in gall bladder volume at any
Fig 2. Abundance of faecal bacteria expressed asmeans (±standard error of the mean) of log10-transformed number of colony forming units (CFU)per gram of faeces upon cultivation. The dotted line shows the lower detection limit. Reductions were observed in the abundance of faecal anaerobes,coliform, enterococci and bifidobacteria from day 0 to day 4. At 180 days after the antibiotics course, both the total aerobic and total anaerobic bacterialcounts as well as the 3 specific bacterial groups had returned to the same levels as prior to the antibiotics course.
doi:10.1371/journal.pone.0142352.g002
Table 2.
Day 0 Day 4 95% CI Day 42 95% CI
Glucose 1 0.98 (0.95–1.01) 1.00 (0.97–1.04)
Insulin 1 0.85 (0.73–1.00) 1.06 (0.90–1.24)
C-peptide 1 0.90 (0.81–1.00) 1.03 (0.93–1.15
Gastrin 1 1.07 (0.94–1.22) 0.95 (0.84–1.09)
CCK 1 0.97 (0.86–1.10) 0.97 (0.86–1.10)
GIP 1 1.06 (0.92–1.22) 1.09 (0.94–1.25)
GLP-1 1 1.05 (0.75–1.48) 1.20 (0.85–1.68)
PYY 1 1.40† (1.20–1.63) 1.08 (0.92–1.25)
Relative changes in postprandial plasma/serum excursions of glucose, pancreatic and gut hormones on day 4 and 42 expressed as mean change in total
area under curve (tAUC) with day 0 as reference (with 95% confidence intervals (CI) in brackets), e.g. tAUCPYY increased 40% from day 0 to day 4.
† denotes p<0.05. CCK, cholecystokinin, GIP, glucose-dependent insulinotropic polypeptide, GLP-1, glucagon-like peptide-1, PYY, peptide YY.
doi:10.1371/journal.pone.0142352.t002
Gut Microbiota and Postprandial Physiology
PLOS ONE | DOI:10.1371/journal.pone.0142352 November 12, 2015 8 / 14
of the 5 time points (-15, 25, 55, 90 and 235 min) on day 0, 4 and 42 were found and no signifi-cant changes in time-to-peak plasma paracetamol concentration were seen (S1 Table).
DiscussionWe report that a short-term broad-spectrum antibiotic course in healthy young males resultsin 1) acute and dramatic reductions in the abundance of a representative set of gut bacteriaconfirmed by cultivation of faecal samples, 2) acutely and reversibly increased circulatingPYY3-36 concentrations, but 3) no changes in glucose tolerance or release of gastrin, CCK,GIP and GLP-1.
Although substantial changes in metabolic phenotype has been previously seen in animalsexposed to antibiotics [36–38], few human interventional studies have investigated the effect ofantibiotic treatment on gut hormone secretion or glucose metabolism. In a Dutch study, 20obese patients with metabolic syndrome were randomised to receive 7 days of per oral treat-ment with either vancomycin (500 mg thrice-daily) or amoxicillin (500 mg thrice-daily) [16].Mixed meal tests performed before and immediately after the treatment period showed nochanges in postprandial glucose tolerance or secretion of the gut-derived incretin hormones
Fig 3. Mean (±standard error of the mean) postprandial excursions of plasma glucose, insulin and C-peptide on day 0, 4 and 42. No significantchange in postprandial plasma glucose, insulin or C-peptide responses (assessed as area under curve) was observed.
doi:10.1371/journal.pone.0142352.g003
Fig 4. Mean (±standard error of the mean) postprandial excursions of plasma gastrin, cholecystokinin (CCK), glucose-dependent insulinotropicpolypeptide (GIP), glucagon-like-peptide 1 (GLP-1) and peptide YY (PYY) on day 0, 4 and 42. An acute reversible increase in plasma PYY concentrationwas seen following the antibiotics course, whereas no significant changes were seen in the plasma concentrations of the other gut hormones.
doi:10.1371/journal.pone.0142352.g004
Gut Microbiota and Postprandial Physiology
PLOS ONE | DOI:10.1371/journal.pone.0142352 November 12, 2015 9 / 14
GIP and GLP-1, but hyperinsulinaemic euglycaemic clamps showed a slight decrease inperipheral insulin sensitivity in the group receiving vancomycin compared to no change in theamoxicillin group. In contrast, a recent follow-up to this study showed no difference in insulinsensitivity following vancomycin or amoxillin compared to placebo treatment in obese maleswith impaired glucose tolerance [39]. In line with the latter, we found no change in tAUCinsulin,tAUCC-peptide or HOMA, Matsuda or insulinogenic indices between study days in the presentstudy with a 4 day-duration of antibiotics intervention.
The gut microbiota has been suggested to affect host glucose metabolism by at least 4 differentmechanisms: Through modulation of the bile acid pool [16,40], stimulation of the innateimmune system [41], or by fermentation of complex carbohydrates to short-chain fatty acidsthat can either function directly as metabolic substrates or influence the secretion of gut hor-mones [42]. Regarding the first 2 mechanisms, we did not find any change in gallbladder volumeor emptying, and we saw no changes in CRP. In relation to the latter mechanism it was recentlyreported that germ-free rodents with low intestinal levels of short-chain fatty acids had higherexpression of proglucagon, higher GLP-1 levels and higher density of enteroendocrine L cells, thecell responsible for secretion of GLP-1 as well as PYY [43]. The high GLP-1 secretion was abol-ished upon bacterial colonisation of the germ free animals, but could be re-established by subject-ing conventionally raised rodents to a short course of broad-spectrum antibiotics expected toeradicate most of the gut bacteria [43]. Although PYY has well-established effects on appetitesensation and food intake, a direct effect of PYY on glucose metabolism remains controversial[44]. Increased secretion of PYY has previously been reported in patients with diarrhoea follow-ing gastrointestinal infection [45] and an important function of PYYmay be to limit nutrientand water excretion by reducing colonic transit time and fluid secretion [46,47]. In our study,several participants reported diarrhoea during the antibiotic course, and after completion of thecourse, plasma PYY concentrations were increased. It might therefore be hypothesised that theincreased PYY secretion is a physiologic response to limit water and nutrient loss following (anti-biotic-induced) diarrhoea. We saw a decrease in faecal abundance of short-chain fatty acid pro-ducing genera (bifidobacteria) [48] at the same time that plasma concentrations of PYY went up,raising the question of the role of short-chain fatty acids for this response. However, the generalbelief is that short-chain fatty acids stimulate L cell secretion [49] and perhaps it is ratherincreased exposure of the L cells with loose stool fluid containing other L cell stimulants (unab-sorbed nutrients or bile acids), that is responsible for the increased PYY secretion.
Several limitations of the current study should be addressed. Firstly, as we did not includean untreated comparison group, we cannot rule out random variation or study effects as expla-nations for the negative results or the observed differences between baseline and subsequentstudy days. The finding of a small increase in bodyweight on day 180 is in line with observa-tional studies reporting long-term increased risk of obesity following antibiotics [11,12,15,50],but could also reflect aging of the participants or seasonal variation [51]. The findings ofincreased plasma cholesterol concentrations on day 8 and 180, with no changes on day 4 and42 are not supported by previous studies, do not seem biologically meaningful and may resultfrom natural variation and/or slight deviations in study procedures on day 8 and 180 comparedto day 0, 4 and 42 (see methods). Secondly, the low participant number means a low statisticalpower for detecting small changes. However, the confidence intervals of the observed variables(Table 1 and Table 2) were generally narrow, indicating that we did not ignore a clinically rele-vant metabolic difference. Thirdly, for ethical reasons, considering the risk of antibiotic resis-tance development and the lack of knowledge about metabolic effects of antibiotics at the timeof the study initiation, we chose to employ a short-term antibiotics course. Although this anti-biotics course indeed led to dramatic acute changes in microbiota load and composition, wecannot exclude the possibility that other antibiotic courses could induce even more dramatic
Gut Microbiota and Postprandial Physiology
PLOS ONE | DOI:10.1371/journal.pone.0142352 November 12, 2015 10 / 14
effects on the gut microbiota, and subsequently could have more pronounced or sustained met-abolic effects. This possibility seems particularly plausible if antibiotics are given multipletimes, in higher dosages or during critical periods of life such as early life [12,38,50]. Lastly,although we found no long-term changes in the abundance of several common gut bacterialgroups, it is important to emphasize that compositional changes at the phylum, genus or spe-cies level will not be detected by the applied cultivation technique, nor did our investigationassess if metabolically relevant changes occurred in the gut microbiome.
Interestingly, we observed an increase in faecal abundance of several bacterial groups sub-acutely following antibiotics, which is in line with a recent human study using qPCR to assesschanges in gut microbiota following antibiotic treatment [9]. A likely explanation is that theincreased bacterial groups have occupied new ecological niches in the gut, which were madeavailable by the antibiotic treatment.
Conclusion and Future DirectionsAn acute reversible increase in the postprandial plasma level of the gut hormone PYY, but noclinically relevant changes in insulin sensitivity, insulin release or release of other gut hormoneswere seen following 4-day broad-spectrum antibiotics course in healthy young males. Therewas an apparent lack of association between substantial shifts in gut microbiota as evaluated bycultivation and overall unchanged metabolic variables, contrasting the current dogma, whichimplies the gut microbiota to be a key player in metabolic regulation. However, sustained orpronounced metabolic effects of antibiotics given in other dosages or to other populations can-not be excluded based on this study. In a recent population-based case-control study, exposureto narrow-spectrum antibiotics was more strongly associated with development of type 2 dia-betes, than exposure to general or broad-spectrum antibiotics [13]. Data on the long-term met-abolic effect of commonly used narrow-spectrum antibiotics (such asphenoxymethylpenicillin) therefore seems warranted.
Supporting InformationS1 TREND Checklist. TREND Checklist.(PDF)
S1 Fig. Study design. The study encompassed 5 study visits (arrows) and a 4-day 3-drug anti-biotic course. At all 5 study visits, bodyweight, height and blood pressure were measured,health questionnaires were completed and fasting blood samples and a faecal sample were col-lected. In addition, on 3 of the study days (day 0, 4 and 42) a standardised meal test withrepeated blood sampling was performed.(TIFF)
S1 File. Study protocol approved by ethical committee, in Danish.(DOCX)
S1 Protocol. Study protocol approved by ethical committee, in English.(DOCX)
S1 Table. Resting metabolic rate, gastric emptying, fasting and postprandial gallbladdervolumes, composite appetite score and food intake during ad libitum meal. No significantchanges were observed in any of the above variables from before to immediately after or 42days after the antibiotics course. Data shown as mean values (with 95% confidence intervals(CI)).(DOCX)
Gut Microbiota and Postprandial Physiology
PLOS ONE | DOI:10.1371/journal.pone.0142352 November 12, 2015 11 / 14
AcknowledgmentsWe are grateful to our volunteers whose availability made this work possible, to Jytte Purtoft,Nina Kjeldsen, Sisse M. Schmidt and Lene B. Albæk, for expert technical assistance, and to theAugustinus Foundation, the Aase og Ejnar Danielsen Foundation, the Toyota Foundation, andthe 3G Center (Danish Council for Strategic Research) for economical support to the study.This work was supported by research grants from the Novo Nordisk Foundation Center forBasic Metabolic Research, an independent Research Center at the University of Copenhagenpartially funded by an unrestricted donation from the Novo Nordisk Foundation.
Author ContributionsConceived and designed the experiments: KHMMF JR OBP TH JJH TV FKK. Performed theexperiments: KHM. Analyzed the data: KHMMIB TRL USJ JFR JJH. Contributed reagents/materials/analysis tools: MIB TRL USJ JFR JJH. Wrote the paper: KHMMFMIB TRL USJ JROP TH JFR JJH TV FKK.
References1. Qin J, Li Y, Cai Z, Li S, Zhu J, Zhang F, et al. A metagenome-wide association study of gut microbiota in
type 2 diabetes. Nature. 2012; 490: 55–60. doi: 10.1038/nature11450 PMID: 23023125
2. Karlsson FH, Tremaroli V, Nookaew I, Bergström G, Behre CJ, Fagerberg B, et al. Gut metagenome inEuropean women with normal, impaired and diabetic glucose control. Nature. 2013; 498: 99–103. doi:10.1038/nature12198 PMID: 23719380
3. Le Chatelier E, Nielsen T, Qin J, Prifti E, Hildebrand F, Falony G, et al. Richness of human gut micro-biome correlates with metabolic markers. Nature. 2013; 500: 541–546. doi: 10.1038/nature12506PMID: 23985870
4. Ridaura VK, Faith JJ, Rey FE, Cheng J, Duncan AE, Kau AL, et al. Gut Microbiota from Twins Discor-dant for Obesity Modulate Metabolism in Mice. Science. 2013; 341: 1241214–1241214. doi: 10.1126/science.1241214 PMID: 24009397
5. Vrieze A, Van Nood E, Holleman F, Salojärvi J, Kootte RS, Bartelsman JFWM, et al. Transfer of intesti-nal microbiota from lean donors increases insulin sensitivity in individuals with metabolic syndrome.Gastroenterology. 2012; 143: 913–916.e7. doi: 10.1053/j.gastro.2012.06.031 PMID: 22728514
6. Bäckhed F, Ding H, Wang T, Hooper LV, Koh GY, Nagy A, et al. The gut microbiota as an environmen-tal factor that regulates fat storage. Proc Natl Acad Sci U S A. 2004; 101: 15718–15723. doi: 10.1073/pnas.0407076101 PMID: 15505215
7. Jernberg C, Löfmark S, Edlund C, Jansson JK. Long-term ecological impacts of antibiotic administra-tion on the human intestinal microbiota. ISME J. 2007; 1: 56–66. doi: 10.1038/ismej.2007.3 PMID:18043614
8. Jakobsson HE, Jernberg C, Andersson AF, Sjölund-Karlsson M, Jansson JK, Engstrand L. Short-TermAntibiotic Treatment Has Differing Long-Term Impacts on the Human Throat and Gut Microbiome.2010; 5: e9836.
9. Panda S, El khader I, Casellas F, Lopez Vivancos J, Garcia Cors M, Santiago A, et al. Short-TermEffect of Antibiotics on Human Gut Microbiota. PLoS ONE. 2014; 9. doi: 10.1371/journal.pone.0095476PMID: 24748167
10. Dethlefsen L, Relman DA. Colloquium Paper: Incomplete recovery and individualized responses of thehuman distal gut microbiota to repeated antibiotic perturbation. Proc Natl Acad Sci. 2010; 108: 4554–4561. doi: 10.1073/pnas.1000087107 PMID: 20847294
11. Thuny F, Richet H, Casalta J-P, Angelakis E, Habib G, Raoult D. Vancomycin Treatment of InfectiveEndocarditis Is Linked with Recently Acquired Obesity. Bereswill S, editor. PLoS ONE. 2010; 5: e9074.doi: 10.1371/journal.pone.0009074 PMID: 20161775
12. Bailey LC, Forrest CB, Zhang P, Richards TM, Livshits A, DeRusso PA. Association of Antibiotics inInfancyWith Early Childhood Obesity. JAMA Pediatr. 2014; doi: 10.1001/jamapediatrics.2014.1539PMID: 25265089
13. Mikkelsen KH, Knop FK, Frost M, Hallas J, Pottegård A. Use of Antibiotics and Risk of Type 2 Diabetes:A Population-Based Case-Control Study. J Clin Endocrinol Metab. 2015; jc.2015–2696. doi: 10.1210/jc.2015-2696
Gut Microbiota and Postprandial Physiology
PLOS ONE | DOI:10.1371/journal.pone.0142352 November 12, 2015 12 / 14
14. Chou H-W, Wang J-L, Chang C-H, Lee J-J, ShauW-Y, Lai M-S. Risk of Severe Dysglycemia AmongDiabetic Patients Receiving Levofloxacin, Ciprofloxacin, or Moxifloxacin in Taiwan. Clin Infect Dis.2013; 57: 971–980. doi: 10.1093/cid/cit439 PMID: 23948133
15. Francois F, Roper J, Joseph N, Pei Z, Chhada A, Shak JR, et al. The effect of H. pylori eradication onmeal-associated changes in plasma ghrelin and leptin. BMCGastroenterol. 2011; 11: 37. doi: 10.1186/1471-230X-11-37 PMID: 21489301
16. Vrieze A, Out C, Fuentes S, Jonker L, Reuling I, Kootte RS, et al. Impact of oral vancomycin on gutmicrobiota, bile acid metabolism, and insulin sensitivity. J Hepatol. 2014; 60: 824–831. doi: 10.1016/j.jhep.2013.11.034 PMID: 24316517
17. Parker BA, Sturm K, MacIntosh CG, Feinle C, Horowitz M, Chapman IM. Relation between food intakeand visual analogue scale ratings of appetite and other sensations in healthy older and young subjects.Eur J Clin Nutr. 2004; 58: 212–218. doi: 10.1038/sj.ejcn.1601768 PMID: 14749739
18. Flint A, Raben A, Blundell JE, Astrup A. Reproducibility, power and validity of visual analogue scales inassessment of appetite sensations in single test meal studies. Int J Obes Relat Metab Disord J IntAssoc Study Obes. 2000; 24: 38–48.
19. Gregersen NT, Flint A, Bitz C, Blundell JE, Raben A, Astrup A. Reproducibility and power of ad libitumenergy intake assessed by repeated single meals. Am J Clin Nutr. 2008; 87: 1277–1281. PMID:18469250
20. Daneman N, Sarwar S, Fowler RA, Cuthbertson BH, SuDDICU Canadian Study Group. Effect of selec-tive decontamination on antimicrobial resistance in intensive care units: a systematic review and meta-analysis. Lancet Infect Dis. 2013; 13: 328–341. doi: 10.1016/S1473-3099(12)70322-5 PMID:23352693
21. D’Amico R, Pifferi S, Leonetti C, Torri V, Tinazzi A, Liberati A. Effectiveness of antibiotic prophylaxis incritically ill adult patients: systematic review of randomised controlled trials. BMJ. 1998; 316: 1275–1285. PMID: 9554897
22. Rao S, Kupfer Y, Pagala M, Chapnick E, Tessler S. Systemic absorption of oral vancomycin in patientswith Clostridium difficile infection. Scand J Infect Dis. 2011; 43: 386–388. doi: 10.3109/00365548.2010.544671 PMID: 21198337
23. Gemer O. Absorption of orally administered gentamicin in infants with diarrhea. Pediatr Pharmacol(New York). 1983; 3: 119–23.
24. Saito T. Possible Factors Involved in Oral Inactivity of Meropenem, a Carbapenem Antibiotic. Pharma-col Amp Pharm. 2012; 03: 201–206. doi: 10.4236/pp.2012.32027
25. Lewis SJ, Heaton KW. Stool form scale as a useful guide to intestinal transit time. Scand J Gastroen-terol. 1997; 32: 920–924. PMID: 9299672
26. WHO | Diarrhoea. In: WHO [Internet]. Available: http://www.who.int/topics/diarrhoea/en/. Accessed 20August 2013.
27. Orskov C, Rabenhøj L, Wettergren A, Kofod H, Holst JJ. Tissue and plasma concentrations of amidatedand glycine-extended glucagon-like peptide I in humans. Diabetes. 1994; 43: 535–539. PMID:8138058
28. Rehfeld JF. Accurate measurement of cholecystokinin in plasma. Clin Chem. 1998; 44: 991–1001.PMID: 9590372
29. Stadil F, Rehfeld JF. Determination of gastrin in serum. An evaluation of the reliability of a radioimmuno-assay. Scand J Gastroenterol. 1973; 8: 101–112. PMID: 4697070
30. Shipkova M, Petrova DT, Rosler AE, Orth M, Engelmayer J, Wieland E, et al. Comparability and impre-cision of 8 frequently used commercially available immunoassays for therapeutic drug monitoring. TherDrug Monit. 2014; 36: 433–441. doi: 10.1097/FTD.0000000000000043 PMID: 24646729
31. Rose SB, Miller RE. Studies with the Agar Cup-Plate Method: I. A Standardized Agar Cup-Plate Tech-nique. J Bacteriol. 1939; 38: 525–537. PMID: 16560269
32. DoddsWJ, GrohWJ, Darweesh RM, Lawson TL, Kishk SM, Kern MK. Sonographic measurement ofgallbladder volume. Am J Roentgenol. 1985; 145: 1009–1011.
33. Matsuda M, DeFronzo RA. Insulin sensitivity indices obtained from oral glucose tolerance testing: com-parison with the euglycemic insulin clamp. Diabetes Care. 1999; 22: 1462–1470. PMID: 10480510
34. Hanson RL, Pratley RE, Bogardus C, Narayan KV, Roumain JM, Imperatore G, et al. Evaluation of sim-ple indices of insulin sensitivity and insulin secretion for use in epidemioiogic studies. Am J Epidemiol.2000; 151: 190–198. PMID: 10645822
35. Utzschneider KM, Prigeon RL, Faulenbach MV, Tong J, Carr DB, Boyko EJ, et al. Oral DispositionIndex Predicts the Development of Future Diabetes Above and Beyond Fasting and 2-h Glucose Lev-els. Diabetes Care. 2009; 32: 335–341. doi: 10.2337/dc08-1478 PMID: 18957530
Gut Microbiota and Postprandial Physiology
PLOS ONE | DOI:10.1371/journal.pone.0142352 November 12, 2015 13 / 14
36. Membrez M, Blancher F, Jaquet M, Bibiloni R, Cani PD, Burcelin RG, et al. Gut microbiota modulationwith norfloxacin and ampicillin enhances glucose tolerance in mice. FASEB J Off Publ Fed Am Soc ExpBiol. 2008; 22: 2416–2426. doi: 10.1096/fj.07-102723
37. Carvalho BM, Guadagnini D, Tsukumo DML, Schenka AA, Latuf-Filho P, Vassallo J, et al. Modulationof gut microbiota by antibiotics improves insulin signalling in high-fat fed mice. Diabetologia. 2012; doi:10.1007/s00125-012-2648-4 PMID: 22828956
38. Cho I, Yamanishi S, Cox L, Methé BA, Zavadil J, Li K, et al. Antibiotics in early life alter the murinecolonic microbiome and adiposity. Nature. 2012; 488: 621–626. doi: 10.1038/nature11400 PMID:22914093
39. Reijnders D, Goosens G, Neis E, Van der Beek K, Most J, Holst J, et al. Effects of gut microbiota manip-ulation by antibiotics on host metabolism in obese humans. Poster presentation presented at: EMBLConference on the Human Microbiome; 2015 Jun; Heidelberg, Germany.
40. Sayin SI, Wahlström A, Felin J, Jäntti S, Marschall H-U, Bamberg K, et al. Gut Microbiota RegulatesBile Acid Metabolism by Reducing the Levels of Tauro-beta-muricholic Acid, a Naturally Occurring FXRAntagonist. Cell Metab. 2013; 17: 225–235. doi: 10.1016/j.cmet.2013.01.003 PMID: 23395169
41. Cani PD, Amar J, Iglesias MA, Poggi M, Knauf C, Bastelica D, et al. Metabolic endotoxemia initiatesobesity and insulin resistance. Diabetes. 2007; 56: 1761–1772. doi: 10.2337/db06-1491 PMID:17456850
42. Cummings JH, Pomare EW, BranchWJ, Naylor CP, Macfarlane GT. Short chain fatty acids in humanlarge intestine, portal, hepatic and venous blood. Gut. 1987; 28: 1221–1227. PMID: 3678950
43. Wichmann A, Allahyar A, Greiner TU, Plovier H, Lundén GÖ, Larsson T, et al. Microbial Modulation ofEnergy Availability in the Colon Regulates Intestinal Transit. Cell Host Microbe. 2013; 14: 582–590. doi:10.1016/j.chom.2013.09.012 PMID: 24237703
44. Woods SC, D’Alessio DA. Central Control of BodyWeight and Appetite. J Clin Endocrinol Metab. 2008;93: s37–s50. doi: 10.1210/jc.2008-1630 PMID: 18987269
45. El-Salhy M, Mazzawi T, Gundersen D, Hatlebakk JG, Hausken T. Changes in the symptom pattern andthe densities of large-intestinal endocrine cells following Campylobacter infection in irritable bowel syn-drome: a case report. BMC Res Notes. 2013; 6: 391. doi: 10.1186/1756-0500-6-391 PMID: 24073715
46. Wichmann A, Allahyar A, Greiner TU, Plovier H, Lundén GÖ, Larsson T, et al. Microbial Modulation ofEnergy Availability in the Colon Regulates Intestinal Transit. Cell Host Microbe. 2013; 14: 582–590. doi:10.1016/j.chom.2013.09.012 PMID: 24237703
47. Moriya R, Shirakura T, Hirose H, Kanno T, Suzuki J, Kanatani A. NPY Y2 receptor agonist PYY(3–36)inhibits diarrhea by reducing intestinal fluid secretion and slowing colonic transit in mice. Peptides.2010; 31: 671–675. doi: 10.1016/j.peptides.2009.11.005 PMID: 19925840
48. Roberfroid M, Gibson GR, Hoyles L, McCartney AL, Rastall R, Rowland I, et al. Prebiotic effects: meta-bolic and health benefits. Br J Nutr. 2010; 104 Suppl 2: S1–63. doi: 10.1017/S0007114510003363PMID: 20920376
49. Tolhurst G, Heffron H, Lam YS, Parker HE, Habib AM, Diakogiannaki E, et al. Short-Chain Fatty AcidsStimulate Glucagon-Like Peptide-1 Secretion via the G-Protein-Coupled Receptor FFAR2. Diabetes.2011; 61: 364–371. doi: 10.2337/db11-1019 PMID: 22190648
50. Trasande L, Blustein J, Liu M, Corwin E, Cox LM, Blaser MJ. Infant antibiotic exposures and early-lifebody mass. Int J Obes 2005. 2012; doi: 10.1038/ijo.2012.132
51. Visscher TLS, Seidell JC. Time trends (1993–1997) and seasonal variation in body mass index andwaist circumference in the Netherlands. Int J Obes. 2004; 28: 1309–1316. doi: 10.1038/sj.ijo.0802761
Gut Microbiota and Postprandial Physiology
PLOS ONE | DOI:10.1371/journal.pone.0142352 November 12, 2015 14 / 14