Embed Size (px)
DESCRIPTION
Click this research conducted by Mahendra Trivedi, and know more about the effect of biofield treatment on the physical and thermal characteristics of silicon, tin and lead powders.
Citation preview

Research Article Open Access
Trivedi et al., J Material Sci Eng 2013, 2:3http://dx.doi.org/10.4172/2169-0022.1000125
Research Article Open Access
Material Science & Engineering
Volume 2 • Issue 3 • 1000125J Material Sci EngISSN: 2169-0022 JME, an open access journal
Effect of Bio Field Treatment on the Physical and Thermal Characteristics of Silicon, Tin and Lead PowdersMahendra K Trivedi, Shrikant Patil* and Rama Mohan TallapragadaTrivedi foundation,14747 N Northsight Blvd, Suite 111-136, Scottsdale, AZ 85260, USA
*Corresponding author: Shrikant Patil, Trivedi foundation,14747 N Northsight Blvd, Suite 111-136, Scottsdale, AZ 85260, USA, E-mail: [email protected]
Received August 07, 2013; Accepted August 29, 2013; Published September 08, 2013
Citation: Trivedi MK, Patil S, Tallapragada RM (2013) Effect of Bio Field Treatment on the Physical and Thermal Characteristics of Silicon, Tin and Lead Powders. J Material Sci Eng 2: 125. doi:10.4172/2169-0022.1000125
Copyright: © 2013 Trivedi MK, et al. This is an open-access article distributed under the terms of the Creative Commons Attribution License, which permits unrestricted use, distribution, and reproduction in any medium, provided the original author and source are credited.
Keywords: Biofield; Particle size; X-ray diffraction; Silicon; Tin; Lead
IntroductionElectrical currents along with associated magnetic fields that are
complex and dynamic are present inside the bodies on many different scales most likely due to dynamical processes such as heart and brain function, blood and lymph flow, ion transport across cell membranes, and other biologic processes [1]. Bio field is a cumulative effect exerted by these fields of human body on the surroundings. Typically, it may act directly on molecular structures, changing the conformation of molecules in functionally significant ways as well as may transfer bio-information through energy signals interacting directly with the energy fields of life. At the balanced intersection of human and machine adaptation is found the optimally functioning brain-computer interface (BCI) [2]. Experiments are reported of BCI controlling a robotic quad copter in three-dimensional (3D) physical space using non invasive scalp electroencephalogram (EEG) in human subjects.
Mr. Mahendra. K. Trivedi is known to transform the characteristics of various living and non- living materials through bio field in his physical presence as well as through his thought intervention. The details of several scientific investigations and the results in the form of original data are reported elsewhere [3-7].
The present paper reports the changes in the characteristics of powders of group IV elements silicon, tin and lead after exposure to the bio field of Mr. Trivedi.
ExperimentalSilicon (-325 mesh), tin (-325 mesh) and lead (-200 mesh) powders
of Alpha Aesar are used in the present investigation. The purity of the powders is respectively 99.5, 99.8 and 99%. Both untreated and powders exposed to thought intervention of Mr. Trivedi at different times are characterized by Laser particle size analysis, Specific surface area (BET), X-ray Diffraction (XRD), Thermo Gravimetric Analysis (TGA), Differential Thermal Analysis (DTA) and Simultaneous Differential Thermal Analysis (SDTA).
Average particle size and size distribution are obtained using SYMPATEC HELOS-BF laser particle size analyzer with a detection range of 0.1 to 875 µm (micro meters). From the particle size distribution, d50 the average particle size and d99 (maximum particle size below which 99% of particles are present) for the control (untreated or as received powders) are taken as standard and are compared with the results obtained on four separately treated powders. Surface area determination is carried out using a SMART SORB 90 BET surface area analyzer with a measuring range of 0.2 to 1000 m2/g.
X-ray diffraction is carried out using a powder Phillips, Holland PW 1710 XRD system. A copper anode with nickel filter is used. The wavelength of the radiation is 1.54056 Å (10-10 m or 10-8 Cm). The data is obtained in the form of 2θ vs. Intensity chart as well as a detailed table containing 2θ°, d value Å, peak width 2θ°, peak intensity counts, relative Intensity %, etc. The‘d’ values are compared with standard JCPDS data base and the Miller Indices h, k and l for various 2θ° values are noted. The data are then analyzed using PowderX software to obtain lattice parameters and unit cell volume.
Thermo gravimetric analysis (TGA) and simultaneous differential thermal analysis (SDTA) combined analyses are carried for the tin and lead powders from room temperature to 400°C at a heating rate of 5°C/min in air. While for silicon powder thermo gravimetric analysis (TGA) and differential thermal analysis (SDTA) combined analysis are
AbstractSilicon, tin and lead powders belong to group IV in periodic table and exhibit decreasing semi conducting nature
towards the bottom of the group. These are very useful in producing non ferrous powder metallurgy components.
In the present investigation silicon, tin and lead powders are exposed to bio field. Both the exposed and unexposed powders are later characterized by various techniques. The average particle size, after an initial decrease is found to increase with increase in number of days after treatment although the size is lee than that exhibited by untreated powder, suggesting the operation of competing mechanisms fracture and sintering. The BET surface area increased slightly in silicon powder but did not change in tin and lead powders. SEM photographs showed that samples exposed to bio field after 20 days showed fracture paths and fractures at inter and intra particle boundaries in treated powders. Thermal analysis indicated a decrease in heat of reaction and decrease in mass in treated samples.
X-ray diffraction of the powder samples indicated both increase and decrease in crystallite size, unit cell volume and molecular weight of samples exposed to bio field even after 179 days.
These results indicate that the properties of the metallic powders can be controlled even up to atomic level by exposing to bio field.
Citation: Trivedi MK, Patil S, Tallapragada RM (2013) Effect of Bio Field Treatment on the Physical and Thermal Characteristics of Silicon, Tin and Lead Powders. J Material Sci Eng 2: 125. doi:10.4172/2169-0022.1000125
Page 2 of 7
Volume 2 • Issue 3 • 1000125J Material Sci EngISSN: 2169-0022 JME, an open access journal
carried out from room temperature to 1450°C at a heating rate of 40°C/min in air. Scanning Electron microscopy of untreated and treated powders is carried out using a JEOL JSM-6360 instrument.
ResultsParticle size and size distribution
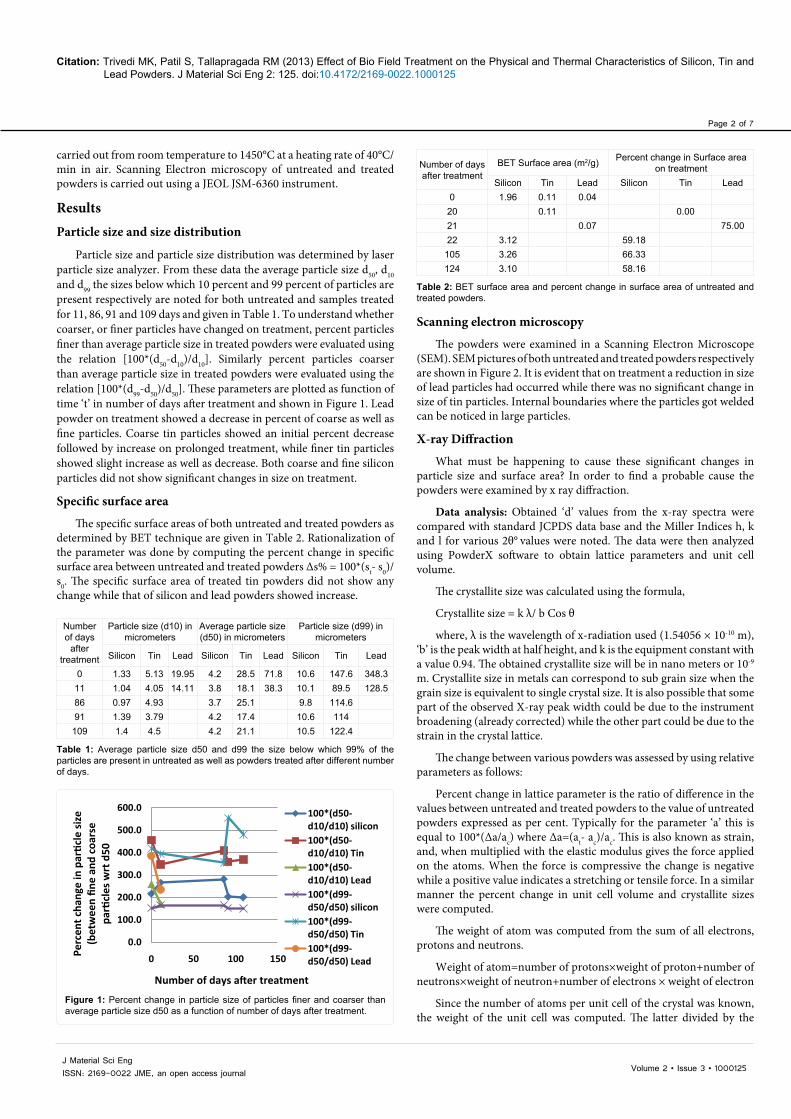
Particle size and particle size distribution was determined by laser particle size analyzer. From these data the average particle size d50, d10 and d99 the sizes below which 10 percent and 99 percent of particles are present respectively are noted for both untreated and samples treated for 11, 86, 91 and 109 days and given in Table 1. To understand whether coarser, or finer particles have changed on treatment, percent particles finer than average particle size in treated powders were evaluated using the relation [100*(d50-d10)/d10]. Similarly percent particles coarser than average particle size in treated powders were evaluated using the relation [100*(d99-d50)/d50]. These parameters are plotted as function of time ‘t’ in number of days after treatment and shown in Figure 1. Lead powder on treatment showed a decrease in percent of coarse as well as fine particles. Coarse tin particles showed an initial percent decrease followed by increase on prolonged treatment, while finer tin particles showed slight increase as well as decrease. Both coarse and fine silicon particles did not show significant changes in size on treatment.
Specific surface area
The specific surface areas of both untreated and treated powders as determined by BET technique are given in Table 2. Rationalization of the parameter was done by computing the percent change in specific surface area between untreated and treated powders Δs% = 100*(st- s0)/s0. The specific surface area of treated tin powders did not show any change while that of silicon and lead powders showed increase.
Scanning electron microscopy
The powders were examined in a Scanning Electron Microscope (SEM). SEM pictures of both untreated and treated powders respectively are shown in Figure 2. It is evident that on treatment a reduction in size of lead particles had occurred while there was no significant change in size of tin particles. Internal boundaries where the particles got welded can be noticed in large particles.
X-ray Diffraction
What must be happening to cause these significant changes in particle size and surface area? In order to find a probable cause the powders were examined by x ray diffraction.
Data analysis: Obtained ‘d’ values from the x-ray spectra were compared with standard JCPDS data base and the Miller Indices h, k and l for various 2θ° values were noted. The data were then analyzed using PowderX software to obtain lattice parameters and unit cell volume.
The crystallite size was calculated using the formula,
Crystallite size = k λ/ b Cos θ
where, λ is the wavelength of x-radiation used (1.54056 × 10⁻¹⁰ m), ‘b’ is the peak width at half height, and k is the equipment constant with a value 0.94. The obtained crystallite size will be in nano meters or 10-9 m. Crystallite size in metals can correspond to sub grain size when the grain size is equivalent to single crystal size. It is also possible that some part of the observed X-ray peak width could be due to the instrument broadening (already corrected) while the other part could be due to the strain in the crystal lattice.
The change between various powders was assessed by using relative parameters as follows:
Percent change in lattice parameter is the ratio of difference in the values between untreated and treated powders to the value of untreated powders expressed as per cent. Typically for the parameter ‘a’ this is equal to 100*(Δa/ac) where Δa=(at- ac)/ac. This is also known as strain, and, when multiplied with the elastic modulus gives the force applied on the atoms. When the force is compressive the change is negative while a positive value indicates a stretching or tensile force. In a similar manner the percent change in unit cell volume and crystallite sizes were computed.
The weight of atom was computed from the sum of all electrons, protons and neutrons.
Weight of atom=number of protons×weight of proton+number of neutrons×weight of neutron+number of electrons × weight of electron
Since the number of atoms per unit cell of the crystal was known, the weight of the unit cell was computed. The latter divided by the
0.0
100.0
200.0
300.0
400.0
500.0
600.0
0 50 100 150Perc
ent c
hang
e in
partic
le s
ize
(bet
wee
n fin
e an
d co
arse
pa
rticl
es w
rt d
50
Number of days after treatment
100*(d50-d10/d10) silicon100*(d50-d10/d10) Tin100*(d50-d10/d10) Lead100*(d99-d50/d50) silicon100*(d99-d50/d50) Tin100*(d99-d50/d50) Lead
Figure 1: Percent change in particle size of particles finer and coarser than average particle size d50 as a function of number of days after treatment.
Number of days
after treatment
Particle size (d10) in micrometers
Average particle size (d50) in micrometers
Particle size (d99) in micrometers
Silicon Tin Lead Silicon Tin Lead Silicon Tin Lead
0 1.33 5.13 19.95 4.2 28.5 71.8 10.6 147.6 348.311 1.04 4.05 14.11 3.8 18.1 38.3 10.1 89.5 128.586 0.97 4.93 3.7 25.1 9.8 114.691 1.39 3.79 4.2 17.4 10.6 114109 1.4 4.5 4.2 21.1 10.5 122.4
Table 1: Average particle size d50 and d99 the size below which 99% of the particles are present in untreated as well as powders treated after different number of days.
Number of days after treatment
BET Surface area (m2/g) Percent change in Surface area on treatment
Silicon Tin Lead Silicon Tin Lead0 1.96 0.11 0.04
20 0.11 0.0021 0.07 75.0022 3.12 59.18
105 3.26 66.33124 3.10 58.16
Table 2: BET surface area and percent change in surface area of untreated and treated powders.

Citation: Trivedi MK, Patil S, Tallapragada RM (2013) Effect of Bio Field Treatment on the Physical and Thermal Characteristics of Silicon, Tin and Lead Powders. J Material Sci Eng 2: 125. doi:10.4172/2169-0022.1000125
Page 3 of 7
Volume 2 • Issue 3 • 1000125J Material Sci EngISSN: 2169-0022 JME, an open access journal
volume of the unit cell gives the theoretical density. Since the volume of unit cell of the powder changes on treatment, the density as well as weight of atom will also change.
The weight of the atom when multiplied by the Avogadro’s number (6.023×10²³) gives the atomic weight (M) or the weight of a gram atom of the substance. The ratio difference in atomic weight between untreated and treated samples to the atomic weight of untreated sample was then expressed as per cent change in atomic weight. Typically this is same as 100×(ΔM/Mc) where ΔM=(Mt-Mc)/Mc. This value also represents the percent change in sum of weights of protons and neutrons in the nucleus.
The percent change in positive charge per unit volume of the atom was computed as follows;
The atomic radius was obtained by dividing the lattice parameter ‘a’ with 2.
r = a/2
Then the volume of the atom was obtained by assuming it to be spherical V = 4πr3/3
The positive charge per unit volume of the atom was computed by multiplying the number of protons (p) in the atom with elementary charge 1.6×10⁻¹⁹ coulombs and then by dividing with the volume of the atom. The percent change in positive charge per unit volume ΔZ between untreated and treated powders was then obtained as
ΔZ% = 100(Zt+-Zc+)/Zc+
Results of XRD: The results of XRD obtained after data analysis
are given in Tables 3a-3d. Variation in percent change in unit cell volume and percent change in atomic weight with number of days after treatment (Table 3a, 3c and Figure 3) showed similar behavior for all the powders. An initial increase followed by decrease in case of lead powders, while the reverse this initial decrease followed by increase in case of silicon and tin powders. Percent nuclear charge per unit volume of atom showed exactly opposite variation. An initial decrease followed by increase in case of lead powders, and initial increase followed by decrease in case of silicon and tin powders (Figure 4). The variation in crystallite size is shown in Figure 5. Lead powder showed an initial decrease followed by increase. Silicon powders showed a continuous decrease followed by a steady crystallite size corresponding to that exhibited by untreated powders. Tin powders showed a decrease followed by increase reaching a steady state crystallite size.
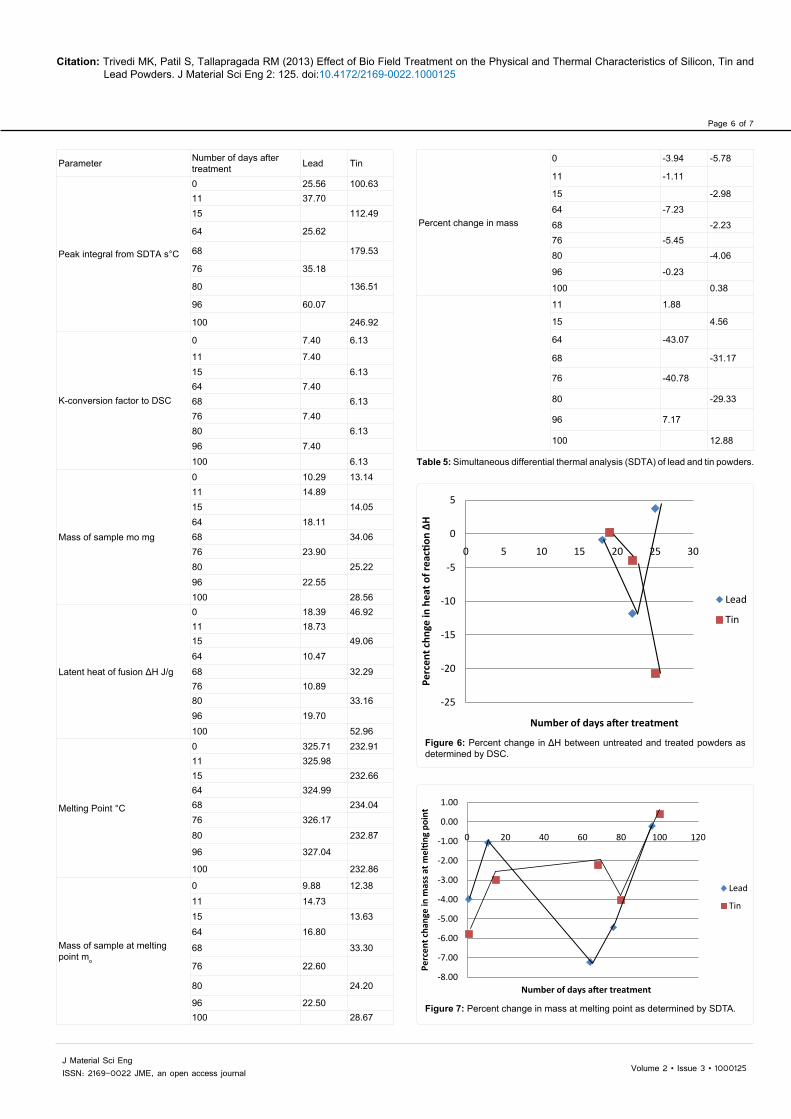
Results of thermal analysis: Change in thermal characteristics of treated lead and tin powders in nitrogen atmosphere and air were studied using DSC and SDTA respectively (Table 4 and 5). DSC results indicated no significant change in melting point. The latent heat of fusion (ΔH) in treated lead and tin powders had decreased up to a maximum of 11.85 and 20.71%. The percent change in ΔH between untreated and treated powders is shown in Figure 6. The percent change in mass between the initial powders and the powders at respective melting points (Figure 7) as well as the percent change in equivalent ΔH (as measured by SDTA in air) between untreated and treated powders is shown in Figure 8. The mass at melting point in both lead and tin powders had decreased up to 7.23 and 5.78% respectively indicating vaporization. The equivalent latent heat of fusion in treated lead and tin powders had decreased up to a maximum of 43.07 and
(a) Lead powder untreated (b) Lead powder treated
(c) Tin powder untreated (d) Tin powder treated
Figure 2: Scanning electron micrographs of untreated and treated lead and tin powders.

Citation: Trivedi MK, Patil S, Tallapragada RM (2013) Effect of Bio Field Treatment on the Physical and Thermal Characteristics of Silicon, Tin and Lead Powders. J Material Sci Eng 2: 125. doi:10.4172/2169-0022.1000125
Page 4 of 7
Volume 2 • Issue 3 • 1000125J Material Sci EngISSN: 2169-0022 JME, an open access journal
31.17% respectively. The decrease in latent heat of fusion in all the treated powders without significant change in melting temperature suggests that the powders are already in a high energy state prior to melting.
DiscussionsParticle can be single crystals or poly crystalline. In the later case
the grain boundaries (boundaries between adjacent single crystals) are
the structural weak points and can fracture under stress reducing the particle size. However, the fracture of particles creates fresh surfaces which are amenable for cold welding of such surfaces increasing the particle size. Thus changes in particle size are alternately attributed to fracture, creation of fresh particle surfaces and welding. This kind of behavior is exhibited by tin particles. Silicon being covalent bonded is strong and showed least deformation of coarse particles while deformation along cleavage planes may have contributed to increase in
Number of days after treatmentVolume of unit cell × 10^-24 Cm3 Percent change in volume of unit cell
Silicon Tin Lead Silicon Tin LeadControl 0 158.81 108.06 121.94
Treated T1 69 158.97 0.09667 108.46 0.366
7 121.83 -0.090
Treated T2 133 158.9 108.06 0.055 -0.004
Treated T3 157 158.94 0.081
164 108.2 0.130
38 122.03 0.071
Treated T4 179 158.97 0.100
178 108.51 0.415
48 121.97 0.020
Table 3a: Volume of the unit cell, and percent change in volume for control and treated powders.
Number of days after treatmentEffective nuclear charge per unit volume of the atom
(Coulombs/Cm3) × 103 Percent change in effective nuclear charge
Silicon Tin Lead Silicon Tin Lead
Control 0 26.93 77.18 205.4
Treated T1 69 26.90 -0.096
67 76.76 -0.547
7 205.6 0.091
Treated T2 133 26.92 77.18 -0.055 0.006
Treated T3 157 26.91 -0.081
164 77.03 -0.195
38 205.3 -0.070
Treated T4 179 26.90 -0.100
178 76.70 -0.619
48 205.4 -0.019
Table 3b: Effective nuclear charge per unit volume of the atom, and percent change in this parameter for control and treated powders.
Number of days after treatmentAtomic weight
(Grams/gram atom) Percent change in atomic weight
Silicon Tin Lead Silicon Tin Lead
Control 0 28.24 120.029 208.797
Treated T1 69 28.267 0.096
67 120.469 0.3667 208.608 -0.090
Treated T2 133 28.255 120.025 0.055 -0.004
Treated T3 157 28.262 0.081
164 120.186 0.130
38 208.944 0.071
Treated T4 179 28.268 0.100
178 120.527 0.415
48 208.838 0.020
Table 3c: Atomic weight and percent change in atomic weight for control and treated powders.

Citation: Trivedi MK, Patil S, Tallapragada RM (2013) Effect of Bio Field Treatment on the Physical and Thermal Characteristics of Silicon, Tin and Lead Powders. J Material Sci Eng 2: 125. doi:10.4172/2169-0022.1000125
Page 5 of 7
Volume 2 • Issue 3 • 1000125J Material Sci EngISSN: 2169-0022 JME, an open access journal
size of fine particles. Lead being the weakest material showed decrease in size of both fine and coarse particles.
These results are also in agreement with increased surface area. The existence of internal particle boundaries and fracturing of coarse particles into finer ones will certainly increase the surface as observed. Scanning electron micrographs of treated lead powder showed fractured particles and internal boundaries that may have contributed to increased surface area.
X-ray diffraction of treated silicon and tine powders showed decreased unit cell volume and atomic weight while it increased the percent change in nuclear charge per unit volume of atom. Decrease in nuclear charge per unit volume indicates increase in atomic volume or decrease in number of positively charged protons. This reduced charge will attract the neighbouring atoms with lesser force thus increasing the unit cell and crystallite size as was observed in the present experiments. The interesting result observed in the present experiments is that the percent change in atomic weight is inversely proportional to percent change in nuclear charge per unit volume of atom and vice versa. This is only possible if protons are converted to neutrons and vice versa. That is bio energy mediates energy conversion to mass and mass conversion to energy through interchange of protons and neutrons.
ConclusionsBio field exerted by Mr. Trivedi on aluminium metal powders had
caused the following effects:
1. Changes in particle size of powders on treatment are alternately attributed to fracture, creation of fresh particle surfaces and welding.
2. The specific surface area of the treated powders had increased with increase in number of days after treatment which was also consistent with decreased percent of coarser particles.
3. Scanning electron microscopy indicated internal boundaries and angular particles thus justifying the observed decrease in surface area.
4. Results of X-ray diffraction had showed that treatment with bio field had decreased the percent change in both unit cell volume and atomic weight while it increased the percent change in
Number of days after treatment
Crystallite size × 10-9 m Percent change in crystallite size
Silicon Tin Lead Silicon Tin Lead
Control 0 71.1 107.67 71.6
Treated T1 69 106.7 50
67 143.41 33.27
7 85.9 20Treated T2 133 85.3 107.6 20 -0.01Treated T3 157 71.1 0
164 143.44 33.2938 53.7 -25
Treated T4 179 71.1 0
178 143.49 33.25
48 61.4 -14.3
Table 3d: Crystallite size and percent change in crystallite size of control and treated powders.
-0.2
-0.1
0
0.1
0.2
0.3
0.4
0.5
0 50 100 150 200
Perc
ent c
hang
e in
vol
ume
of u
nit c
ell
Number of days after treatment
Silicon
Tin
Lead
Figure 3: Percentage change in volume of unit cell of treated powders.
-0.7
-0.6
-0.5
-0.4
-0.3
-0.2
-0.1
0
0.1
0.2
0 50 100 150 200
Perc
ent c
hang
e in
effe
ctive
nuc
lear
ch
arge
Number of days after treatment
Silicon
Tin
Lead
Figure 4: Percentage change in effective nuclear charge per unit volume of the atom.
-30
-20
-10
0
10
20
30
40
50
60
0 50 100 150 200
Perc
ent c
hang
e in
cry
stal
lite
size
Number of days after treatment
Silicon
Tin
Lead
Figure 5: Percentage change in crystallite size in treated powders.
Parameter Number of days after treatment Lead TinΔH J/g 0 21.18 56.60
18 20.9919 56.7422 18.67 54.3725 21.97 44.88
Percent change in ΔH 18 -0.9019 0.2522 -11.85 -3.9425 3.73 -20.71
Table 4: Differential scanning calorimetry of lead and tin powders.
Citation: Trivedi MK, Patil S, Tallapragada RM (2013) Effect of Bio Field Treatment on the Physical and Thermal Characteristics of Silicon, Tin and Lead Powders. J Material Sci Eng 2: 125. doi:10.4172/2169-0022.1000125
Page 6 of 7
Volume 2 • Issue 3 • 1000125J Material Sci EngISSN: 2169-0022 JME, an open access journal
Parameter Number of days after treatment Lead Tin
Peak integral from SDTA s°C
0 25.56 100.6311 37.7015 112.49
64 25.62
68 179.53
76 35.18
80 136.51
96 60.07
100 246.92
K-conversion factor to DSC
0 7.40 6.13
11 7.4015 6.1364 7.4068 6.1376 7.4080 6.1396 7.40100 6.13
Mass of sample mo mg
0 10.29 13.1411 14.8915 14.0564 18.1168 34.0676 23.9080 25.2296 22.55100 28.56
Latent heat of fusion ΔH J/g
0 18.39 46.9211 18.7315 49.0664 10.4768 32.2976 10.8980 33.1696 19.70100 52.96
Melting Point °C
0 325.71 232.9111 325.9815 232.6664 324.9968 234.0476 326.1780 232.87
96 327.04
100 232.86
Mass of sample at melting point mo
0 9.88 12.38
11 14.7315 13.6364 16.80
68 33.30
76 22.60
80 24.20
96 22.50100 28.67
Percent change in mass
0 -3.94 -5.78
11 -1.11
15 -2.98
64 -7.23
68 -2.2376 -5.4580 -4.06
96 -0.23
100 0.38
11 1.88
15 4.56
64 -43.07
68 -31.17
76 -40.78
80 -29.33
96 7.17
100 12.88
Table 5: Simultaneous differential thermal analysis (SDTA) of lead and tin powders.
-25
-20
-15
-10
-5
0
5
0 5 10 15 20 25 30
Perc
ent c
hnge
in h
eat o
f rea
ction
ΔH
Number of days after treatment
Lead
Tin
Figure 6: Percent change in ΔH between untreated and treated powders as determined by DSC.
-8.00
-7.00
-6.00
-5.00
-4.00
-3.00
-2.00
-1.00
0.00
1.00
0 20 40 60 80 100 120
Perc
ent c
hang
e in
mas
s at m
eltin
g po
int
Number of days after treatment
Lead
Tin
Figure 7: Percent change in mass at melting point as determined by SDTA.

Citation: Trivedi MK, Patil S, Tallapragada RM (2013) Effect of Bio Field Treatment on the Physical and Thermal Characteristics of Silicon, Tin and Lead Powders. J Material Sci Eng 2: 125. doi:10.4172/2169-0022.1000125
Page 7 of 7
Volume 2 • Issue 3 • 1000125J Material Sci EngISSN: 2169-0022 JME, an open access journal
nuclear charge per unit volume of atom. These results suggest that bio energy had mediated energy conversion to mass and mass conversion to energy through interchange of protons and neutrons in the nucleus.
5. Thermal analysis of the tin and lead powders indicated a decrease in latent heat of fusion in all the treated powders without significant change in melting temperature, suggesting that the powders were already in a high energy state prior to melting.
-50
-40
-30
-20
-10
0
10
20
0 20 40 60 80 100 120
Perc
ent c
hang
e in
ΔH
Number of days after treatment
Lead
Tin
Figure 8: Percent change in ΔH as determined by SDTA.
Acknowledgement
We thank the staff of various laboratories for conducting various characterization experiments. We thank Dr. Cheng Dong of NLSC, Institute of Physics, and Chinese academy of Sciences for permitting us to use PowderX software for analyzing XRD results.
References
1. Rubik B (1994) Bioelectromagnetics applications in medicine. Alternative medicine: expanding medical horizons: a report to the National Institutes of Health on alternative medical systems and practices in the United States (NIH publication no. 94-066). US Government Printing Office, Washington DC, USA.
2. LaFleur K, Cassady K, Doud A, Shades K, Rogin E, et al. (2013) Quadcopter control in three-dimensional space using a noninvasive motor imagery-based brain–computer interface. J Neural Eng.
3. http://www.trivediscience.com/materials-science/
4. Trivedi MK, Tallapragada RM (2008) A transcendental to changing metal powder characteristics. Met Pow Rep 63: 22-28, 31.
5. Dabhade VV, Trivedi MK, Tallapragada RM (2009) Effect of external energy on the atomic, crystalline, and powder characteristics of antimony and bismuth. Bull Mat Sci 32: 5471-5479.
6. Trivedi MK, Tallapragada RM (2009) Effect of super consciousness external energy on atomic, crystalline and powder characteristics of carbon allotrope powders. Mat Res Inno 13: 473-480.
7. Trivedi MK, Patil S, Tallapragada RM (2013) Effect of Bio Field Treatment on the Physical and Thermal Characteristics of Vanadium Pentoxide Powders. J Material Sci Eng S11: 001.
Submit your next manuscript and get advantages of OMICS Group submissionsUnique features:
• Userfriendly/feasiblewebsite-translationofyourpaperto50world’sleadinglanguages• AudioVersionofpublishedpaper• Digitalarticlestoshareandexplore
Special features:
• 250OpenAccessJournals• 20,000editorialteam• 21daysrapidreviewprocess• Qualityandquickeditorial,reviewandpublicationprocessing• IndexingatPubMed(partial),Scopus,EBSCO,IndexCopernicusandGoogleScholaretc• SharingOption:SocialNetworkingEnabled• Authors,ReviewersandEditorsrewardedwithonlineScientificCredits• Betterdiscountforyoursubsequentarticles
Submityourmanuscriptat:http://www.omicsgroup.org/journals/submission
Citation: Trivedi MK, Patil S, Tallapragada RM (2013) Effect of Bio Field Treatment on the Physical and Thermal Characteristics of Silicon, Tin and Lead Powders. J Material Sci Eng 2: 125. doi:10.4172/2169-0022.1000125