Embed Size (px)
Citation preview

University of Arkansas, FayettevilleScholarWorks@UARK
Theses and Dissertations
12-2018
Effect of Cement Content on ConcretePerformanceCaleb Joshua LeBowUniversity of Arkansas, Fayetteville
Follow this and additional works at: https://scholarworks.uark.edu/etd
Part of the Civil Engineering Commons, and the Structural Engineering Commons
This Thesis is brought to you for free and open access by ScholarWorks@UARK. It has been accepted for inclusion in Theses and Dissertations by anauthorized administrator of ScholarWorks@UARK. For more information, please contact [email protected], [email protected].
Recommended CitationLeBow, Caleb Joshua, "Effect of Cement Content on Concrete Performance" (2018). Theses and Dissertations. 3000.https://scholarworks.uark.edu/etd/3000

Effect of Cement Content on Concrete Performance
A thesis submitted in partial fulfillment of the requirements for the degree of
Master of Science in Civil Engineering
by
Caleb LeBow University of Arkansas
Bachelor of Science in Civil Engineering, 2017
December 2018 University of Arkansas
This thesis is approved for recommendation to the Graduate Council.
_______________________________ W. Micah Hale, PhD Thesis Director
_______________________________ Gary Prinz, PhD Committee Member
____________________________ Cameron Murray, PhD Committee Member

Abstract
Of all the traditional concrete materials, portland cement has the greatest impact on
mixture cost and the environment. Cement is in many ways the glue holding concrete together
(Weiss, 1999), and as such, it plays a major role in fresh and hardened concrete properties.
Without the proper range of cement in the mixture, low strength development or excessive
shrinkage may occur leading to premature deterioration. The Arkansas Department of
Transportation (ARDOT) recognizes two types of concrete for use in bridge construction, Class
S and Class S(AE). This paper focuses on the findings from testing of Class S(AE) concrete,
short for Class S air entrained, as it is the primary concrete used in the construction of bridge
decks within the state. The goal of this project is to investigate the possibility of reducing cement
content in Class S(AE) mix designs while maintaining required ARDOT specifications for fresh
and hardened concrete. The testing program included varying cementitious material content,
Class C fly ash percentage, and water to cementitious material ratio (w/cm).

Acknowledgments
I am thankful foremost for Christ, His grace, and the opportunity to pursue my masters.
I would like to express my appreciation and respect to my advisor Dr. Micah Hale for his
guidance, keen insight, and patience for my many questions. I also want to thank Dr. Gary Prinz
and Dr. Cameron Murray for serving on my committee and being so helpful both in the lab and
the classroom.
Special thanks go to the many students who work in the lab with me each day. Particularly,
thank you Casey Jones, Remington Reed, and Gabe Cook. From helping to increase my
knowledge of concrete to simply providing good advice on my PowerPoint slides, your hard
work and kind spirits were very encouraging.
Finally, I have been blessed to have such a generous and understanding family. Though you may
not find concrete nearly as interesting as I do, I am thankful to have you all in my life and I
appreciate your confused nodding for the many times I have droned on about fly ash. Most
especially, thank you my beautiful and lovely wife Vanessa. Your support has given me much
strength and I am thankful to call you mine. This research and all my schooling, undergraduate
through where I stand now, would not have been possible without you all.

Table of Contents
1. Introduction ................................................................................................................................. 1
1.1. Need for Research ................................................................................................................ 1
1.2. Goal of Research .................................................................................................................. 3
2. Literature Review .......................................................................................................................... 4
2.1. Mix Proportioning ................................................................................................................... 4
2.2. Cement ................................................................................................................................... 5
2.2.1. Cement Content and Workability ...................................................................................... 5
2.2.2. Cement Content and Compressive Strength ...................................................................... 6
2.2.3. Cement Content and Drying Shrinkage ............................................................................. 6
2.2.4. Cement Content and Durability ......................................................................................... 7
2.3. Prior Research .......................................................................................................................... 7
2.4. Summary ........................................................................................................................... 9
3. Investigation ..................................................................................................................................... 10
3.1. Scope ................................................................................................................................. 10
3.2. Materials ............................................................................................................................. 11
3.3. Procedure .............................................................................................................................. 13
3.3.1. Mix Proportions and Testing ............................................................................................ 13
3.3.2. Batching .................................................................................................................. 15
3.3.3. Curing ...................................................................................................................... 16
3.3.4. Fresh and Hardened Property Tests ................................................................................ 17
4. Results ............................................................................................................................................ 22
4.1. Goal ..................................................................................................................................... 22
4.2. Fresh Properties ................................................................................................................. 22
4.3. Hardened Properties ......................................................................................................... 26
4.3.1. Compressive Strength ......................................................................................... 26
4.3.1.1. Cement Content and Strength ............................................................................. 26
4.3.1.2. Fly Ash Content and Compressive Strength ...................................................... 27
4.3.1.3. Compressive Strength Results ............................................................................ 30
4.3.2. Drying Shrinkage .................................................................................................... 30
4.3.2.1. Cement Content and Drying Shrinkage ................................................................ 30
4.3.2.2. Fly Ash and Drying Shrinkage ............................................................................. 32

4.3.2.3. Drying Shrinkage Results .................................................................................... 36 4.3.3. Additional Testing ................................................................................................... 36 4.4. Potential Savings ............................................................................................................ 40
5. Conclusion ................................................................................................................................ 42
References ................................................................................................................................ 43

List of Figures
Figure 1.1. States polled for early age concrete cracking (Aktan et al., 2003) ............................... 3
Figure 2.1. Relationship of concrete compressive strength and cementitious content (Mehta and Monteiro, 2006) .............................................................................................................................. 6
Figure 3.1. Drying Shrinkage specimen ....................................................................................... 17
Figure 3.2. Compressive Strength specimen ................................................................................ 17
Figure 3.3. Compressive Strength testing .................................................................................... 18
Figure 3.4. Shrinkage Prism testing .............................................................................................. 19
Figure 3.5. Modulus of Elasticity testing ...................................................................................... 20
Figure 3.6. Rapid Chloride Ion Permeability testing .................................................................... 21
Figure 4.1. Cement only compressive strengths ........................................................................... 27
Figure 4.2. Mixes with 611 lb/yd3 compressive strengths ...………………………………..….. 28
Figure 4.3. Mixes with 564 lb/yd3 compressive strengths ...………………………………..….. 29
Figure 4.4. Mixes with 517 lb/yd3 compressive strengths ...………………………………..….. 29
Figure 4.5. Concrete mixture with 611 lb/yd3 and 0% fly ash ..................................................... 31
Figure 4.6. Concrete mixture with 564 lb/yd3 and 0% fly ash ..................................................... 32
Figure 4.7. Concrete mixture with 517 lb/yd3 and 0% fly ash ..................................................... 32
Figure 4.8. Concrete mixture with 611 lb/yd3 and 20% fly ash ................................................... 33
Figure 4.9. Concrete mixture with 564 lb/yd3 and 20% fly ash ................................................... 34
Figure 4.10. Concrete mixture with 517 lb/yd3 and 20% fly ash ................................................. 34
Figure 4.11. Concrete mixture with 611 lb/yd3 and 30% fly ash ................................................. 35
Figure 4.12. Concrete mixture with 564 lb/yd3 and 30% fly ash ................................................. 35
Figure 4.13. Concrete mixture with 517 lb/yd3 and 30% fly ash ................................................. 36
Figure 4.14. Measured Modulus of Elasticity versus prediction equations .................................. 38
Figure 4.15. Measured Non Resistivity compared to standards ................................................... 39

List of Tables
Table 1.1. Class S (AE) ARDOT Concrete Mix Requirements ...................................................... 2
Table 3.1. Mix proportioning ........................................................................................................ 10
Table 3.2. Coarse and fine aggregate properties ........................................................................... 11
Table 3.3. Fine aggregate sieve analysis ....................................................................................... 11
Table 3.4. Coarse aggregate sieve analysis ................................................................................... 12
Table 3.5. Fly ash properties ......................................................................................................... 12
Table 3.6. Cement properties ........................................................................................................ 13
Table 3.7. Class S(AE) Contractor Mixes .................................................................................... 14
Table 3.8. Class S(AE) Batching Plan .......................................................................................... 15
Table 4.1. Cement only Slump and Unit weight mixes ................................................................ 24
Table 4.2. Fly ash Slump and Unit weight mixes ......................................................................... 25
Table 4.3. Modulus of elasticity data ............................................................................................ 38
Table 4.4. Material cost estimates ................................................................................................ 40
Table 4.5. Approximate potential savings .................................................................................... 41

1
1. Chapter 1: Introduction
1.1. Need for Research
Concrete is one of the most heavily used construction materials around the world today,
however this is not without a price (Mehta and Monteiro, 2006). One of the main elements in
concrete is portland cement. Cement is not only more expensive than most other components in
a traditional concrete mixture, but it also has major environmental impact. Approximately 7%
of the carbon dioxide (CO2) production worldwide is created in association with the production
of cement (Mehta, 2004). In addition, the Environmental Protection Agency (EPA) designated
the cement industry as the 3rd largest contributor to pollution in the world (EPA, 2003). Thus,
the findings detailed within this report have potential to offer substantial monetary and financial
savings.
The focus on cement reduction is not backed only by cost and green initiatives, but also
by its relationship to many fresh and hardened concrete properties. Arguably the most important
concrete property is compressive strength, since compressive strength affects so many
properties of concrete. Compressive strength often increases as cement content increases. While
this may seem positive, past research has shown links between increased concrete strength and
increased drying shrinkage and cracking density (Darwin, Browning, and Lindquist, 2004). As
cement content increases beyond what is necessary for design strength, issues with workability
and durability may result, which must be accounted for via the use of admixtures (Wasserman,
Katz, and Bentur, 2009). This decrease in workability and increase in heat of reacting cement
often result in increased early age cracking. Through mixing and batching, concrete is as much
an art as it is a science, there are evident ties between cement content and cracking (Aktan, Fu,
Dekelbab, and Attanayaka , 2003).

2
When higher cement contents lead to strengths much higher than the minimum required
by ARDOT for Class S(AE) concrete, early age cracking can occur decreasing the useful
lifespan of bridges. Past research has shown the average compressive strength of bridge decks
in Arkansas exceed the required 28-day compressive strength of 4000 psi (Reed and Hale,
2013). This study showed that even mixtures with higher w/cm still achieve 4000 psi by 7 days.
Strengths exceeding the minimum requirements have been found to cause increased shrinkage
that was likely partially related to the early strength gain due to increased hydration product
formation in the first 1 to 7 days (Almutairi, 2017). Arkansas is not alone in experiencing this
type of early cracking. Of the 30 states polled by Aktan et al. (2003), approximately 70%
experienced the same sort of cracking within the first few months of the concrete’s life, as
provided in Figure 1.1 (Aktan et al., 2003). The standards for Class S(AE) bridge deck concrete
are provided in Table 1.1. The overall need for this project can be summed up by stating that
reduction in cement content for concrete bridge decks can: reduce cracking, reduce cost, and
reduce environmental impact.
Table 1.1. Class S (AE) ARDOT Concrete Mix Requirements
Properties Class S (AE)
Minimum 28-day compressive strength (psi) 4000
Minimum cementitious content (lb/yd3) 611
Maximum fly ash content (Class C or F) (%) 20
Maximum slag cement content (%) 25
Maximum w/cm 0.44
Slump range (in.) 1 – 4
Air content (%) 6 ± 2
Note. Adapted from ARDOT division 800. (2014).

3
Figure 1.1. States polled for early age concrete cracking (Aktan et al., 2003)
1.2. Goal of Research
Past research has provided data on the effect of cementitious material content on
concrete properties. Cement content can affect Class S(AE) bridge deck concrete. This study
looks at furthering these findings through additional testing of fresh and hardened properties of
Class S(AE) concrete, to better determine how the mix proportions can change concrete
properties. 36 different mixture designs were tested with 4 different w/cms, 3 different fly ash
contents, and 3 different amounts of cementitious material. The principal goal was to provide
evidence that mixtures can be proportioned to meet or exceed ARDOT requirements with a
reduced cement content below current minimum design standards.

4
2. Chapter 2: Literature Review
This literature review will take an in depth look at past research that has shown
correlations between fresh and hardened properties of concrete and cement content.
2.1. Mix Proportioning
In the most basic of terms concrete is made up of water, aggregate, and cementitious
materials. Portland cement reacts with water to become the binder holding the mixture together.
When additional admixtures, like high range water reducer (HRWR), or supplementary
cementitious materials (SCMs) are added, their effects must be considered as all materials
affect the concrete differently. For example, the addition of fly ash has been found to affect
both compressive strength and shrinkage of concrete, and this must be accounted for when
designing the mix (Thomas, 2007).
When designing a mix, engineers typically start by aiming for a specified 28-day
concrete strength specified for the job, as shown in the ACI 211.1 Standard Practice for
Selecting Proportions for Normal, Heavyweight, and Mass Concrete (Qasrawi, 2016). If using
this standard, the engineer first selects the desired slump for the project. Then after taking into
account the nominal maximum aggregate size, mixing water required can be determined. Next,
the w/cm is chosen being chiefly dependent on the desired compressive strength, but also
considering the exposure conditions of the concrete. Exposure also plays a role in selection of
the type of cement as certain cement types work better under specific environmental conditions.
Once all of this has been selected, the engineer can determine the weights of coarse aggregate,
water, and cement to be used. Then using the absolute volume method and the different
material weights and specific gravities, it is possible to determine the necessary amount of fine
aggregate, while considering air voids.

5
2.2. Cement
Cement plays a major role within a concrete mixture and affects most important aspects
of the mix, such as: workability, compressive strength, drying shrinkage, and durability. Through
the process of hydration, cement particles react with water, binding the aggregate, and the
strength matrix develops (Weiss, 1999). Around the world, many standards and specifications
call for the overdesign of the concrete elements under the assumption that this creates another
factor of safety (Taylor, Yurdakul, and Brink, 2015). However, recent research has shed light on
the relationship between cement content and cracking and how overdesigning may be
detrimental to concrete. As cement content in a mix increases, the compressive strength usually
increases as well. However, costs also increase due to the high cost of cement relative to other
concrete ingredients and long-term effects caused by crack maintenance. This cracking is likely
a result of increased drying shrinkage and heat of hydration in the early age concrete with higher
cement content (Aktan et.al, 2003).
2.2.1. Cement Content and Workability
Cement content and cement fineness play crucial roles in affecting the workability of
concrete. If a mix has too much cement in relation to its water content, the mix will likely be
difficult to place. However, with too much water the mixture will segregate, making it equally
difficult to use for the intended purpose on the job. Thus, selecting the required amount of
cement for a mix is integral to the concrete mixture design, affecting workability and overall
construction costs. Finer cement requires increased water contents to hydrate a larger surface
area and generally causes higher temperature during hydration (Mardani-Aghabaglou, Son,
Felekoglu, Ramya, 2017). Thus, adjusting cement quantities and fineness within mixes prior to
placement can help to improve workability protects the concrete from additional cracking within
6
its interfacial transition zone due to excessive heat and drying strain created during the curing
process.
2.2.2. Cement Content and Compressive Strength
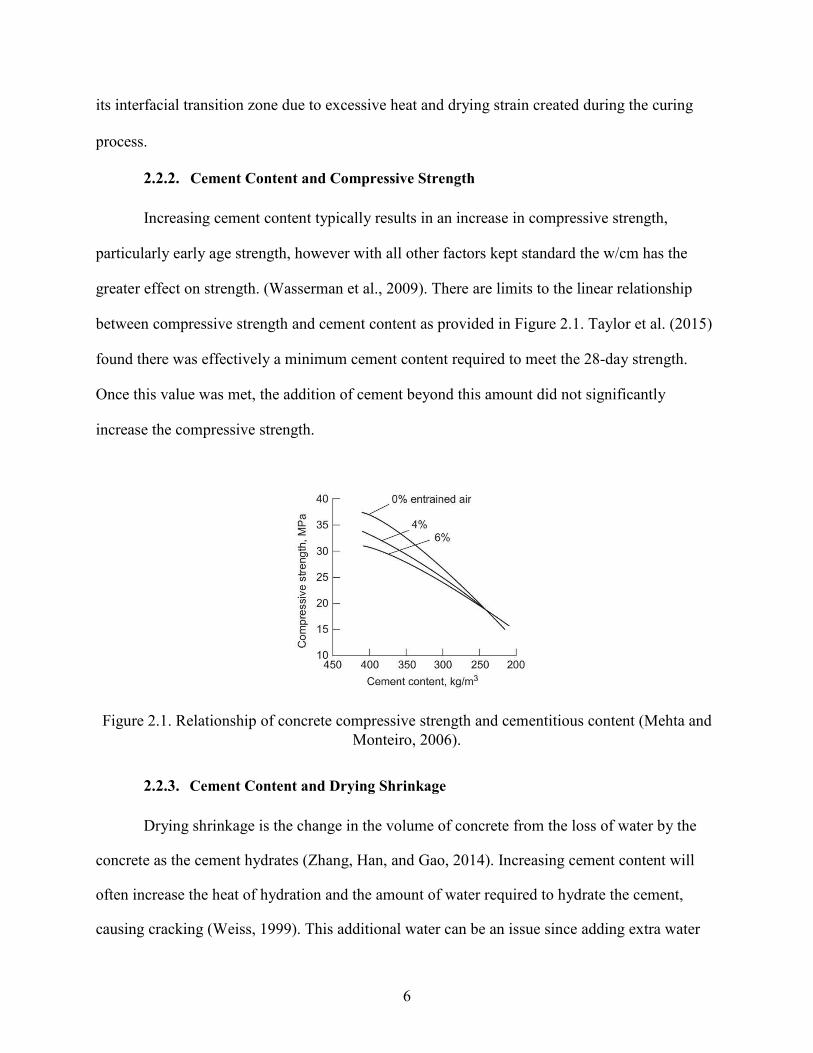
Increasing cement content typically results in an increase in compressive strength,
particularly early age strength, however with all other factors kept standard the w/cm has the
greater effect on strength. (Wasserman et al., 2009). There are limits to the linear relationship
between compressive strength and cement content as provided in Figure 2.1. Taylor et al. (2015)
found there was effectively a minimum cement content required to meet the 28-day strength.
Once this value was met, the addition of cement beyond this amount did not significantly
increase the compressive strength.
Figure 2.1. Relationship of concrete compressive strength and cementitious content (Mehta and
Monteiro, 2006).
2.2.3. Cement Content and Drying Shrinkage
Drying shrinkage is the change in the volume of concrete from the loss of water by the
concrete as the cement hydrates (Zhang, Han, and Gao, 2014). Increasing cement content will
often increase the heat of hydration and the amount of water required to hydrate the cement,
causing cracking (Weiss, 1999). This additional water can be an issue since adding extra water

7
increases drying shrinkage as more water is available within the mix to evaporate. Additionally,
when concrete is restrained either with rebar or by other structural elements, any strain over 400
x 10-6 results in cracking (Babaei and Fouladga, 1997). Cracking can occur easily and is often
very detrimental to the lifespan of concrete, so it is important to guard against it in as many
ways as possible. Therefore, it is generally recommended to use a minimum cement content
while still meeting 28-day compressive strength requirements, to better reduce early age
cracking.
2.2.4. Cement Content and Durability
Cement also plays a major role in the durability of a concrete mix. Durability is the way
the concrete resists weathering and deterioration while retaining its form, quality, and properties
when under exposure (ACI Committee 201, Durability of Concrete). Cracks are a problem for
durability and can decrease service life. An increase in cement can lead to an increase in
cracking density, which can ultimately lower the durability of concrete substantially (Darwin et
al., 2004). Additionally, increased cement often leads to more paste which has been shown to
increase shrinkage and permeability (Fowler and Rached, 2011). It has also been seen that the
use of fly ash or slag cement in mixes can reduce permeability (Salem and Burdett, 2004).
Permeability can be better understood through rapid chloride ion permeability tests which are
discussed in Section 4.4.
2.3. Prior Research
During hydration, greater heat causes greater stresses due to temperature. This leads to
tensile stresses, which cause cracking as the concrete begins to hydrate. The heat of hydration
and the subsequent cracking it causes were found to be primarily dependent on cement: type,
content, and fineness (Aktan et al., 2003).
Past studies have also shown the amount of drying shrinkage present in concrete is a
function of the amount of aggregate, type of aggregate, and cement paste content of the

8
concrete (ElSafty, 2013). Salem and Burdette (2004) found that shrinkage decreased with
decreases in cement paste via the use of SCMs, as these often decrease the overall concrete
porosity or amount of void spaces within the concrete. In addition, findings from this study
showed an increase in shrinkage over the first 5 weeks, with reduced shrinkage over the
subsequent 11 weeks on average. With all other factors held constant, an increase in cement
will increase the amount of paste. This results in an increased rate of hydration and evaporation,
leading to additional shrinkage. Shrinkage cracking in reinforced concrete not only reduces
compressive strength of the concrete, but also decreases durability of the concrete by creating
channels for water and chemicals to penetrate the concrete. Penetration of the concrete by
various harmful chemicals can then do further damage via freeze-thaw cycles and deterioration
of reinforcing steel.
It was found prior that an increased cement content often leads to an increase in
cracking density (Darwin et al., 2004). Darwin also suggested setting upper bounds for
compressive strength values to help negate the cracking caused by the increase in strength.
Additionally, Yurdukal (2010) found that the use of cementitious materials at the lower end of a
range from 500 to 600 lb/yd3 was best overall for the mix when evaluating both fresh and
hardened properties of concrete. Wasserman et al. (2009) found workability decreased with
reductions in cement. The decreased cement content created a harsh mix, with little lubrication
for the aggregates. However, this study noted that the replacement of the reduced cement with
SCMs was helpful in restoring workability. This factor can likely be attributed to the ability of
SCMs, such as the fly ash used in this study, to act as additional lubrication within the mix.
The replacement of cement with SCMs like Class C fly ash have been shown to offer
equal to or slightly greater long-term strengths than similar mixes made with only cement
(Salem and Burdette, 2004). In a study performed by Yurdakul (2013), the introduction of fly
ash at 15% and 30% was found to produce similar compressive strength to mixtures containing

9
only portland cement. Class C fly ash has cementitious and pozzolanic properties of, with the
pozzolanic reaction contributing to greater strength gain later in life (Thomas, 2007).
Economically speaking, fly ash is a byproduct of the coal industry and is generally less
expensive than cement (Aktan et al., 2003). Regarding shrinkage, Class C fly ash has shown to
cause equal or less shrinkage than plain cement, due to the reduction in paste (Seo, Ohno, and
Nakagawa, 2007).
2.4. Summary
Cement content plays a chief role in concrete mixtures and effects both fresh and
hardened properties. Past research has shown, in most cases, cement content can be decreased
while maintaining strength requirements and decreasing drying shrinkage, permeability, and
cracking. Additionally, the replacement of cement by SCMs can be helpful in reducing cracking
and permeability while maintaining workability. The addition of fly ash can reduce the required
cement content while still meeting design standards.

10
3. Chapter 3: Investigation
3.1. Scope
This study was conducted to examine whether the cement content in Class S(AE)
concrete can be reduced while still meeting ARDOT standards for both fresh and hardened
concrete properties. This testing program was conducted in two parts. In part one, 36 mixes
were batched (shown in Table 3.1). The development of the mixes and the testing matrix is
further discussed in section 3.3. All mixes were held to the same standards for slump, air
content, and temperature.
Table 3.1. Mix proportioning
Properties Values
Cementitious Material Contents (lb/yd3) 611, 564, 517
Water Cement Ratio 0.40, 0.42, 0.44, 0.50
Class C Fly Ash Replacement (%) 0, 20, 30
Number of Mixes 36
Cylinders (per mix) 12
Compressive Strength Tested (days) 1, 7, 28, 56
Shrinkage Prisms (per mix) 3
Shrinkage Strain Tested (per week/16 weeks) 1
Part two of this program developed worst case scenarios based on the results of part one.
Nine additional batches were developed based on the mixtures that had the highest w/cm and
lowest cementitious material. The same testing in part one was performed but additionally the
rapid chloride ion permeability (RCIP) was measured along with modulus of elasticity (MOE).
To better complete the project, which included similar testing for Class S and portland cement
concrete pavement (PCCP) concrete, a mix from Class S, S(AE), and PCCP were each chosen
for these tests. Each batch was performed once using three of coarse aggregates: sandstone,
river gravel, and limestone.

11
3.2. Materials
The material properties of the aggregates used in the study are shown in Table 3.2. The
principal coarse aggregate used was crushed limestone from Springdale, AR. The primary fine
aggregate used was river sand from the Arkansas River in Van Buren, AR. The coarse and fine
aggregate properties of absorption and specific gravity (ASTM C127 and ASTM C128), as well
as dry rodded unit weight (ASTM C29) are listed in Table 3.2.
Table 3.2. Coarse and fine aggregate properties
Properties Fine Aggregate Coarse Aggregate
Maximum Size Aggregate (in.) - 1.00
Nominal Maximum Size Aggregate (in.) - 0.75
Dry Rodded Unit Weight (lb/ft3) - 100 Specific Gravity 2.63 2.61
Absorption Capacity (%) 0.48 2.10
Fineness Modulus 2.99 -
The primary coarse aggregate used was #57 crushed limestone. Sieving per ASTM C33
was performed on both types of aggregate to ensure the gradations met the ARDOT requirements
as well. The fine aggregate and the coarse aggregate gradations are listed in Tables 3.3 and 3.4.
The fine aggregate met the ARDOT standards though the coarse aggregate did not as the percent
passing the 1/2in and #4 sieves were both beyond the specifications in two separate tests.
Table 3.3. Fine aggregate sieve analysis
Sieve Fine Aggregate % Passing ARDOT Specification % Passing
3/8" 100 100
# 4 99 95-100
# 8 95 70-95
# 16 83 45-85
# 30 61 20-65
# 50 17 5-30
# 100 2 0-5

12
Table 3.4. Coarse aggregate sieve analysis
Sieve Coarse Aggregate % ARDOT Specification AASHTO M43 #57
Passing % Passing
1½" 100 100 100
1" 100 60-100 95-100
3/4" 75 35-75 -
1/2" 25 - 25-60
3/8" 12 10-30 -
#4 2 0.5 0-10
#8 1 - 0-5
Ash Grove Type I/II cement was used throughout the study, along with Class C fly ash
from Boral Resources. The fly ash was produced at the White Bluff generating plant in Redfield,
AR. Properties of the cement and fly ash are listed in Tables 3.5 and 3.6. Additional admixtures
such as, air entertainer (AE) and HRWR were also used as needed to meet requirements for air
content and slump. The AE used was Terapave AEA and the HRWR was a carboxylate-based
admixture, Grace ADVA Cast 575.
Table 3.5. Fly Ash properties
Item Description
SiO2 36.73%
Al2O3 21.49
Fe2O3 5.68%
CaO 22.70%
Na2O 1.48%
K2O 0.57%
MgO 4.30%
∑ Oxides 63.90%
∑ Alkalis 29.05%

13
Table 3.6. Cement properties
Item Description
Chemical
SiO2 20.11%
Al2O3 5.07%
Fe2O3 3.80%
CaO 64.15%
MgO 0.98%
SO3 3.23%
Loss on ignition 2.39%
Na2O 0.18%
K2O 0.56%
Insoluble Residue 0.40%
CO2 1.09%
Limestone 2.80%
CaCO3 88.23%
Potential compounds
C3S 55%
C2S 14%
C3A 7%
C4AF 11%
C3S + 4.75 C3A 88%
Physical
Air content of mortar (volume) 8%
Fineness 4.5 m2/g
Autoclave expansion -0.01%
Mortar Bar Expansion 0.00%
3.3. Procedure
3.3.1. Mix Proportions and Testing
Table 3.7 shows representative mixes for Class S(AE) concrete, as reported by ARDOT
from various bridge deck projects in AR. From Table 3.7, it is clear that concrete producers
typically used the minimum amount of cementitious material, and generally the max w/cm.
Additionally, 5 of the 8 cases below included a water reducer or retarder, and nearly all added
varying amounts of fly ash ranging from 18 to 25%. The coarse aggregate content used in this

14
study was 1800 lb/yd3, which was chosen based on consultation with ARDOT and was quite
similar to the range of coarse aggregate contents shown in Table 3.7.
Table 3.7. Class S(AE) Contractor Mixes Material or Concrete Producers
Property ACC CMTS CMTS MTA RCC MTA Tune Near
Cement (lb/yd3) 611 520 489 519 489 519 516 489
Fly ash (lb/yd3) 0 91 122 91 122 91 95 122
Rock (lb/yd3) 1760 1740 1745 1687 1731 1629 1720 1720
WR/Retarder D17 D17 Yes Recover - - D17 -
w/cm 0.44 0.40 0.42 0.44 0.44 0.44 0.44 0.42
As previously described, testing in this study largely involved varying the cementitious
content, w/cm, and fly ash content. The different mix proportions that followed from these
variations can be seen in Table 3.8. All mixes were designed to meet ARDOT minimum
standards of 28-day compressive strength, air content, and slump. For cementitious material, the
ARDOT minimum is 611 lb/yd3. To check the reduction not only of cement but also of total
cementitious material, this was tested at the current minimum standard of 611, as well as lower
values of 564 and 517 lb/yd3, to further evaluate the effect of further reductions in cementitious
material content. Regarding w/cm, the current maximum w/cm that ARDOT allows for Class
S(AE) is 0.44. Thus, testing was performed at the maximum value, as well as at two lower w/cm.
This was done to compare reductions in shrinkage due to lessened water contents. The w/cm
was also tested at 0.50, as a worst case scenario for field concrete. Finally, the current maximum
ARDOT standard for fly ash replacement is 20%. For tests in this study, 0, 20 and 30% fly ash
replacement values were used. The mixes batched with 0% fly ash were treated as the control
while the 20 and then 30% mixes were evaluated to determine shrinkage effects when reducing
cement through replacement with fly ash.

15
Table 3.8. Class S(AE) Batching Plan
Cementitious Material content
w/cm
0.40 0.42 0.44 0.50 (lb/yd3)
Mixtures ID
611 (100% portland cement) 1-A 1-D 1-G 1-J
611 (20% Class C fly ash) 1-B 1-E 1-H 1-K
611 (30% Class C fly ash) 1-C 1-F 1-I 1-L
564 (100% portland cement) 2-A 2-D 2-G 2-J
564 (20% Class C fly ash) 2-B 2-E 2-H 2-K
564 (30% Class C fly ash) 2-C 2-F 2-I 2-L
517 (100% portland cement) 3-A 3-D 3-G 3-J
517 (20% Class C fly ash) 3-B 3-E 3-H 3-K
517 (30% Class C fly ash) 3-C 3-F 3-I 3-L
3.3.2. Batching
The batching procedure for each mix occurred as follows. One day prior to batching,
coarse and fine aggregates were obtained from stockpiles at the Engineering Research Center
(ENRC) at the University of Arkansas (UA). A small representative sample of each was placed
in an oven for 24 hours to measure moisture content per ASTM C566. Then larger samples of
each aggregate type, approximately 5 gallons, were collected and used for batching the
following day. Each bucket was sealed upon collection. The following day the samples were
removed from the oven and moisture contents measured.
Once the moisture contents of the aggregates were determined, the quantities of all the
materials were measured and the concrete was mixed in accordance with ASTM C192. The
coarse aggregate and approximately half of the mixing water were first added to the mixer. The
mixer was then started, sand and more water added, and finally the cementitious materials along
with the remaining water containing the admixtures were added. Upon addition of all the
16
materials to the mixer, the mixer was started and the materials were mixed for three minutes,
then allowed to rest for three minutes (with the mixer off), and then mixed for another two
minutes. For each of the initial 36 mixes the batch size was 1.8 ft3, which was sufficient
concrete to measure slump, unit weight, and air tests. If the mixtures passed the ARDOT
requirements for slump and air content, 12 cylinders and 3 shrinkage prisms were cast
according to the ASTM C192. For the 9 additional mixes, an extra 14 cylinders were cast to
perform RCIP (ASTM C1202) and MOE (ASTM C469) at 28 and 56 days. The batch size for
these mixes was 2.6 ft3.
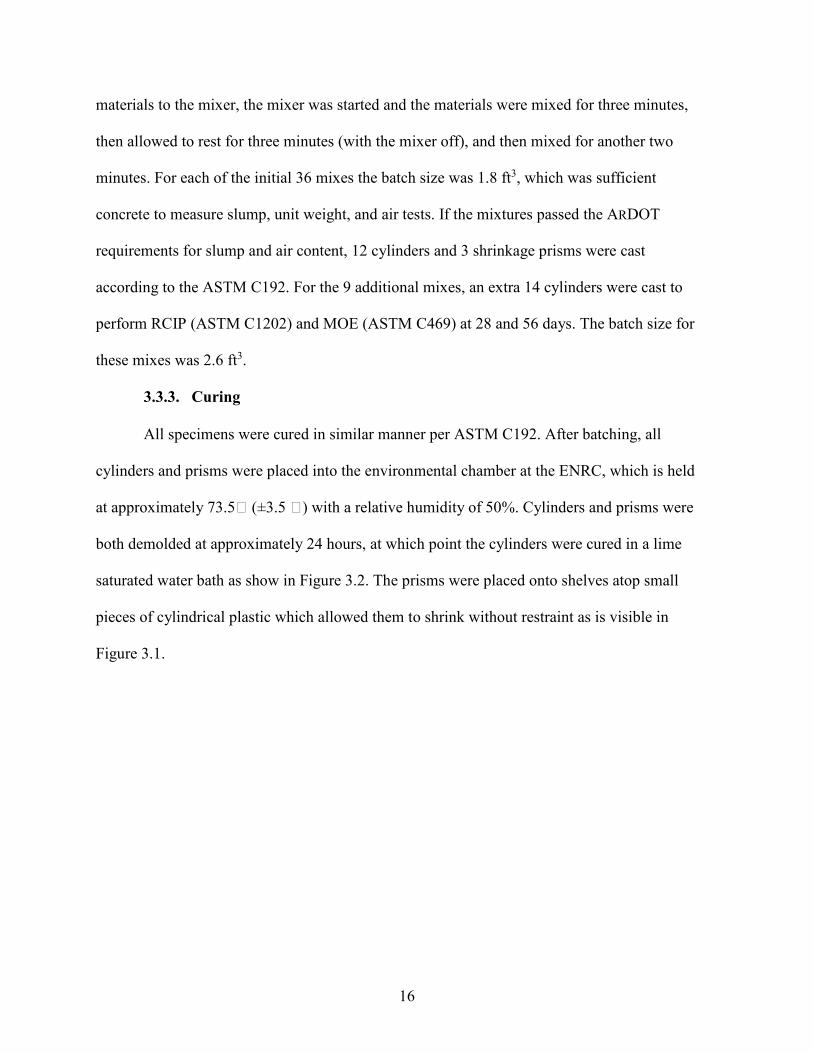
3.3.3. Curing
All specimens were cured in similar manner per ASTM C192. After batching, all
cylinders and prisms were placed into the environmental chamber at the ENRC, which is held
at approximately 73.5℉ (±3.5 ℉) with a relative humidity of 50%. Cylinders and prisms were
both demolded at approximately 24 hours, at which point the cylinders were cured in a lime
saturated water bath as show in Figure 3.2. The prisms were placed onto shelves atop small
pieces of cylindrical plastic which allowed them to shrink without restraint as is visible in
Figure 3.1.

17
Figure 3.1. Drying Shrinkage specimen
Figure 3.2. Compressive Strength specimen
3.3.4. Fresh and Hardened Property Tests
The fresh concrete tests were performed to ensure the mix met the standard
specifications for slump (ASTM C143), temperature (ASTM C1064), unit weight and air
content (ASTM C138), so further testing could be performed. Compressive strength was
measured primarily to determine if concrete mix met the requirements for 28-day strength. 4
inch by 8 inch cylinders were cast, with three cylinders tested at 1, 7, 28, and 56 days. An

18
example of this testing can be seen in Figure 3.3. Cylinders were ground plane on both ends
using an end grinder prior to testing.
Figure 3.3. Compressive Strength Testing
After casting and 24 hours of curing, the specimens were demolded and the hardened
properties were measured; compressive strength (ASTM C39), MOE (ASTM C469), RCIP
(ASTM C1202), and drying shrinkage (ASTM C157). Drying shrinkage was tested to
evaluate how mix proportioning affected the dimensional stability of the mix. In theory, the
shrinkage should decrease as cement content was reduced. From each mix, three 4-in by 4-in
by 11.25-in prisms were crafted with dimensions of. The initial length of each prism was
measured upon demolding and then changes were measured once per week for 16 weeks. The
shrinkage testing apparatus can be seen in Figure 3.4.

19
Figure 3.4. Shrinkage Prism Testing
Next, MOE was tested in the hardened concrete, as shown in Figure 3.5. Like RCIP,
MOE was only tested for the additional 9 mixtures with higher w/c. For each test, three
cylinders were tested to determine compressive strength, and then three additional cylinders
were tested for MOE. The results of these 9 additional mixes and their MOEs were analyzed
and compared to determine the effect of aggregate type on MOE. These values were
compared with the ACI/AASHTO prediction equations.

20
Figure 3.5. Modulus of Elasticity testing
RCIP testing followed the procedure outlined in ASTM C1202. An example of the
RCIP test setup can be seen in Figure 3.6. Prior to testing, the specimens went through the
preparation outlined in ASTM 1202. The test involves running a 60V current through the
specimens with an NaCl and BaOH solution on either side to measure the concrete’s
permeability to chloride ions. This data gives a numerical measure of how well the concrete
mixture can protect the steel reinforcement inside it from chemical attack. The ability of the
different mixes to resist the current can be seen in Figure 4.17.

21
Figure 3.6. Rapid Chloride Ion Permeability testing
22
4. Chapter 4: Results
4.1. Goal
This study was completed with the overarching goal of providing evidence that there
could be reduction to the ARDOT minimum cement content while still meeting the standard
specifications for other concrete properties. Testing of this hypothesis involved varying
cementitious material, w/cm, and fly ash percentage. Below are the results from the testing of
the different mix designs, and how the fresh and hardened concrete properties changed in
accordance.
4.2. Fresh Properties
The fresh concrete properties tested in this study were slump, unit weight, and air
content. The results of these tests are shown in Tables 4.1 and 4.2 below. These tables also show
mixtures containing HRWR. It should be noted that admixtures were added, when needed, to
increase workability and to meet ARDOT standards. In regards to air content, there were no
direct correlations noted in this study between air content and slump or air content and
cementitious material contents. When looking at unit weight, it was seen that as the w/cm
decreased from 0.50 to 0.40, unit weight generally increased by approximately 2.5 lb/yd3. This
was likely caused by the reduction of water because, with all other factors held constant,
reducing water in the mix will require a slight increase in the amount of fine aggregate, which is
heavier than the water. Besides this however, there were no direct correlations between unit
weight and cement content or fly ash percentage.
In the case of slump, the w/cm and the overall amount and type of cementitious material
are both vital. Whenever the w/cm increased, it often resulted in an increase in the slump of the
mix. When dealing with cementitious material quantities, it was noted that reducing the overall

23
quantity of cementitious material made the mix become less workable. This is due primarily to
the overall decrease in water quantity as the quantity of cementitious materials decreased. This
factor is key when recommending a lower minimum value to ARDOT, especially since some of
the lower w/cm mixtures with 517 lb/yd3 of cementitious material had lower slumps than those
of the other mixtures in this study and were more difficult to work. Though all mixes met the
required strength at 28 days, workability is still a major factor in mixture design to ensure the
concrete can be placed and consolidated efficiently. In addition to overall content, the type of
cementitious material is also important. It was found that when using fly ash contents of 20 or
30%, the workability would increase compared to mixtures containing cement only. This is due
to the increased lubrication effect of fly ash, as its particles are smaller and act like “ball
bearings” in the mixture. This isn’t obvious in the data from every mix due the impact of air
entertainer, but as an example, the slump values for the 20 and 30% fly ash mixes for 0.5 w/cm,
were relatively high with no addition the HRWR.

24
Table 4.1. Cement only Slump and Unit weight mixes
Cementitious Content (lb/yd3)
% Class C Fly Ash
w/cm Slump (in.) Unit weight
(lb/yd3)
HRWR (mL)
AEA (mL)
Air Content
(%)
0.40 1.25* 144.5 5.5 20 10
611 0
0.42 2.25* 143.3 6.1 20 9
0.44 1.25 144.6 4.8 0 10
0.50 6.50** 138.1 6.9 0 2
0.40 2.00* 141.3 8.0 35 10
564 0
0.42 2.00* 141.4 7.0 10 6.5
0.44 1.00 143.8 5.2 0 10
0.50 5.25** 141.4 6.0 0 2
0.40 1.00* 145.4 5.2 20 4
517 0
0.42 4.00* 142.6 7.1 20 4
0.44 1.00* 142.2 7.2 15 7
0.50 1.75 145.2 4.4 0 1.5
*Slump was achieved with HRWR **Slump could not be reduced due to high water content

25
Table 4.2. Fly ash Slump and Unit weight mixes
Cementitious Content (lb/yd3)
% Class C Fly Ash
w/cm Slump (in.) Unit weight
(lb/yd3)
Air Content
(%)
HRWR (mL)
AEA (mL)
0.40 2.00* 139.8 7.5 15 20
20
0.42 2.00* 142.4 6.1 10 15
0.44 3.75 138.7 5.9 0 24
611
0.50 8.00** 141.6 4.2 0 9
0.40 2.00* 140.1 7.4 15 25
30
0.42 1.75 145.4 4.0 0 18
0.44 4.25 140.6 6.0 0 27
0.50 7.75** 137.7 7.0 0 15
0.40 1.00* 143.0 6.8 10 13.5
20
0.42 2.25* 141.9 7.2 10 11
0.44 1.75 142.4 5.6 0 22
564
0.50 6.50** 141.7 5.4 0 9
0.40 1.25* 144.1
5.6 10 16
30
0.42 1.50* 143.5 6.5 29.6 13.5
0.44 2.50 144.3 4.1 0 25
0.50 7.50** 142.0 4.6 0 13
0.40 1.25* 140.7 8.0 25 8.5
20
0.42 1.00* 144.0 6.0 35 8
0.44 1.50* 142.0 6.6 10 22
517
0.50 2.50 144.2 4.7 0 8.5
0.40 2.00*
140.6 8.0 20 8
30
0.42 1.00* 143.5 7.0 30 11
0.44 2.75* 139.4 7.8 15 17
0.50 6.75** 141.2 7.0 0 13
*Slump was achieved with HRWR **Slump could not be reduced due to high water content
Overall, reducing the cementitious material content had little effect on the air content or
unit weight. The replacement of cement with fly ash also had little effect in these areas, though it
increased slump. Values for air were within the ARDOT standards (shown in Table1.1). Slump
was affected by the reduction in cementitious materials, as the lower cementitious content mixes

26
were often more difficult to work with. That said, several mixes ranging from the upper limit of
611 to the lower limit of 517 lb/yd3 required the addition of HRWR to meet the slump standards
of 1 to 4 inches, so this correlation between slump and reduced cementitious values is likely not
quite as exact as it may seem.
Using these tables, it is recommended that ARDOT consider using cementitious material
values of 564 and 517 lb/yd3 on a more regular basis, as batches that utilize these amounts can
still meet the requirements for slump, air, and unit weight without requiring substantially
different amounts of admixtures or effort from that of currently approved mixes. It may also be
worth considering increasing the limits of fly ash contents to 30%, as these would have a
positive impact on slump.
4.3. Hardened Properties
4.3.1. Compressive Strength
For Class S(AE) concrete, ARDOT requires a minimum 28-day compressive strength of
4000 psi, which was achieved by all mixes. Compressive strengths were measured using three
cylinders tested at 1, 7, 28, and 56 days. The strength values referenced in this report represent
the average of 3 specimens.
4.3.1.1. Cement Content and Strength
As specified prior, an increase in cement content is often related to an increase in
compressive strength. However, in this study, an increase of cementitious material from 517 to
564 to 611 lb/yd3 produced near equivalent compressive strength values, as shown in Figure 4.2.
Roughly 78% of the mixtures reached the specified compressive strength of 4000 psi within 7
days. The remainder of the mixtures achieved 4000 psi by 28 days.” Additionally, it is important
to note that the weakest mixture (0.50 w/cm, 517 lb/yd3, 30% FA) met the required strength by
28 days. Based on this data, even if only 517 lb.yd3 of cementitious materials are used, and the

27
w/cm exceeds the 0.44 minimum set by ARDOT, the mixture was still capable of exceeding the
minimum 28-day strength of 4000 psi. Additionally, decreases in w/cm and increases in unit
weight were found to increase in compressive strength. Higher slump mixtures had lower
compressive strengths as well. Higher air content mixtures generally had lower strengths, which
is likely a partial cause of some of the compressive strength values in the graphs below.
Figure 4.1. Cement only compressive strength
4.3.1.2. Fly Ash Content and Compressive Strength
Fly ash plays a role in the ultimate compressive strength, but for this study it is more
valuable to look at how it effects strength gain. Due to the pozzolanic reaction, many fly ash
mixes gain strength more slowly than non-fly ash mixes and have reduced early age strength
development, but gain slightly greater ultimate strength due to the continued reactions
(Thomas, 2007) Thus, when comparing it to a cement only mix, the comparable fly ash mix
often had lower 1 and 7 day strengths , as shown in Figures 4.2, 4.3, and 4.4. This is especially
true for lower cementitious contents, such as the 517 lb/yd3 mix, as these mixes already have

28
reduced cement and portions of the mixes are replaced with a less reactive material.
Conversely, fly ash replacement often resulted in slightly greater strength than mixes with little
to no fly ash at similar water cement ratios. Overall, the data provided little reason to be
concerned with the strength mixtures with w/cm up to 0.5 or high fly ash contents, as even the
mixture with the highest w/cm and lowest cementitious content achieved 4000 psi by 28 days
with over 3000 psi at 7 days and 1000 psi at 1 day. Again, this data can be seen in Figures 4.2,
4.3, and 4.4.
Figure 4.2. Mixes with 611 lb/yd3 compressive strengths

29
Figure 4.3. Mixes with 564 lb/yd3 compressive strengths
Figure 4.4. Mixes with 517 lb/yd3 compressive strengths

30
4.3.1.3. Compressive Strength Results
Based on the compressive strength data, the ARDOT standard of 611 lb/yd3 of
cementitious material could be reduced substantially, as all the mixes met the minimum
compressive strength of 4000 psi by 28 days. This includes the mixes where the fly ash
contents were 20 and 30%. Though the mixes with higher fly ash contents did show lower early
strength, by 28 days they developed sufficient strength. Considering this, the ARDOT
maximum of 20% fly ash replacement could be increased to 30% without a detrimental effect
on 28-day compressive strength. Additionally, it is important to note that even in the case of a
w/cm of 0.50, well above the ARDOT max of 0.44, all mixes still met the requirements. In the
end, strength data shows that in many cases current standards result in overdesign, and
reduction of cement is both plausible and helpful monetarily and environmentally.
4.3.2. Drying Shrinkage
Three shrinkage prisms were cast from each batch to test drying shrinkage in
accordance with ASTM C157. These prisms were measured once per week for 16 weeks and
the values noted for each week are the average of the measurements for the 3 prisms. These
findings are another major aspect to this study to supplement the strength results. The goal
with shrinkage was to look for equal to or lesser drying shrinkage as cementitious materials
was reduced or replaced, ultimately resulting in decreased cracking.
4.3.2.1. Cement Content and Drying Shrinkage
Figures 4.5, 4.6, and 4.7 represent findings for the cement only mixtures for all w/cm
tested. In both mixtures with and without fly ash, findings were generally similar. It was noted
that reducing cementitious material from 611 to 517 lb/yd3 decreased shrinkage by 100 x 10-6
microstrains. As the w/cm decreased from the max of 0.50 to the minimum of 0.40, there was an
approximate decrease of 50 x 10-6 microstrains. The similarity in strain is likely attributed to the
high amount of coarse aggregate, 1800 lb/yd3, in each mix. By the end of 16 weeks, many of the

31
measurements for these mixes were near 500 x 10-6 microstrain. Overlapping strain values for
different w/cm within mixes can be seen in Figures 4.5 through 4.13. It seems reasonable that
mixes with a higher w/cm would develop greater strains throughout the testing as the increased
amounts of water within these mixes lead to additional evaporation and shrinkage. However,
minor deviations due to time of batching and changes in humidity caused several of the
shrinkage values to rise and fall below those of subsequent w/cm tested. The data showed that
the more significant factor in controlling strain was cementitious content, as this caused the
greater differences.
Figure 4.5. Concrete mixture with 611 lb/yd3 and 0% fly ash

32
Figure 4.6. Concrete mixture with 564 lb/yd3 and 0% fly ash
Figure 4.7. Concrete mixture with 517 lb/yd3 and 0% fly ash
4.3.2.2. Fly Ash and Drying Shrinkage
The contribution of fly ash to drying shrinkage was minimal. Overall, fly ash affected
the shrinkage in a very similar manner as it affected strength. Mixes with 20 or 30% fly ash
showed approximately equivalent strain at 16 weeks. The difference in strain between the 20

33
and 30% replacement amounts was minimal and no direct approximation of value can be
denoted for the difference, as data values often overlapped for similar mixes. Similar trends for
drops in microstrain as cementitious material and w/cm decreased were noted and still applied
to fly ash mixes. All of this can be seen in Figures 4.8 through 4.13. It is important to note that
little to no change in shrinkage occurred between these same mixes of similar w/cm. Likely,
this can be all be related back to one of the main culprits for loss in strength, the ITZ. Since the
ITZ is the weak link in concrete, it is valuable to think about how the addition of fly ash can
affect it. In most cases, adding fly ash has shown to decrease the heat of hydration. This lower
heat not only helps better protect the ITZ from early age thermal cracking, but it can also help
reduce potential for evaporation and drying shrinkage. These lower temperatures often help
reduce microcracks which would only propagate further during drying and cause more
cracking (Aktan et al., 2003).
Figure 4.8. Concrete mixture with 611 lb/yd3 and 20% fly ash

34
Figure 4.9. Concrete mixture with 564 lb/yd3 and 20% fly ash
Figure 4.10. Concrete mixture with 517 lb/yd3 and 20% fly ash

35
Figure 4.11. Concrete mixture with 611 lb/yd3 and 30% fly ash
Figure 4.12. Concrete mixture with 564 lb/yd3 and 30% fly ash

36
Figure 4.13. Concrete mixture with 517 lb/yd3 and 30% fly ash
4.3.2.3. Drying Shrinkage Results
From the shrinkage data shown in the previous figures, the reduction in cement content
reduces the strain associated with drying shrinkage. In addition, it appears the addition of fly ash
is of little to no consequence in regard to drying shrinkage, as it causes near equivalent strain to
those mixes with no fly ash. In all 36 cases, no mix exceeded a drying shrinkage of 600 x 10-6
microstrain, meaning max shrinkage values were not far above the initial values for cracking in
restrained conditions. Additionally, it was noted that as w/cm decreased the strain showed a
slight drop on average. Thus, overall it was found that reduction of cement and replacement of
fly ash reduced the drying shrinkage of some mixtures and little effect on others. This was most
likely due to the constant coarse aggregate content of 1800 lb/yd3 that was used in all the
mixtures.
4.3.3. Additional Testing
Both MOE and RCIP testing were performed for the last 9 high w/cm low
cementitious material mixes. These mixes represented not just Class S(AE) concrete, but

37
also Class S and PCCP, to better fulfill the entirety of the study which focused on multiple
ARDOT approved concrete types. The goal was to determine the differences in MOE, RCIP,
compressive strength, and shrinkage between the mixtures tested for these three classes. The
3 mixes tested used no fly ash and were: Class S(AE) with 517 lb/yd3 of cement at a w/cm
of 0.50, Class S with 517 lb/yd3 of cement at a w/cm of 0.55, and Class PCCP with 470
lb/yd3 of cement at a w/cm of 0.50. Each batch was performed once with sandstone, river
gravel, and limestone as the coarse aggregate. Mixes were tested at 28 and 56 days.
The goal of the MOE testing performed in this study was to determine if the standard
prediction equations for MOE given below could be used to predict MOE based on concrete
compressive strength. To test this, the mixtures that had the lowest 28-day compressive
strength were used. Additionally, since MOE effectively provides stiffness and stiffness is
affected by coarse aggregate content, three different coarse aggregates from around the state
were chosen after consultation with ARDOT research personnel. For the MOE data,
Equation 1 and 2 below give the standard MOE equations so they can be plotted and
compared to the data in Figure 4.14. In the case of equation 2 below, it was plotted with an
upper bound using the highest density of limestone in the equation, and lower bound using
the lowest density of the river gravel.
�� = 57000√�′� Eq.1
�� = 33�� .�√�′� Eq. 2
There is little change in MOE values from 28 to 56 days. Though it had the lowest
specific gravity, the river gravel provided the highest MOE values. The river gravel was
followed by the limestone and then the sandstone, both at 28 and 56 days. Additionally, it
appears the river gravel and limestone both behave better than the predictions from the ACI

38
and AASHTO equations. However, the sandstone failed to meet expectations at either 28 or
56 days. From these results, it was determined that the standard equations above could be
used to predict MOE for river gravel and limestone mixtures containing a high w/cm and low
cement content, however they would overpredict for sandstone
Figure 4.14. Measured Modulus of Elasticity versus prediction equations
Table 4.3. Modulus of elasticity data
Class Sandstone River Gravel Limestone
28 Day – Average Modulus of Elasticity (ksi)
S(AE) 3430 5800 5410
S 3430 5920 4990
PCCP 3670 5590 6010
Class Sandstone River Gravel Limestone
56 Day – Average Modulus of Elasticity (ksi)
S(AE) 3520 6070 5552
S 3490 5870 5079
PCCP 3820 6260 6147

39
Figure 4.15. Measured Non Resistivity compared to standards
Figure 4.15 represents the findings for RCIP and shows the standards for chloride ion
permeability (low, moderate, and high) as defined by ASTM C1202. The data shown in this
section represents the average of the tested specimens. However, due to imperfections in the
systems and specimens, not all four of the specimens could be fully tested each time. Thus,
some of the data is averaged for fewer specimens. It should be noted in Figure 4.15 that higher
numbers of coulombs passing through the specimen equate to less resistive and theoretically
more permeable concrete. This was best seen in the case of the Class S mix which had the
highest w/cm of 0.55 and produced higher permeability values in every aggregate case. While
changes were small between the values of the different mixes as the aggregate was changed, it
seemed evident that the most resistant aggregate was the river gravel, followed by the limestone
and then sandstone. These results point to a difference in the classification of the three types of
concrete tested here, with class S(AE) and PCCP concrete having moderate permeability, and
class S concrete having high permeability likely due to its increased water content.
Additionally, based on these results it is evident that the type of coarse aggregate used and a

40
lower cement content can both decrease the permeability of the concrete, though the w/cm has
the greatest ability to cause change.
4.4. Potential Savings
Below is a cost evaluation of some common Class S(AE) mixes batched at minimum and
lower cementitious material contents, with an increased fly ash replacement percentage. The
average material cost received from ARDOT in June of 2018 are listed in Table 4.4. From 2013
to 2015, 76,469 yd3 of Class S(AE) bridge deck concrete was used by ARDOT for state projects.
Based on this quantity and the average cost values, potential savings were calculated and
compared for traditional and non-traditional mixes.
Table 4.4. Material cost estimates
Material Price ($)*
Cement 280
Fly Ash 35
Rock 18
Sand 17
* Prices listed above are per 2000 lbs
For a w/cm of 0.44, the least expensive mix that meets ARDOT standards contained 611
lb/yd3 of cementitious material with a 20% fly ash content. Using the cost estimates in Table 4.4
this mix costs approximately $96/yd3, though it only includes cost of materials and not
transportation or labor. However, using the same w/cm while reducing the cementitious content
to 517 lb/yd3 and increasing the fly ash content to 30%, the mix cost decreases to approximately
$81/yd3, while still meeting all the ARDOT requirements for fresh and hardened concrete. This
amounts to a difference of $15/yd3 and based on the total quantity of Class S(AE) concrete cast
from 2013 through 2015, the cost savings could have been over 1 million dollars, as shown in
Table 4.5. As can be seen from this table, substantial economic savings can be attained through
the reduction of cement and increase of fly ash within mixes.

41
Table 4.5. Approximate potential savings
Year
Quantity (yd3)
Cost ($)
611 lb/yd3- 20% FA 517 lb/yd3- 30% FA
2013 31129 2,988,384 2,521,449
2014 36088 3,464,448 2,923,128
2015 9252 888192 749,412
Sum 147577 7,341,024 6,193,989
∑ Savings $1,147,035

42
5. Chapter 5: Conclusion
The goal of this study was to show that ARDOT can reduce cement content in Class
S(AE) concrete while still meeting all the necessary requirements for fresh and hardened
concrete. The primary variables were cementitious material content, fly ash percentage, and
w/cm. The most important conclusions and findings of this study are listed below in bullet form.
• ARDOT can allow their minimum required cementitious material content for Class
S(AE) concrete to be reduced from 611 to 517 lb/yd3 while still meeting
requirements for fresh and hardened properties.
• Class C fly ash content can be increased to a max of 30% while still meeting ARDOT requirements for compressive strength, air content, and slump.
• At the highest w/cm of 0.50 with the lowest cementitious material value of 517
lb/yd3 and 30% replacement of cement with fly ash, the mix still developed the
required 28-day strength and showed a level of shrinkage not significantly different
from that of lower w/cm mixes.
• All mixes achieved the ARDOT standard compressive strength for Class S(AE)
concrete of 4000 psi by 28 days, with most exceeding this value by 7 days.
• Mixes batched with 20 or 30 % Class C fly ash had equivalent or slightly greater
drying shrinkage strain and compressive strength at 28 day and 56 days, compared to
mixtures with no fly ash.
• Drying shrinkage was found to have minimal change overall, with approximate
decreases of 100 microstrain from 611 to 517 lb/yd3 and of 50 microstrain from 0.50
to 0.40 w/cm.

43
References Almutairi, W. (2017). Optimization of Concrete Mixtures for Use in Structural Elements. Theses and Dissertations. 2482. Aktan, H. M., Fu, G., Dekelbab, W., and Attanayaka, U. (2003). Investigate causes & develop methods to minimize early-age deck cracking on Michigan bridge decks. Rep. No. RC- 1437, Transportation Research Board, Washington, D.C. Arkansas State Highway and Transportation Department (AHTD) (2013), Standard Specifications for Highway Construction. ASTM C138. (2014). Standard Test Method for Density (Unit Weight), Yield, and Air Content (Gravimetric) of Concrete. ASTM C138/C138M, West Conshohocken, PA. ASTM C143. (2000). Standard test method for slump of hydraulic-cement concrete. ASTM International, West Conshohocken, USA. ASTM C192. (2002). Standard practice for making and curing concrete test specimens in the laboratory. ASTM, West Conshohocken, USA. Babaei, K., and Fouladgar, A. M. (1997). Solutions to Concrete Bridge Deck Cracking. Concrete International, Vol. 19, No. 7, pp. 34. Bucur, R. D., Barbuta, M., Konvalina, P., Serbanoiu, A. A., and Bernas, J. (2017). Studies for Understanding Effects of Additions on the Strength of Cement Concrete. IOP Conf. Series: Materials Science and Engineering 246. Darwin, D., Browning, J., and Lindquist, W. D. (2004). Control of Cracking in Bridge Decks: Observations from the Field. Cement, Concrete, and Aggregates, Vol. 26, No. 2. ElSafty, A., and Abdel-Mohti, A. (2013). Investigation of Likelihood of Cracking in Reinforced Concrete Bridge Decks. International Journal of Concrete Structures and Materials, Vol. 7, No. 1, pp. 79-93. EPA. (2003). Background Document for Life-Cycle Greenhouse Gas Emission Factors for Fly Ash Used as a Cement Replacement in Concrete. Rep. No. EPA530-R-03-016, Environmental Protection Agency, http://www.epa.gov/.
Fowler, D., & Rached, M. (2011). Optimizing Aggregates to Reduce Cement in Concrete Without Reducing Quality. Transportation Research Record: Journal of the Transportation
Research Board, 2240, 89-95. doi:10.3141/2240-12 Mardani-Aghabaglou, A., Son, A. E., Felekoglu, B., and Ramyar, K. (2017). Effect of cement fineness on properties of cementitious materials containing high range water reducing admixture. Journal of Green Building, Vol. 12, No. 1.

44
Mehta, K. (2004). High-performance, high-volume fly ash concrete for sustainable development. International Workshop on Sustainable Development and Concrete Technology. pp. 3-14. Mehta, K. P., and Monteiro, P. J. M. (2006). Concrete Microstructure, Properties, and Materials third edition. McGraw-Hill. Peyton, S. W., Sanders, C. L., John, E. E., and Hale, W. M. (2012). "Bridge deck cracking: A field study on concrete placement, curing, and performance." Constr.Build.Mater., 34 70-76. Qasrawi, H. (2016). Design of Normal Concrete Mixtures Using Workability-Dispersion- Cohesion Method. Advances in Civil Engineering, 2016.
Reed, N. T., and Hale, W. M. (2013). Controlling strength gain and permeability using slag cement. Magazine o Concrete Research, 65(6), 350-357. Salem, R., & Burdette, E. (2004). Development of an optimal high-performance concrete mixture for Tennessee bridge decks. WIT Transactions on The Built Environment, 76. Schmitt, T. R., & Darwin, D. (1999). Effect of material properties on cracking in bridge decks. Journal of Bridge Engineering, 4(1), 8-13. Seo, T. S., Ohno, Y., & Nakagawa, T. (2007). Cracking behavior of concrete containing fly ash due to drying shrinkage. In Proceedings of an International Conference on Sustainable
Construction Materials and Technologies (Chun, Claisse, Naik and Ganjian (Eds)). Taylor and Francis Group, London (pp. 165-169)
Skalny, J., & Roberts, L. R. (1987). High-Strength Concrete. Annual Review of Materials
Science, 17(1), 35-56.
Taylor, P., Yurdakul, E., & Brink, M. (2015). Performance-Based Proportioning. Concrete
International, 37(8), 41-46. Thomas, M. (2007). Optimizing the Use of Fly Ash in Concrete. Portland Cement Association, 1-24. Wassermann, R., Katz, A., and Bentur, A. (2009). Minimum cement content requirements: a must or a myth? Mater.Struct., 42(7), 973-982. Weiss, J. (1999). Prediction of Early-Age Shrinkage Cracking in Concrete Elements. Northwestern University. Yurdakul, E. (2010). Optimizing concrete mixtures with minimum cement content for
performance and sustainability. Iowa State University Yurdakul, E., Taylor, P. C., Ceylan, H., & Bektas, F. (2013). Effect of water-to-binder ratio, air content, and type of cementitious materials on fresh and hardened properties of binary and

45
ternary blended concrete. Journal of materials in civil engineering, 26(6), 04014002. Zhang, J., Han, Y. D., & Gao, Y. (2014). Effects of Water-Binder Ratio and Coarse Aggregate Content on Interior Humidity, Autogenous Shrinkage, and Drying Shrinkage of Concrete. Journal of Materials in Civil Engineering, 26(1).


![constellation.uqac.ca · Web view[28] I.A. Altun, Effect of temperature on the mechanical properties of self-flowing low cement refractory concrete, Cement and Concrete Res. 31 (2001)](https://img.pdfslide.net/doc/110x75/5ff3963679b1d92cf624e105/web-view-28-ia-altun-effect-of-temperature-on-the-mechanical-properties-of.jpg)