Embed Size (px)
Citation preview
1316
†To whom correspondence should be addressed.E-mail: [email protected]
Korean J. Chem. Eng., 27(4), 1316-1322 (2010)DOI: 10.1007/s11814-010-0193-8
RAPID COMMUNICATION
Effect of chemical and thermal environments on structuresof mesoporous silica formed in aerosol phase
Sang Hyuk Ye and Sun-Geon Kim†
Department of Chemical Engineering and Materials Science, Chung Ang University,221, Huksuk-dong, Dongjak-gu, Seoul 156-756, Korea
(Received 14 September 2009 • accepted 24 November 2009)
Abstract−Spheres of mesoporous silica were prepared in aerosol phase of acidic TEOS sols having structure-di-recting agents (SDA) such as cetyltrimethylammonium bromide (CTAB) and Pluronic P-123. Their structural character-istics were investigated by systematically varying the chemical and thermal conditions of preparation with TEM, FT-IR,BET and SAXS. Both SDAs produced well-assembled 2-D hexagonal structures. Alcoholic solvent left better orderwith smaller d values than aqueous one. The upper SDA concentration for mesoporosity was much lower in the formerthan the latter. To get the highest order, it was important to obtain the complete self-assembly of SDA molecules with-out any deterioration prior to calcination. Well self-assembled mesophase appeared for the product spray dried at 100 oCand subsequently calcined at 400 oC. One-hour calcination yielded the best order. The number of domains increasedwith the calcination period up to 5 hrs and then decreased in further extended period. CTAB was bonded to silica surfaceto preserve the affinity to OH after it disappeared while P123 was not the case.
Key words: Mesoporous Silica, Structure-directing Agent, Aerosols, Nanostructures, TEOS Sols
INTRODUCTION
Aerosol-phase self assembly has been recently demonstrated tobe a continuous, rapid, simple and flexible method for synthesizingordered mesoporous silica particles [1-4]. During a short flight ofdroplets having silica precursor and structure directing agents (SDA)through a heated tube, self-assembly of the SDA and sol-gel chem-istry are combined to control the mesoporous structures of the par-ticles. They have high surface area and well-organized monodis-perse pores with wide applications, e.g., catalysts, electro-opticalmaterials, controlled release agents, chromatography sorbents andadsorbents. The solvent evaporation starting at the surface of thedroplet during aerosol processing induces the increase of the SDAconcentration and subsequent self assembly of the SDA molecules,which grows radially inward. Unlike films showing progressivechange in mesostructure by increasing the SDA concentration [1],the particles prepared with comparable CTAB concentrations showedonly wormlike disordered or hexagonal mesophases, due to theircurvature [1,2,5,6]. To obtain long-range order, the optimal molarratio of CTAB to TEOS found widely varied between 0.03 and 0.25,depending on chemical and thermal environments of preparation[5-7]. Additional characteristics of the aerosol-phase preparationwas that the mesophases were composed of differently oriented do-mains [6,8,9]. A subtle compromise has to be found between thefluidity needed for the self assembly and the rigidity needed to pre-serve the spherical morphology [7]. Relatively low temperaturesbelow 150 oC were favored for the best organization from semi-solid state [5-7,10], followed by calcinations at high temperature.Lin and Bai [11] reported that pore size was uniform in the synthe-
sized mesophase from 450 oC to 550 oC but got poorer at 650 oC.All of these findings were obtained from precursor solutions hav-
ing different compositions and aerosol reactors with different resi-dence times and flow regimes. In addition, the optimal reactor tem-perature suggested was just for drying and ordering of SDA, leav-ing a more important step of the following pore formation accom-panied by silica solidification to be elucidated. Furthermore, mostresearches on the optimization of preparation conditions were con-centrated on CTAB only.
In this study we fixed the composition of each constituent, ex-cept SDA and solvent, in the precursor solution, reactor dimensionand carrier gas flow rate. Under such condition the best ordering ofthe final mesophase was pursued by varying the nature and con-centration of SDA, solvent composition, reactor temperature, andthe temperature and time of calcination. Both CTAB and P123 werechosen as representative SDAs to study the morphology and for-mation mechanism of the mesophases.
EXPERIMENTAL
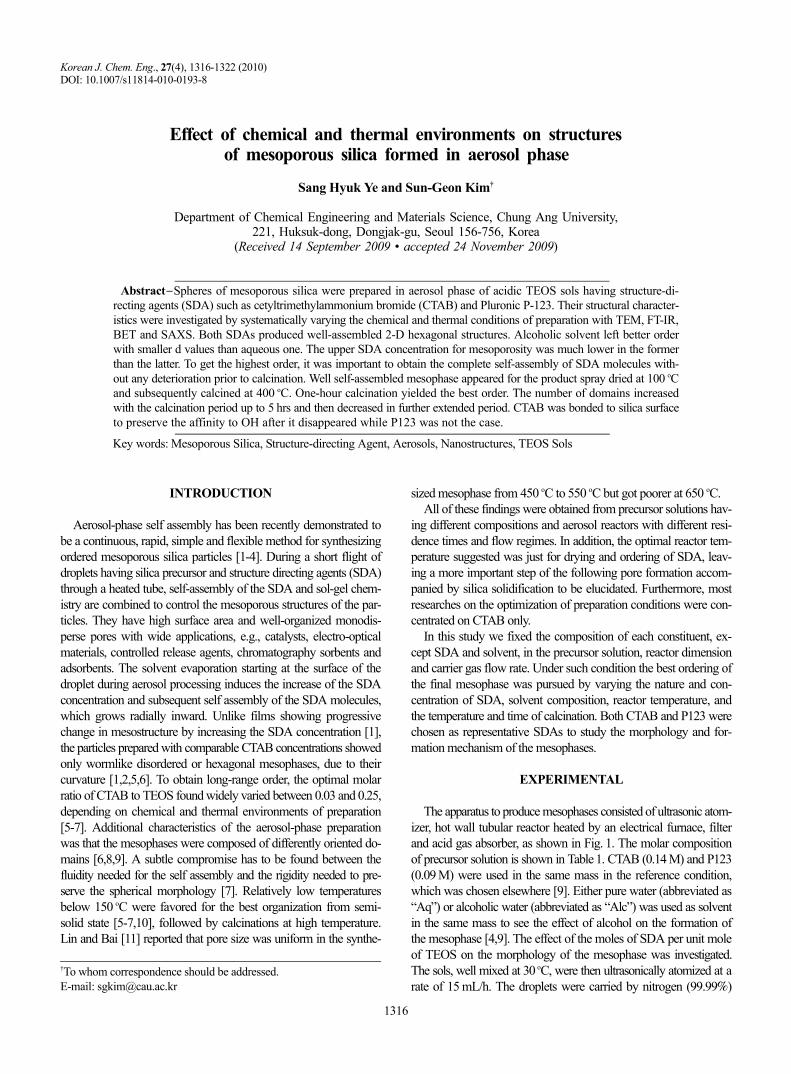
The apparatus to produce mesophases consisted of ultrasonic atom-izer, hot wall tubular reactor heated by an electrical furnace, filterand acid gas absorber, as shown in Fig. 1. The molar compositionof precursor solution is shown in Table 1. CTAB (0.14 M) and P123(0.09 M) were used in the same mass in the reference condition,which was chosen elsewhere [9]. Either pure water (abbreviated as“Aq”) or alcoholic water (abbreviated as “Alc”) was used as solventin the same mass to see the effect of alcohol on the formation ofthe mesophase [4,9]. The effect of the moles of SDA per unit moleof TEOS on the morphology of the mesophase was investigated.The sols, well mixed at 30 oC, were then ultrasonically atomized at arate of 15 mL/h. The droplets were carried by nitrogen (99.99%)
Effect of chemical and thermal environments on structures of mesoporous silica formed in aerosol phase 1317
Korean J. Chem. Eng.(Vol. 27, No. 4)
flowing at 1 L/min through a horizontal tubular reactor made ofquartz, 700 mm long with the diameter of 30 mm, placed in the fur-nace at preset temperatures. The particles exiting from the reactorwere collected by the filter, while water vapor and acid formed inthe reactor were absorbed in caustic solution before exhausting wastegas. The reactor set temperature was varied to see its effect on dry-ing, organization and solidification of the mesophase. The refer-ence reactor temperature was 400 oC.
The particles recovered from the filter, referred to “as-prepared,”were further calcined at different temperatures for different times,to complete pore formation and silica solidification. The referencetemperature and time of the calcination were 400 oC and 1 hr, respec-tively. The mesophase calcined will be called by “calcined.”1. Characterization of Particles
Morphologies of as-prepared and calcined mesophases were ob-served with scanning electron microscope (SEM, Philips 515, PhilipsCo.), transmission electroscope (TEM, Carl Zeiss-EM912, Omega) andhigh resolution transmission electron microscope (TEM, JEM4010,JEOL). Organization of pores was investigated with small angleX-ray spectroscopy (SAXS, Scintag-SDS 2000). Chemical bondsin the mesophases were identified with Fourier-transform infraredspectroscopy (FT-IR, Perkin Elmer FT-IR 1615). BET Sorptome-ter (ASAP 2010, Micromeritics) was used to obtain the informa-
tion on specific surface area, adsorption and desorption isotherms,pore volume, pore size distribution and average pore diameter ofthe mesophase.
RESULTS AND DISCUSSION
1. Effects of Precursor Composition on Morphology of CTAB-Mesophases
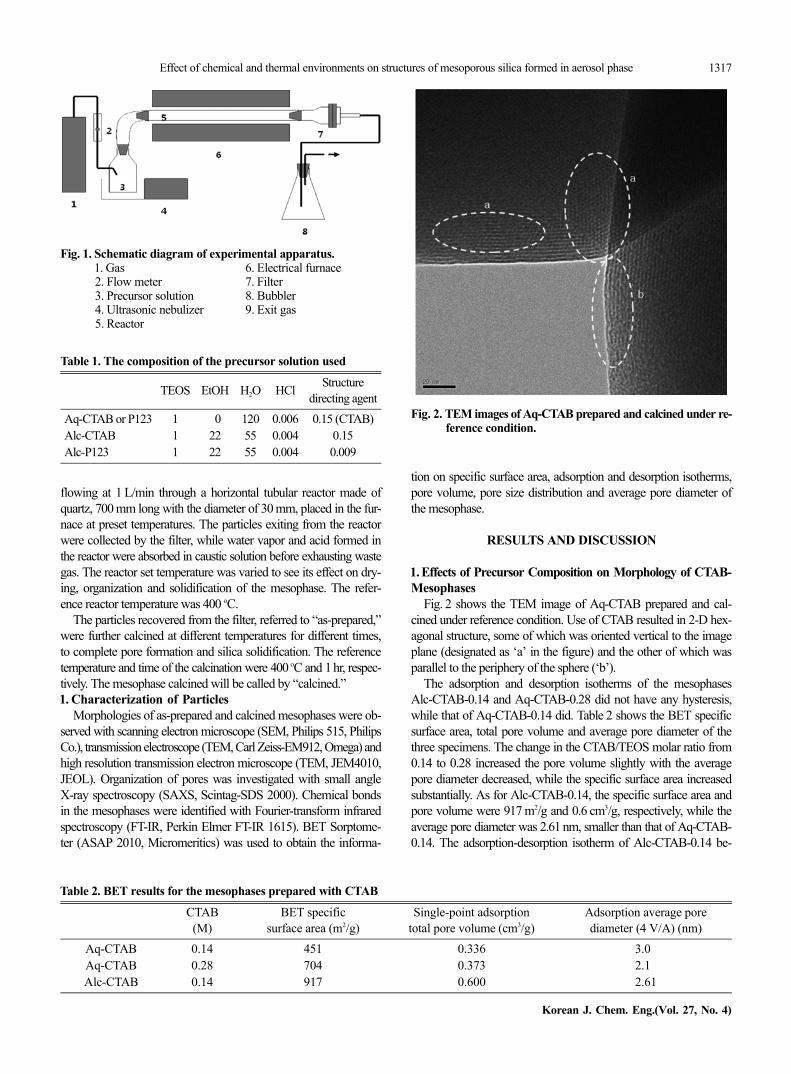
Fig. 2 shows the TEM image of Aq-CTAB prepared and cal-cined under reference condition. Use of CTAB resulted in 2-D hex-agonal structure, some of which was oriented vertical to the imageplane (designated as ‘a’ in the figure) and the other of which wasparallel to the periphery of the sphere (‘b’).
The adsorption and desorption isotherms of the mesophasesAlc-CTAB-0.14 and Aq-CTAB-0.28 did not have any hysteresis,while that of Aq-CTAB-0.14 did. Table 2 shows the BET specificsurface area, total pore volume and average pore diameter of thethree specimens. The change in the CTAB/TEOS molar ratio from0.14 to 0.28 increased the pore volume slightly with the averagepore diameter decreased, while the specific surface area increasedsubstantially. As for Alc-CTAB-0.14, the specific surface area andpore volume were 917 m2/g and 0.6 cm3/g, respectively, while theaverage pore diameter was 2.61 nm, smaller than that of Aq-CTAB-0.14. The adsorption-desorption isotherm of Alc-CTAB-0.14 be-
Fig. 1. Schematic diagram of experimental apparatus.1. Gas 6. Electrical furnace2. Flow meter 7. Filter3. Precursor solution 8. Bubbler4. Ultrasonic nebulizer 9. Exit gas5. Reactor
Table 1. The composition of the precursor solution used
TEOS EtOH H2O HCl Structuredirecting agent
Aq-CTAB or P123 1 00 120 0.006 0.15 (CTAB)Alc-CTAB 1 22 55 0.004 0.15Alc-P123 1 22 55 0.004 0.009
Fig. 2. TEM images of Aq-CTAB prepared and calcined under re-ference condition.
Table 2. BET results for the mesophases prepared with CTAB
CTAB(M)
BET specificsurface area (m2/g)
Single-point adsorptiontotal pore volume (cm3/g)
Adsorption average porediameter (4 V/A) (nm)
Aq-CTAB 0.14 451 0.336 3.00Aq-CTAB 0.28 704 0.373 2.10Alc-CTAB 0.14 917 0.600 2.61
1318 S. H. Ye and S.-G. Kim
July, 2010
longed to type IV among the six isotherm types according to theIUPAC classification, typical for the materials containing orderedmesopores. Alc-CTAB-0.14, as a type of MCM-41, had isothermscontaining no hysteresis loop, due to the very narrow pore size dis-tribution in these materials. The isotherm shape of these materialswas called Type IVa [12]. Aq-CTAB-0.28 was one of type I, typicalfor not mesoporous but microporous materials. It also did not showany order of mesoporosity in TEM image, though not shown here.Aq-CTAB-0.14 belonged to type H2 among the four types of hy-steresis loops according to the IUPAC classification, typical formaterials with complex structures containing interconnected net-works of pores with different size and shape.
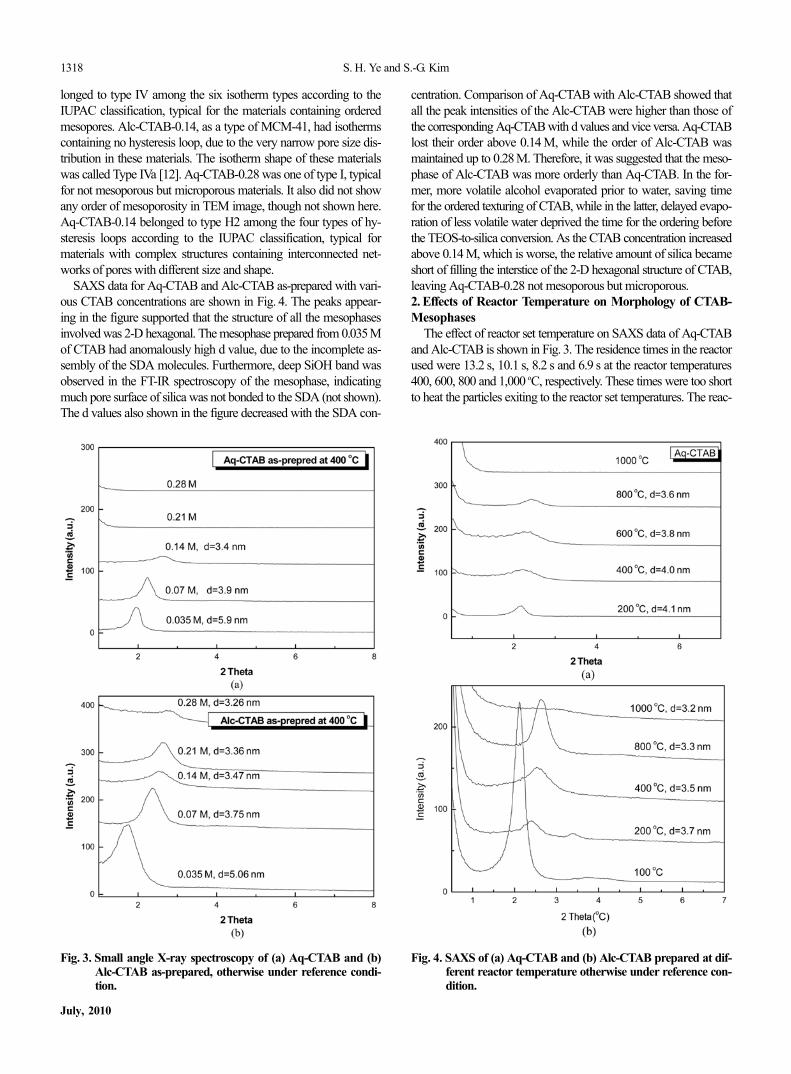
SAXS data for Aq-CTAB and Alc-CTAB as-prepared with vari-ous CTAB concentrations are shown in Fig. 4. The peaks appear-ing in the figure supported that the structure of all the mesophasesinvolved was 2-D hexagonal. The mesophase prepared from 0.035 Mof CTAB had anomalously high d value, due to the incomplete as-sembly of the SDA molecules. Furthermore, deep SiOH band wasobserved in the FT-IR spectroscopy of the mesophase, indicatingmuch pore surface of silica was not bonded to the SDA (not shown).The d values also shown in the figure decreased with the SDA con-
centration. Comparison of Aq-CTAB with Alc-CTAB showed thatall the peak intensities of the Alc-CTAB were higher than those ofthe corresponding Aq-CTAB with d values and vice versa. Aq-CTABlost their order above 0.14 M, while the order of Alc-CTAB wasmaintained up to 0.28 M. Therefore, it was suggested that the meso-phase of Alc-CTAB was more orderly than Aq-CTAB. In the for-mer, more volatile alcohol evaporated prior to water, saving timefor the ordered texturing of CTAB, while in the latter, delayed evapo-ration of less volatile water deprived the time for the ordering beforethe TEOS-to-silica conversion. As the CTAB concentration increasedabove 0.14 M, which is worse, the relative amount of silica becameshort of filling the interstice of the 2-D hexagonal structure of CTAB,leaving Aq-CTAB-0.28 not mesoporous but microporous.2. Effects of Reactor Temperature on Morphology of CTAB-Mesophases
The effect of reactor set temperature on SAXS data of Aq-CTABand Alc-CTAB is shown in Fig. 3. The residence times in the reactorused were 13.2 s, 10.1 s, 8.2 s and 6.9 s at the reactor temperatures400, 600, 800 and 1,000 oC, respectively. These times were too shortto heat the particles exiting to the reactor set temperatures. The reac-
Fig. 3. Small angle X-ray spectroscopy of (a) Aq-CTAB and (b)Alc-CTAB as-prepared, otherwise under reference condi-tion.
Fig. 4. SAXS of (a) Aq-CTAB and (b) Alc-CTAB prepared at dif-ferent reactor temperature otherwise under reference con-dition.
Effect of chemical and thermal environments on structures of mesoporous silica formed in aerosol phase 1319
Korean J. Chem. Eng.(Vol. 27, No. 4)
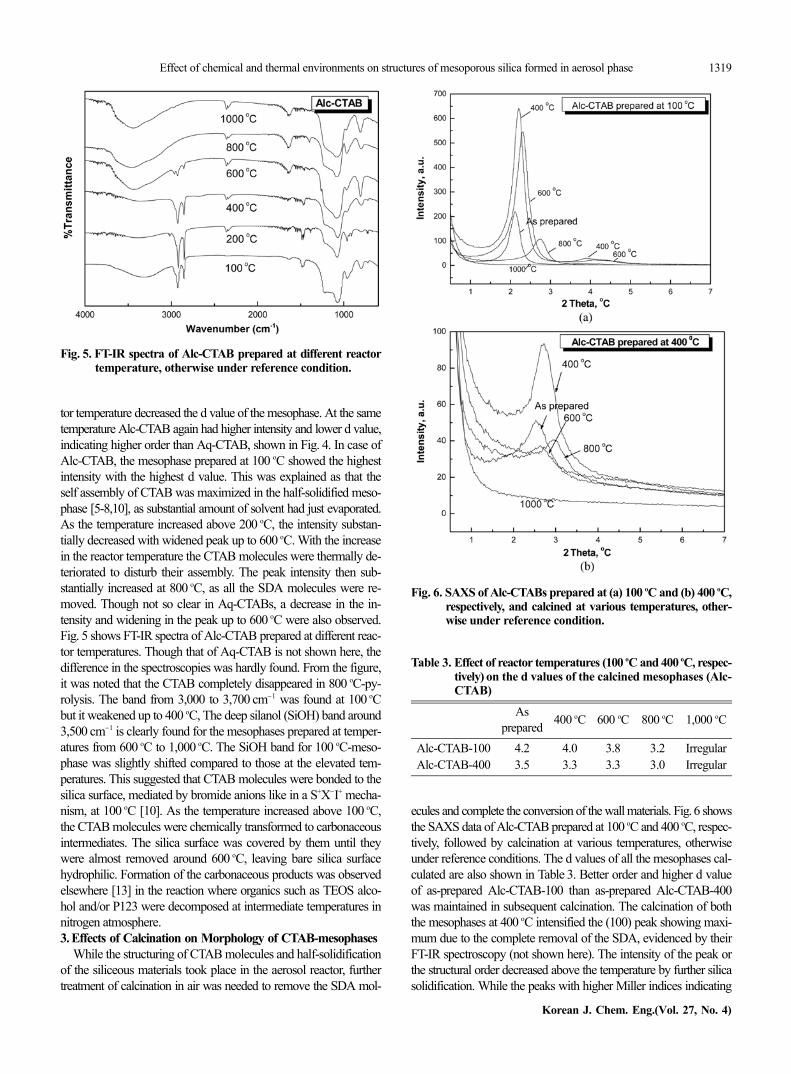
tor temperature decreased the d value of the mesophase. At the sametemperature Alc-CTAB again had higher intensity and lower d value,indicating higher order than Aq-CTAB, shown in Fig. 4. In case ofAlc-CTAB, the mesophase prepared at 100 oC showed the highestintensity with the highest d value. This was explained as that theself assembly of CTAB was maximized in the half-solidified meso-phase [5-8,10], as substantial amount of solvent had just evaporated.As the temperature increased above 200 oC, the intensity substan-tially decreased with widened peak up to 600 oC. With the increasein the reactor temperature the CTAB molecules were thermally de-teriorated to disturb their assembly. The peak intensity then sub-stantially increased at 800 oC, as all the SDA molecules were re-moved. Though not so clear in Aq-CTABs, a decrease in the in-tensity and widening in the peak up to 600 oC were also observed.Fig. 5 shows FT-IR spectra of Alc-CTAB prepared at different reac-tor temperatures. Though that of Aq-CTAB is not shown here, thedifference in the spectroscopies was hardly found. From the figure,it was noted that the CTAB completely disappeared in 800 oC-py-rolysis. The band from 3,000 to 3,700 cm−1 was found at 100 oCbut it weakened up to 400 oC, The deep silanol (SiOH) band around3,500 cm−1 is clearly found for the mesophases prepared at temper-atures from 600 oC to 1,000 oC. The SiOH band for 100 oC-meso-phase was slightly shifted compared to those at the elevated tem-peratures. This suggested that CTAB molecules were bonded to thesilica surface, mediated by bromide anions like in a S+X−I+ mecha-nism, at 100 oC [10]. As the temperature increased above 100 oC,the CTAB molecules were chemically transformed to carbonaceousintermediates. The silica surface was covered by them until theywere almost removed around 600 oC, leaving bare silica surfacehydrophilic. Formation of the carbonaceous products was observedelsewhere [13] in the reaction where organics such as TEOS alco-hol and/or P123 were decomposed at intermediate temperatures innitrogen atmosphere.3. Effects of Calcination on Morphology of CTAB-mesophases
While the structuring of CTAB molecules and half-solidificationof the siliceous materials took place in the aerosol reactor, furthertreatment of calcination in air was needed to remove the SDA mol-
ecules and complete the conversion of the wall materials. Fig.6 showsthe SAXS data of Alc-CTAB prepared at 100 oC and 400 oC, respec-tively, followed by calcination at various temperatures, otherwiseunder reference conditions. The d values of all the mesophases cal-culated are also shown in Table 3. Better order and higher d valueof as-prepared Alc-CTAB-100 than as-prepared Alc-CTAB-400was maintained in subsequent calcination. The calcination of boththe mesophases at 400 oC intensified the (100) peak showing maxi-mum due to the complete removal of the SDA, evidenced by theirFT-IR spectroscopy (not shown here). The intensity of the peak orthe structural order decreased above the temperature by further silicasolidification. While the peaks with higher Miller indices indicating
Fig. 6. SAXS of Alc-CTABs prepared at (a) 100 oC and (b) 400 oC,respectively, and calcined at various temperatures, other-wise under reference condition.
Fig. 5. FT-IR spectra of Alc-CTAB prepared at different reactortemperature, otherwise under reference condition.
Table 3. Effect of reactor temperatures (100 oC and 400 oC, respec-tively) on the d values of the calcined mesophases (Alc-CTAB)
Asprepared 400 oC 600 oC 800 oC 1,000 oC
Alc-CTAB-100 4.2 4.0 3.8 3.2 IrregularAlc-CTAB-400 3.5 3.3 3.3 3.0 Irregular
1320 S. H. Ye and S.-G. Kim
July, 2010
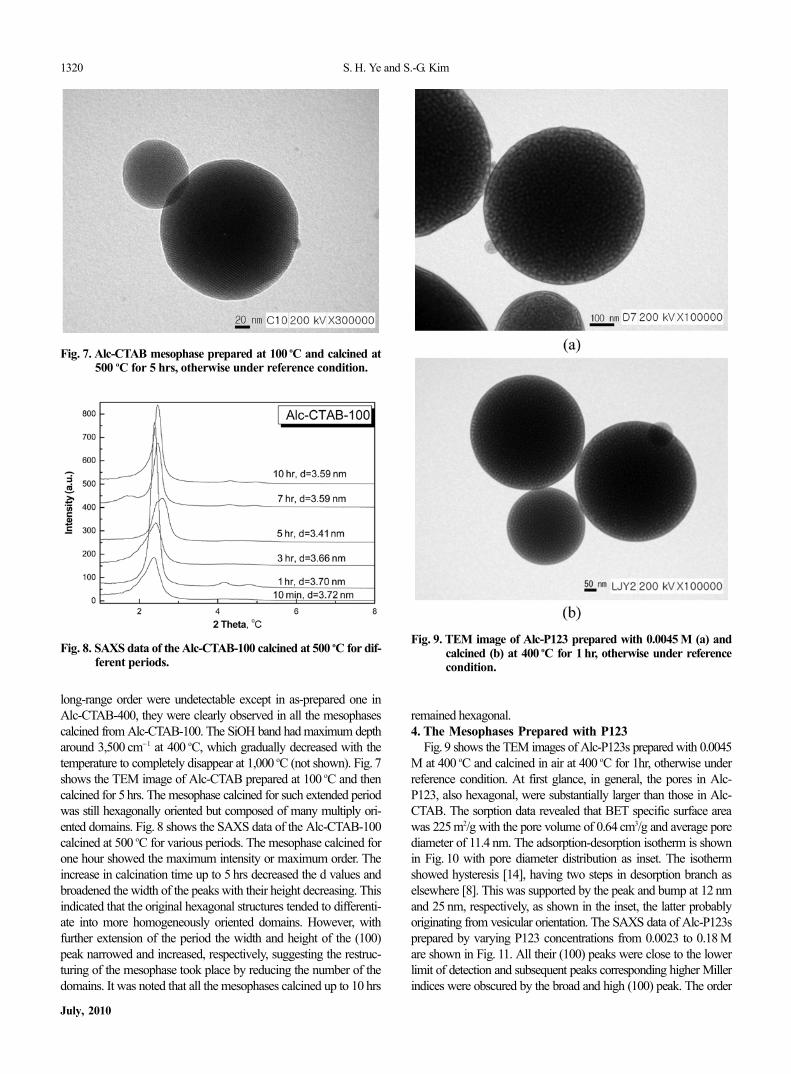
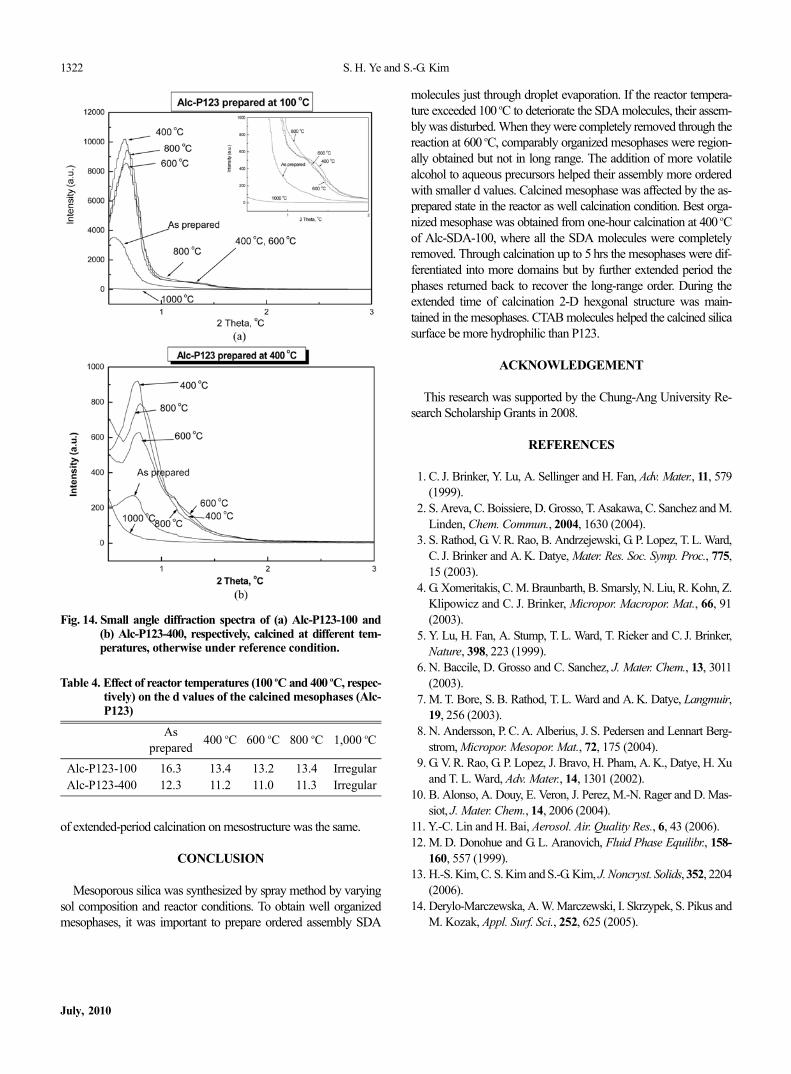
long-range order were undetectable except in as-prepared one inAlc-CTAB-400, they were clearly observed in all the mesophasescalcined from Alc-CTAB-100. The SiOH band had maximum deptharound 3,500 cm−1 at 400 oC, which gradually decreased with thetemperature to completely disappear at 1,000 oC (not shown). Fig. 7shows the TEM image of Alc-CTAB prepared at 100 oC and thencalcined for 5 hrs. The mesophase calcined for such extended periodwas still hexagonally oriented but composed of many multiply ori-ented domains. Fig. 8 shows the SAXS data of the Alc-CTAB-100calcined at 500 oC for various periods. The mesophase calcined forone hour showed the maximum intensity or maximum order. Theincrease in calcination time up to 5 hrs decreased the d values andbroadened the width of the peaks with their height decreasing. Thisindicated that the original hexagonal structures tended to differenti-ate into more homogeneously oriented domains. However, withfurther extension of the period the width and height of the (100)peak narrowed and increased, respectively, suggesting the restruc-turing of the mesophase took place by reducing the number of thedomains. It was noted that all the mesophases calcined up to 10 hrs
remained hexagonal.4. The Mesophases Prepared with P123
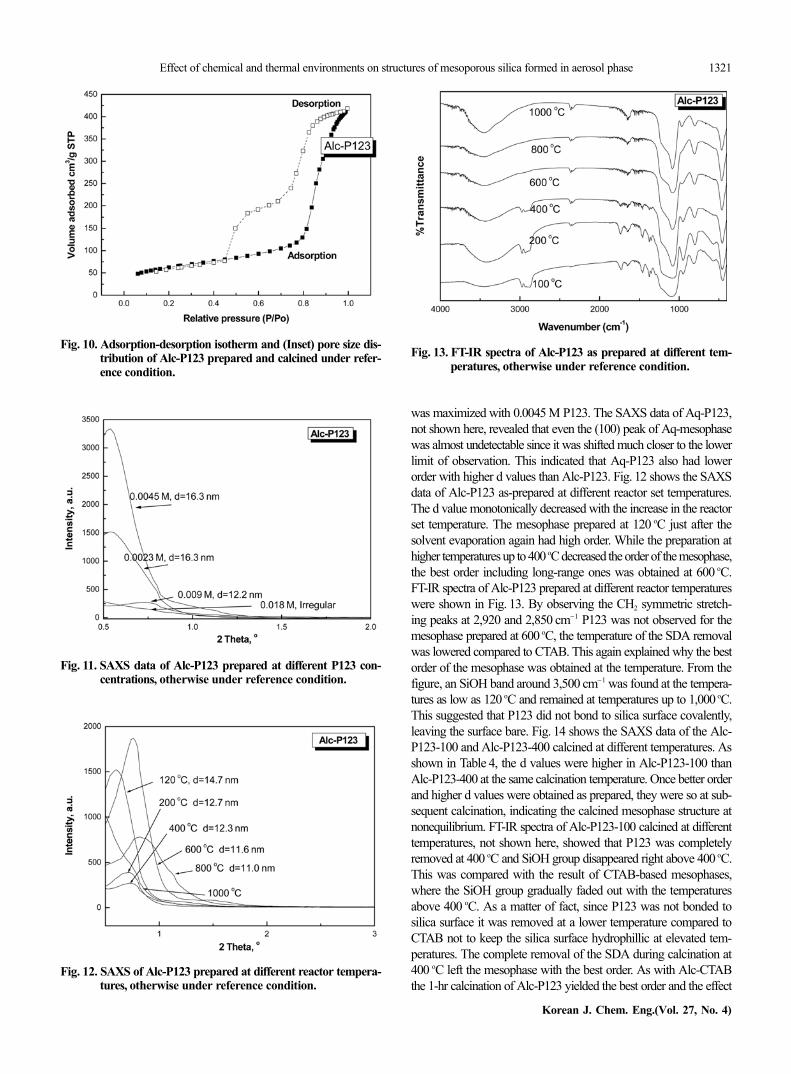
Fig. 9 shows the TEM images of Alc-P123s prepared with 0.0045M at 400 oC and calcined in air at 400 oC for 1hr, otherwise underreference condition. At first glance, in general, the pores in Alc-P123, also hexagonal, were substantially larger than those in Alc-CTAB. The sorption data revealed that BET specific surface areawas 225 m2/g with the pore volume of 0.64 cm3/g and average porediameter of 11.4 nm. The adsorption-desorption isotherm is shownin Fig. 10 with pore diameter distribution as inset. The isothermshowed hysteresis [14], having two steps in desorption branch aselsewhere [8]. This was supported by the peak and bump at 12 nmand 25 nm, respectively, as shown in the inset, the latter probablyoriginating from vesicular orientation. The SAXS data of Alc-P123sprepared by varying P123 concentrations from 0.0023 to 0.18 Mare shown in Fig. 11. All their (100) peaks were close to the lowerlimit of detection and subsequent peaks corresponding higher Millerindices were obscured by the broad and high (100) peak. The order
Fig. 9. TEM image of Alc-P123 prepared with 0.0045 M (a) andcalcined (b) at 400 oC for 1 hr, otherwise under referencecondition.
Fig. 8. SAXS data of the Alc-CTAB-100 calcined at 500 oC for dif-ferent periods.
Fig. 7. Alc-CTAB mesophase prepared at 100 oC and calcined at500 oC for 5 hrs, otherwise under reference condition.
Effect of chemical and thermal environments on structures of mesoporous silica formed in aerosol phase 1321
Korean J. Chem. Eng.(Vol. 27, No. 4)
was maximized with 0.0045 M P123. The SAXS data of Aq-P123,not shown here, revealed that even the (100) peak of Aq-mesophasewas almost undetectable since it was shifted much closer to the lowerlimit of observation. This indicated that Aq-P123 also had lowerorder with higher d values than Alc-P123. Fig. 12 shows the SAXSdata of Alc-P123 as-prepared at different reactor set temperatures.The d value monotonically decreased with the increase in the reactorset temperature. The mesophase prepared at 120 oC just after thesolvent evaporation again had high order. While the preparation athigher temperatures up to 400 oC decreased the order of the mesophase,the best order including long-range ones was obtained at 600 oC.FT-IR spectra of Alc-P123 prepared at different reactor temperatureswere shown in Fig. 13. By observing the CH2 symmetric stretch-ing peaks at 2,920 and 2,850 cm−1 P123 was not observed for themesophase prepared at 600 oC, the temperature of the SDA removalwas lowered compared to CTAB. This again explained why the bestorder of the mesophase was obtained at the temperature. From thefigure, an SiOH band around 3,500 cm−1 was found at the tempera-tures as low as 120 oC and remained at temperatures up to 1,000 oC.This suggested that P123 did not bond to silica surface covalently,leaving the surface bare. Fig. 14 shows the SAXS data of the Alc-P123-100 and Alc-P123-400 calcined at different temperatures. Asshown in Table 4, the d values were higher in Alc-P123-100 thanAlc-P123-400 at the same calcination temperature. Once better orderand higher d values were obtained as prepared, they were so at sub-sequent calcination, indicating the calcined mesophase structure atnonequilibrium. FT-IR spectra of Alc-P123-100 calcined at differenttemperatures, not shown here, showed that P123 was completelyremoved at 400 oC and SiOH group disappeared right above 400 oC.This was compared with the result of CTAB-based mesophases,where the SiOH group gradually faded out with the temperaturesabove 400 oC. As a matter of fact, since P123 was not bonded tosilica surface it was removed at a lower temperature compared toCTAB not to keep the silica surface hydrophillic at elevated tem-peratures. The complete removal of the SDA during calcination at400 oC left the mesophase with the best order. As with Alc-CTABthe 1-hr calcination of Alc-P123 yielded the best order and the effect
Fig. 11. SAXS data of Alc-P123 prepared at different P123 con-centrations, otherwise under reference condition.
Fig. 10. Adsorption-desorption isotherm and (Inset) pore size dis-tribution of Alc-P123 prepared and calcined under refer-ence condition.
Fig. 12. SAXS of Alc-P123 prepared at different reactor tempera-tures, otherwise under reference condition.
Fig. 13. FT-IR spectra of Alc-P123 as prepared at different tem-peratures, otherwise under reference condition.
1322 S. H. Ye and S.-G. Kim
July, 2010
of extended-period calcination on mesostructure was the same.
CONCLUSION
Mesoporous silica was synthesized by spray method by varyingsol composition and reactor conditions. To obtain well organizedmesophases, it was important to prepare ordered assembly SDA
molecules just through droplet evaporation. If the reactor tempera-ture exceeded 100 oC to deteriorate the SDA molecules, their assem-bly was disturbed. When they were completely removed through thereaction at 600 oC, comparably organized mesophases were region-ally obtained but not in long range. The addition of more volatilealcohol to aqueous precursors helped their assembly more orderedwith smaller d values. Calcined mesophase was affected by the as-prepared state in the reactor as well calcination condition. Best orga-nized mesophase was obtained from one-hour calcination at 400 oCof Alc-SDA-100, where all the SDA molecules were completelyremoved. Through calcination up to 5 hrs the mesophases were dif-ferentiated into more domains but by further extended period thephases returned back to recover the long-range order. During theextended time of calcination 2-D hexgonal structure was main-tained in the mesophases. CTAB molecules helped the calcined silicasurface be more hydrophilic than P123.
ACKNOWLEDGEMENT
This research was supported by the Chung-Ang University Re-search Scholarship Grants in 2008.
REFERENCES
1. C. J. Brinker, Y. Lu, A. Sellinger and H. Fan, Adv. Mater., 11, 579(1999).
2. S. Areva, C. Boissiere, D. Grosso, T. Asakawa, C. Sanchez and M.Linden, Chem. Commun., 2004, 1630 (2004).
3. S. Rathod, G. V. R. Rao, B. Andrzejewski, G. P. Lopez, T. L. Ward,C. J. Brinker and A. K. Datye, Mater. Res. Soc. Symp. Proc., 775,15 (2003).
4. G. Xomeritakis, C. M. Braunbarth, B. Smarsly, N. Liu, R. Kohn, Z.Klipowicz and C. J. Brinker, Micropor. Macropor. Mat., 66, 91(2003).
5. Y. Lu, H. Fan, A. Stump, T. L. Ward, T. Rieker and C. J. Brinker,Nature, 398, 223 (1999).
6. N. Baccile, D. Grosso and C. Sanchez, J. Mater. Chem., 13, 3011(2003).
7. M. T. Bore, S. B. Rathod, T. L. Ward and A. K. Datye, Langmuir,19, 256 (2003).
8. N. Andersson, P. C. A. Alberius, J. S. Pedersen and Lennart Berg-strom, Micropor. Mesopor. Mat., 72, 175 (2004).
9. G. V. R. Rao, G. P. Lopez, J. Bravo, H. Pham, A. K., Datye, H. Xuand T. L. Ward, Adv. Mater., 14, 1301 (2002).
10. B. Alonso, A. Douy, E. Veron, J. Perez, M.-N. Rager and D. Mas-siot, J. Mater. Chem., 14, 2006 (2004).
11. Y.-C. Lin and H. Bai, Aerosol. Air. Quality Res., 6, 43 (2006).12. M. D. Donohue and G. L. Aranovich, Fluid Phase Equilibr., 158-
160, 557 (1999).13. H.-S. Kim, C. S. Kim and S.-G. Kim, J. Noncryst. Solids, 352, 2204
(2006).14. Derylo-Marczewska, A. W. Marczewski, I. Skrzypek, S. Pikus and
M. Kozak, Appl. Surf. Sci., 252, 625 (2005).
Fig. 14. Small angle diffraction spectra of (a) Alc-P123-100 and(b) Alc-P123-400, respectively, calcined at different tem-peratures, otherwise under reference condition.
Table 4. Effect of reactor temperatures (100 oC and 400 oC, respec-tively) on the d values of the calcined mesophases (Alc-P123)
Asprepared 400 oC 600 oC 800 oC 1,000 oC
Alc-P123-100 16.3 13.4 13.2 13.4 IrregularAlc-P123-400 12.3 11.2 11.0 11.3 Irregular