Embed Size (px)
Citation preview
1
EFFECT OF CINNAMOMUM CASSIA BARK EXTRACT ON
GLUCOSE HOMEOSTASIS IN ALLOXAN-INDUCED DIABETIC
RATS IN COMPARISON WITH DIRECT RENIN INHIBITOR
(ALISKIREN) AND DIPEPTIDYL PEPTIDASE-IV INHIBITOR
(SITAGLIPTIN)
A thesis submitted in partial fulfillment for the requirements for
the degree of Doctor of Philosophy in Physiology
by
Navaid Kazi

2
Department of Physiology
Faculty of Medicine & Allied Medical Sciences
Isra University, Hyderabad, Sindh
December 2015
EFFECT OF CINNAMOMUM CASSIA BARK EXTRACT ON
GLUCOSE HOMEOSTASIS IN ALLAXON-INDUCED DIABETIC
RATS IN COMPARISON WITH DIRECT RENIN INHIBITOR
(ALISKIREN) AND DIPEPTIDYL PEPTIDASE-IV INHIBITOR
(SITAGLIPTIN)
by
Navaid Kazi
Supervisor/Co-supervisors

3
Prof. Din Muhammad Shaikh (Supervisor)
Professor of Physiology
Prof. Ahmed Azmi (Co-supervisor)
Professor of Physiology
Prof. Mumtaz Qureshi (Co-supervisor)
Professor of Biochemistry
DEDICATION

4
THIS THESIS IS DEDICATED TO MY PARENTS, WIFE AND CHILDREN

5
CERTIFICATE
This is to certify that DR. NAVAID KAZI S/O ABDUL WAHEED KAZI has carried out
research work on the topic “EFFECT OF CINNAMOMUM CASSIA BARK EXTRACT ON GLUCOSE
HOMEOSTASIS IN ALLAXON-INDUCED DIABETIC RATS IN COMPARISON WITH DIRECT RENIN
INHIBITOR (ALISKIREN) AND DIPEPTIDYL PEPTIDASE-IV INHIBITOR (SITAGLIPTIN)” under my
supervision and that his work is original and his thesis is worthy of presentation to Isra University
for awarding the degree of “Doctor of Philosophy” in the subject of Physiology.
Prof. Din Muhammad Shaikh
Supervisor _____________________

6
Department of Physiology Signature of Supervisor
Isra University
7
ACKNOWLEDGEMENT
With the deep and profound sense of gratitude and thanks to the almighty ALLAH
for giving me the chance for completing this thesis, I am greatly indebted to my respected
Supervisor, Prof. Dr. Din Muhammad Shaikh and Co-supervisor, Prof. Dr Ahmed Azmi
and Prof. Dr Mumtaz A Qureshi for their cooperation, guidance and constructive criticism
in the successful completion of this thesis and without their help, this manuscript was not
possible to complete. I am grateful to Prof. Dr. Ghulam Qadir Kazi, the Vice Chancellor
Isra University for his whole heartedly valuable co-operation and support.
My thanks are also to all my colleagues, friends and well wishers for giving me
the support and help during the course of conduct of this study.

8
ABSTRACT
BACKGROUND: Cinnamon is a small evergreen tree belonging to the family
Lauraceae. Cassia is a member of plant family known as Cinnamon. It is also known as
"Java cinnamon", Saigon cinnamon”, "Padang cassia" or as the "Chinese cinnamon".
Cinnamon plays role in the management of diabetes and its complications, and also used
as an herbal remedy. Cinnamon is one of spice having a long history of use as flavoring
agent, preservative and pharmaco-logical remedies.
OBJECTIVES OF STUDY:
To determine effects of cinnamon cassia bark extract (CCBE) on glucose
homeostasis in alloxan induced diabetic rats.
To compare the effect of CCBE vs. Sitagliptin and Aliskerin on glucose homeostasis
in alloxan induced diabetic rats.
To evaluate the anti oxidant activity of CCBE in alloxan induced rats
To compare the anti oxidant effect of CCBE vs. aliskerin and sitagliptin in alloxan
induced diabetic rats.
To observe the protective effects of C. cassia on the histology of Islets of Langerhans
of Pancreas in comparison to aliskerin and sitagliptin in alloxan induced diabetic rats.
SUBJECTS AND METHODS: An experimental – analytical study was conducted at the
Isra University, Al-Tibri Medical College and Liaquat University. Sixty Wistar Albino rats
of either sex were selected according to inclusion and exclusion criteria and were divided
into 6 groups comprising of 10 rats in each group which were further subdivided into 5 in
each sub group. Cinnamomum cassia barks extract (ethanolic) (CCBE), aliskerin and
sitagliptin were given in proper doses. Animal were handled under close supervision

9
during experimentation. The blood samples and pancreatic tissue were stored (-80oC)
and processed in a systemic way. Stem bark of Cinnamomum cassia (cinnamon) was
collected from the local market and authenticated by Botany Department of Sindh
University. Blood glucose, serum insulin, superoxide dismutase and glutathione
peroxidase were determined according to standard methods. Pancreatic tissue was
stained with H & E for microscopic examination. Collected data was analyzed on SPSS
version 21.0. (IBM, corporation, USA) P-value of significance was taken at 0.05.
RESULTS: Blood glucose lowering activity of CCBE was observed at both low
and high doses of 0.3g/day and 0.6g/day respectively. Glucose homeostasis
potential of CCBE was found comparable to sitagliptin. CCBE in combination with
sitagliptin revealed more synergistic effect on blood glucose levels. Serum insulin
was elevated by CCBE. Antioxidant and tissue protective effects of CCBE were
also observed compared to other groups. Superoxide dismutase (SOD) and
glutathione peroxidase (GPX) were found elevated in CCBE. The CCBE treated
animals revealed intact tissue architecture, pancreatic acini, and visible Islets of
Langerhans at both low and high doses.
CONCLUSION: It is concluded that the Cinnamomum cassia bark extract exerts
glucose lowering effects primarily by stimulation of insulin from β-cells of the islets
of Langerhans. Microscopic picture of pancreatic histology revealed intact tissue
in Cinnamomum cassia treated animals. Regenerating pancreatic tissue and
most probably the pancreatic β-cells mass was visibly observed
KEYWORDS: Cinnamomum cassia Sitagliptin Aliskerin Glucose
homeostasis Alloxan Diabetic Rats

10
LIST OF ABBREVIATION
ABBREVIATION
TERM
ACE
AD
AGT
AMPK
ARBs
AT-1
ATMC
ATP
BMI
BPA
BUN
CA
CAE
cAMP
CAT
CCBE
CD 26
DCT
DM
DNA
Angiotensin converting enzyme
Anno Domini
Angiotensinogen
Activated Monophosphate protein kinase pathways
Angiotensin receptor blockers
Angiotensin 1 Receptors
Al Tibri Medical College
Adenosine tri phosphate
Body mass index
Bisphenol A
Blood urea Nitrogen
Cinnamaldehyde
Cinnamomum Aldehyde extract
Cyclic Adenosine Mono phosphate
Cinnamaldehyde treated
Cinnamomum Cassia Bark extract
Cluster of differentiation 26 marker.
Distal convoluted tubule
Diabetes Mellitus
Deoxyribonucleic acid

11
DPP - IV
DRI
DUHS
EC50
ED50
EDTA
EGF
ER
FAO
FRAP
GFR
GIP
GLP
GLUT 2
GPX
GSH
GSSG
HbA1c
HDL
IDF
IFN -
IRS
JECFA
J G cells
LDL
L/min
LSD
MDA
MDP
Dipeptidyl Peptidase- IV
Direct rennin inhibitors
Dow University of health sciences
Effective concentration
Effective dose
Ethylene diamine tetra acetic acid
Endothelial derived growth factor
Endoplasmic reticulum
Federation of agriculture organization
Ferric reducing activity of plasma
Glomerular filtration rate
Glucose dependent insulinotropic peptide
Glicentin like peptide
Glucose transporter -2
Glutathione peroxidase
Reduced Glutathione
Oxidized Glutathione
Glycosylated Hemoglobin
High density lipoprotein
International Diabetes Federation
Interferon gamma
Insulin Receptor substrate
Joint expert committee on food additives
Juxta Glomerular Cells
Low density lipoprotein
Liter per minute
Lysergic acid diethyl amide
Melondialdehyde
Mesoscale discovery plate

12
Mg / liter
MHCP
MICs
g/ liter
mRNA
MSD
MSP
NADPH
NBT
NO
NWFP
OGTT
OP
PBST
PCOs
PDE
PDX-1
PGE2
PI
PNDS
RAAS
RBC
SGOT
SGPT
SOD
SPSS
STZ
TBARS
US- FDA
Milligram per liter
Methyl hydroxyl chalcone polymer
Minimal inhibitor y concentration
Microgram per liter
Messenger Ribonucleic acid
Metabolic assays mouse /rat insulin kit
Medoff sliding plates
Nicotinamide dinucleotide phosphate
Nitrobule tetrazolium
Nitric Oxide
North west frontier province
Oral glucose tolerance test
Octyphenol
Phosphate buffered saline tween
Poly cystic ovarian syndrome
Phosphor - di - esterase inhibitors
Pancreatic and duodenal homeobox
Prostaglandin Eicosanoid
Phosphatidyl – inositol
Pakistan National Diabetes Survey
Renin Angiotensin Aldosterone Mechanism
Red blood cells
Serum glutamic oxaloacetate transaminase
Serum glutamic pyruvate transaminase
Superoxide dismutase
Statistical Package for the social sciences
Streptozotocin (induced diabetes)
Thiobarbituric acid reactive substances
United Sate Food and drugs administration

13
WHO World health organization
TABLE OF CONTENTS
Page #
ACKNOWLEDGEMENT--------------------------------------------------------------- iv
ABSTRACT------------------------------------------------------------------------------- v
LIST OF ABBREVIATION-------------------------------------------------------------
TABLE OF CONTENTS--------------------------------------------------------------
vii
ix
LIST OF TABLES----------------------------------------------------------------------- xii
LIST OF FIGURES--------------------------------------------------------------------- xiii
LIST OF GRAPHS----------------------------------------------------------------------
LIST OF PHOTOMICROGRAPHS
xiv
xvii
CHAPTER – I ---------------------------------------------------------------------------
01
1. INTRODUCTION--------------------------------------------------------------- 01
2. AIMS/OBJECTIVES ---------------------------------------------------------- 3. RATIONALE OF STUDY----------------------------------------------------- 4. Hypothesis-----------------------------------------------------------------------
04
05
06

14
CHAPTER – II ------------------------------------------------------------------------- 07
LITERATURE REVIEW -------------------------------------------------------------- 07
1. Pancreas ------------------------------------------------------------------------ 1.1. Beta cell biology (Islets of Langerhans)-------------------------
07
07
2. Physiology of glucose homeostasis -------------------------------------- 2.1. Source of blood glucose-------------------------------------------- 2.2. Fate of blood glucose level---------------------------------------- 2.3. Significance of glucose homeostasis---------------------------- 2.4. Factors regulating glucose homeostasis------------------------
2.4.1. Insulin----------------------------------------------------------- 2.4.2. Glucagon------------------------------------------------------- 2.4.3. Catecholamines---------------------------------------------- 2.4.4. Cortisol---------------------------------------------------------- 2.4.5. Growth hormone----------------------------------------------
10
11
13
14
15
15
16
17
17
17
3. Incretin hormones-------------------------------------------------------------
3.1. The entero – insular axis------------------------------------------- 3.2. History of incretins---------------------------------------------------- 3.3. The incretin system--------------------------------------------------- 3.4. GLP -1 and Beta cell proliferation-------------------------------- 3.5. GLP -1 and Beta cell neogenesis-------------------------------- 3.6. Dipeptidyl Peptidase IV ( DPP – IV )----------------------------- 3.7. Dipeptidyl Peptidase Inhibitor -------------------------------------
18
18
18
19
23
23
24
25
4. Renin Angiotensin Aldosterone System----------------------------------
4.1. History of discovery -------------------------------------------------- 4.2. Synthesis of circulating renin---------------------------------------
4.2.1. Decreased Stretch of afferent arteriole---------------- 4.2.2. Decreased delivery of salt to the macula densa------------------------------------------------------------ 4.2.3. Adrenergic stimulation -------------------------------------
4.3. Physiology of RAAS ------------------------------------------------- 4.3.1. Alternative Enzymatic pathways-------------------------- 4.3.2. ACE can act on substrates other than Ang I 4.3.3. Angiotensin II can be converted to
Angiotensin III & IV ------------------------------------------ 4.3.4. Components of the RAAS also reside within
25
25
26
27
28
28

15
local tissues --------------------------------------------------- 4.3.5. Angiotensin receptors---------------------------------------
4.4. Direct Renin inhibitors- Aliskerin ---------------------------------- 4.4.1. Aliskerin--------------------------------------------------------- 4.4.2. Mechanism of action of Aliskerin ------------------------ 4.4.3. Aliskerin was co – developed by Swiss
Pharmaceuticals----------------------------------------------
28
29
29
30
30
31
35
35
35
36
5. Cinnamomum Cassia -------------------------------------------------------- 5.1. Over view -------------------------------------------------------------- 5.2. Historical prospective of C. Cassia as medicine-------------- 5.3. Cinnamom used as traditional medicine ------------------------ 5.4. Adult posology & mode of administration ---------------------- 5.5. Non clinical pharmacological data-------------------------------- 5.6. Toxicology---------------------------------------------------------------
5.6.1. Teratogenicity ------------------------------------------------ 5.6.2. Reproductive organs --------------------------------------- 5.6.3. Carcinogenicity----------------------------------------------- 5.6.4. Genotoxicity & mutagenicity------------------------------- 5.6.5. Acute toxicity-------------------------------------------------- 5.6.6. Sub acute & chronic toxicity-------------------------------
36
36
40
41
42
43
47
47
47
47
47
48
48
CHAPTER – III -------------------------------------------------------------------------
50
MATERIALS AND METHODS ---------------------------------------------------- 50

16
3.1. Study Design ------------------------------------------------------------- 50
3.2. Study setting -------------------------------------------------------------- 50
3.3. Duration of study--------------------------------------------------------- 50
3.4. Sample size --------------------------------------------------------------- 3.5. Grouping of animals -----------------------------------------------------
50
50
3.6. Inclusion criteria --------------------------------------------------------- 50
3.7. Exclusion criteria---------------------------------------------------------- 53
3.8. Data collection procedure --------------------------------------------- 53
3.9. Animal housing & experimental details ----------------------------- 53
3.10. Preparation of ethanol based Cinnamomum Cassia ----------- 53
3.10.1. Plant material ------------------------------------------------- 3.10.2. Collection of plant material--------------------------------- 3.10.3. Preparation of plant extract-------------------------------- 3.10.4. Dryness of Cinnamom Stem Bark----------------------- 3.10.5. Check level of Cinnamom Stem Bark dryness---------------------------------------------------------
3.10.6. Sifting of Cinnamom bark powder------------------------ 3.10.7. Preparation of Cinnamom Stem Bark extract 3.10.8. Filtration of mixture ------------------------------------------ 3.10.9. Separation of extract from ethanol----------------------- 3.10.10. Re – Separation of ethanol from extract---------------- 3.10.11. Storage of extract-------------------------------------------- 3.10.12. Animal Sacrifice and Blood sampling------------------- 3.10.13. Determination of Glutathione peroxidase—----------- 3.10.14. Determination of Superoxide dismutase--------------- 3.10.15. Insulin Detection
3.11. Data Analysis--------------------------------------------------------------
54
54
54
54
55
55
55
56
56
56
57
57
58
58
59
60
CHAPTER – IV ------------------------------------------------------------------------- 61

17
RESULTS -------------------------------------------------------------------------------- 61
CHAPTER – V -------------------------------------------------------------------------- 109
DISCUSSION --------------------------------------------------------------------------- 109
CHAPTER – VI ------------------------------------------------------------------------- 131
CONCLUSION -------------------------------------------------------------------------- 131
CHAPTER – VII ------------------------------------------------------------------------- 132
RECOMMENDATIONS --------------------------------------------------------------- 132
REFRENCES ---------------------------------------------------------------------------- 133
APPENDIX - I---------------------------------------------------------------------------
APPENDIX- II----------------------------------------------------------------------------

18
LIST OF TABLES
Chapter Description Page
IV –1 Analysis of variance ( ANOVA ) ------------------------------------ 64
IV –2 Blood glucose level ( mg/dl) in animal groups ------------------ 65
IV-3 Serum Insulin level ((U/ml) in animal groups ------------------ 66
IV-4 Superoxide Dismutase (U/ml) in animal groups --------------- 67
IV-5 Glutathione Peroxidase (U/ml) in animal groups ------------- 68
IV-6 Blood Glucose , Serum Insulin, Superoxide Dismutase &
Glutathione levels in group” A” animals -------------------------
69
IV-7 Blood Glucose , Serum Insulin, Superoxide Dismutase &
Glutathione levels in group” B” animals
70
IV-8 Blood Glucose , Serum Insulin, Superoxide Dismutase &
Glutathione levels in group “C” animals
71
IV-9 Blood Glucose , Serum Insulin, Superoxide Dismutase &
Glutathione levels in group “D” animals
72

19
IV-10 Blood Glucose , Serum Insulin, Superoxide Dismutase &
Glutathione levels in group “E” animals
73
IV-11 Blood Glucose , Serum Insulin, Superoxide Dismutase &
Glutathione levels in group “F” animals 74
LIST OF FIGURES
Figure Description Page
II – 1 Physiological Anatomy of Pancreas, duct system & Islets of
Pancreas 09
II – 2 Utilization of Blood Glucose by different tissues & organs shown
as micromole of glucose ----------------------------------- 12
II – 3 Fate of glucose metabolism ---------------------------------------- 13
II – 4 Incretin effect in normal healthy & diabetic subjects -------- 21
II – 5 Incretin effect in normal healthy & diabetic subjects --------- 22

20
II – 6 Release of Renin & stimulation of Angiotensinogen into
Angiotensi I & Angiotensin II--------------------------------------- 34
II – 7 Release of Renin & stimulation of Angiotensinogen into
Angiotensi I & Angiotensin II --------------------------------------- 35
II – 8 Physiological effect of Renin Angiotensin Aldosterone System --
----------------------------------------------------------------- 36
II – 9 Physiological effect of Renin Angiotensin Aldosterone System --
----------------------------------------------------------------- 37
II – 10 Cinnamomum Cassia -------------------------------------------- 40
LIST OF GRAPHS
IV-1 Bar graphs showing blood glucose distribution among all groups
as a cumulative on different days in all groups -------
75
IV-2 Bar graphs showing insulin secretion among all groups as a
cumulative on different days in all groups --------
76
IV-3 Bar graphs showing Superoxide Dismutase activity as a
cumulative on different days in all groups ------------------------
77

21
IV-4 Bar graphs showing Glutathione peroxidase activity as a
cumulative on different days in all groups -----------------------
78
IV-5 Bar graphs showing blood glucose level in sub groups A1 & A2----
----------------------------------------------------------------------
79
IV-6 Bar graphs showing blood insulin level in sub groups A1 & A2------
---------------------------------------------------------------------
80
IV-7 Bar graphs showing Superoxide dismutase level in sub groups A1
& A2-----------------------------------------------------------
81
IV-8 Bar graphs showing Glutathione peroxidase activity in sub groups
A1 & A2----------------------
82
IV-9 Bar graphs showing blood glucose level in sub groups B1 & B2----
-----------------------------------------------------------------------
83
IV-10 Bar graphs showing blood insulin level in sub groups B1 & B2------
-------------------------------------------------------------------
84
IV-11 Bar graphs showing Superoxide dismutase activity in sub groups
B1 & B2-----------------------------------------------------------
85
IV-12 Bar graphs showing Glutathione peroxidase activity in sub groups
B1 & B2----------------------------------------------------------
86
IV-13 Bar graphs showing blood glucose level in sub groups C1 & C2----
-----------------------------------------------------------------------
87

22
IV-14 Bar graphs showing blood insulin level in sub groups C1 & C2------
--------------------------------------------------------------------
88
IV-15 Bar graphs showing Superoxide dismutase activity in sub groups
C1 & C2---------------------------------------------------------
89
IV-16 Bar graphs showing Glutathione peroxidase activity in sub groups
C1 & C2---------------------------------------------------------
90
IV-17 Bar graphs showing blood glucose level in sub groups D1 & D2----
----------------------------------------------------------------------
91
IV-18 Bar graphs showing blood insulin level in sub groups D1 & D2------
------------------------------------------------------------------
92
IV-19 Bar graphs showing Superoxide dismutase activity in sub groups
D1 & D2--------------------------------------------------------
93
IV-20 . Bar graphs showing Glutathione peroxidase activity in sub
groups D1 & D2----------------------------------------------------------
94
IV-21 Bar graphs showing blood glucose level in sub groups E1 & E2----
------------------------------------------------------------------------
95
IV-22 Bar graphs showing blood insulin level in sub groups E1 & E2------
---------------------------------------------------------------------
96
IV-23 Bar graphs showing Superoxide dismutase activity in sub groups
E1 & E2-----------------------------------------------------------
97

23
IV-24 Bar graphs showing Glutathione peroxidase activity in sub groups
E1 & E2----------------------------------------------------------
98
IV-25 Bar graphs showing blood glucose level in sub groups F1 & F2-----
-----------------------------------------------------------------------
99
IV-26 Bar graphs showing blood insulin level in sub groups F1 & F2-------
---------------------------------------------------------------------
100
IV-27 Bar graphs showing Superoxide dismutase activity in sub groups
F1 & F2----------------------------------------------------------
101
IV-28 Bar graphs showing Glutathione peroxidase activity in sub groups
F1 & F2----------------------------------------------------------
102

24

25
LIST OF PHOTOMICROGRAPH
IV – 1 Group A1. (Control). Normal Architecture or Pancreas, is visible
and islet of Langerhans are also visible. X100 (H & E)-------------
--------------------------------------------------------------
103
IV – 2 Group A2 (Alloxan induced Rats) completely disturbed
Architecture of pancreas, islet of Langerhans is not properly
visible. X100 (H&E)----------------------------------------
103
IV – 3 Group B1 (CCBE 0.3g/dl). Islets of Langerhans are partially
visible but smaller in size X100 (H&E)-----------------
104
IV – 4 Group B2 (CCBE 0.6g/dl) Anatomical architecture of pancreas
is visible, with islets of Langerhans showing moderate recovery.
X400 (H&E)-----------------------------------
104
IV – 5 Group C1 (Aliskerin) Anatomical Architecture of pancreas is
disturbed; islets of Langerhans are also invisible. X100 (H&E)---
-------------------------------------------------------------------
105
IV– 6. Group C2 (Aliskerin) Anatomical architecture of pancreas is
disturbed; islets of Langerhans are also invisible. X100 (H & E)--
-----------------------------------------------------------------
105
IV– 7 Group D1 (Sitagliptin) Anatomical architecture of pancreas is
partially disturbed; with mild recovery of islets of Langerhans.
X400 (H & E)-------------------------------------------
106
IV– 8. Group D2 (Sitagliptin) Anatomical architecture of pancreas is
partially disturbed; with mild recovery of islets of Langerhans.
X400 (H & E)-------------------------------------------
106
IV– 9 Group E1 (Low dose CCBE+Aliskerin) Anatomical architecture
of pancreas is mildly distorted with partial recovery of islets of
Langerhans. X200 (H&E)------------------

26
107
IV– 10 Group E2 (Low dose CCBE+Sitagliptin) Anatomical architecture
of pancreas is nearly well defined; islets of Langerhans are
moderately visible. X100 (H & E)-------------
107
IV– 11 Group F1 (High Dose CCBE+Aliskerin) Anatomical architecture
of pancreas is mildly disturbed with partial recovery of islets of
Langerhans. X200 (H & E)----------------
108
IV– 12 Group F2 (High Dose CCBE+Sitagliptin) Anatomical
architecture of pancreas is well defined; islets of Langerhans
are almost recovered. X200 (H & E)--------------
108
CHAPTER I
1. INTRODUCTION
Diabetes mellitus (DM) is a syndrome characterized by chronic
hyperglycemia caused by relative or absolute insulin deficiency. (1, 2) The
chronic hyperglycemia, in long term causes damage in the target organs like eye,

27
nerves, kidney, heart and blood vessels. (3, 4) According to international diabetes
federation (IDF), the number of diabetics at the age of twenty is going to rise from
285 million in 2013. (4) The Pakistan ranks six position regarding diabetes burden
in whole world. (5) According to an estimate of Shera, et al. there are 15%
Pakistani’s with diagnosed DM millions more who remain undiagnosed / unaware
of having DM.(6) Pakistan National diabetes survey (PNDS) revealed that for
each diagnosed case of DM there are 2 cases of undiagnosed DM and 3 cases of
impaired glucose tolerance approximately. (6, 7)
The incidence of type-2 DM is increasing rapidly around the world. DM is
the most common of the endocrine disorder in which homeostasis of
carbohydrate and lipid metabolism is improperly regulated by insulin. (2, 8, 9)
Insulin is the ideal treatment for diabetes in the conditions where blood glucose
levels cannot be controlled by oral hypoglycemic agents. The application of
insulin and administration of oral hypoglycemic agents has involved in the
management of diabetes. Despite the adverse drug effects the researchers tried
to adopt some hypoglycemic agents of plant origin particularly in the developing
countries. (10) It has been noted that spices play a major role in the
management of diabetes and its complications, and also used as an herbal
remedy. (6,11)
Cinnamon is one of such spices having a long history of use as spice,
preservative, medicinal use and flavoring additive, (12) and is associated with
increased risk of various ailments. (13) Cinnamon is a small evergreen tree
belonging to the family Lauraceae. It has two varieties Cinnamomum cassia and
Cinnamomum zylanicum having both in vitro and in vivo anti-diabetic effect. (14)
Aliskiren is the first agent in a new class of orally effective direct rennin inhibitors

28
approved for hypertension treatment. (15) In contrast to conventional RAS
blockers angiotensin- converting enzyme (ACE) inhibitors and Angiotensin II type
1 receptor blockers (ARBs), Aliskerin blocks RAAS by directly inhibiting plasma
rennin activity and preventing the formation of both Angiotensin I and Angiotensin
II as demonstrated by basic and clinical findings. (16, 17) Data from the AVOID
trial suggest that the addition of Aliskerin to an ARB provides an additive anti-
proteinuric effect compared to that of the ARB alone. (18) From the ALTITUDE
study (19), the potential cardiorenal benefits and safety of Aliskerin in a broad
range of high-risk patient with TD2M remain controversial.
Dipeptidyl Peptidase-IV (DPP-IV), also known as adenosine deaminase
complexing protein 2, degrades both glicentin-like peptide (GLP) and glucose
dependent insulinotropic peptide (GIP) to metabolites which are physiologically
inert. Competitive inhibition of DPP- IV by drugs increases the half-life of GLP
and GIP. The available DPP- IV inhibitors include Sitagliptin, linagliptin, alogliptin,
and vildgliptin. The first four are approved in the USA for the treatment of T2DM,
while vildagliptin has been approved for use in Europe and Latin-America.
Several other agents of DDP-IV inhibitors are in phase III clinical trials and
include dutogliptin and gemigliptin. With daily doses ranging from 100mg for
Sitagliptin to 5mg for saxagliptin and linagliptin, the drugs are all similar in their
efficiency in lowering Hb A1c levels, safety profile, and patient tolerance, (20)
DPP –IV inhibitors result in a mean decrease in HbA1C ranging between 0.5%
and 1%.(21). The present study is proposed to study the effects of Cinnamomum
cassia bark extract on glucose homeostasis in comparison to sitagliptin and
aliskerin in alloxan induced diabetic rat model.

29
2. OBJECTIVES OF STUDY
To determine effects of cinnamon cassia bark extract (CCBE) on glucose
homeostasis in alloxan induced diabetic rats.
To compare the effect of CCBE vs. Sitagliptin and Aliskerin on glucose
homeostasis in alloxan induced diabetic rats.

30
To evaluate the anti oxidant activity of CCBE in alloxan induced rats
To compare the anti oxidant effect of CCBE vs. aliskerin and sitagliptin in
alloxan induced diabetic rats.
To observe the protective effects of C. cassia on the histology of Islets of
Langerhans of Pancreas in comparison to aliskerin and sitagliptin in alloxan
induced diabetic rats.
3. RATIONALE OF STUDY
Currently, the Pakistan is suffering a serious epidemic of DM, with millions
of diagnosed cases of DM and thousands of new cases. Cinnamomum cassia in
comparison with the present study is intended to investigate the effect of direct
rennin Inhibitor (Aliskiren) and Dipeptidyl-peptidase IV inhibitor (Sitagliptin), on

31
the glucose metabolism, physiology and cellular effects at the level of beta cell
pancreas in alloxan induced diabetic rat model.
The rational of study is to develop a therapeutic approach for managing
glucose homeostasis by repairing the injury of endocrine pancreas with the help
of Cinnamomum cassia (Herb) in comparison with direct rennin inhibitor
(Aliskiren) and Dipeptidyl-peptidase IV inhibitor (Sitagliptin) in alloxan induced
diabetic rat model.
4. HYPOTHESIS
The comparison between Cinnamomum cassia with direct rennin
(Aliskiren) and Dipeptidyl peptidase- IV inhibitors in glucose homeostasis will be
studied

32
Null Hypothesis: Cinnamomum cassia does not have anti diabetic effect on
alloxan induced diabetic rats.
Alternative Hypothesis: Cinnamomum cassia has anti diabetic effect in alloxan
induced diabetic rats.
CHAPTER II
LITERATURE REVIEW
1. PANCREAS

33
The pancreas is a retroperitoneal organ which lies horizontally extending
from C loop of duodenum to the hilum of spleen. Anatomically, pancreas is
divisible into head, neck, body and tail. The head of pancreas lies sandwiched in
the C loop of duodenum, posterior to hanging transverse colon. The anterior
surface of body of pancreas is covered by peritoneum. The tail lies in lieno -renal
ligament of spleen. (22). Physiologically, pancreas has exocrine and endocrine
parts, serves two major functions:
(i) Exocrine part: comprises of 85% of pancreatic tissue, produces digestive juice
rich in enzymes. The digestive juice is secreted by acinar cells. The pancreatic
digestive juice enters second part of duodenum through duct; and
(ii) Endocrine part: The blood regulation of glucose level, which is achieved by
endocrine cells of the islets of Langerhans.
Embryologically, pancreas is derived from a ventral and dorsal pancreatic
bud at the junction of fore and mid gut. The ventral bud gives rise to head and
uncinate process of pancreas, while dorsal bud becomes pancreatic body and
tail. Pancreatic ventral bud has a separate duct called “duct of Wirsung” and
“duct of Santorini” is that of dorsal bud in adult life. (22).
1.1. βeta cell Biology- Islets of Langerhans
The pancreas contains around 1 million of Islet of Langerhans in a
normal adult. The size of Islet of Langerhans varies from 40-900µm. The larger
Islet of Langerhans lie very close to arteriole and venules, whilst smaller one lie
embedded deep within pancreatic core tissue. Most of the Islet of Langerhans
contain 300-4000 cells of five major types;
i. α-(alpha) cells: secrete glucagon, an antagonistic hormone of insulin.

34
ii. β-(beta) cells: produce insulin which is the main blood glucose regulating
hormone of endocrine pancreas.
iii. β-(beta) cells: release amylin, which counter regulates the insulin secretion
and functions.
iv. β-(beta) cells: secrete pancreastatin. The pancreastatin decreases release
of insulin and somatostatin, increases release of glucagon, and inhibits the
exocrine secretions.
v. δ- (delta) cells: produce somatostatin. The somatostatin is general
inhibitory hormone. It inhibits secretion of gut and endocrine pancreas.
vi. ε- (Epsilon) cells: secrete Gherlin hormone that both release and augment
physiological functions of insulin. (22)

35
Figure. II-1. Physiological anatomy of Pancreas, duct system and Islets of
Pancreas. Adapted from: Samikannu, (23)
2. PHYSIOLOGY OF GLUCOSE HOMEOSTASIS

36
Blood glucose varies throughout 24 hours. It is affected by multiple factors
like tissue metabolism, glucose supply and hormonal factors. Normal blood
glucose in post-prandial period peaks to 200 mg/dl and in fasting is up to 100
mg/day. Thus blood glucose level is maintained by various physiological factors
within a narrow range defined as normoglycemia.
Normoglycemia is tightly controlled by co- and counter regulatory
mechanisms of neural and hormonal systems. Blood glucose of ≤20mg/dl
produces complete inhibition of insulin release, and stimulates counter regulatory
hyperglycemic hormone called the glucagon.
Central gluco-receptors of hypothalamus are regulated by blood glucose
level, thus hypothalamus plays a central role in glucose homeostasis. Whenever,
blood glucose declines, the counter regulatory mechanisms come into action and
include;
Sympathetic nerve stimulation
Anti-insulin hormones
o Catecholamine
o Glucagon
o Cortisol
o Growth hormone—etc.
Counter regulatory mechanism maintain a normal glucose homeostasis by
counter regulating the insulin. Thus there is balance between insulin and anti -
insulin hormones to maintain a normal balance of blood glucose. (24)
2.1. Source of Blood Glucose:

37
Diet is the most important sole source of blood glucose. But during inter-
digestive phases, the liver in particular plays major role by i ts glycogen contents.
Liver maintains normoglycemia through;
Glycogenolysis: is defined as the lysis of liver glycogen.
Gluconeogenesis: is the synthesis of de-novo glucose from non-carbohydrate
sources such as pyruvate, lactate and glycerol etc.(24, 25).

38
Figure. II-2. Utilization of blood glucose by different tissues and organs shown as
micromole of glucose. Adapted from SHRAYYEF, et al(24)
2.2. Fate of Blood Glucose level

39
Blood glucose is utilized by various body cells, tissues, organs and
systems. The inter-digestive periods are essential as the external sources of food
are not available. Some body organs like liver perform functions of maintaining
blood glucose homeostasis. Disposal of glucose occurs through a number of
limited metabolic pathways, as below;
Glucose is metabolized by glycolysis, Krebs cycle and oxidative
phosphorylation. During aerobic conditions final product of glucose is
pyruvate, while under anaerobic conditions lactate is the final product. But
lactate may be converted into pyruvate once oxygen is available.
Glucose is broken down by glycolysis and other pathways to release energy,
which is then captured in form of high energy phosphate bonds like ATP
(adenosine triphosphate).
Lactate and pyruvate may enter various cycles to yield energy.
(24-26).
The fate of blood glucose level is shown in figure II-3.
Figure. II-3. Fate of glucose metabolism. Adapted from SHRAYYEF, et al (24)
2.3. Significance of Glucose Homeostasis

40
Blood glucose is an obligatory food for the extraction of energy by all cells
of human body. Certain organs are completely glucose dependent and insulin
independent like;
Neurons
Kidneys – medullary part
Red blood cells
Retina
Schwann cells
Enterocytes
The above tissues are affected at the most during hypo- and/or
hyperglycemic conditions. With prolonged starvation, ketone bodies are produced
by liver and released into blood. Ketone bodies cross blood brain barrier and are
utilized by neurons also.
Blood glucose levels <55 mg/dl disturbs brain physiology. Glucose levels
<20 mg/dl may result in permanent damage of various parts of brain. The
resulting conditions are coma, convulsions, brain damage, amnesia, and death.
(24-29).
2.4. Factors Regulating Glucose Homeostasis

41
Neurohormonal factors are involved in the blood glucose homeostasis.
There is balance between hypoglycemic hormone, insulin vs. hyperglycemic
hormones (anti-insulin hormones) as glucagon, cortisol, growth hormone,
catecholamine and thyroxine, etc. (25, 27, 28-30)
Physiological effects of various hormones on glucose homeostasis are
described as under:
2.4.1. Insulin
Insulin is a peptide hormone comprising of 51 amino acids, arranged in
two chains. It is secreted by the β- cell of “Islet of Langerhans” of Pancreas.
Insulin is called as the “hormone of abundance” because of availability of
food is handled by it. When food reaches in stomach, the insulin secretion and
synthesis are switched on.
Insulin stores the food in reservoirs like liver, skeletal muscle and adipose
tissue.
Insulin functions through its membrane receptor. Its receptor shows tyrosine
kinase activity.
Glucose transporters are translated and inserted in cell membrane, which
internalize the blood glucose into intracellular compartment.
Insulin exerts following effects on the blood glucose level;
o Transport of blood glucose into cell
o Glycogenolysis is inhibited in liver.
o Glycogen synthesis is stimulated
o Gluconeogenesis is inhibited
o Lipogenesis stimulation

42
o Lipolysis inhibition
Physiological effects of insulin are shown in table II.
Insulin release is increased by 3-4 times after meal intake. On the contrary,
blood glucose <50mg/dl causes a 80-90% reduction in insulin release.
Carbohydrates, fat and protein meals equally stimulate insulin release. Food
intake stimulates gut related local hormones, known as incretins, which circulate
through local blood vessels and stimulate insulin release.
(24, 28-31)
2.4.2. Glucagon
Glucagon is synthesized and secreted by the α-cells of Islets of
Langerhans.
Glucagon is anti-insulin hormone
It is peptide in structure i.e. composed of amino acids.
Most potent stimulus is hypoglycemia
Many other also regulate blood glucose
Glucagon receptors are present on cell membrane, and associated with
adenylyl cyclase.
Glucagon stimulates glycogenolysis
Stimulates gluconeogenesis
Stimulates Lipolysis
(24, 25, 30, 32)
2.4.3. Catecholamine

43
Catecholamines are potent anti-insulin hormones, which include
epinephrine, nor-epinephrine and dopamine. Catecholamines are released from
adrenal medulla. They are the anti-insulin hormones released in response to
hypoglycemia. Catecholamine increase blood glucose through
Glycogenolysis
Stimulates gluconeogenesis
Stimulates Lipolysis
Add free glucose to blood vessels.
(24, 25, 28-30, 31)
2.4.4. Cortisol
Cortisol is a steroid hormone synthesized and secreted by adrenal cortex.
Hypoglycemia is a potent stimulus for Cortisol release
Cortisol stimulates glycogenolysis
Stimulates gluconeogenesis.
(24, 25, 28-30, 31)
2.4.5. Growth hormone
Anterior pituitary glands produce growth hormone in response to
hypoglycemia. Growth hormone stimulates glycogenolysis and gluconeogenesis.
(24, 25, 28, 29, 32)

44
3. INCRETIN HORMONES
3.1. The Entero-Insular Axis
Food intake causes release of certain factors from intestinal mucosa which
stimulate endocrine pancreas to release insulin which was first conceptualized to
explain that the oral glucose stimulates more insulin release compared to
parenteral glucose load. Such gut related factors were collectively called as
incretin. (24)
3.2. History of incretins
Bayliss and Starling (1902) first time presented concept that a hormone
(secretin) released from intestinal mucosa stimulates the exocrine pancreas.
Intestinal mucosa extract was administered in patients with type 1 DM, but failed
to improve blood glucose homeostasis.
La Barre (1932) introduced the term ‘incretin’ for factors extracted from the
upper gut mucosa, which caused hypoglycemia. A proposal for therapeutic role of
incretin for DM was introduced by him.
The studies of Leow et al. (1939) concluded the existence of incretins as
“suspicious”. This was followed by a silent gap for incretins for 30 years till 1970.
With the advancement in molecular biology after 70s, the incretin
hypothesis was researched aggressively. Finally, it was proved that the incretins
do exist which revolutionized the DM treatment. (33-35)
3.3. The Incretin System

45
In response to food intake, the gut related L and K cells of intestinal
mucosa release incretin hormones. Incretins stimulate secretion of insulin in
presence of food in intestinal lumen. The insulin becomes available even before
glucose enters into blood commonly called feed forward mechanism, but the
events occur in glucose dependent manner so that no risk of hypoglycemia does
occur.
Incretins regulate blood glucose level through multiple targets; they slow
gastric emptying, inhibit glucagon secretion, reduce satiety and aid in losing
weight. At present two bio molecules are termed under umbrella of incretins;
Glucagon-Like Polypeptide-1 (GLP-1) and
Gastric Inhibitory Peptide (GIP).
It is reported that type 2 DM subjects with controlled glycaemic status
exhibit an effective incretin-effect in response to glucose load compared with
normal healthy counterparts as shown in II-5. (33-36)
Exogenous administration of GLP-1 increases insulin release sufficient to
normalize plasma glucose levels, while GIP in supra physiological doses, exhibits
reduced insulinotropic effect with no effect on blood glucose levels. Therefore,
therapeutic strategies for type 2 diabetes mellitus are focused on the use of GLP-
1 analogues but not with GIP, but the drawback of GLP-1 is its short half life of
just 2 minutes, because it is rapidly cleared from blood by the enzyme Dipetidyl
Peptidase-4 (DPP-4). Recently, synthetic DPP-4 resistant incretins are available
by sophisticated biological techniques. (33-36)
For the glucose lowering potential of incretins, some intact β-cells must be
present to produce glycaemic control; therefore incretins are useful in type 2 DM,
but not in type 1 DM. The negative results of incretins on blood glucose levels
during 1920-1940 were due to the fact that they were used in type 1 DM having

46
no β-cells mass at all. Therefore, one of important therapeutic options was
missed. The GLP-1 mimetic agents resistant to DPP-4 are available with long half
life and effective glycaemic effects. The two GLP-1 mimetics introduced in clinical
practice include the; Exenatide and Liraglutide.
Exenatide, was first introduced as new class of drug in United States in
2005 but in 2007 in Europe. Liraglutide was approved for drug use in Europe in
2009 and in the Japan and United States in 2010. (33-36)

47
Figure. II-4. Incretin effect in normal healthy and diabetes mellitus. Adapted
From SEEWODHRY, et al. (33)

48
Figure. II-5. Incretin effect in normal healthy and diabetes mellitus.
Adapted from SHRAYYEF, et al. (24)
3.4. GLP-1 and β Cell Proliferation

49
GLP-1 over expresses homeobox gene-1 (PDX-1) of the β-cell-specific
transcription factor related to pancreas and duodenum. The gene is implicated in
the expression of insulin gene, glucokinase gene, GLUT2 gene, and also
differentiation of β-cell. The incretins increases β -cell proliferation in in-vitro
experiments via phosphatidyl-inositol (PI)-3-kinase and protein kinase C signaling
interactions.
GLP-1 induces genes and proto-oncogene’s which are implicated in the
cell apoptosis and cell growth like; junD, c-jun, nur77 and c-fos. GLP-1 causes
induction of DNA synthesis as detected by incorporation of tritiated thymidine
incorporation in insulinoma and also in islets of Langerhans in rat model.
Exenadin-4 is a long acting GLP-1 agonist. Exenadin-4 induces β-cells
proliferations and β-cells neogenesis from duct progenitor cells of pancreas type
2 diabetic rat model. (33, 36-41).
3.5. GLP-1 and β cell Neogenesis
The de-novo development of islets of Langerhans cells and β-cells
neogenesis in adult pancreas are highly controversial reports, but evidence
based conclusions showed it happening, especially in transgenic mice and rodent
models.
The In-vivo models have demonstrated that the ductile cells are capable of
giving rise to new β-cells and also the interferon gamma (IFN-γ) over expression.
Wrapping of pancreatic duct with plastic sheaths in order to induce inflammation
with concomitant administration of EGF and gastrin is reported to induce β-cells
proliferation. The β-cells ductile origin from in-situ progenitor cells during acute
pancreatic injury has produced controversial results, as it has been reported in
previous studies. The controversy is that the pancreatic ductile cells whether
50
contribute or not is not proved and is yet controversial hence remains to be
elucidated. (42-46)
3.6. Dipeptidyl Peptidase IV (DPP -IV)
The DPP IV is a 110 KD cell surface glycoprotein. DPP-IV is a serine-
protease which cleaves 2- amino acids from small peptides containing alanine or
proline from N-terminal end. This enzyme, also known as the T-cell antigen
CD26, is found in many locations including intestinal and renal brush-border
membranes, on hepatocytes and capillary endothelial cells and in a soluble form
in plasma. Although its specificity suggests a role of the metabolism of many
endogenous peptides, it seems as DPP IV activity is especially critical for
inactivation of GLP-1. The in vivo N-terminal truncation of both endogenous and
exogenous GLP-1 was likely to have a physiological role in mediating the rapid
degradation of native GLP-1. The peptide has an apparent plasma half-life of
approximately 1–2 minutes and clearance rate is 5–10 L/min, exceeding the
cardiac output by a factor of 2 to 3.
ROUTE OF EXRETION OF GLP. In patients with type 2 diabetes, studies
suggest a correlation between glycemic control and plasma DPP IV activity, but
this does not seem to be correlated to the amount of intact biologically active
hormone in plasma. Targeted disruption of the CD26 gene had increased levels
of intact endogenous GLP-1 supporting the importance of DPP IV in GLP-1
metabolism. DPP IV inhibition was able to completely prevent the N-terminal
degradation of native GLP-1 in vivo and this was also associated with
enhancement of its insulinotropic effects.(38, 47-52)
3.7. Dipeptidyl Peptidase Inhibitor

51
Dipeptidyl peptidase-IV inhibitors completely block the DPP-IV enzyme.
Thus elevate endogenous GLP-1 level and exaggerate the incretin action. DPP-
IV inhibitors are novel blood glucose lowering agents taken orally. DPP-IV
inhibitors may be used as monotherapy or combined with some other antidiabetic
compounds such as sulfonylureas, metformin, and thiazolidinediones. Sitagliptin,
vildagliptin and saxagliptin are already on sale. Other family members such as
linagliptin and alogliptin are in final phases of clinical trials. The proliferative and
anti-apoptotic actions of GLP-1 on islet β-cells have been mirrored by studies
using DPP-IV inhibitors in rodents with induced diabetes mellitus. Mice model on
high fatty diet, treated with streptozotocin (low dose) followed by 2–3 months of
treatment with des-fluoro-sitagliptin showed improvement in fasting and
postprandial blood glucose, increased insulin, and increased numbers of insulin-
positive β-cells in association with normalization of β -cell mass and restoration
toward normal of the β-cell: β-cell ratio. (38, 48-52).
4. RENIN ANGIOTENSIN ALDOSTERONE SYSTEM (RAAS)
4.1. History of Discovery
The story of the discovery of the RAS began more than 100 years ago
(1896). A Finnish Professor of Physiology, Robert A. Tigerstedt (1853–1923), at
the Karolinska Institute in Stockholm, and Per Gustav Bergman, a medical
student, performed a new experiment in rabbit model. Both were inspired by
Charles Dourad Brown Sequard, who was famous for discovering inner
secretions of organs; like injecting extracts of animal organs into experimental
animals. Tigerstedt and Bergman prepared extract of rabbit kidney (donor) and
injected its cold extract into the jugular vein of recipient rabbit model. They

52
observed a consistent rise in systemic blood pressure. It was concluded that the
kidney tissue extract might contained a pressor molecule hence they termed it as
Renin. They further proved that the Renin pressor substance was located in the
cortex of kidney, and that the pressor effect was i ndependent of nervous reflexes.
(Tigerstedt and Bergman 1898). Intriguingly, these observations remain obscured
and forgotten for many years.
Years later, H. Goldblatt (1934) performed experiments on dogs by
clipping one or both kidney arteries. He proved the possibility of pressor
substance is being secreted by kidneys because clipping renal arteries produced
severe hypertension. This was followed by experiments in two laboratories at
Indianapolis and Argentina by scientists. Their experiments proved that the Renin
is produced by kidney but itself is not pressor substance, but rather an enzyme
which converts some other proteins to release pressor peptides which increase
blood pressure. This new agent was termed as angiotensinogen released from
liver. (53-56)
4.2. Synthesis of Circulating Renin
The human genome contains only one copy renin gene called Ren-1c.
However, certain mice strains have two distinct renin genes labelled as Ren-1d
and Ren-2.
Human Ren-1c renin gene expression varies in different organ- systems
of human body. But the kidneys are naturally expressing the gene product, the
renin, in large quantities which is readily releasable into blood capillaries. It is
proved from animal experiments that complete bilateral removal of kidneys leads
to undetectable amounts of renin in the blood plasma. At present, it is known that
the Renin is produced by special cells called juxtaglomerular cells (JG) cells
which are specialized vascular smooth muscle cells located in afferent arteriole

53
near the glomeruli of nephrons. A low salt diet causes increased release of renin
from afferent arterioles. Similar to other hormones, first pre-pro-renin is
synthesized by renin mRNA, which is transported to rough ER. The pre- peptide
is cleaved in rough ER, pro- peptide is cleaved in Golgi apparatus, where renin is
glycosylated with mannose 6 phosphate and deposited in granules. Upon
stimulation, active renin, which is a 40,000-Da single-chain polypeptide enzyme,
is secreted into blood circulation. However, small amounts are secreted into
renal interstitium also.
The JG apparatus plays a major role in regulation and secretion of renin
release. The JG apparatus comprises of glomerular mesangial cells, JG granular
cells of vascular smooth muscles of afferent arterioles and macula densa of distal
part of renal tubules respectively. (28, 29, 54-59)
Three classical stimuli, all elicited by a decline in systemic blood pressure
or alteration in blood volume, which are known to increase renin synthesis and
release as follows:
4.2.1. Decreased stretch of the afferent arteriole:
The granular JG cells of afferent arteriole are very sensitive to vascular
stretch. It is a local effect which is not driven by any neural reflex input.
An increase in JG cell stretch occurs in response to increased systemic
blood pressure, which in turn, increases intracellular calcium. The calcium in turn
increases vascular tone and result is reduced renin release. On the contrary, as
the systemic blood pressure declines, it reduces vascular stretch and hence JG
cells, which become stimulated resulting in release of large quantities of renin into
circulation. (28, 29, 54-59)

54
4.2.2. Decreased delivery of salt (sodium chloride)
to the macula densa:
Macula densa are specialized chemo
sensitive cells located in the distal convoluted tubule (DCT) lying in the
angle of glomerulus of same nephrons. The macula densa functions through the
tubuloglomerular feedback. The tubuloglomerular feedback helps in maintaining
GFR at a steady state. A reduced load of salt in DCT is sensed by macula densa.
This message is conveyed to afferent arteriole and mesangial cells of glomerulus.
The messengers are the ATP, adenosine, NO and increased synthesis of PGE2.
This local chemical modulation stimulates the JG cells of afferent arteriole, to
synthesize and release renin in the circulation. (28, 29, 54-59)
4.2.3. Adrenergic stimulation.
The JG cells are innervated by sympathetic nerve fibers. The sympathetic
nerve endings release neurotransmitter which act on JG cells through β1-
adrenergic receptors. The β1-adrenergic receptors are expressed on the surface
of the JG cells. Stimulated β1-adrenergic receptors increase intracellular cyclic
adenosine monophosphate (cAMP) which stimulates renin release. Sympathetic
nerve fibers of kidney are very potent in action and in stimulating release of renin
and this occurs in response to acute sodium changes and diameters of renal
blood vessels i.e., renal vasoconstriction and vasodilatation. (28, 29, 54-59)
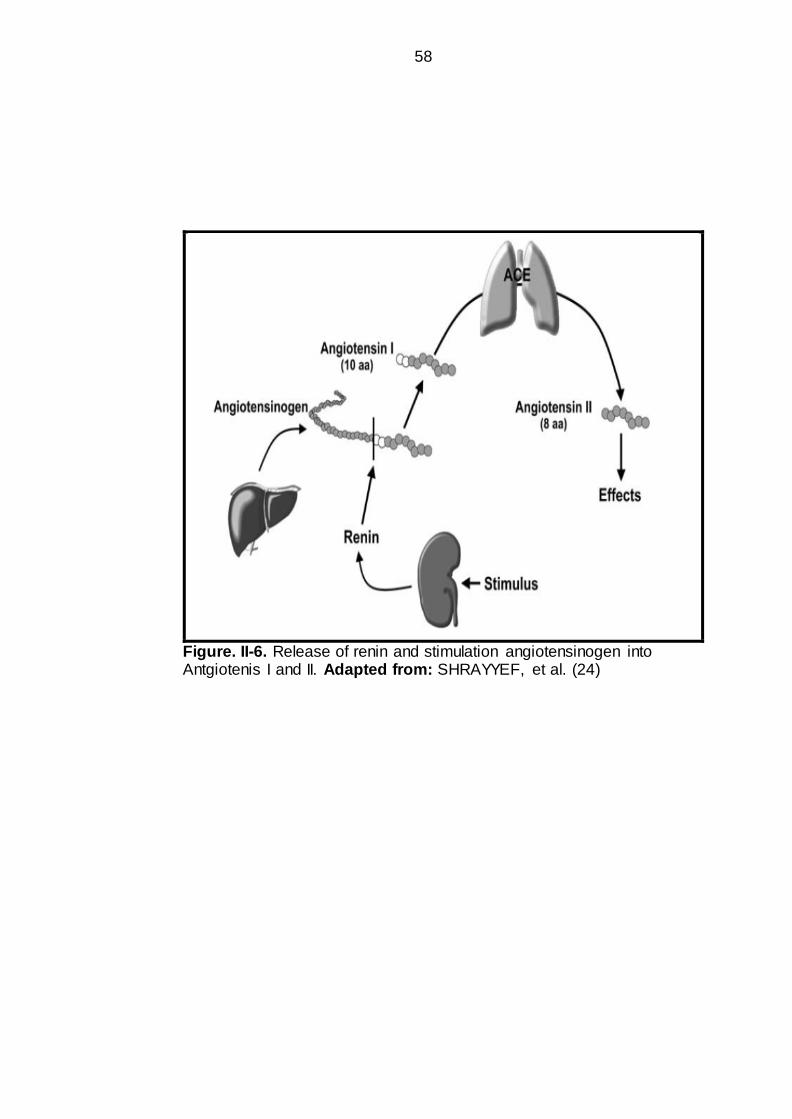
4.3. Physiology of Renin angiotensin aldosterone system (RAAS)
The RAAS was slowly and gradually elucidated as shown in Figure II-6, II-
7 and II-8. In response to stimuli as mentioned above, renin is released from
kidney, and is a proteolytic enzyme. It acts on its substrate, angiotensiongen

55
(AGT). The AGT is a circulating protein (α-2 globulins fraction). The renin cleaves
angiotensiongen into Angiotensin-I (Ang I), which is a decapeptide, containing 10
amino acids. Angiotensin I is biologically inert and is converted into Angiotensin-II
(Ang II) by the action of enzyme. The conversion of angiotensin I to II is mediated
through catalytic action of enzymes called Angiotensin Converting Enzyme
(ACE). Angiotensin-II is an octapeptide containing 8 amino acids. The ACE is
present on the vascular endothelial cell surfaces on whole body, but in particular
the pulmonary blood vessels. (Figure II-6, II-7 and II-8). Angiotensin-II is
biologically active hormones which mediates its physiological actions through
angiotensin receptors. (28, 29, 54-58)
Details are given as under:
4.3.1. Alternative enzymatic pathways are present and are able to convert Ang I and Ang
II (Figure II-6, II-7 and II-8).
Tonin and Cathepsin D are alternative enzymatic agents of renin capable
of converting Ang I into Ang II. Similarly alternative of ACE do exists, and include
trypsin, cathepsins G and heart chymase, which are capable of performing
function similar to ACE. However, the contribution of these alternative pathways
in Ang II production in humans remains ambiguous and needs to be elucidated.
4.3.2. ACE can act on substrates other than Ang I.
The ACE is also capable of degrading substance P, bradykinin and other
small peptides. The physiological role of this enzymatic conversion is not
understood clearly, but it is proved that the ACE inhibition leads to the
accumulation of these substances;
Accumulation of substance P, bradykinin and other small peptides may be
responsible for some of the beneficial effects such as antihypertensive, but may

56
exert adverse effects like angioedema, cough etc similar to ACE inhibitors. (28,
29, 54-58)
4.3.3. Angiotensin II can be converted to
angiotensin III and IV
There are several angiotensin peptide0s with biological effects (Figure II-6,
II-7 and II-8). Angiotensin II may be converted to Ang III [angiotensin-(2-8)] and
Ang IV [angiotensin-(3-8)], respectively. Ang III and IV is suggested of playing
role in the brain, whereas angiotensin-(1-7) has vasodepressor properties.
Angiotensin-(1-7) may be formed directly from Ang I. Vasodepressor activity of
Angiotensin-(1-7) may augment the antihypertensive activity of ACE inhibitor
drugs. (28, 29, 54-58)
4.3.4. Components of the RAAS also reside
within local tissues.
As discussed, most of renin comes from kidney and angiotensiongen
(AGT) comes from liver, but it is also well understood that Renin, AGT and ACE
are expressed in various tissues locally. The local Renin, AGT and ACE system is
known as Tissue (local) RAAS.
Tissue RAAS has been found in heart, brain, gut, pancreas, adrenals,
reproductive organs, blood vessels, renal interstitium and adipose tissue, etc.
Brain and Intrarenal RAAS contribute in salt, water and systemic blood pressure
regulation, whereas, vascular and cardiac RAAS are involved in the
cardiovascular pathophysiology. (28, 29, 54-58)

57
4.3.5. Angiotensin (AT) Receptors
AT-1 and AT-2 are the two main receptor isoforms as detected in rodent
models. AT1 and the AT2 receptors have been cloned and belong to G protein
coupled receptor super family. The AT-1 receptor, in turn, is divided into AT1a
and AT1b. AT4R and AT1-7R and intracellular receptors are some other forms of
receptors.
AT1 receptor: mediates classical physiological functions of Ang II, such as,
vasoconstriction, salt and water retention, cell growth & proliferation. AT1
receptors can be selectively sartans drugs.
AT2 receptors: Fetal tissue expresses AT2 receptors, however, AT2 receptors
are observed at the site of tissue injury. AT2 receptors mediate apoptosis, cell
differentiation, inhibition of cell growth and vasodilatation. (28, 29, 54-58)
58
Figure. II-6. Release of renin and stimulation angiotensinogen into Antgiotenis I and II. Adapted from: SHRAYYEF, et al. (24)

59
Figure. II-7. Release of renin and stimulation angiotensinogen into
antgiotenis I and II. Adapted from SHRAYYEF, et al (24)

60
Figure. II-8. Physiological effects of Renin angiotensin aldosterone
system. Adapted from SHRAYYEF, et al. (24)

61
4.4. Direct Renin Inhibitors- Aliskerin
4.4.1. Aliskerin
Aliskerin is a new class of anti hypertensive drugs. It is first in a class of
drugs labelled as Direct Renin Inhibitors (DRI). Currently, it is licensed for
Primary/Essential Hypertension. In the market, it is available with the trade name
of Rasilez, UK and Tekturna, US. (60)
Aliskerin
Figure. II-9. Physiological effects of Renin angiotensin aldosterone
system.
Adapted from: GRADMAN, et al. (60)
4.4.2. Mechanism of action of Aliskerin
Aliskerin binds to renin at the S3bp site. This site is essential for
physiological activity of renin. Binding to this pocket, S3bp site, makes the renin
action blocked. (60).
62
4.4.3. Aliskerin was co-developed By Swiss
Pharmaceuticals
Novartis and Speedel are two Swiss Pharmaceutical companies which co-
developed a direct renin inhibitor, called aliskerin. US-FDA approved the
Aliskerin for the primary hypertension in 2007. (60)
In a clinical trial by Novartis, an increased incidence of hypotension,
hyperkalemia, renal problems and non-fatal stroke was observed in diabetic
patients. Then a new contraindication was added to A liskerin, that it must not be
used with angiotensin receptor blockers (ARBs) and angiotensin converting
enzyme inhibitors (ACEIs) in diabetics. (60-62) A new warning to avoid Aliskerin
with ARBs and ACEIs in patients with moderate to severe renal impairment with
glomerular filtration rate less than 60 ml/min. (63-64)
5. CINNAMOMUM CASSIA
5.1. Overview
Cassia is a member of plant family known as Cinnamon. It is also known
as "Java cinnamon", Saigon cinnamon”, "Padang cassia" or as the "Chinese
cinnamon". (Figure II-10 and II-11)
In botanical taxonomy, the Cassia is termed as C. cassia blume, C. cassia,
C. aromaticum (nees) syn, C. burmannii, C burmannii blume, C. obtusifolia, C.
cassia (nees) ex blume, C. tora and C. loureini nees. (65, 66)
It is publicly known fact that the Cinnamon is primarily used as herbal
spice, taste enhancer, and food additive, and to some extent in liquors
preparation. Coumarins are a natural component of cassia which belongs to

63
benzopyrene family. The coumarins are present in sufficient quantities in cassia
which may be health hazardous. But it is well known fact that the Ceylon
cinnamon contains little amounts of coumarins and is thus free of health hazards.
Cassia and cinnamon vary too much in their biochemical composition. Ceylon
cinnamon is rich in benzyl-benzoate and eugenol but lacks coumarin. Coumarins
are present in Bark of cassia considerably. However, amount depends upon
species, sub-species of cinnamon and more over climate conditions. (67-69)

64
Figure. II-10. Cinnamomum cassia. Adapted from; www.wikipedia.com
/accessed/15thmarch2014

65
Figure. II-11. Cinnamomum cassia. Adapted from; www.wikipedia.com
/accessed/15thmarch2014

66
5.2. Historical Perspectives of C. cassia as medicine
The use of C. cassia as medicine by human beings dates back since
centuries. In the Ancient Egypt, the embalming fluids were mixed with C. cassia
as spicy ingredients. In the Ayuverdic medicine, the C. cassia had been used as
anti-nauseating, anti flatulent and anti diarrheal agent.
In the early 16th century, Portuguese found the Sri-Lankan cinnamon trees.
They started exporting C.Cassia to Europe for nearly two centuries. Later on,
Dutch occupied Sri Lanka in mid of 17th century and also exported C. Cassia.
Subsequently, the British (1796) made East India Company in the Indian
subcontinent. The East India Company became the major exporter of C. cassia to
Europe. Undoubtedly, Sri Lanka is the sole supplier of C. cassia bark and oils
throughout the World till present. (65, 69, 70)
The oil and bark of both Ceylon and Chinese cinnamon are used by
Pharma industry. However the food industry prefers use of Ceylon cinnamon.
China has already become one of the main cinnamons exporting country in the
World next to Sri Lanka. (65, 69, 70)
From historical perspective, cinnamon is mentioned by Greeks,
Dioskurides, Plinius, Galenu, Romans, Herodotus and Theophrastus. It is also
quoted in Bible. Dioskurides mentioned 5 cassia and 7 species of cinnamon, it
was used as digestive and diuretic agent.
In Europe, cinnamon was introduced in 8th century. It was most expensive
spice herb. It was used by Kings and Popes only. The first written manuscript
detailed from an Arabian source as medicinal remedy. (65, 69, 70)

67
Cinnamon trees do existed in Cyelon as earlier as 1310 A.D as mentioned
by Johannes of Montevino. Nicolo Conit reported a real description of cinnamon
tree about one century later. A more authentic real description of cinnamon tree is
reported by Nicolo Conit about one century later. Mr Holland (1756) was the first
to cultivate cinnamon trees.
Mr. Holland was first who cultivated the cinnamon trees in the cultivation
areas in 1765. As the production was increased by Holland, similar was its export
to Europe at that time. After capture of Sri Lanka (1796) by East India Company,
then trading and export was monopolized by that company. Mr. Holland also
started cultivating cinnamon in Java and Sumatra, since then cinnamon was used
as cardiac tonic (1833).
Cinnamon oil was first extracted by St Amando of Doornyk by the end of
15th century. Cinnamon oil was used as a herbal medicine in nerve sensitivity
diseases. Higher doses of oil were used as nerve, uterus, muscle and cardiac
stimulant. Side effects of higher doses of Oil were also reported at that time as it
might cause methaemoglobinaemia and renal disease. It was also reported that
oil exhibited anti-bacterial effects against typhus ailment. (65, 69, 70)
5.3. Cinnamomum cassia used as Traditional Medicine
In traditional herbal medicine, the cinnamon was used as stomachic agent
and nerve tonic. Cinnamon was used for treatment of vomiting, gastro
esophageal reflux, hyperacidity, diarrhea, dyspepsia and abdominal bloating. (73)
The cinnamon was used as a germicidal agent, antispasmodic and astringent
agent. The chronic bronchitis, rheumatic pain, impotence, injuries, eye disease,
gynecological problems, leucorrhoea, toothache, and dyspnea etc, were treated
with cinnamon. (74-76)

68
Cinnamon relieved dyspepsia and its symptoms as that flatulence, gut
spasms, and gut bloating. Similarly it was used as appetite stimulant and treating
diarrheal disease. (77-79)
In folk medicine, the cinnamon is used as a topical agent for wound
healing. And also used for treating diarrhea, dyspepsia, cold and flu. Use for
treating diarrhea and dyspepsia is well documented. (78-79). Drops of cinnamon
oils were considered remedial for painful menses and for bleeding cessation. The
essential oil as cinnamon drops was good remedy for dysmenorrhoea and
menorrhagia. (67, 78, 79)
5.4. Adult Posology and Mode of administration
Spirit: is prepared as 1:10 parts of oil in 90% ethanol, and administered 0.3 to
1.2 ml per day in 3 divided doses (80)
Tincture: is prepared as 1:5 parts of oil in 70% ethanol as solvent V/V, and given
as 2-4 ml per day in 3 divided doses. (81, 82)
Dried bark: is given orally as 1.5-4 grams per day or as infusion 0.5-1.0 gram in
3 divided doses per day. (78, 79)
Fluid extract: is prepared as 1:1 fluid extract in 70% ethanol as solvent V/V, and
given 3 times per day. (67, 79, 81)
Aetheroleum: is given orally in 3 divided doses, amounting about 50-200 mg per
day. (67, 79,83)

69
5.5. Non-clinical Pharmacological Data
In vitro tests
Bactericidal activity:
Essential oil of cinnamon was administered in in-vitro experiments to
bacteria and its effect was observed. Bactericidal activity was observed against
gram +ve bacteria (Bacillus subtilis and Staphylococcus aureus) and gram –ve
bacteria (K.pneumoniae, P. aeroginosa, P. vulgaris and E.coli). Very low MICs
(minimal inhibitory activity) concentrations were reported for bactericidal activity.
(70, 84)
The bactericidal activity was observed against Listeria monocytogenes.
The lowest minimal inhibitory activity (MIC) for cinnamon bark essential oil was
500 ppm. Such low MICs is an excellent bactericidal activity. (70, 84)
Fungicidal activity:
The cinnamaldehyde compounds of cinnamon essential oils showed
fungicidal activity. Cinnamaldehyde causes inhibition of fungi proliferation. It also
neutralizes its mycotoxins. The fungi included Aspergillus clavus, Aspergillus
parasiticus, Aspergillus niger, and Candida albicans. Dermatophytes are the skin
diseases related to fungi, are all inhibited by cinnamon oil extract. Fungicidal
inhibitory zone was 28 millimeter, which was less as compared to ketoconazole,
but the fungicidal activity was comparable. Aflatoxin synthesis is also inhibited by
Cinnamaldehyde. (72, 76).

70
Spermicidal activity:
The cinnamon oil component cinnamaldehyde exhibits sperm killing
potential. Sperm immobility and sperm cell death was observed at a minimum
concentration of 1:400 V/V. (85)
Inflammation soothing activity:
Inflammatory process is hampered by essential cinnamon oils, including
bark oils. The inflammation in rheumatoid disorders was also alleviated by
cinnamon oils; hence they were used for this purpose. The soothing effect was
attributed to irritant and pungent ingredients. Cinnamon oil also inhibits
prostaglandin synthesis. Inhibition of cyclo-oxygenase enzyme by eugenol of
cinnamon oils is already documented. (86)
Cytotoxic activity:
The hepatotoxicity of cinnamaldehyde is proved in rat models. The
underlying mechanism is the depletion of glutathione stores. The cinnamon
extracts of Petroleum ether (25:1) and chloroform (68:1) showed severe
cytotoxicity. ED50 values were found at 60 and 58 μg/ml in human cancer (KB)
cells. The ED50 values for mouse leukemia and L1210 cells were observed at 24
and 20 μg/ml respectively. (86, 87)
Anti-tumor activity:
Potent anti tumor activity is proved in in-vitro animal models. The
components of cinnamon include; Cinnamaldehyde (CA) and its two analogues;
the 2-hydroxycinnamaldehyde and 2-benzoyloxycinnamaldehyde. The analogues
are reported as chemotherapeutic and chemo-preventive agents. (69- 72)

71
Spasmolytic activity:
The Spasmolytic activity is observed in the ileum and tracheal smooth
muscles of guinea pig model. This effect was produced by the cinnamon bark oil
(EC50 41 mg/litre) and cinnamaldehyde which resembled to Papaverie like
Spasmolytic effects. The Spasmolytic effects were comparable to other agents.
Relaxing effects on ileal smooth muscle were more pronounced compared to
tracheal smooth muscle. The Cinnamaldehyde, Eugenol-acetate, and Eugenol
show Spasmolytic activity. Spasmolytic activity was comparable to isoprenaline
and phospho-di-esterase (PDE) inhibitors. (88)
Flatulence:
The effects of cinnamon oils were assessed on stomach and intestine
regarding relief of flatulence. The reduction in flatulence was comparable to
phenoxyethanol, p-hydroxybenzaldehyde, isobutanol, menthol, m-Cresol,
dimethicone, and silica. (78, 79)
In vivo tests
Anti-inflammatory activity:
The anti-inflammatory activity of cinnamaldehyde was observed on cotton
pellet induced chronic inflammation. In this experiment, dry ethanolic extract was
given orally at 400 mg/kg. An inflammation soothing effect was observed. It also
revealed anti-proliferative activity. (86)

72
Analgesic activity:
Dry ethanolic extract of Cinnamomum zeylanicum is reported in rats
exhibited a potent analgesic activity. Acetic acid induced and hot plate thermal
stimulation induced writhing tests revealed analgesic activity. A dose of 200-
400mg/kg was sufficient to produce analgesic activity. (71, 72)
Spasmolytic activity:
The cinnamaldehyde exerts a papaverine-like muscle relaxing activity,
which is mediated through vasodilating activity. Movement of mouse intestine
and stomach of rats were moderately inhibited by intravenous dose of 5-10
mg/kg. Cinnamaldehyde speeded up the healing of stress induced stomach
erosions. (70)
Cinnamaldehyde administered in the peritoneum of mice model reduced
gut peristalsis at a dose of 250mg/kg body weight. While in anesthetized rats, 5-
20 mg/kg given intravenously reduced the stomach motility. (69, 71, 72)
Bile Secretion:
Experimental rats showed increased bile flow when given 500 mg/kg body
weight cinnamaldehyde. The observed effect was excellent. (71, 72)
Nervous System:
Motor activity was inhibited by cinnamaldehyde at a dose of 250-
1000mg/kg when administered orally. Paradoxically, stimulation of central
nervous system has been reported in rabbits at dose of 10-20 mg/kg intra-
arterially. (71, 72).

73
Cardiovascular activity:
Dogs revealed stimulatory effect on cardiovascular system at intravenous
dose of 5 and 10 mg/kg body weight of cinnamaldehyde. A dose dependent blood
pressure lowering effect was also reported. (76)
5.6. Toxicology
5.6.1. Teratogenicity:
Teratogenicity of methanol extract of Cinnamon in rat models has not been
proved when administered orally. While in the chick embryos, cinnamaldehyde
showed 49% lethality and 58.2% malformations. Teratogenicity of chick embryo
was observed at its toxic dose of 0.5 mmol/ embryo. (65, 66, 71, 72, 76)
5.6.2. Reproductive organs:
The mice were fed on ethanolic extract of C. zeylanicum at doses of 100
mg/kg/day orally, it produced astonishing results. The weight of reproductive
organs was increased. Sperm count and motility was also increased. Sperm
toxicity has not been reported in earlier in-vitro studies. (85)
5.6.3. Carcinogenicity:
Inhibition of thioredoxin reductase has been observed by Cinnamaldehyde;
hence it can be used as chemotherapeutic and chemopreventive purpose. (71,
72)
5.6.4. Genotoxicity and Mutagenecity
Reports on Genotoxicity and Mutagenecity are conflicting. Some of
previous studies used Ames testing to detect mutagenic effects and it was

74
reported positively. Experiment on Chinese hamster using Cinnamaldehyde and
cinnamon bark oil produced chromosomal aberrations. Mutagenecity of ethanolic
extract of cinnamon by Ames test has also been reported. Drosophila testing
showed Genotoxicity of cinnamaldehyde, while aqueous extract of cinnamon
produced no such effect. Other previous studies have not reported of any
Mutagenecity with Cinnamaldehyde, cinnamon bark oil and cinnamon extracts
using Ames testing. Both rat and hamster liver microsomal preparations were
used for mutagenicity detection, but the trans-cinnamic acid and trans-
cinnamaldehyde produced no any mutagenic effect in salmonella typhimurium
strains. (71, 72)
5.6.5. Acute toxicity:
Severe skin irritation of rabbits was observed with undiluted cinnamon bark
oil, however, very mild irritation was observed on hairless skin of mice model.
Cinnamon oil mixed with petroleum was applied to skin of 25 volunteer human
beings, revealed no skin irritation. The dermal lethal dose in rats is determined at
0.59 mg per kg, while oral lethal dose of cinnamaldehyde in rats is estimated at
2.22 g/kg. Oral lethal dose of cinnamon bark oil is estimated at 4.16 g/kg while
dermal lethal dose was produced at 0.69 ml/kg. (65, 66)
5.6.6. Sub-acute and chronic toxicity:
Upper limit of daily intake of cinnamon is set out at 700 μg/kg per day in
human beings. This upper limit is recommended by the Joint FAO/WHO Expert
Committee on Food Additives (JECFA). The stomach irritation and liver toxicity
has been reported with cinnamaldehyde. Maximum dose eugenol dose is up to
2.5 mg/kg.

75
Animal studies have reported both gastric irritation and severe
hepatotoxicity in Sprague Dawly rats at a dose of 10g/kg body weight (for 16
weeks). Pronounced hepatoxicity was reported as indicated by histological
findings of hepatocyte swelling (65, 66).

76
CHAPTER III
MATERIALS AND METHODS
3.1. Study Design: Experimental – Analytical study
3.2. Study Settings: Isra University, Al-Tibri Medical College and
Diagnostic and Research Laboratory, LMUHS, Hyderabad.
3.3. Duration of Study: One year from the date of synopsis approval-
January 2014- December 2014.
3.4. Sample Size: Sixty Wistar Albino rats of either sex were selected
from Animal House of AL-Tibri Medical College, Karachi.
3.5. Sampling technique
Phase I. Purposive sampling was done to select healthy rats
Phase II. Induction of diabetes mellitus with alloxan (Sigma Aldrich,
stored at 40C) – rats which achieved blood glucose levels of >250
mg/dl were selected (after duration of 72 hours).
Phase III. Simple random sampling was done to divide the selected
animals into subgroups amongst the groups.
3.6. Grouping of Animals:
Total 60 Albino rats of either sex
Rats were divided into six groups comprising of 10 rats in each
group.

77
Each Rat group was sub divided into 2 sub-groups containing 5 rats
each sub group.
Group A (n = 10)
Further sub divided into 2 groups
Group A1- Simple control (n = 5) ---- This group was given normal saline only.
Group A2- Diabetic Control (n = 5) --This group was treated with Alloxan only.
Group B (n = 10) ----------------- Extract - treated group
Further sub divided into 2 groups:
Group B1 (n = 5) -----------------------It was treated with low dose extract
Group B2 (n = 5) -----------------------It was treated with high dose extract
Group C (n = 10) ------------------ Aliskiren treated group
Further sub divided into 2 groups:
Group C1 (n = 5) ----------------------It was treated with low dose of drug
Group C2 (n = 5) --------------------- It was treated with high dose of drug
Group D (n = 10) ---------------- sitagliptin treated group
Group D1 (n = 5)--------------------- It was treated with low dose of drug
Group D2 (n = 5) ---------------------It was treated with high dose of drug
Combination of low & high dose of Extract + Aliskiren & Sitagliptin:
Group E (n = 10) –---------------Low dose of combination (Ext + drug)
E1(n = 5) = LExt + LDrug 1 (Aliskiren)
E2 (n = 5) = LExt + LDrug 2 (sitagliptin)
Group F (n = 10) -----------------High dose of combination (Ext + drug)
F1(n = 5) = HExt + HDrug 1 (Aliskiren)
F2(n = 5) = HExt + HDrug 2 (sitagliptin )

78
Animal Groups (n=60)
Groups Subgroups Dose
Group A (n=10)
A1 (Normal saline) -
Alloxan Induced
Diabetes mellitus (120mg i.p.)
A2 (Alloxan induced)
120 mg/kg i.p.
Group B (n=10)
B1 – CCBE low
dose
CCBE
0.3g/day
B2 – CCBE high dose
CCBE 0.6g/day
Group C (n=10)
C1 – Aliskerin low
dose
Aliskerin
100mg/day
C2 – Aliskerin high dose
Aliskerin 200mg/day
Group D (n=10)
D1 - Sitagliptin low dose
Sitagliptin 100mg/day
D2 - Sitagliptin
high dose
Sitagliptin
200mg/day
Group E (n=10)
E1 - CCBE+ Aliskerin low dose
CCBE 0.3g + Aliskerin 100mg
E2 – CCBE+
Sitagliptin low dose
CCBE 0.3g +
Sitagliptin 100mg
Group F (n=10)
F1 – CCBE+ Aliskerin high dose
CCBE 0.6g + Aliskerin 200mg
F2 - CCBEs+ Sitagliptin high dose
CCBE 0.6g + Sitagliptin
200mg

79
3.7. Inclusion Criteria
200-250 grams
Rats – both genders
Alloxan induced diabetic rats with minimum blood sugar level of
250mg/dl.
3.8. Exclusion criteria
Animals which fail to achieve required blood sugar level mentioned in
inclusion criteria
Diseased rats under weight
3.9. Data collection Procedure
Animal were handled under close supervision during experimentation. The
blood samples and pancreatic tissue were stored and processed in a systemic at
Diagnostic and Research Laboratory, LUMHS, Hyderabad.
3.10. Animal Housing and Experimental Details
Albino rats were housed in animal cages with a 12 hour light & dark cycle.
They were given standard diet and water ad-libitum.
To induce the experimental diabetes alloxan was dissolved in normal
saline. The rats achieving the level of blood glucose more than >250mg/dl were
considered as diabetic. The blood samples for measurements of glucose levels of
all rats were taken at 0hrs, 6hrs, 12hrs, 24hrs, and 72 hrs for diabetic experiment
for confirmation. The day on which blood glucose level >250mg/dl was confirmed,
that day was counted as first day of experimentation.

80
3.11. Preparation of ethanol based Cinnamomum cassia 129
3.11.1. Plant Material
The fresh stem bark of Cinnamomum cassia was selected for the present
study purpose.
3.11.2. Collection of Plant Material
The stem bark of Cinnamomum cassia (cinnamon) was collected from the
local market. The approval for conducting research on animals was taken from
ethical committee of the Isra University, Hyderabad, Sindh, Pakistan. The
taxonomy of Plant material was identified and authenticated by International
Pharmaceutical Laboratory of Baqai University, Karachi, and Sindh.
3.11.3. Preparation of Plant extract
Ethanol based Cinnamomum cassia (cinnamon) plant extract was
prepared as under:
3.11.4. Dryness of Cinnamon Stem Bark
The plant materials (stem bark) were washed thoroughly in running tap
water. The material were placed and spread properly on cotton cloth and were
fully covered from all sides by net cloth to minimize the entry of dust and other
foreign particles on the stem bark of Cinnamon. These materials were kept in a
well cleaned and airy room having ceiling and exhaust fan to regulate the air flow
in the room. The room temperature was maintained between 35-40oC during day
time and 25-30oC during night time. The humidity was minimized by keeping

81
exhaust fan open in the morning and switch off at night. This procedure was
performed continuously for 6 weeks, till the plant materials were completely dried.
3.11.5. Checking level of Cinnamon Stem Bark Dryness
To check the amount of dryness in cinnamon stem bark, one of the bark
pieced was picked and broken up from the center into two halves on weekly
basis. As this began to dry the stem bark became hard and their fibers lost the
elasticity, and were easily broken up in smaller pieces showing their dryness
completely. After drying, the cinnamon stem barks were then grinded in grinder
machine to get coarse powder.
3.11.6. Sifting of Cinnamon Bark Powder
The sifting procedure was done by using sifting net having the holes of 0.5
mm in size. The size of the hole was checked by vernier caliper. The cinnamon
stem bark powder was sifted thoroughly. The granules of powder lesser than 0.5
mm were kept in the container for further procedure, while particles of more than
0.5 mm size were again grinded to obtain smaller size of the particles. The
materials were again sifted and this was done repeatedly to achieve the required
size of particles which is 0.4 mm or lesser during sifting and required amount to
be used for study purpose.
3.11.7. Preparation of Cinnamon Stem Bark Extract
The cinnamon stem bark powder obtained after complete sifting were
transferred to Buchner flask with help of thistle funnel through continuous shaking
as the mouth Buchner flask is very narrow. The extract was prepared by taking
sufficient amount of 98% ethanol in the flask, so that whole powder material was

82
completely dipped into the ethanol. The mixture was kept for one week and
during this period daily shaking was required to separate out all the chemicals
and then the mixture was mixed in the ethanol. This was considered as fraction-1.
This fraction was decant off and kept in a well cleaned and sterilized flask. This
procedure was repeated again to obtain fraction-2 from the material. At the end of
second fraction and after one week, a glass tube of 1 mm diameter was then
inserted to the bottom of flask and a negative pressure was applied through pump
to obtain maximum extract from the liquid powder mixture. The equal amount of
98% ethanol was then added into the mixture after obtaining fraction-1 and
fraction-2 of extract.
3.11.8. Filtration of Mixture
After obtaining the solution from the mixture, another conical flask along
with funnel was taken and the filter paper was placed on the inner surface of the
funnel to filter the Cinnamomum cassia solution.
3.11.9. Separation of Extract from Ethanol
The filtered solution was then transferred in the round flask of the rotary
evaporator for separating the alcohol form plant materials. The solution was
continuously heated below 50oC and also under negative pressure of 2 bar to
minimize the boiling point. This separates the ethanol from the plant extract.
3.11.10. Re-separation of Ethanol from Extract
The extract obtained still contained traceable amounts of ethanol. The
extracted material was shifted in a beaker covered by a coverlid. A glass tube
was passed from the hole of the cover inside the beaker. Air was then entered

83
into the beaker through the glass tube connected with air pump. The inlet of the
pump was fixed with Whatman filter paper of 0.22µ. An air pressure was then
introduced into the material to enhance the complete evaporation of ethanol from
the extract.
3.11.11. Storage of Extract
The extracted solution of Cinnamomum stem bark extract was kept in a
well cleaned and air tight bottles. The extract bottles were then placed in the
refrigerator at 80C for further process. The material obtained was dark chocolate
in color and gummy in appearance having a pH of 7.0. 129
3.11.12. Animal Sacrifice and Blood sampling
Fasting rats were sacrificed after thirty days of treatment.
Blood will be collected into heparinized tubes.
Serum was separated out.
Following laboratory tests were conducted.
1. Estimation of blood glucose level – by glucose oxidase method
2. Insulin was measured by ELISA method fully automatic MEIA analyzer.
3. Superoxide dismutase (Misra and Fridovich14).
4. Glutathione peroxidase (Rotruck et al.15)
5. Histo-pathological studies
The animals were sacrificed by neck dislocation. The sections of
pancreatic tissue were examined microscopically for histological changes.
Each sample of pancreatic tissue obtained was washed in normal saline
and tissues were fixed in previously marked containers, containing 10%

84
formaldehyde as preservative. The tissues were embedded in paraffin, cut into 5
µm thick sections and stained with Hematoxylin-Eosin (H & E) staining for
histological examination.
3.11.13. Determination of Glutathione Peroxidase
(GPX)
o GPX Randox Diagnostics Assay Kit
o Assay Protocol
GPX activity was determined at 250C by measuring the rate of NADPH
oxidation as a decrease in absorbance at 340 nm (ε = 6.2 mM cm-1) according to
the method of Halliwell and Foyer (1978). The reaction mixture (1.0ml) consisted
of 100 mM Tris-HCl buffer (pH 7.8), 21 mM EDTA, 0.005 mM NADPH, 0.5 mM
oxidized glutathione (GSSG), and the enzymes extract. NADPH was added to
start the reaction. Unit activity is defined as “one unit will reduce 1.0 mole of
oxidized glutathione per minute under standard assay conditions”.
3.11.14. Determination of superoxide dismutase
(SOD)
o SOD Randox Diagnostics Assay Kit
o Assay Protocol
The assay for SOD activity was performed by following the method of
Beyer and Fridovich (1987). The assay mixture consisted of 27.0ml of 0.05 M
potassium phosphate buffer (pH 7.8), 1.5ml of L-methionine (300 mg/10 ml),
1.0ml of nitrobule tetrazolium salt (NBT) (14.4mg/10ml), and 0.75ml of Triton X-
100. Aliquots (1.0ml) of this mixture were delivered into small glass tubes,

85
Followed by the addition of 20µl enzyme extract and 10 µl of riboflavin (4.4 mg/
100ml). The cocktail was mixed and the illuminated for 15 minutes in an
aluminum foil-lined box, containing 25W fluorescent tube. In a control tube
sample was replaced by 20µl of buffer and the absorbance was measured 560
nm. The reaction stopped by switching off the light and placing the tubes in dark.
Increase in absorbance due to formation of formazan was measured at 560 nm.
Under the described conditions, the increase in absorbance in control was taken
as 100% and the enzyme activity in the sample was calculated by determining
the percentage inhibition per minute. One unit of SOD is that amount of enzyme
which causes a 50% inhibition of the rate for reduction of nitrobule tetrazolium
(NBT) under the conditions of the assay.
3.11.15. Insulin Detection
o MSD Metabolic Assays Mouse/Rat Insulin Kit
o Assay Protocol
150 µL of “Blocker A solution” was dispensed into a well. Plate was sealed,
and incubated at 300–1000 rpm at room temperature. Shook it vigorously. Plates
were washed 3 times with a Phosphate buffered saline plus 0.05% Tween-20
(PBS-T). 40 µL of 1x antibody solution was put into Meso scale discovery (MSD)
plate. Added 10µL of sample in the wells appropriately and immediately. Plates
were sealed with adhesive seal, incubated for 2 hours and shook vigorously.
Following, the plate were washed three times with PBS-T. 150µL of Read Buffer
T was added to each of MSD plate. Plates were read immediately following
addition of the Read Buffer.

86
3.12. Data Analysis
The normality of data was checked with Shapiro-Wilk test and was
analyzed by analysis of variance. The variables which yielded significant F-ratio
and p-value were treated with post-Hoc Fischer`s LSD testing for multiple
comparisons. The data collected was analyzed on SPSS version 21.0. A p-value
of ≤0.05 was taken statistically significant.

87
CHAPTER IV
RESULTS
The present study was an experimental study conducted at animal house
of Al-Tibri Medical College, Karachi, a campus of Isra University. The primary
goal of study was to evaluate effects of Cinnamomum cassia bark extract (CCBE)
on blood glucose homeostasis. And secondary objectives were to observe effects
on the insulin secretion, superoxide dismutase and glutathione peroxidase activity
and histology of pancreas. The study observed significantly positive effects of
CCBE on glucose homeostasis, insulin secretion, superoxide dismutase and
glutathione peroxidase activity compared to DPP-IV inhibitor (sitagliptin) and
direct renin inhibitor (aliskerin) as alone and in combination at different doses.
Significant F-ratio and p-value (shown in table IV-1) of variables were
further analyzed by multiple comparison post host tests.
Cumulative results for blood glucose, insulin secretion, superoxide
dismutase and glutathione peroxidase are shown in table IV -1 to IV -5 and
Graphs IV -1, IV -2, IV -3 and IV -4. Blood glucose lowering activity of CCBE was
observed at both low and high doses of 0.3g/day and 0.6g/day respectively.
Glucose homeostasis potential of CCBE was comparable to sitagliptin. CCBE in
combination with sitagliptin revealed more synergistic effect on blood glucose
levels. The blood glucose lowering effect of Aliskerin was not observed in present
study.
Insulin levels were found elevated in low dose and high dose CCBE
compared to sitagliptin, aliskerin and controls. The synergistic insulin secretory
effect of CCBE combined with sitagliptin was observed as shown in graph IV-2.
The animals of CCBE groups showed elevated antioxidant enzyme activities as

88
shown in graphs IV-3 and IV-4 and table IV -1 to IV -5. The superoxide dismutase
(SOD) and glutathione peroxidase (GPX) were found elevated in CCBE
compared to all groups except controls. SOD and GPX activity of CCBE animals
was higher than Sitagliptin-alone treated animals.
Blood glucose, insulin, SOD and GPX were analyzed in individual
subgroups and results are shown in table IV-6 to IV-11 and graphs IV-5 to IV-28.
Blood glucose in subgroups A1 and A2 was found highly different
(p<0.0001) as shown in table IV-6 and graph VI-5. Similar are the observations
for the insulin, SOD and GPX activity.
Groups B1 and B2 were treated with low and high dose CCBE (0.3g/dl and
0.6g/dl respectively) and statistically significant results were observed for all of
the four variables. Blood glucose, insulin, SOD and GPX activity were noted as
359.0±64.48 and 251.4±70.24 mg/dl (p=0.036), 6.40±1.34 and 10.4±4.61 µU/L
(0.015), 126.2±14.73 and 178.6±97.02 U/ml (0.001) and 7651.0±3133.10 and
13628.4±1358.12 U/L (0.004) respectively (Table IV-7 and Graphs IV-9 to 12).
Group C1 and C2 were treated with Aliskerin 100 and 200 mg/day. The
present study revealed no significant results for any of variables. The blood
glucose lowering effect, insulin, SOD and GPX activities were found non-
significant (Table IV-8, Graphs IV-13 to 16).
The sitagliptin showed significant differences as shown for groups D1 and
D2 in table IV-9 and Graphs IV-17 to 20.
Blood glucose, insulin, SOD and GPX levels for CCBE low and high dose
combined with Aliskerin or sitagliptin are shown in table IV-10 and 11
respectively. The CCBE combined with sitagliptin revealed better results than
alone or in combination with Aliskerin. An optimal blood glucose lowering effects
of CCBE was observed with high doses of 0.6g/day alone or in combination with

89
sitagliptin and similar are the observations for the insulin. CCBE and sitagliptin
groups showed elevated SOD and GPX activity as shown in tables IV-10 and 11
and Graphs IV-23, 24, 27 and 28 respectively.
Histology of Pancreas: Histological findings of pancreas were interpreted and
compared to controls. Alloxan induced diabetic rats revealed complete loss of
microscopic architecture of tissue with loss of microscopic details of Islets of
Langerhans (Photomicrographs IV.2). CCBE treated animals showed improved
tissue architecture, pancreatic acini, and visible Islets of Langerhans low doses.
But at high doses more pronounced histological improvement was observed. This
shows cytoprotective effects of CCBE on free radical mediated pancreatic injury.
Similarly, sitagliptin showed a cytoprotective effects as shown in
Photomicrograph IV-8. Aliskerin group did not show any change in histology of
pancreas compared to Alloxan animal’s pancreas (Photomicrographs IV-6 and 7).

90
Table IV.1. Analysis of variance (ANOVA) results of animal groups (n=60)
F-value p-value
Blood Glucose (mgdl-1) 115.50 0.023
Insulin (µUL-1) 13.72 0.006
Superoxide Dismutase (Uml-1) 13.03 0.014
Glutathione Peroxidase (UL-1) 11.35 0.024

91
Table IV.2. Blood Glucose level (mg/dl) in animal groups (n=60)
Mean Std.
Deviation
95% Confidence
Interval for Mean
Lower
Bound
Upper
Bound
Group A. Controls 271.6 163.1 154.8 388.30
Group B. CCBE 335.20 71.1 284.3 386.06
Group C. Aliskerin 403.0 54.8 364.03 442.56
Group D. Sitagliptin 351.8 68.8 302.5 401.06
Group E.
CCBE+Aliskerin+Sitagliptin
328.0 79.1 271.3 384.6
Group F. High Dose
CCBE+Aliskerin or Sitagliptin
280.4 63.54 234.9 325.85
p≤0.01

92
Table IV.3. Serum Insulin levels (µU/ml) in animal groups (n=60)
Mean Std.
Deviation
95% Confidence Interval
for Mean
Lower
Bound
Upper
Bound
Group A. Controls 13.2 10.5 5.6 20.7
Group B. CCBE 6.1 1.52 5.0 7.19
Group C. Aliskerin 2.8 1.03 2.06 3.53
Group D. Sitagliptin 6.2 1.68 4.99 7.40
Group E.
CCBE+Aliskerin+Sitagliptin
8.0 3.62 5.40 10.59
Group F. High Dose
CCBE+Aliskerin or Sitagliptin
10.60 3.43 8.14 13.05
p≤0.05

93
Table IV.4. Superoxide Dismutase (U/ml) in animal groups (n=60)
Mean Std.
Deviation
95% Confidence Interval
for Mean
Lower
Bound
Upper
Bound
Group A. Controls 191.4 39.20 163.35 219.44
Group B. CCBE 123.4 39.50 95.13 151.60
Group C. Aliskerin Ϯ 77.9 25.64 59.55 96.20
Group D. Sitagliptin 99.10 18.44 85.90 112.29
Group E. CCBE+ Aliskerin+
Sitagliptin
142.70 60.67 99.29 186.10
Group F. High Dose CCBE+
Aliskerin or Sitagliptin
149.30 54.33 110.43 188.16
p≤0.02 Ϯ p=Non-significant

94
Table IV.5. Glutathione Peroxidase (U/L) in animal groups (n=60)
Mean Std.
Deviation
95% Confidence Interval
for Mean
Lower
Bound
Upper Bound
Group A. Controls 8475.80 3261.8 6142.39 10809.20
Group B. CCBE 5739.80 3255.7 3410.0 8086.1
Group C. Aliskerin 3213.0 793.3 2645.4 3780.55
Group D. Sitagliptin 4313.0 1880.2 2967.9 5658.07
Group E. CCBE+ Aliskerin+
Sitagliptin
6291.80 2992.5 4151.08 8432.5
Group F. High Dose CCBE+
Aliskerin or Sitagliptin
7214.40 3229.5 4904.1 9524.69
p≤0.03

95
Table IV.6. Blood Glucose, Serum Insulin, Superoxide Dismutase and
Glutathione Peroxidase in Group A animals
Parameters
Group A1 (Control)
Normal Saline
Group A2 (Alloxan)
120mg/kg i.p
p-value
Mean S.D Mean S.D
Blood Glucose (mgdl-1) 122.0 9.33 420.1 66.92 0.005
Insulin (µUL-1) 23.0 2.73 3.40 1.14 0.0001
Superoxide Dismutase
(Uml-1)
196.0 18.38 71.4 10.59 0.004
Glutathione
Peroxidase (UL-1)
10832.2 943.9 2745.1 1367.46 0.006

96
Table IV.7. Blood Glucose, Serum Insulin, Superoxide Dismutase and
Glutathione Peroxidase in Group B animals
Parameters
Group B1
(CCBE 0.3gdl-1)
Group B2
( CCBE 0.6gdl-1)
p-
value
Mean S.D Mean S.D
Blood Glucose
(mgdl-1)
359.0 64.48 251.4 70.24 0.036
Insulin (µUL-1) 6.40 1.34 10.4 4.61 0.015
Superoxide
Dismutase (Uml-1)
126.2 14.73 178.6 97.02 0.001
Glutathione
Peroxidase (UL-1)
7651.0 3133.10 13628.4 1358.12 0.004
CCBE- Cinnamomum cassia bark extract

97
Table IV.8. Blood Glucose, Serum Insulin, Superoxide Dismutase and
Glutathione Peroxidase in Group C animals
Parameters
Group C1 (Aliskerin 100mgday-1)
Group C2 (Aliskerin
200mgday-1)
p-
value
Mean S.D Mean S.D
Blood Glucose (mgdl-1) 409.0 45.33 397.6 68.11 0.31
Insulin (µUL-1) 2.40 1.14 3.20 0.83 0.91
Superoxide Dismutase
(Uml-1)
69.0 32.17 86.80 15.7 0.58
Glutathione Peroxidase
(UL-1)
3469.4 908.5 2956.6 653.1 0.47

98
Table IV.9. Blood Glucose, Serum Insulin, Superoxide Dismutase and
Glutathione Peroxidase in Group D animals
Parameters
Group D1 (Sitagliptin
100mgday-1)
Group D2 (Sitagliptin
200mgday-1)
p-
value
Mean S.D Mean S.D
Blood Glucose (mgdl-1) 353.2 64.89 270.4 61.92 0.049
Insulin (µUL-1) 7.0 1.58 9.8 4.20 0.06
Superoxide Dismutase
(Uml-1)
102.60 18.88 175.6 99.7 0.032
Glutathione
Peroxidase (UL-1)
3869.40 1410.1 8756.6 3960.1 0.048

99
Table IV.10. Blood Glucose, Serum Insulin, Superoxide Dismutase and
Glutathione Peroxidase in Group E animals
Parameters
Group E1 (CCBE 0.3gdl-1+
Aliskerin 100mgday-1)
Group E2 (CCBE 0.3gdl-1 +
Sitagliptin 100mgday-1)
p-
value
Mean S.D Mean S.D
Blood Glucose
(mgdl-1)
331.6 108.45 206.40 66.30 0.016
Insulin (µUL-1) 7.0 2.7 10.4 1.14 0.033
Superoxide
Dismutase (Uml-1)
126.0 29.7 159.4 32.20 0.012
Glutathione
Peroxidase (UL-1)
6925.1 2895.1 8858.1 1911.1 0.025
CCBE- Cinnamomum cassia Bark Extract

100
Table IV.11. Blood Glucose, Serum Insulin, Superoxide Dismutase and
Glutathione Peroxidase in Group F animals
Parameters
Group F1
(CCBE 0.6gdl-1+ Aliskerin 200mgday-1)
Group F2
(CCBE 0.6gdl-1 + Sitagliptin 200mgday-
1)
p-value
Mean S.D Mean S.D
Blood Glucose
(mgdl-1)
286.4 50.79 180.4 50.47 0.01
Insulin (µUL-1) 7.40 2.07 12.60 3.91 0.039
Superoxide
Dismutase (Uml-1)
153.6 58.9 297.6 70.36 0.008
Glutathione
Peroxidase (UL-1)
7131.0 2841.9 11497.4 2622.90 0.036
CCBE- Cinnamomum cassia Bark Extract

101
Graph IV-1. Bar graphs showing blood glucose distribution among different
groups.

102
Graph IV-2. Bar graphs showing insulin secretion among different groups

103
Graph IV-3. Bar graphs showing Superoxide dismutase activity among different
groups

104
Graph IV -4. Bar graphs showing Glutathione peroxidase activity among different
groups

105
Graph IV -5. Bar graphs showing blood glucose level in subgroups A1 and A 2. A
highly significant p-value was observed (p=0.0001).

106
Graph IV -6. Bar graphs showing insulin levels in subgroups A1 and A 2. A highly
significant p-value was observed (p=0.0001).

107
Graph IV -7. Bar graphs showing Superoxide dismutase activity in subgroups A1
and A 2. A highly significant p-value was observed (p=0.0001).

108
Graph IV -8. Bar graphs showing Glutathione peroxidase activity in subgroups A1
and A 2. A highly significant p-value was observed (p=0.0001).

109
Graph IV -9. Bar graphs showing blood glucose level in subgroups B1 and B 2. A
significant p-value was observed (p=0.001).

110
Graph IV -10. Bar graphs showing insulin level in subgroups B1 and B 2. A
significant p-value was observed (p=0.001).

111
Graph IV -11. Bar graphs showing superoxide dismutase activity in subgroups B1
and B 2. A significant p-value was observed (p=0.001).
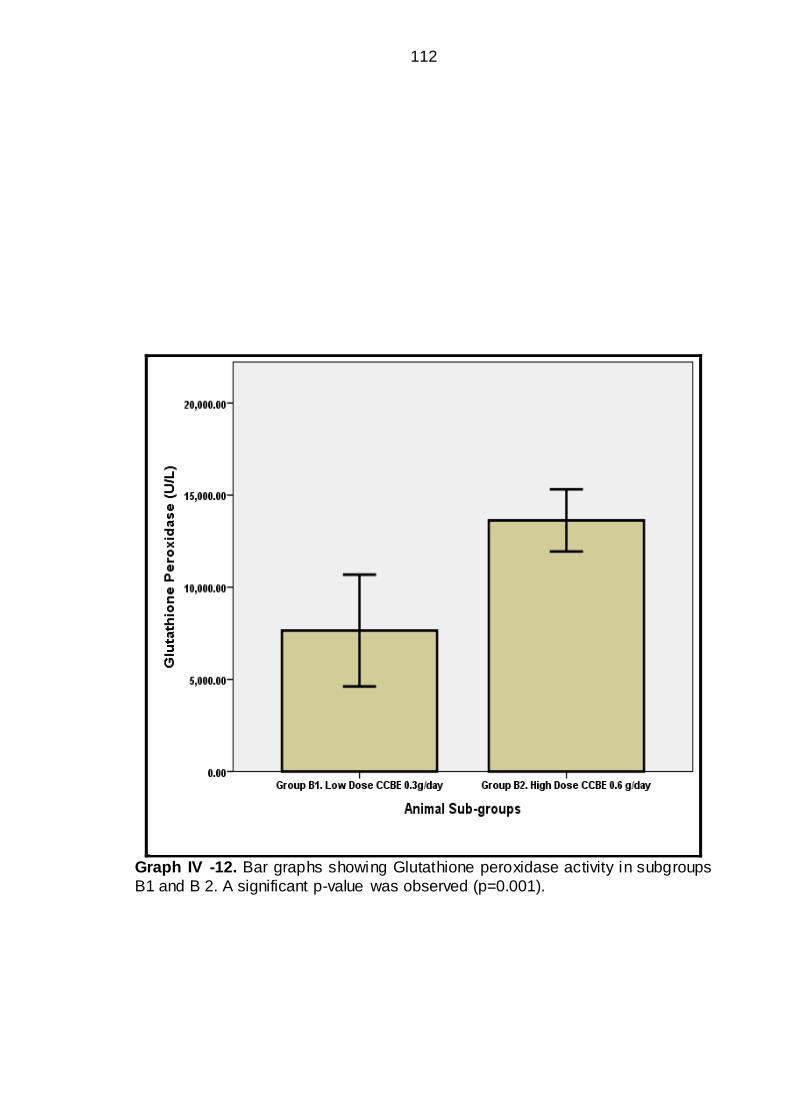
112
Graph IV -12. Bar graphs showing Glutathione peroxidase activity in subgroups
B1 and B 2. A significant p-value was observed (p=0.001).

113
Graph IV -13. Bar graphs showing blood glucose levels in subgroups C1 and C
2. Non-significant p-value was observed (p>0.05).

114
Graph IV -14. Bar graphs showing blood glucose levels in subgroups C1 and C
2. Non-significant p-value was observed (p>0.05).

115
Graph IV -15. Bar graphs showing superoxide dismutase activity in subgroups
C1 and C 2. Non-significant p-value was observed (p>0.05).

116
Graph IV -16. Bar graphs showing Glutathione peroxidase activity in subgroups
C1 and C 2. Non-significant p-value was observed (p>0.05).
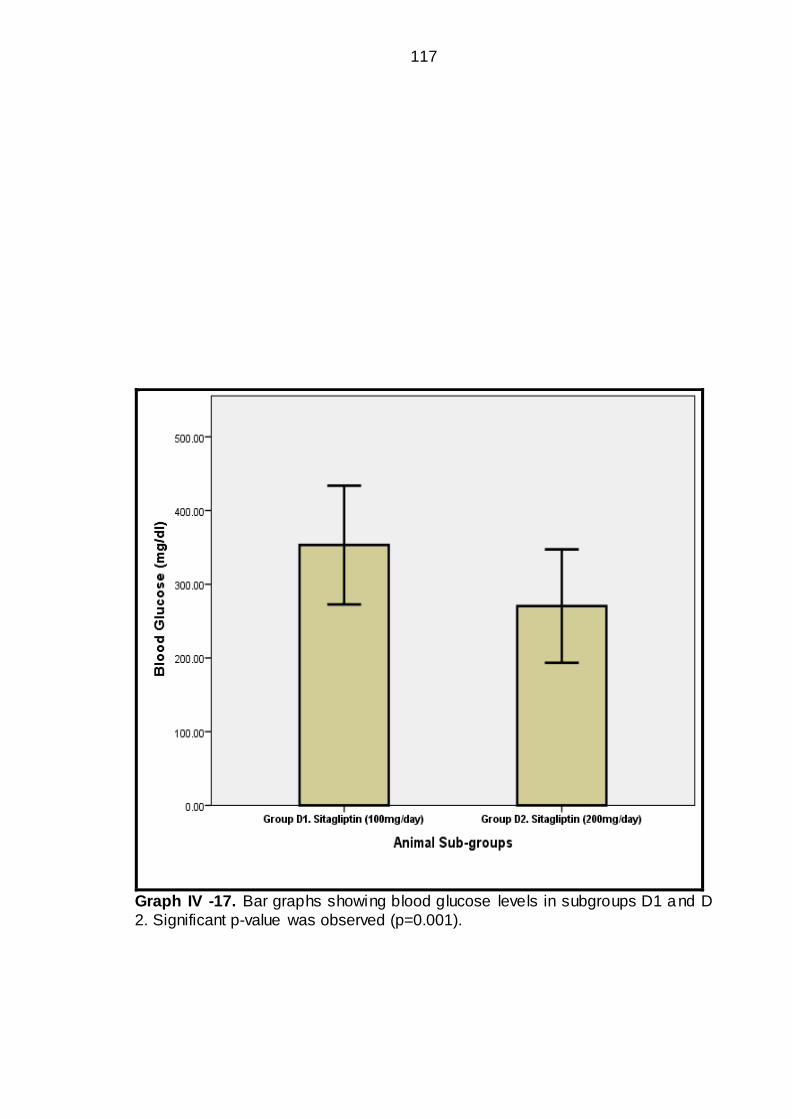
117
Graph IV -17. Bar graphs showing blood glucose levels in subgroups D1 and D
2. Significant p-value was observed (p=0.001).

118
Graph IV -18. Bar graphs showing insulin levels in subgroups D1 and D 2.
Significant p-value was observed (p=0.001).

119
Graph IV -19. Bar graphs showing superoxide dismutase activity in subgroups
D1 and D 2. Significant p-value was observed (p=0.0001).

120
Graph IV -20. Bar graphs showing Glutathione peroxidase activity in subgroups
D1 and D 2. Significant p-value was observed (p=0.001).

121
Graph IV -21. Bar graphs showing blood glucose levels in subgroups E1 and E 2.
Significant p-value was observed (p=0.001).

122
Graph IV -22. Bar graphs showing insulin levels in subgroups E1 and E 2.
Significant p-value was observed (p=0.001).
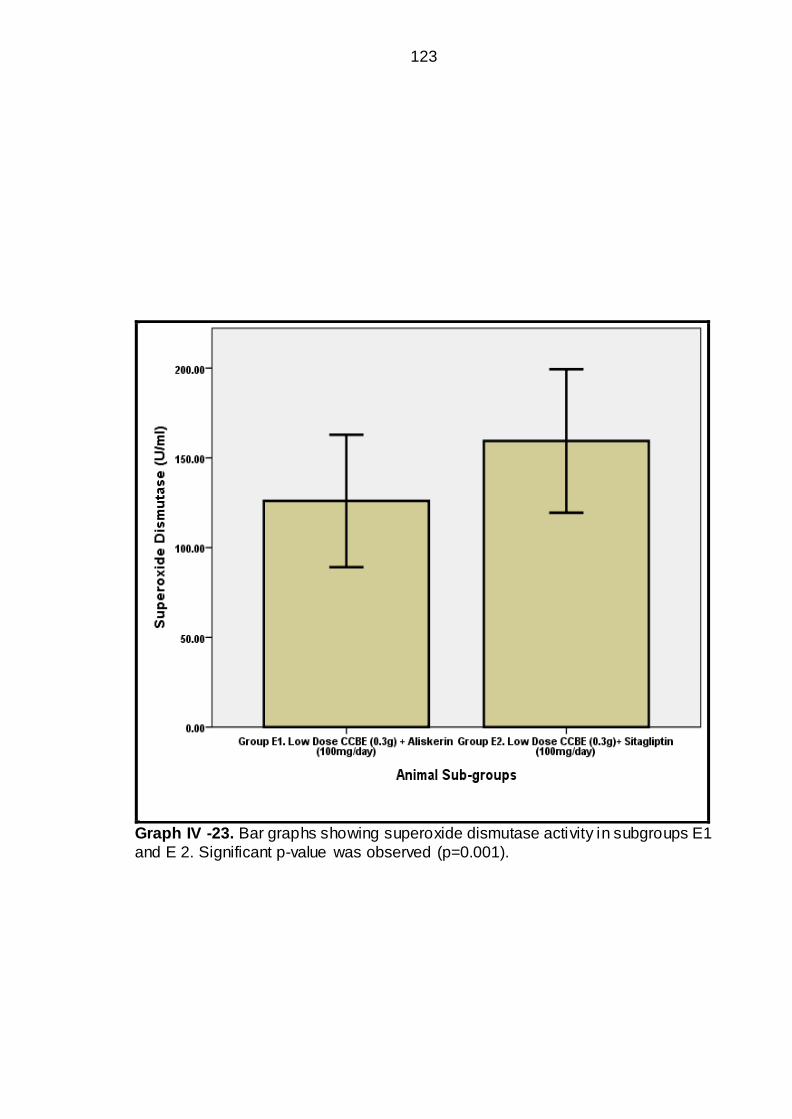
123
Graph IV -23. Bar graphs showing superoxide dismutase activity in subgroups E1
and E 2. Significant p-value was observed (p=0.001).

124
Graph IV -24. Bar graphs showing glutathione peroxidase activity in subgroups
E1 and E 2. Significant p-value was observed (p=0.001).

125
Graph IV -25. Bar graphs showing blood glucose levels in subgroups F1 and F 2.
Significant p-value was observed (p=0.001).

126
Graph IV -26. Bar graphs showing insulin levels in subgroups F1 and F 2.
Significant p-value was observed (p=0.001).

127
Graph IV -27. Bar graphs showing superoxide dismutase activity in subgroups F1
and F 2. A highly significant p-value was observed (p=0.001).

128
Graph IV -28. Bar graphs showing Glutathione peroxidase activity in subgroups
F1 and F 2. Significant p-value was observed (p=0.001).

129
Photomicrograph IV – 1 Group A1. (Control). Normal Architecture or Pancreas,
is visible and islet of Langerhans are also visible. X100 (H & E)
Photomicrograph IV – 2. Group A2 (Alloxan induced Rats) completely disturbed
Architecture of pancreas, islet of Langerhans is not properly visible. X100 (H&E)

130
Photomicrograph IV – 3 Group B1 (CCBE 0.3g/dl). Islets of Langerhans are partially
visible but smaller in size X100 (H&E)
Photomicrograph IV-4.Group B2 (CCBE 0.6g/dl) Anatomical architecture of pancreas is
visible, with islets of Langerhans showing moderate recovery. X400 (H&E)

131
Photomicrograph IV-5 Group C1 (Aliskerin) Anatomical Architecture of pancreas is
disturbed; islets of Langerhans are also invisible. X100 (H&E)
Photomicrograph IV-6. Group C2 (Aliskerin) Anatomical architecture of pancreas is
disturbed; islets of Langerhans are also invisible. X100 (H & E)

132
Photomicrograph IV-7. Group D1 (Sitagliptin) Anatomical architecture of pancreas is
partially disturbed; with mild recovery of islets of Langerhans. X400 (H & E)
Photomicrograph IV-8. Group D2 (Sitagliptin) Anatomical architecture of pancreas is
partially disturbed; with mild recovery of islets of Langerhans. X400 (H & E)

133
Photomicrograph IV-9. Group E1 (Low dose CCBE+Aliskerin) Anatomical architecture
of pancreas is mildly distorted with partial recovery of islets of Langerhans. X200 (H&E)
Photomicrograph IV-10. Group E2 (Low dose CCBE+Sitagliptin) Anatomical
architecture of pancreas is nearly well defined; islets of Langerhans are moderately
visible. X100 (H & E)

134
Photomicrograph IV-11. Group F1 (High Dose CCBE+Aliskerin) Anatomical
architecture of pancreas is mildly disturbed with partial recovery of islets of Langerhans.
X200 (H & E)
Photomicrograph IV-12. Group F2 (High Dose CCBE+Sitagliptin) Anatomical
architecture of pancreas is well defined; islets of Langerhans are almost recovered. X200
(H & E)

135
CHAPTER V
DISCUSSION
Type 2 diabetics are increasing in number throughout the World because
of obesity, sedentary life style, population growth, aging and urbanization. The
prevalent diabetic epidemic is particularly relevant to Pakistan. According to WHO
estimates that half of 333 million diabetic people will be from Asia in 2030. While
International Diabetes Federation (IDF) estimates that the number of diabetics
older than twenty is projected to increase from 285 million in 2010 to 439 million
in 2030 (6, 7).
Currently, Pakistan is catering a large number of diabetics and ranks sixth
position in World. Shera et al reported that 15% of Pakistan population is
diagnosed of having DM, and more millions are undiagnosed. They are unaware
about DM because of lack of health facilities and present late with diabetic
complications. (6, 7)
Although type 2 DM is rigorously treated with a number of available anti
diabetic pills but diabetics still feel miserable because of no significant
improvement in quality of life. Hence there is need for alternative herbal
molecules to be investigated and made available to minimize hundreds of
physical sicknesses of DM which are not treatable effectively by current allopathic
drug therapy. The present study was an experimental study conducted on rat
model DDP-IV inhibitor (sitagliptin), DRI (aliskerin) and herbal medicine
(Cinnamomum cassia).
Optimal control of blood glucose is essential for quality of life in patients
with type 2 diabetes mellitus (89). Prolonged uncontrolled diabetics are prone to

136
development of retinal damage, blindness, renal damage, renal failure, end stage
renal disease and nerve damage. All these complications are now well
established (90). Likewise, similar is the incidence of cardiovascular heart
diseases in diabetics. (91, 92).
Oral antidiabetic drugs being used include, sulfonylureas, biguanides,
glucosidase inhibitors, DDP-IV inhibitors and meglitinides are well known for
reducing hemoglobin A1C. Undoubtedly, antidiabetic oral agents and insulin are
effective at reducing plasma glucose levels, but side effects like weight gains, risk
of lactic acidosis and hypoglycemia, contraindications of some agents in heart
failure, gastric upset and diarrhea are problematic. Thus it necessitates for
alternative options like herbal agents, dietary and lifestyle modifications. Insulin
use is awkward in that the diabetics have to use multiple times, with risk of
hypoglycemia and local side effects at the site of injection. (74)
Cinnamomum cassia is a culinary spicy herbal agent used since centuries
back. Cinnamon use for lowering plasma glucose has been known since ancient
days. Use of Cinnamon as medicine dates back 5000 years approximately, when
it was primarily used for stomach and digestive problems, as appetizer, as anti -
nauseating, anti-gas, anti-spasmodic, anti-flatulent, and for diarrhea. (74)
It is reported that the Cinnamon significantly helps type 2 diabetics to
manage their glycaemic status. Type 2 diabetics having problems in controlling
glucose levels even with insulin therapy are normalized with concomitant use of
cinnamon. (93- 96)
Active compound of Cinnamon capable of exerting insulin like activity is
debatable. The original active compound regulating blood glucose level was

137
recognized as “methylhydroxy chalcone polymer (MHCP)”. The MHCP is
proposed of exerting glucose lowering effect through molecular mimicry. It is
demonstrated in in-vitro experiments that the MHCP activates a number of cell
receptors including the insulin receptors (96). Anderson investigated MHCPs
ability to function as insulin mimetic in 3T3-L1 adipocytes (94). Recent reports
had claimed of glycaemic regulatory effects as exerted by polyphenols, in
particular “Polyphenol A”. (93- 96) A search of Pubmed, Medlip, Google scholars
and a number of websites revealed limited number of literature on the effects of
Cinnamomum cassia on blood glucose levels in diabetes mellitus in both animal
and human studies. Cinnamomum cassia is reported in a few clinical trials and
animal studies, of possessing glucose regulating effects and anti-oxidant effects.
1. ANIMAL STUDIES - CINNAMOMUM CASSIA
STUDY OF KAMBLE et al (97)
KAMBLE, et al (2013) recently performed an experimental study in alloxan
induced albino diabetic rats at Al-Ameen Medical College, Karnataka, India to
investigate the effects of C. cassia on glucose homeostasis. Study compared
effects of aqueous extract of C. cassia (60 mg/kg), glibenclamide (5 mg/kg) and
Metformin (0.5gm/kg) in diabetic rats. All the agents under study were given
orally as single morning dose. Fasting blood glucose was checked with
glucometer on days 0, 10 and 15.
KAMBLE, et al (97) reported significant results of C. cassia (60 mg/kg)
compared to antidiabetic agents. Study reproted that the aqueous extract of C.
cassia (60 mg/kg) alone produced significant effects on glucose homeostasis
compared to glibenclamide and Metformin (p<0.05). It was further reported that
effects of C. cassia on glucose homeostasis were more pronounced when it was

138
combined with glibenclamide, this indicated a synergistic potentiating effect of C.
cassia. However, synergistic effect of C. cassia was not observed with Metformin.
Kamble et al concluded that the C. cassia showed independent effect on glucose
homeostasis and it was potentiated when combined with glibenclamide. (97)
Similar are the results of present study, as it is confirmed that CCBE exerts
glucose lowering effect in rat model as alone and synergistic effect with
sitagliptin.
STUDY OF QIN et al (98)
An animal study by QIN et al (98) with euglycemic clamps had shown a
dose dependent enhanced glucose utilization in rat model when an aqueous
extract of C. cassia was given at 30-300 mg/kg body weight to animals.
Enhanced effects on insulin receptors in skeletal muscle were observed as under;
o Increase in “insulin receptor (IR)-β” by insulin administration
o Increase in “IR substrate (IRS)-1 tyrosine phosphorylation”
o Increase in “IRS-1-phosphatidylinositol (PI) 3-kinase”.
It was concluded by researcher that in-vivo effects of C.cassia are similarly
a result of potentiation of insulin signaling pathways (98).
QIN, et al (98) had reported that the fructose induced “insulin resistance” in
male Wistar albino rats was ameliorated by C.cassia extract ingestion. The
insulin resistance was improved and insulin dependent glucose uptake was
enhanced in C.cassia extract fed animals. It was concluded that the C.cassia
extract overcomes insulin resistance and improves glucose uptake through
insulin mediated signaling pathways. (98) The present study witnessed similar
effects on glucose homeostasis which are similar to above study.
139
STUDY OF KANNAPPAN et al (99)
KANNAPPAN et al (99) conducted a study on effects of cinnamon bark
extract (CBEt) on insulin sensitivity and glucose tolerance. It was reported by
researcher that the CBEt ingested rats revealed enhanced expression of
hexokinase. And also the skeletal muscle and liver glycogen content was
elevated. This indicated that the CBEt increases glucose transport in insulin-
dependent cells and improves glucose homeostasis (99). The findings are also in
agreement with present study in regards of glucose homeostasis.
STUDY OF KIM et al (100)
KIM et al had reported similar effects of CBBE on glucose homeostasis in
type 2 diabetic db/db mice model. The blood glucose was measured on weeks 2,
4 and 6. Significantly positive effects on glucose homeostasis were observed and
it was concluded that the CCBE exerts its blood glucose lowering effects through
insulin-mediated glucose regulation hence glucose homeostasis was maintained
(100). The findings support the results of present study.
STUDY OF BABU (101)
BABU (101) conducted a study with “Cinnamaldehyde” derived from true
Ceylon Cinnamomum zeylanicum. Cinnamaldehyde was administered at different
doses (5, 10 and 25 mg/kg) for 45 days to streptozocin-induced diabetic male
Wistar rats. The results were highly yielding regarding glucose and blood lipids
homeostasis, and yielding effects were significantly dose dependent. After 6
weeks of experimental period a significant reduction was observed in;
Total cholesterol
Triglycerides and

140
Enteric α-glycosidase activity.
Overall, it was concluded that the cinnamaldehyde exerts hypoglycemic
and hypolipidemic activity (101). The results of above study are in agreement to
present study in terms of glucose lowering effect.
STUDY OF JIA, et al (102) and TALPUR, et al. (103)
Several recent studies reported that the “Cinnamon oil” and “Polyphenolic
oligomers” extracts had shown promising hypoglycemic, hypolipidemic and anti-
oxidant activities in streptozocin induced diabetic rat models (102) (103). The
results are in full agreement with present study.
STUDY OF VERSPOHL et al. (104)
VERSPOHL et al. (104) evaluated effects of CCBE on blood glucose
homeostasis and serum insulin release in rats. He used extracts of common and
cassia cinnamon bark extract. It was concluded that the C. cassia extract was
more superior compared to common cinnamon extract regarding insulin secretion
(104).
Mechanisms of action of CCBE on glucose homeostasis by different
researchers have been proposed as;
1. Increase in serum insulin levels, (101)
2. Increase in hepatic glycogen storage (101)
3. Insulin-receptor signaling (98)
4. An insulino-mimetic effect (105)
5. Reduction in intestinal α-glycosidase activity (106)
6. Increased insulin secretion (104)

141
The results of present study are consistent with above mechanisms of
actions regarding glucose homeostasis and insulin. Hence, it may be claimed by
present study that the CCBE increases insulin from β-cells surviving in Islets of
Langerhans of Pancreas in experimental rats. On the basis of these studies
cinnamon is well known for pharmacological properties in the treatment of type 2
diabetes.
STUDY OF BABU et al (107)
A most recent study has been reported by BABU et al (107) from Tamil
Nadu, India. The study was conducted on streptozocin induced diabetic Wistar
rats. The end points of study were to evaluate in-vivo effects of cinnamaldehyde,
an active ingredient of C.cassia, as a blood glucose regulator, insulin stimulator,
anti-oxidant and anti-peroxidant agent. Effects on pancreatic β-cell were
evaluated. Following results were reported;
o Study of Babu et al - In vitro effects of cinnamaldehyde on plasma
glucose levels (107)
Babu et al in an experimental study evaluated the free radical scavenger
activity of cinnamaldehyde i.e. Superoxide (O-2) and nitric oxide (NO) radicals. On
comparative analysis, it was reported that the cinnamaldehyde exerted better O-2
and NO scavenging potential compared to controls and ascorbic acid fed
animals, thus cinnamaldehyde proved of its antioxidant property.
o Study of Babu et al- Effects of cinnamaldehyde on plasma glucose levels
(107)
In streptozocin inducted diabetic Wistar rats, it was reported that the active
ingredient of C. cassia, the cinnamaldehyde, shows significant effect on glucose

142
homeostasis compared to diabetic controls. Cinnamaldehyde was used at doses
of 5, 10 and 20 mg/kg. Cinnamaldehyde showed significant effect on glucose
homeostasis in a dose dependent fashion. Maximum effect on glucose
homeostasis was observed at 20 mg/kg doe of cinnamaldehyde (p<0.05).
Keeping in view, beneficial effects on glucose homeostasis, further studies were
conducted to observe combined effects on insulin secretion and anti-oxidant
activities of cinnamaldehyde. However, regulatory effects on glucose
homeostasis of Babu et al (107) are in agreement with present study. “CCBE
ameliorates glucose homeostasis” has been observed in our present animal
model study.
o Study of Babu et al- Effect of cinnamaldehyde on plasma insulin levels
(107)
Effects of cinnamaldehyde on plasma insulin levels were further preceded
in the same study. Plasma insulin levels were measured in normal controls,
diabetic and experimental animals of cinnamaldehyde and glibenclamide.
Cinnamaldehyde significantly increased plasma insulin from pancreatic tissue
compared to diabetic controls and glibenclamide taken as standard reference
(p<0.05). It was concluded that the cinnamaldehyde enhances insulin secretion
from β-cells of pancreas
The findings of present study agree very much. Insulin levels were found
elevated in low dose and high dose CCBE compared to sitagliptin and controls.
Again synergistic insulin secretory effects were observed for CCBE combined
with sitagliptin as shown in graph IV-2. The animals of CCBE groups showed
elevated antioxidant enzyme activities as shown in graphs IV-3 and IV-4.

143
o Study of Babu et al- In vivo antioxidant effect of cinnamaldehyde (107)
Indicators of lipid peroxidation were studied as malonaldehyde (TBARS)
and hydroperoxides (HP). Non-enzymatic antioxidants were also studied and
included ascorbic acid, α-tocopherol, ceruloplasmin and reduced glutathione
(GSH) in normal controls, diabetics, cinnamaldehyde and glibenclamide groups.
(107)
Markers of lipid peroxidation were highly elevated in streptozocin induced
diabetic rats compared to other groups. Cinnamaldehyde treated animals showed
elevated markers of lipid peroxidation compared to normal rats, however,
difference was statistically non-significant (p>0.05).
Diabetic rats revealed a significant (p<0.05) increase in peroxides and
hydroperoxides (TBARS), decreased levels of anti-oxidants, and decreased
vitamin C compared with normal rats.
After administration of cinnamaldehyde and glibenclamide, a significant
reduction was observed in lipid peroxides (TBARS) and levels were very close to
normal. GPX, SOD and CAT were all increased in cinnamaldehyde and
glibenclamide animals compared to diabetic rats (p<0.05) and were
approximating to normal rats. It was concluded that the cinnamaldehyde and
glibenclamide reduced markers of lipid peroxidation and increased GPX, SOD
and CAT activity (107)
The findings are consistent with present study as elevated activity of anti-
oxidant enzymes was confirmed. The superoxide dismutase (SOD) and
glutathione peroxidase (GPX) were found elevated in CCBE compared to all
other groups except controls. SOD and GPX activity of CCBE animals was higher
than sitagliptin-alone treated animals.

144
o Study of Babu et al- Histological findings of pancreas (107)
Diabetic group: Histological examination of diabetic rats showed
complete destruction of pancreatic tissue and loss of normal tissue architecture in
STZ-induced diabetic rats compared to normal (control) rats. Diabetic rats
revealed distorted and feebly visible pancreatic acini and islets of Langerhans
were ill defined and shrunken. (107)
Cinnamaldehyde and Glibenclamide groups: STZ-induced diabetic rats,
in which cinnamaldehyde and glibenclamide were administered, showed a normal
architecture, pancreatic acini and islets of Langerhans. Pancreatic islets were
visibly regenerating with newly sprouting capillaries. (107)
The findings of present study showed that the CCBE protected pancreatic
tissue as examined by histological details of various group animals. The CCBE
protected pancreatic tissue against free radical mediated injury. The details of
histological findings are shown in IV-1 to IV-13. CCBE animals showed
comparatively intact islets of Langerhans, pancreatic acini and organ architecture.
STUDY OF SHEN, et al (108)
SHEN et al repoted experience of cinnamon extract (CE) on regulation of
glucose homeostasis in type 2 diabetic rat model.
o Study of SHEN et al (2014)- in-vitro experiment on 3T3-L1 adipocytes and
C2C12 myotubes in type 1 diabetic rats
Shen et al repoted that the CE regulates glucose homeostasis through its
effects on glucose transporte-4 (GLUT4) translocation in adipocytes and
myocytes both. This effect was mediated through insulin-signaling and AMP-

145
activated protein kinase (AMPK) pathways. Phosphorylation of AMPK and Acetyl-
CoA carboxylase was enhanced by CE.
The findings of glucose lowering effects of Shen et al are similar to present
study. Present study confirmed the effects of CCBE on glucose homeostasis.
(108)
o Study of SHEN et al (2014)- in-vivo experiment on type 2 diabetic rats
To elucidate effects of CE on glucose homeostasis and uptake by cells, an
in-vivo study investigated the possible mechanisms. Effects of CE were
investigated by performing OGTT and insulin-glucose tolerance tests in type 2
diabetic rats. Shen et al reported that one of the mechanisms of CE mediated
glucose homeostasis is by GLUT-4 translocation linked by AMPK signaling
pathways. Insulin was found to antagonize the activation of AMPK. Hence, it was
concluded that the GLUT-4 translocation is enhanced by CE and regulates blood
glucose levels (108). The findings of present study are in agreement with Shen et
al. (108).
STUDY OF MORGAN et al (109)
MORGAN et al reported a study on effects of Cinnamon aqueous extract
(CAE) on the natural antioxidant enzymes of kidney, brain and testicular tissue in
Bisphenol A (BPA) and Octyphenol (OP) induced injury in male albino rats. (109)
A significant rise in blood urea and serum creatinine was observed.
Similarly, malonaldehyde (MDA) concentrations were eleva ted in kidney, brain
and testes of BPA and OP treated rats. BPA and OP treated rats showed a
severe reduction in GSH, SOD and CAT activity compared to control rats. (109)

146
On the contrary, the findings were highly significant in animals that were
pre-treated with CAE, approximately 2 hours before BPA or OP was instituted.
Pre-administration of CAE protected organ histology (kidney, brain and testes)
and also increased natural anti-oxidant systems. GSH, SOD and CAT levels of
kidney, brain and testes of CAE rats were elevated compared to diabetic rats and
were in normal range compared to non-diabetic control rats. (109)
The findings of present study are consistent with MORGAN et al. The
superoxide dismutase (SOD) and glutathione peroxidase (GPX) were found
elevated in CCBE (p=0.0001). SOD and GPX activity of CCBE animals was
higher than sitagliptin-alone treated animals.
2. CLINICAL STUDIES/TRIALS- CINNAMOMUM CASSIA
STUDY OF KHAN et al (110)
A small clinical trial was reported by KHAN et al (110) from Department of
Human Nutrition, NWFP Agriculture University Pakistan. This clinical trial included
sixty type 2 diabetics. The inclusion criteria were type 2 diabetic patients of > 40
years of age, not taking insulin therapy, or a drug for major systemic disease and
fasting blood glucose of 140-400 mg/dl were selected and studied. Sixty type 2
diabetics were divided into study and placebo groups. C. cassia was
administered orally in doses of 1, 3 and 6 grams per day for total 40 days. C.
cassia was filled in capsules as an add-on therapy to anti-diabetic drug. The part
of C. cassia is not specified. A 20 days washout period was also allowed. Blood
samples were collected for measurement of blood glucose, triacylglycerol, total
cholesterol, LDL-c and HDL-c at day 0, and after C. cassia administration at 20
and 40th day and day 60 (post-intervention day 20) of washout period. It was
reported that the C. cassia reduced fasting blood glucose and reduced all sub-
fractions of lipids except HDL-c which was similar in pre- and post-intervention

147
periods. The glucose lowering effects of C. cassia was also noted on post-
intervention day 20th of washout time period. The glucose lowering effect was
observed at doses of 1 gram per day and was pronounced at 6 grams per day. C.
cassia exerted sustained glucose lowering effects which was persistent in high
dose (6 grams) for many days after C. cassia intake was stopped. It was
concluded that the C. cassia exerts glucose lowering effect in a time dependent
fashion. The authors were of opinion that the C. cassia may even show effects at
doses may be less than 1 gram per day. It was also suggested that the C. cassia
exerts a prolonged & sustained glucose regulating effects hence it is not
necessary to use C. cassia on daily basis as its effects persisted for many days
(110). The findings of present animal study are consistent regarding the blood
glucose lowering effects of CCBE.
STUDY OF ANURADHA AND DEVI (111)
ANURADHA AND DEVI (111) also reported significant reduction in both
fasting and post prandial blood glucose after 4 g cinnamon supplementation for
90 days. Findings of present study support above mentioned results of CCBE on
glucose homeostasis.
STUDY OF MANG, et al (112)
MANG, et al (112) reported a double blind clinical study from Hannover,
Germany. The study collected a sample of 79 type 2 diabetics according to well
delineated inclusion and exclusion criteria. Eventually, 14 diabetics were dropped
because of various reasons, and finally 65 subjects were reported. C. cassia was
given orally as powder filled capsules of amount 3 grams approximately for four
months. Variables studied were the fasting plasma glucose hemoglobin A1c and
blood lipids at end of four month. It was reported that the mean fasting plasma

148
glucose was reduced by 10.3% compared to baseline while placebo groups
revealed a 3.4% reduction. The findings were statistically significant (p=0.0001).
While A1C and blood lipids showed non-significant reduction when compared
pre- and post-intervention values. Plasma glucose reduction was significantly
correlated with baseline concentrations, indicating the C. cassia exerts more
effects in diabetics with very high baseline blood glucose levels. Finally it was
concluded that the C. cassia exerts moderate blood glucose lowering effects and
may be used in diabetics as add on therapy (MANG et al., 2006). The findings
are supported by present study.
STUDY OF VANSCHOONBEEK et al (113)
A previous double blind placebo controlled clinical trial by
VANSCHOONBEEK; et al (113) had reported contrary results regarding effect of
C. cassia on glucose homeostasis from Netherlands. The study comprised of 25
postmenopausal diabetic women who ingested 1.5 grams of C. cassia for 6
weeks to investigate effects on blood glucose, insulin sensitivity and blood lipids.
Before and after second and sixth week of C. cassia supplementation, blood
samples were investigated for research variables as mentioned above. C. cassia
failed to show any effects on the glucose homeostasis, insulin sensitivity and
blood lipids. The results of previous clinical trials were strongly negated, and it
was concluded that the C. cassia (1.5 grams per day) had no beneficial effects on
study parameters. It was recommended that the C. cassia supplementations
should be re-visited before health claims were made. (113) The findings of above
study are inconsistent with most of studies mentioned in literature (74, 110, 114,
115).

149
STUDY OF SUPPAPITIPORN et al (116)
SUPPAPITIPORN et al (116) recruited 60 type 2 diabetics at King
Chulalongkorn Memorial Hospital in Thailand. The study was proposed to study
and report effects of C. cassia on glucose homeostasis in terms of fasting
glucose levels and A1C, liver aminotransferases, BUN, creatinine, blood pressure
and BMI. C. cassia 1.5 grams per day were given orally for 12 weeks. The final
results were mixed, as two variables (SGOT and HbA1c) were improved to some
extent. Non significant effects were observed for fasting glucose levels, SGPT,
BUN, creatinine, blood pressure and BMI. However, A1C improvement was
significant in terms of proportion of patients achieving HbA1c ≤7% was greater in
patients receiving C. cassia compared to placebo controls. SGOT improvement
was found statistically significant (p = 0.001) (116). Findings of above study are
also inconsistent with present study with regard to blood glucose lowering effect.
STUDY OF ZIEGENFUSS (117)
ZIEGENFUSS (117) conducted a double-blind, placebo-controlled clinical
trial on 22 subjects with pre-diabetes with metabolic syndrome. The study used a
commercially available Cinnamon extract (Cinnulin PF®). The study subjects
were divided into two groups a control group (placebo therapy) and experimental
group (500 mg Cinnulin PF® daily).
The Cinnamon extract was given for 12 weeks and objective was to
explore the effects on fasting blood glucose levels and body composition.
Following results were declared in cinnamon group;
Fasting blood glucose- a reduction by -8.4%.
Systolic blood pressure- a reduction by -3.8%.
Lean body mass – an increase by +1.1%.
Body fat- an increase by 0.7%. (117)

150
The finding of glucose homeostasis of present study is consistent with
above.
STUDY OF WANG, et al (118)
Polycystic ovary syndrome (PCOS) is a common female condition
associated with fertility problems, insulin resistance and compensatory hyper-
insulinemia which are reported present in 50-70% of normal weight and up to
95% in over-weight female (118).
WANG et al. conducted a study to investigate if any of the beneficial effect
of cinnamon on the PCOS female. It was postulated that the water soluble
“Polyphenols” compounds possess insulin potentiating effects which were to be
examined. Fifteen female with PCOS were randomized to study and placebo
groups. Study group received cinnamon for 8 weeks orally. Study reported
following results;
A significant lowering of “insulin-resistance” and “fasting blood glucose”
21% lowering of “Mean blood glucose” level with OGTT
Increased insulin sensitivity as measured by “Matsuda`s insulin sensitivity
index”
It was concluded that the cinnamon extract reduces insulin resistance,
thereby improves glucose homeostasis in female with PCOS compared to
placebo group, (118) the findings are consistent with present study.
STUDY OF HLEBOWICZ et al. (119)
HLEBOWICZ et al. (119) conducted a cross over trial in 14 healthy diabetic
subjects by using 6 grams of cinnamon extract with meals. Finally, result was a
significant reduction in “post-prandial blood glucose level” and “delayed gastric
emptying”. However, no effect was observed on satiety by cinnamon in study

151
population. The glucose lowering effects of above study are consistent with
present study.
STUDY OF SOLOMON et al (120)
SOLOMON et al (120), in a clinical trial, examined effect of C.cassia on
seven lean healthy male subjects, aged 26 ± 1 years, BMI of 24.5 ± 0.3 kg/m2,
with better glycaemic tolerance. The volunteers were invited to ingest glucose in
OGTT supplemented with 5 grams C.cassia powder or placebo. The C.cassia
bark extract was used. C.cassia reduced plasma glucose in 75 gram ingested
OGTT subjects up to 13% when ingested with glucose compared to 10% when
C.cassia was ingested prior to glucose swallowing. (p=0.05).
Moreover, the effects of C.cassia on glucose homeostasis and insulin
sensitivity persisted for 12 h after cinnamon ingestion suggesting that cinnamon
may have prolonged effects on events associated with increased insulin
sensitivity. The findings are in agreement with present study in terms of glucose
lowering and insulin activity.
STUDY OF BLEVINS et al (121)
BLEVINS et al (121) conducted study at the University of Oklahoma USA.
C. cassia supplementation was analyzed regarding any effects on fasting blood
glucose, A1C, insulin, BMI and blood cholesterol. A sample of 77 type 2 diabetics
was recruited for investigating the effects of C. cassia, but many subjected were
dropped or withdrew from study protocol because of various reasons. Finally 58
participants completed the study. Experimental group (n=30) received 500 mg of
C. cassia filled capsules while controls (n=28) received wheat flour filled capsules
as placebo. C. cassia 500 mg was given orally twice a day for 3 months. Findings
were negative regarding effects of C. cassia as no improvement in fasting blood

152
glucose, A1C, insulin, BMI and blood cholesterol. It was concluded that the C.
cassia must be further studied under strict experimental designs regarding
ethnicity, dose, BMI, baseline glucose levels, A1C and concurrent drug intake.
Further studies were recommended. The findings of above study are inconsistent
with present and most of the studies mentioned in literature (74, 110, 114, 115)
STUDY OF CRAWFORD (122)
CRAWFORD (122) reported his experience of C. cassia supplementation
on glycated hemoglobin A1. The study published in Journal of American Board of
Family Medicine. The study was a randomized controlled clinical trial comprising
of 109 type 2 diabetics which were supplemented with C. cassia (1 gram per day)
capsules for 90 days. Baseline A1C was noted and re -noted after 90 days for
comparison. Positive findings were reported regarding amelioration of A1C at pre-
and post-intervention periods and this indicated that the C. cassia has effects on
glucose homeostasis. It was reported that the C. cassia lowered HbA1C by
0.83% (95% CI, 0.46 –1.20) versus 0.37% routine antidiabetic drug therapy (95%
CI, 0.15– 0.59). It was concluded that the C. cassia possessed positive effects on
glucose homeostasis as indicated by improvement in A1C which is a best
available indicator of glycemic control in diabetics (122).
STUDY OF SONI et al (115)
SONI et al (115) studied effects of C. cassia on 30 non-insulin dependent
diabetics from Rajasthan, India. Experimental groups (n=15) received 2 grams of
C. cassia per day while controls (n=15) received placebo therapy. The study
reported significant effects of C. cassia on glucose homeostasis in terms of
fasting and postprandial blood glucose levels. The author has strongly
recommended supplementing type 2 diabetics with C. cassia intervention as it

153
exerts positive effects on glucose homeostasis (115). The findings of present
study conducted on animals also support the recommendation of above study.
STUDY OF ROUSSEL et al., (114)
ROUSSEL et al., (114) reported positive findings in his clinical study.
Baseline age and BMI of subjects and C.cassia was 45.8+/-3.6 years and 45.6+/-
2.7 years and 34.2+/-4.2 and 32.3+/-2.7 kg/m2 respectively. Placebo groups did
not showed any improvement in research variable studied while C.cassia showed
fasting plasma glucose reduction from 114+/- 2.2 to 102+/-4.3 mg/dl (p=0.0001).
Plasma stress markers were significantly improved (p<0.05). Ferric reducing
activity of plasma (FRAP) and plasma thiol (SH) radicals were increased, while
plasma MDA levels decreased in subjects receiving the C.cassia extract. The
effects were more pronounced after 12 than 6 weeks. There was also a positive
correlation (r = 0.74; p = 0.014) between MDA and plasma glucose. In contrast,
RBC antioxidant enzymes SOD and GPX were not altered by supplementation at
6 weeks, but were found significant at 12 weeks (p<0.05). This study supports the
hypothesis that the inclusion of water soluble compounds of C. cassia reduces
risk factors and complications associated with diabetes and cardiovascular
disease (114).
STUDY OF SOLOMON et al (123)
In another clinical trial by SOLOMON (2009) was conducted on eight male
volunteers (aged 25 ± 1 year, body mass index 24.0 ± 0.7 kg/m2). Participants
underwent two 14-day interventions. Participants were divided into C.cassia
(3g/day) or placebo groups [69]. C.cassia reduced the plasma glucose responses
to OGTT and improved insulin sensitivity. However, the effects disappeared

154
rapidly following cessation of C.cassia intake. The results showed an
improvement in glucose homeostasis and insulin sensitivity, but the effects were
reversed quickly afterwards. (123) Ultimate results are consistent with our study.
WICKENBERG et al. 2014 (128)
21 subjects with impaired glucose tolerance (IGT) were included in the
study. 6 g of cinnamon was given twice a day for 12 weeks. No significant change
in the insulin sensitivity was observed in subjects with IGT. The findings of above
study are inconsistent to present and previous studies.
STUDY OF HOEHAN et al (74)
A recent clinical trial has been reported by HOEHAN, et al (74) Clinical trial
was conducted at Raabe College of Pharmacy, Ohio, Northern University, USA.
The study included 18 type 2 diabetics, 9 male and 9 female patients. Clinical trial
was divided into 3 weeks control phase and a 9 week experimental phase. 50%
of patients received C. cassia (1000mg per day) and other 50% received placebo
pills. Objective of study was to compare effect of C. cassia on blood glucose
compared to dietary changes alone. The subjects were educated for intake of
appropriate diabetic diets during study period. The study reported a significant
reduction in blood glucose in experimental groups compared to placebo. A 30
mg/dl reduction was noted in blood glucose in experimental groups (C. cassia
group) (p=0.000000003915). It was concluded that the C. cassia exerts effects on
glucose homeostasis very much comparable to available anti-diabetic drugs (74),
despite change in methodology.
Dipeptidyl peptidase-IV inhibitors (Sitagliptin, vildagliptin and saxagliptin)
which are capable of blocking the DPP-IV enzyme may increase the endogenous
GLP-1 level which in turn exerts incretin effect. DPP-IV inhibitors are novel oral

155
glucose-lowering agents, which may be used as monotherapy or in combination
with other antidiabetic compounds, metformin, thiazolidinediones or even
sulfonylureas. Sitagliptin, vildagliptin and saxagliptin are already on the market,
either as single agents or in fixed-dose combined formulations with metformin.
Other compounds, such as alogliptin and linagliptin, are in a late phase of
development. The proliferative and anti-apoptotic actions of GLP-1 on islet β-cells
have been mirrored by studies using DPP-IV inhibitors in diabetic rodents. High-
fat–fed mice treated with low-dose streptozocin followed by 2–3 months of
treatment with des-fluoro-sitagliptin showed improvement in fasting and
postprandial hyperglycemia, increased pancreatic insulin content, and increased
numbers of insulin-positive β-cells in association with normalization of β -cell
mass and restoration toward normal of the β-cell: β-cell ratio. (33, 48, 49, 50-52)
In present study, effects of sitagliptin were proved in diabetic rats. When
combined with C.cassia the effects on glucose homeostasis were striking.
The In-vivo models have demonstrated that the ductile cells are capable of
giving rise to new β-cells and also the interferon gamma (IFN-γ) over expression.
Wrapping of pancreatic duct with plastic sheaths in order to induce inflammation
with concomitant administration of EGF and gastrin is reported to induce β-cells
proliferation. The β-cells ductile origin from in-situ progenitor cells during acute
pancreatic injury has produced controversial results, as it has been reported in
previous studies. The controversy is that the pancreatic ductile cells contribute or
not is not proved or is controversial and remains to be elucidated. (42-46)
In our study, capillary neogenesis, intact tissue architecture mediated by
sitagliptin in favored by above studies. Effects on serum insulin and augmentation
of enzymes, SOD and GPX, were also significantly present in sitagliptin treated

156
animals. In a most recent study reported by MEGA, (124), it was reproted that six
weeks administration of sitagliptin in Zuker diabetic fatty rat, improved β-cell
functions, and improved pancreatic islet structure. It was reported that the
sitagliptin might mediate its effects through an increase in endogenous incretins
(GLP-1 and GIP). Sitagliptin may exert pancreatic protective effects through its
cytoprotective effects like anti-inflammatory effect, anti-apoptotic effect and pro-
proliferative effects (124). However, our study hypothesizes that the sitagliptin
may partially exert its cytoprotective and islet protective effects through
augmentation of anti-oxidant enzymes which minimize the tissue destruction by
free radicals.
Aliskerin is a newly launched direct rennin inhibitor approved for essential
hypertension. In present study, we did not observed any effect of aliskerin either
on glucose homeostasis or pancreatic cytoprotective effects. As previous studies
reported controversial results. GANDHI (125) reported that the aliskerin improves
glucose homeostasis through expression of GLUT-2 and GLUT-4 transporters in
liver and muscles. The study of KANG (126) did not observe any effect on blood
glucose levels in db/db mice. KANG (126) reported that the aliskerin (25 mg/kg),
infused through an osmotic mini pump showed no significant changes in glucose
homeostasis, serum creatinine, electrolytes and systolic blood pressure in db/db
diabetic mice model. Another study by Al-LAFI (127) had reported no significant
effect of aliskerin on blood glucose levels. Finding of no ef fect of aliskerin of
present study on glucose homeostasis is also in parallel to KANG (126) and AL-
LAFI (127). Present study did not observe any cytoprotective effect of aliskerin or
any effect on anti-oxidant enzyme systems in alloxan induced diabetic in rat
model.

157
CHAPTER VI
CONCLUSION
On the basis of evidence and facts of present study, comparable to both
animal and human studies, it is concluded that the Cinnamomum cassia exerts
glucose lowering effects primarily by stimulation of insulin release from β-cells of
the islets of Langerhans. Cinnamomum cassia augmented the secretion of insulin
many folds probably by protecting β-cells from free radicals due to its anti-oxidant
activity and stimulation of β-cells. C.cassia exerts a direct insulin releasing effect
through incretins.
Microscopic picture of pancreatic histology reveals intact tissue in
Cinnamomum cassia treated animals. Regenerating pancreatic tissue and most
probably the pancreatic β-cells mass is visibly observed. The present study
suggests that the Cinnamomum cassia undoubtedly maintains glucose
homeostasis through release of insulin and anti-oxidant activity which protects
pancreatic tissue.

158
CHAPTER VII
RECOMMENDATION
Further studies are recommended to elucidate various mechanisms of
glucose homeostasis on animal models.
The chemical analysis of Cinnamomum cassia is recommended to find out the
active component which enhances insulin secretion and free radical
scavenging activity alone and components present in its extract.
Animal and clinical trials are recommended to be conducted under strict
experimental conditions with sophisticated instrumentation to prove C.cassia
further for making it available to grassroots as herbal remedy for diabetes
mellitus. This will help to minimize economical burden, improve health and
prevent complication of diabetes mellitus.
Cinnamomum cassia may be used as add- on therapy with anti-diabetic
drugs.

159
REFERENCES
1. Harris MI. Undiagnosed NIDDM: clinical and public health issues. Diabetes
Care. 1993; 16: 642-52.
2. Masharani U. Diabetes mellitus and hypoglycemia. In: Mc Phee SJ,
Papadakis MA, Rabow MW (ed) Current medical diagnosis and treatment. 51st edition. Mc-Graw Hill companies, Inc. New York. 2012; 1161-1211.
3. Brown MJ. Aliskerin. Circulation. 2008; 118 (7): 773-84.
4. Yamamoto K, Kataoka YF, Dong F. Aliskiren enhances the protective effects of valsartan againt cardiovascular and renal injury in endothelial nitric oxide
synthase-deficient mice. Hypertension. 2009; 54(3): 633-8
5. Riche DM, Minor DS, Hlodiness AS, Ease HE. An issue of dependence:
implications from the Aliskiren in the evalution of proteinuria in diabetes (AVOID) trial. J Clin Hyperten. 2009; 11 (2): 89-93.
6. Shera ASA, Jawad FA, Maqsood AA. Prevalence of diabetes in Pakistan.
Diabet Res Clin Pract 2007; 76: 219-22.
7. Shahid SM, Nawab SZ, Shaikh R. Mehboob T. Glycemic control,
dyslipidemias and endothelial dysfuction in co-existed diabetes, hypertension and nephropathy. Pak J Pharmacol Soc 2012; 25(1): 123-9.
8. Afghani T, Qureshi N, Choudhry KSA. Screening for diabetic retinopathy: A comparative study between hospital and community based screening and
between paying and non-paying patients. J Ayub Med Coll 2007; 19 (1): 16-22.
9. American Diabetes Association. Standards of medical care in diabetes. Diabetes care 2012; 35 (Suppl1):S11-S63.
10. Rdrigues DL, Castelao A M, Gorriz J L, de-Alvaro F, Gonzalez JFN.
Pathophysiological role and therapeutic implications of inflammation in
diabetic nephropathy. World J Diabet 2012; 3 (1): 7-18.
11. Broadhurst CL, Polansky MM, Anderson RA. Insulin-like biological activity of culinary and medical plant aqueous extracts in vitro. J Agric Food Chem 2000; 48:849 –52.
12. Sangal A. Role of cinnamon as beneficial antidiabetic food adjunt: a review.
Advances in Applied Science Research. 2011; 2(4): 440-450.
13. Senanayake UM, Wijeskera ROB, Ravindran K, Shylaja M. Cinnamon and
Cassia. CRC Press. 2003:80-120.
14. Leela NK, Parthasarathy VA, Chempakam B, Zachariah TJ. Chemistry of Spices. CAB International, Oxford shire, 2008: 124-145.

160
15. Barceloux DG. Disease – a- month. 2009; 55: 327-335.
16. Dicker D. DPP-4 inhibitors: impact on glycemic control and cardiovascular risk factors. Diabet care 2011; 34:S276-8.
17. Choy M, Lam S. Sitagliptin: a novel drug for the treatment of type 2 diabetes. Cardiol Rev 2007; 15:264-71.
18. Qin B, Panickar KS, Anderson RA. Cinnamon: Potential role in the prevention
of insulin resistance, metabolic syndrome and type 2 Diabetes. J. Diabetes
Sci. Technol. 2010; 4(3): 685-693.
19. Weber AE. Dipeptidyl peptidase IV inhibitors for the treatment of diabetes. J Med Chem 2004; 47:4135–41.
20. Deshpande AD, Harris-Hayes M, Schootman M. Epidemiology of diabetes and diabetes –related complication. Phys. Ther. 2008; 88(11): 1254-64.
21. Versphol EJ, Bauer K, Neddermann E. Antidiabetic effect of Cinnamomum
Cassia and Cinnamomum zylanicum in vivo and in vitro. Phytotherepy
Research. 2005;19: 203-6.
22. Fisher WE, Anderson DK, Bell H Jr, Saluia AK, Brunicardi FC. Pancreas. In: Brunicardi F, Andersen D, Billiart T, Dunn D, Hunter J, Matthews J, Pollock RE. Schwartz`s Principles of Surgery. 9th edition. M`c Graw-Hill Educaiton
Asia. 2009:1167-1201.
23. Samikannu B. Dipeptidyl Peptidase IV inhibition activates CREB and improves islet vascularization through the VEGF-A/VEGFR-2 pathway. Inaugural Dissertation. zur Erlangung des Grades eines Doktors der Humanbiologie des
Fachbereichs Medizinder Justus-Liebig-Universität Giessen, Germany. 2013.
24. Shrayyef MZ, Gerich JE. Normal Glucose Homeostasis. In: Poretsky L. (editor). Principles of Diabetes Mellitus. Springer Science and Business Media, LLC. 2010.
25. Gerich JE. Physiology of glucose homeostasis. Diabetes Obes Metab. 2000;
2:345–50.
26. Woerle HJ, Meyer C, Dostou JM. Pathways for glucose disposal after meal
ingestion in humans. Am J Physiol Endocrinol Metab. 2003; 284:E716–E725.
27. Stumvoll M, Meyer C, Perriello G, Kreider M, Welle S, Gerich J. Human kidney and liver gluconeogenesis: evidence for organ substrate selectivity. Am J Physiol. 1998; 274:E817–E826.
28. Barret KE, Barman SM, Boitano S, Brooks H. Ganong`s Review of Medical
Physiology, 24th ed. M`c Graw Hill Medical Publishing. New York. 2012:507-8.
29. Guyton AC, Hall JE. Textbook of Medical Physiology, 11 th ed. Elsevier
Saunders. Philadelphia, Pennsylvania. 2012:457-60.

161
30. Gromada J, Franklin I, Wollheim CB. Alpha-cells of the endocrine pancreas: 35 years of research but the enigma remains. Endocr Rev. 2007; 28: 84–116.
31. Magnusson I, Rothman D, Gerard D, Katz L, Shulman G. Contribution of
hepatic glycogenolysis to glucose production in humans in response to a
physiological increase in plasma glucagon concentration. Diabetes. 1995; 44:185–9.
32. Rizza R, Gerich J, Haymond M, et al. Control of blood sugar in insulin-
dependent diabetes: comparison of an artificial endocrine pancreas,
subcutaneous insulin infusion and intensified conventional insulin therapy. N Engl J Med. 1980; 303:1313–8.
33. Seewoodhary J, Bain SC. Incretin therapeutics in diabetes: 1902-To Present.
The West London Medical Journal. 2010; 2 (2): 15 – 24
34. Kjems LLHJ. The influence of GLP-1 on glucose-stimulated insulin secretion:
effects on B-cell sensitivity in type 2 and non diabetic subjects.’ Diabetes 2003; 52:380-6.
35. Vollmer KHJ. Predictors of incretin concentrations in subjects with normal, impaired, and diabetic glucose tolerance. Diabetes 2008; 57:678-87.
36. Meier JJNM. Secretion, degradation and elimination of glucagon like peptide 1
and gastric inhibitory polypeptide in patients with chronic renal insufficiency
and healthy control subjects.’ Diabetes 2004;53: 654-62.
37. Hansen L, D. C. ‘Glucagon-like peptide-1-(7-36)amide is transformed to glucagon-like peptide-1-(9-36)amide by dipeptidyly peptidase IV in the capillaries supplying the L cells of the porcine intestine.’ Endocrinology 1999;
140: 5356-5363.
38. De Fronzo RA, Ratner RE, Han J. Effects of exenatide (exendin- on glycemic control and weight over 30 weeks in metformin-treated patients with type 2 diabetes. Diabetes Care. 2005; 28:1092-1100.
39. Fehmann HC, Habener JF. Insulinotropic hormone glucagon-like peptide-I (7-
37) stimulation of proinsulin gene expression and proinsulin biosynthesis in insulinoma beta TC-1 cells. Endocrinology. 1992; 130: 159-66.
40. Garber A, Henry R, Ratner R, et al. Liraglutide versus glimepiride monotherapy for type 2 diabetes (LEAD-3 Mono): a randomised, 52-week,
phase III, double-blind, parallel-treatment trial. Lancet 2009; 373:473–81.
41. Wang X, Zhou J, Doyle ME, Egan JM. Glucagon-like peptide-1 causes
pancreatic duodenal homeobox-1 protein translocation from the cytoplasm to the nucleus of pancreatic beta-cells by a cyclic adenosine
monophosphate/protein kinase A-dependent mechanism. Endocrinology.2001; 142: 1820-1827.

162
42. Jonsson J, Carlssson L, Edlund T, Edlund H. Insulin-promoter-factor 1 is required for pancreas development in mice. Nature. 1994;37: 606-9.
43. Stoffers DA, Kieffer TJ, Hussain MA, Drucker DJ, Bonner-Weir S, Habener JF. Insulinotropic glucagon-like peptide 1 agonists stimulate expression of home domain protein IDX-1 and increase islet size in mouse pancreas. Diabetes.
2000; 49:741-8.
44. Buteau J, Foisy S, Rhodes CJ, Carpenter L, Biden TJ, Prentki M. Protein kinase Czeta activation mediates glucagon-like peptide-1-induced pancreatic beta-cell proliferation. Diabetes. 2001;50:2237-43.
45. Oster A, Jensen J, Serup P, Galante P, Madsen OD, Larsson LI. Rat
endocrine pancreatic development in relation to two homeobox gene products (Pdx-1 and Nkx 6.1). J Histochem Cytochem. 1998; 46: 707-15.
46. Xu G, Stoffers DA, Habener, JF, Nonner-Weir S. Exendin-4 stimulates both beta-cell replication and neogenesis, resulting in increased beta-cell mass and
improved glucose tolerance in diabetic rats. Diabetes. 1999; 48: 2270-6.
47. Mu J, Woods J, Zhou YP, Roy RS, Li Z, Zycband E, et al. Chronic inhibition of
dipeptidyl peptidase-4 with a sitagliptin analog preserves pancreatic beta-cell mass and function in a rodent model of type 2 diabetes. Diabetes. 2006; 55:
1695-1704.
48. Scheen AJ. Dipeptidylpeptidase-4 inhibitors (Gliptins): focus on drug-drug
interactions. Clin Pharmacokinet. 2010;49: 573-88.
49. Deacon CF, Danielsen P, Klarskov L, Olesen M, Holst JJ. Dipeptidyl peptidase IV inhibition reduces the degradation and clearance of GIP and potentiates its insulinotropic and antihyperglycemic effects in anesthetized
pigs. Diabetes. 2001; 50: 1588-97.
50. Ryskjaer J, Deacon CF, Carr RD, Krarup T, Madsbad S, Holst J, Vilsboll T. Plasma dipeptidyl peptidase-IV activity in patients with type-2 diabetes mellitus correlates positively with HbAlc levels, but is not acutely affected by
food intake. Eur J Endocrinol. 2006; 155: 485-93.
51. Lambeir AM, Durinx C, Scharpe S, de-Meester I. Dipeptidyl-peptidase IV from bench to bedside: an update on structural properties, functions, and clinical aspects of the enzyme DPP IV. Crit Rev Clin Lab Sci. 2003; 40:209-294.
52. Mentlein R, Gallwitz B, Schmidt WE. Dipeptidyl-peptidase IV hydrolyses
gastric inhibitory polypeptide, glucagon-like peptide-1(7-36) amide, peptide histidine methionine and is responsible for their degradation in human serum. Eur J Bioche. 1993; 214: 829-35.
53. Bonner-Weir S, Weir GC. New sources of pancreatic beta-cells. Nat
Biotechnol. 2005; 23: 857- 861.

163
54. Montani JP, van-Vilet BN. General Physiology and Pathophysiology of the Renin–Angiotensin System. Department of Medicine/Division of Physiology,
University of Fribourg, Rue du Muse 5, 1700 Fribourg, Switzerland. 2005.
55. Brasier AR, Li J. Mechanisms for inducible control of angiotensinogen gene
transcription. Hypertension. 1996;27:465–75.
56. Cowley AW Jr. Control of the renal medullary circulation by vasopressin V1 and V2 receptors in the rat. Exp Physiol. 2000;85(Spec No):223S–231S
57. Dzau VJ. Theodore Cooper lectures: tissue angiotensin and pathobiology of vascular disease: a unifying hypothesis. Hypertension. 2001;37:1047–52
58. Eaton SB, Konner M. Paleolithic nutrition: a consideration of its nature and
current implications. N Engl J Med.1985; 312: 283–9.
59. Edwards RM. Segmental effects of norepinephrine and angiotensin II on
isolated renal microvessels. Am J Physiol.1983;244:F526–F534
60. Gradman A, Schmieder R, Lins R, Nussberger J, Chiang Y, Bedigian M.
Aliskiren, a novel orally effective renin inhibitor, provides dose-dependent antihypertensive efficacy and placebo-like tolerability in hypertensive
patients". Circulation. Vol. 2005; 111(8): 1012–8.
61. Straessen JA, Li Y, Richart T. Oral Renin Inhibitors. Lancet. 2006;
368 (9545): 1449–56.
62. Parving HH, Persson F, Lewis JB, Lewis JB, Lewis EJ, Hollenberg NK. Aliskiren Combined with Losartan in Type 2 Diabetes and Nephropathy," N Engl J Med. 2008; 358: 2433.
63. Ingelfinger Jr. Aliskiren and dual therapy in type 2 diabetes mellitus. N. Engl.
J. Med. 2008; 358 (23): 2503–5.
64. Parving HH, Brenner BM, McMurray JJ. Baseline characteristics in the
aliskiren trial in type 2 diabetes using cardio-renal endpoints (ALTITUDE). J Renin Angio Aldo Syst. 2012; 13 (3): 387-93.
65. European Medicines Agency. Science Medicines Health: Assessment report on Cinnamomum verum J. S. Presl, cortex and corticis aetheroleums. 2011.
66. Thakare M. Pharmacological screening of some medicinal plants as antimicrobial and feed additives. Thesis. Department of Animal and Poultry
Science, Virginia Polytechnic Institute and State University, Blacksburg, Virginia USA 2004.
67. Aarestrup FM, Jensen LB. Trends in antimicrobial susceptibility in relation to antimicrobial usage and presence of resistance genes in Staphylococcus
hyicus isolated from exudative epidermitis in pigs. Vet. Microbiol. 2002;9:83-94.

164
68. Banerjee GC. A Text Book of Animal Husbandry. 2nd edition. India publication, Delhi, India. 1998.
69. Cheng TC, Cheng WL, Hsu JC, Shih Y, Chou ST. Chemical composition and tyrosinase inhibitory activity of Cinnamomum cassia essential oil. Botanical Studies. 2013; 54: 10.
70. Bent S, Ko R. Commonly used herbal medicines in the United States: a
review. Am. J. Med. 2004; 116: 478-85.
71. Friedman M. Food browning and its prevention: an overview. J Agric Food
Chem. 1996; 44:631–53.
72. Giordani R, Regli P, Kaloustian J, Portugal H. Potentiation of antifungal activity of amphotericin B by essential oil from Cinnamomum cassia. Phytother Res. 2006; 20:58–61.
73. Alzoreky N S, Nakahara KS. Antibacterial activity of extracts from some
edible plants commonly consumed in Asia. Int. J. Food Microbiol. 2003; 80: 223-30.
74. Hoehn AN, Stockert AL. The Effects of Cinnamomum Cassia on Blood Glucose Values are Greater than those of Dietary Changes Alone. Nutrition
and Metabolic Insights.2012;5: 77–83
75. Ooi LS, Li Y, Kam SL, Wang H, Wong EY, Ooi VE. Antimicrobial activities of
cinnamon oil and cinnamaldehyde from the Chinese medicinal herb Cinnamomum cassia Blume. Am J Chin Med. 2006; 34:511–22
76. Lee HS, Ahn YJ. Growth-inhibiting effects of Cinnamomum cassia bark
derived materials on human intestinal bacteria. J Agric Food Chem.
1998;46:8–12
77. Boyd FM, Edwards HM Jr. Fat absorption by germ-free chicks. Poult. Sci. 1967;46: 1481-3.
78. Beuchat LR, Golden DA. Antimicrobials occurring naturally in foods. Food Technol. 1989; 43: 134-42.
79. Bent S, Ko R. Commonly used herbal medicines in the United States: a
review. Am. J. Med.2004;116: 478-85.
80. Marongiu B, Piras A., Porcedda S, Tuveri E, Sanjust E, Meli M, et al.
Supercritical CO2 extract of Cinnamomum zeylanicum: chemical characterization and antityrosinase activity. J Agric Food Chem. 2007;55:10022–7
81. Azumi S, Tanimura A, Tanamoto K. A novel inhibitor of bacterial endotoxin
derived from cinnamon bark. Biochem. Biophys. Res. Commun. 1997; 234:506-10.

165
82. Bent S, Ko R. Commonly used herbal medicines in the United States: a review. Am. J. Med.2004; 116: 478-85.
83. Ka H, Park HJ, Jung HJ, Choi JW, Cho KS, Ha J, et al. Cinnamaldehyde induces apoptosis by ROS-mediated mitochondrial permeability transition in human promyelocytic leukemia HL-60 cells. Cancer Lett. 2003; 196:143–52.
84. Barnes EM, Mead GC, Impey CS, Adams BW. The effect of dietary bacitracin
on the incidence of Streptococcus faecalis subspecies liquefaciens and related streptococci in the intestines of young chicks. Br. Poult. Sci. 1987; 19:713-23.
85. Matsuura R, Ukeda H, Sawamura M. Tyrosinase inhibitory activity of citrus
essential oils. J Agric Food Chem.2006;54:2309–13
86. Koh WS, Yoon SY, Kwon BM, Jeong TC, Nam KS, Han MY. Cinnamaldehyde
inhibits lymphocyte proliferation and modulates T-cell differentiation. Int J Immunopharmacol. 1998;20:643–60
87. Akoachere JF, Ndip RN, Chenwi E B, Ndip LM, Njock TE, Anong DN.
Antibacterial effect of Zingiber officinale and Garcinia kola on respiratory tract
pathogens. East Afr. Med. J. 2002; 79: 588-92.
88. Marongiu B, Piras A, Porcedda S, Tuveri E, Sanjust E, Meli M, et al. Supercritical CO2 extract of Cinnamomum zeylanicum: chemical characterization and antityrosinase activity. J Agric Food Chem. 2007;
55:10022–7.
89. Barendse S, Singh H, Frier BM, Speight J. The impact of hypoglycaemia on quality of life and related patient-reported outcomes in Type 2 diabetes: a narrative review. Diabetic Med. 2012; 29(3): 293–302.
90. Deshpande AD, Harris-Hayes M, Schootman M. Epidemiology of diabetes
and diabetes –related complication. Phys Ther. 2008; 88(11): 1254-64.
91. Home P. Cardiovascular disease and oral agent glucose-lowering therapies in
the management of type 2 diabetes. Diabetes Technol The. 2012; 14: S33–42.
92. Bower JK, Appel LJ, Matsushita K. Glycated Hemoglobin and Risk of
Hypertension in the Atherosclerosis Risk in Communities Study. Diabetes
Care. 2012;35(5):1031–7.
93. Jarvill-Tayor KJ, Anderson RA, Graves DJ. A hydroxychalcone derived from cinnamon functions as a mimetic for insulin in 3T3-L1 adipocytes. J Am Coll Nutr. 2001; 20(4):327–36.
94. Anderson RA. Chromium and polyphenols from cinnamon improve insulin
sensitivity. P Nutr Soc. 2008;67(1) :48–53.
95. Curtis PJ, Sampson M, Potter J, Dhatariya K, Kroon PA, Cassidy A. Chronic
ingestion of flavan-3-ols and isoflavones improves insulin sensitivity and

166
lipoprotein status and attenuates estimated 10-year CVD risk in medicated postmenopausal women with type 2 diabetes A 1-year, double-blind, ran-
domized, controlled trial. Diabetes Care. 2012; 35(2):226–32. 96. Jia Q, Liu X, Wu X, Wang X, Hu Y, Li C. Cinnamomum cassia. Phytomedicine.
2008; 16: 744-50.
97. Kamble S, Rambhimaiah S. Antidiabetic activity of aqueous extract of
Cinnamomum cassia in alloxan induced diabetic rats. Biomed Pharmacol J 2013; 6 issue 1: 83-8.
98. Qin B, Nagasaki M, Ren G, Bajotto T, Oshida Y, Sato Y. Cinnamomum cassia. Diabet Res Clin Pract. 2003; 62: 139-48.
99. Kannappan S, Jayaraman T, Rajasekar P, Ravichandran MK, ANuradha CV.
Cinnamomum cassia. Singapore Med J2006; 47: 858-63.
100. Kim YJ, Uyama H. Tyrosinase inhibitors from natural and synthetic sources:
structure, inhibition mechanism and perspective for the future. Cell Mol Life Sci. 2005; 62:1707–23.
101. Babu PS, Alshatwi AA, Ignacimuthu S. Beneficial antioxidative and antiperoxidative effects of cinnamaldehyde protect streptozocin induced
Pancreated β-cells damage in Wistar rats. Biomol Ther. 2007; 22 issue: 47-54.
102. Jia Q, Liu X, Wu X. Hypoglycemic activity of a polyphenolic oligomer-rich extract of Cinnamomum parthenoxylon bark in normal and streptozotocin-
induced diabetic rats. Phytomedicine. 2009; 16(8): 744–50. 103. Talpur N, Echard B, Ingram C, Bagchi D, Preuss H. Cinnamomum cassia.
Diabetes Obes Metab.2005;7: 193-9.
104. Verspohl EJ. Novel therapeutics for type 2 diabetes: incretin hormone mimetics (glucagon-like peptide-1 receptor agonists) and dipeptidyl peptidase-4 inhibitors.’ Pharmacology & Therapeutics. 2009;124: 113-38.
105. Roffey B, Atwal A, Kubow S. Cinnamomum cassia. Mol Nutr Food Res. 2006; 50: 739–45.
106. Kim SH, Hyun SH, Choung SY. Cinnamomum cassia. J Ethnopharmacol.
2006; 104: 119–23.
107. Babu PS, Alshatwi AA, Ignacimuthu S. Beneficial antioxidative and
antiperoxidative effects of cinnamaldehyde protect streptozocin induced Pancreated β-cells damage in Wistar rats. Biomol Ther. 2014; 22 issue: 47-54.
108. Shen Y, Honma N, Kobayashi K, Jia LJ, Hosono T, Shindo K, et al.
Cinnamon Extract Enhances Glucose Uptake in 3T3-L1 Adipocytes and C2C12 Myocytes by Inducing LKB1-AMPActivated Protein Kinase Signaling. PLOS ONE. 2014; 9(2): e87894.

167
109. Morgan AM, El-Ballalb SS, El-Bialyc B E, EL-Boraic NB. Studies on the
potential protective effect of cinnamon against bisphenol A- and octylphenol-
induced oxidative stress in male albino rats. Toxicology Reports 1. 2014: 92–101.
110. Khan A, Safdar A, Khan MMA, Khathak KN, Anderson RA. Cinnamon
Improves Glucose and Lipids of People With Type 2 Diabetes. Diabetes
Care. 2003; 26:3215–8.
111. Anuradha V, Devi A. Hypoglycemic effect of Cinnamon and Cumin seed powder on type 2 Diabetes. Indian J Nutr Diet. 2004; 49(9): 370-4.
112. Mang B, Wolters M, Schmitt B, Kelb K, Lichtinghangen R., Stichtenoth DO, Hahn A. Effects of a cinnamon extract on plasma glucose, HbA1c and
serum lipids in diabetes mellitus type 2.European Journal of Clinical Investigation. 2006; 36: 340–4.
113. Vanschoonbeek K, Thomassen BJW, Senden JM, Wodzig WKWH, Loon LJC. Cinnamon supplementation does not improve glycemic control in
postmenopausal type 2 diabetes patients. Am Soc Nutr. 2006:977-8. 114. Roussel AM, Hiniger I, Benarab R, Ziegenfuss TN. Antioxidant Effects of a
Cinnamon Extract in People with Impaired Fasting Glucose That Are Overweight or Obese. Journal of the American College of Nutrition. 2009;
28(1): 16-21. 115. Soni R, Bhatnagar V. Effect of Cinnamon (Cinnamomum Cassia)
intervention on Blood Glucose of Middle Aged Adult Male with Non Insulin Dependent Diabetes Mellitus (NIDDM). Kamla-Raj Ethno-Med. 2009; 3(2):
141-4. 116. Suppapitipon S, Kanpaski N, Suppapitipon N. The effect of cinnamon cassia
powder in type 2 diabetes mellitus. J Med Assoc Thailand. 2006; 89 (3): S200-S205.
117. ZiegenfussTN, Hofheins JE, Mendel RW, Landis J, Anderson RA.
Cinnamomum cassia. J Intl Soc Sports Nutr. 2007; 3: 45-53.
118. Wang JG, Anderson RA, Graham III GM, Chu MC, Sauer MV, Guarnaccia
MM. Cinnamomum cassia. Fertil Steril. 2007; 88: 240–3. 119. Hlebowicz J, Darwiche G, Bjorgell O, Almer LO. Cinnamomum cassia. Am J
Clin Nutr. 2007; 85: 1552–6.
120. Solomon TPJ, Blannin AK. Effects of short-term cinnamon ingestion on in vivo glucose tolerance. Diabetes Obesity and Metabolism. 2007; 9(6):895-901.

168
121. Blevins SM, Leyva MJ, Brown J, Wright J, Scofield RH, Aston CE. Effect of cinnamon on glucose and lipid levels in non-insulin-dependent type 2
diabetics. Diabetes Care. 2007; 30 (9): 2236-7. 122. Crawford P. Effectiveness of cinnamon for lowering hemoglobin A1C in
patients with type 2 diabetes: a randomized, controlled trial. J Am Board
Fam Med. 2009; 22(5):507-12.
123. Solomon TPJ, Blannin AK. Changes in glucose tolerance and insulin sensitivity following 2 weeks of daily cinnamon ingestion in healthy humans. Eur. J. Appl. Physiol. 2009, 105:969-976.
124. Mega C, Vala H, Rodroques-Santos P, Oliveira J, Teixeira F, Fernandeds R,
et al. Sitagliptin prevents aggravation of endocrine and exocrine pancreatic damage in the Zucker Diabetic Fatty rat – focus on amelioration of metabolic profile and tissue cytoprotective properties. Diabetol Metab Syndr. 2014; 6
(1): 42.
125. Gandhi S, Srinivasan BP, Akarte AS. Aliskerin improves insulin resistance and ameliorates diabetic renal vascular complications in STZ-induced diabetic rats. JRAAS. 2013;14 (1):3-13.
126. Kang YS, Lee MH, Song HK, Hyun YY, Cha JJ, Ko GJ, et al. Aliskerin
improves insulin resistance and ameliorates diabetic vascucalr complications in dh/db mice. Nephrol Diabl Transplant. 2011; 26 (4):1194-1204.
127. Al-Lafi SM, Artinian SB, Boutary SS, Zwainy NS, Bitar KM, Bikhazi AB.
Aliskerin, exenadin-4 and insulin: their impact on endothelin receptor subtype (s) regulation/binding in type 1 diabetic rat hearts. Canadian J Physiol Pharmacol. 2013; 91 (10):830-8.
128. Wickenberg J, Lindstedt S, Nilsson J, Hlebowicz J. Cassia cinnamon does
not change the insulin sensitivity or the liver enzymes in subjects with impaired glucose tolerance. Nutritional J 2014.
129. Handa SS, Khanuja SPS, Longo G, Rakesh DD. Extraction technologies for medicinal and aromatic plants. International Center for Science and High
Technology, Trieste Italy 2008.