Embed Size (px)
Citation preview
University of Arkansas, FayettevilleScholarWorks@UARK
Theses and Dissertations
5-2017
Effect of Column Axial Load on Skewed SMF RBSConnection DemandsClovis DesrochersUniversity of Arkansas, Fayetteville
Follow this and additional works at: http://scholarworks.uark.edu/etd
Part of the Civil Engineering Commons, and the Structural Engineering Commons
This Thesis is brought to you for free and open access by ScholarWorks@UARK. It has been accepted for inclusion in Theses and Dissertations by anauthorized administrator of ScholarWorks@UARK. For more information, please contact [email protected], [email protected].
Recommended CitationDesrochers, Clovis, "Effect of Column Axial Load on Skewed SMF RBS Connection Demands" (2017). Theses and Dissertations. 1886.http://scholarworks.uark.edu/etd/1886
Effect of Column Axial Load on Skewed SMF
RBS Connection Demands
A thesis submitted in partial fulfillment of the requirements for the degree of Master of Science in Civil Engineering
by
Clovis Desrochers University of Arkansas
Bachelor of Science in Civil Engineering, 2015
May 2017 University of Arkansas
This thesis is approved for recommendation to the Graduate Council. Dr. Gary Prinz Thesis Director Dr. Eric Fernstrom Dr. Micah Hale Committee Member Committee Member
Abstract
Steel buildings in high seismic areas often require special structural systems to transfer
large lateral forces induced by earthquake accelerations. The selection of an appropriate
seismic steel system (braced frame, moment frame, shear wall, etc.) is often influenced by
architectural considerations. Moment frame configurations offer the most architectural
flexibility, but are limited by code prequalification requirements that limit the use of non-
orthogonal (skewed) beam-column connection geometries. A recent study has investigated
laterally skewed moment frame connections, indicating that skew increases the potential for
column twist and column flange yielding; however, it is unclear how realistic column axial loads
will affect the skewed connection performance.
This study investigates the effects of column axial loads on skewed special moment
frame connections containing reduced beam sections (RBSs). Detailed finite element analyses
are used for all investigations, and several beam-column connection configurations are
considered, representing: 3 beam-column geometries (shallow, medium and deep columns); 4
levels of skew at the beam-to-column connection; and 4 levels of applied column axial load.
Results indicate that combined beam skew, axial load, and applied connection rotations lead to
local buckling issues within deep column moment frame configurations; however, increasing
beam-skew and axial load has little effect on connection moment capacity prior to column local
buckling initiation. Beam-skew angle is the dominate contributor to resulting column twist and
increasing column axial load (up to 50% ΦPn) has a negligible effect on resulting column twist.
Applied column axial loads have little effect on resulting column flange yielding within the
skewed beam-to-column connections.

Table of Contents
1. Introduction 1
2. Frame Configurations 5 2.1 Finite Element Modeling Techniques 8 2.2 Mesh Size and Initial Imperfections 12 2.3 Loading Protocol 14
3. Results and Discussion 15
3.1 Effect of Column Axial Loads on Global Connection Response 15 3.1.1 Shallow-Column Models 18 3.1.2 Medium-Column Models 20 3.1.3 Deep-Column Models 21
3.2 Effect of Column Axial Load on Skewed RBS Connection Column Twisting 24 3.2.1 Shallow-Column Models 27 3.2.2 Medium-Column Models 28 3.2.3 Deep-Column Models 29
3.3 Column Flange Stress 32
4. Summary and Conclusions 35
References 36
Appendix 38 A. Distribution of PEEQ along Column Flanges 38 B. Hysteresis Graphs 40 C. RBS Flange-Cut Dimension Calculation 53 D. Determining the Nominal Compressive Strengths 56

List of Tables
Table 1 Beam-column combinations and the beam RBS flange-cut dimensions. 7
Table 2 Analysis matrix and results. 9
Table 3 Column properties. 18
Table 4 Deep-column SMF failure observations. 24
List of Figures
Figure 1 Plan view of beam-flange cuts in an RBS connection. 2
Figure 2 Common Post-Northridge Earthquake failure modes: (a) fracture of weld or column flange, (b) column flange rupture and propagation into column web. 2
Figure 3 Example framing plan view of SMFs with skewed (non-orthogonal) connections. 2
Figure 4 Plan view of out-of-plane (lateral) skew. 4
Figure 5 Model Geometry. 5
Figure 6 Reduced Beam Section details. 7
Figure 7 Increased column width “b” demanded by beam skew. 7
Figure 8 Connection Geometry. 8
Figure 9 Comparison of backbone curve and the hardening model. 11
Figure 10 DOFs and applied loads. 12
Figure 11 Overview of meshing with locations of refinement. 13
Figure 12 Fundamental frequency mode shapes for W14X132 models with (a) 0° skew, and (b) 30° skew, scaled by 50 times for ease of viewing. 13
Figure 13 Loading protocol. 15
Figure 14 Resisting of moment forces by the strong and weak axes of the column due to beam-skew. 17
Figure 15 Effect of column axial loads on PEEQ distribution in the COI at 0.04 rad drift, for models with 30° skew. Note the deep-column SMF connection at 50% ΦPn failed before reaching 0.04 rad drift. 17
Figure 16 Failure from column local buckling below the: (a) second-story connection for the shallow column model with 30° skew and 50% ΦPn; (b) first-story connection for the deep column model with 20° skew and 25% ΦPn. 18
Figure 17 Location of connection-moment data. 18
Figure 18 Effects of beam-skews and axial loads on reactionary moments at the connection for shallow-column SMFs at various interstory drift angles. 19
Figure 19 Effect of beam-skews and axial loads on connection moment capacity for medium-column SMFs at various interstory drift angles. Also included are the visualizations of the instability mechanisms. 21

Figure 20 Effect of beam-skews and axial loads on reactionary moments at the connection for deep-column SMFs at various interstory drift angles. The missing data point (20° skew, and 25% ΦPn) is due to column buckling prior to completing 0.04 rad drift, as shown in Figure 16b, and an explanation is given in section 3.2.3. Also included are the instability mechanism visualizations, where points “h”, “i” and “j”, “k” are 10% and 15% ΦPn, respectively. 23
Figure 21 Column torsion and weak axis bending produced by (a) out-of-plane beam skew and (b) lateral-torsional buckling of the RBS [Chi and Uang (2002)]. 25
Figure 22 Effect of beam-skew on equivalent plastic strain (PEEQ) distribution in the COI at 0.04 rad drift, for SMFs with a consistent axial load. 26
Figure 23 Effect of beam-skew and axial load on column twist at 0.04 rad drift. 26
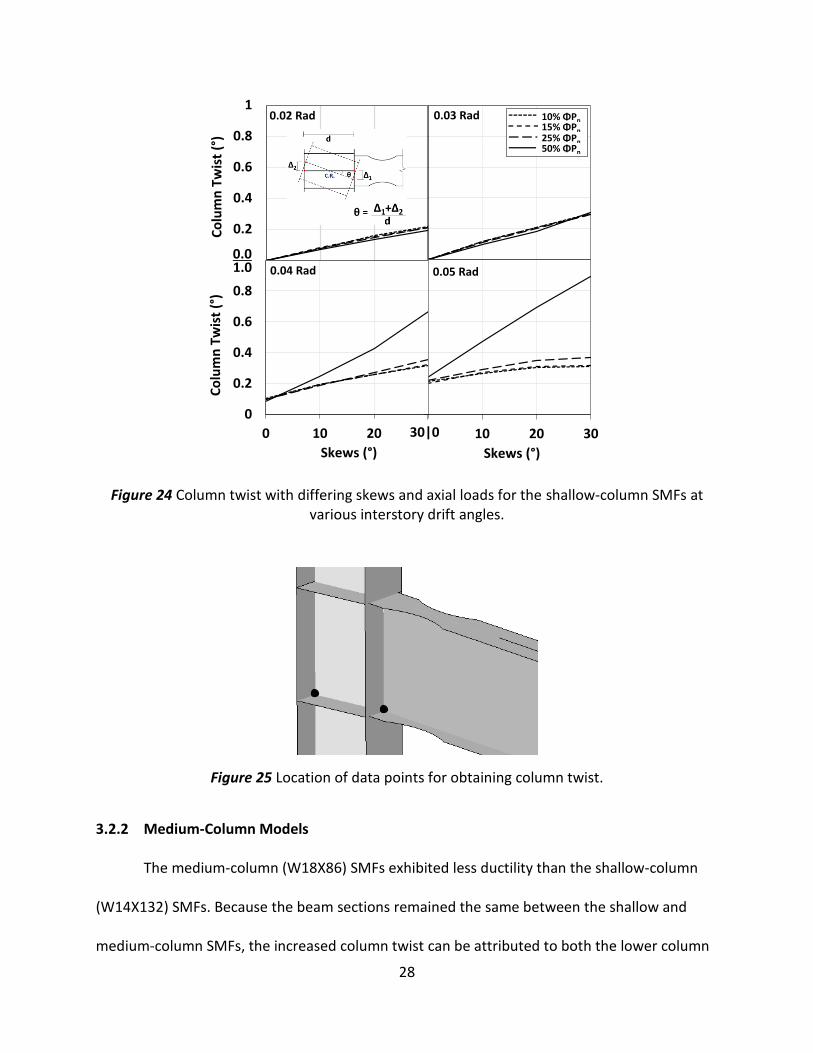
Figure 24 Column twist with differing skews and axial loads for the shallow-column SMFs at various interstory drift angles. 28
Figure 25 Location of data points for obtaining column twist. 28
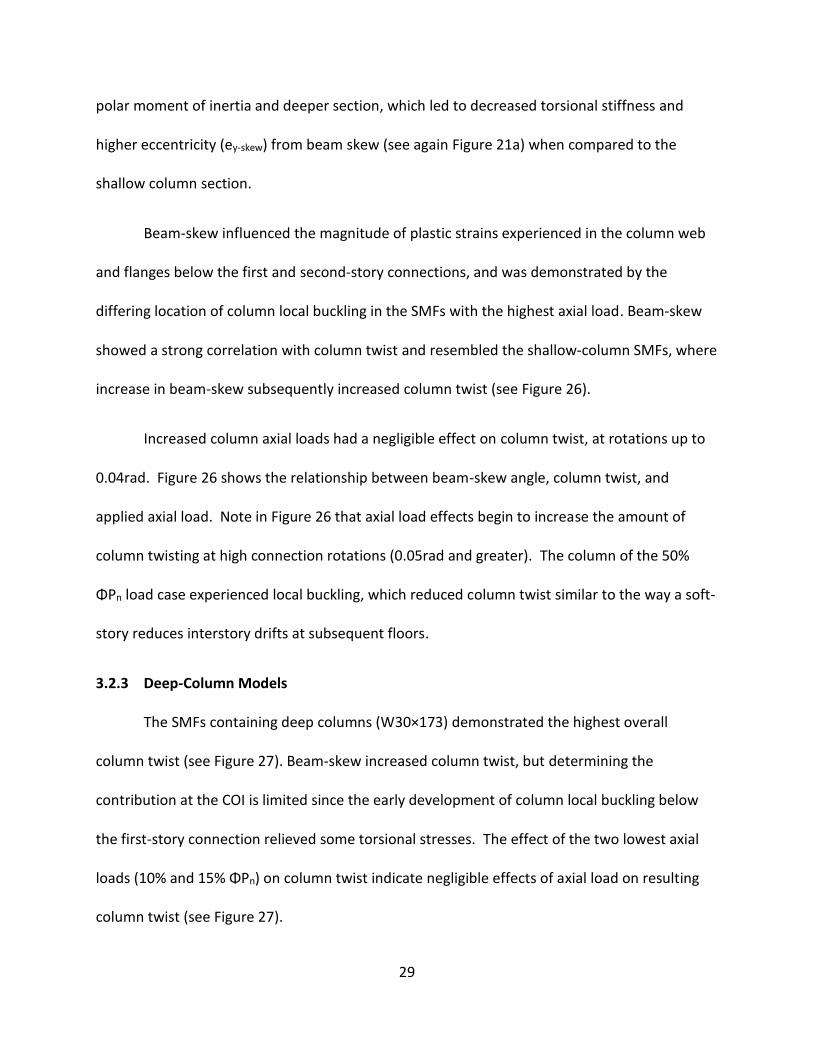
Figure 26 Column twist with differing skews and axial loads for the medium-column SMFs at various interstory drift angles. Also included are the instability mechanism visualizations of the column compression flange. 30
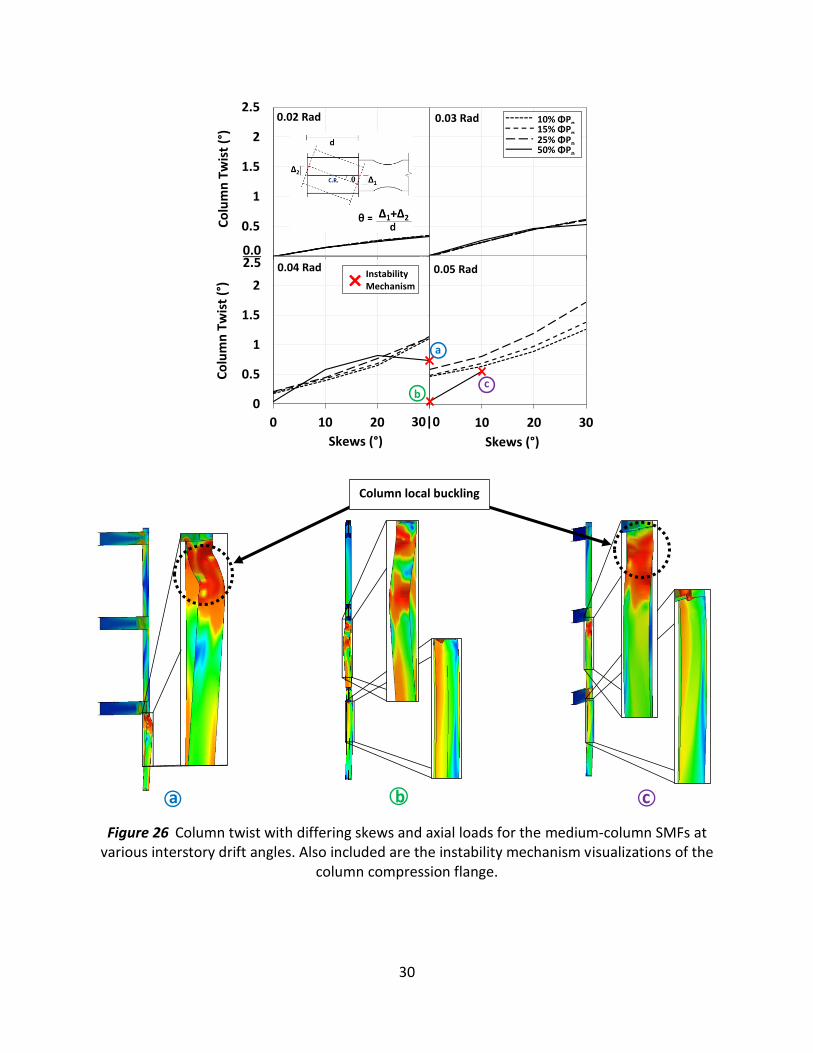
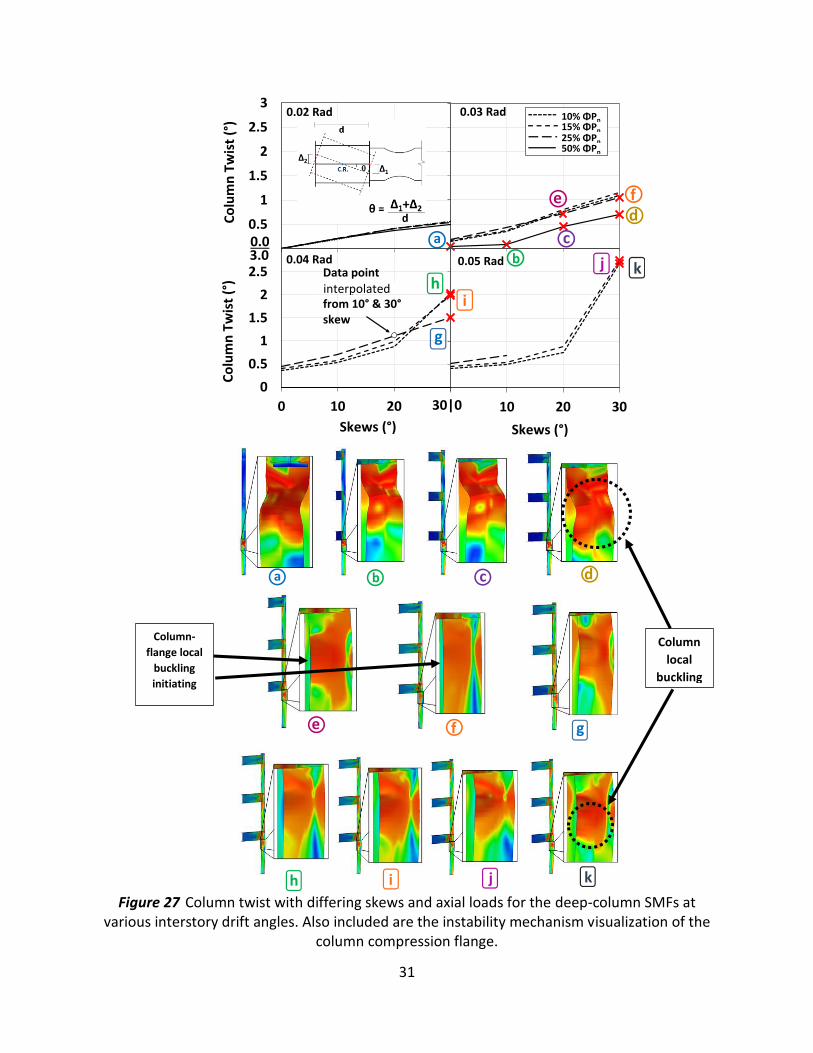
Figure 27 Column twist with differing skews and axial loads for the deep-column SMFs at various interstory drift angles. Also included are the instability mechanism visualization of the column compression flange. 31
Figure 28 Two common areas of maximum equivalent plastic strains (shaded). 33
Figure 29 Location of data extraction for column-flange PEEQ distribution. 33
Figure 30 Effect of beam-skew and axial load on the PEEQ at the column flange-tip at 0.04 rad drift. 33
Figure 31 PEEQ distribution along the normalized deep-column flange with varying skews and axial loads at 0.04 rad drift. (a) W 14×132 models; (b) W18×86 models; and (c) W30×173 models. The red lines denote the presence of column local buckling. 34
Figure 32A Distribution of PEEQ at 0.04 and 0.05 rad drift with varying skews and axial loads for the shallow-column SMFs. 38
Figure 33A Distribution of PEEQ at 0.04 and 0.05 rad drift with varying skews and axial loads for the medium-column SMFs. 39
Figure 34A Distribution of PEEQ at 0.04 and 0.05 rad drift with varying skews and axial loads for the deep-column SMFs. 39
Figure 35B Hysteresis graphs showing moments and column twist with storydrift for the shallow-column SMFs containing 0° skew. 41
Figure 36B Hysteresis graphs showing moments and column twist with storydrift for the shallow-column SMFs containing 10° skew. 42
Figure 37B Hysteresis graphs showing moments and column twist with storydrift for the shallow-column SMFs containing 20° skew. 43
Figure 38B Hysteresis graphs showing moments and column twist with storydrift for the shallow-column SMFs containing 30° skew. 44
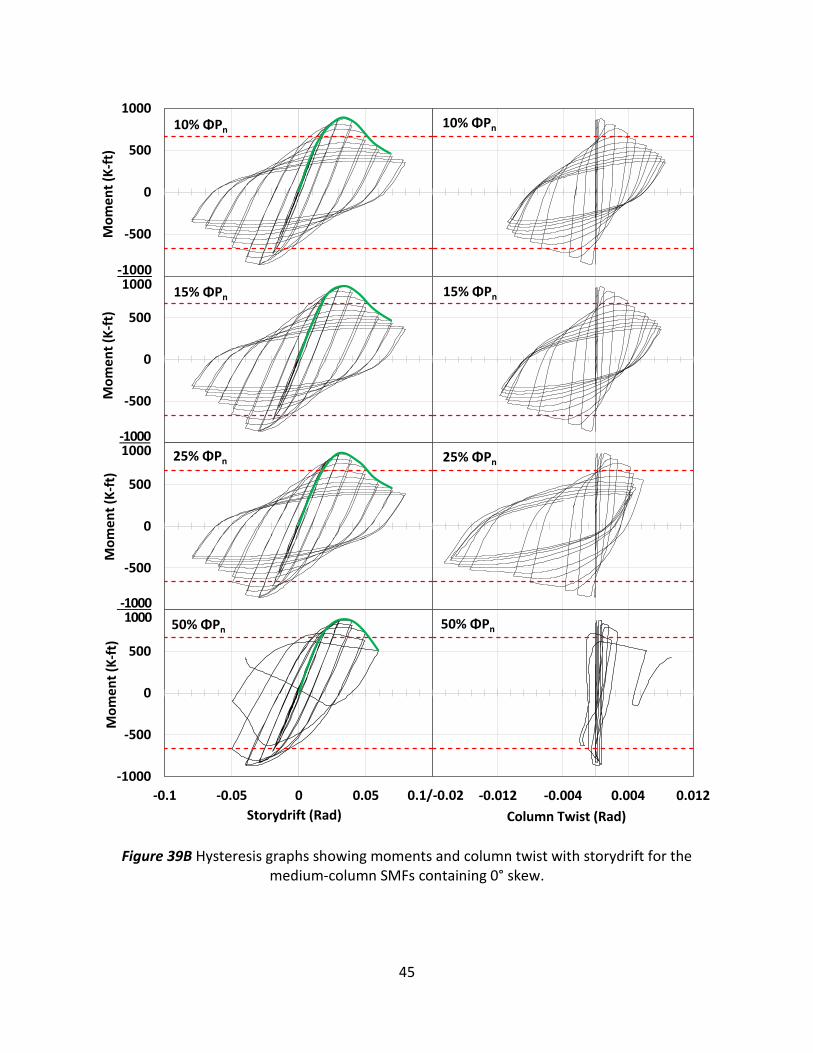
Figure 39B Hysteresis graphs showing moments and column twist with storydrift for the medium-column SMFs containing 0° skew. 45
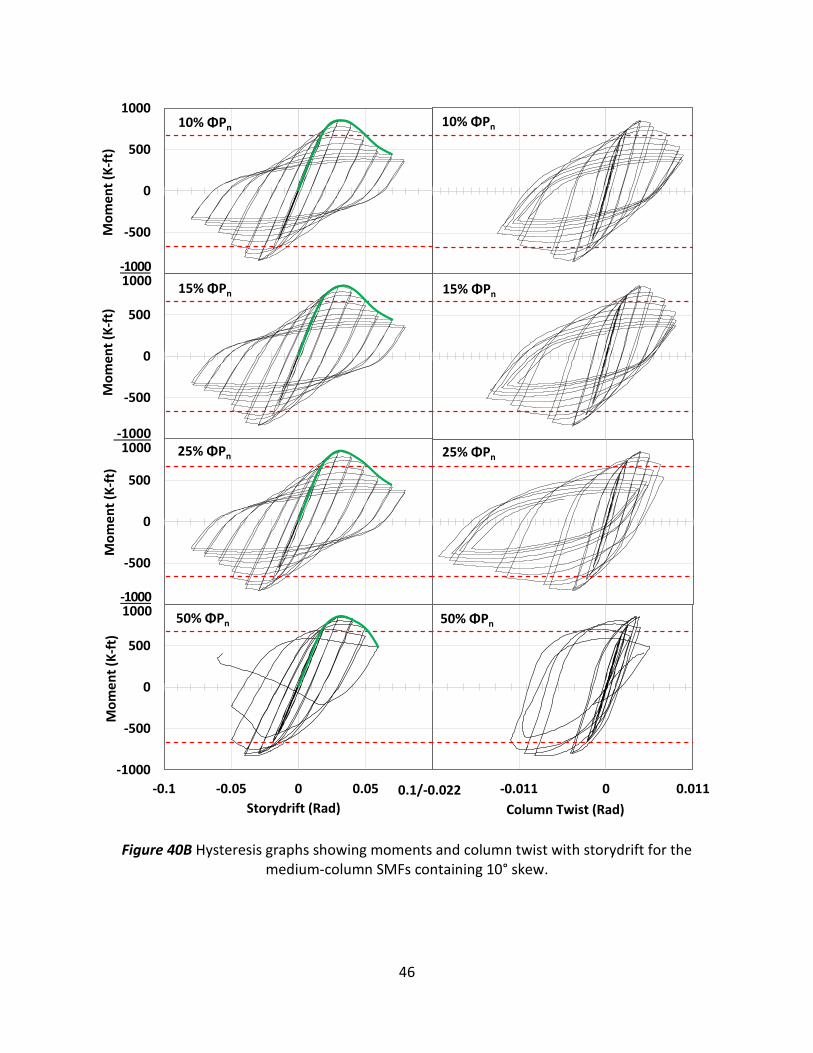
Figure 40B Hysteresis graphs showing moments and column twist with storydrift for the medium-column SMFs containing 10° skew. 46
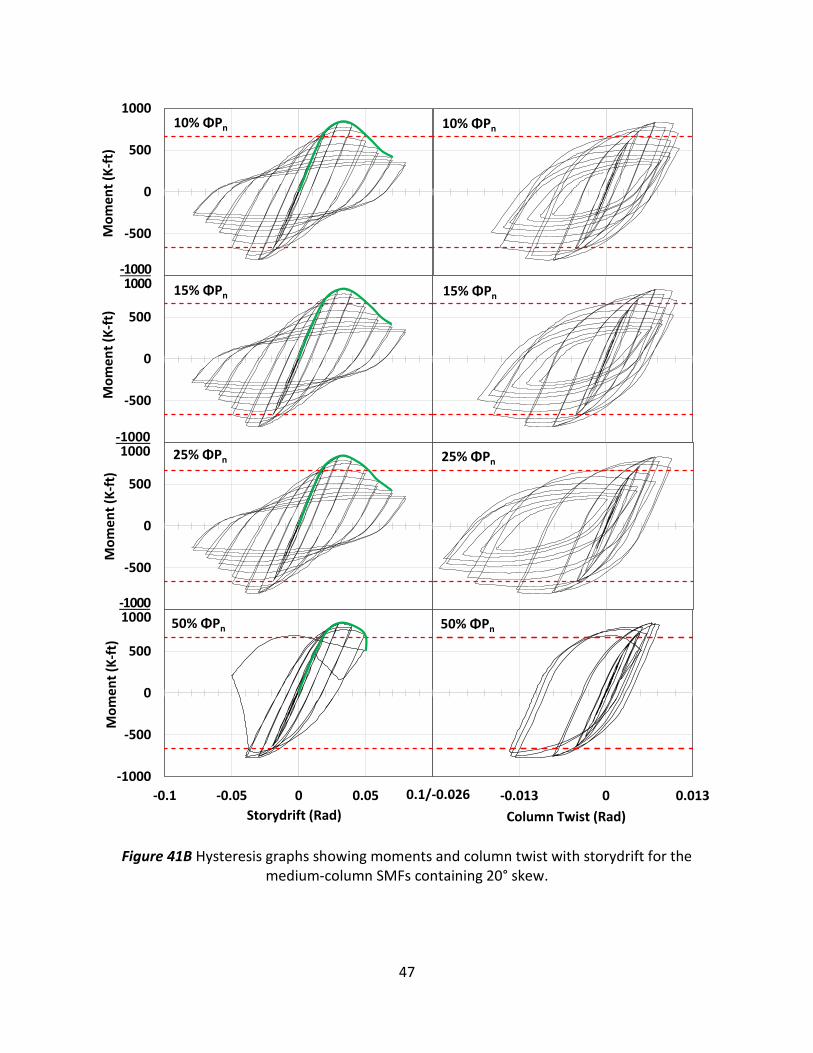
Figure 41B Hysteresis graphs showing moments and column twist with storydrift for the medium-column SMFs containing 20° skew. 47
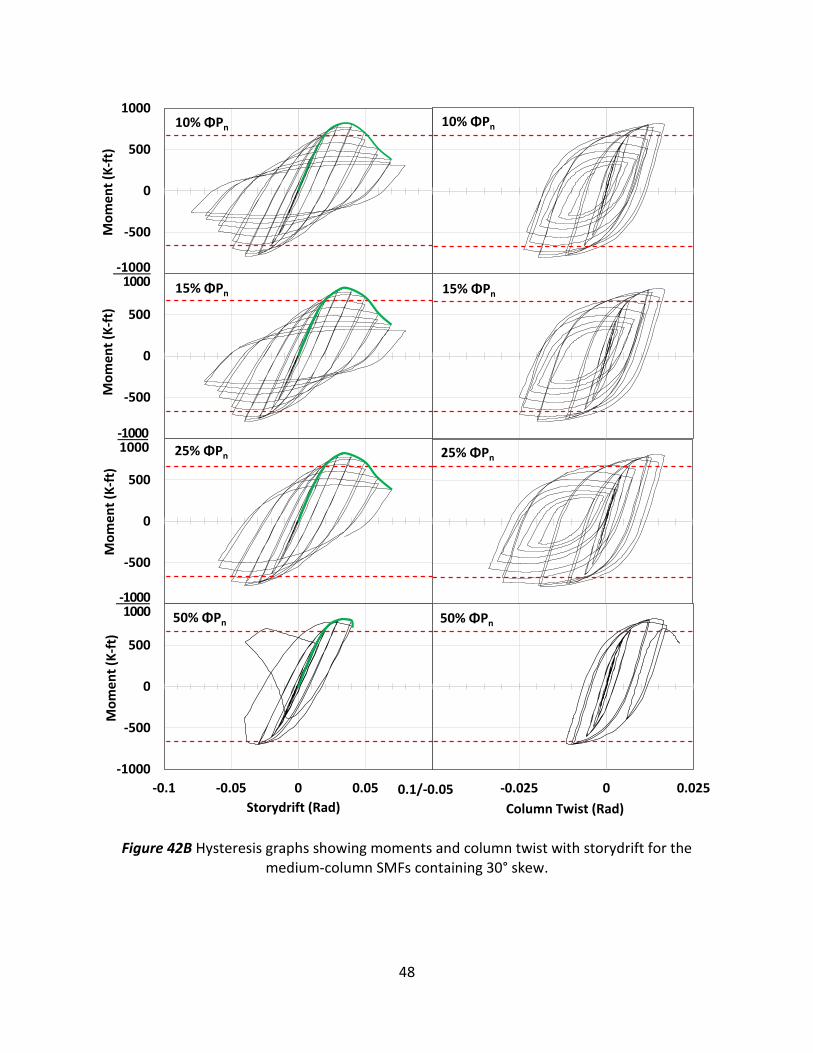
Figure 42B Hysteresis graphs showing moments and column twist with storydrift for the medium-column SMFs containing 30° skew. 48
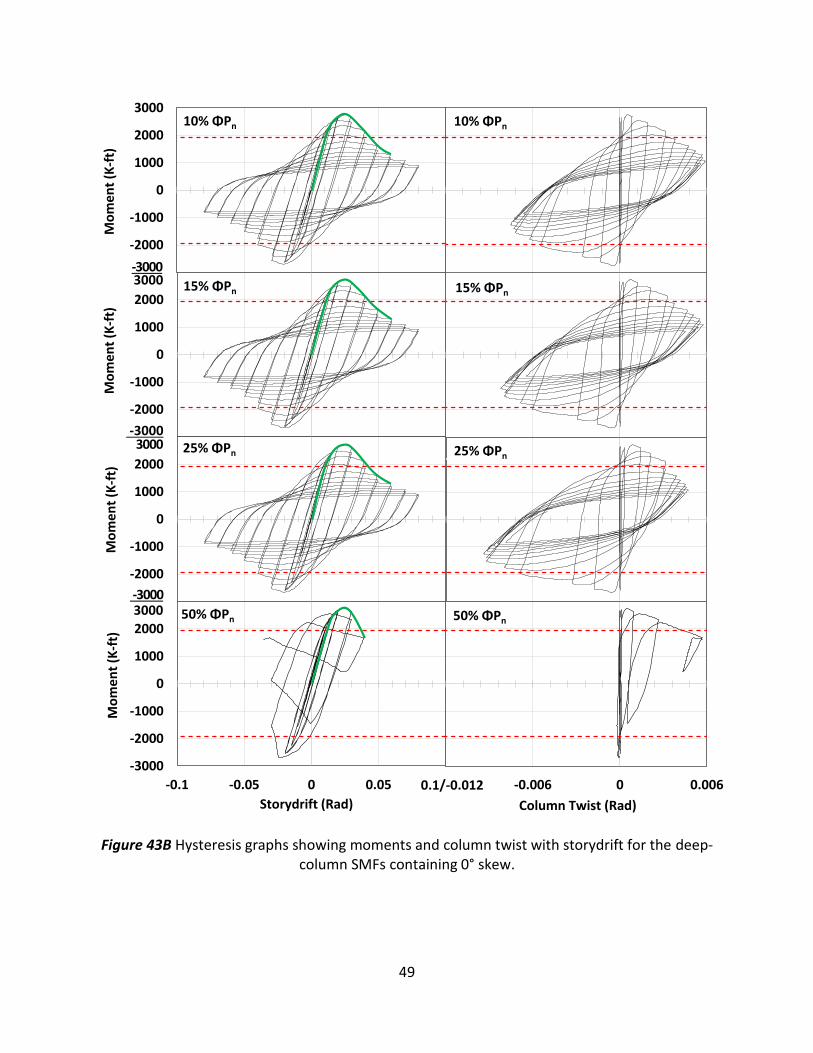
Figure 43B Hysteresis graphs showing moments and column twist with storydrift for the deep-column SMFs containing 0° skew. 49
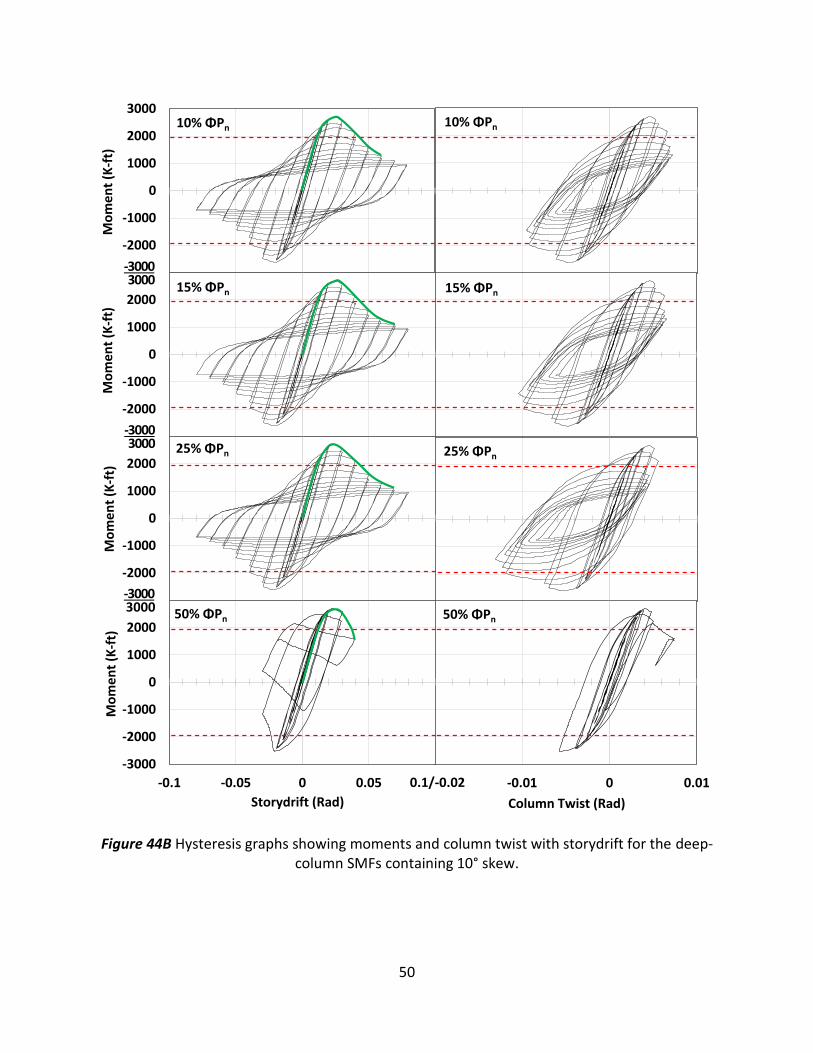
Figure 44B Hysteresis graphs showing moments and column twist with storydrift for the deep-column SMFs containing 10° skew. 50
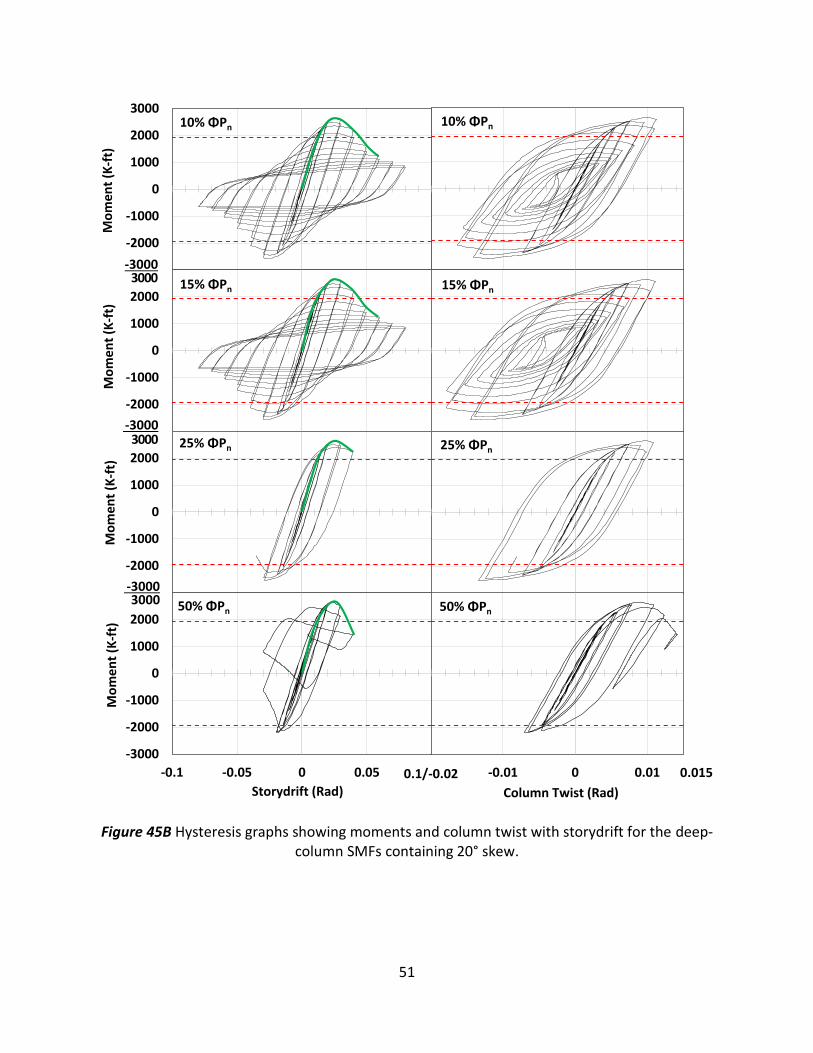
Figure 45B Hysteresis graphs showing moments and column twist with storydrift for the deep-column SMFs containing 20° skew. 51
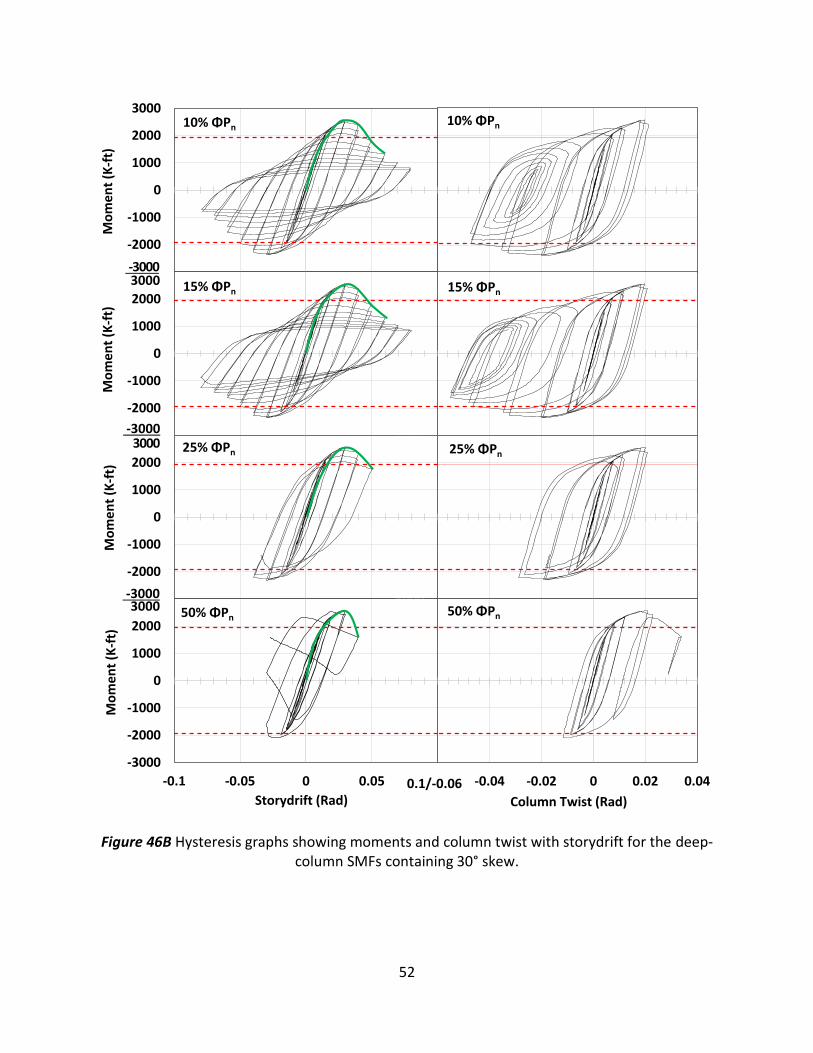
Figure 46B Hysteresis graphs showing moments and column twist with storydrift for the deep-column SMFs containing 30° skew. 52
Figure 47C Visualization of moment distribution along the beam and the influence of the plastic moment in the RBS moment (MPR) on the moment at the column face (Mf). 53
1
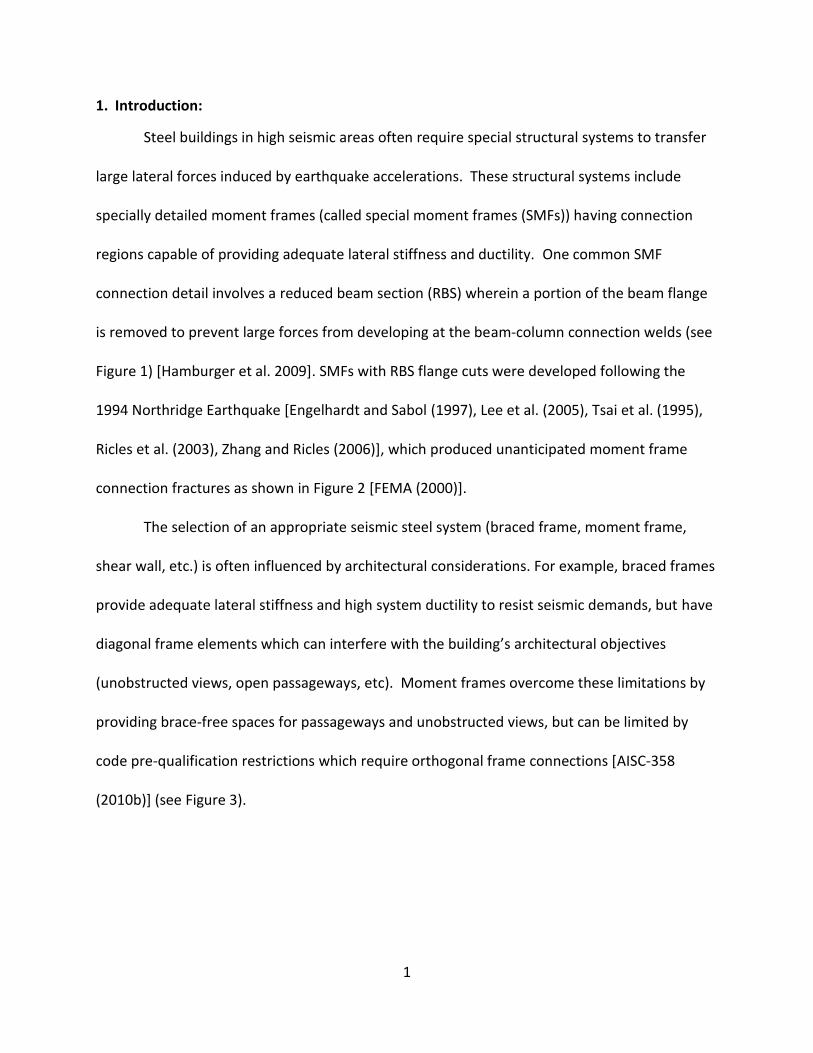
1. Introduction:
Steel buildings in high seismic areas often require special structural systems to transfer
large lateral forces induced by earthquake accelerations. These structural systems include
specially detailed moment frames (called special moment frames (SMFs)) having connection
regions capable of providing adequate lateral stiffness and ductility. One common SMF
connection detail involves a reduced beam section (RBS) wherein a portion of the beam flange
is removed to prevent large forces from developing at the beam-column connection welds (see
Figure 1) [Hamburger et al. 2009]. SMFs with RBS flange cuts were developed following the
1994 Northridge Earthquake [Engelhardt and Sabol (1997), Lee et al. (2005), Tsai et al. (1995),
Ricles et al. (2003), Zhang and Ricles (2006)], which produced unanticipated moment frame
connection fractures as shown in Figure 2 [FEMA (2000)].
The selection of an appropriate seismic steel system (braced frame, moment frame,
shear wall, etc.) is often influenced by architectural considerations. For example, braced frames
provide adequate lateral stiffness and high system ductility to resist seismic demands, but have
diagonal frame elements which can interfere with the building’s architectural objectives
(unobstructed views, open passageways, etc). Moment frames overcome these limitations by
providing brace-free spaces for passageways and unobstructed views, but can be limited by
code pre-qualification restrictions which require orthogonal frame connections [AISC-358
(2010b)] (see Figure 3).
2
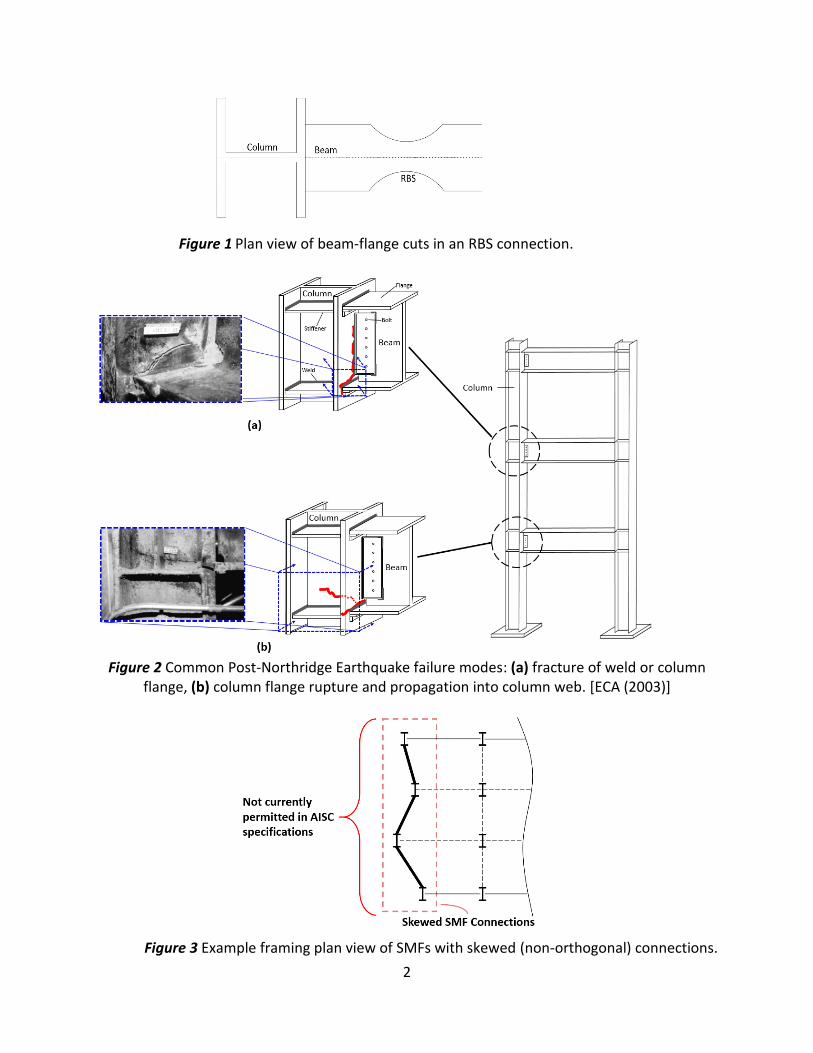
Figure 2 Common Post-Northridge Earthquake failure modes: (a) fracture of weld or column
flange, (b) column flange rupture and propagation into column web. [ECA (2003)]
Figure 3 Example framing plan view of SMFs with skewed (non-orthogonal) connections.
Figure 1 Plan view of beam-flange cuts in an RBS connection.
3
Experimental testing and analytical investigations are required for pre-qualifying SMF
connections. Existing prequalified RBS SMF connections in the Seismic Provisions for Structural
Steel Buildings [AISC-358 (2010b)] are all orthogonal beam-column configurations [Hamburger
et al. (2009)]. Information on seismic demands in skewed (non-orthogonal) RBS connections is
limited.
In an effort to improve architectural flexibility of common moment frame
configurations, Prinz and Richards (2016) investigated the performance of laterally skewed SMF
connections with detailed finite element models. Two types of models were considered by Prinz
and Richards (2016): one type simulating typical laboratory moment connection testing, and
the other type more realistically representing building conditions (specifically column boundary
conditions). Results demonstrated a complex relationship between out-of-plane skew, column
twisting, column yielding, and strain demands in the RBS. Out-of-plane skew increased column
twisting and resulted in irregular yielding in the column flange tips near the beam-to-column
connections. While columns analyzed by Prinz and Richards (2016) contained some axial loads
introduced through beam shear, effects of larger (more realistic) column axial loads on column
twisting and the resulting system-level response are unknown.
Deep columns commonly used in SMF configurations can exhibit greater column twist
than shallow columns due to the increased eccentricity from lateral movement of the RBS
compression flange [Zhang and Ricles (2006), Chi and Uang (2002)]. Full-scale tests on un-
skewed connection configurations [Zhang and Ricles (2006), Chi and Uang (2002)] were used to
develop a procedure for predicting column torsion resulting from the use of RBS connections;
however, it is not clear how large column axial loads combined with skewed RBS connections
4
will affect column torsional demands and the resulting beam bracing requirements.
The following research focuses on extending the work of Prinz and Richards (2016) by
investigating effects from column axial loads on column twisting and yielding in skewed SMF
RBS connections. The study involves advanced finite element modeling of SMF connections
using techniques similar to Prinz and Richards (2016) and other analytical studies on SMF
connections [Chi et al. (2006), Gilton and Uang (2002), Pachoumis et al. (2009), Zhang and
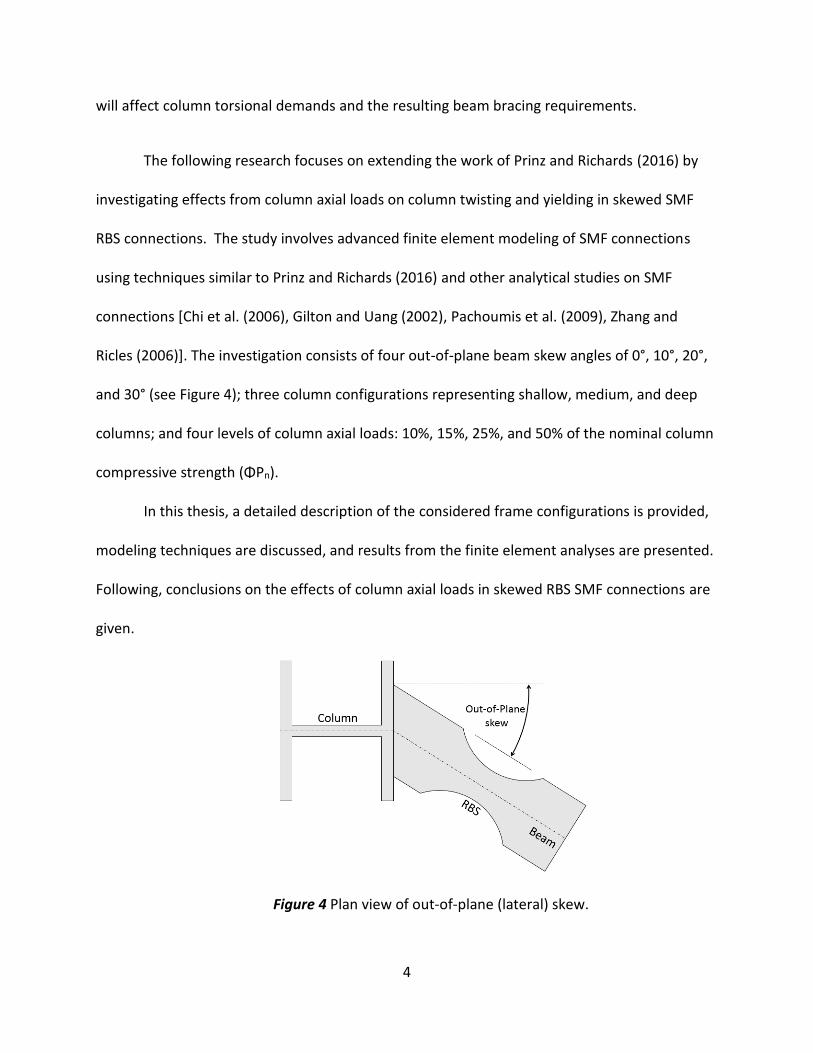
Ricles (2006)]. The investigation consists of four out-of-plane beam skew angles of 0°, 10°, 20°,
and 30° (see Figure 4); three column configurations representing shallow, medium, and deep
columns; and four levels of column axial loads: 10%, 15%, 25%, and 50% of the nominal column
compressive strength (ΦPn).
In this thesis, a detailed description of the considered frame configurations is provided,
modeling techniques are discussed, and results from the finite element analyses are presented.
Following, conclusions on the effects of column axial loads in skewed RBS SMF connections are
given.
Figure 4 Plan view of out-of-plane (lateral) skew.
5
Frame Configurations
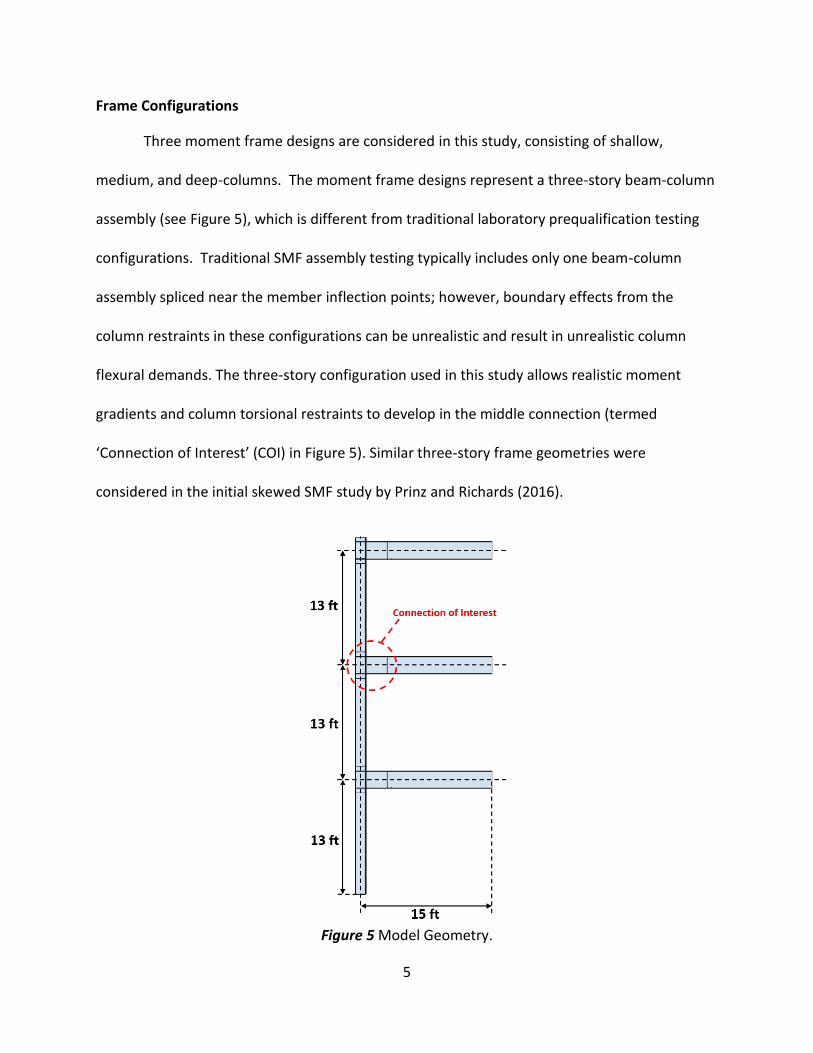
Three moment frame designs are considered in this study, consisting of shallow,
medium, and deep-columns. The moment frame designs represent a three-story beam-column
assembly (see Figure 5), which is different from traditional laboratory prequalification testing
configurations. Traditional SMF assembly testing typically includes only one beam-column
assembly spliced near the member inflection points; however, boundary effects from the
column restraints in these configurations can be unrealistic and result in unrealistic column
flexural demands. The three-story configuration used in this study allows realistic moment
gradients and column torsional restraints to develop in the middle connection (termed
‘Connection of Interest’ (COI) in Figure 5). Similar three-story frame geometries were
considered in the initial skewed SMF study by Prinz and Richards (2016).
Figure 5 Model Geometry.
6
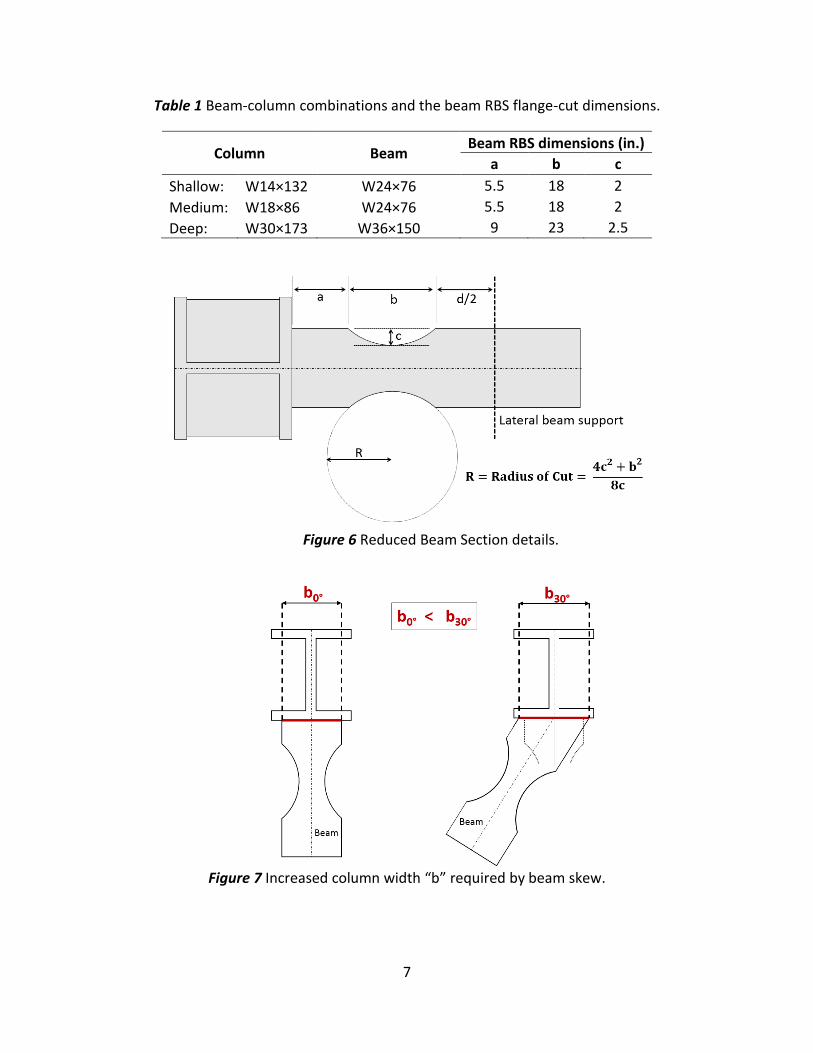
The considered beam-column configurations (presented in Table 1) are near the
allowable slenderness limits provided in the AISC provisions [AISC (2010b)], representing worst-
case skewed geometries for design. Also shown in Table 1 are the RBS flange cut dimensions
(‘a’, ‘b’, and ‘c’, see Figure 6). Sample RBS flange-cut design calculations are presented later in
Appendix C.
The deep column configurations in Table 1, while commonly used in un-skewed SMFs
due to story drift and “strong-column/weak-beam” requirements [Hamburger et al. (2009)]
create concerns about column twisting for skewed connections. Even in un-skewed
geometries, the combination of lateral beam displacements (resulting from RBS-buckling) and
out-of-plane column bending, often create higher warping stresses than more shallow columns.
High “h/tf3“ ratios are mainly responsible for large warping stresses in deep columns resulting
from centerline distances between flanges (h) and flange thicknesses (tf) [Chi and Uang (2002)].
Additionally, wider column sections, particularly the lighter-weight sections, are susceptible to
local and lateral-torsional buckling [Hamburger et al. (2009)]. The column sections chosen in
this study must also accommodate skewed beam geometry, which can result in wider required
column flanges (see Figure 7).
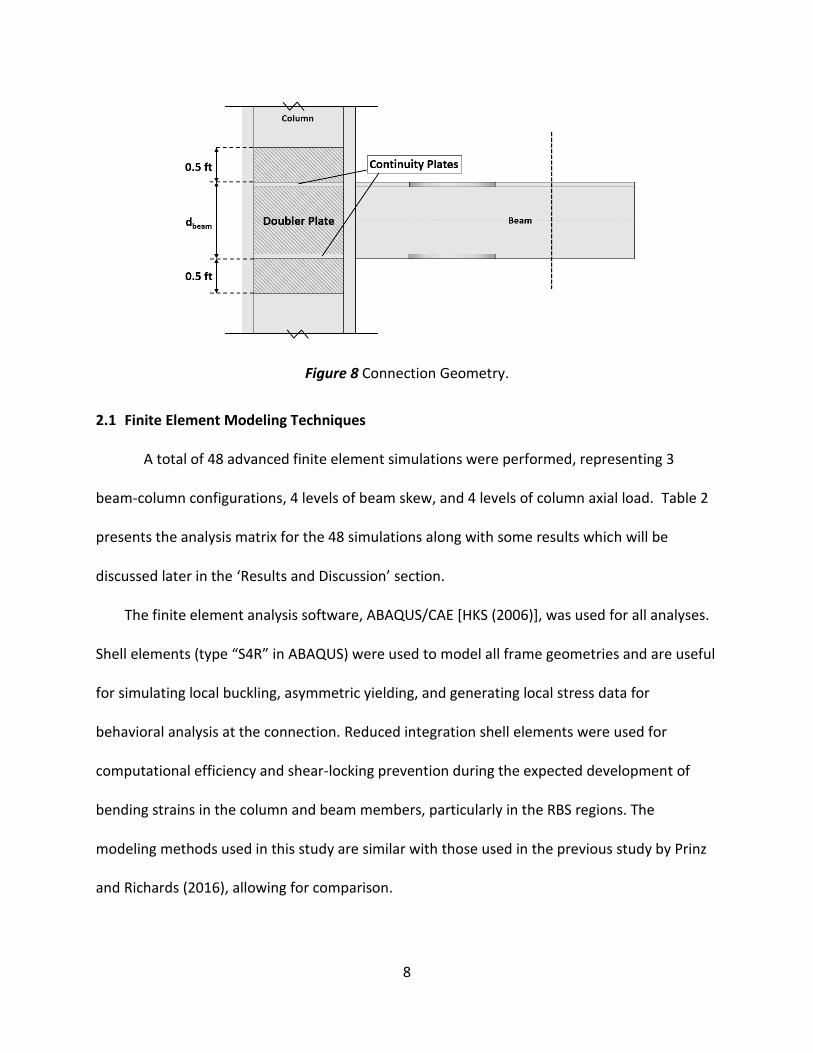
The chosen SMF RBS connections incorporate both continuity plates and doubler plates
for panel zone strength and ductility requirements (see Figure 8) [AISC (2010b)]. In addition, the
continuity and doubler plates brace the column web and flanges to prevent local buckling in the
connection.
7
Table 1 Beam-column combinations and the beam RBS flange-cut dimensions.
Column Beam Beam RBS dimensions (in.)
a b c
Shallow: W14×132 W24×76 5.5 18 2
Medium: W18×86 W24×76 5.5 18 2
Deep: W30×173 W36×150 9 23 2.5
Figure 6 Reduced Beam Section details.
Figure 7 Increased column width “b” required by beam skew.
8
Figure 8 Connection Geometry.
2.1 Finite Element Modeling Techniques
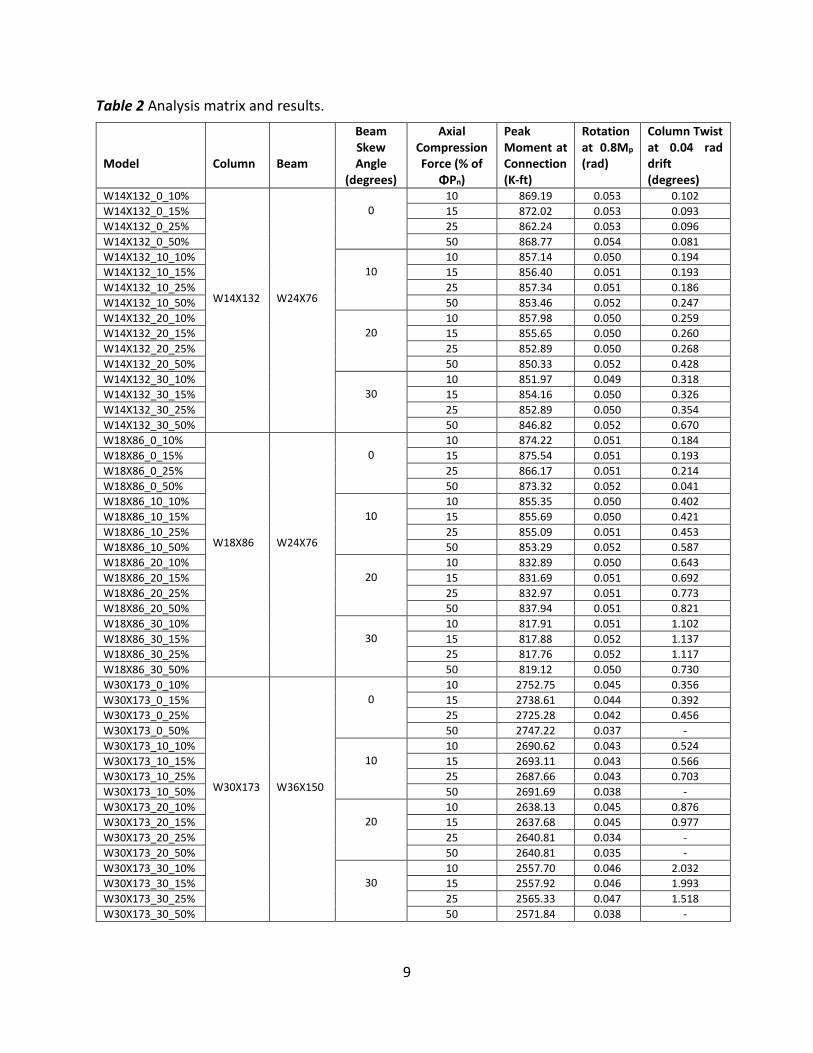
A total of 48 advanced finite element simulations were performed, representing 3
beam-column configurations, 4 levels of beam skew, and 4 levels of column axial load. Table 2
presents the analysis matrix for the 48 simulations along with some results which will be
discussed later in the ‘Results and Discussion’ section.
The finite element analysis software, ABAQUS/CAE [HKS (2006)], was used for all analyses.
Shell elements (type “S4R” in ABAQUS) were used to model all frame geometries and are useful
for simulating local buckling, asymmetric yielding, and generating local stress data for
behavioral analysis at the connection. Reduced integration shell elements were used for
computational efficiency and shear-locking prevention during the expected development of
bending strains in the column and beam members, particularly in the RBS regions. The
modeling methods used in this study are similar with those used in the previous study by Prinz
and Richards (2016), allowing for comparison.
9
Table 2 Analysis matrix and results.
Model
Column
Beam
Beam Skew Angle
(degrees)
Axial Compression Force (% of
ΦPn)
Peak Moment at Connection (K-ft)
Rotation at 0.8Mp (rad)
Column Twist at 0.04 rad drift (degrees)
W14X132_0_10% W14X132
W24X76
0
10 869.19 0.053 0.102
W14X132_0_15% 15 872.02 0.053 0.093
W14X132_0_25% 25 862.24 0.053 0.096
W14X132_0_50% 50 868.77 0.054 0.081
W14X132_10_10% 10
10 857.14 0.050 0.194
W14X132_10_15% 15 856.40 0.051 0.193
W14X132_10_25% 25 857.34 0.051 0.186
W14X132_10_50% 50 853.46 0.052 0.247
W14X132_20_10% 20
10 857.98 0.050 0.259
W14X132_20_15% 15 855.65 0.050 0.260
W14X132_20_25% 25 852.89 0.050 0.268
W14X132_20_50% 50 850.33 0.052 0.428
W14X132_30_10% 30
10 851.97 0.049 0.318
W14X132_30_15% 15 854.16 0.050 0.326
W14X132_30_25% 25 852.89 0.050 0.354
W14X132_30_50% 50 846.82 0.052 0.670
W18X86_0_10% W18X86
W24X76
0
10 874.22 0.051 0.184
W18X86_0_15% 15 875.54 0.051 0.193
W18X86_0_25% 25 866.17 0.051 0.214
W18X86_0_50% 50 873.32 0.052 0.041
W18X86_10_10% 10
10 855.35 0.050 0.402
W18X86_10_15% 15 855.69 0.050 0.421
W18X86_10_25% 25 855.09 0.051 0.453
W18X86_10_50% 50 853.29 0.052 0.587
W18X86_20_10% 20
10 832.89 0.050 0.643
W18X86_20_15% 15 831.69 0.051 0.692
W18X86_20_25% 25 832.97 0.051 0.773
W18X86_20_50% 50 837.94 0.051 0.821
W18X86_30_10% 30
10 817.91 0.051 1.102
W18X86_30_15% 15 817.88 0.052 1.137
W18X86_30_25% 25 817.76 0.052 1.117
W18X86_30_50% 50 819.12 0.050 0.730
W30X173_0_10% W30X173
W36X150
0
10 2752.75 0.045 0.356
W30X173_0_15% 15 2738.61 0.044 0.392
W30X173_0_25% 25 2725.28 0.042 0.456
W30X173_0_50% 50 2747.22 0.037 -
W30X173_10_10% 10
10 2690.62 0.043 0.524
W30X173_10_15% 15 2693.11 0.043 0.566
W30X173_10_25% 25 2687.66 0.043 0.703
W30X173_10_50% 50 2691.69 0.038 -
W30X173_20_10% 20
10 2638.13 0.045 0.876
W30X173_20_15% 15 2637.68 0.045 0.977
W30X173_20_25% 25 2640.81 0.034 -
W30X173_20_50% 50 2640.81 0.035 -
W30X173_30_10% 30
10 2557.70 0.046 2.032
W30X173_30_15% 15 2557.92 0.046 1.993
W30X173_30_25% 25 2565.33 0.047 1.518
W30X173_30_50% 50 2571.84 0.038 -
10
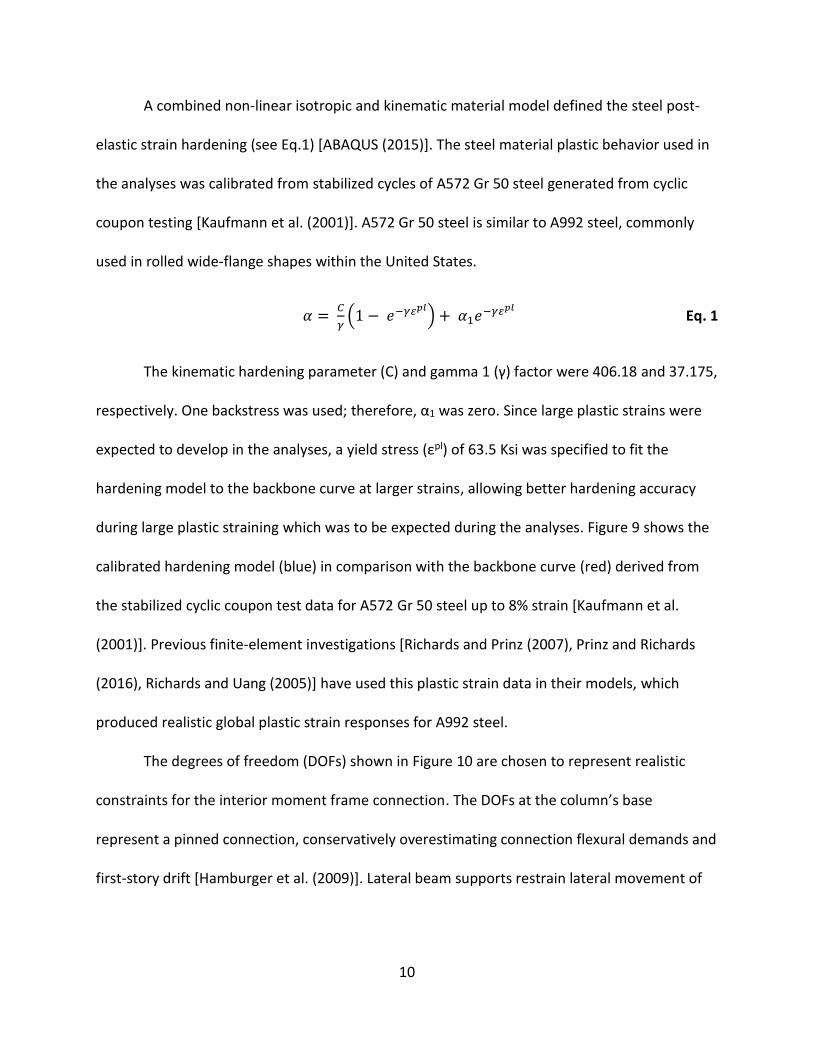
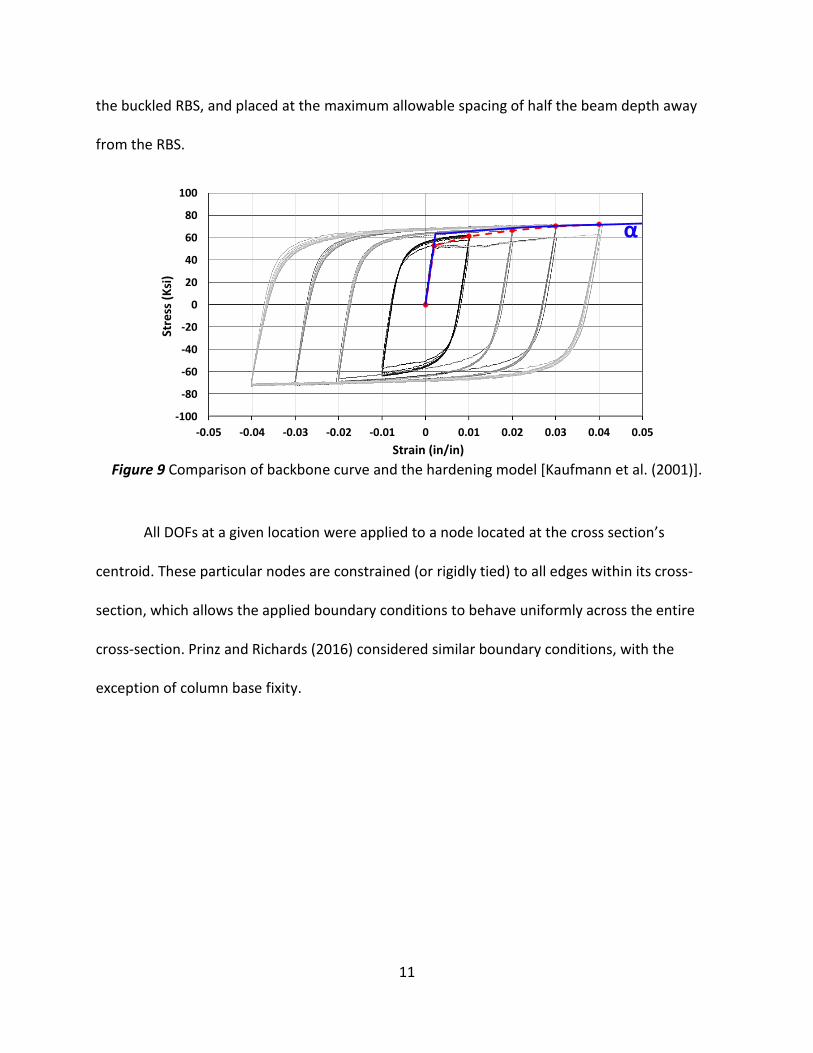
A combined non-linear isotropic and kinematic material model defined the steel post-
elastic strain hardening (see Eq.1) [ABAQUS (2015)]. The steel material plastic behavior used in
the analyses was calibrated from stabilized cycles of A572 Gr 50 steel generated from cyclic
coupon testing [Kaufmann et al. (2001)]. A572 Gr 50 steel is similar to A992 steel, commonly
used in rolled wide-flange shapes within the United States.
𝛼 = 𝐶
𝛾(1 − 𝑒−𝛾𝜀𝑝𝑙
) + 𝛼1𝑒−𝛾𝜀𝑝𝑙 Eq. 1
The kinematic hardening parameter (C) and gamma 1 (γ) factor were 406.18 and 37.175,
respectively. One backstress was used; therefore, α1 was zero. Since large plastic strains were
expected to develop in the analyses, a yield stress (εpl) of 63.5 Ksi was specified to fit the
hardening model to the backbone curve at larger strains, allowing better hardening accuracy
during large plastic straining which was to be expected during the analyses. Figure 9 shows the
calibrated hardening model (blue) in comparison with the backbone curve (red) derived from
the stabilized cyclic coupon test data for A572 Gr 50 steel up to 8% strain [Kaufmann et al.
(2001)]. Previous finite-element investigations [Richards and Prinz (2007), Prinz and Richards
(2016), Richards and Uang (2005)] have used this plastic strain data in their models, which
produced realistic global plastic strain responses for A992 steel.
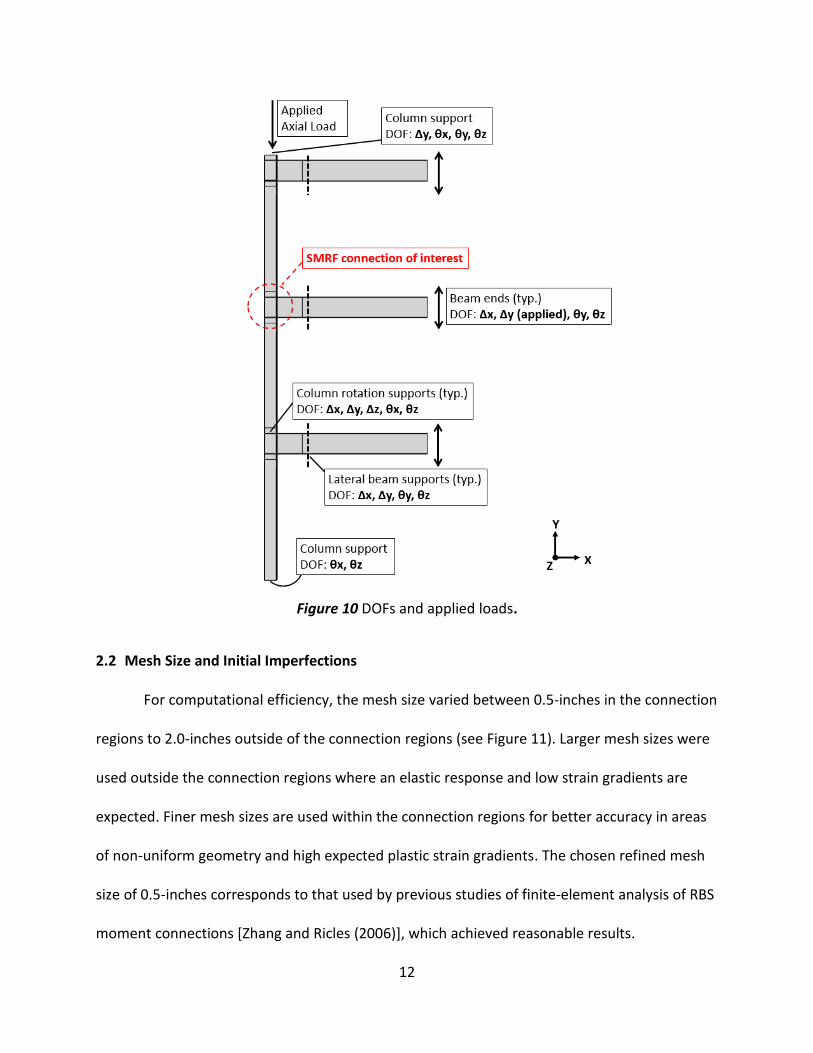
The degrees of freedom (DOFs) shown in Figure 10 are chosen to represent realistic
constraints for the interior moment frame connection. The DOFs at the column’s base
represent a pinned connection, conservatively overestimating connection flexural demands and
first-story drift [Hamburger et al. (2009)]. Lateral beam supports restrain lateral movement of
11
the buckled RBS, and placed at the maximum allowable spacing of half the beam depth away
from the RBS.
Figure 9 Comparison of backbone curve and the hardening model [Kaufmann et al. (2001)].
All DOFs at a given location were applied to a node located at the cross section’s
centroid. These particular nodes are constrained (or rigidly tied) to all edges within its cross-
section, which allows the applied boundary conditions to behave uniformly across the entire
cross-section. Prinz and Richards (2016) considered similar boundary conditions, with the
exception of column base fixity.
-100
-80
-60
-40
-20
0
20
40
60
80
100
-0.05 -0.04 -0.03 -0.02 -0.01 0 0.01 0.02 0.03 0.04 0.05
α
Stre
ss (
Ksi
)
Strain (in/in)
12
Figure 10 DOFs and applied loads.
2.2 Mesh Size and Initial Imperfections
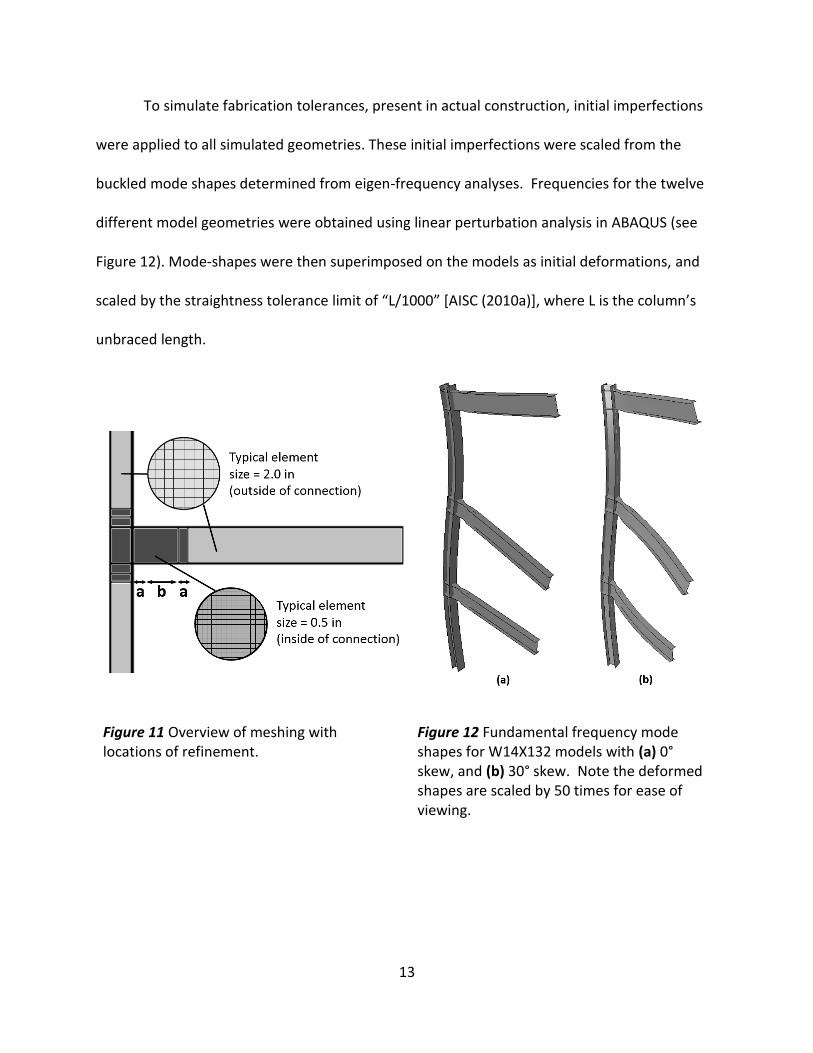
For computational efficiency, the mesh size varied between 0.5-inches in the connection
regions to 2.0-inches outside of the connection regions (see Figure 11). Larger mesh sizes were
used outside the connection regions where an elastic response and low strain gradients are
expected. Finer mesh sizes are used within the connection regions for better accuracy in areas
of non-uniform geometry and high expected plastic strain gradients. The chosen refined mesh
size of 0.5-inches corresponds to that used by previous studies of finite-element analysis of RBS
moment connections [Zhang and Ricles (2006)], which achieved reasonable results.
13
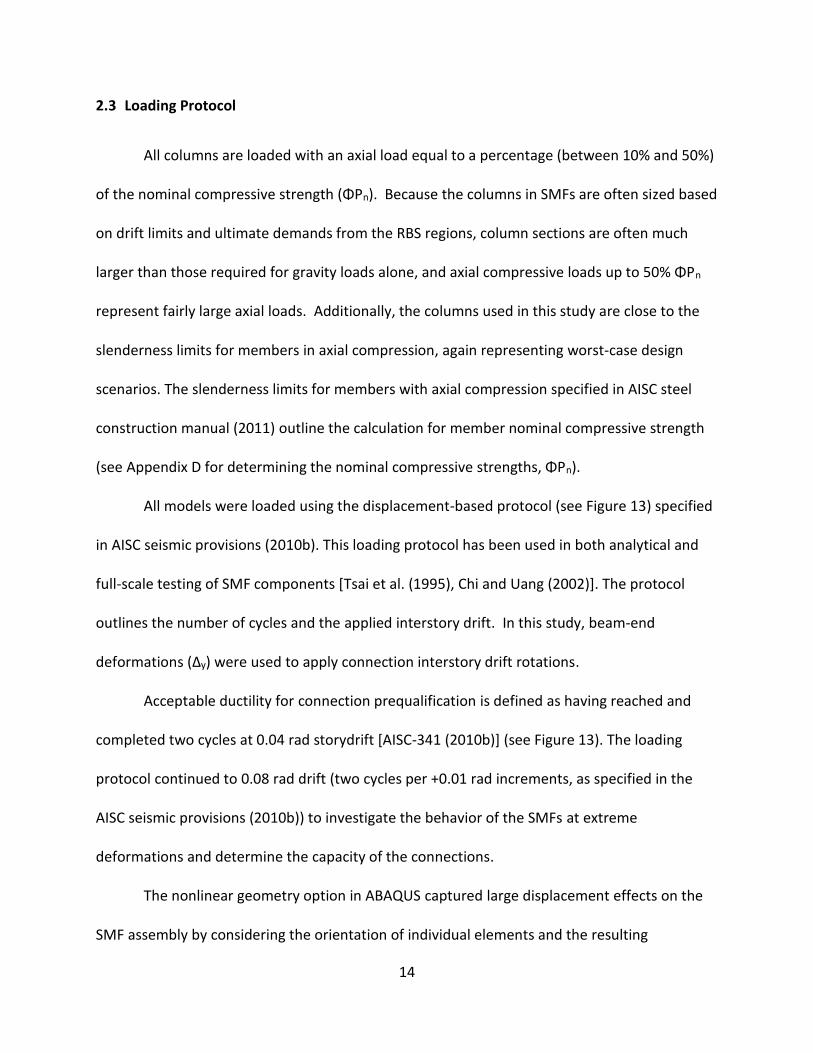
To simulate fabrication tolerances, present in actual construction, initial imperfections
were applied to all simulated geometries. These initial imperfections were scaled from the
buckled mode shapes determined from eigen-frequency analyses. Frequencies for the twelve
different model geometries were obtained using linear perturbation analysis in ABAQUS (see
Figure 12). Mode-shapes were then superimposed on the models as initial deformations, and
scaled by the straightness tolerance limit of “L/1000” [AISC (2010a)], where L is the column’s
unbraced length.
Figure 11 Overview of meshing with locations of refinement.
Figure 12 Fundamental frequency mode shapes for W14X132 models with (a) 0° skew, and (b) 30° skew. Note the deformed shapes are scaled by 50 times for ease of viewing.
14
2.3 Loading Protocol
All columns are loaded with an axial load equal to a percentage (between 10% and 50%)
of the nominal compressive strength (ΦPn). Because the columns in SMFs are often sized based
on drift limits and ultimate demands from the RBS regions, column sections are often much
larger than those required for gravity loads alone, and axial compressive loads up to 50% ΦPn
represent fairly large axial loads. Additionally, the columns used in this study are close to the
slenderness limits for members in axial compression, again representing worst-case design
scenarios. The slenderness limits for members with axial compression specified in AISC steel
construction manual (2011) outline the calculation for member nominal compressive strength
(see Appendix D for determining the nominal compressive strengths, ΦPn).
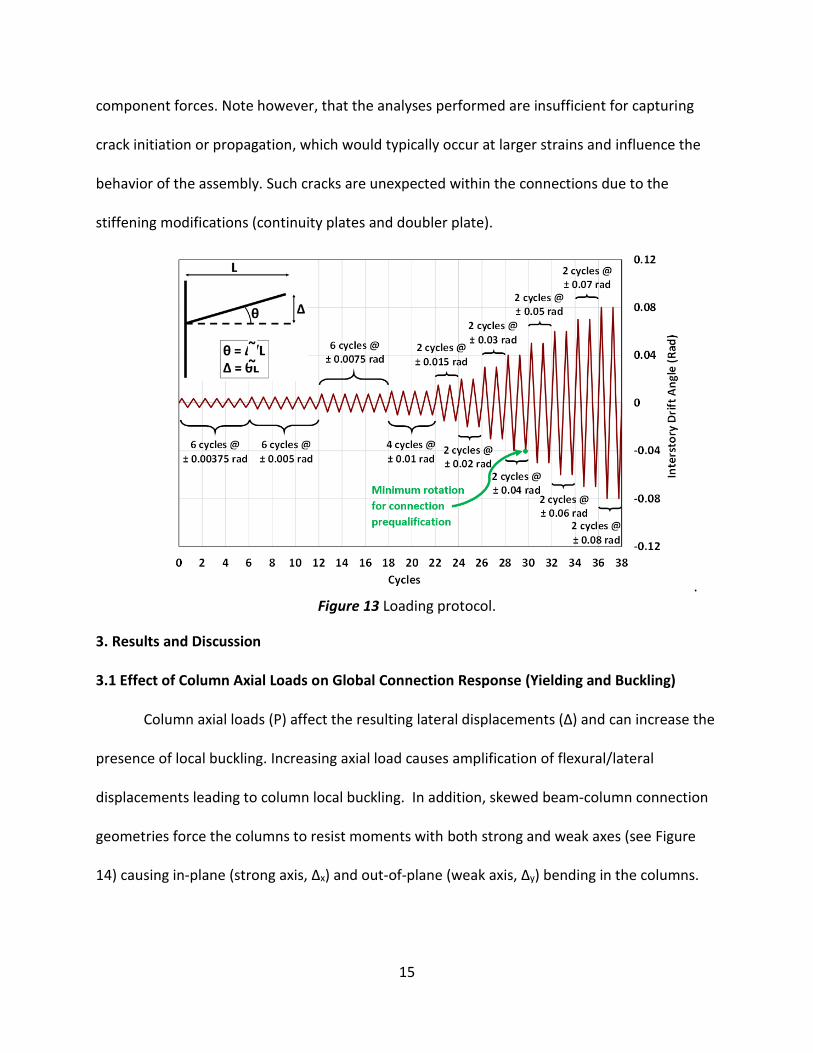
All models were loaded using the displacement-based protocol (see Figure 13) specified
in AISC seismic provisions (2010b). This loading protocol has been used in both analytical and
full-scale testing of SMF components [Tsai et al. (1995), Chi and Uang (2002)]. The protocol
outlines the number of cycles and the applied interstory drift. In this study, beam-end
deformations (Δy) were used to apply connection interstory drift rotations.
Acceptable ductility for connection prequalification is defined as having reached and
completed two cycles at 0.04 rad storydrift [AISC-341 (2010b)] (see Figure 13). The loading
protocol continued to 0.08 rad drift (two cycles per +0.01 rad increments, as specified in the
AISC seismic provisions (2010b)) to investigate the behavior of the SMFs at extreme
deformations and determine the capacity of the connections.
The nonlinear geometry option in ABAQUS captured large displacement effects on the
SMF assembly by considering the orientation of individual elements and the resulting
15
component forces. Note however, that the analyses performed are insufficient for capturing
crack initiation or propagation, which would typically occur at larger strains and influence the
behavior of the assembly. Such cracks are unexpected within the connections due to the
stiffening modifications (continuity plates and doubler plate).
. Figure 13 Loading protocol.
3. Results and Discussion
3.1 Effect of Column Axial Loads on Global Connection Response (Yielding and Buckling)
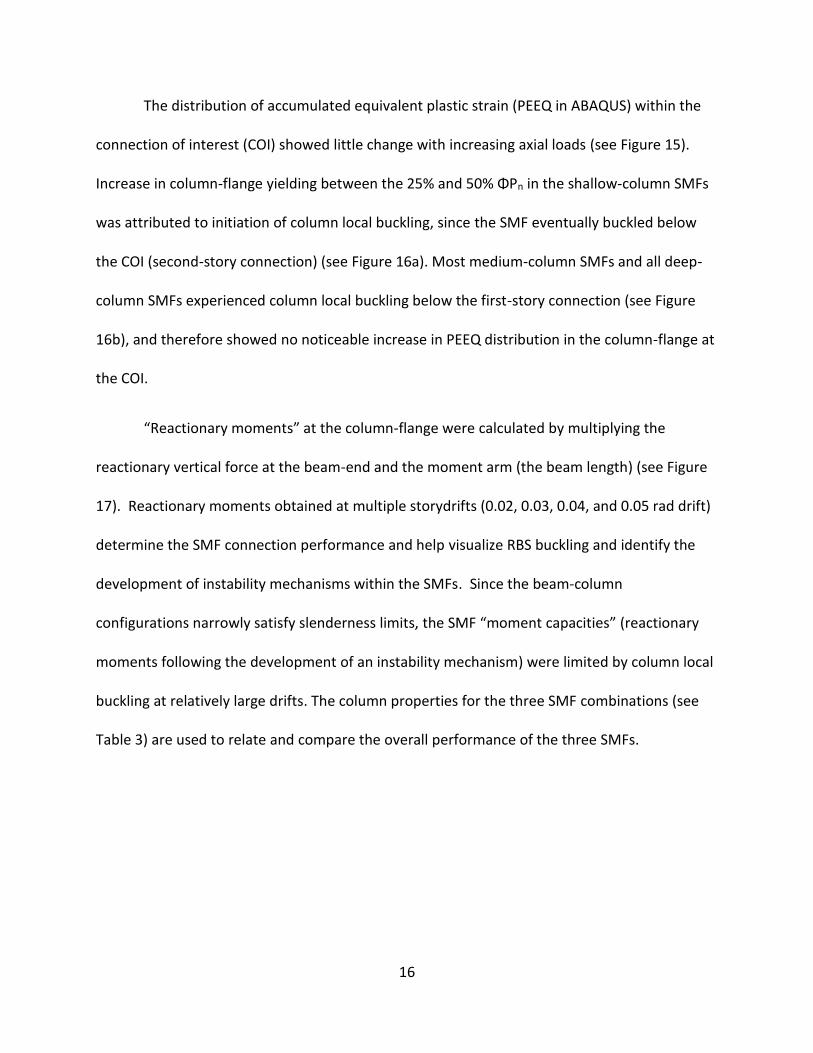
Column axial loads (P) affect the resulting lateral displacements (Δ) and can increase the
presence of local buckling. Increasing axial load causes amplification of flexural/lateral
displacements leading to column local buckling. In addition, skewed beam-column connection
geometries force the columns to resist moments with both strong and weak axes (see Figure
14) causing in-plane (strong axis, Δx) and out-of-plane (weak axis, Δy) bending in the columns.
~ ~
16
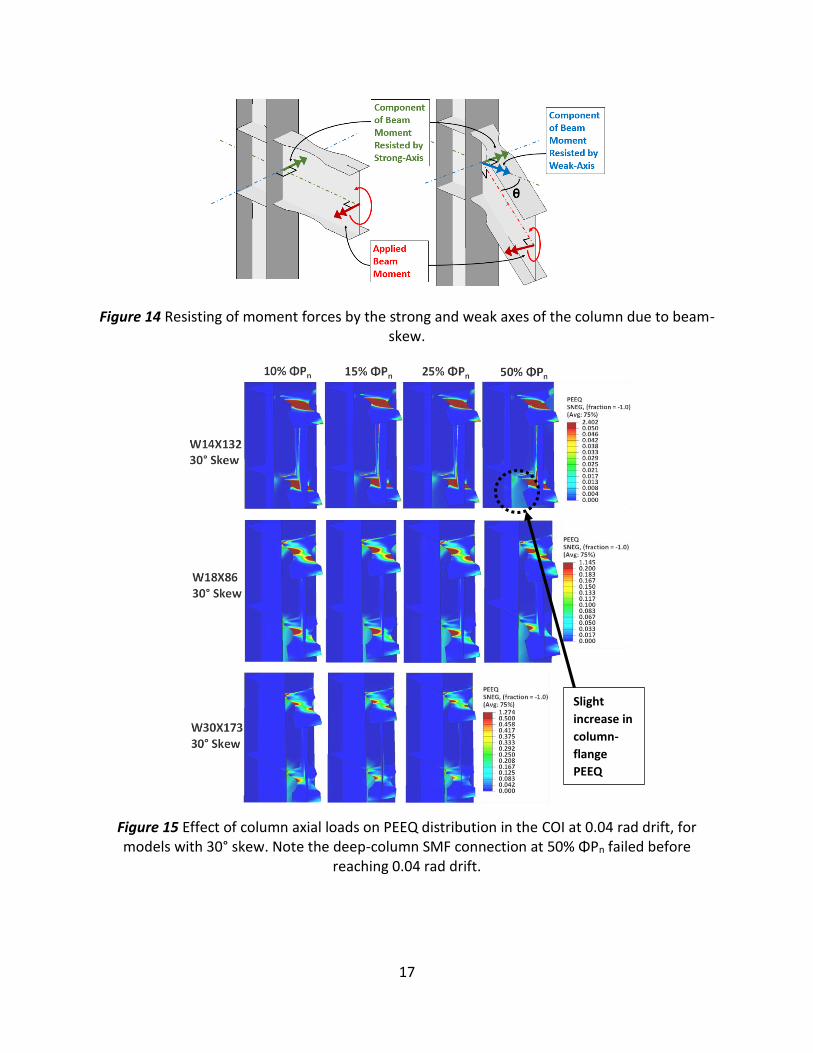
The distribution of accumulated equivalent plastic strain (PEEQ in ABAQUS) within the
connection of interest (COI) showed little change with increasing axial loads (see Figure 15).
Increase in column-flange yielding between the 25% and 50% ΦPn in the shallow-column SMFs
was attributed to initiation of column local buckling, since the SMF eventually buckled below
the COI (second-story connection) (see Figure 16a). Most medium-column SMFs and all deep-
column SMFs experienced column local buckling below the first-story connection (see Figure
16b), and therefore showed no noticeable increase in PEEQ distribution in the column-flange at
the COI.
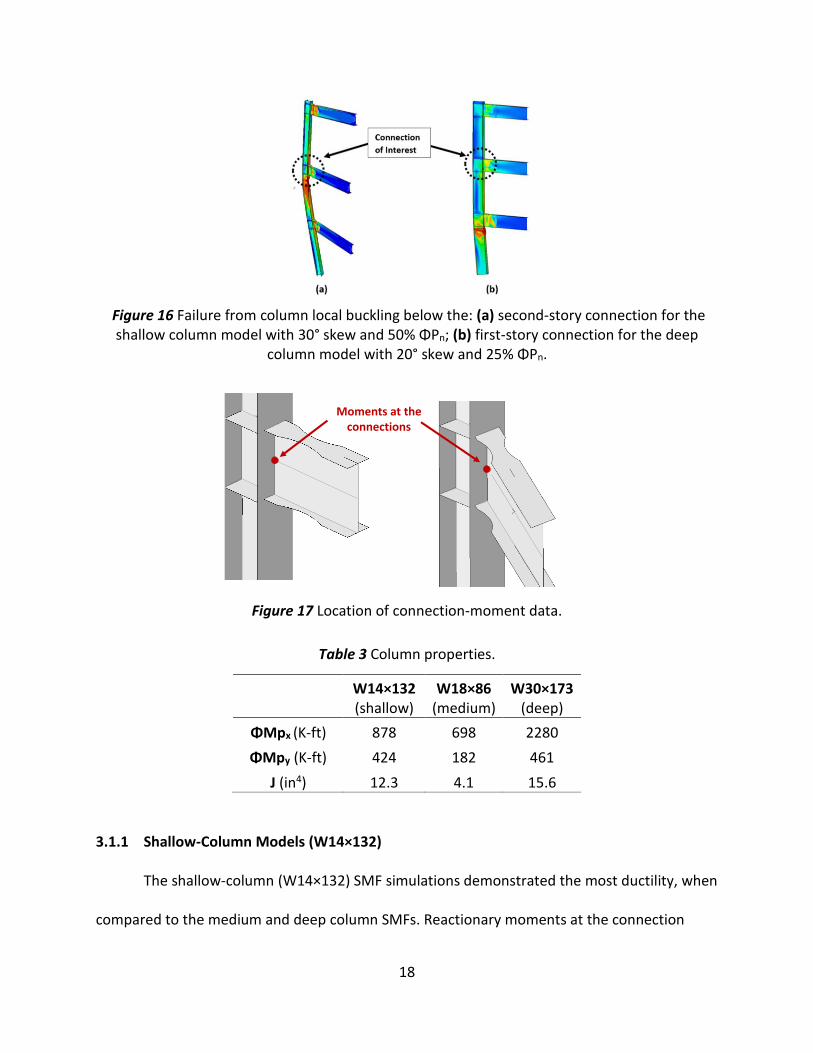
“Reactionary moments” at the column-flange were calculated by multiplying the
reactionary vertical force at the beam-end and the moment arm (the beam length) (see Figure
17). Reactionary moments obtained at multiple storydrifts (0.02, 0.03, 0.04, and 0.05 rad drift)
determine the SMF connection performance and help visualize RBS buckling and identify the
development of instability mechanisms within the SMFs. Since the beam-column
configurations narrowly satisfy slenderness limits, the SMF “moment capacities” (reactionary
moments following the development of an instability mechanism) were limited by column local
buckling at relatively large drifts. The column properties for the three SMF combinations (see
Table 3) are used to relate and compare the overall performance of the three SMFs.
17
Figure 14 Resisting of moment forces by the strong and weak axes of the column due to beam-skew.
Figure 15 Effect of column axial loads on PEEQ distribution in the COI at 0.04 rad drift, for models with 30° skew. Note the deep-column SMF connection at 50% ΦPn failed before
reaching 0.04 rad drift.
Slight
increase in
column-
flange
PEEQ
18
Figure 16 Failure from column local buckling below the: (a) second-story connection for the shallow column model with 30° skew and 50% ΦPn; (b) first-story connection for the deep
column model with 20° skew and 25% ΦPn.
Figure 17 Location of connection-moment data.
Table 3 Column properties.
W14×132 (shallow)
W18×86 (medium)
W30×173 (deep)
ΦMpx (K-ft) 878 698 2280
ΦMpy (K-ft) 424 182 461
J (in4) 12.3 4.1 15.6
3.1.1 Shallow-Column Models (W14×132)
The shallow-column (W14×132) SMF simulations demonstrated the most ductility, when
compared to the medium and deep column SMFs. Reactionary moments at the connection
Moments at the connections
19
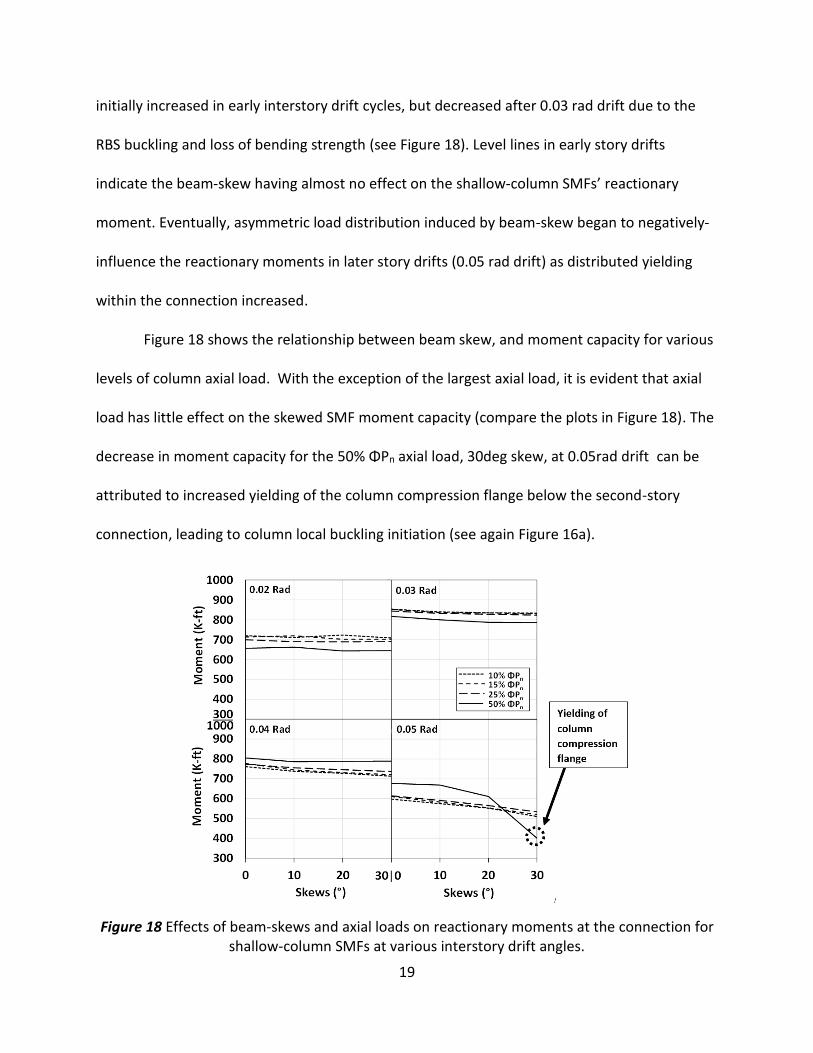
initially increased in early interstory drift cycles, but decreased after 0.03 rad drift due to the
RBS buckling and loss of bending strength (see Figure 18). Level lines in early story drifts
indicate the beam-skew having almost no effect on the shallow-column SMFs’ reactionary
moment. Eventually, asymmetric load distribution induced by beam-skew began to negatively-
influence the reactionary moments in later story drifts (0.05 rad drift) as distributed yielding
within the connection increased.
Figure 18 shows the relationship between beam skew, and moment capacity for various
levels of column axial load. With the exception of the largest axial load, it is evident that axial
load has little effect on the skewed SMF moment capacity (compare the plots in Figure 18). The
decrease in moment capacity for the 50% ΦPn axial load, 30deg skew, at 0.05rad drift can be
attributed to increased yielding of the column compression flange below the second-story
connection, leading to column local buckling initiation (see again Figure 16a).
Figure 18 Effects of beam-skews and axial loads on reactionary moments at the connection for shallow-column SMFs at various interstory drift angles.
20
3.1.2 Medium-Column Models (W18×86)
Moment capacities in the medium-column (W18×86) SMF connections were similar to
those in shallow-column SMFs; however, the downward trend in moment capacity with
increased skew angle at early story drifts indicates a negative-influence of beam-skew on
resulting moment capacity. These downward trends gradually level-out in larger story drifts
(story drifts greater than 0.03rad). Note that the similarities in performance between the
medium and shallow column could be attributed to the configuration, wherein the same
beam section was used.
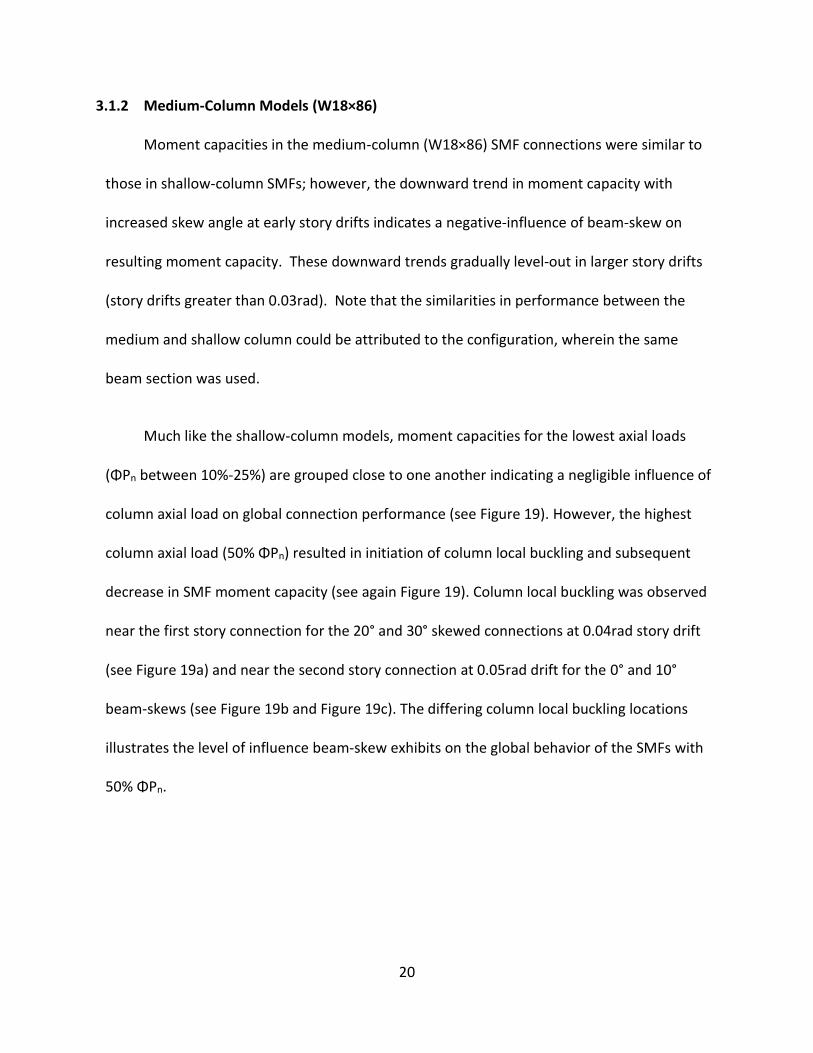
Much like the shallow-column models, moment capacities for the lowest axial loads
(ΦPn between 10%-25%) are grouped close to one another indicating a negligible influence of
column axial load on global connection performance (see Figure 19). However, the highest
column axial load (50% ΦPn) resulted in initiation of column local buckling and subsequent
decrease in SMF moment capacity (see again Figure 19). Column local buckling was observed
near the first story connection for the 20° and 30° skewed connections at 0.04rad story drift
(see Figure 19a) and near the second story connection at 0.05rad drift for the 0° and 10°
beam-skews (see Figure 19b and Figure 19c). The differing column local buckling locations
illustrates the level of influence beam-skew exhibits on the global behavior of the SMFs with
50% ΦPn.
21
Figure 19 Effect of beam-skews and axial loads on connection moment capacity for medium-
column SMFs at various interstory drift angles. Also included are the visualizations of the
instability mechanisms.
3.1.3 Deep-Column Models (W30×173)
The deep-column (W30×173) SMFs, which have the greatest overall flexural capacities,
performed the worst during cyclic loading due to column local buckling issues (see Figure 20).
Many of the deep-column SMF simulations experienced column local buckling at low
connection rotations (near 0.03rad). Due to these early local buckling issues at higher axial
loads, connection moment capacities from only the two lowest axial loads (10% and 15% ΦPn)
are valid for determining the effects of beam-skew and axial load on connection response. As
22
shown in Figure 20, increased beam skew results in a slight reduction in moment capacity;
however, the addition of moderate axial loads (between 10% and 15% ΦPn) appears to have
negligible effect on connection performance (note in Figure 20 that the resulting moment
capacity from the 10%-15% ΦPn axial loads are tightly grouped at all skew levels). Under higher
axial loads (25% and 50% ΦPn), the SMF connections were negatively affected by increased
beam skew (see Figure 20). Under 50% ΦPn column axial load local buckling initiated at 0.03rad
for all levels of beam skew. Under the 25% ΦPn column axial load, local buckling initiated at
0.03rad for connection skews of 20 and greater.
These observations raise concerns for the justifications behind modern approach of
using deeper column sections in SMFs. These tests relied on the ductility of all components
(beam, column, and the connection) to achieve the adequate level of ductility of 0.04 rad drift
[AISC 341 (2010b)]. The deepest/stiffest column and beam sections significantly reduced the
frame’s overall ductility. Given the sudden failures of the deep-column SMFs with moderate to
high axial loads (25% to 50% ΦPn) (see Table 4); imprecise axial load estimations could lead to a
substantial reduction in ductility through premature column local buckling. For the deep-
column SMFs, simply increasing the axial load from 25% to 50% ΦPn affects whether the frame
achieves the 0.04 rad drift or not, regardless of beam-skew. The early column local buckling
observed coincides with the failure mechanisms observed in the full-scale experiments on deep
columns subjected to both axial loads and strong-axis bending [Uang et al. (2017)].
23
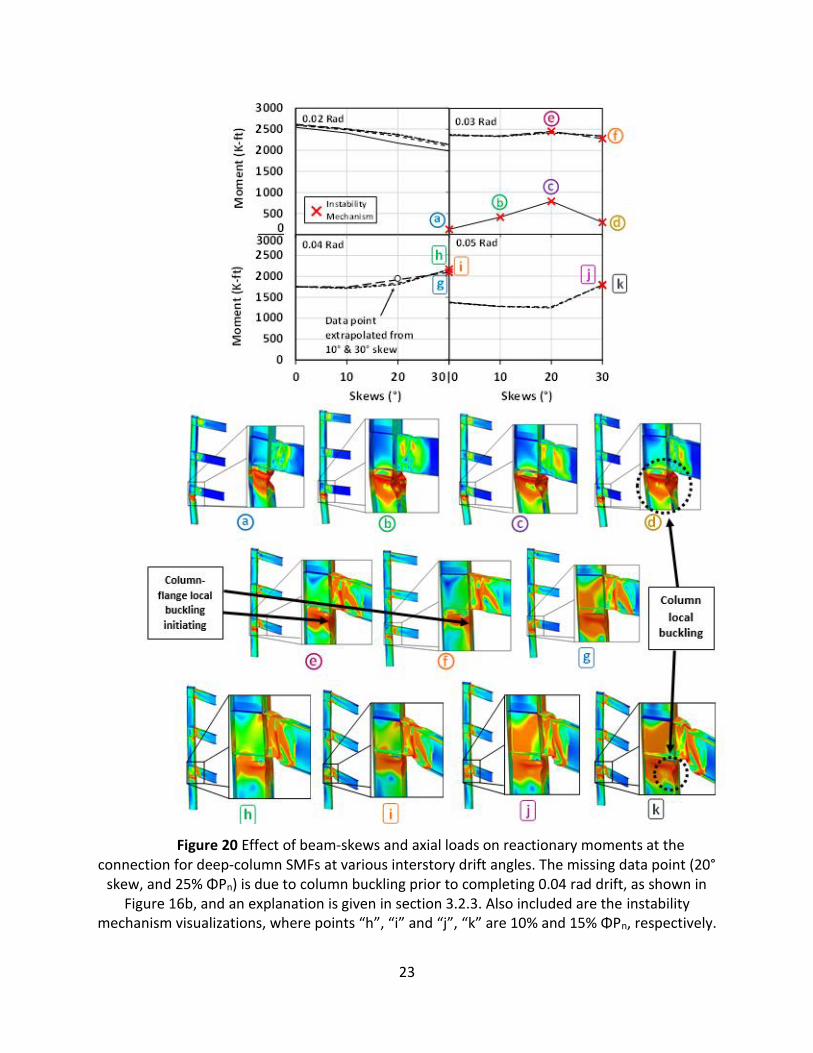
Figure 20 Effect of beam-skews and axial loads on reactionary moments at the connection for deep-column SMFs at various interstory drift angles. The missing data point (20°
skew, and 25% ΦPn) is due to column buckling prior to completing 0.04 rad drift, as shown in Figure 16b, and an explanation is given in section 3.2.3. Also included are the instability
mechanism visualizations, where points “h”, “i” and “j”, “k” are 10% and 15% ΦPn, respectively.
24
Table 4 Deep-column SMF failure observations.
Model Rotation of Column Local Buckling Initiating (rad)
W30×173_0_10% -
W30×173_10_10% -
W30×173_20_10% -
W30×173_30_10% First cycle of 0.04
W30×173_0_15% -
W30×173_10_15% -
W30×173_20_15% -
W30×173_30_15% First cycle of 0.04
W30×173_0_25% -
W30×173_10_25% -
W30×173_20_25% First cycle of 0.03 *
W30×173_30_25% First cycle of 0.04 *
W30×173_0_50% First cycle of 0.03 *
W30×173_10_50% First cycle of 0.03 *
W30×173_20_50% First cycle of 0.03 *
W30×173_30_50% First cycle of 0.03 *
* Model failed (column local buckling) in first cycle of subsequent rotation.
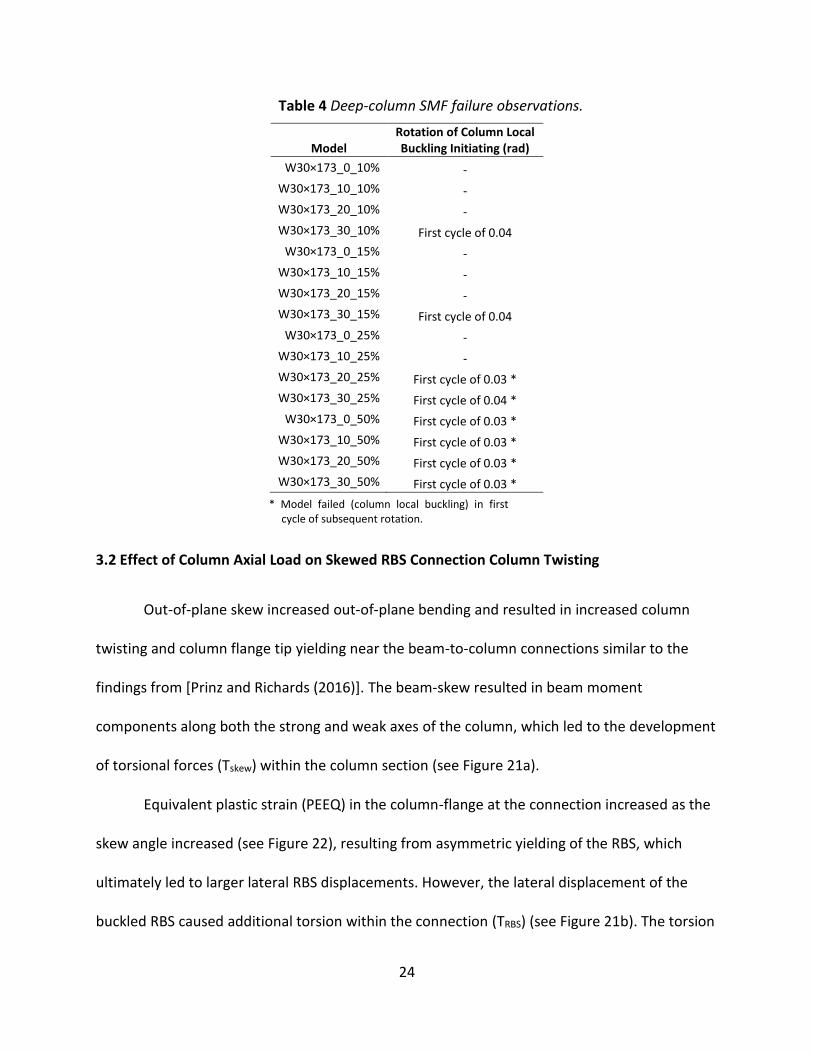
3.2 Effect of Column Axial Load on Skewed RBS Connection Column Twisting
Out-of-plane skew increased out-of-plane bending and resulted in increased column
twisting and column flange tip yielding near the beam-to-column connections similar to the
findings from [Prinz and Richards (2016)]. The beam-skew resulted in beam moment
components along both the strong and weak axes of the column, which led to the development
of torsional forces (Tskew) within the column section (see Figure 21a).
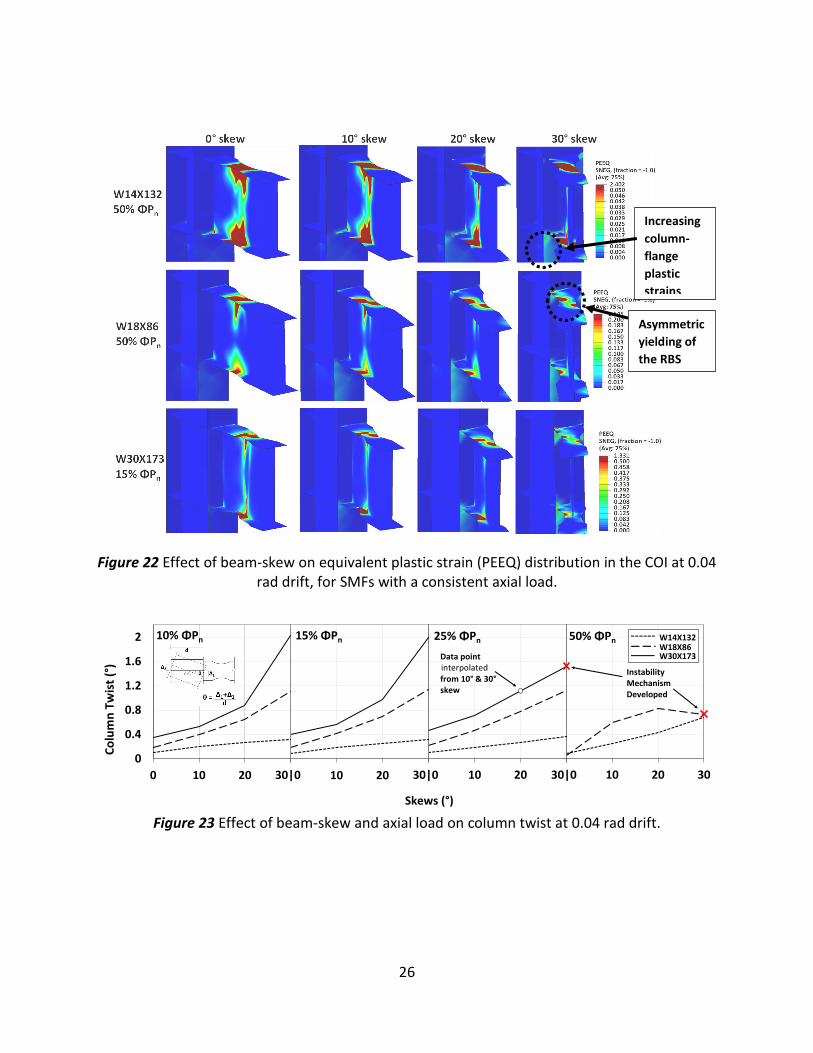
Equivalent plastic strain (PEEQ) in the column-flange at the connection increased as the
skew angle increased (see Figure 22), resulting from asymmetric yielding of the RBS, which
ultimately led to larger lateral RBS displacements. However, the lateral displacement of the
buckled RBS caused additional torsion within the connection (TRBS) (see Figure 21b). The torsion
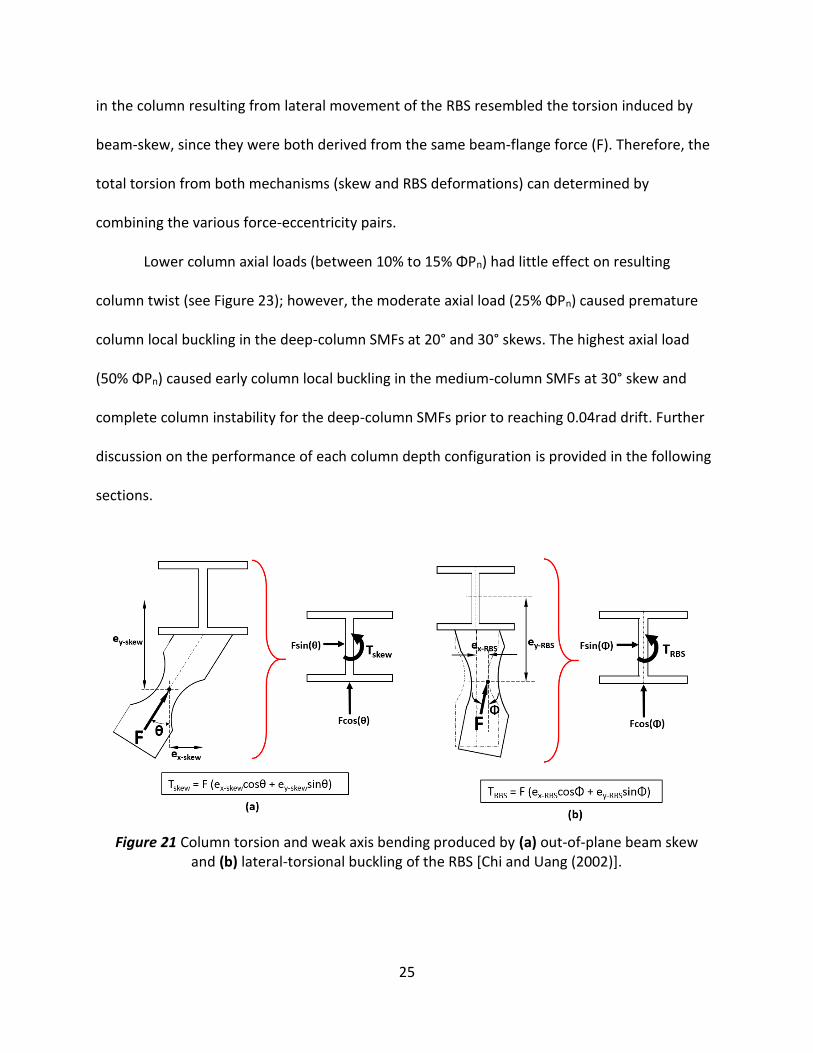
25
in the column resulting from lateral movement of the RBS resembled the torsion induced by
beam-skew, since they were both derived from the same beam-flange force (F). Therefore, the
total torsion from both mechanisms (skew and RBS deformations) can determined by
combining the various force-eccentricity pairs.
Lower column axial loads (between 10% to 15% ΦPn) had little effect on resulting
column twist (see Figure 23); however, the moderate axial load (25% ΦPn) caused premature
column local buckling in the deep-column SMFs at 20° and 30° skews. The highest axial load
(50% ΦPn) caused early column local buckling in the medium-column SMFs at 30° skew and
complete column instability for the deep-column SMFs prior to reaching 0.04rad drift. Further
discussion on the performance of each column depth configuration is provided in the following
sections.
Figure 21 Column torsion and weak axis bending produced by (a) out-of-plane beam skew and (b) lateral-torsional buckling of the RBS [Chi and Uang (2002)].
26
Co
lum
n T
wis
t (°
)
Figure 22 Effect of beam-skew on equivalent plastic strain (PEEQ) distribution in the COI at 0.04 rad drift, for SMFs with a consistent axial load.
Figure 23 Effect of beam-skew and axial load on column twist at 0.04 rad drift.
0
0.4
0.8
1.2
1.6
2
0 10 20 30
50% ΦPn
Skews (°)
0
0.4
0.8
1.2
1.6
2
0 10 20 30
25% ΦPn
30|0
0
0.4
0.8
1.2
1.6
2
0 10 20 30
15% ΦPn
0
0.4
0.8
1.2
1.6
2
0 10 20 30
10% ΦPn
30|0
W14X132W18X86W30X173
30|0
Data point extrapolated from 10° & 30°skew
Instability Mechanism Developed
Asymmetric
yielding of
the RBS
Increasing
column-
flange
plastic
strains
interpolated

27
3.2.1 Shallow-Column Models
The shallow-column section (W14×132) experienced the lowest column twisting of the
three beam-column configurations (see again Figure 23). Beam-skew showed a consistent
correlation with column twist in all SMFs, which was expected due to the torsional force
resulting from the out-of-plane moment components.
Increased axial loads, excepting the highest axial load that led to column local buckling
at high drifts, had a negligible effect on column twisting. Note in Figure 24 that the column
twist behavior from the 10%-25%ΦPn axial loads are tightly grouped at all beam-skew levels.
Under larger column axial loads (50% ΦPn), the columns experienced local buckling, but only in
later storydrifts (0.06 rad drift). No column local buckling was observed in any of the shallow-
column SMFs leading up to 0.05 rad drift. All of the column twist data were calculated from
flange displacements Δ1 and Δ2 as shown in Figure 25.
Axial-loads and beam-skews are inherently tied to column twisting, since they both
influence the development of axial, torsional, and flexural stresses in the columns; however,
any deleterious effects of combining axial load and beam-skew are only evident under the
largest axial load (note the increase in column twist of the 50% ΦPn line in Figure 24).
28
Figure 24 Column twist with differing skews and axial loads for the shallow-column SMFs at various interstory drift angles.
Figure 25 Location of data points for obtaining column twist.
3.2.2 Medium-Column Models
The medium-column (W18X86) SMFs exhibited less ductility than the shallow-column
(W14X132) SMFs. Because the beam sections remained the same between the shallow and
medium-column SMFs, the increased column twist can be attributed to both the lower column
0
0.2
0.4
0.6
0.8
1
0 10 20 30
0
0.2
0.4
0.6
0.8
1
0 10 20 30
10% ΦPn15% ΦPn25% ΦPn50% ΦPn
0.03 Rad
0.05 Rad
Skews (°) Skews (°)
Co
lum
n T
wis
t (°
)C
olu
mn
Tw
ist
(°)
0
0.2
0.4
0.6
0.8
1
0 10 20 30
0
0.2
0.4
0.6
0.8
1
0 10 20 30
0.01.0
0.02 Rad
0.04 Rad
30|0
29
polar moment of inertia and deeper section, which led to decreased torsional stiffness and
higher eccentricity (ey-skew) from beam skew (see again Figure 21a) when compared to the
shallow column section.
Beam-skew influenced the magnitude of plastic strains experienced in the column web
and flanges below the first and second-story connections, and was demonstrated by the
differing location of column local buckling in the SMFs with the highest axial load. Beam-skew
showed a strong correlation with column twist and resembled the shallow-column SMFs, where
increase in beam-skew subsequently increased column twist (see Figure 26).
Increased column axial loads had a negligible effect on column twist, at rotations up to
0.04rad. Figure 26 shows the relationship between beam-skew angle, column twist, and
applied axial load. Note in Figure 26 that axial load effects begin to increase the amount of
column twisting at high connection rotations (0.05rad and greater). The column of the 50%
ΦPn load case experienced local buckling, which reduced column twist similar to the way a soft-
story reduces interstory drifts at subsequent floors.
3.2.3 Deep-Column Models
The SMFs containing deep columns (W30×173) demonstrated the highest overall
column twist (see Figure 27). Beam-skew increased column twist, but determining the
contribution at the COI is limited since the early development of column local buckling below
the first-story connection relieved some torsional stresses. The effect of the two lowest axial
loads (10% and 15% ΦPn) on column twist indicate negligible effects of axial load on resulting
column twist (see Figure 27).
30
Figure 26 Column twist with differing skews and axial loads for the medium-column SMFs at various interstory drift angles. Also included are the instability mechanism visualizations of the
column compression flange.
0
0.5
1
1.5
2
2.5
0 10 20 300 10 20 30
0
0.5
1
1.5
2
2.5
0 10 20 30
0.02 Rad 0.03 Rad
0.05 Rad
0
0.5
1
1.5
2
2.5
0 10 20 3030|0
0.02.5 0.04 Rad
InstabilityMechanism×
10% ΦPn15% ΦPn25% ΦPn50% ΦPn
Co
lum
n T
wis
t (°
)C
olu
mn
Tw
ist
(°)
Skews (°) Skews (°)
a
bc
a b c
Column local buckling
31
Figure 27 Column twist with differing skews and axial loads for the deep-column SMFs at
various interstory drift angles. Also included are the instability mechanism visualization of the column compression flange.
0
0.5
1
1.5
2
2.5
3
0 10 20 30
0
0.5
1
1.5
2
2.5
3
0 10 20 30
0.03 Rad
0
0.5
1
1.5
2
2.5
3
0 10 20 30
0
0.5
1
1.5
2
2.5
3
0 10 20 30
0.03.0
0.02 Rad
0.04 Rad 0.05 Rad
Skews (°) Skews (°)
10% ΦPn15% ΦPn25% ΦPn50% ΦPn
30|0
Data point extrapolated from 10° & 30°skew
Co
lum
n T
wis
t (°
)C
olu
mn
Tw
ist
(°)
a
b
c
de f
g
hi
j k
a b c d
e f g
h i j k
Column
local
buckling
Column-
flange local
buckling
initiating
interpolated
32
3.3 Column Flange Stress
Column-flange equivalent plastic strains (PEEQ in ABAQUS) were obtained to investigate
the distribution of yielding within the connection at differing beam-skews and axial loads.
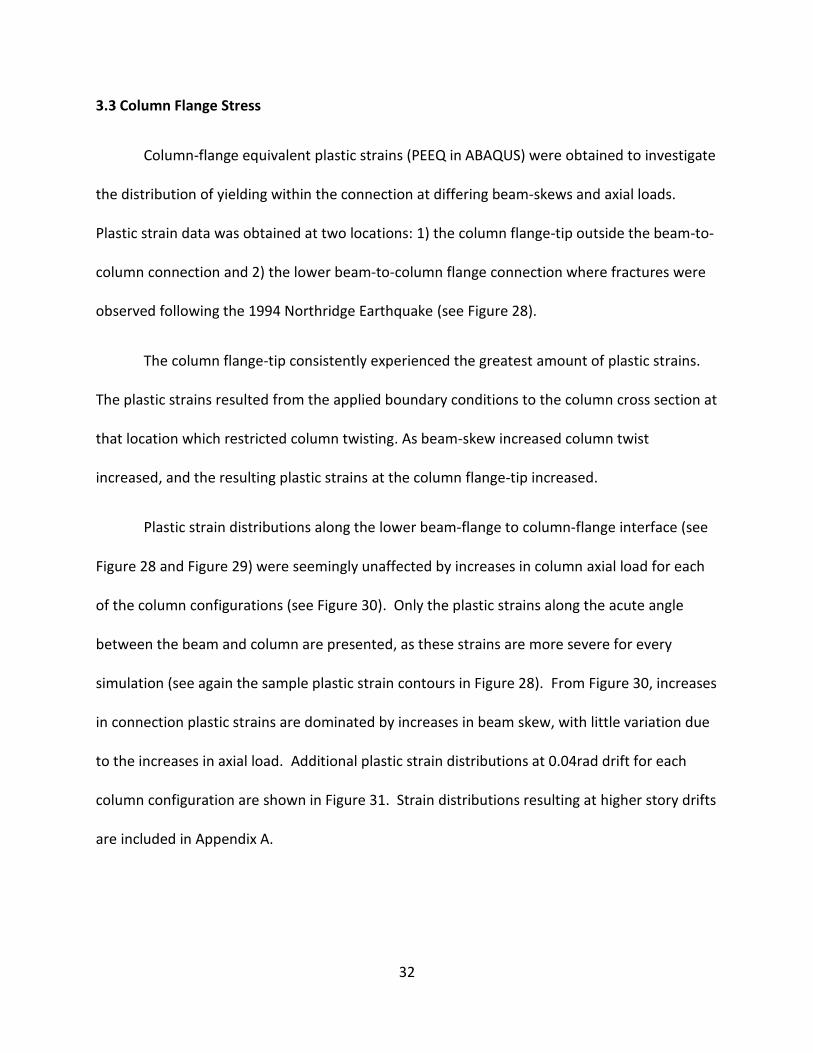
Plastic strain data was obtained at two locations: 1) the column flange-tip outside the beam-to-
column connection and 2) the lower beam-to-column flange connection where fractures were
observed following the 1994 Northridge Earthquake (see Figure 28).
The column flange-tip consistently experienced the greatest amount of plastic strains.
The plastic strains resulted from the applied boundary conditions to the column cross section at
that location which restricted column twisting. As beam-skew increased column twist
increased, and the resulting plastic strains at the column flange-tip increased.
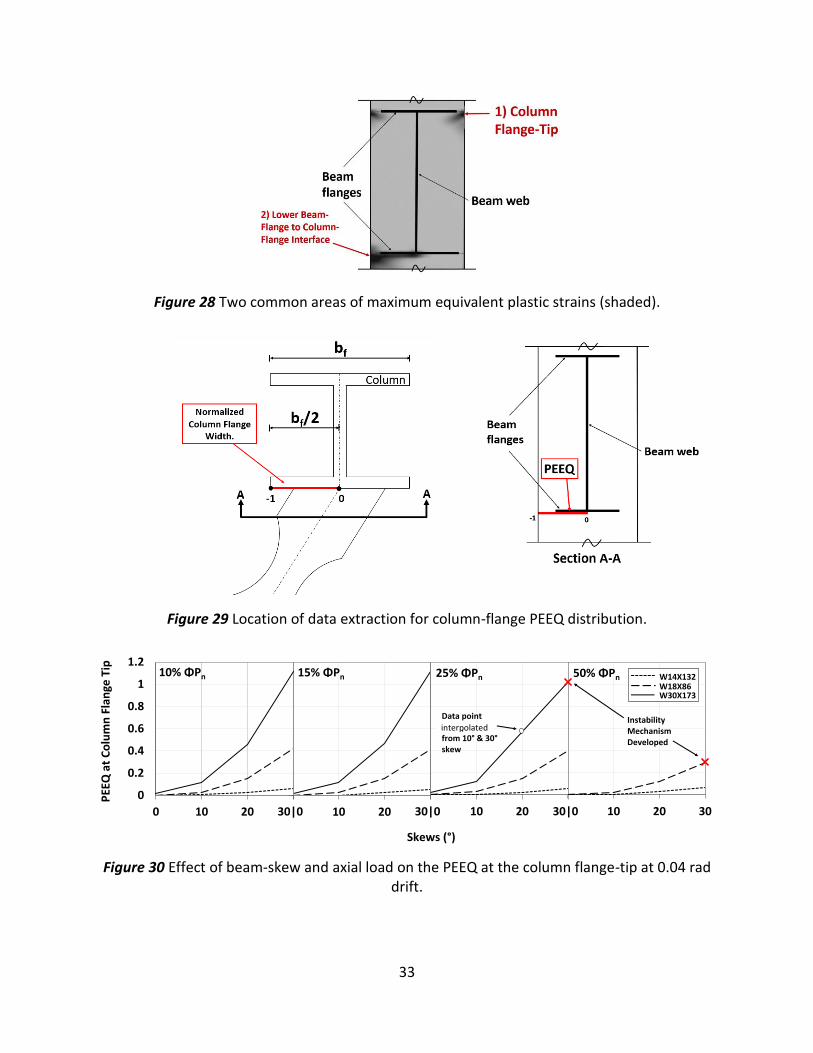
Plastic strain distributions along the lower beam-flange to column-flange interface (see
Figure 28 and Figure 29) were seemingly unaffected by increases in column axial load for each
of the column configurations (see Figure 30). Only the plastic strains along the acute angle
between the beam and column are presented, as these strains are more severe for every
simulation (see again the sample plastic strain contours in Figure 28). From Figure 30, increases
in connection plastic strains are dominated by increases in beam skew, with little variation due
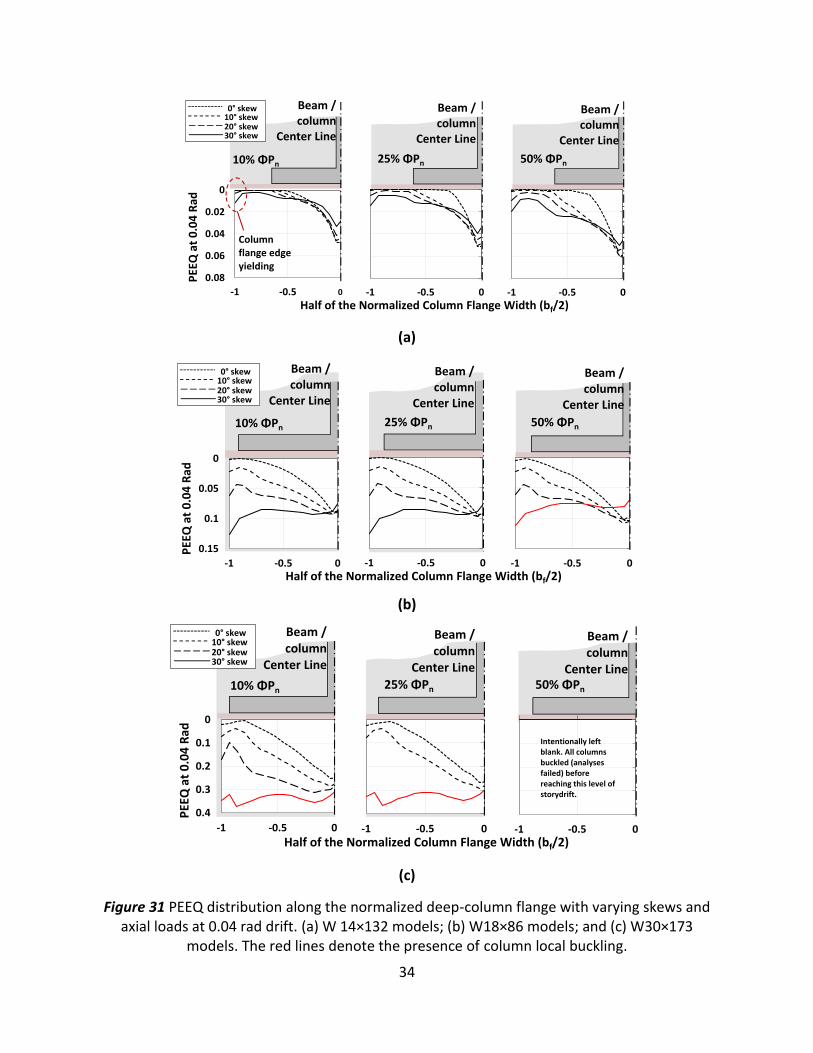
to the increases in axial load. Additional plastic strain distributions at 0.04rad drift for each
column configuration are shown in Figure 31. Strain distributions resulting at higher story drifts
are included in Appendix A.
33
Figure 28 Two common areas of maximum equivalent plastic strains (shaded).
Figure 29 Location of data extraction for column-flange PEEQ distribution.
Figure 30 Effect of beam-skew and axial load on the PEEQ at the column flange-tip at 0.04 rad drift.
0
0.2
0.4
0.6
0.8
1
1.2
0 10 20 30
50% ΦPn
Skews (°)
0
0.2
0.4
0.6
0.8
1
1.2
0 10 20 30
25% ΦPn
30|0
0
0.2
0.4
0.6
0.8
1
1.2
0 10 20 30
15% ΦPn
PEE
Q a
t C
olu
mn
Fla
nge
Tip
0
0.2
0.4
0.6
0.8
1
1.2
0 10 20 30
10% ΦPn
30|0 30|0
Data point extrapolated from 10° & 30°skew
W14X132W18X86W30X173
Instability Mechanism Developed
interpolated
34
(a)
(b)
(c)
Figure 31 PEEQ distribution along the normalized deep-column flange with varying skews and axial loads at 0.04 rad drift. (a) W 14×132 models; (b) W18×86 models; and (c) W30×173
models. The red lines denote the presence of column local buckling.
0
0.02
0.04
0.06
0.08
-1 -0.5 0
0
0.02
0.04
0.06
0.08
-1 -0.5 0
Beam / column
Center Line
Column flange edgeyielding
0
Beam / column
Center Line
10% ΦPn
Half of the Normalized Column Flange Width (bf/2)
PEE
Q a
t 0
.04
Rad
0° skew10° skew20° skew30° skew
0
0.02
0.04
0.06
0.08
-1 -0.5 0
25% ΦPn
Beam / column
Center Line
50% ΦPn
0
0.05
0.1
0.15
-1 -0.5 0
0
0.05
0.1
0.15
-1 -0.5 0
PEE
Q a
t 0
.04
Rad
0
0.05
0.1
0.15
-1 -0.5 0
10% ΦPn 25% ΦPn 50% ΦPn
Half of the Normalized Column Flange Width (bf/2)
Beam / column
Center Line
Beam / column
Center Line
Beam / column
Center Line
0° skew10° skew20° skew30° skew
0
0.1
0.2
0.3
0.4
-1 -0.5 0
0
0.1
0.2
0.3
0.4
-1 -0.5 0
PEE
Q a
t 0
.04
Rad
0
0.1
0.2
0.3
0.4
-1 -0.5 0
Intentionally left blank. All columns buckled (analyses failed) before reaching this level of storydrift.
10% ΦPn 25% ΦPn 50% ΦPn
Half of the Normalized Column Flange Width (bf/2)
Beam / column
Center Line
Beam / column
Center Line
Beam / column
Center Line
0° skew10° skew20° skew30° skew

35
4. Summary and Conclusions
The effect of column axial loads on the performance of SMFs containing skewed RBS
connections was investigated using detailed finite element analyses. A total of 48 analyses were
performed, representing 3 beam-column configurations, 4 levels of beam skew, and 4 levels of
column axial load. All considered beam-column geometries narrowly satisfy slenderness limits
as outlined in the AISC Seismic Provisions, representing worst-case scenarios for performance
evaluation. The following conclusions are based on the 48 analyses:
1. Increasing beam-skew and axial load has little effect on connection moment capacity
prior to column local buckling initiation.
2. Increasing column axial load (up to 50% ΦPn) has a negligible effect on resulting column
twist. Beam-skew angle is the dominate contributor to resulting column twist.
3. Applied column axial loads have little effect on column flange yielding within the beam-
to-column connections. Column flange yielding is dominated by the applied beam-skew
angle.
4. Deep-column SMFs are susceptible to column local buckling at low beam-skew angles.
Under the larger applied axial loads (50% ΦPn) column local buckling was observed in
the deep-column configurations at low drifts (less than 0.04rad) and at all beam skew
angles. It is important to note that the medium-depth columns also experienced local
buckling issues at low drifts (less than 0.04rad); however, this only occurred at large
beam-skew angles (greater than 20deg) and large axial loads.
36
References
ABAQUS, (2015), Abaqus Analysis User’s Manual, version 6.12, University at Cambridge, UK. American Institute of Steel Construction, (2010a). Code of standard practice for steel buildings
and bridges, Chicago. American Institute of Steel Construction, (2010b), ANSI/AISC 341-05. Seismic provisions for
structural steel buildings, American Institute of Steel Construction, Inc., Chicago, IL. American Institute of Steel Construction, (2011), Steel Construction Manual, 14th edition. AISC,
Chicago, IL. American Institute of Steel Construction, (2012), Seismic Design Manual, 2nd edition. Structural
Educational Council, Chicago, IL. Chi, W., Kanvinde, A., and Deierlein, G. (2006). "Prediction of Ductile Fracture in Steel
Connections Using SMCS Criterion." J. Struct. Eng. 132(2), 171-181. Chi, B., & Uang, C. M. (2002). Cyclic response and design recommendations of reduced beam
section moment connections with deep columns. Journal of Structural Engineering, 128(4), 464-473.
Earthquake Country Alliance. (2003). Retrieved January 18, 2017, from http://www.earthquakecountry.org/step4/steelframe.html
Engelhart, M. D., & Sabol, T. A. (1997, September). Seismic-resistant steel moment connections: Developments since the 1994 Northridge earthquake. Progress in Structural Engineering and Materials, 68-77. doi:10.1002/pse.2260010112
FEMA (2000). Recommended seismic design criteria for new steel moment frame buildings, FEMA 350, Federal Emergency Management Agency, Washington, DC.
Gilton, C. S., and Uang, C.-M. (2002). "Cyclic Response and Design Recommendations of Weak-Axis Reduced Beam Section Moment Connections." J. Struct. Eng. 128(4), 452.
Hamburger, Ronald O., Krawinkler, Helmut, Malley, James O., and Adan, Scott M. (2009). "Seismic
design of steel special moment frames: a guide for practicing engineers," NEHRP Seismic Design Technical Brief No. 2, National Institute of Standards and Technology, Gaithersburg, MD., NIST GCR 09-917-3
HKS (Hibbitt, Karlsson, and Sorensen). (2006). ABAQUS standard users manual, version 6.4,
Providence, RI.
37
Kaufmann, E. J., Metrovich, B. R., and Pense, A. W. (2001). “Characterization of cyclic inelastic strain behavior on properties of A572 Gr. 50 and A913 Gr. 50 rolled sections.” ATLSS Rep. No. 01-13, National Center for Engineering Research on Advanced Technology for Large Structural Systems, Lehigh Univ., Bethlehem, PA.
Lee, C., Jeon, S., Kim, J., and Uang, C. (2005). "Effects of Panel Zone Strength and Beam Web
Connection Method on Seismic Performance of Reduced Beam Section Steel Moment Connections." J. Struct. Eng., 10.1061/(ASCE)0733-9445(2005)131:12(1854), 1854-1865.
Pachoumis, D. T., Galoussis, E. G., Kalfas, C. N., and Christitsas, A. D. (2009). "Reduced beam section moment connections subjected to cyclic loading: Experimental analysis and FEM simulation." Eng. Structures 31(1), 216-223.
Prinz, G. S., and Richards, P.W. (2016) "Demands on reduced beam section connections with out-
of-plane skew." J. Struct. Eng. 142(1) Richards, P. W., and Prinz, G. S. (2007). “Non-linear time history analysis of refined mesh steel
structures.” Proc., 9th Canadian Conf. on Earthquake Engineering, Canadian Association for Earthquake Engineering, ON, Canada.
Richards, P. W., and Uang, C.-M. (2005). “Effect of flange width-thickness ratio on eccentrically
braced frames link cyclic rotation capacity.” J. Struct. Eng., 10.1061/(ASCE)0733-9445(2005)131:10(1546), 1546–1552.
Ricles, J. M., Mao, C., Lu, L., & Fisher, J. W. (2003). “Ductile details for welded unreinforced
moment connections subject to inelastic cyclic loading”. Engineering Structures, 667-680. doi:10.1016/s0141-0296(02)00176-1
Tsai, K. C., Wu, S., & Popov, E. P. (1995). “Experimental performance of seismic steel beam-column moment joints.” Journal of Structural Engineering, 121(6), 925-931.
Uang, C., Ozkula, G., & Harris, J. (2017). “Observations from Cyclic Tests on Deep, Slender Wide-
Flange Structural Steel Beam-Column Members.” Engineering Journal, 54, 45-60. Retrieved March 17, 2017.
Zhang, X., and Ricles, J. M. (2006). “Seismic Behavior of Reduced Beam Section Moment
Connections to Deep Columns."” J. Struct. Eng., 10.1061/(ASCE)0733-9445(2006)132:3(358), 358–367.
38
Appendix
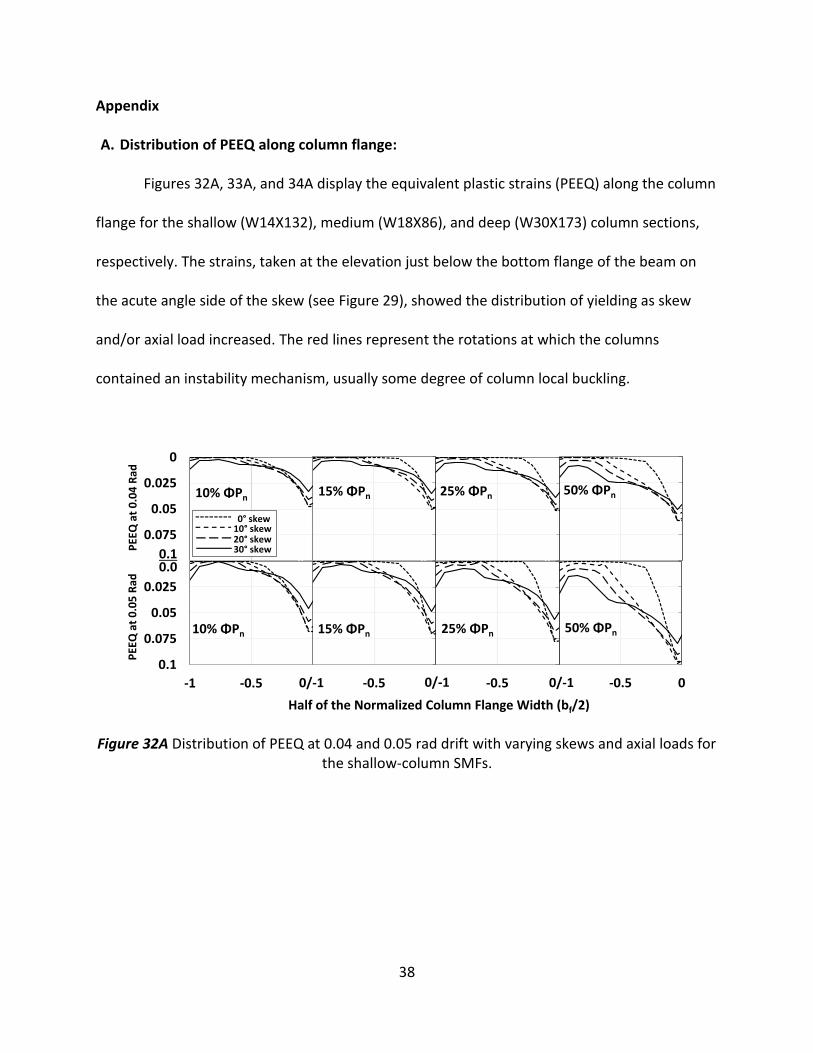
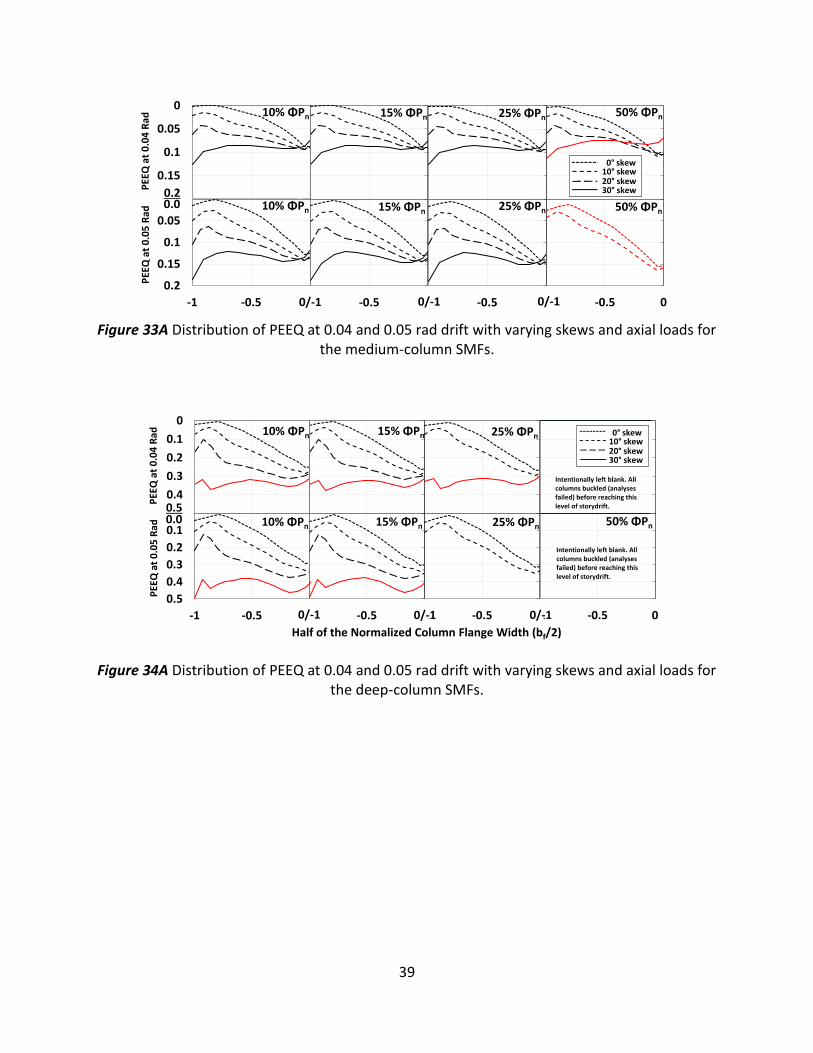
A. Distribution of PEEQ along column flange:
Figures 32A, 33A, and 34A display the equivalent plastic strains (PEEQ) along the column
flange for the shallow (W14X132), medium (W18X86), and deep (W30X173) column sections,
respectively. The strains, taken at the elevation just below the bottom flange of the beam on
the acute angle side of the skew (see Figure 29), showed the distribution of yielding as skew
and/or axial load increased. The red lines represent the rotations at which the columns
contained an instability mechanism, usually some degree of column local buckling.
Figure 32A Distribution of PEEQ at 0.04 and 0.05 rad drift with varying skews and axial loads for the shallow-column SMFs.
0
0.025
0.05
0.075
0.1
-1 -0.5 0
PEE
Q a
t 0
.04
Rad
50% ΦPn
0
0.025
0.05
0.075
0.1
-1 -0.5 0
25% ΦPn
0
0.025
0.05
0.075
0.1
-1 -0.5 0
15% ΦPn
15% ΦPn
0
0.025
0.05
0.075
0.1-1 -0.5 0
10% ΦPn
PEE
Q a
t 0
.05
Rad
0
0.025
0.05
0.075
0.1
-1 -0.5 0
0
0.025
0.05
0.075
0.1
-1 -0.5 0
25% ΦPn
0
0.025
0.05
0.075
0.1
-1 -0.5 0
0
0.025
0.05
0.075
0.1
-1 -0.5 0
10% ΦPn
0/-1
0.0
0/-1
0° skew10° skew20° skew30° skew
0/-1
Half of the Normalized Column Flange Width (bf/2)
0.1
15% ΦPn 50% ΦPn
39
Figure 33A Distribution of PEEQ at 0.04 and 0.05 rad drift with varying skews and axial loads for
the medium-column SMFs.
Figure 34A Distribution of PEEQ at 0.04 and 0.05 rad drift with varying skews and axial loads for the deep-column SMFs.
0
0.05
0.1
0.15
0.2
-1 -0.5 0
PEE
Q a
t 0
.04
Rad
50% ΦPn
0
0.05
0.1
0.15
0.2
-1 -0.5 0
25% ΦPn
0
0.05
0.1
0.15
0.2
-1 -0.5 0
15% ΦPn
15% ΦPn
0
0.05
0.1
0.15
0.2-1 -0.5 0
10% ΦPn
PEE
Q a
t 0
.05
Rad
0
0.05
0.1
0.15
0.2
-1 -0.5 0
0
0.05
0.1
0.15
0.2
-1 -0.5 0
25% ΦPn
0
0.05
0.1
0.15
0.2
-1 -0.5 0
0
0.05
0.1
0.15
0.2
-1 -0.5 0
10% ΦPn
0/-1
0.0
0/-1
0° skew10° skew20° skew30° skew
0/-1
0.215% ΦPn 50% ΦPn
0
0.1
0.2
0.3
0.4
0.5
-1 -0.5 0
PEE
Q a
t 0
.04
Rad 0° skew
10° skew20° skew30° skew
0
0.1
0.2
0.3
0.4
0.5
-1 -0.5 0
25% ΦPn
0
0.1
0.2
0.3
0.4
0.5
-1 -0.5 0
15% ΦPn
0
0.1
0.2
0.3
0.4
0.5-1 -0.5 0
10% ΦPn
Intentionally left blank. All columns buckled (analyses failed) before reaching this level of storydrift.
0
0.1
0.2
0.3
0.4
0.5
-1 -0.5 0
PEE
Q a
t 0
.05
Rad 50% ΦPn
0
0.1
0.2
0.3
0.4
0.5
-1 -0.5 00/-1
25% ΦPn
0
0.1
0.2
0.3
0.4
0.5
-1 -0.5 00/-1
15% ΦPn
0
0.1
0.2
0.3
0.4
0.5
-1 -0.5 00/-1
10% ΦPn
Intentionally left blank. All columns buckled (analyses failed) before reaching this level of storydrift.
Half of the Normalized Column Flange Width (bf/2)
0.00.5
40
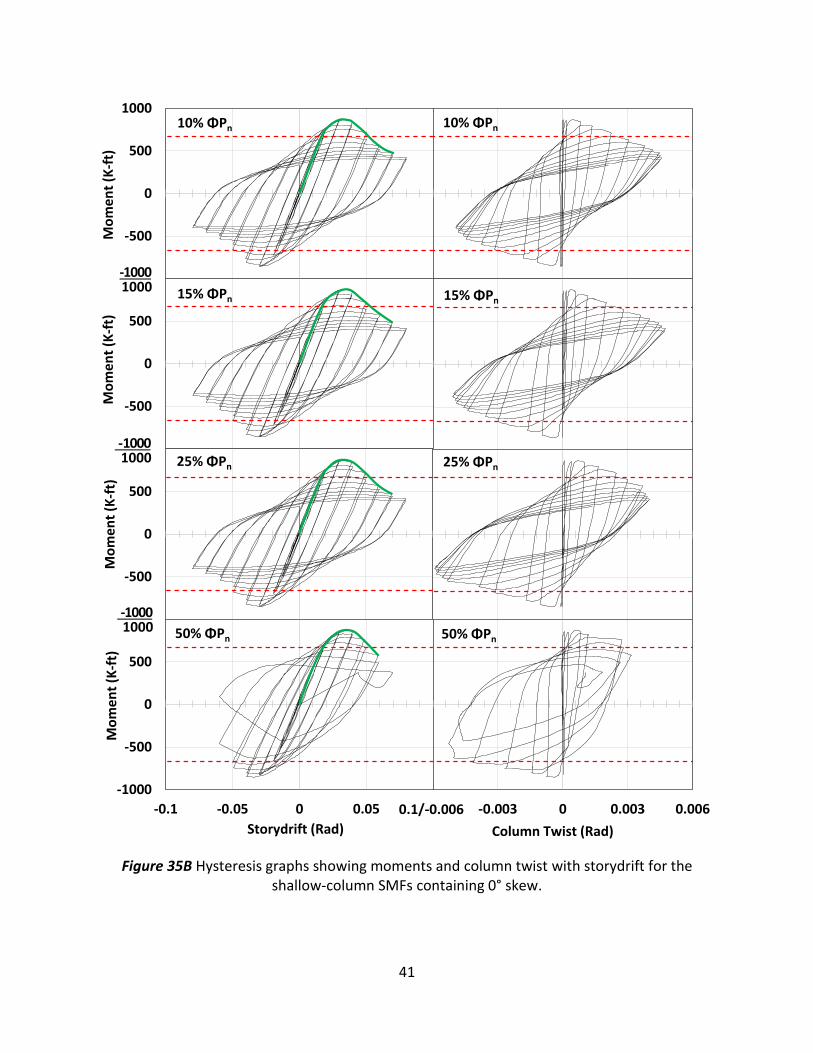
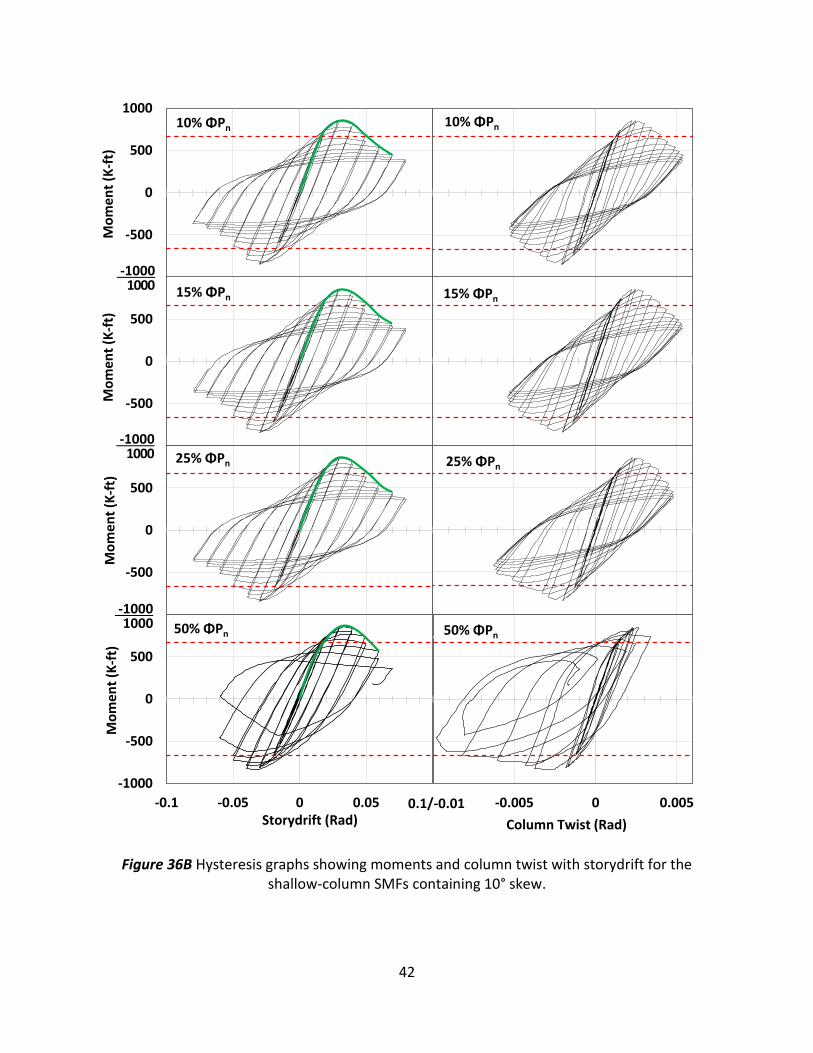
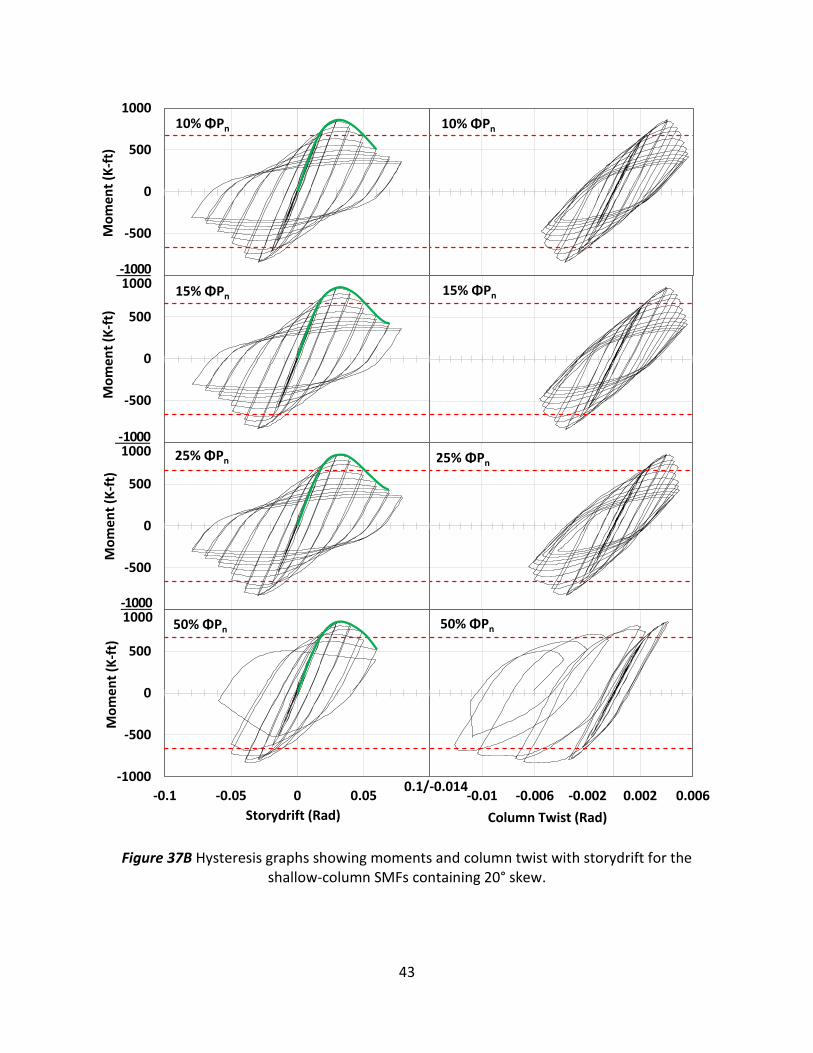
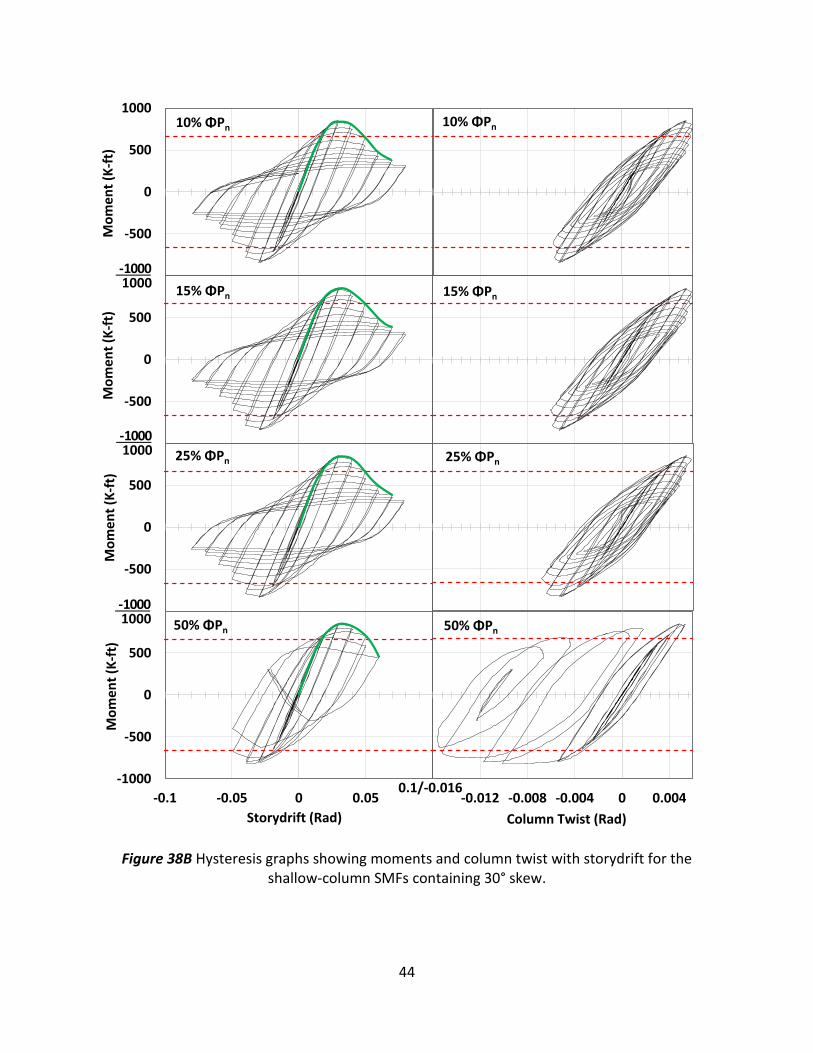
B. Hysteresis graphs:
Figures 35B – 38B, Figures 39B – 42B, and Figures 43B – 46B show the hysteresis graphs
for the W14×132 (shallow-column) models, W18×86 (medium-column) models, and W30×173
(deep-column) SMFs at the four different beam skews, respectively. The hysteresis graphs on
the left show the connection moments (in K-ft), and the respective storydrifts. The hysteresis
graphs on the right show the same connection moments along with the corresponding effect on
column twisting. The red dashed-lines are the beam moments (K-ft) representing 0.8Mp, and
the green lines show the approximated backbone curves. The intersection of the red and green
lines are the storydrifts obtained at 0.8Mp, summarized in Table 2.
41
Figure 35B Hysteresis graphs showing moments and column twist with storydrift for the shallow-column SMFs containing 0° skew.
Mo
me
nt
(K-f
t)
Storydrift (Rad)
Mo
me
nt
(K-f
t)M
om
en
t (K
-ft)
Mo
me
nt
(K-f
t)
-1000
-500
0
500
1000
-0.006 -0.003 0 0.003 0.006
10% ΦPn
-1000
-500
0
500
1000
-0.006 -0.003 0 0.003 0.006
15% ΦPn
-1000
-500
0
500
1000
-0.006 -0.003 0 0.003 0.006
-1000
-500
0
500
1000
-0.006 -0.003 0 0.003 0.006
25% ΦPn
50% ΦPn
-1000
-500
0
500
1000
-0.1 -0.05 0 0.05 0.1
10% ΦPn
-1000
-500
0
500
1000
-0.1 -0.05 0 0.05 0.1
15% ΦPn
-1000
-500
0
500
1000
-0.1 -0.05 0 0.05 0.1
-1000
-500
0
500
1000
-0.1 -0.05 0 0.05 0.1
25% ΦPn
50% ΦPn
Column Twist (Rad)
0.1/-0.006
-10001000
-10001000
-10001000
42
Figure 36B Hysteresis graphs showing moments and column twist with storydrift for the shallow-column SMFs containing 10° skew.
Mo
me
nt
(K-f
t)
Storydrift (Rad)
Mo
me
nt
(K-f
t)M
om
en
t (K
-ft)
Mo
me
nt
(K-f
t)
-1000
-500
0
500
1000
-0.01 -0.005 0 0.005
10% ΦPn
-1000
-500
0
500
1000
-0.01 -0.005 0 0.005
15% ΦPn
-1000
-500
0
500
1000
-0.01 -0.005 0 0.005
-1000
-500
0
500
1000
-0.01 -0.005 0 0.005
25% ΦPn
50% ΦPn
-1000
-500
0
500
1000
-0.1 -0.05 0 0.05 0.1
10% ΦPn
-1000
-500
0
500
1000
-0.1 -0.05 0 0.05 0.1
15% ΦPn
-1000
-500
0
500
1000
-0.1 -0.05 0 0.05 0.1
-1000
-500
0
500
1000
-0.1 -0.05 0 0.05 0.1
25% ΦPn
50% ΦPn
Column Twist (Rad)
0.1/-0.01
-10001000
-10001000
-10001000
43
Figure 37B Hysteresis graphs showing moments and column twist with storydrift for the shallow-column SMFs containing 20° skew.
Mo
me
nt
(K-f
t)
Storydrift (Rad)
Mo
me
nt
(K-f
t)M
om
en
t (K
-ft)
Mo
me
nt
(K-f
t)
-1000
-500
0
500
1000
-0.014 -0.01 -0.006 -0.002 0.002 0.006
10% ΦPn
-1000
-500
0
500
1000
-0.014 -0.01 -0.006 -0.002 0.002 0.006
15% ΦPn
-1000
-500
0
500
1000
-0.014 -0.01 -0.006 -0.002 0.002 0.006
-1000
-500
0
500
1000
-0.014 -0.01 -0.006 -0.002 0.002 0.006
25% ΦPn
50% ΦPn
-1000
-500
0
500
1000
-0.1 -0.05 0 0.05 0.1
10% ΦPn
-1000
-500
0
500
1000
-0.1 -0.05 0 0.05 0.1
15% ΦPn
-1000
-500
0
500
1000
-0.1 -0.05 0 0.05 0.1
-1000
-500
0
500
1000
-0.1 -0.05 0 0.05 0.1
25% ΦPn
50% ΦPn
Column Twist (Rad)
0.1/-0.014
-10001000
-10001000
-10001000
44
Figure 38B Hysteresis graphs showing moments and column twist with storydrift for the shallow-column SMFs containing 30° skew.
Mo
me
nt
(K-f
t)
Storydrift (Rad)
Mo
me
nt
(K-f
t)M
om
en
t (K
-ft)
Mo
me
nt
(K-f
t)
-1000
-500
0
500
1000
-0.016 -0.012 -0.008 -0.004 0 0.004
10% ΦPn
-1000
-500
0
500
1000
-0.016 -0.012 -0.008 -0.004 0 0.004
15% ΦPn
-1000
-500
0
500
1000
-0.016 -0.012 -0.008 -0.004 0 0.004
-1000
-500
0
500
1000
-0.016 -0.012 -0.008 -0.004 0 0.004
25% ΦPn
50% ΦPn
-1000
-500
0
500
1000
-0.1 -0.05 0 0.05 0.1
10% ΦPn
-1000
-500
0
500
1000
-0.1 -0.05 0 0.05 0.1
15% ΦPn
-1000
-500
0
500
1000
-0.1 -0.05 0 0.05 0.1
-1000
-500
0
500
1000
-0.1 -0.05 0 0.05 0.1
25% ΦPn
50% ΦPn
Column Twist (Rad)
0.1/-0.016
-10001000
-10001000
-10001000
45
Figure 39B Hysteresis graphs showing moments and column twist with storydrift for the medium-column SMFs containing 0° skew.
Mo
me
nt
(K-f
t)
Storydrift (Rad)
Mo
me
nt
(K-f
t)M
om
en
t (K
-ft)
Mo
me
nt
(K-f
t)
-1000
-500
0
500
1000
-0.02 -0.012 -0.004 0.004 0.012
10% ΦPn
-1000
-500
0
500
1000
-0.02 -0.012 -0.004 0.004 0.012
15% ΦPn
-1000
-500
0
500
1000
-0.02 -0.012 -0.004 0.004 0.012
-1000
-500
0
500
1000
-0.02 -0.012 -0.004 0.004 0.012
25% ΦPn
50% ΦPn
-1000
-500
0
500
1000
-0.1 -0.05 0 0.05 0.1
10% ΦPn
-1000
-500
0
500
1000
-0.1 -0.05 0 0.05 0.1
15% ΦPn
-1000
-500
0
500
1000
-0.1 -0.05 0 0.05 0.1
-1000
-500
0
500
1000
-0.1 -0.05 0 0.05 0.1
25% ΦPn
50% ΦPn
Column Twist (Rad)
0.1/-0.02
-10001000
-10001000
-10001000
46
Figure 40B Hysteresis graphs showing moments and column twist with storydrift for the medium-column SMFs containing 10° skew.
Mo
me
nt
(K-f
t)
Storydrift (Rad)
Mo
me
nt
(K-f
t)M
om
en
t (K
-ft)
Mo
me
nt
(K-f
t)
-1000
-500
0
500
1000
-0.022 -0.011 0 0.011
10% ΦPn
-1000
-500
0
500
1000
-0.022 -0.011 0 0.011
15% ΦPn
-1000
-500
0
500
1000
-0.022 -0.011 0 0.011
-1000
-500
0
500
1000
-0.022 -0.011 0 0.011
25% ΦPn
50% ΦPn
-1000
-500
0
500
1000
-0.1 -0.05 0 0.05 0.1
10% ΦPn
-1000
-500
0
500
1000
-0.1 -0.05 0 0.05 0.1
15% ΦPn
-1000
-500
0
500
1000
-0.1 -0.05 0 0.05 0.1
-1000
-500
0
500
1000
-0.1 -0.05 0 0.05 0.1
25% ΦPn
50% ΦPn
Column Twist (Rad)
0.1/-0.022
-10001000
-10001000
-10001000
47
Figure 41B Hysteresis graphs showing moments and column twist with storydrift for the medium-column SMFs containing 20° skew.
Mo
me
nt
(K-f
t)
Storydrift (Rad)
Mo
me
nt
(K-f
t)M
om
en
t (K
-ft)
Mo
me
nt
(K-f
t)
-1000
-500
0
500
1000
-0.026 -0.013 0 0.013
10% ΦPn
-1000
-500
0
500
1000
-0.026 -0.013 0 0.013
15% ΦPn
-1000
-500
0
500
1000
-0.026 -0.013 0 0.013
-1000
-500
0
500
1000
-0.026 -0.013 0 0.013
25% ΦPn
50% ΦPn
-1000
-500
0
500
1000
-0.1 -0.05 0 0.05 0.1
10% ΦPn
-1000
-500
0
500
1000
-0.1 -0.05 0 0.05 0.1
15% ΦPn
-1000
-500
0
500
1000
-0.1 -0.05 0 0.05 0.1
-1000
-500
0
500
1000
-0.1 -0.05 0 0.05 0.1
25% ΦPn
50% ΦPn
Column Twist (Rad)
0.1/-0.026
-10001000
-10001000
-10001000
48
Figure 42B Hysteresis graphs showing moments and column twist with storydrift for the medium-column SMFs containing 30° skew.
Mo
me
nt
(K-f
t)
Storydrift (Rad)
Mo
me
nt
(K-f
t)M
om
en
t (K
-ft)
Mo
me
nt
(K-f
t)
-1000
-500
0
500
1000
-0.05 -0.025 0 0.025
10% ΦPn
-1000
-500
0
500
1000
-0.05 -0.025 0 0.025
15% ΦPn
-1000
-500
0
500
1000
-0.05 -0.025 0 0.025
-1000
-500
0
500
1000
-0.05 -0.025 0 0.025
25% ΦPn
50% ΦPn
-1000
-500
0
500
1000
-0.1 -0.05 0 0.05 0.1
10% ΦPn
-1000
-500
0
500
1000
-0.1 -0.05 0 0.05 0.1
15% ΦPn
-1000
-500
0
500
1000
-0.1 -0.05 0 0.05 0.1
-1000
-500
0
500
1000
-0.1 -0.05 0 0.05 0.1
25% ΦPn
50% ΦPn
Column Twist (Rad)
0.1/-0.05
-10001000
-10001000
-10001000
49
Figure 43B Hysteresis graphs showing moments and column twist with storydrift for the deep-column SMFs containing 0° skew.
Mo
me
nt
(K-f
t)
Storydrift (Rad)
Mo
me
nt
(K-f
t)M
om
en
t (K
-ft)
Mo
me
nt
(K-f
t)
-3000
-2000
-1000
0
1000
2000
3000
-0.012 -0.006 0 0.006
10% ΦPn
-3000
-2000
-1000
0
1000
2000
3000
-0.012 -0.006 0 0.006
15% ΦPn
-3000
-2000
-1000
0
1000
2000
3000
-0.012 -0.006 0 0.006
-3000
-2000
-1000
0
1000
2000
3000
-0.012 -0.006 0 0.006
25% ΦPn
50% ΦPn
-3000
-2000
-1000
0
1000
2000
3000
-0.1 -0.05 0 0.05 0.1
10% ΦPn
-3000
-2000
-1000
0
1000
2000
3000
-0.1 -0.05 0 0.05 0.1
15% ΦPn
-3000
-2000
-1000
0
1000
2000
3000
-0.1 -0.05 0 0.05 0.1
-3000
-2000
-1000
0
1000
2000
3000
-0.1 -0.05 0 0.05 0.1
25% ΦPn
50% ΦPn
Column Twist (Rad)
0.1/-0.012
-30003000
-30003000
-30003000
50
Figure 44B Hysteresis graphs showing moments and column twist with storydrift for the deep-column SMFs containing 10° skew.
Mo
me
nt
(K-f
t)
Storydrift (Rad)
Mo
me
nt
(K-f
t)M
om
en
t (K
-ft)
Mo
me
nt
(K-f
t)
-3000
-2000
-1000
0
1000
2000
3000
-0.02 -0.01 0 0.01
10% ΦPn
-3000
-2000
-1000
0
1000
2000
3000
-0.02 -0.01 0 0.01
15% ΦPn
-3000
-2000
-1000
0
1000
2000
3000
-0.02 -0.01 0 0.01
-3000
-2000
-1000
0
1000
2000
3000
-0.02 -0.01 0 0.01
25% ΦPn
50% ΦPn
-3000
-2000
-1000
0
1000
2000
3000
-0.1 -0.05 0 0.05 0.1
10% ΦPn
-3000
-2000
-1000
0
1000
2000
3000
-0.1 -0.05 0 0.05 0.1
15% ΦPn
-3000
-2000
-1000
0
1000
2000
3000
-0.1 -0.05 0 0.05 0.1
-3000
-2000
-1000
0
1000
2000
3000
-0.1 -0.05 0 0.05 0.1
25% ΦPn
50% ΦPn
Column Twist (Rad)
0.1/-0.02
-30003000
-30003000
-30003000
51
Figure 45B Hysteresis graphs showing moments and column twist with storydrift for the deep-column SMFs containing 20° skew.
Mo
me
nt
(K-f
t)
Storydrift (Rad)
Mo
me
nt
(K-f
t)M
om
en
t (K
-ft)
Mo
me
nt
(K-f
t)
-3000
-2000
-1000
0
1000
2000
3000
-0.02 -0.01 0 0.01
10% ΦPn
-3000
-2000
-1000
0
1000
2000
3000
-0.02 -0.01 0 0.01
15% ΦPn
-3000
-2000
-1000
0
1000
2000
3000
-0.02 -0.01 0 0.01
-3000
-2000
-1000
0
1000
2000
3000
-0.02 -0.01 0 0.01
25% ΦPn
50% ΦPn
-3000
-2000
-1000
0
1000
2000
3000
-0.1 -0.05 0 0.05 0.1
10% ΦPn
-3000
-2000
-1000
0
1000
2000
3000
-0.1 -0.05 0 0.05 0.1
15% ΦPn
-3000
-2000
-1000
0
1000
2000
3000
-0.1 -0.05 0 0.05 0.1
-3000
-2000
-1000
0
1000
2000
3000
-0.1 -0.05 0 0.05 0.1
25% ΦPn
50% ΦPn
Column Twist (Rad)
0.1/-0.02
-30003000
-30003000
-30003000
0.015
52
Figure 46B Hysteresis graphs showing moments and column twist with storydrift for the deep-column SMFs containing 30° skew.
Mo
me
nt
(K-f
t)
Storydrift (Rad)
Mo
me
nt
(K-f
t)M
om
en
t (K
-ft)
Mo
me
nt
(K-f
t)
-3000
-2000
-1000
0
1000
2000
3000
-0.06 -0.04 -0.02 0 0.02 0.04
10% ΦPn
-3000
-2000
-1000
0
1000
2000
3000
-0.06 -0.04 -0.02 0 0.02 0.04
15% ΦPn
-3000
-2000
-1000
0
1000
2000
3000
-0.1 -0.05 0 0.05 0.1
10% ΦPn
-3000
-2000
-1000
0
1000
2000
3000
-0.1 -0.05 0 0.05 0.1
15% ΦPn
Column Twist (Rad)
-30003000
-3000
-2000
-1000
0
1000
2000
3000
-0.06 -0.04 -0.02 0 0.02 0.04
25% ΦPn
-3000
-2000
-1000
0
1000
2000
3000
-0.1 -0.05 0 0.05 0.1
25% ΦPn
-30003000
-3000
-2000
-1000
0
1000
2000
3000
-0.06 -0.04 -0.02 0 0.02 0.04
50% ΦPn
-3000
-2000
-1000
0
1000
2000
3000
-0.1 -0.05 0 0.05 0.1
50% ΦPn
0.1/-0.06
-30003000
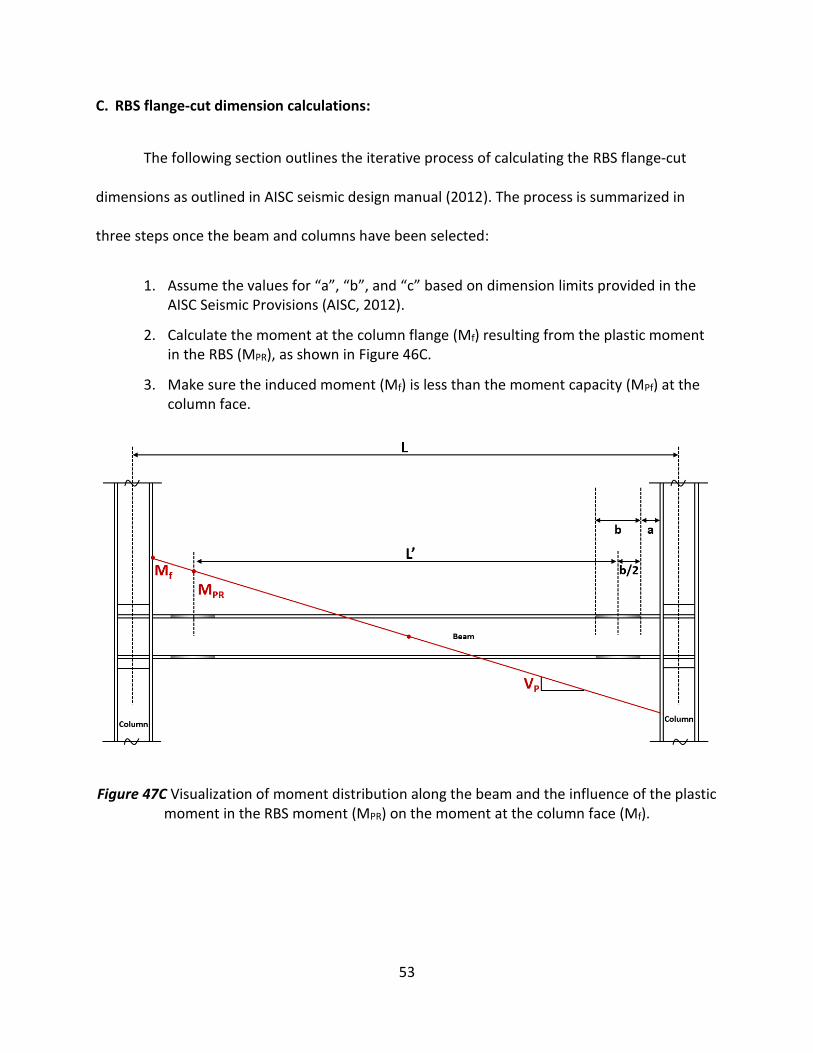
53
C. RBS flange-cut dimension calculations:
The following section outlines the iterative process of calculating the RBS flange-cut
dimensions as outlined in AISC seismic design manual (2012). The process is summarized in
three steps once the beam and columns have been selected:
1. Assume the values for “a”, “b”, and “c” based on dimension limits provided in the AISC Seismic Provisions (AISC, 2012).
2. Calculate the moment at the column flange (Mf) resulting from the plastic moment in the RBS (MPR), as shown in Figure 46C.
3. Make sure the induced moment (Mf) is less than the moment capacity (MPf) at the column face.
Figure 47C Visualization of moment distribution along the beam and the influence of the plastic moment in the RBS moment (MPR) on the moment at the column face (Mf).

54
1. Assuming a, b, and c:
Beam (W24×76) properties: bf = 8.99 in, db = 23.9 in, tf = 0.68 in, Zx = 200 in3
Column (W14×132) properties: dc = 14.7 in
Limits: 0.5bf ≤ a ≤ 0.75bf 4.0 ≤ a ≤ 6.74
0.65db ≤ b ≤ 0.85db 15.54 ≤ b ≤ 20.31
0.1bf ≤ c ≤ 0.25bf 0.9 ≤ c ≤ 2.24
Initial assumptions: a = 6 in, b = 18 in, and c = 1.5 in
2. Calculate the moments at the column flange (Mf) induced by the RBS plastic moment (MPR).
𝐿’ = 𝐿 – 2𝑎 – 𝑑𝑐 – 𝑏 Eq. 2 𝑍𝑅𝐵𝑆 = 𝑍𝑋 – (2)(𝑐)(𝑡𝑓)(𝑑𝑏 – 𝑡𝑓) Eq. 3
𝑀𝑃𝑅 = 𝐶𝑃𝑅𝑅𝑌𝑍𝑅𝐵𝑆𝐹𝑌 Eq. 4
𝑉𝑃 = 𝑀𝑃𝑅
(𝐿′
2) Eq. 5
𝑀𝑓 = 𝑀𝑃𝑅 + (𝑉𝑃)(𝑎 +𝑏
2) Eq. 6
where “FY” is the yield strength of A992 Grade 50 steel, which is 50 Ksi. “L’” is the distance
between the two plastic hinges (middle of the flange cuts), and was found to be 315.3
inches. “ZX” and “ZRBS” are the plastic section moduli about the axis of bending (X- axis) for
the entire (uncut) section and the reduced section, which were found to be 200 in3 and
152.63 in3, respectively. “MPR” is the plastic moment of the RBS, calculated as 10,073.6 K-
in. “CPR” is the strain hardening factor and “RY” is the over strength factor of 1.2 and 1.1,
respectively. “VP” is the shear at the plastic hinge, and was determined to be 63.9 K.
Finally, “Mf” is the moment force at the column face determined from the linear
relationship of the shear force along the beam, and was calculated as 11,032 K-in.

55
3. Compare to the moment capacity at the column flange (MPf):
𝑀𝑃𝑓 = 𝑅𝑌𝑍𝑋𝐹𝑌 Eq. 7
“MPf” was found to be 11,000 K-in. The limit Mf < MPf was not satisfied, and therefore must
start over. To reduce Mf, we can either increase “c” and/or “b”, or decrease “a”.
1. The new RBS flange cut dimensions will be:
a = 5.5 in, b = 18 in, and c = 2 in
2. L’ = 316.3 in, ZRBS = 136.84 in3, MPR = 9,031.55 K-in, VP = 57.11 K, Mf = 9,859.61 K-in
3. The limit Mf < MPf was satisfied, therefore:
a = 5.5 in, b = 18 in, and c = 2 in
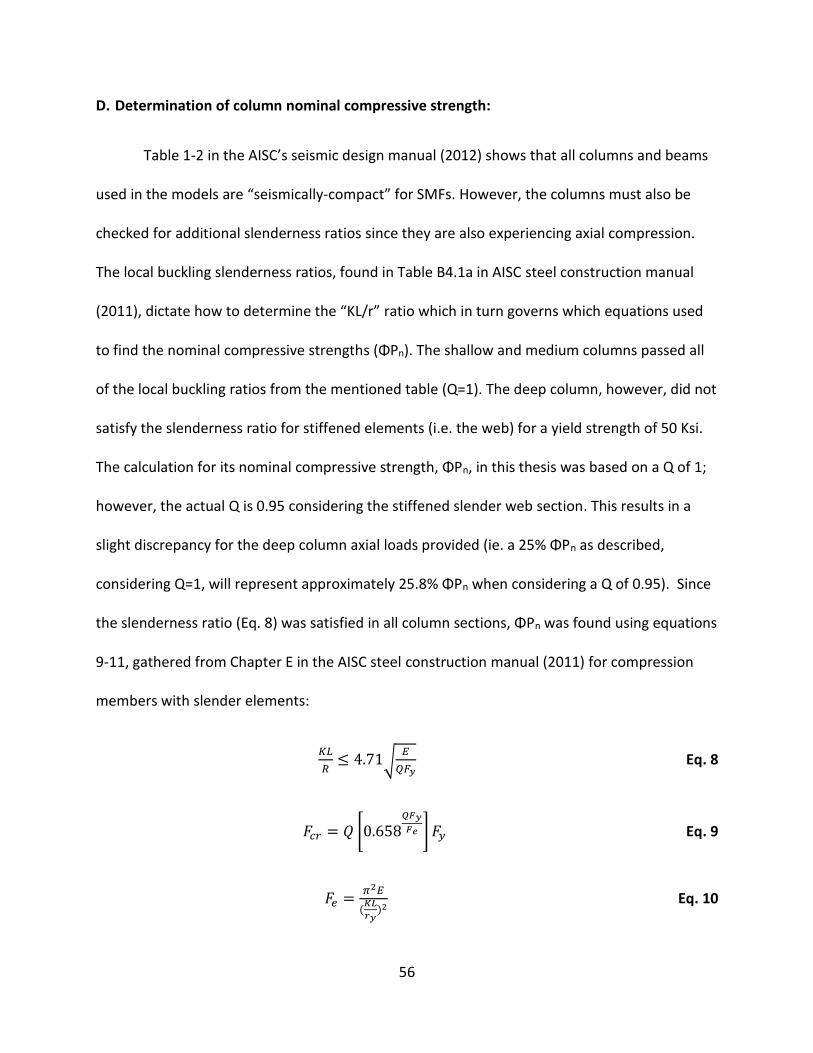
56
D. Determination of column nominal compressive strength:
Table 1-2 in the AISC’s seismic design manual (2012) shows that all columns and beams
used in the models are “seismically-compact” for SMFs. However, the columns must also be
checked for additional slenderness ratios since they are also experiencing axial compression.
The local buckling slenderness ratios, found in Table B4.1a in AISC steel construction manual
(2011), dictate how to determine the “KL/r” ratio which in turn governs which equations used
to find the nominal compressive strengths (ΦPn). The shallow and medium columns passed all
of the local buckling ratios from the mentioned table (Q=1). The deep column, however, did not
satisfy the slenderness ratio for stiffened elements (i.e. the web) for a yield strength of 50 Ksi.
The calculation for its nominal compressive strength, ΦPn, in this thesis was based on a Q of 1;
however, the actual Q is 0.95 considering the stiffened slender web section. This results in a
slight discrepancy for the deep column axial loads provided (ie. a 25% ΦPn as described,
considering Q=1, will represent approximately 25.8% ΦPn when considering a Q of 0.95). Since
the slenderness ratio (Eq. 8) was satisfied in all column sections, ΦPn was found using equations
9-11, gathered from Chapter E in the AISC steel construction manual (2011) for compression
members with slender elements:
𝐾𝐿
𝑅≤ 4.71√
𝐸
𝑄𝐹𝑦 Eq. 8
𝐹𝑐𝑟 = 𝑄 [0.658𝑄𝐹𝑦
𝐹𝑒 ] 𝐹𝑦 Eq. 9
𝐹𝑒 =𝜋2𝐸
(𝐾𝐿
𝑟𝑦)2
Eq. 10

57
ΦPn = (0.9)𝐹𝑐𝑟𝐴𝑔 Eq. 11
The nominal compressive strengths were found to be 1510, 880, and 1968 Kips for the
shallow (W14×132), medium (W18×86), and deep columns (W30×173), respectively.