Embed Size (px)
Citation preview
EFFECT OF CORPORATE SOCIAL RESPONSIBILITY ON THE PROFITABILITY
OF COMMERCIAL BANKS IN KENYA
DENNIS KIMANI MUCHAI
D63/61174/2013
A MANAGEMENT RESEARCH PROJECT SUMBITTED IN PARTIAL
FULFILLMENT OF THE REQUIREMENTS OF AWARD OF A MASTER OF
SCIENCE IN FINANCE,UNIVERSITY OF NAIROBI
OCTOBER, 2014

ii
DECLARATION
I, the undersigned, declare that this project is my original work and that it has not been
presented in any other university or institution for academic credit.
Signature .................................................... Date ....................................
This research project has been submitted for examination with our approval as university
supervisor.
Signature .................................................... Date ....................................
Supervisor
Dr. J.Aduda

iii
ACKNOWLEDGEMENT
First and foremost, I would wish to thank the almighty God for the free gift of life and for
guiding me; giving me strength, wisdom and the ability to successfully complete this study.
I am deeply indebted to my supervisor and lecturer Dr. Joshua Aduda from the University of
Nairobi whose help, stimulating suggestions and encouragement helped me in all the time of
this research.
My heartfelt appreciation also goes to my mum Mrs. Jane Muchai and my brothers for their
relentless support, sacrifices and encouragement during my studies. Their dedication,
understanding and vision were surely key to my researching level of my studies.
I would like to appreciate my friends who were always there.
To all of you, I say God bless you.

iv
DEDICATION
This project is dedicated to my late dad Mr. David Muchai and my mum Mrs. Jane W.
Muchai for her encouragement and support during the time of my studies.
v
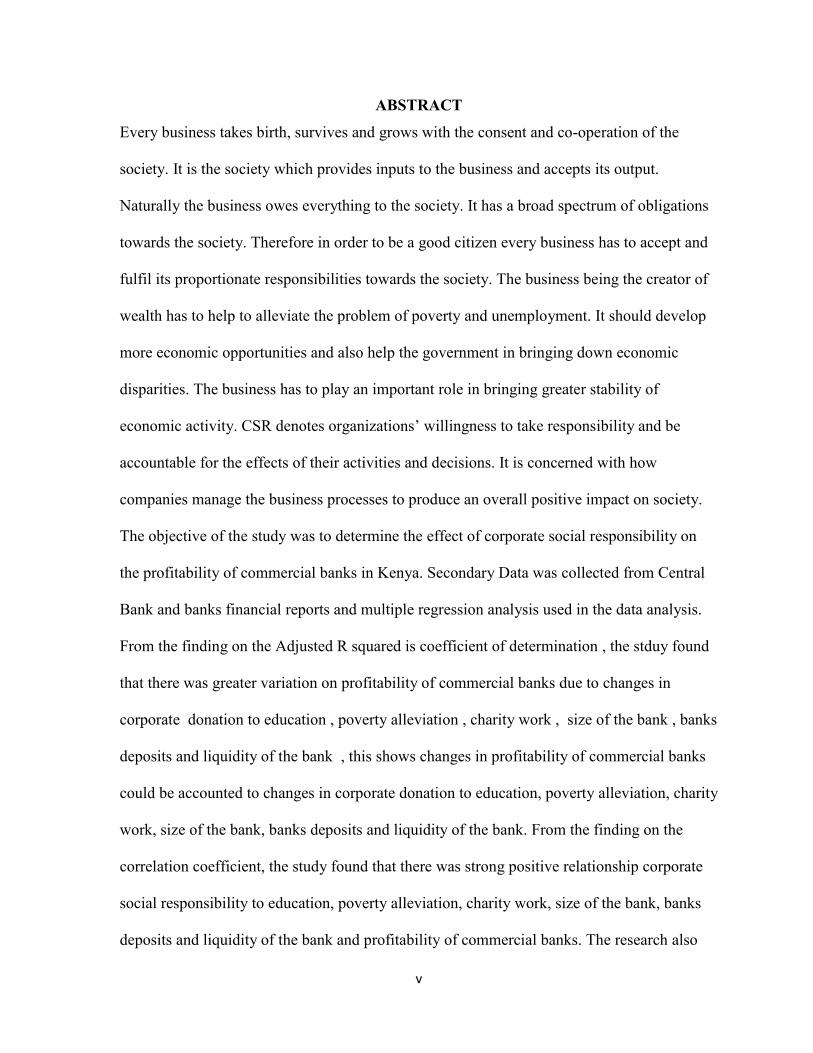
ABSTRACT
Every business takes birth, survives and grows with the consent and co-operation of the society. It is the society which provides inputs to the business and accepts its output. Naturally the business owes everything to the society. It has a broad spectrum of obligations towards the society. Therefore in order to be a good citizen every business has to accept and fulfil its proportionate responsibilities towards the society. The business being the creator of wealth has to help to alleviate the problem of poverty and unemployment. It should develop more economic opportunities and also help the government in bringing down economic disparities. The business has to play an important role in bringing greater stability of economic activity. CSR denotes organizations’ willingness to take responsibility and be accountable for the effects of their activities and decisions. It is concerned with how companies manage the business processes to produce an overall positive impact on society. The objective of the study was to determine the effect of corporate social responsibility on the profitability of commercial banks in Kenya. Secondary Data was collected from Central Bank and banks financial reports and multiple regression analysis used in the data analysis. From the finding on the Adjusted R squared is coefficient of determination , the stduy found that there was greater variation on profitability of commercial banks due to changes in corporate donation to education , poverty alleviation , charity work , size of the bank , banks deposits and liquidity of the bank , this shows changes in profitability of commercial banks could be accounted to changes in corporate donation to education, poverty alleviation, charity work, size of the bank, banks deposits and liquidity of the bank. From the finding on the correlation coefficient, the study found that there was strong positive relationship corporate social responsibility to education, poverty alleviation, charity work, size of the bank, banks deposits and liquidity of the bank and profitability of commercial banks. The research also

vi
revealed that contribution to community education lead to the organization’s profitability. The research revealed that financial contribution to the corporate social responsibility contributed to the organization’s profitability.
vii
TABLE OF CONTENTS
DECLARATION..................................................................................................................... ii
ACKNOWLDGEMENT ....................................................................................................... iii
DEDICATION........................................................................................................................ iv
ABSTRACT ............................................................................................................................. v
TABLE OF CONTENTS ..................................................................................................... vii
LIST OF TABLES ................................................................................................................. ix
LIST OF ABBREVIATIONS ................................................................................................ x
CHAPTER ONE: .................................................................................................................... 1
INTRODUCTION................................................................................................................... 1
1.1 Background to the Study ................................................................................................. 1
1.1.1 Corporate Social Responsibility ............................................................................... 2
1.1.2 Profitability of Commercial Banks ........................................................................... 4
1.1.3 Effect of Corporate Social Responsibility on the Profitability ................................. 5
1.1.4 Commercial Bank in Kenya ..................................................................................... 6
1.2 Research Problem ............................................................................................................ 7
1.3 Objective of the Study ..................................................................................................... 9
1.4 Value of the Study ......................................................................................................... 10
CHAPTER TWO: ................................................................................................................. 11
LITERATURE REVIEW .................................................................................................... 11
2.1 Introduction ................................................................................................................... 11
2.2 Theoretical Framework ................................................................................................. 11
2.2.1 Instrumental Theory ............................................................................................... 11
2.2.2 The Institutional Theory ......................................................................................... 11
2.2.3 The Shareholder Primacy Theory ........................................................................... 12
2.3 Determinant of Profitability of Commercial Banks ...................................................... 14
2.3.1 Deposits .................................................................................................................. 14
2.3.2 Capital Ratio ........................................................................................................... 15
2.3.3 Liquidity ratio ......................................................................................................... 16
2.3.4 Bank Size ................................................................................................................ 17
2.4 Empirical Review .......................................................................................................... 17
2.5 Summary of the Literature ............................................................................................ 23
CHAPTER THREE .............................................................................................................. 24
RESEARCH METHODOLOGY ........................................................................................ 24
3.1 Introduction ................................................................................................................... 24
3.2 Research Design ............................................................................................................ 24
3.3 Population...................................................................................................................... 24
3.4 Data Collection .............................................................................................................. 25
3.5 Data Analysis ................................................................................................................ 25
3.5.1 Analytical Model .................................................................................................... 25
viii
3.5.2 Test of Significance ................................................................................................ 26
CHAPTER FOUR: ............................................................................................................... 27
DATA ANALYSIS, RESULTS AND FINDINGS ............................................................. 27
4.1 Introduction ................................................................................................................... 27
4.2 Analysis and Interpretation ........................................................................................... 27
4.2.1 Regression For 2009 ............................................................................................... 27
4.2.2 Regression analysis for 2010 .................................................................................. 29
4.2.3 Regression Analsyis For 2011 ................................................................................ 32
4.2.4 Regression analsyis for 2012 .................................................................................. 34
4.2.5 Regression analsyis for year 2013 .......................................................................... 36
4.3 Summary and Interpretation of Findings ...................................................................... 38
CHAPTER FIVE: ................................................................................................................. 41
SUMMARY, CONCLUSIONS AND RECOMMENDATIONS ...................................... 41
5.1 Summary of Findings .................................................................................................... 41
5.2 Conclusion ..................................................................................................................... 42
5.3 Policy Recommendations .............................................................................................. 43
5.4 Limitation of the study .................................................................................................. 44
5.5 Areas For Further research ............................................................................................ 45
REFERENCES ...................................................................................................................... 46
APPENDICES ....................................................................................................................... 51
Appendix I: Introductory letter ........................................................................................... 51
Appendix II : Data Collection sheet .................................................................................... 52
Appendix III: List of Licensed Commercial Banks in Kenya ............................................. 53

ix
LIST OF TABLES
Table 4.1: Model Summary .................................................................................................... 27
Table 4.2: ANOVAa ................................................................................................................ 27
Table 4.3: Coefficients ........................................................................................................... 28

x
LIST OF ABBREVIATIONS
CFP Corporate Financial Performance
CRR Cash Reserve Ratio
CSR Corporate Social Responsibility
EMS Environmental Management Systems
KEPSS Kenya Electronic Payments and Settlement System
MT 102 Multiple third parties Message Type
MT 103 Single Third Party Message Type
MT 202 Inter-bank transfers
NPLs non-performing loans
1
CHAPTER ONE:
INTRODUCTION
1.1 Background to the Study
As a field of study in management, Corporate Social Responsibility (CSR) probably emerged
in the 1950s in the United States. Business practices in the 1900s that could be termed
socially responsible took different forms: philanthropic donations to charity, service to the
community, enhancing employee welfare and promoting religious conduct (Banerjee. 2009).
Before the twenty-first century, there was a common perception within and outside the
business world that the company’s sole social responsibility was to make as much profit as
possible, while community building and public services are the sole responsibility of the
government (Visser. Matten and Pohl. 2010).
Therefore, maximization of profit meant the maximization of the taxes paid by the company
to the government. This, in turn, could be spent on welfare, improving the society’s
wellbeing. With this traditional understanding, involving the company in CSR would be seen
as detrimental to both the company and society in general. None of the parties considered
CSR in any way related to their respective business or social activities (Visser et al. 2010).
Early proponents were CEOs and business leaders from the big oil and energy companies,
telecommunication corporations and automobile manufactures of the 1920s (Banerjee. 2009).
The ideology of CSR in the 1950s was primarily based on an assumption of the obligation of
business to society. This obligation arose because some scholars and practitioners saw
business as an instrument of society and managers as public trustees whose main job was to
2
balance often competing demands of employees, customers, suppliers, communities and
shareholders. The philosophy driving CSR discourses from the 1950s onwards was an
attempt to cultivate civic virtue in corporations. In the 1980s, the focus of CSR shifted from
CSR as obligation (“doing good to do good”) to CSR as strategy (“doing good to do well”)
(Banerjee. 2009).
1.1.1 Corporate Social Responsibility
CSR has gained an increasingly high profile in recent years. CSR can be defined as the ways
in which a business seeks to align its values and behaviors with those of its various stake
holders. The stake holders of a business includes the employees, customers, suppliers,
government, interest groups such as environmental groups and wider societal interests on
whom operations of the business may have an impact. There is a growing awareness that
companies cannot operate in isolation from the wider society in which they are located, and
that they need to consider the interests of groups other than shareholders if their longer term
sustainability is to be maintained (Mallin. 2009).
CSR is a commitment to improve community well-being through discretionary business
practices and contributions of corporate resources. Kotler and Lee (2011a). describe
community well-being to include human conditions as well as environmental issues (Kotler
& Lee. 2011a). A key element of this definition is the word discretion. It does not refer to
business activities that are mandated by law or that is moral or ethical in nature and perhaps
therefore expected; rather, it refers to a voluntary commitment a business makes in choosing
and implementing these practices and making these contributions. They further explain that
such a commitment must be demonstrated in order for a company to be described as socially
3
responsible This will be fulfilled through the adoption of new business practices and/or
contributions, either monetary or nonmonetary (Kotler & Lee. 2011).
CSR is a consistent pattern at the very least, of private firms doing more than they are willing
to do under applicable laws and regulations guiding and governing the environment, worker
safety and health and investments in the communities which they operate
(Hay, Stavins, & Vietor. 2005). In the last decade directional signal signs point to increased
corporate giving, increased corporate reporting on social responsibility initiatives, the
establishment of a corporate social norm to do good, and an apparent transition from giving
as an obligation to giving as a strategy (Kotler & Lee. 2011).
The role of business is rapidly changing. In today’s emerging global society, businesses have
embraced CSR as a value reflective of their new role in contributing to societal goals, but
also a strategy for improving the bottom line. Increasingly, business seeks to maintain
corporate identity while at the same time upholding social and environmental standards and
confronting the concerns of social exclusion and community development (Development,
2001. p. 3). A corporation adopts and conducts discretionary business practices and
investments that support social causes to improve community well-being and protect the
environment (Kotler & Lee. 2011). In the business community it is perhaps the view of many
that Corporate Social Responsibility (CSR) is the primary focus and that sustainability
belongs on the next level down. This may seem a little trite but it highlights one of the
potential conflicts that sit at the core of business strategy more importantly it demonstrates
the potential diversity of opinion (Hawkins. 2006. p. 1).
4
There continues to be confusion among business, media, civil society and academics about
what is meant by terms such as ‘corporate social responsibility’. While the term CSR is
widely used, it is often understood by journalists and others to refer only to a business’s
involvement in the community such as employee volunteering and corporate philanthropy,
whereas we understand that what is important is not what companies do with a small
percentage of their profits, but how they make all their profits; how business does its
business; how it behaves to employees, customers and suppliers; the impacts it has on the
environment and society, as well as on the communities in which it operates. CSR is a
business approach that creates long-term value to society at large, as well as to shareholders,
by embracing the opportunities and managing the risks associated with economic,
environmental and social developments; and builds this into corporate purpose and strategy
with transparency and accountability to stakeholders (Theaker. 2008).
1.1.2 Profitability of Commercial Banks
Financial performance refers to the measure of how well a firm can use assets from its
primary mode of business and generate revenue (Haber & Reichel. 2005). Different
perspectives of how to evaluate a firm’s financial performance have different theoretical
implications (Hillman and Keim. 2001). and each is subject to particular biases (Mc Guire,
Schneeweis, & Hill. 1986). In that manner, certain researchers have used market measures
(Alexander and Buchholz, 1978; Vance 1975), while others have put forth the accounting
measures (Waddock and Graves, 1997; Cochran and Wood, 1984). while some adopt both of
these (McGuire, Sundgreen, Schmeewei. 1988).
5
Focus of our analysis in this study wason accounting measures specifically Corporate Size
specifically on Return on Assets (ROA). The shortcoming of this approach is in sense that it
only captures historical data and aspects of a company (McGuire, Sundgren and Schneeweis.
1988). Such information is however subject to general managerial discretion of fund
allocation and thus reflects internal decision making capabilities and managerial
performance, rather than external market responses to organizational action (Cochrane,
1984).
1.1.3 Effect of Corporate Social Responsibility on the Profitability
The effect of CSR and CFP has raised argument among scholars (Dodd, 1932; Jarrel and
Peltzman, 1985; Hoffer et al., 1988; Preston and O’banno, 1997; Waddock and Graves. 1997;
Griffins and Mahon. 1997; McWilliams and Siegel. 2000; Simpsons and Kohers. 2002). As
previous literature has stated, the CSP and CFP effect of the relationship may be negative,
neutral or positive. The viewpoint for positive correlation between CSP and CFP suggest
that as a company’s explicit costs are opposite of the hidden costs of stakeholders, therefore,
this viewpoint is proposed from the perspective of avoiding cost to major stakeholders and
considering their satisfaction (Cornell and Shapiro. 1987). In addition, this theory further
infers that commitment to CSR would result to increased costs to competitiveness and
decrease the hidden cost of stakeholders who are necessary for the survival of the company.
Bowman and Haire. (1975). pointed out that some stakeholders’ regard CSR as a symbolic
management skill, namely, CSR is a symbol of reputation, and the company reputation was
improved by actions to support the community, resulting in positive influence on sales.
6
Therefore, when a company increases its costs by improving CSP in order to increase
competitive advantage, such CSR activities can enhance company reputation, thus, in the
long run CFP can be improved, by sacrificing the short term CFP; The viewpoint for negative
effect between CSR and CFP suggests that the fulfilment of CSR will bring competitive
disadvantages to the company (Aupperle et al. 1985). as the consequence costs may request
other methods or need to bear other costs. When carrying out CSR activities, increased costs
will result in little gain if measured in economic interests. When neglecting some
stakeholder, such as employed or the employees or environment, result in a lower CSP for
the enterprise, the CFP may be improved. Hence, Waddock and Graves (1997) indicated that
this theory was based on the assumption of negative effect of CSR and CFP.
1.1.4 Commercial Bank in Kenya
The Kenyan banking sector is of comprised 43 commercial banks, 1 mortgage finance
Company, 9 deposit taking microfinance institutions, 7 representative offices of foreign
banks, 105 foreign exchange bureaus and 2 credit reference bureaus as at October 31, 2013.
The banking sector balance sheet expanded by 13.2 percent from Kshs 2,316.1Billion in
October 2012 to Kshs 2,622.6 billion in October 2013. The key components of the balance
sheet on the asset side were loans and advances, government securities and placements,
which accounted for 56.9 percent, 22.1 percent and 5.1 percent of total assets, respectively.
The banking sector gross loans and advances grew from Kshs 1,340.7 billion in October
2012 to Kshs 1,549.9 billion in October 2013, which translated to a growth of 15.6 percent.
The growth was attributed to increase in lending to households, trade, manufacturing and real
7
estate sectors. Loans and advances net of provisions stood at Kshs 1,491.8 billion in October
2013, up from Kshs 1,290.4 billion registered in a similar period in 2012. Deposits from
customers which form the main source of funding for the banking sector, accounted for 72.7
percent of total funding liabilities. The deposit base increased by 10.3 percent from Kshs
1,728.7 billion in October 2012 to Kshs 1,906.3 billion in October 2013 largely supported by
aggressive mobilization of deposits by banks, remittances and receipts from exports.
The banking sector recorded improved capital levels in October 2013 with total shareholders’
funds growing by 20.9 percent from Kshs 342.3 billion in October 2012 to Kshs 413.7 billion
in October 2013. Consequently, the ratios of core and total capital to total risk-weighted
assets increased from 17.8 percent and 20.6 percent in October 2012 to 19.4 percent and 22.9
percent, respectively. The stock of gross non-performing loans (NPLs) increased by 32.2
percent from Kshs 62.5 billion in October 2012 to Kshs 82.7 billion in October 2013
attributed mainly to high interest rates and the reduced economic activities during the period
towards and after the March 2013 general elections. Similarly, the ratio of gross NPLs to
gross loans increased from 4.7 percent in October 2012 to 5.3 percent in October 2013.
1.2 Research Problem
Previous studies have been conducted on the effects of other aspects of CSR on the financial
performance of firms and have yielded different results. The literature has presented
arguments and evidence in three directions, a positive, a negative or a neutral relation
between various other CSR activities and corporate financial performance. Under the
stakeholder theory framework, argument is given that attention to the interests of the various
8
stakeholders of the corporation may improve a firm’s image and reputation, and that a firm’s
concerns about such interests are able to affect its productivity positively, financial
performance and value creation (Guan & Noronha. 2013).
Griffin and Mahon. (1997). and Margolis and Walsh. (2001, 2003). show the controversial
results about CSR -CFP relation which testifies for the need of further research. Margolis and
Walsh. (2001). has examined a group of studies, which utilised 27 distinct data sources.
While considering CSR as an independent variable, a series of works try to verify whether
CSR has the capacity to positively affect financial performance. Among the works revised by
Margolis and Walsh. (2001). 53 per cent of those searching a positive effect of the CSR on
CFP had confirmed that relationship (Guan & Noronha. 2013).
Recent investigation undertaken by Baron et al. (2009). demonstrates that these questions
remain un answered. These authors examine the connection between CSR and CFP
combining the variable’ Social Pressure’’ as a moderating factor of this relation. The
inclusion of this factor to the study leads to a neutral relation between CSR and CFP(Aras,
Aybars, & Kutlu. 2010). Another study was conducted by Orlitzky et al. (2003). who found a
strong correlation between corporate financial performance and corporate
social/environmental performance (Hay et al. 2005). Some argue that CSR activities increase
costs without sufficient offsetting benefits, hurt performance and compete with value-
maximizing activities. Examples of these additional costs include making charitable
donations, developing plans for community improvement, and establishing procedures to
reduce pollution (Sun. 2012).
9
A survey on eight UK supermarkets on CEO’s perspectives on CSR activities and financial
performance reported a significant negative relationship of the two variables. Nelling and
Webb. (2009). use the KLD index as the measure of CSR and return on assets (ROA) to
measure financial performance. They find no evidence that CSR is related to a firm’s
financial performance (Sun. 2012).
Many other CSR -financial performance studies document a positive relationship between
CSR and financial performance. Early work by Cochran and Wood. (1984). find a positive
link between CSR and financial performance. Cochran and Wood. (1984). point out that
more comprehensive measure of CSR are needed to further research in this area. McGuire et
al. (1988). document a positive association between CSR and accounting-based and market-
based financial performance measures (Sun. 2012). From the reviewed studies, the
conclusion is that CSR as a whole does not give a conclusive directional relationship with
financial performance of a business organization. The study therefore intends to study an
aspect of corporate social responsibility) and profitability and as an aspect of financial
performance in the banking industry.
1.3 Objective of the Study
To determine the effect of corporate social responsibility on the profitability of commercial
banks in Kenya.
10
1.4 Value of the Study
This research will increase the understanding of the relationship between corporate social
responsibility and the financial profitability of firms. The results should be of interest to
managers who contemplate engaging in corporate social responsibility activities, investors
and financial analysts who assess firm performance and policy makers who design and
implement guidelines on corporate social responsibility. The findings of this report will be
used to improve information available to relevant actors regarding the current situation
concerning corporate social responsibility practices in the Banking industry and how this is
related to the sectors profitability. This report will also seek to produce recommendations for
other firms willing to incorporate corporate social responsibility practices in their various
business operations.
The finding of the study will be of great importance to policy maker in the banking industry
as they will be enlightened on the effect of corporate social responsibility on the profitability
of commercial banks in Kenya. The study will also be of great importance to future scholars
and academicians as it will provide literature for future research as well as provide basis for
future research.
11
CHAPTER TWO:
LITERATURE REVIEW
2.1 Introduction
This chapter contains a review of literature regarding CSR practices in firms. In this chapter
the researcher will bring out what others have written about corporate social responsibility as
a corporate social responsibility activity.
2.2 Theoretical Framework
A theory can be described as a set of assumptions, propositions, or accepted facts that
attempt to provide a plausible or rational explanation of cause and effect relationship among
a group of observed phenomenon (Krishnaswami & Satyaprasad. (2010)).
2.2.1 Instrumental Theory
This theory assumed that the corporation is an instrument for wealth creation and that this is
its sole social responsibility. Only the economic aspect of the interactions between business
and society is considered. So any supposed social activity is accepted if, and only if, it is
consistent with wealth creation. This group of theories could be called instrumental theories
because they understand CSR as a mere means to the end of profits (Lanis & Richardson.
(2012)).
2.2.2 The Institutional Theory
Rather than seeing CSR purely as a realm of voluntary action, institutional theory suggests
seeking to place CSR explicitly within a wider field of economic governance characterized
by different modes, including the market, state regulation and beyond. While CSR measures
are often aimed at or utilize markets as a tool, institutional theories of the economy also see
12
markets themselves as being socially embedded within a wider field of social networks,
business associations and political rules. In particular, many of the most interesting
developments in CSR today play themselves out in a social space of private, but collective
forms of self-regulation (Kotler & Lee. 2011). Given that CSR includes the aspect of society
already in its very label; one would have thought that institutional theory would have been a
core conceptual lens in understanding the social responsibilities of business all along. After
all in its very definition, institutional CSR appears to be right at the center of what CSR is all
about (Hawkins. 2006).
2.2.3 The Shareholder Primacy Theory
Traditional shareholder primacy theory contends that a corporation is primarily responsible
to its shareholders to maximize wealth, consequently social factors should not interfere in a
corporations business operations. In the modern business setting however, a company’s core
objective of profit maximization must be underpinned by a proactive approach to CSR in
order to manage and mitigate a broader array of risk factors. Managing risk via community
engagement and the implementation of socially responsible strategies is increasingly linked
to business success and stakeholder confidence. Intangibles such as trust, ethics, corporate
culture, employee satisfaction, environmental behavior and community responsibility are
increasingly relevant to consumers, business partners, governments, special interest groups,
existing and potential employees and investors, (Corporate Social Responsibility. (2001)).
In the last two hundred years markets have unleashed a tremendous amount of innovation
and progress in the west. The industrial revolution, the rise of consumerism, and the dawn of
the global marketplace have each in their own way made life better for millions of people
13
(Kotler & Lee. 2011). Alongside the great strides forward are a set of deeply troubling issues.
Capitalism, understood in the sense of “how markets work” has also notoriously increased
the divide between the rich and poor, both within and across nations. We have become blind
to some of the consequences of our actions that are harmful to others, such as environmental
degradation, dominance of less privileged groups, and the inequitable distribution of
opportunities (Visser et al. 2010).
The fruits from these deeply troubling issues are beginning to germinate. Global warming,
global financial crises, and global terrorism threaten to destabilize our world. It is more
imperative than ever to study carefully and understand the power of markets and capitalism,
and begin the construction of a new narrative about how capitalism can be a force for good in
the world (Visser et al. 2010).
Stake holder theory can be seen as articulating a different and morally rich way of thinking
about disciplines of business. Stakeholder theories have been developed to address three
important and interrelated questions about business: how value is created, the nature of the
relationship between ethics and capitalism, and how managers can best think about their day-
to-day practices. The pursuit of these questions raises many more. The vocabulary for
stakeholders is not only good for addressing these three purposes, but for creating new
opportunities for practical and theoretical development as well (Visser et al. 2010).
14
2.3 Determinant of Profitability of Commercial Banks
According to Husni. (2011.) the internal determinants of banks profitability are normally
consisting of factors that are within the control of commercial banks. They are the factors
which affect the revenue and the cost of the banks. Some studies classified them into two
categories namely the financial statement variables and non-financial variables. External
factors are said to be the factors that are beyond the control of the management of
commercial banks. The external determinants of commercial banks profitability are indirect
factors, which are uncontrollable, but have an enormous impact on bank’s profitability.
According to Karkrah and Ameyaw. (2010). macroeconomic variables has been a major
components of the external profit determinants in most studies. The most external factors that
have been presented in most studies include competition/market share/firm size, inflation,
GDP growth, and interest rate; (Haron. Sudin. 2004).
2.3.1 Deposits
Banks are said to be heavily dependent on the funds mainly provided by the public as
deposits to finance the loans being offered to the customers. There is a general notion that
deposits are the cheapest sources of funds for banks and so to this extent deposits have
positive impact on banks profitability if the demand for bank loans is very high. That is, the
more deposits commercial bank is able accumulate the greater is its capacity to offer more
loans and make profits; Devinaga Rasiah. (2010). However, one should be aware that if
banks loans are not high in demand, having more deposits could decrease earnings and may
result in low profit for the banks. This is because deposits like Fixed, Time or Term deposits
attract high interest from the banks to the depositors, Devinaga Rasiah. (2010). Investigation
15
done by Husni. (2011). on the determinants commercial banks performance in Jordan
disclosed that there is significant positive relationship between ROA and Total liability to
total Assets. To capture deposits in the model Vong et al. (2009). presented the effect of
deposits (DETA) on profitability as deposits to total assets ratio.
2.3.2 Capital Ratio
Devinaga Rasiah. (2010). and Vong et al. (2009). included capital ratio (EQTA or CTRA) as
a variable in their study of determinants of banks profitability and performance because
capital also serve as a source of funds along with deposits and borrowings. They argue that
capital structure which includes shareholders’ funds, reserves and retained profit affect the
profitability of commercial banks because of its effect on leverage and risk. They
documented that, commercial banks assets could be also financed by either capital or debt.
Sufian. et al. (2008). argued that banks in developing countries needs a strong capital
structure, because it provides them strength to withstand financial crises and offers depositors
a better safety net in times of bankruptcy and distress macroeconomic conditions. And
according to Molyneux. (1992). banks with high level of equity can reduce their cost of
capital and that could impact positively on profitability. Empirical evidence presented by
Karkrah and Ameyaw. (2010). on profitability determinants of commercial banks in Ghana
revealed that the equity ratio which is the measure of the capital strength of the banks posted
a positive relation with the banks ROA.
16
2.3.3 Liquidity ratio
According to Devinaga Rasiah. (2010). commercial banks are required by regulators to hold
a certain level of liquidity assets. And the reason behind this regulation is to make sure that
the commercial banks always possess enough liquidity in order to be able to deal with bank
runs. He further argue that a bank assume the status of highly liquid only if it has been able to
accumulate enough cash and have in possession other liquid assets as well as having the
ability to raise funds quickly from other sources to be able to meet its payment obligation and
other financial commitments on time.
However, Devinaga Rasiah. (2010). asserted that the lower returns on liquid assets and
excessive fund which has not been invested may also negatively affect the profitability of
banks. And because of this, liquidity management serves as an important determinant of
commercial bank profitability. It may not be prudent for commercial banks to hold huge
amount of an idle funds because it deprive the banks of income and profitability. This is
because the more the banks turn funds into loans or invest them the more its accumulate
income and profit. This has been confirmed by the study of Eichengreen & Gibson. (2001).
which documented that the fewer the amount of funds tied up in liquid investment and the
liquid assets the higher the profitability. In order to capture liquidity ratio in profitability
model Devinaga Rasiah. (2010). used loan to deposit ratio (LIQ) as a proxy for liquidity. He
did this with the view that data on loans to deposits of commercial banks are normally
disclosed in their annual reports and also because the loans to deposit ratio can be calculated.
17
2.3.4 Bank Size
Both Vong et al. (2009). and Devinaga. (2010). included market share in their studies.
According to Devinaga. (2010). market share could be included in the profitability model as
an external determinant because if commercial banks could be able to expand their market
share then they may be able to increase their income as well hence profit. This is because the
ability to increase market share requires selling more so in the case of banking if commercial
banks are able to for example offer more loans to more customers then they stand a greater
chance of increasing interest income as well as profits.
Karkrah and Ameyaw. (2010). argues that the market share or size of banks is normally used
to capture potential economies or diseconomies of scale in the banking sector. Secondly, the
size of banks as a variable control for cost differences and product and risk diversification.
They argue that the first factor (economies or diseconomies of scale) is expected to lead to a
positive relationship between bank size and profitability if there are significant economies of
scale and their argument was based on the empirical evidence of Akhavein, Berger &
Humphrey (1997) Bourke (1989), Molyneux & Thornton (1992. This argument also seems to
be supported by the investigation of Andreas & Gabrielle (2011) on determinants of bank
profitability before and during the financial crisis in Switzerland.
2.4 Empirical Review
Mwai (2013) did a study on the impact of the corporate social responsibility on the corporate
financial performance in the corporate and NGO partnerships in Kenya. The Study attempted
to address the question whether Corporate Social Responsibility can be linked to corporate
financial performance of Corporate that engage in partnership with NGO. Using descriptive
18
research design and inferential analysis, the study tested the sign of the relationship between
Corporate Social Responsibility and Corporate financial performance in NGO-Corporate.
The study used data covering a five year period from 2008 to 2012. The target population
consisted of all the NGO and Corporate partnerships in Kenya. Stratified random sampling
was then used to select a sample of 6 Corporate engaged in partnership with the NGO.
Analysis was based on descriptive statistics using secondary data that was obtained. The
study also used multiple regression analysis to establish the relationship between the two
variables. Control variables of leverage and Cash Conversion Cycle were introduced in the
multiple regression models. The study found out a significant positive correlation between
Corporate Social Responsibility and Corporate Financial Performance of Corporate engaging
in partnership with NGO. The correlation result of the study model found a positive
correlation between Corporate Social Responsibility and with both Corporate Size (log of
assets) and Cash Conversion Cycle. Additionally, the correlation result found a negative
relationship between Corporate Social Responsibility and Leverage.
Oyenje. (2012). carried out a research to establish the relationship between CSR practices
and financial performance of Firms in the Manufacturing, Construction and Allied Sector of
the Nairobi Securities Exchange. Although the study was meant to be a census survey, non-
availability of complete data of the companies resulted to only 10 out of the 14 companies in
the sector being studied. Secondary data was obtained from the audited financial reports of
the companies for the period from 2007 to 2011. A multiple regression model was
established to determine the relationship between the two variables. Control variables of
manufacturing efficiency and capital intensity were also introduced in the regression model.
Her conclusion was that there existed a relationship between the independent variables (CSR
19
score, manufacturing efficiency and capital intensity) used in the model and dependent
variable (return on assets) with a correlation coefficient of 0.870. The results of the study
also showed that there was insignificant positive relationship between CSR practice and
financial performance. Financial performance and manufacturing efficiency was found to
have a significant linear inverse relationship.
Cheruiyot. (2010). aimed to explain the relationship between corporate social responsibility
and financial performance of firms listed at the Nairobi stock exchange. A 5 year study with
CSR index based on different level of implementation and dimensions was carried out in
order to address multidimensional CSR indicators. This was a cross sectional study of all the
47 listed companies in the NSE’s main segment as at 31st December 2009. Using regression
analysis he sought to establish the relationship between CSR index and financial performance
measured in terms of return on assets, return on equity and return on sales. He found that
there was a statistically significant relationship between CSR and financial performance. A
knowledge gap of using multidimensional CSR indicators to carry out a mulit-period study
therefore exist which studies the impact of CSR on financial performance. A 5 year study
with CSR index based on different level of implementation and dimensions was carried out
in order to address the limitations.
Obusubiri. (2006). aimed at explain the relationship between CSR and portfolio performance
in Kenya. He also found a positive relationship between CSR and portfolio performance. He
attributed this relationship to the good corporate image that comes with CSR making
investors prefer such companies implying that good CSR behaviour has a reputational benefit
for the practicing firm.
20
Pava and Krausz. (1996). aimed to explain the relationship between CSR and traditional
financial performance, through examining long-term financial performance. They used the
literature review in the first section to show that the paradox of social cost could be explained
by five explanations and used The CEP ratings, based on an assessment of 12 specific CSR
components as a measurement of (CSR), and then put the criteria for measurement of the
financial performance depend on market base, accounting base, measure of Risk, other firm
specific characteristic They took 53 company listed in Council on Economic Priorities (CEP)
socially response and compared the financial performance of this group with another group
as a control sample, which is similar in both size and industry, and they found a little
evidence to suggest a positive association between CSR and traditional financial
performance.
Preston and O’Bannon. (1997). analyzed the relationship between indicators of Social
Responsibilities and Financial Performance, through examining data from 67 large U.S
Corporation for 1982-1992, by using a typology and analysis; they used four trends in
discussing this relation 1) social impact hypothesis 2) Trade-off hypothesis 3) available Fund
and 4) Finally managerial opportunism hypothesis, and they found a strong positive
correlation either by positive synergies or by available funding.
Orlitzky. (2001). in this study the researcher investigated the relationship between CSP and
CFP regarding to level of the corporate size and the researcher for this purpose integrated
three variables of meta-analysis first: CSP and CFP , second: Total Cost of CSR activities
and CSP, third: Total Cost of CSR activities and CFP. The individual-link and fit analysis
suggest that organizational size has no significant path to CSP or CFP, and the only path that
cannot be dropped in these three variables model, is from CSP to CFP.
21
Mackey (2007). in this paper, the researchers built a theory on a sample observation that
equity holders may sometimes have interest besides simply maximizing their wealth when
they make their investment decisions. They developed a model adapting a market definition
of firm’s performance by focusing on how socially responsible corporate activities affect
firms market value. This model was used to describe the impact of the present value of firm’s
cash flow will have on the firm’s market value at the beginning or at the end of socially
responsible activities. The model suggests that there was a positive correlation between
firm’s choices about investing in socially responsible activities and firm’s value. The paper
provides an explanation of when the investment in these kinds of socially responsible
activities will occur.
Shen and Chang. (2009). The purpose of their study was to investigate the financial
performance with regarding to CSR and NON-CSR, they used a sample of Taiwan’s data
from 2005-2006, and used matching theory and propensity score matching methodology to
emphasize the effect of adapting CSR on financial performance and distinguish between two
a broach, first: the social impact hypothesis and the second: the shift of focus hypothesis.
They found a positive relation with the CFP regarding to CSP companies.
Surroca. (2010). examined the relationship between CSP and CFP with regarding to
intangible recourses, they advanced the understanding of the relationship between CSR and
CFP in three ways: theoretically, empirically, and methodologically. The main proposition of
this paper is that intangibles mediate the relationship between CRP and CFP which operates
in both directions, they used an international database provided by sustainalytic responsible
investment services, and their sample was 599 firms from 28 nations. The result of this study
22
shows positive associations between firm’s intangibles and both measures of performance
CSP and CFP.
Castro (2010). in this paper, it dealt with the specific issue of the strategic decisions through
studying the relationship between CSR and CFP. They used a panel based on the 658 firms
included in KLD database and covered 15 years (1991-2005), and used standard OLS
regression analysis. The result suggest that KLD doesn’t impact performance, the positive
impact found is due mainly to the fact that firms that adopted high standards of KLD self
selected themselves, that positive effect dilutes when Endogeneity is properly taken into
account.
Choi. (2008). studied the empirical relation between CSP and CFP in Korea, they used a
sample of 1222 firm during the years 2002-2008, and they measure CSP by both equal
weighted CSR index and stakeholders weighted CSR. The CFP was measured by (ROA),
(ROE) and (Topin’Q). They used cross-sectional regression model using four factors model
by analyzing whether investors can obtain abnormal returns by employing socially
responsible screens. They founded a positive and significant relationship between CFP and
stakeholders weighted (CSR) index but not the Equal weighted (CSR) index
23
2.5 Summary of Literature
CSR is an important issue which concerns about the ethics, society, natural environment,
employees and also working environment as a whole. The question of how CSR affects
financial performance of the firms is still being researched. Although there is evidence
showing positive relationship between CSR and financial performance, it still has some
limitation of conclusion and mixed results. Margolis and Walsh (2002) stated in review of 95
empirical studies conducted between 1972 to 2001 that when treated as an independent
variable, corporate social performance is found to have a positive relationship to financial
performance in 42 studies (53%), no relationship in 19 studies (24%), a negative relationship
in 4 studies (5%), and a mixed relationship in 15 studies (19%).
CSR emerge as a way for organization assume its responsibilities and contribute to a
sustainable development, it also raise the question about how can CSR positively affect
economic performance in a way that can generate resources to continually invest in social
and environmental demands. According to Waddock and Graves suggest that high levels of
financial performance can provide the resource necessary to invest in CSR practices
(Waddock and Graves 2011). Also Ullmann argued that in periods of low economic return,
companies have other priorities than investment in CSR which may suggest that a
satisfactory financial performance can have a positive influence in future commitment with
social responsibility practices (Balabanis, Phillips, Lyall, 1998). This study seek to determine
the effect of corporate social responsibility on the profitability of commercial banks in Kenya
24
CHAPTER THREE
RESEARCH METHODOLOGY
3.1 Introduction
This section presents the methods in data collection and analysis and forms the blue print for
conducting the research. It covered the research methodology, research design, population of
study, data collection and processing methods and data analysis.
3.2 Research Design
This was a descriptive survey of the commercial banks licensed in Kenya. According to
Mugenda and Mugenda (2006), a descriptive research is a process of collecting data in order
to answer questions concerning the status of the subjects in the study. The choice of the
survey will be due to the need for accuracy and statistically reliable data. This method was
chosen owing to the fact that all the head offices of all the commercial banks are located in
Nairobi hence it would be convenient to undertake a census of all the 43 commercial banks.
3.3 Population
The population of study consisted of all the licensed commercial banks in Kenya. According
to CBK (2013) there are 43 licensed commercial banks in Kenya (Appendix 1). Census
survey methodology of all the licensed commercial banks was used in order to increase
accuracy and reliability of data collected in this research.
25
3.4 Data Collection
Secondary data will be obtained from documents that include financial reports of commercial
banks operating in Kenya and annual CBK supervision reports it included data on the effect
of corporate social responsibility on the profitability of commercial banks in Kenya. This
data will be collected through a data collection form. Data was obtained for the last five years
from 2009 to 2013.
3.5 Data Analysis
The data to be collected is largely quantitative and hence a quantitative analysis technique
was used in data analysis. The descriptive and inferential statistics was used in analysis of
relationships, differences, trends and comparisons. Key to the research was establishing the
linkage between corporate social responsibility and profitability of commercial banks in
Kenya. Data was presented using tables in order to elaborate and to determine the effect of
corporate social responsibility on the profitability of commercial banks in Kenya
3.5.1 Analytical Model
The following regression analysis was used to determine the effect of corporate social
responsibility on the profitability of commercial banks in Kenya. The relationship equation
will be as shown below-
ROAit = α + β1EDit + β2PAit + β3CWit + β4SIZEit + β5 DETA it + β6LIQ πit
26
Where
ROA is the Return on Assets of the Bank’s total assets; it was measured by the ratio of EBIT
to Total assets, which will be used to measure banks profitability.
ED is the a measure of banks’ corporate donation to charity work that support education; it
was measured by ratio of total amount spent on education to total assets of the banks
PA is the a measure of banks’ corporate donation to support poverty alleviation; it was
measured by ratio of total amount spent on poverty alleviation to total assets of the banks
CW is the a measure of banks’ corporate donation to support charity work; it was measured
by ratio of total amount spent on charity work to total assets of the banks
SIZE is the size of the bank which represents the total assets of the bank; it was measured
using the Natural logarithm of total assets
DETA is the bank’s deposits, which was measured by the ratio of Deposits to total assets for
bank j in year t
LIQ is the liquidity of the bank; it was measured using the ratio of total Loans to total deposit
for bank j in year t
π= Error term
3.5.2 Test of Significance
Analsyis of Variance (ANOVA) was used to test the significance of the model, The
significance of the regression model was determined at 95% confidence interval and 5%
level of significance. Adjusted R squared was used to determine the variation in the
dependent variable due to changes in the independent variables.
27
CHAPTER FOUR:
DATA ANALYSIS, PRESENTATION AND FINDINGS
4.1 Introduction
This chapter presents the data findings to determine the effect of corporate social
responsibility on the profitability of commercial banks in Kenya. This data were collected
from the Central Bank of Kenya and banks financial reports. Multiple linear regressions were
used to determine the effect of corporate social responsibility on the profitability of
commercial banks in Kenya. The study covered a period of 5 years from years 2009 to 2013.
4.2 Analysis and Interpretation
In this study, a multiple regression analysis was conducted to test the influence among
predictor variables. The research used statistical package for social sciences (SPSS V 20) to
code, enter and compute the measurements of the multiple regressions
4.2.1 Regression For 2009
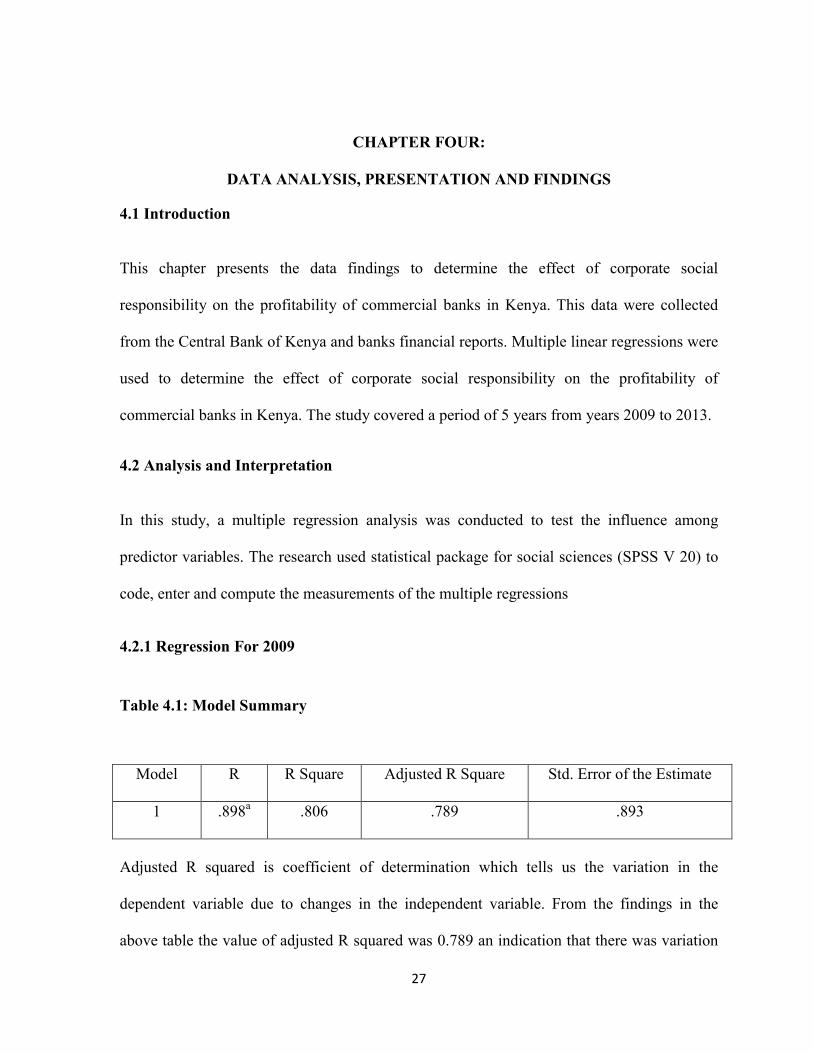
Table 4.1: Model Summary
Model R R Square Adjusted R Square Std. Error of the Estimate
1 .898a .806 .789 .893
Adjusted R squared is coefficient of determination which tells us the variation in the
dependent variable due to changes in the independent variable. From the findings in the
above table the value of adjusted R squared was 0.789 an indication that there was variation
28
of 78.9 percent on profitability of commercial banks due to changes in corporate donation to
education , poverty alleviation , charity work , size of the bank , banks deposits and liquidity
of the bank at 95 percent confidence interval . This shows that 78.9 percent changes in
profitability of commercial banks could be accounted to changes in corporate donation to
education, poverty alleviation, charity work, size of the bank, banks deposits and liquidity of
the bank. R is the correlation coefficient which shows the relationship between the study
variables, from the findings shown in the table above there was a strong positive relationship
between the study variables as shown by 0.898.
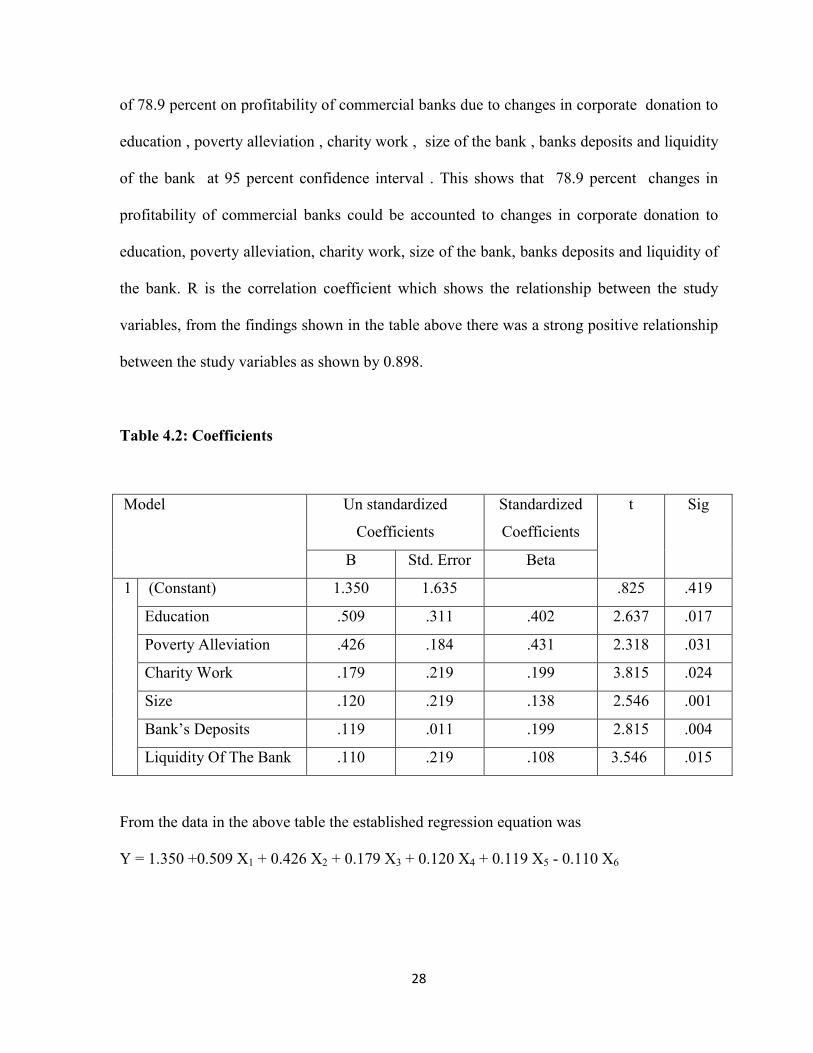
Table 4.2: Coefficients
Model Un standardized
Coefficients
Standardized
Coefficients
t Sig
B Std. Error Beta
1 (Constant) 1.350 1.635 .825 .419
Education .509 .311 .402 2.637 .017
Poverty Alleviation .426 .184 .431 2.318 .031
Charity Work .179 .219 .199 3.815 .024
Size .120 .219 .138 2.546 .001
Bank’s Deposits .119 .011 .199 2.815 .004
Liquidity Of The Bank .110 .219 .108 3.546 .015
From the data in the above table the established regression equation was
Y = 1.350 +0.509 X1 + 0.426 X2 + 0.179 X3 + 0.120 X4 + 0.119 X5 - 0.110 X6
29
From the above regression equation it was revealed that holding corporate donation to
education , poverty alleviation , charity work , size of the bank , banks deposits and liquidity
of the bank to a constant to a constant zero , profitability of commercial banks would be at
1.350, a unit increase in corporate donation to education would lead to increase in the
profitability of commercial banks by a factors of 0.509, unit increase in contribution to
poverty alleviation would lead to increase in profitability of commercial banks by factors of
0.426, a unit increase in charity work would lead to increase in profitability of commercial
banks by a factor of 0.179 , a unit increase in size of the bank would lead to increase in
profitability of commercial banks by a factors of 0.120, further unit increase bank deposit
would lead to increase in profitability of commercial bank by a unit of 0.119 a unit increase
in liquidity of the bank would lead to increase in profitability of the bank by a unit of 0.110.
All the variables were significant (p<0.05).
4.2.2 Regression analysis for 2010
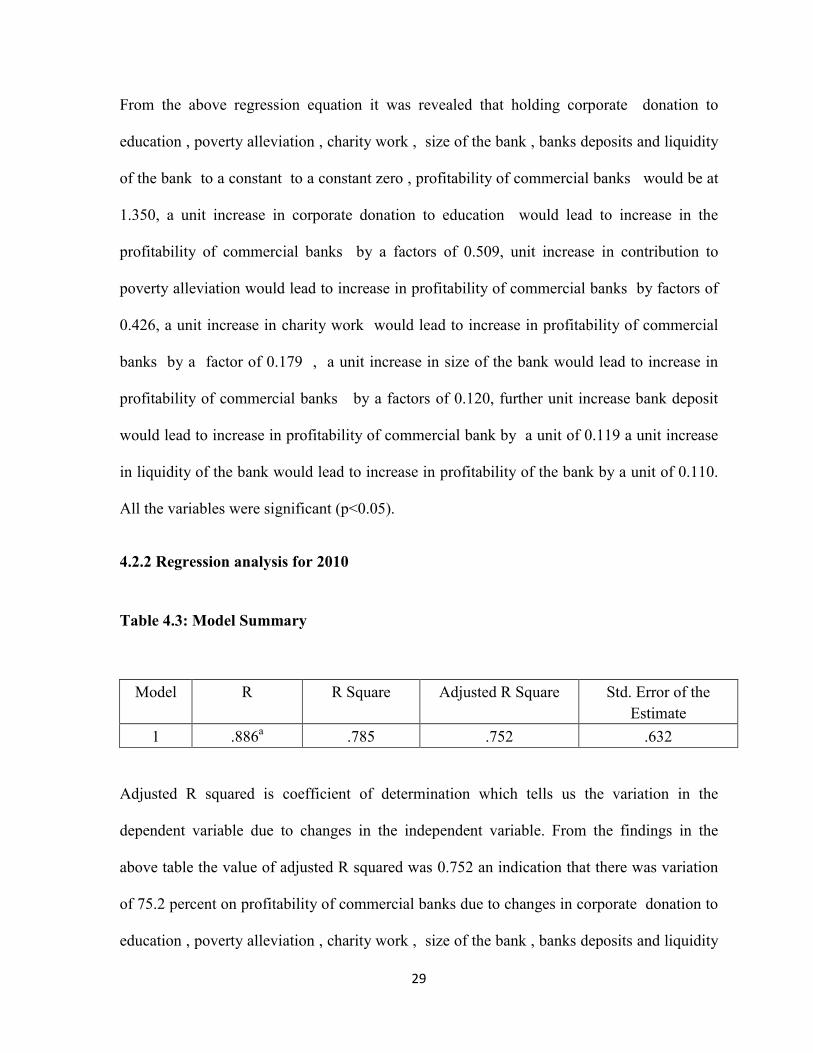
Table 4.3: Model Summary
Model R R Square Adjusted R Square Std. Error of the
Estimate
1 .886a .785 .752 .632
Adjusted R squared is coefficient of determination which tells us the variation in the
dependent variable due to changes in the independent variable. From the findings in the
above table the value of adjusted R squared was 0.752 an indication that there was variation
of 75.2 percent on profitability of commercial banks due to changes in corporate donation to
education , poverty alleviation , charity work , size of the bank , banks deposits and liquidity
30
of the bank at 95 percent confidence interval . This shows that 75.2 percent changes in
profitability of commercial banks could be accounted to changes in corporate donation to
education, poverty alleviation, charity work, size of the bank, banks deposits and liquidity of
the bank. R is the correlation coefficient which shows the relationship between the study
variables, from the findings shown in the table above there was a strong positive relationship
between the study variables as shown by 0.886.
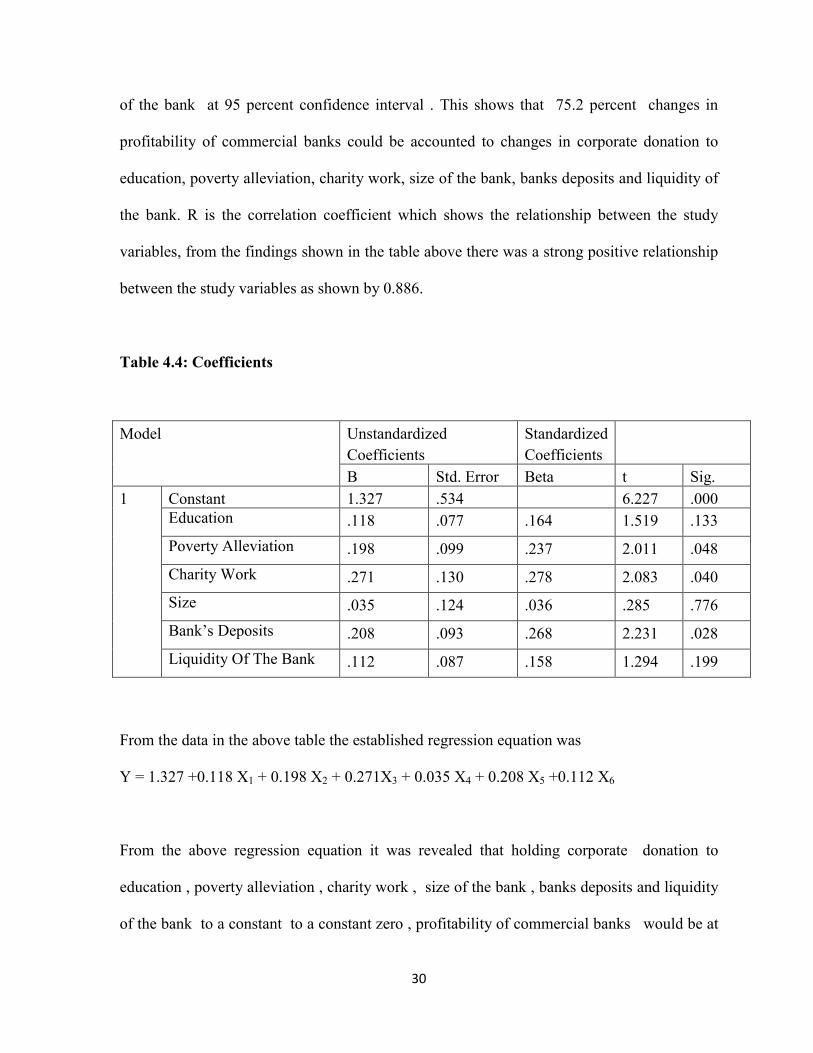
Table 4.4: Coefficients
Model Unstandardized
Coefficients
Standardized
Coefficients
B Std. Error Beta t Sig.
1 Constant 1.327 .534 6.227 .000 Education .118 .077 .164 1.519 .133
Poverty Alleviation .198 .099 .237 2.011 .048
Charity Work .271 .130 .278 2.083 .040
Size .035 .124 .036 .285 .776
Bank’s Deposits .208 .093 .268 2.231 .028
Liquidity Of The Bank .112 .087 .158 1.294 .199
From the data in the above table the established regression equation was
Y = 1.327 +0.118 X1 + 0.198 X2 + 0.271X3 + 0.035 X4 + 0.208 X5 +0.112 X6
From the above regression equation it was revealed that holding corporate donation to
education , poverty alleviation , charity work , size of the bank , banks deposits and liquidity
of the bank to a constant to a constant zero , profitability of commercial banks would be at
31
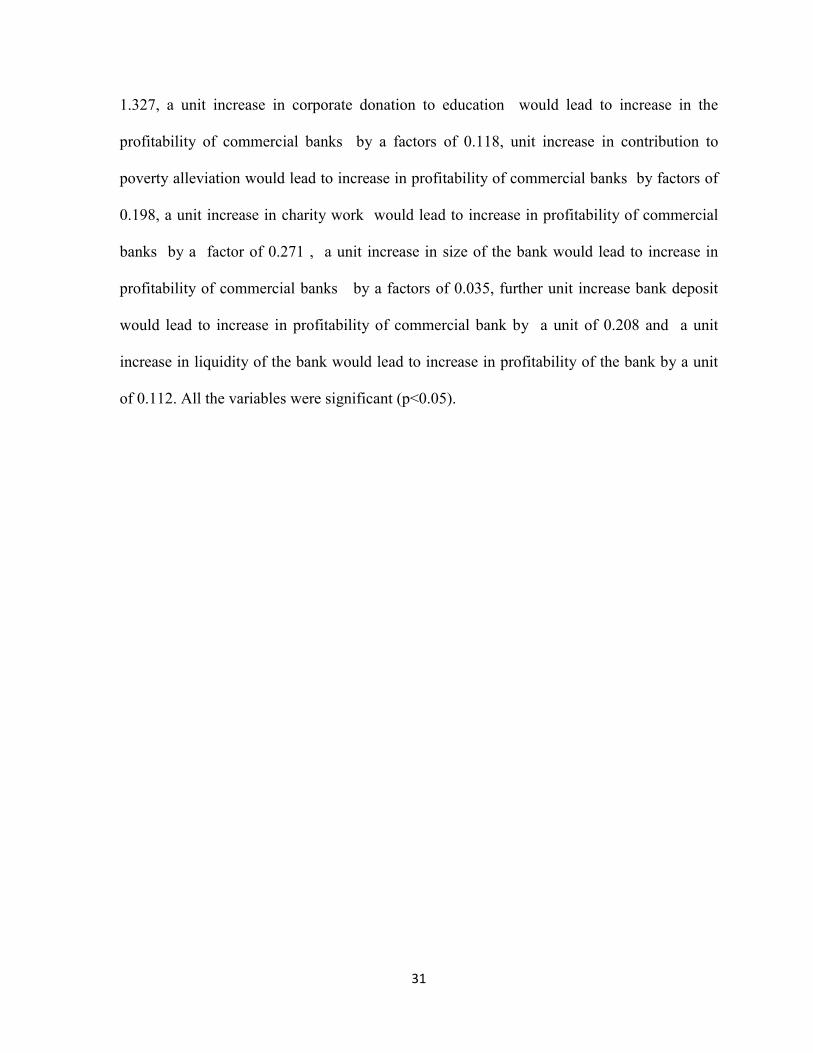
1.327, a unit increase in corporate donation to education would lead to increase in the
profitability of commercial banks by a factors of 0.118, unit increase in contribution to
poverty alleviation would lead to increase in profitability of commercial banks by factors of
0.198, a unit increase in charity work would lead to increase in profitability of commercial
banks by a factor of 0.271 , a unit increase in size of the bank would lead to increase in
profitability of commercial banks by a factors of 0.035, further unit increase bank deposit
would lead to increase in profitability of commercial bank by a unit of 0.208 and a unit
increase in liquidity of the bank would lead to increase in profitability of the bank by a unit
of 0.112. All the variables were significant (p<0.05).
32
4.2.3 Regression Analsyis For 2011
Table 4.5: Model Summary
Model R R Square Adjusted R Square Std. Error of the
Estimate
1 .832a .692 .653 .583
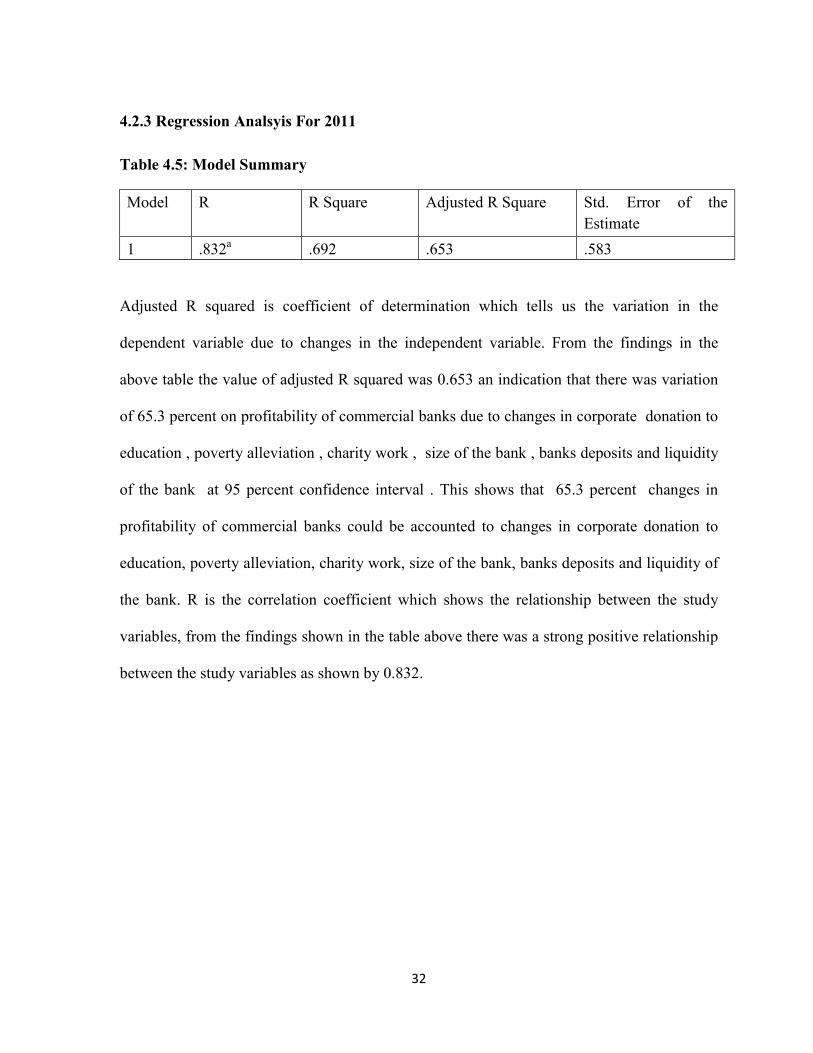
Adjusted R squared is coefficient of determination which tells us the variation in the
dependent variable due to changes in the independent variable. From the findings in the
above table the value of adjusted R squared was 0.653 an indication that there was variation
of 65.3 percent on profitability of commercial banks due to changes in corporate donation to
education , poverty alleviation , charity work , size of the bank , banks deposits and liquidity
of the bank at 95 percent confidence interval . This shows that 65.3 percent changes in
profitability of commercial banks could be accounted to changes in corporate donation to
education, poverty alleviation, charity work, size of the bank, banks deposits and liquidity of
the bank. R is the correlation coefficient which shows the relationship between the study
variables, from the findings shown in the table above there was a strong positive relationship
between the study variables as shown by 0.832.
33
Table 4.6: Coefficients
Model Unstandardized
Coefficients
Standardized
Coefficients
B Std. Error Beta t Sig.
1 Constant 2.809 .519 5.414 .000 Education .012 .049 .026 .256 .799
Poverty Alleviation .016 .099 .024 .166 .868
Charity Work .102 .078 .164 1.301 .197
Size .088 .104 .104 .844 .401
Bank’s Deposits .058 .100 .075 .573 .568
Liquidity Of The Bank .162 .092 .188 1.757 .083
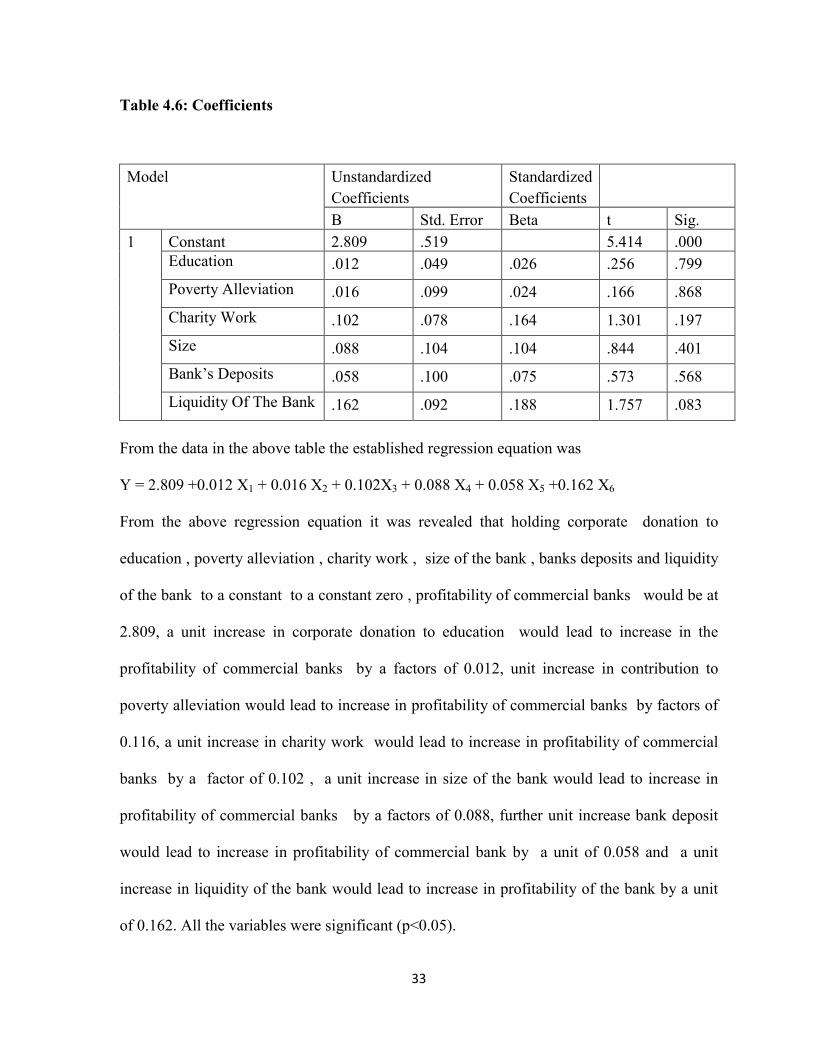
From the data in the above table the established regression equation was
Y = 2.809 +0.012 X1 + 0.016 X2 + 0.102X3 + 0.088 X4 + 0.058 X5 +0.162 X6
From the above regression equation it was revealed that holding corporate donation to
education , poverty alleviation , charity work , size of the bank , banks deposits and liquidity
of the bank to a constant to a constant zero , profitability of commercial banks would be at
2.809, a unit increase in corporate donation to education would lead to increase in the
profitability of commercial banks by a factors of 0.012, unit increase in contribution to
poverty alleviation would lead to increase in profitability of commercial banks by factors of
0.116, a unit increase in charity work would lead to increase in profitability of commercial
banks by a factor of 0.102 , a unit increase in size of the bank would lead to increase in
profitability of commercial banks by a factors of 0.088, further unit increase bank deposit
would lead to increase in profitability of commercial bank by a unit of 0.058 and a unit
increase in liquidity of the bank would lead to increase in profitability of the bank by a unit
of 0.162. All the variables were significant (p<0.05).
34
4.2.4 Regression analsyis for 2012
Table 4.7: Model Summary
Model R R Square Adjusted R Square Std. Error of the
Estimate
1 .757a .573 .526 .805
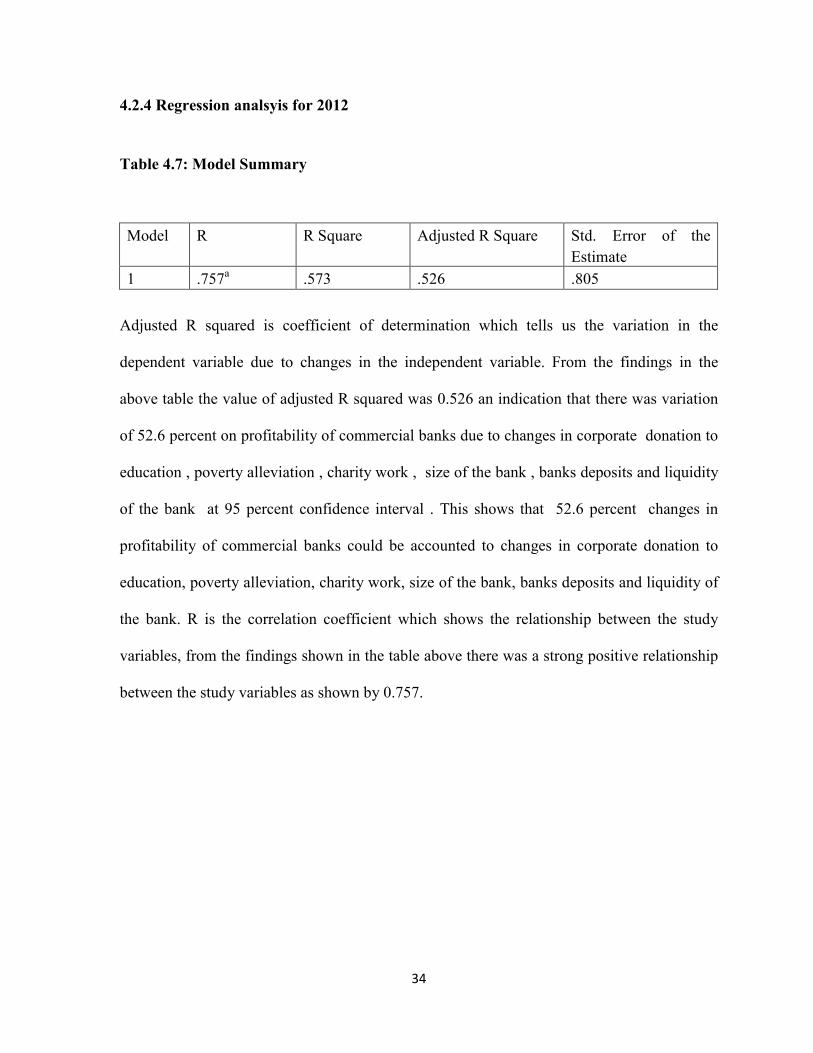
Adjusted R squared is coefficient of determination which tells us the variation in the
dependent variable due to changes in the independent variable. From the findings in the
above table the value of adjusted R squared was 0.526 an indication that there was variation
of 52.6 percent on profitability of commercial banks due to changes in corporate donation to
education , poverty alleviation , charity work , size of the bank , banks deposits and liquidity
of the bank at 95 percent confidence interval . This shows that 52.6 percent changes in
profitability of commercial banks could be accounted to changes in corporate donation to
education, poverty alleviation, charity work, size of the bank, banks deposits and liquidity of
the bank. R is the correlation coefficient which shows the relationship between the study
variables, from the findings shown in the table above there was a strong positive relationship
between the study variables as shown by 0.757.

35
Table 4.8: Coefficients
Model Unstandardized
Coefficients
Standardized
Coefficients
B Std. Error Beta t Sig.
1 Constant 2.385 .408 3.944 .348 Education .209 .089 .222 2.347 .021
Poverty Alleviation .069 .095 .080 .732 .466
Charity Work .134 .097 .135 1.375 .173
Size .270 .091 .269 2.951 .004
Bank’s Deposits .022 .092 .019 .236 .814
Liquidity Of The Bank .210 .118 .182 1.769 .081
From the data in the above table the established regression equation was
Y = 2.385 + 0.209X1 + 0.069 X2 + 0.134X3 + 0.270 X4 + 0.022 X5 +0.210X6
From the above regression equation it was revealed that holding corporate donation to
education , poverty alleviation , charity work , size of the bank , banks deposits and liquidity
of the bank to a constant to a constant zero , profitability of commercial banks would be at
2.385, a unit increase in corporate donation to education would lead to increase in the
profitability of commercial banks by a factors of 0.209, unit increase in contribution to
poverty alleviation would lead to increase in profitability of commercial banks by factors of
0.069, a unit increase in charity work would lead to increase in profitability of commercial
banks by a factor of 0.134 , a unit increase in size of the bank would lead to increase in
profitability of commercial banks by a factors of 0.270, further unit increase bank deposit
would lead to increase in profitability of commercial bank by a unit of 0.022 and a unit
increase in liquidity of the bank would lead to increase in profitability of the bank by a unit
of 0.210. All the variables were significant (p<0.05).
36
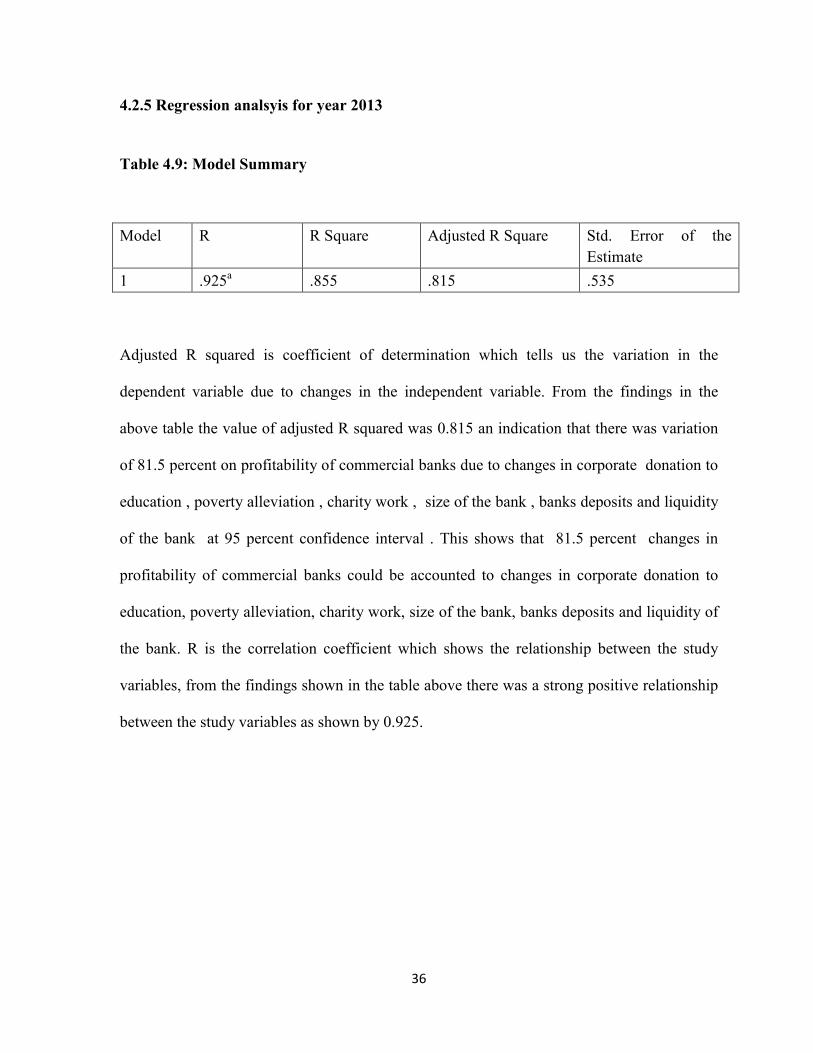
4.2.5 Regression analsyis for year 2013
Table 4.9: Model Summary
Model R R Square Adjusted R Square Std. Error of the
Estimate
1 .925a .855 .815 .535
Adjusted R squared is coefficient of determination which tells us the variation in the
dependent variable due to changes in the independent variable. From the findings in the
above table the value of adjusted R squared was 0.815 an indication that there was variation
of 81.5 percent on profitability of commercial banks due to changes in corporate donation to
education , poverty alleviation , charity work , size of the bank , banks deposits and liquidity
of the bank at 95 percent confidence interval . This shows that 81.5 percent changes in
profitability of commercial banks could be accounted to changes in corporate donation to
education, poverty alleviation, charity work, size of the bank, banks deposits and liquidity of
the bank. R is the correlation coefficient which shows the relationship between the study
variables, from the findings shown in the table above there was a strong positive relationship
between the study variables as shown by 0.925.
37
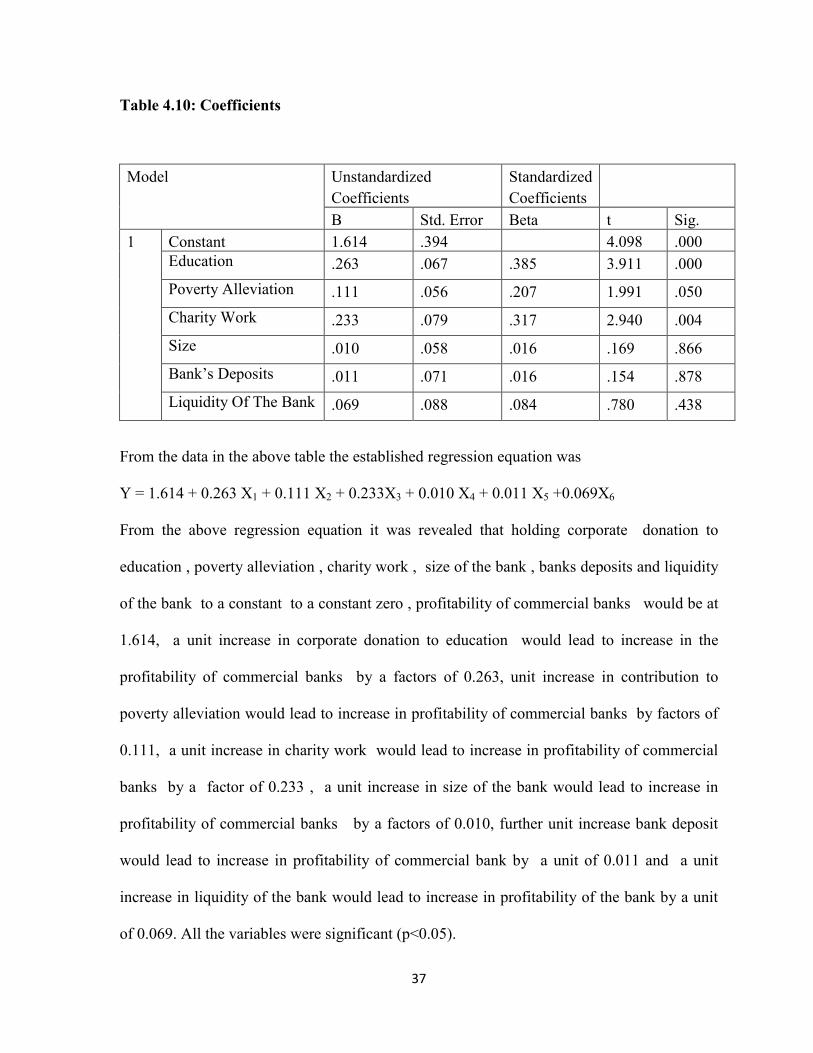
Table 4.10: Coefficients
Model Unstandardized
Coefficients
Standardized
Coefficients
B Std. Error Beta t Sig.
1 Constant 1.614 .394 4.098 .000 Education .263 .067 .385 3.911 .000
Poverty Alleviation .111 .056 .207 1.991 .050
Charity Work .233 .079 .317 2.940 .004
Size .010 .058 .016 .169 .866
Bank’s Deposits .011 .071 .016 .154 .878
Liquidity Of The Bank .069 .088 .084 .780 .438
From the data in the above table the established regression equation was
Y = 1.614 + 0.263 X1 + 0.111 X2 + 0.233X3 + 0.010 X4 + 0.011 X5 +0.069X6
From the above regression equation it was revealed that holding corporate donation to
education , poverty alleviation , charity work , size of the bank , banks deposits and liquidity
of the bank to a constant to a constant zero , profitability of commercial banks would be at
1.614, a unit increase in corporate donation to education would lead to increase in the
profitability of commercial banks by a factors of 0.263, unit increase in contribution to
poverty alleviation would lead to increase in profitability of commercial banks by factors of
0.111, a unit increase in charity work would lead to increase in profitability of commercial
banks by a factor of 0.233 , a unit increase in size of the bank would lead to increase in
profitability of commercial banks by a factors of 0.010, further unit increase bank deposit
would lead to increase in profitability of commercial bank by a unit of 0.011 and a unit
increase in liquidity of the bank would lead to increase in profitability of the bank by a unit
of 0.069. All the variables were significant (p<0.05).
38
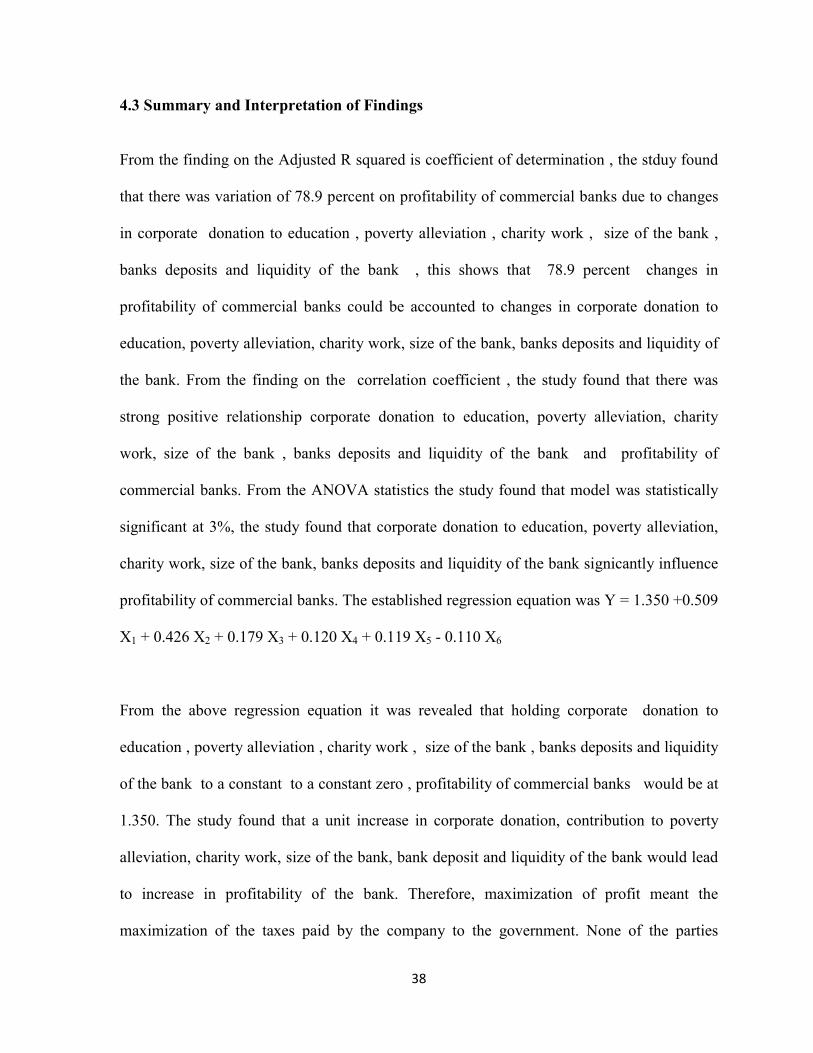
4.3 Summary and Interpretation of Findings
From the finding on the Adjusted R squared is coefficient of determination , the stduy found
that there was variation of 78.9 percent on profitability of commercial banks due to changes
in corporate donation to education , poverty alleviation , charity work , size of the bank ,
banks deposits and liquidity of the bank , this shows that 78.9 percent changes in
profitability of commercial banks could be accounted to changes in corporate donation to
education, poverty alleviation, charity work, size of the bank, banks deposits and liquidity of
the bank. From the finding on the correlation coefficient , the study found that there was
strong positive relationship corporate donation to education, poverty alleviation, charity
work, size of the bank , banks deposits and liquidity of the bank and profitability of
commercial banks. From the ANOVA statistics the study found that model was statistically
significant at 3%, the study found that corporate donation to education, poverty alleviation,
charity work, size of the bank, banks deposits and liquidity of the bank signicantly influence
profitability of commercial banks. The established regression equation was Y = 1.350 +0.509
X1 + 0.426 X2 + 0.179 X3 + 0.120 X4 + 0.119 X5 - 0.110 X6
From the above regression equation it was revealed that holding corporate donation to
education , poverty alleviation , charity work , size of the bank , banks deposits and liquidity
of the bank to a constant to a constant zero , profitability of commercial banks would be at
1.350. The study found that a unit increase in corporate donation, contribution to poverty
alleviation, charity work, size of the bank, bank deposit and liquidity of the bank would lead
to increase in profitability of the bank. Therefore, maximization of profit meant the
maximization of the taxes paid by the company to the government. None of the parties
39
considered CSR in any way related to their respective business or social activities (Visser et
al., 2010). CSR has gained an increasingly high profile in recent years. There is a growing
awareness that companies cannot operate in isolation from the wider society in which they
are located, and that they need to consider the interests of groups other than shareholders if
their longer term sustainability is to be maintained (Mallin. 2009).
CSR is a commitment to improve community well-being through discretionary business
practices and contributions of corporate resources. Kotler and Lee (2011a) describe
community well-being to include human conditions as well as environmental issues (Kotler
& Lee, 2011). CSR is a consistent pattern at the very least, of private firms doing more than
they are willing to do under applicable laws and regulations guiding and governing the
environment, worker safety and health and investments in the communities which they
operate (Hay. Stavins AND Vietor. 2005).
The role of business is rapidly changing. Increasingly, business seeks to maintain corporate
identity while at the same time upholding social and environmental standards and
confronting the concerns of social exclusion and community development (Development,
2001). In the business community it is perhaps the view of many that Corporate Social
Responsibility (CSR) is the primary focus and that sustainability belongs on the next level
down. This may seem a little trite but it highlights one of the potential conflicts that sit at the
core of business strategy more importantly it demonstrates the potential diversity of opinion
(Hawkins, 2006).
40
The concept of Corporate Social Responsibility has been defined in various ways by many
practitioners and scholars like. Bowen (1953) holds that social responsibility refers to
obligations to pursue those policies to make decisions or to follow those lines of actions that
are desirable in terms of objectives and values of society. Cannon (1994) looks at Corporate
Social Responsibility as being a result of the internal regulation of the business in compliance
with the obligations placed on the firm by legislation, ownership and control. Carroll (1996)
identifies four components that need to be present in order for business to claim it is socially
responsible: These are economic, legal, ethical and philanthropic responsibilities. Gustavson
(2008) considers the management of ecological and social challenges and the widespread
adoption of the language of sustainability by the corporate sector to be the genesis of
Corporate Social Responsibility.
Nordberg (2008) contends that corporate governance is an ethical debate where directors
decide on the allocation of resources to competing demands. Panayiotou (2009) views
corporate social responsibility in three ways: The economic view is concerned with
profitability, wages and benefits, resource usage, job offerings and outsourcing. The
environmental view is on processes, products and services related to the environment while
the social view focuses on health and safety issues, employee relations, ethics, human rights
and working conditions.
41
CHAPTER FIVE:
SUMMARY, CONCLUSIONS AND RECOMMENDATIONS
5.1 Summary of Findings
The objective of the study was to determine the effect of corporate social responsibility on
the profitability of commercial banks in Kenya. Secondary Data was collected from Central
Bank and banks financial reports and multiple regression analysis used in the data analysis.
From the finding on the Adjusted R squared is coefficient of determination , the stduy found
that there was greater variation on profitability of commercial banks due to changes in
corporate donation to education , poverty alleviation , charity work , size of the bank , banks
deposits and liquidity of the bank , this shows changes in profitability of commercial banks
could be accounted to changes in corporate donation to education, poverty alleviation, charity
work, size of the bank, banks deposits and liquidity of the bank. From the finding on the
correlation coefficient , the study found that there was strong positive relationship corporate
donation to education, poverty alleviation, charity work, size of the bank , banks deposits and
liquidity of the bank and profitability of commercial banks. From the above regression
equation, the study found that a unit increase in corporate donation, contribution to poverty
alleviation, charity work and size of the bank, bank deposit and liquidity of the bank would
lead to increase in profitability of the bank. The study established that corporate donation to
charity work has contributed towards the bank’s profitability. The study revealed that
organizations contribution to poverty alleviation leads to profitability. The research also
revealed that contribution to community education lead to the organization’s profitability.
42
5.2 Conclusion
From the findings the study established that corporate donation to charity work has
contributed towards the bank’s profitability thus the study concludes that corporate donation
to charity work had a positive influence on the profitability of Commercial Banks in Kenya.
The study revealed that organizations contribution to poverty alleviation leads to profitability
thus the study concludes that contribution to poverty alleviation has a positive influence on
the profitability of Commercial Banks in Kenya.
The research also revealed that contribution to community education lead to the
organization’s profitability thus the study concludes that supporting education had a positive
impact on the profitability of Commercial Banks in Kenya.
The research revealed that financial contribution to the corporate social responsibility
contributed to the organization’s profitability thus the research concludes that financial
contribution to corporate social responsibility had a positive impact on the profitability of
Commercial Banks in Kenya.
The study also found that through Corporate Social responsibility there is enhance reputation
management. The study established that reputation management influence corporate financial
performance in the organization, The study found that reputation management enables a
company to charge a premium for products and services, enables the benefits of positive
relationships to deliver business advantage, helps companies to build customers trust thereby
increasing sales, a good reputation demonstrably increases corporate worth and provides
sustained competitive advantage.
43
5.3 Policy Recommendations
From the findings and conclusion the study recommends that the organization can influence
its corporate financial performance by engaging in various Corporate Social responsibility
activities as this will help it build it reputation and also gain competitive advantage and thus
higher productivity.
There is need for the organization to provide their employees with training as this will
enhance their creativity and thus increase in the innovativeness in the organization thus
enhancing financial performance in the organization.
From the findings and conclusion the study recommends that the organization can influence
its corporate financial performance by engaging in various Corporate Social responsibility
activities as this will help it build it reputation and also gain competitive advantage and thus
higher productivity.
There is need for the organization to provide their employees with training as this will
enhance their creativity and thus increase in the innovatiness in the organisation thus
enhancing financial performance in the organization.
Employee of any organization are highly involved in Corporate Social Responsibility
activities , there is need for commercial in kenya to enhance their employees skills as
employees ideas and creativity and their involvement help in enhancing the success of
corporate social responsibility activities .
44
5.4 Limitation of the study
This study was limited to the precision of data obtained from central bank of Kenya and
banks financial reports, secondary data was extracted on the effect of corporate social
responsibility on the profitability of commercial banks in Kenya.
The study was limited to the effect of corporate social responsibility on the profitability of
commercial banks in Kenya in attaining its objective the study was limited to 5 years period
starting form year 2009 to year 2013.
The study was based on a five year study period from the year 2009 to 2013, a longer
duration of time would have captured longer duration more data and probably given more
reliable results in the study. This may have probably given a longer time focus hence given a
broader dimension to the problem.
The study was limited to 43 Commercial Banks in Kenya in order to determine the effect of
corporate social responsibility on the profitability of commercial banks in Kenya.
45
5.5 Areas For Further research
The study recommends an in-depth study to be carried out on the challenges faced by
organization as they implement Corporate Social Responsibility in the country.
The study recommends that a study should be conducted to establish the real value in
monetary terms how much Corporate Social Responsibility contribute to profitability of
Commercial Banks in Kenya.
Corporate Social Responsibility is used by the organization to enhance their reputation in the
market. The study recommends that a study should be done on the role of corporate social
responsibility in enhancing corporate reputation.
The study recommends that a study should be conducted on the impact of legislation on
adoption of corporate social responsibility by Companies in Kenya.
46
REFERENCES
Andreas,R.H and Gabrielle. R. (2011), Mortgage Finance in Denmark. The Association of
Danish Mortgage Banks. November
Aras, G. Aybars A., & Kutlu, O. (2010). Managing corporate performance: Investigating the
relationship between corporate social responsibility and financial performance in
emerging markets. International Journal of Productivity and Performance
Management, 59(3), 229–254.
Banerjee. S. B. (2009). Corporate Social Responsibility: The Good, the Bad and the Ugly.
Edward Elgar Publishing.
Bourke.G.P.(1989). The removal of mortgage market constraints and the implications for
Econometric Modelling of UK House Prices, Oxford Bulletin , 25,52.
Castro. H (2010). Corporate Social Responsibility in Europe and the U.S: Insights from
Businesses’ Self-Presentations.
Chen. H. & Wang. X. (2011). Corporate social responsibility and corporate financial
performance in China: an empirical research from Chinese firms. Corporate
Governance, 11(4), 361–370.
Cheruiyot.R (2010). The relationship between corporate social responsibility and financial
performance of firms listed at the Nairobi stock exchange. Unpublished MBA Thesis
University of Nairobi.
Choi. R (2008). Corporate social responsibility: A case study approach. Chaltenham:
Edward Elgar Publishing Limited.
Cooper. D. & Schindler. P. (2008). Business Research Methods. Irwin/McGraw-Hill Inc.
Corporate Social Responsibility: A Dutch Approach. (2001). Uitgeverij Van Gorcum.
47
Crowther. D. & Aras. G. (2010). Handbook of Corporate Governance and Social
Responsibility. Farnham, Surrey, GBR: Ashgate Publishing Group. Retrieved from
http://site.ebrary.com/lib/stpaulslimuru/docDetail.action?docID=10367801
Crowther. D. & Capaldi. N. (2008). Ashgate Research Companion to Corporate Social
Responsibility. Abingdon, Oxon, GBR: Ashgate Publishing Group. Retrieved from
http://site.ebrary.com/lib/stpaulslimuru/docDetail.action?docID=10240619
Development. O. for E. C. and. (2001). Corporate Social Responsibility: Partners for
Progress ; [ Held in Paris in November 2000 ]. OECD Publishing.
Devinaga. R. . (2010). Theoretical Framework of Profitability as Applied to Commercial
Banks in Malaysia; European Journal of Economics, Finance and Administrative
Sciences .
Eichengreen. T.L.T. and Gibson. B.A. (2001). Mortgage refinancing with asymmetric
information, The AREUEA Journal, 21, 481-510.
Gavai. A. K. (2010). Business Ethics. Mumbai, IND: Global Media. Retrieved from
http://site.ebrary.com/lib/stpaulslimuru/docDetail.action?docID=10415502
Guan. J. & Noronha. C. (2013). Corporate social responsibility reporting research in the
Chinese academia: a critical review. Social Responsibility Journal, 9(1), 33–55.
doi:10.1108/17471111311307804
Hawkins. D. E. (2006). Corporate Social Responsibility: Balancing Tomorrow’s
Sustainability and Today’s Profitability. Palgrave Macmillan.
Hay. B. L. Stavins. R. N. & Vietor. R. H. K. (2005). Environmental Protection and the Social
Responsibility of Firms: Perspectives from Law, Economics, and Business. Resources
for the Future.
Husni. B. (2011). House Prices and Mortgage Credit Availability: Is the Relationship
Reinforcing? Job Market Paper.
48
Karkrah. J and Ameyaw. V. W. (2010). Information Finance Markets. Conclusions. New
Agriculture is Transforming. Demand for Rural Financial Services
Kothari. C. R. (2004a). Research Methodology : Methods and Techniques. Daryaganj, Delhi,
IND: New Age International. Retrieved from
http://site.ebrary.com/lib/stpaulslimuru/docDetail.action?docID=10318734
Kothari. C. R. (2004b). Research Methodology: Methods and Techniques. New Age
International.
Kotler. P. & Lee. N. (2011a). Corporate Social Responsibility: Doing the Most Good for
Your Company and Your Cause. John Wiley & Sons.
Kotler. P. & Lee. N. (2011b). Corporate Social Responsibility: Doing the Most Good for
Your Company and Your Cause. John Wiley & Sons.
Krishnaswami. O. R. & Satyaprasad, B. G. (2010). Business Research Methods. Mumbai,
IND: Global Media. Retrieved from
http://site.ebrary.com/lib/stpaulslimuru/docDetail.action?docID=10415560
Kumar. D. (2003). Information Finance Markets. Conclusions. New Agriculture is
Transforming Demand for Rural Financial Services
Lanis. R. & Richardson. G. (2012). Corporate social responsibility and tax aggressiveness: a
test of legitimacy theory. Accounting, Auditing & Accountability Journal, 26(1), 75–
100. doi:10.1108/09513571311285621
Mackey. G (2007). Corporate social responsibility and financial performance: Correlation or
misspecification? Strategic Management Journal, 21(5): 603-609.
Mallin. C. A. (2009). Corporate Social Responsibility: A Case Study Approach. Edward
Elgar Publishing.
Molyneux. K and Thornton. M, S. ( 1992). Expanding Housing Lending in Africa, Urban
Institute for OPIC Housing Africa Conference, Cape Town, May 2-4
49
Mwai. J. K (2013). Impact Of The Corporate Social Responsibility On The Corporate
Financial Performance In The Corporate And NGO Partnerships In Kenya,
Unpublished MBA Thesis University of Nairobi.
Obusubiri. H. J (2006). The Relationship Between CSR And Portfolio Performance In Kenya.
He Also Found A Positive Relationship Between CSR And Portfolio Performance.
Unpublished MBA Thesis University of Nairobi.
Orlitzky. (2001). An investigation into the relationship between CSP and CFP. Internatiol
Joirnal of Business , 12(4), 16-45.
Oyenje. O. H (2012). Relationship Between CSR Practices And Financial Performance Of
Firms In The Manufacturing, Construction And Allied Sector Of The Nairobi
Securities Exchange. Unpublished MBA Thesis University of Nairobi.
Pasiouras. J.E. and Kosmidou. A. (2007). "Credit rationing in markets with imperfect
information", American Economic Review, 71, 393-410
Pava. G and Krausz,H (1996). Relationship Between CSR And Traditional Financial
Performance, Through Examining Long-Term Financial Performance. International
Journal of Finanace , 2(16),13-47.
Preston. K and O’Bannon. H (1997). The relationship between indicators of Social
Responsibilities and Financial Performance, International Journal of Finance and
Accounting , 7(10), 98-117.
Shen. J and Chang. H (2009). Private politics, corporate social responsibility and integrated
strategy. Journal of Economics and Management Strategy, 10(1): 7-45
Sufian. D. (2008). Re-forming Mortgage Markets- Sound and Affordable Home Lending in
a New Era , Cornell University Press, Ithaca, NY.
Sun. L. (2012). Further evidence on the association between corporate social responsibility
and financial performance. International Journal of Law and Management, 54(6),
472–484. doi:10.1108/17542431211281954
50
Surroca. J (2010). Moral, money, ethical investing and economic psychology. Human
Relation, 53(2): 179-191.
Theaker. A. (2008). The public relations handbook (3rd ed.). London ; New York: Routledge.
Tse. R.Y.C. (2002). Mortgage default risk and lending policy, a study of the mortgage
lending in Hong Kong, Australian Land Economics Review, 2, 12-17
Villosio. P. 1995). Making Remittances Work for Development: Leveraging Remittances to
the Housing Market, Fall 2005 SIPA Workshop, Columbia University
Visser. W. Matten. D. & Pohl. M. (2010). A-Z of Corporate Social Responsibility (2nd
Edition). Hoboken, NJ, USA: Wiley. Retrieved from
http://site.ebrary.com/lib/stpaulslimuru/docDetail.action?docID=10441452
Vong. J. and F. Nourzad. (2009).“Do Lower Mortgage Rates Mean Higher Housing Prices?”
Applied Economics, 36, 20-34.
World Bank. (2010). Banking Sector Stability, Efficiency, and Outreach in Kenya, Policy
Research Working Paper .23, 24-42,
World Bank. (2002). Upgrading Low Income Urban Settlements: Country Assessment
Report Ghana.

51
APPENDICES
Appendix I: Introductory letter
From: DENNIS KIMANI MUCHAI
To: Respondent
Dear, Respondent
RE: Questionnaire
I am a student at University of Nairobi pursuing Masters of Science in Finance. I am
carrying out a study on EFFECT OF CORPORATE SOCIAL RESPONSIBILITY ON
THE PROFITABILITY OF COMMERCIAL BANKS IN KENYA
You are kindly requested you to assist in the collection of secondary data, from your
organization so as to enable me accomplish the study. Please, note that all the information
given shall be treated purely and used for academic purposes and shall be treated as
confidential. Thank you for taking your time to complete the questionnaire and for your time
and cooperation.
Yours sincerely
DENNIS KIMANI MUCHAI
Student UoN Kenya

52
Appendix II : Data Collection sheet
Name of the Bank
YEAR ROA Banks
corporate
donation
on
education
Banks
corporate
donation on
poverty
alleviation
Banks
corporate
donation on
charity
work
Assets of
the
banks
Total
Bank
deposits
Total
loans
2009
2010
2011
2012
2013
53
Appendix III: List of Licensed Commercial Banks in Kenya 1. African Banking Corporation 2. Bank of Africa Kenya limited 3. Bank of Baroda (K) Limited 4. Bank of India 5. Barclays Bank of Kenya Limited 6. CFC Stanbic Bank Limited 7. Charterhouse Bank Limited-Under Statutory Management 8. Chase Bank (K) Limited 9. Citibank N.A Kenya 10. Commercial Bank of Africa Limited 11. Consolidated Bank of Kenya Limited 12. Co-operative Bank of Kenya Limited 13. Credit Bank Limited 14. Development Bank of Kenya Limited 15. Diamond Trust Bank (K) Limited 16. Dubai Bank Kenya Limited 17. Ecobank Kenya Limited 18. Equatorial Commercial Bank Limited 19. Equity Bank Limited 20. Family Bank Limited 21. Fidelity Commercial Bank Limited 22. Fina Bank Limited 23. First Community Bank Limited 24. Giro Commercial Bank Limited 25. Guardian Bank Limited 26. Gulf Africa Bank Limited 27. Habib Bank A. G Zurich 28. Habib Bank Limited 29. Imperial Bank Limited 30. I & M Bank Limited 31. Jamii Bora Bank Limited 32. Kenya Commercial Bank Limited 33. K-Rep Bank Limited 34. Middle East Bank (K) Limited 35. National Bank of Kenya Limited 36. NIC Bank Limited 37. Oriental Commercial Bank Limited 38. Paramount Universal Bank Limited 39. Prime Bank Limited 40. Standard Chartered Bank Kenya Limited 41. Trans-national Bank Limited 42. UBA Kenya Bank Limited 43. Victoria Commercial Bank Limited
Source: CBK 2014