Embed Size (px)
Citation preview
EFFECT OF COPPER ALLOY ADDITION METHOD ON THE DIMENSIONAL RESPONSE OF SINTERED FE-CU-C STEELS
Michael L. Marucci and Francis G. Hanejko Hoeganaes Corporation
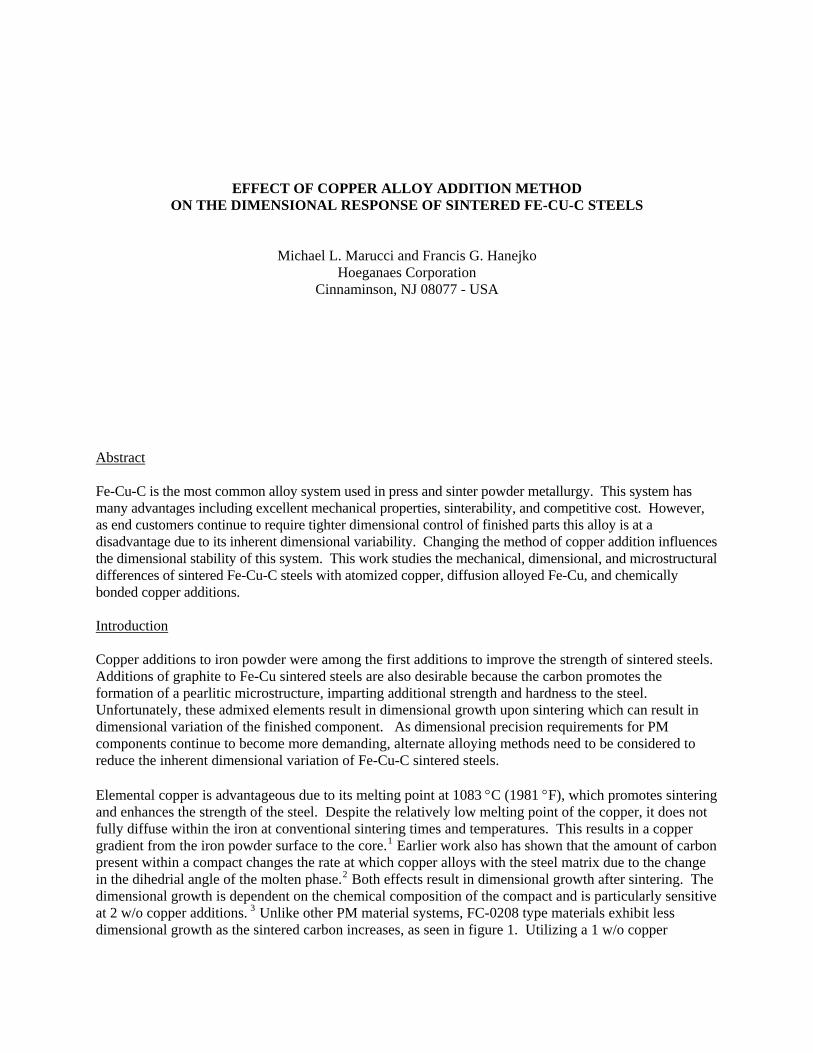
Cinnaminson, NJ 08077 - USA Abstract Fe-Cu-C is the most common alloy system used in press and sinter powder metallurgy. This system has many advantages including excellent mechanical properties, sinterability, and competitive cost. However, as end customers continue to require tighter dimensional control of finished parts this alloy is at a disadvantage due to its inherent dimensional variability. Changing the method of copper addition influences the dimensional stability of this system. This work studies the mechanical, dimensional, and microstructural differences of sintered Fe-Cu-C steels with atomized copper, diffusion alloyed Fe-Cu, and chemically bonded copper additions. Introduction Copper additions to iron powder were among the first additions to improve the strength of sintered steels. Additions of graphite to Fe-Cu sintered steels are also desirable because the carbon promotes the formation of a pearlitic microstructure, imparting additional strength and hardness to the steel. Unfortunately, these admixed elements result in dimensional growth upon sintering which can result in dimensional variation of the finished component. As dimensional precision requirements for PM components continue to become more demanding, alternate alloying methods need to be considered to reduce the inherent dimensional variation of Fe-Cu-C sintered steels. Elemental copper is advantageous due to its melting point at 1083 °C (1981 °F), which promotes sintering and enhances the strength of the steel. Despite the relatively low melting point of the copper, it does not fully diffuse within the iron at conventional sintering times and temperatures. This results in a copper gradient from the iron powder surface to the core.1 Earlier work also has shown that the amount of carbon present within a compact changes the rate at which copper alloys with the steel matrix due to the change in the dihedrial angle of the molten phase.2 Both effects result in dimensional growth after sintering. The dimensional growth is dependent on the chemical composition of the compact and is particularly sensitive at 2 w/o copper additions. 3 Unlike other PM material systems, FC-0208 type materials exhibit less dimensional growth as the sintered carbon increases, as seen in figure 1. Utilizing a 1 w/o copper
addition reduces the sensitivity of sintered carbon on dimensional variation. However, at this reduced copper addition level, the strength is below that of a standard FC-0208 material.
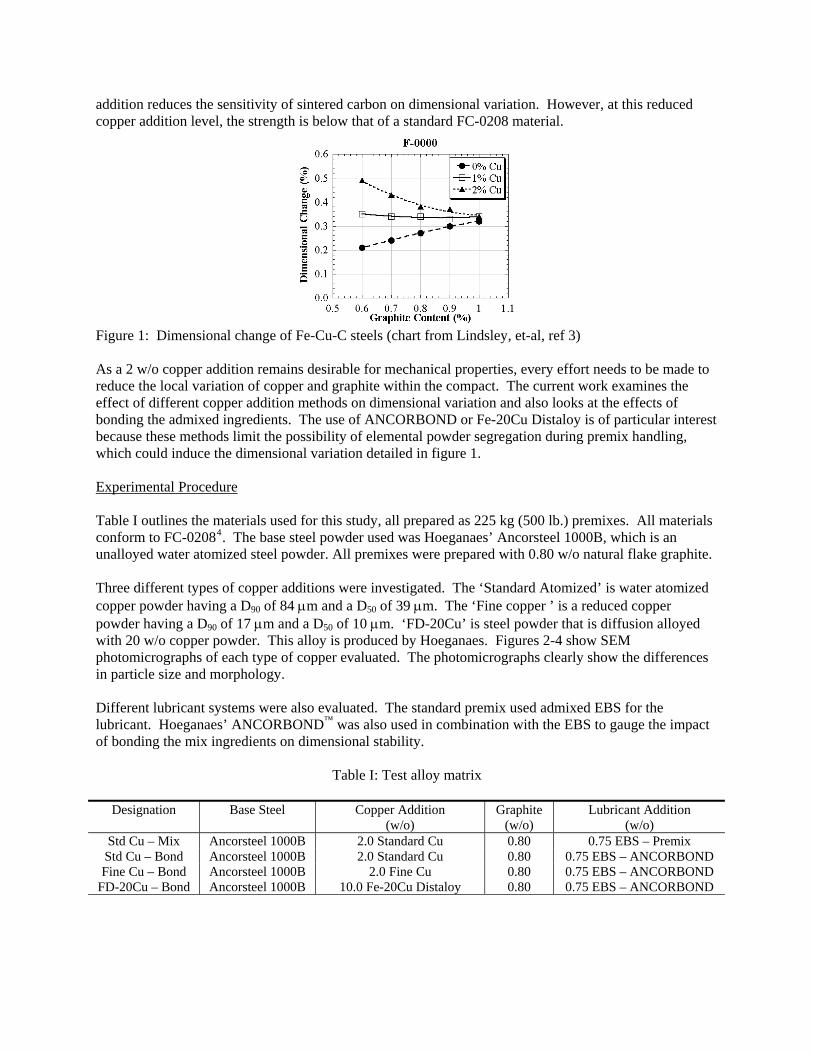
Figure 1: Dimensional change of Fe-Cu-C steels (chart from Lindsley, et-al, ref 3) As a 2 w/o copper addition remains desirable for mechanical properties, every effort needs to be made to reduce the local variation of copper and graphite within the compact. The current work examines the effect of different copper addition methods on dimensional variation and also looks at the effects of bonding the admixed ingredients. The use of ANCORBOND or Fe-20Cu Distaloy is of particular interest because these methods limit the possibility of elemental powder segregation during premix handling, which could induce the dimensional variation detailed in figure 1. Experimental Procedure Table I outlines the materials used for this study, all prepared as 225 kg (500 lb.) premixes. All materials conform to FC-02084. The base steel powder used was Hoeganaes’ Ancorsteel 1000B, which is an unalloyed water atomized steel powder. All premixes were prepared with 0.80 w/o natural flake graphite. Three different types of copper additions were investigated. The ‘Standard Atomized’ is water atomized copper powder having a D90 of 84 μm and a D50 of 39 μm. The ‘Fine copper ’ is a reduced copper powder having a D90 of 17 μm and a D50 of 10 μm. ‘FD-20Cu’ is steel powder that is diffusion alloyed with 20 w/o copper powder. This alloy is produced by Hoeganaes. Figures 2-4 show SEM photomicrographs of each type of copper evaluated. The photomicrographs clearly show the differences in particle size and morphology. Different lubricant systems were also evaluated. The standard premix used admixed EBS for the lubricant. Hoeganaes’ ANCORBOND™ was also used in combination with the EBS to gauge the impact of bonding the mix ingredients on dimensional stability.
Table I: Test alloy matrix
Designation Base Steel Copper Addition (w/o)
Graphite (w/o)
Lubricant Addition (w/o)
Std Cu – Mix Ancorsteel 1000B 2.0 Standard Cu 0.80 0.75 EBS – Premix Std Cu – Bond Ancorsteel 1000B 2.0 Standard Cu 0.80 0.75 EBS – ANCORBOND Fine Cu – Bond Ancorsteel 1000B 2.0 Fine Cu 0.80 0.75 EBS – ANCORBOND
FD-20Cu – Bond Ancorsteel 1000B 10.0 Fe-20Cu Distaloy 0.80 0.75 EBS – ANCORBOND
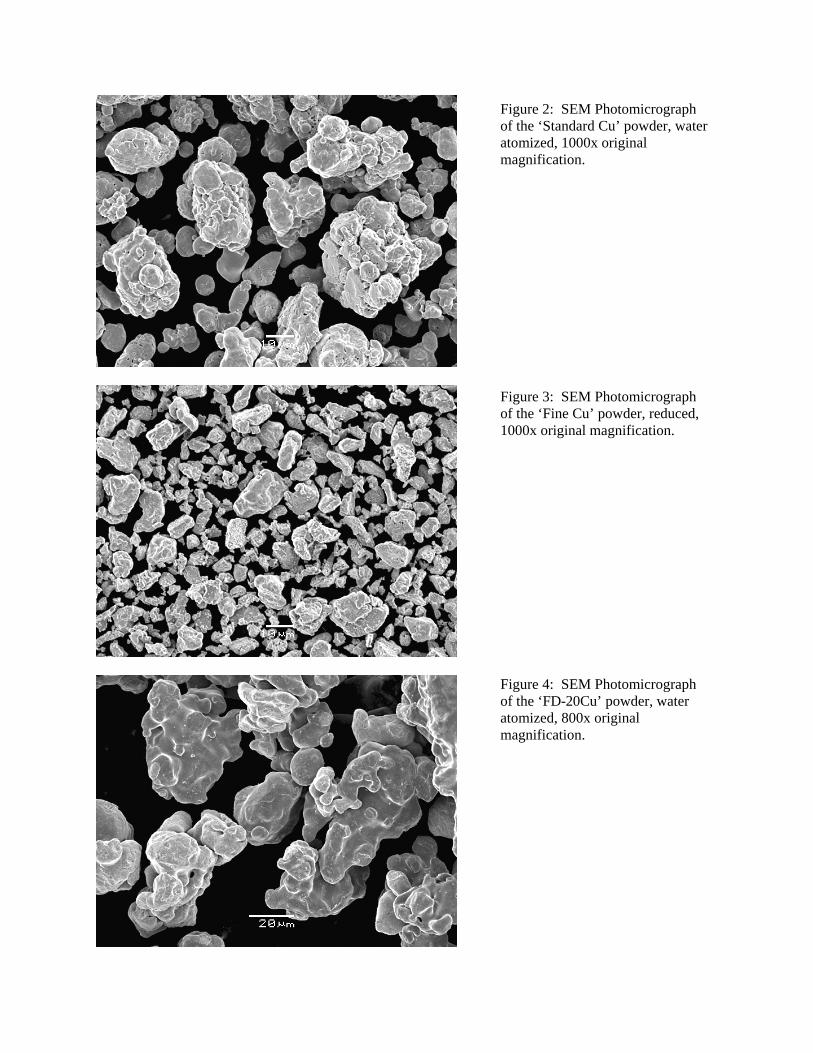
Figure 2: SEM Photomicrograph of the ‘Standard Cu’ powder, water atomized, 1000x original magnification.
Figure 3: SEM Photomicrograph of the ‘Fine Cu’ powder, reduced, 1000x original magnification.
Figure 4: SEM Photomicrograph of the ‘FD-20Cu’ powder, water atomized, 800x original magnification.
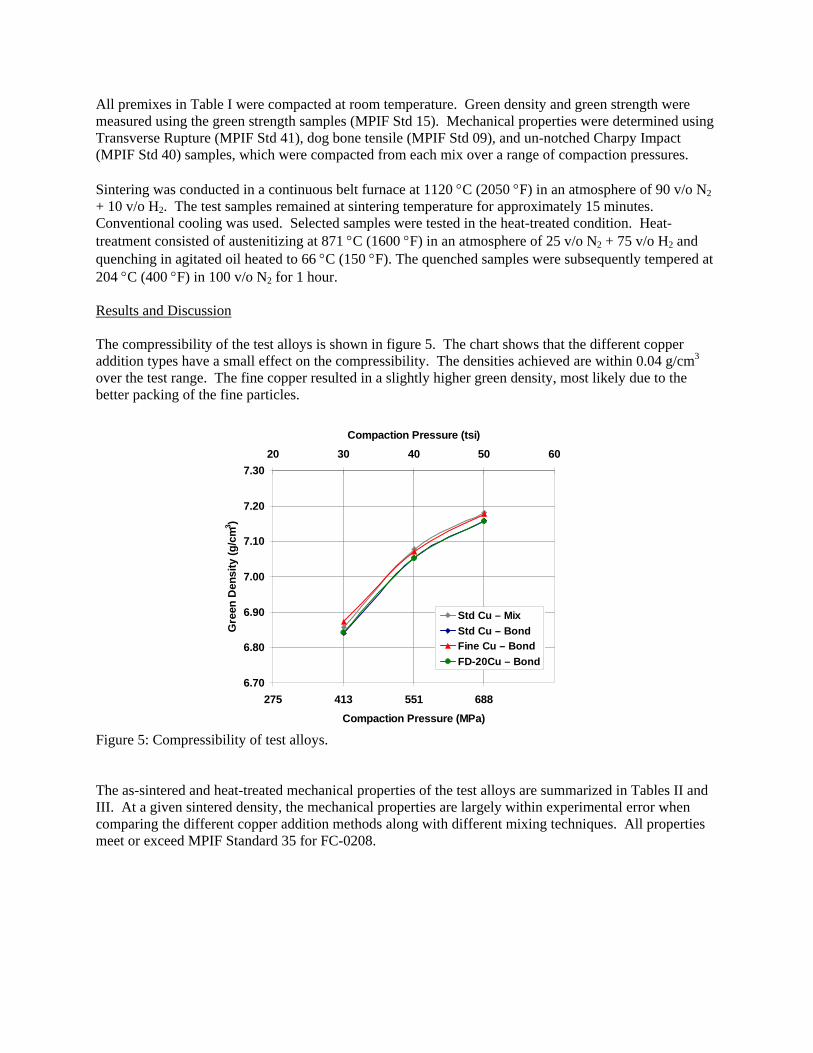
All premixes in Table I were compacted at room temperature. Green density and green strength were measured using the green strength samples (MPIF Std 15). Mechanical properties were determined using Transverse Rupture (MPIF Std 41), dog bone tensile (MPIF Std 09), and un-notched Charpy Impact (MPIF Std 40) samples, which were compacted from each mix over a range of compaction pressures. Sintering was conducted in a continuous belt furnace at 1120 °C (2050 °F) in an atmosphere of 90 v/o N2 + 10 v/o H2. The test samples remained at sintering temperature for approximately 15 minutes. Conventional cooling was used. Selected samples were tested in the heat-treated condition. Heat-treatment consisted of austenitizing at 871 °C (1600 °F) in an atmosphere of 25 v/o N2 + 75 v/o H2 and quenching in agitated oil heated to 66 °C (150 °F). The quenched samples were subsequently tempered at 204 °C (400 °F) in 100 v/o N2 for 1 hour. Results and Discussion The compressibility of the test alloys is shown in figure 5. The chart shows that the different copper addition types have a small effect on the compressibility. The densities achieved are within 0.04 g/cm3 over the test range. The fine copper resulted in a slightly higher green density, most likely due to the better packing of the fine particles.
6.70
6.80
6.90
7.00
7.10
7.20
7.30
275 413 551 688Compaction Pressure (MPa)
Gre
en D
ensi
ty (g
/cm
3 )
20 30 40 50 60Compaction Pressure (tsi)
Std Cu – MixStd Cu – BondFine Cu – BondFD-20Cu – Bond
Figure 5: Compressibility of test alloys. The as-sintered and heat-treated mechanical properties of the test alloys are summarized in Tables II and III. At a given sintered density, the mechanical properties are largely within experimental error when comparing the different copper addition methods along with different mixing techniques. All properties meet or exceed MPIF Standard 35 for FC-0208.
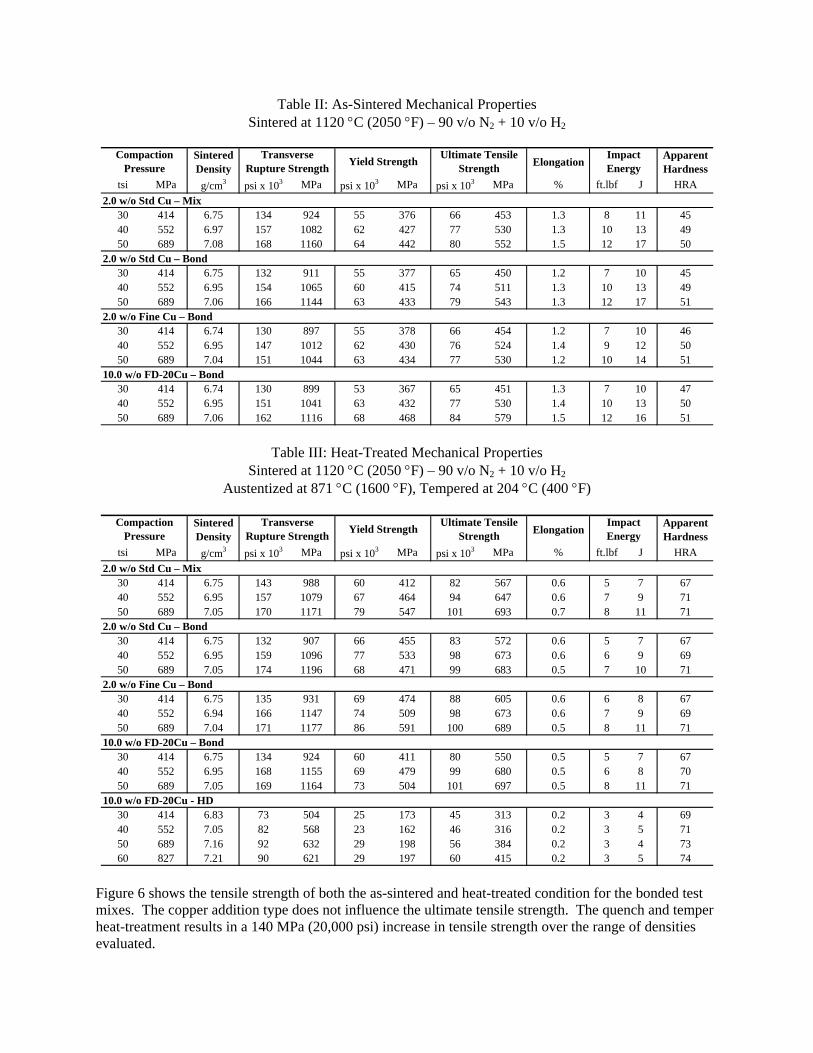
Table II: As-Sintered Mechanical Properties Sintered at 1120 °C (2050 °F) – 90 v/o N2 + 10 v/o H2
Sintered Density Elongation Apparent
Hardnesstsi MPa g/cm3 psi x 103 MPa psi x 103 MPa psi x 103 MPa % ft.lbf J HRA
2.0 w/o Std Cu – Mix30 414 6.75 134 924 55 376 66 453 1.3 8 11 4540 552 6.97 157 1082 62 427 77 530 1.3 10 13 4950 689 7.08 168 1160 64 442 80 552 1.5 12 17 50
2.0 w/o Std Cu – Bond30 414 6.75 132 911 55 377 65 450 1.2 7 10 4540 552 6.95 154 1065 60 415 74 511 1.3 10 13 4950 689 7.06 166 1144 63 433 79 543 1.3 12 17 51
2.0 w/o Fine Cu – Bond30 414 6.74 130 897 55 378 66 454 1.2 7 10 4640 552 6.95 147 1012 62 430 76 524 1.4 9 12 5050 689 7.04 151 1044 63 434 77 530 1.2 10 14 51
10.0 w/o FD-20Cu – Bond30 414 6.74 130 899 53 367 65 451 1.3 7 10 4740 552 6.95 151 1041 63 432 77 530 1.4 10 13 5050 689 7.06 162 1116 68 468 84 579 1.5 12 16 51
Impact Energy
Compaction Pressure
Transverse Rupture Strength Yield Strength Ultimate Tensile
Strength
Table III: Heat-Treated Mechanical Properties Sintered at 1120 °C (2050 °F) – 90 v/o N2 + 10 v/o H2
Austentized at 871 °C (1600 °F), Tempered at 204 °C (400 °F)
Sintered Density Elongation Apparent
Hardnesstsi MPa g/cm3 psi x 103 MPa psi x 103 MPa psi x 103 MPa % ft.lbf J HRA
2.0 w/o Std Cu – Mix30 414 6.75 143 988 60 412 82 567 0.6 5 7 6740 552 6.95 157 1079 67 464 94 647 0.6 7 9 7150 689 7.05 170 1171 79 547 101 693 0.7 8 11 71
2.0 w/o Std Cu – Bond30 414 6.75 132 907 66 455 83 572 0.6 5 7 6740 552 6.95 159 1096 77 533 98 673 0.6 6 9 6950 689 7.05 174 1196 68 471 99 683 0.5 7 10 71
2.0 w/o Fine Cu – Bond30 414 6.75 135 931 69 474 88 605 0.6 6 8 6740 552 6.94 166 1147 74 509 98 673 0.6 7 9 6950 689 7.04 171 1177 86 591 100 689 0.5 8 11 71
10.0 w/o FD-20Cu – Bond30 414 6.75 134 924 60 411 80 550 0.5 5 7 6740 552 6.95 168 1155 69 479 99 680 0.5 6 8 7050 689 7.05 169 1164 73 504 101 697 0.5 8 11 71
10.0 w/o FD-20Cu - HD30 414 6.83 73 504 25 173 45 313 0.2 3 4 6940 552 7.05 82 568 23 162 46 316 0.2 3 5 7150 689 7.16 92 632 29 198 56 384 0.2 3 4 7360 827 7.21 90 621 29 197 60 415 0.2 3 5 74
Compaction Pressure
Transverse Rupture Strength Yield Strength Ultimate Tensile
StrengthImpact Energy
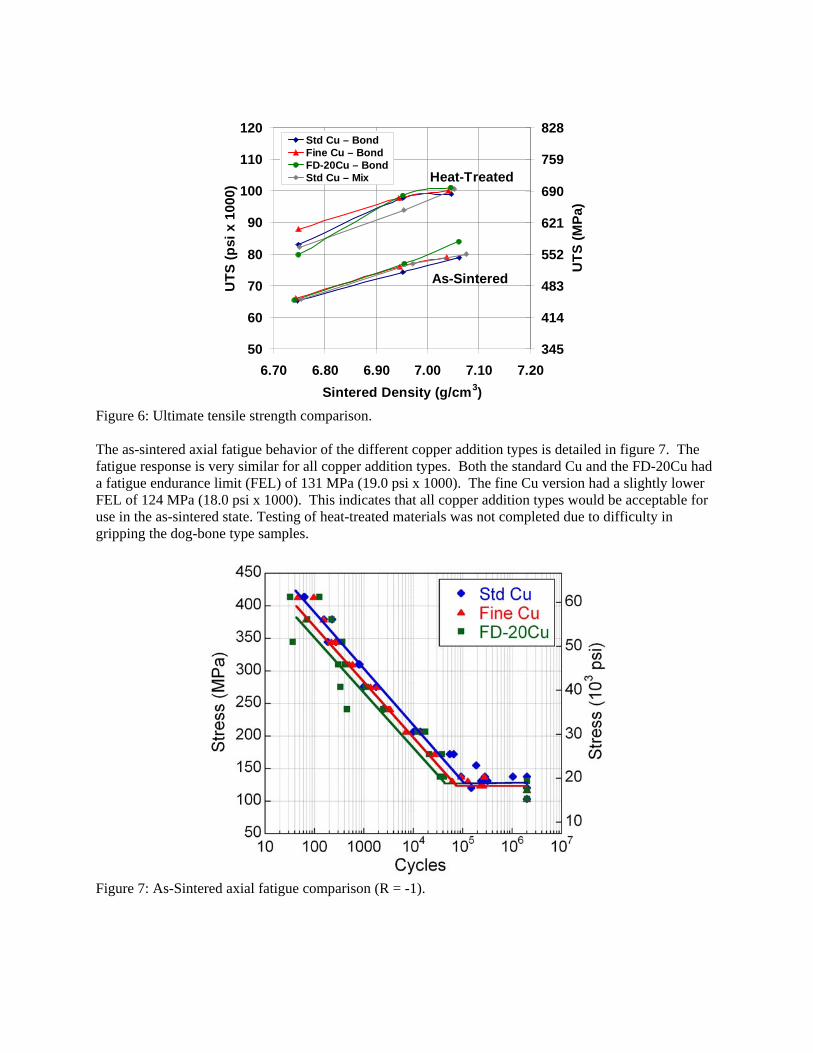
Figure 6 shows the tensile strength of both the as-sintered and heat-treated condition for the bonded test mixes. The copper addition type does not influence the ultimate tensile strength. The quench and temper heat-treatment results in a 140 MPa (20,000 psi) increase in tensile strength over the range of densities evaluated.
50
60
70
80
90
100
110
120
6.70 6.80 6.90 7.00 7.10 7.20Sintered Density (g/cm3)
UTS
(psi
x 1
000)
345
414
483
552
621
690
759
828
UTS
(MPa
)
Std Cu – BondFine Cu – BondFD-20Cu – BondStd Cu – Mix Heat-Treated
As-Sintered
Figure 6: Ultimate tensile strength comparison. The as-sintered axial fatigue behavior of the different copper addition types is detailed in figure 7. The fatigue response is very similar for all copper addition types. Both the standard Cu and the FD-20Cu had a fatigue endurance limit (FEL) of 131 MPa (19.0 psi x 1000). The fine Cu version had a slightly lower FEL of 124 MPa (18.0 psi x 1000). This indicates that all copper addition types would be acceptable for use in the as-sintered state. Testing of heat-treated materials was not completed due to difficulty in gripping the dog-bone type samples.
Figure 7: As-Sintered axial fatigue comparison (R = -1).
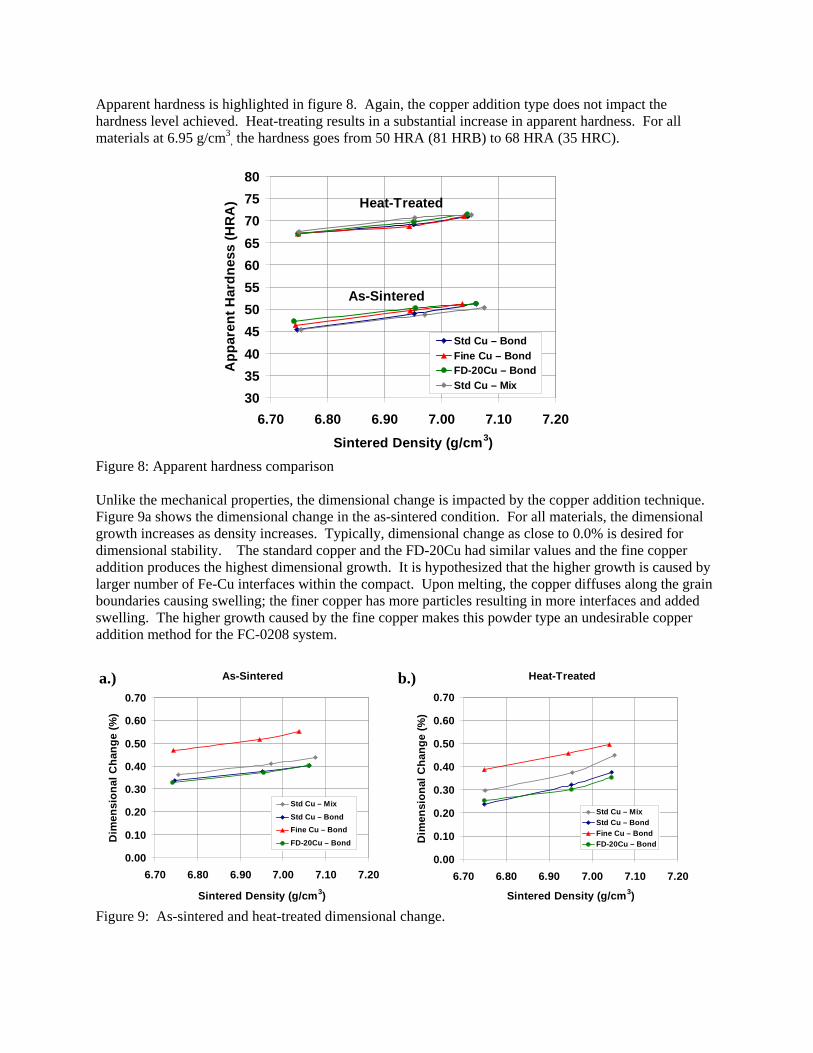
Apparent hardness is highlighted in figure 8. Again, the copper addition type does not impact the hardness level achieved. Heat-treating results in a substantial increase in apparent hardness. For all materials at 6.95 g/cm3
, the hardness goes from 50 HRA (81 HRB) to 68 HRA (35 HRC).
3035404550556065707580
6.70 6.80 6.90 7.00 7.10 7.20
Sintered Density (g/cm3)
App
aren
t Har
dnes
s (H
RA
)
Std Cu – BondFine Cu – BondFD-20Cu – BondStd Cu – Mix
Heat-Treated
As-Sintered
Figure 8: Apparent hardness comparison Unlike the mechanical properties, the dimensional change is impacted by the copper addition technique. Figure 9a shows the dimensional change in the as-sintered condition. For all materials, the dimensional growth increases as density increases. Typically, dimensional change as close to 0.0% is desired for dimensional stability. The standard copper and the FD-20Cu had similar values and the fine copper addition produces the highest dimensional growth. It is hypothesized that the higher growth is caused by larger number of Fe-Cu interfaces within the compact. Upon melting, the copper diffuses along the grain boundaries causing swelling; the finer copper has more particles resulting in more interfaces and added swelling. The higher growth caused by the fine copper makes this powder type an undesirable copper addition method for the FC-0208 system.
As-Sintered
0.00
0.10
0.20
0.30
0.40
0.50
0.60
0.70
6.70 6.80 6.90 7.00 7.10 7.20
Sintered Density (g/cm3)
Dim
ensi
onal
Cha
nge
(%)
Std Cu – Mix
Std Cu – BondFine Cu – Bond
FD-20Cu – Bond
Heat-Treated
0.00
0.10
0.20
0.30
0.40
0.50
0.60
0.70
6.70 6.80 6.90 7.00 7.10 7.20
Sintered Density (g/cm3)
Dim
ensi
onal
Cha
nge
(%)
Std Cu – MixStd Cu – BondFine Cu – BondFD-20Cu – Bond
a.) b.)
Figure 9: As-sintered and heat-treated dimensional change.
Heat-treatment results in a similar trend in dimensional response (figure 9b), however, the final dimensional growth is lower than in the as-sintered state. Typically, the transformation to a martensitic microstructure results in a positive size change. However, additional shrinkage occurs during the austenization/tempering of the steel, offsetting this effect. Again, the standard copper and the FD-20Cu have the lowest dimensional growth. Data from a separate study5 show that when the carbon and copper content of the test alloys are moved over a range of values, the dimensional change varies, as shown in figure 10. Unlike the behavior shown in figure 1, the rate of change as a function of chemistry is almost the same for each alloying method and carbon content, but the relative dimensional growth is similar to what is found in the present study. This shows that the FD-20Cu could be used as an alternative to the standard Cu.
2.0 w/o Cu
0.00
0.10
0.20
0.30
0.40
0.50
0.60
0.70
0.80
0.5 0.6 0.7 0.8 0.9 1.0
Graphite Addition (w/o)
Dim
ensi
onal
Cha
nge
(%)
Std CuFine CuFD-20Cu
0.8 w/o Graphite
0.00
0.10
0.20
0.30
0.40
0.50
0.60
0.70
0.80
1.0 1.5 2.0 2.5 3.0
Cu Addition (w/o)
Dim
ensi
onal
Cha
nge
(%)
Std CuFine CuFD-20Cu
a.) b.)
Figure 10: As-sintered dimensional change as a function of carbon and copper addition. All samples compacted to 6.90 g/cm3. The as-sintered and heat-treated microstructures for the standard Cu and FD-20Cu are compared in figures 11 and 12. As expected, both copper addition types produced a pearlitic as-sintered microstructure. The heat-treated microstructure consists of lath martensite with some areas of bainite. The FD-20Cu sample has a larger amount of bainite; this is most likely due to incomplete diffusion of copper in the iron particles. Moving from a pure copper particle to an Fe-Cu Distaloy has minimal effect on the finished microstructure.
a.) b.)
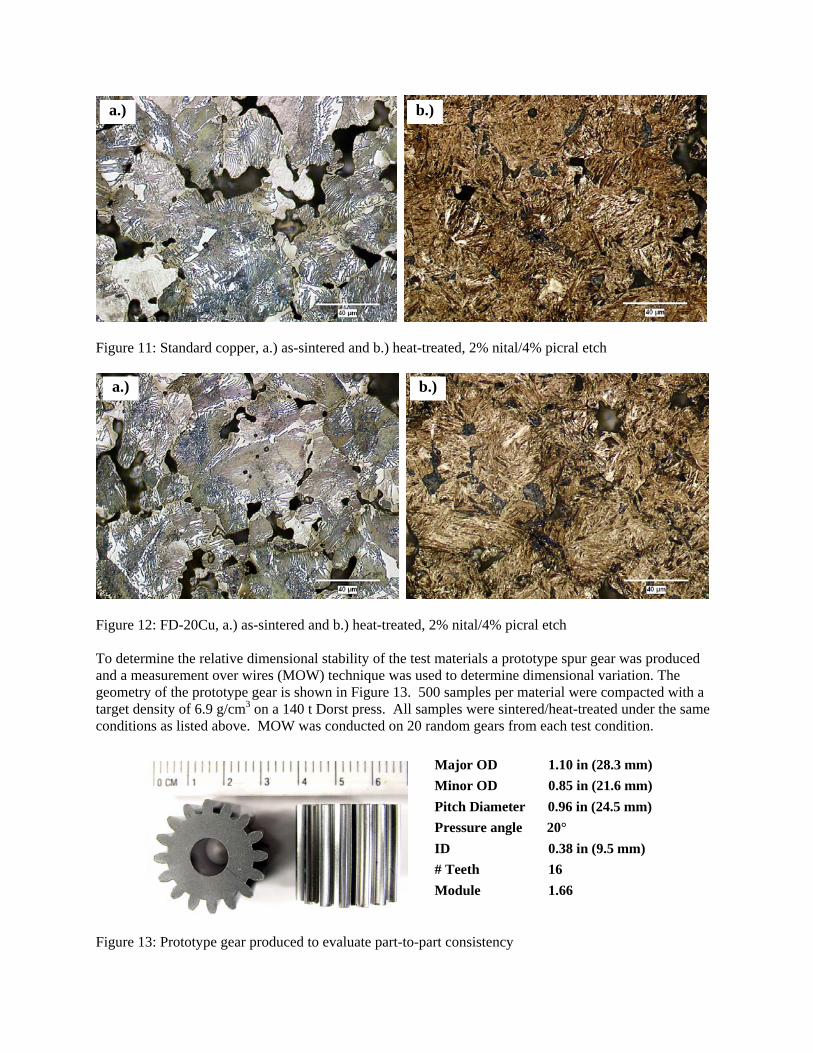
Figure 11: Standard copper, a.) as-sintered and b.) heat-treated, 2% nital/4% picral etch
a.) b.)
Figure 12: FD-20Cu, a.) as-sintered and b.) heat-treated, 2% nital/4% picral etch To determine the relative dimensional stability of the test materials a prototype spur gear was produced and a measurement over wires (MOW) technique was used to determine dimensional variation. The geometry of the prototype gear is shown in Figure 13. 500 samples per material were compacted with a target density of 6.9 g/cm3 on a 140 t Dorst press. All samples were sintered/heat-treated under the same conditions as listed above. MOW was conducted on 20 random gears from each test condition.
Major OD 1.10 in (28.3 mm) Minor OD 0.85 in (21.6 mm) Pitch Diameter 0.96 in (24.5 mm) Pressure angle 20°ID 0.38 in (9.5 mm) # Teeth 16Module 1.66
Figure 13: Prototype gear produced to evaluate part-to-part consistency
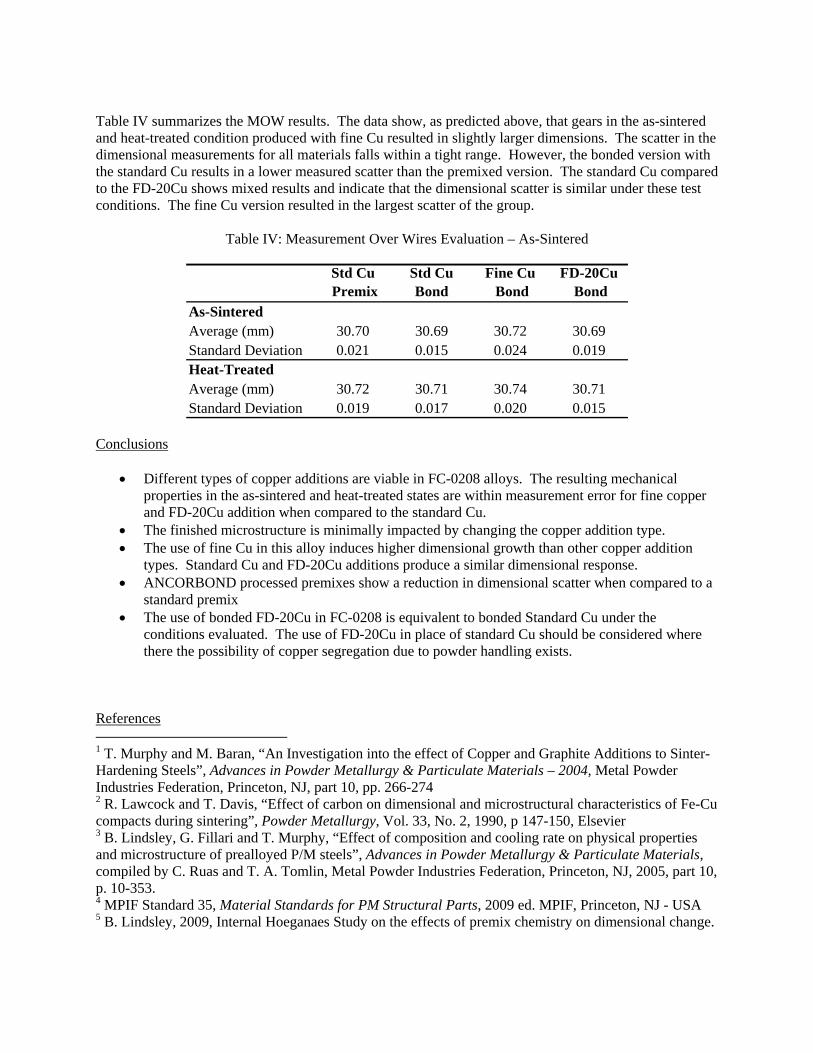
Table IV summarizes the MOW results. The data show, as predicted above, that gears in the as-sintered and heat-treated condition produced with fine Cu resulted in slightly larger dimensions. The scatter in the dimensional measurements for all materials falls within a tight range. However, the bonded version with the standard Cu results in a lower measured scatter than the premixed version. The standard Cu compared to the FD-20Cu shows mixed results and indicate that the dimensional scatter is similar under these test conditions. The fine Cu version resulted in the largest scatter of the group.
Table IV: Measurement Over Wires Evaluation – As-Sintered
Std Cu Premix
Std CuBond
Fine Cu Bond
FD-20Cu Bond
As-SinteredAverage (mm) 30.70 30.69 30.72 30.69Standard Deviation 0.021 0.015 0.024 0.019Heat-TreatedAverage (mm) 30.72 30.71 30.74 30.71Standard Deviation 0.019 0.017 0.020 0.015
Conclusions
• Different types of copper additions are viable in FC-0208 alloys. The resulting mechanical properties in the as-sintered and heat-treated states are within measurement error for fine copper and FD-20Cu addition when compared to the standard Cu.
• The finished microstructure is minimally impacted by changing the copper addition type. • The use of fine Cu in this alloy induces higher dimensional growth than other copper addition
types. Standard Cu and FD-20Cu additions produce a similar dimensional response. • ANCORBOND processed premixes show a reduction in dimensional scatter when compared to a
standard premix • The use of bonded FD-20Cu in FC-0208 is equivalent to bonded Standard Cu under the
conditions evaluated. The use of FD-20Cu in place of standard Cu should be considered where there the possibility of copper segregation due to powder handling exists.
References 1 T. Murphy and M. Baran, “An Investigation into the effect of Copper and Graphite Additions to Sinter-Hardening Steels”, Advances in Powder Metallurgy & Particulate Materials – 2004, Metal Powder Industries Federation, Princeton, NJ, part 10, pp. 266-274 2 R. Lawcock and T. Davis, “Effect of carbon on dimensional and microstructural characteristics of Fe-Cu compacts during sintering”, Powder Metallurgy, Vol. 33, No. 2, 1990, p 147-150, Elsevier 3 B. Lindsley, G. Fillari and T. Murphy, “Effect of composition and cooling rate on physical properties and microstructure of prealloyed P/M steels”, Advances in Powder Metallurgy & Particulate Materials, compiled by C. Ruas and T. A. Tomlin, Metal Powder Industries Federation, Princeton, NJ, 2005, part 10, p. 10-353. 4 MPIF Standard 35, Material Standards for PM Structural Parts, 2009 ed. MPIF, Princeton, NJ - USA 5 B. Lindsley, 2009, Internal Hoeganaes Study on the effects of premix chemistry on dimensional change.


![Index [] · 2010. 4. 30. · Copper Alloy Mechanical Connectors CD_BB Line Mechanical terminals One U-bolt type terminals for copper conductors. Copper alloy terminals with round](https://img.pdfslide.net/doc/110x75/5fe21e440f47565e460947a6/index-2010-4-30-copper-alloy-mechanical-connectors-cdbb-line-mechanical.jpg)