Embed Size (px)
Citation preview
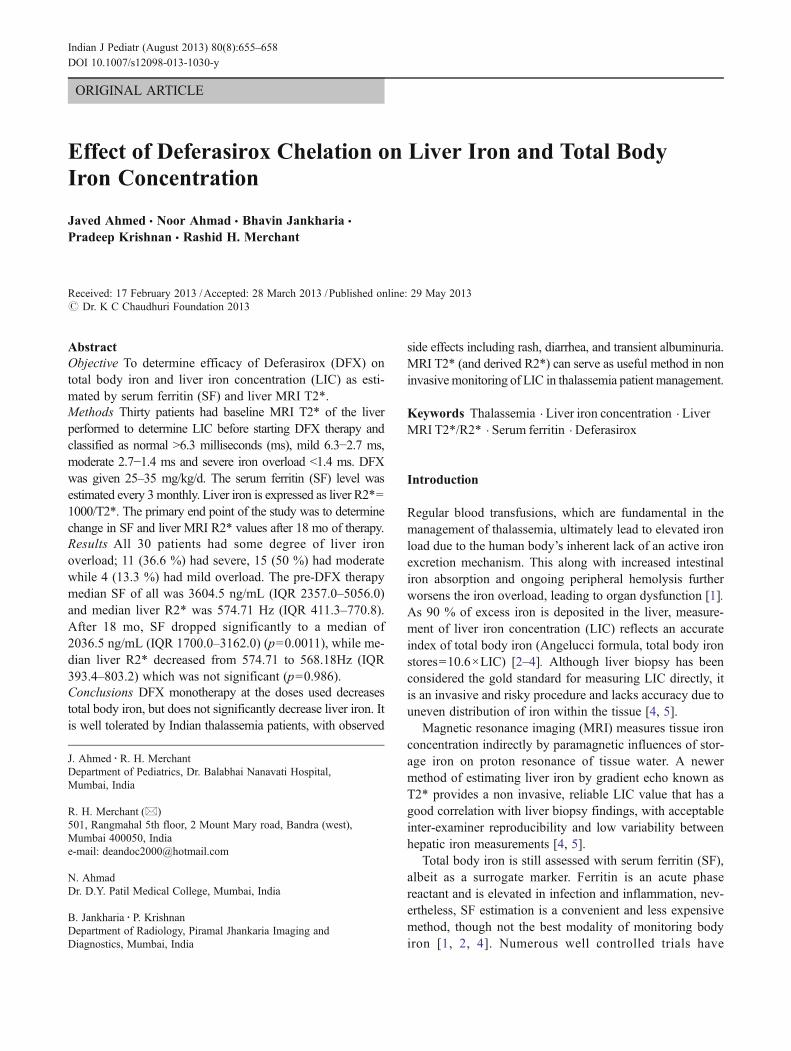
ORIGINAL ARTICLE
Effect of Deferasirox Chelation on Liver Iron and Total BodyIron Concentration
Javed Ahmed & Noor Ahmad & Bhavin Jankharia &
Pradeep Krishnan & Rashid H. Merchant
Received: 17 February 2013 /Accepted: 28 March 2013 /Published online: 29 May 2013# Dr. K C Chaudhuri Foundation 2013
AbstractObjective To determine efficacy of Deferasirox (DFX) ontotal body iron and liver iron concentration (LIC) as esti-mated by serum ferritin (SF) and liver MRI T2*.Methods Thirty patients had baseline MRI T2* of the liverperformed to determine LIC before starting DFX therapy andclassified as normal >6.3 milliseconds (ms), mild 6.3−2.7 ms,moderate 2.7−1.4 ms and severe iron overload <1.4 ms. DFXwas given 25–35 mg/kg/d. The serum ferritin (SF) level wasestimated every 3monthly. Liver iron is expressed as liver R2*=1000/T2*. The primary end point of the study was to determinechange in SF and liver MRI R2* values after 18 mo of therapy.Results All 30 patients had some degree of liver ironoverload; 11 (36.6 %) had severe, 15 (50 %) had moderatewhile 4 (13.3 %) had mild overload. The pre-DFX therapymedian SF of all was 3604.5 ng/mL (IQR 2357.0–5056.0)and median liver R2* was 574.71 Hz (IQR 411.3–770.8).After 18 mo, SF dropped significantly to a median of2036.5 ng/mL (IQR 1700.0–3162.0) (p=0.0011), while me-dian liver R2* decreased from 574.71 to 568.18Hz (IQR393.4–803.2) which was not significant (p=0.986).Conclusions DFX monotherapy at the doses used decreasestotal body iron, but does not significantly decrease liver iron. Itis well tolerated by Indian thalassemia patients, with observed
side effects including rash, diarrhea, and transient albuminuria.MRI T2* (and derived R2*) can serve as useful method in noninvasivemonitoring of LIC in thalassemia patient management.
Keywords Thalassemia . Liver iron concentration . LiverMRI T2*/R2* . Serum ferritin . Deferasirox
Introduction
Regular blood transfusions, which are fundamental in themanagement of thalassemia, ultimately lead to elevated ironload due to the human body’s inherent lack of an active ironexcretion mechanism. This along with increased intestinaliron absorption and ongoing peripheral hemolysis furtherworsens the iron overload, leading to organ dysfunction [1].As 90 % of excess iron is deposited in the liver, measure-ment of liver iron concentration (LIC) reflects an accurateindex of total body iron (Angelucci formula, total body ironstores=10.6×LIC) [2–4]. Although liver biopsy has beenconsidered the gold standard for measuring LIC directly, itis an invasive and risky procedure and lacks accuracy due touneven distribution of iron within the tissue [4, 5].
Magnetic resonance imaging (MRI) measures tissue ironconcentration indirectly by paramagnetic influences of stor-age iron on proton resonance of tissue water. A newermethod of estimating liver iron by gradient echo known asT2* provides a non invasive, reliable LIC value that has agood correlation with liver biopsy findings, with acceptableinter-examiner reproducibility and low variability betweenhepatic iron measurements [4, 5].
Total body iron is still assessed with serum ferritin (SF),albeit as a surrogate marker. Ferritin is an acute phasereactant and is elevated in infection and inflammation, nev-ertheless, SF estimation is a convenient and less expensivemethod, though not the best modality of monitoring bodyiron [1, 2, 4]. Numerous well controlled trials have
J. Ahmed : R. H. MerchantDepartment of Pediatrics, Dr. Balabhai Nanavati Hospital,Mumbai, India
R. H. Merchant (*)501, Rangmahal 5th floor, 2 Mount Mary road, Bandra (west),Mumbai 400050, Indiae-mail: [email protected]
N. AhmadDr. D.Y. Patil Medical College, Mumbai, India
B. Jankharia : P. KrishnanDepartment of Radiology, Piramal Jhankaria Imaging andDiagnostics, Mumbai, India
Indian J Pediatr (August 2013) 80(8):655–658DOI 10.1007/s12098-013-1030-y
demonstrated efficacy of Deferasirox (DFX) in chelatingliver iron [6, 7]. DFX has a half life of 12–16 h and hencecan be given once daily, and has been shown to suppresslabile iron better than intermittent injection of deferoxamine(DFO) [7].
This manuscript presents data on the effect of DFX onLIC. The primary end points of the study were liver R2*(derived from T2*) and SF levels after 18 mo of DFX therapy.
Material and Methods
The aim of the study was to evaluate the efficacy ofDFX chelation on total body iron and liver iron asestimated by SF and MRI T2* respectively. This singlecentre prospective study was conducted between Octo-ber 2008 and October 2010 on 30 multitransfused βthalassemia patients at a tertiary care hospital in Mum-bai. Before DFX therapy was initiated, patients wereon different chelation regimes and hence to quantifythe extent of liver iron, baseline MRI T2* in all 30patients was done. Patients were then started on DFXafter a wash out period, i.e., a drug free period of onewk. DFX was initially started as a single dose of25 mg/kg/d on an empty stomach in the morning andthe dose was further escalated to a maximum of35 mg/kg/d depending upon response and tolerance.Dose reduction was done if any side effect was notedor if SF fell below 500 ng/mL, while dose escalationwas done if SF did not fall on two consecutive occa-sions. MRI liver T2* was repeated after 18 mo oftherapy. Liver T2* measurement was done using soft-ware CMR Tools created by Imperial College, on a 1.5Tesla Siemens sonata machine using a single trans-axial slice through the center of the liver imaged at8 different echo times (1.2 to 11.7 milliseconds). Sig-nal intensity analysis was performed in the periphery ofthe liver away from the large central vessels. The signaldecay curve was visually assessed by a reader and lateechoes were eventually discarded to achieve a good fit.
All MRI data was analyzed using dedicated software(CMR tools; Cardiovascular Imaging Solutions, London,UK). Liver iron values measured by T2* were classifiedas normal i.e., > 6.3 milliseconds (ms), mild ironoverload 6.3−2.7 ms, moderate 2.7−1.4 ms and severe<1.4 ms [8]. Liver R2* is the reciprocal of T2* and iscalculated as R2*=1000/T2*. R2* was used for statisti-cal calculation because it is directly proportional to liveriron while T2* is inversely proportional. Conventionally,liver iron is reported as R2*(Hz) whereas cardiac iron isreported as T2* (ms). The 2 radiologists performingMRI T2* scans were blinded to the details of therapythat the patients received and all values were crosschecked by both radiologists.
SF level was estimated by chemiluminescence immuno-assay (CLIA) from pre-transfusion blood samples when thefirst MRI was done i.e., pre DFX therapy and subsequentlyat 3 monthly intervals. Serological tests for HIV, hepatitis Band C were done before and at the conclusion of study. Liverprofile including Alanine transaminases, albumin and pro-thrombin time with creatinine were estimated monthly forthe first 3–6 mo and subsequently 3 monthly throughout thestudy duration. The primary end points of the study wereliver R2*(derived from T2*) and SF levels after 18 mo ofDFX therapy.
Data is presented as median with IQR (inter quartilerange values between 25th percentile to 75th percentile)and variables analyzed by Mann–Whitney ‘U’ test. P<0.05 was considered statistically significant. The studywas approved by the ethical committee of the instituteand a written informed consent of patients and parentsor guardians was obtained.
Results
Of 30 patients there were 22 males (73.33 %) and 8 females(26.67 %) with a median age of 16 y (range 6.5 to 29 y). Themean blood transfusion requirement was 219.42 mL/kg/ywith a range of 180–260 mL/kg/y.
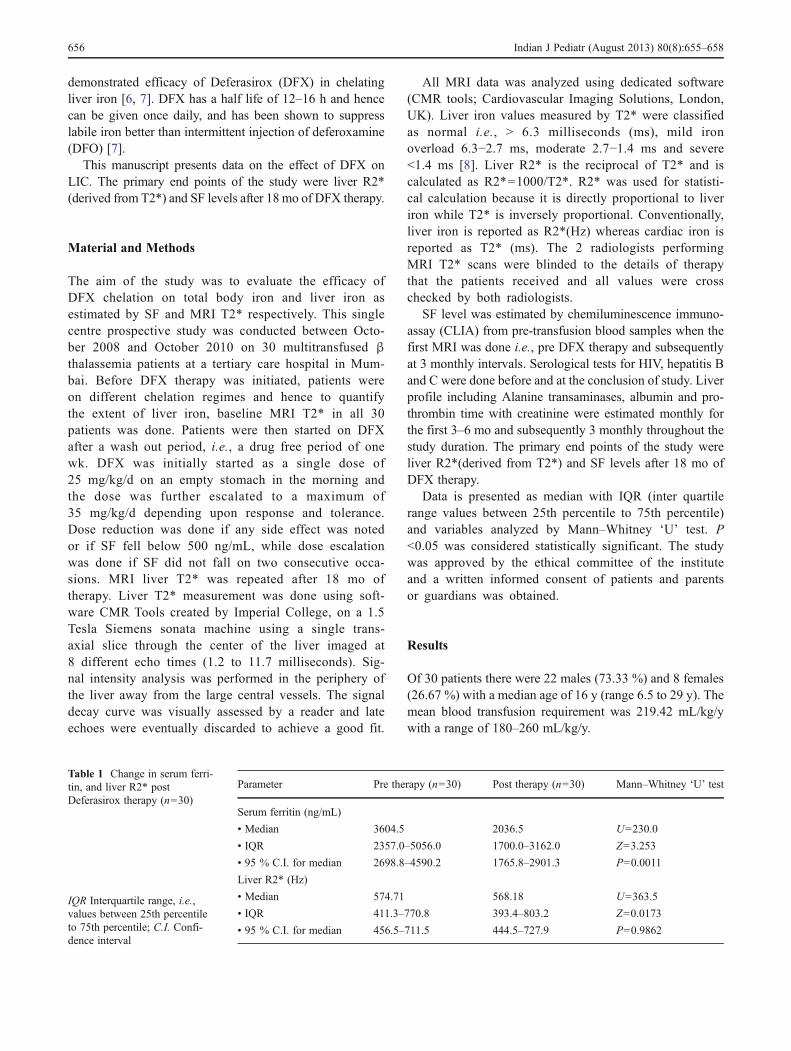
Table 1 Change in serum ferri-tin, and liver R2* postDeferasirox therapy (n=30)
IQR Interquartile range, i.e.,values between 25th percentileto 75th percentile; C.I. Confi-dence interval
Parameter Pre therapy (n=30) Post therapy (n=30) Mann–Whitney ‘U’ test
Serum ferritin (ng/mL)
• Median 3604.5 2036.5 U=230.0
• IQR 2357.0–5056.0 1700.0–3162.0 Z=3.253
• 95 % C.I. for median 2698.8–4590.2 1765.8–2901.3 P=0.0011
Liver R2* (Hz)
• Median 574.71 568.18 U=363.5
• IQR 411.3–770.8 393.4–803.2 Z=0.0173
• 95 % C.I. for median 456.5–711.5 444.5–727.9 P=0.9862
656 Indian J Pediatr (August 2013) 80(8):655–658
Serological tests revealed that 6 (15 %) were HCVand 2 (5 %) were HBsAg positive while none testedpositive for HIV. Ten (33 %) patients had indirecthyperbilirubinemia (serum bilirubin >2 mg%), 4 (13 %) hadALT elevated twice the normal limit (>80 IU/L). Prothrombintime and serum albumin levels were normal in all. All patientshad some degree of liver iron overload; 11 (36.6%) had severe(T2* <1.4 ms), 15 (50 %) had moderate (T2* 1.4 to 2.7 ms),and 4 (13.3 %) had mild liver iron overload (T2* 2.7 to6.3 ms).
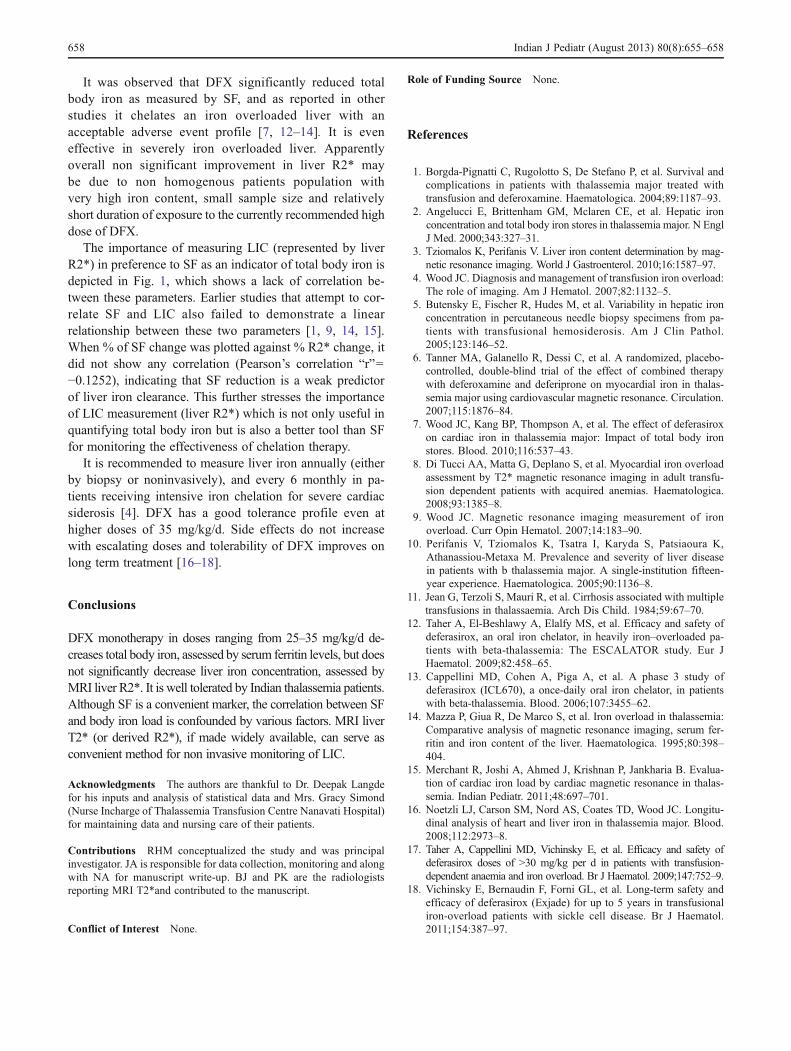
After 18 mo of therapy with DFX there was a significantdrop in SF level from a median of 3604.5 to 2036.5 ng/mL(P=0.0011). LIC (reflected by liver R2*) also showed re-duction in iron overload after therapy (Table 1), but themedian liver R2* of all cases decreased insignificantly frombaseline 574.71 Hz to 568.18 Hz (P=0.9862, non signifi-cant). Reduction in liver iron (reflected by liver R2*) wassignificantly more in severe overloaded liver i.e., T2*<1.4 ms (P=0.0117) than moderate or mild iron overloadedliver (Table 2).
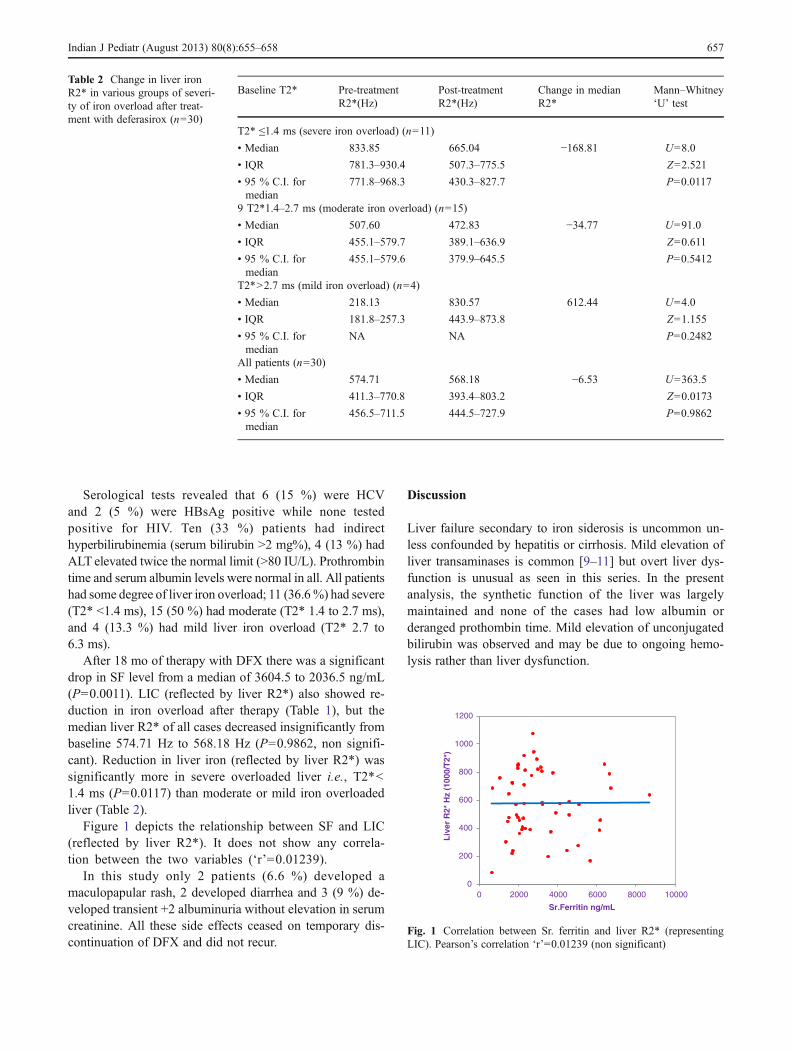
Figure 1 depicts the relationship between SF and LIC(reflected by liver R2*). It does not show any correla-tion between the two variables (‘r’=0.01239).
In this study only 2 patients (6.6 %) developed amaculopapular rash, 2 developed diarrhea and 3 (9 %) de-veloped transient +2 albuminuria without elevation in serumcreatinine. All these side effects ceased on temporary dis-continuation of DFX and did not recur.
Discussion
Liver failure secondary to iron siderosis is uncommon un-less confounded by hepatitis or cirrhosis. Mild elevation ofliver transaminases is common [9–11] but overt liver dys-function is unusual as seen in this series. In the presentanalysis, the synthetic function of the liver was largelymaintained and none of the cases had low albumin orderanged prothombin time. Mild elevation of unconjugatedbilirubin was observed and may be due to ongoing hemo-lysis rather than liver dysfunction.
0
200
400
600
800
1000
1200
0 2000 4000 6000 8000 10000
Liv
er R
2* H
z (1
000/
T2*
)
Sr.Ferritin ng/mL
Fig. 1 Correlation between Sr. ferritin and liver R2* (representingLIC). Pearson’s correlation ‘r’=0.01239 (non significant)
Table 2 Change in liver ironR2* in various groups of severi-ty of iron overload after treat-ment with deferasirox (n=30)
Baseline T2* Pre-treatmentR2*(Hz)
Post-treatmentR2*(Hz)
Change in medianR2*
Mann–Whitney‘U’ test
T2* ≤1.4 ms (severe iron overload) (n=11)
• Median 833.85 665.04 −168.81 U=8.0
• IQR 781.3–930.4 507.3–775.5 Z=2.521
• 95 % C.I. formedian
771.8–968.3 430.3–827.7 P=0.0117
9 T2*1.4–2.7 ms (moderate iron overload) (n=15)
• Median 507.60 472.83 −34.77 U=91.0
• IQR 455.1–579.7 389.1–636.9 Z=0.611
• 95 % C.I. formedian
455.1–579.6 379.9–645.5 P=0.5412
T2*>2.7 ms (mild iron overload) (n=4)
• Median 218.13 830.57 612.44 U=4.0
• IQR 181.8–257.3 443.9–873.8 Z=1.155
• 95 % C.I. formedian
NA NA P=0.2482
All patients (n=30)
• Median 574.71 568.18 −6.53 U=363.5
• IQR 411.3–770.8 393.4–803.2 Z=0.0173
• 95 % C.I. formedian
456.5–711.5 444.5–727.9 P=0.9862
Indian J Pediatr (August 2013) 80(8):655–658 657
It was observed that DFX significantly reduced totalbody iron as measured by SF, and as reported in otherstudies it chelates an iron overloaded liver with anacceptable adverse event profile [7, 12–14]. It is eveneffective in severely iron overloaded liver. Apparentlyoverall non significant improvement in liver R2* maybe due to non homogenous patients population withvery high iron content, small sample size and relativelyshort duration of exposure to the currently recommended highdose of DFX.
The importance of measuring LIC (represented by liverR2*) in preference to SF as an indicator of total body iron isdepicted in Fig. 1, which shows a lack of correlation be-tween these parameters. Earlier studies that attempt to cor-relate SF and LIC also failed to demonstrate a linearrelationship between these two parameters [1, 9, 14, 15].When % of SF change was plotted against % R2* change, itdid not show any correlation (Pearson’s correlation “r”=−0.1252), indicating that SF reduction is a weak predictorof liver iron clearance. This further stresses the importanceof LIC measurement (liver R2*) which is not only useful inquantifying total body iron but is also a better tool than SFfor monitoring the effectiveness of chelation therapy.
It is recommended to measure liver iron annually (eitherby biopsy or noninvasively), and every 6 monthly in pa-tients receiving intensive iron chelation for severe cardiacsiderosis [4]. DFX has a good tolerance profile even athigher doses of 35 mg/kg/d. Side effects do not increasewith escalating doses and tolerability of DFX improves onlong term treatment [16–18].
Conclusions
DFX monotherapy in doses ranging from 25–35 mg/kg/d de-creases total body iron, assessed by serum ferritin levels, but doesnot significantly decrease liver iron concentration, assessed byMRI liver R2*. It is well tolerated by Indian thalassemia patients.Although SF is a convenient marker, the correlation between SFand body iron load is confounded by various factors. MRI liverT2* (or derived R2*), if made widely available, can serve asconvenient method for non invasive monitoring of LIC.
Acknowledgments The authors are thankful to Dr. Deepak Langdefor his inputs and analysis of statistical data and Mrs. Gracy Simond(Nurse Incharge of Thalassemia Transfusion Centre Nanavati Hospital)for maintaining data and nursing care of their patients.
Contributions RHM conceptualized the study and was principalinvestigator. JA is responsible for data collection, monitoring and alongwith NA for manuscript write-up. BJ and PK are the radiologistsreporting MRI T2*and contributed to the manuscript.
Conflict of Interest None.
Role of Funding Source None.
References
1. Borgda-Pignatti C, Rugolotto S, De Stefano P, et al. Survival andcomplications in patients with thalassemia major treated withtransfusion and deferoxamine. Haematologica. 2004;89:1187–93.
2. Angelucci E, Brittenham GM, Mclaren CE, et al. Hepatic ironconcentration and total body iron stores in thalassemia major. N EnglJ Med. 2000;343:327–31.
3. Tziomalos K, Perifanis V. Liver iron content determination by mag-netic resonance imaging. World J Gastroenterol. 2010;16:1587–97.
4. Wood JC. Diagnosis and management of transfusion iron overload:The role of imaging. Am J Hematol. 2007;82:1132–5.
5. Butensky E, Fischer R, Hudes M, et al. Variability in hepatic ironconcentration in percutaneous needle biopsy specimens from pa-tients with transfusional hemosiderosis. Am J Clin Pathol.2005;123:146–52.
6. Tanner MA, Galanello R, Dessi C, et al. A randomized, placebo-controlled, double-blind trial of the effect of combined therapywith deferoxamine and deferiprone on myocardial iron in thalas-semia major using cardiovascular magnetic resonance. Circulation.2007;115:1876–84.
7. Wood JC, Kang BP, Thompson A, et al. The effect of deferasiroxon cardiac iron in thalassemia major: Impact of total body ironstores. Blood. 2010;116:537–43.
8. Di Tucci AA, Matta G, Deplano S, et al. Myocardial iron overloadassessment by T2* magnetic resonance imaging in adult transfu-sion dependent patients with acquired anemias. Haematologica.2008;93:1385–8.
9. Wood JC. Magnetic resonance imaging measurement of ironoverload. Curr Opin Hematol. 2007;14:183–90.
10. Perifanis V, Tziomalos K, Tsatra I, Karyda S, Patsiaoura K,Athanassiou-Metaxa M. Prevalence and severity of liver diseasein patients with b thalassemia major. A single-institution fifteen-year experience. Haematologica. 2005;90:1136–8.
11. Jean G, Terzoli S, Mauri R, et al. Cirrhosis associated with multipletransfusions in thalassaemia. Arch Dis Child. 1984;59:67–70.
12. Taher A, El-Beshlawy A, Elalfy MS, et al. Efficacy and safety ofdeferasirox, an oral iron chelator, in heavily iron–overloaded pa-tients with beta-thalassemia: The ESCALATOR study. Eur JHaematol. 2009;82:458–65.
13. Cappellini MD, Cohen A, Piga A, et al. A phase 3 study ofdeferasirox (ICL670), a once-daily oral iron chelator, in patientswith beta-thalassemia. Blood. 2006;107:3455–62.
14. Mazza P, Giua R, De Marco S, et al. Iron overload in thalassemia:Comparative analysis of magnetic resonance imaging, serum fer-ritin and iron content of the liver. Haematologica. 1995;80:398–404.
15. Merchant R, Joshi A, Ahmed J, Krishnan P, Jankharia B. Evalua-tion of cardiac iron load by cardiac magnetic resonance in thalas-semia. Indian Pediatr. 2011;48:697–701.
16. Noetzli LJ, Carson SM, Nord AS, Coates TD, Wood JC. Longitu-dinal analysis of heart and liver iron in thalassemia major. Blood.2008;112:2973–8.
17. Taher A, Cappellini MD, Vichinsky E, et al. Efficacy and safety ofdeferasirox doses of >30 mg/kg per d in patients with transfusion-dependent anaemia and iron overload. Br J Haematol. 2009;147:752–9.
18. Vichinsky E, Bernaudin F, Forni GL, et al. Long-term safety andefficacy of deferasirox (Exjade) for up to 5 years in transfusionaliron-overload patients with sickle cell disease. Br J Haematol.2011;154:387–97.
658 Indian J Pediatr (August 2013) 80(8):655–658