Embed Size (px)
Citation preview
Purdue UniversityPurdue e-Pubs
International Compressor Engineering Conference School of Mechanical Engineering
1986
Effect of Design Parameters on Oil-Flooded ScrewCompressor PerformanceP. J. Singh
J. L. Bowman
Follow this and additional works at: https://docs.lib.purdue.edu/icec
This document has been made available through Purdue e-Pubs, a service of the Purdue University Libraries. Please contact [email protected] foradditional information.Complete proceedings may be acquired in print and on CD-ROM directly from the Ray W. Herrick Laboratories at https://engineering.purdue.edu/Herrick/Events/orderlit.html
Singh, P. J. and Bowman, J. L., "Effect of Design Parameters on Oil-Flooded Screw Compressor Performance" (1986). InternationalCompressor Engineering Conference. Paper 517.https://docs.lib.purdue.edu/icec/517
EFFECT OF DESIGN PARAMETERS ON OIL-FLOODED SCREW
COMPRESSOR PERFORMANCE
Pawan J. Singh INGERSOLL-RAND COMPANY
Phillipsburg, N.J.
James L. Bowman INGERSOLL-RAND COMPANY
Mocksville, N;C.
ABSTRACT
The performance of oil-flooded screw compressors dep
ends on a large number of design parameters such as
rotor profile, number of rotor lobes, rotor L/D
ratio, wrap angle, geometrical clearances, quantity
and location of oil injection, discharge port size
and tip speed. Knowledge of the effect of these par
ameters can help a designer to select the best per
forming machine for a given application. This paper
systematically examines the effect of several of the
above parameters on compressor size and performance
for a given displacement. Proprietary computer prog
rams (1,2) are used to calculate the geometrical cha
racteristics of the rotors and compressor performance.
Results show that the performance can be considerably
improved by proper selection of design parameters.
Several plots showing the relationship between these
parameters and compressor size and performance are
presented that could be very valuable to a designer.
71
INTRODUCTION
Historically, oil-flooded rqtary screw air compressors have been designed with certain standardized features such as rotor profile and number of male-female rotor lobe combinations. This was because the generation of new profiles and adaptation of manufacturing methods (including the need for new tooling) was a time-consuming and expensive task. In recent times the advent of computerized highly-flexible rotor manufacturing techniques and the development of computerbased design techniques have provided new freedom to the compressor designer. The designer now has the flexibility to adjust the design parameters to their most optimum values for a specific application. In order to exercise this freedom he must have an economical means of predicting the effect of these parametric changes on the compressor performance and size.
In 1980 the authors' company developed several computer programs to rapidly generate rotor profiles along with their supporting data (1). These programs have the flexibility of generating profiles with different shapes and number of lobes, and analyzing their associated leakage lengths and areas as well as inlet and discharge port shapes and sizes. These data are then input to a performance prediction program (2) to yield compressor BHP and capacity. These programs can be used to conduct parametric studies of the effect of geometrical clearances on compressor performance for a known profile. Such studies have been made by Singh and Patel (2) and Fugiwara et al (3) who have provided a detailed accounting of the flow and power losses as a function of clearances and wrap angle.
This paper focuses on a more fundamental aspect of the design process. A designer, using these advanced techniques, can now select a certain profile shape, and then for a given profile can select other parameters such as number of male and female rotor lobes, L/D ratio, wrap angle, discharge port opening angle, etc. While these parameters have a great influence on the machine performance, strength and reliability, meaningful data to guide the designer in proper selection of these parameters does not exist in the open literature. This paper fills this void by presenting such data for typical screw compressor applications and highlights the relative importance of various parameters.
72
PROCEDURE
A number of rotor designs were created and their
dimensions normalized to give identical displacement
per unit revolution. This was done to place all the
designs on a common footing for comparative purposes.
One of the primary design parameters for evaluation
was the selection of the number of male and female
rotor lobes. Eight designs were selected for
consideration with the following male-female rotor
lobe combinations: 3-4, 4-5, 4-6, 5-6, 6-6, 6-7,
7-8, 7-6. Seperate profiles were then generated for
each design under a set of common guidelines: very
small blow-hole area; small sealing line lengths;
small rotor size with adequate mechanical strength
for 100 psi application. While the profiles looked
somewhat different, they shared a common design phil
osophy and many of the profi 1e segments had common
geometrical characteristics. In this way, the des
igner was allowed freedom to tailor the profiles to
the number of lobes combination. Two sample pro
files, 5-6 and 7-6, are shown in figure 1. The (7-6)
profile resulted in highly disproportionate rotors: a
stiff, large male rotor and a weak, small female
rotor. It was such a poor candidate that it was
dropped from further consideration.
Table 1 shows the primary geometric dimensions of the
various profiles normalized to the male rotor diam
eter of the 5-6 profile no. 4. Since the primary
purpose of this paper is to present the relative
merits of different designs, such normalization has
the virtue of highlighting major differences in a
group of candidates. The selection of profile 4 as
the base for normalization will become clear later.
However, we might mention now that profile 4 turned
out to be an excellent choice for typical screw
compressor applications.
In Table 1, two 4-6 profiles, 3 and 3A, are listed
with the main distinction that profile 3 has unequal
rotor diameters while 3A has equal diameters. Prof
iles of type 3A are most widely used in the in
dustry. Thus it was included in this investigation
although it violated the common design criterion of a
small blow-hole. The relative merits of equal and
unequal diameter rotors are more a function of man
ufacturing considerations than the design process.
As can be seen from Table 1, only profiles with the
lobe combination differing by Z, 4-6, 6-8, can be
practically made to have equal rotor diameters.
72a

This forces one to select larger female addendum which generally results in a larger blow-hole. It must be pointed out that we are talking about a larger-blow-hole only in a relative sense. For example, profile 3A has a blow-hole area of about .027 inZ for a 6 in diameter rotor while the comparable area for profile 4 is only .003 in2. Also, the importance of geometrical features such as blow-hole area depends on the application. As the tip speed increases, leakage areas begin to impact performance less and less while inlet and discharge port areas become more important. This is why integrated computer tools such as those described in references 1 and 2 are so important for application-oriented designs.
Table 2 lists the desired geometrical parameters that affect compressor design and performance for various profiles normalized to profile 4 values. The polar moment of inertia is based on the female rotor root diameter, Izfr = lT nfr/32, which serves as a measure of the rotor's stiffness. The moment of inertias of the complete male and female rotors about their respective axis,
Izm 1 ( r2 (xdy-ydx) 4 Jm
lzf = 1 £ r2 (xdy-ydx) 4 jf
represent the stiffness of the rotor end profile including lobes. In practice, however, the contribution of lobes and the moment of inertia based on root diameter is a good indicator of the rotor stifness. From the table, it is apparent that profiles with female-male lobe number difference (Nf-Nm) of 2 tend to have much stiffer female rotors than those with Nr-Nm 1. This indicates that Nf-Nm 2 profiles may be preferable for high pressure applications where rotor loads tend to be very high.
Table 2 also shows that the overlap constant, the ratio of maximum filled volume to the theoretical filled volume, is about the same for all profiles except for the case of equal number of lobes. For the 6-6 lobe profile, cavity fill volume is only 91.2\ of the theoretical volume which is also indicated by early closing of the inlet port. Inlet port closing angle decreases only slightly with the increase in number of lobes except for the 6-6 case.
73

The angle "1!7 is defin~d as the angle of the leading edge of the male cav1 ty and ranges from a negative value at cavity's inception to 8- max = 360 ( 1+1/N ) +SZ'm at cavity's expiration. Unlike the inlet po~t angle, the discharge port angle is a strong function
of the number of lobes. As Nm increases, the discharge port opens earlier as indicated by an increase
in. the port _openin~ angle (commonly called 13m). Th1s allows 1ncreas1ngly large axial and radial discharge ports with increasing Nm-
The blow-hole area for all the profiles is very small by design except for profile 3A. The blow-hole area is a strong function of the female addendum (outer radius - pitch circle radius) which is about 1.5% for most profiles except profile 3A for which it is 3\.
The selection of female addenqum is not completely arbitrary since it strongly affects the torque distribution between the two rotors. Very small or negative addendum can cause torque reversal at certain cavity positions, that may result in vibrations and damage.
Table 2 also shows that the contact or interlobe sealing length increases strongly with the number of lobes which has an adverse effect on performance, par~icularly at low-tip speeds and high pressure ratiOS. The maximum male and female rotor tip seal leakage lengths also increase slightly with the number of lobes but the average leakage length over the complete cycle remains about the same. In fact, the amount of tip seal leakage flow may actually decrease with number of lobes since the leakage has to pass through more cavities before reaching the inlet. While it is instructive to examine how the selection of number of lobes affects various geometrical parameters, the best comparison is obtained by examining their performance characteristics under identical operating conditions. The next section addresses the effect of these parameters on compressor performance and size.
PARAMETRIC EVALUATION
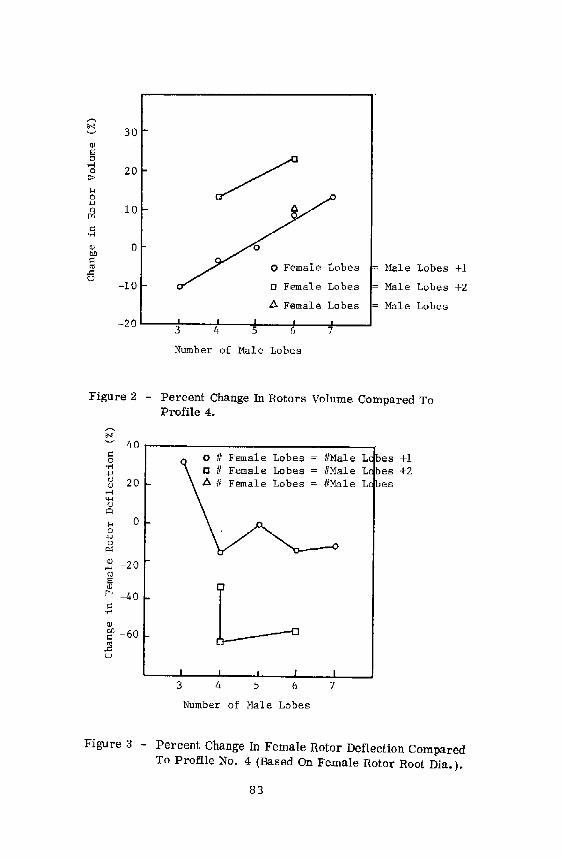
Effect of Number of Lobes on Airend Size.
Figure 2 shows the percent change in male & female rotor cylinder volume [ ~ (Dr+D~) ~ L/4 1 relative to profile 4 as a function of the number of male rotor lobes. It is clear that smaller number of
lobes reduces rotor volume and thus the airend size.
74
Also, there is a distinct difference between Nm-Nf ~ 2 and Nm-Nf = 1 profiles. The former require considerably larger rotors for a given displacement. This happens because, for a part of the revolution, one of the female cavities is idling and not taking part in the suction or compression process.
Effect of Number of Lobes on Rotor Stiffness
Rotor stiffness is an important parameter since it may limit the maximum operating pressure of the compressor. Figure 3 demonstrates the effect of number of lobes on female rotor deflection based on root diameter inertia lzfr· While stiffness is a strong function of the selection of lobe depth, the profiles with Nf-Nm = 2 have female rotors almost equal in size to the male rotors and thus are inherently much stiffer.
Effect of Number of Lobes on Discharge Port Velocity
The maximum gas velocity through the discharge port is plotted in Figure No. 4 with the profile 4 taken as the norm. This velocity is indicative of the port losses that are proportional to velocity squared. The plot shows that the velocity decreases with an increase in the number of lobes. This is clear from the trend in total discharge port area shown in table 2. It also means that the discharge port losses are generally higher for profiles with less number of lobes. Thus at high tip speeds where discharge port losses become significant, profiles with a lower number of lobes will have poor performance.
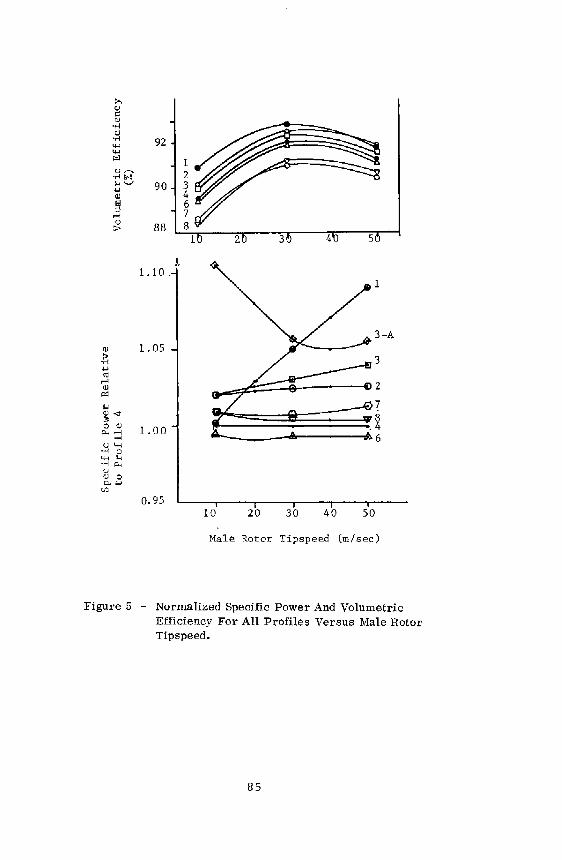
Effect of Lobe Combination on Performance
Figure 5 shows the volumetric efficiency (VE) and normalized specific power (BHP/100 CFM) for various profiles over a tip speed range of 10 to SOm/sec. The performance is based on wrap angle~m = 300°, L/D = 1.65, moderate clearances, typical oil injection rates, inlet pressure = 14.5 psia, 7.8 pressure ratio, 7° early discharge port opening angle and air as the compressed fluid. All profiles except 3A show specific power gradually increasing with tip speed. The profile 3A which does not share the common design philosophy of the rest has an optimum performance at about 25m/sec. This is because at low tip speeds, the large blow-hole area begins to
75
adversely affect performance through inter-cavity
leakage and recompression. Among other profiles, the
3-4 combination has the worst performance at 50 m/sec
due to its restricted discharge port.
Profiles with lobe difference of 1 have marginally
better performance than those with differences of 2
at all tip speeds. While profile 6-7 shows the best
performance in the diagram, all profiles with Nm ~
5 to 7 can be considered to have equivalent per
formance since the differences are minor from a prac
tical point of view and are within the programs'
accuracy. It should also be clear by now that the
5-6 profile has all the attributes of a good profile
in terms of performance, strength, and size and thus
was selected as the base profile for normalization.
It must be emphasized again that these and other
results are valid only for the nsted conditions and
should be used for relative purposes only. For ex
ample, high tip speed performance of 3-4 profile can
be improved considerably by opening the discharge
port even earlier than the 7° used here. Thus each
design should be optimized according to the
individual application.
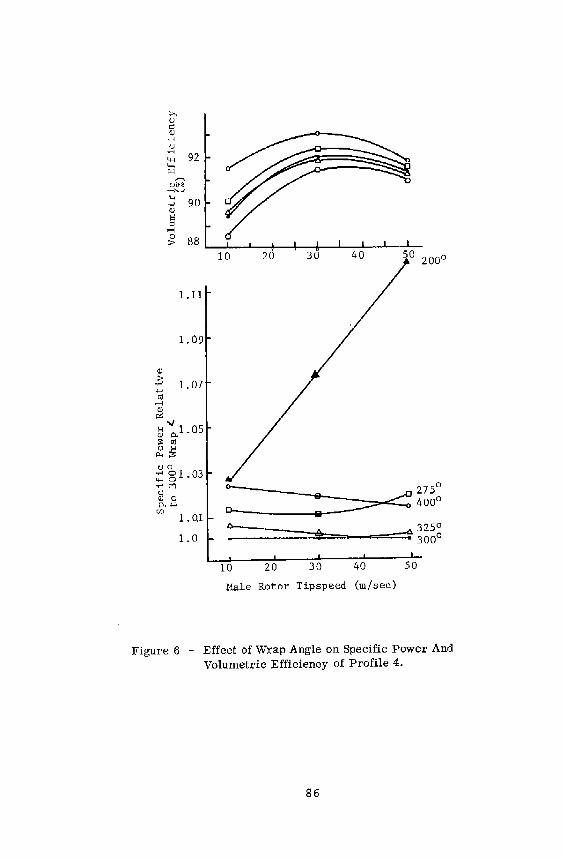
Effect of Wrap Angle on Performance
The change in wrap angle has two primary effects:
The discharge port size increases and the overlap
con- stant decreases with wrap angle. Table 3 lists
various important geometric characteristics of pro
file 4 for wrap angle varying from 200° to 400°.
Figure 6 shows the performance of profile 4 with L/D
- 1.65 andtr;~ 7.8 at various wrap angles~- The
poor performance of the f'm ~ 200° design at high tip
speeds is again caused by overly restrictive dis
charge port. The best performance is indicated by
300° wrap angle. It is interesting that the gen
erally poor performing rr?m ~ 200° design also has the
best VE which decreases with increase in wrap angle.
This is because the leakage lengths are smaller at
lower wrap angles (table 3). In the limit, one can
think of ~m = 0 which will then become a Roots com
pressor. In the Roots compressor, interlobe and
radial seal drive lengths are equal to the rotor
length but the built-in compression ratio is zero and
the axial discharge port if one can be conceived is
extremely small.
76
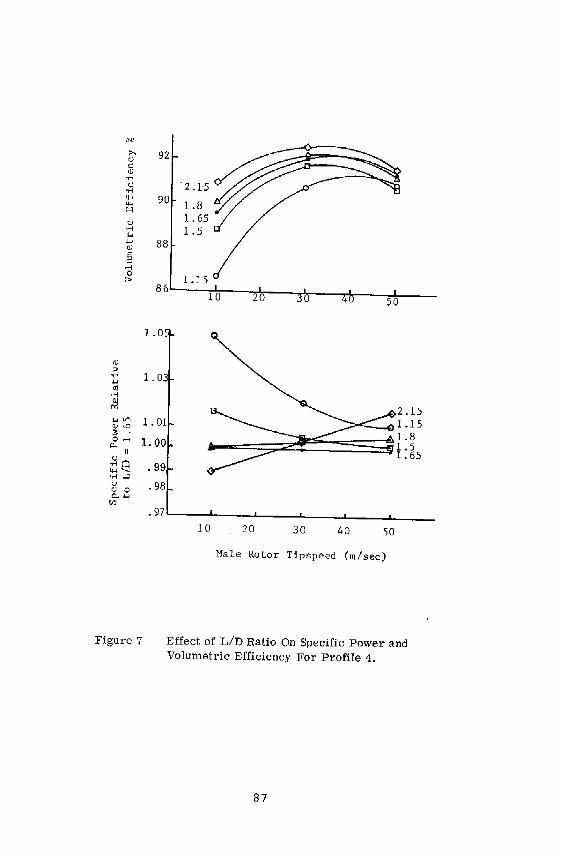
Effect of L/D Ratio on Performance
After the lobe combination, the next parameter normally selected is the L/D ratio. The impact of L/D ratio on airend performance for a 300° wrap angle, 5-6 profile is plotted in Figure 1, while the normalized geometric characteristics are listed in Table 4. L/D ratio of 1.15 generally shows the worst performance in figure 7 both for VE and specifice power, particularly at the low tip speeds. A small L/D ratio means larger diameter rotors for a given displacement and larger leakage areas. At higher tip speeds, the leakage areas begin to have less influence and performance for all L/D ratios tend to cluster together. L/D ratios of 1.65 and 1.8 show the best overall performance. It is perhaps no coincidence that the commonly used values of wrap angle of 300° and L/D = 1.65 based on experience also show up so well in this study.
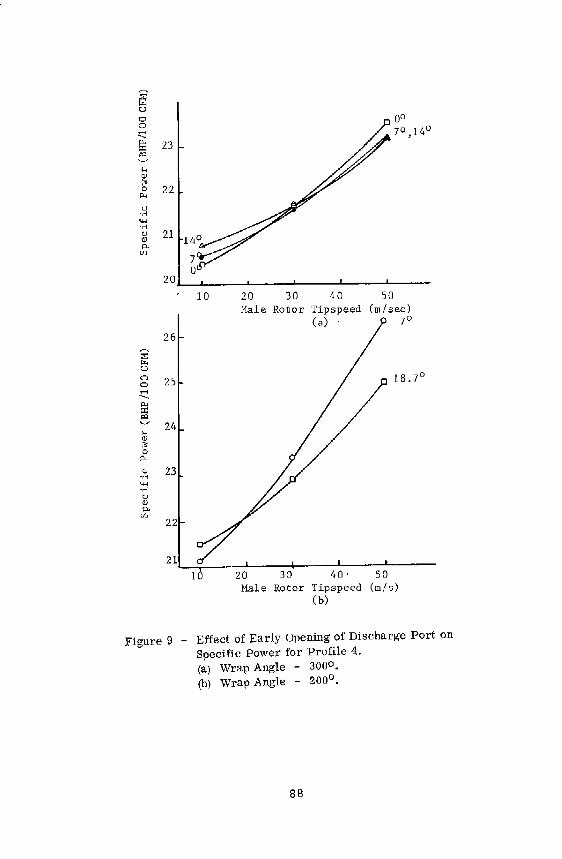
Effect of Opening The Discharge Port Early
One method of improving the performance is to open the discharge port early, i.e., to reduce the built-in pressure ratio. This has the effect of increasing the discharge port size at the cost of some backflow compression. However, at high tip speeds, gas inertia tends to overcome this backflow effect and significant improvement in performance can be achieved. The optimum built-in pressure ratio and other parameters such as opening angle is a function of the profile shape, number of lobes, wrap angle and L/D ratio. Figure 9a shows the effect of oo, 7° and 14° early opening on performance of the 5-6 profile. The data indicates that specific power improves with early opening at 50 m/sec while getting worse at 10m/sec. Even at 50m/sec it appears that any further early opening will make the performance worse. However, with 200° wrap angle, the effect on specific power is significant even at 18.7° early opening (Figure 9b) since the discharge port is very restrictive at the built-in pressure ratio as shown in Table 3. Thus it is necessary to determine the optimum opening angle according to profile shape and operating conditions.
77
CONCLUSIONS
Considerable data relating the effect of certain
important parameters to the performance of oil
flooded rotary screw compressors have been pres
ented. These data can be effectively used by a
compressor designer as a guide in selection of proper
parameters for a given application. The following
significant conclusions can be drawn from these data.
(i) The number of rotor lobes has a major influence
on compressor performance, size and rotor stiffness.
Low number of lobes can lead to a smaller airend but
also poorer performance, particularly at higher tip
speeds and pressure ratios. A 5-6 lobe combination
offers a good overall design but leads to unequal
rotors. The best lobe number selection depends on
the application and other consid~rations beyond per
formance such as ease of manufacturing and main
tenance of tolerances.
(ii) A wrap angle of around 300° and L/D ratios of
1.5 to 1.9 offer good performance for typical air
compressor applications.
(iii) Performance can be improved by opening the
discharge port early. The amount of early opening is
a function of rotor profile and operating conditions.
(iv) The computer programs used here can be a
powerful aid in optimizing compressor geometery ac
cording to the application.
ACKNOWLEDGEMENTS
The authors wish to thank the management of Ingersoll-Rand Company for permission to publish this
paper. The authors also thank A. Onuschak of
Ingersoll-Rand Research for obtaining most of the
computer results.
78
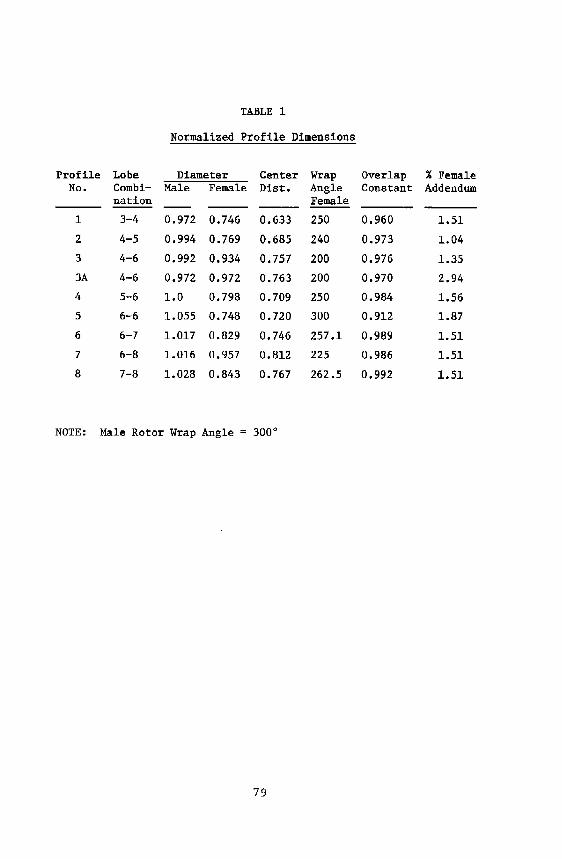
TABLE 1
Normalized Profile Dimensions
Profile Lobe Diameter Center Wrap Overlap % Female No. Combi- Male Female Dist. Angle Constant Addendum
nation Female
1 3-4 0.972 0.746 0.633 250 0.960 1.51
2 4-5 0.994 0.769 0.685 240 0.973 1.04
3 4-6 0.992 0.934 0.757 200 0.976 1.35
3A 4-6 0.972 0.972 0.763 200 0.970 2.94
4 5-6 1.0 0.798 0.709 250 0.984 1.56
5 6-6 1.055 0.748 0.720 300 0.912 1.87
6 6-7 1.017 0.829 0.746 257.1 0.989 1.51
7 6-8 1.016 0.957 0.812 225 0.986 1.51
8 7-8 1.028 0.843 0.767 262.5 0.992 1.51
NOTE: Male Rotor Wrap Angle = 300°
79

TABLE 2
Normalized Geometrical Parameters
Profile Lobe Female Leakage Blow Port Angles Total
No. No. Root Contact Radial Hole Inlet Disch Disch NM-Nf Inertia Area 13m Port
Area
1 3-4 0.24 0.7J4 0.932 0.7 378 22.8 0.546
2 4-5 0.65 0.872 0.974 0.9 366 39.5 0.806
3 4-6 2.40 0.843 0.966 0.7 366 43.1 0.962
3A 4-6 3.04 0.879 0.954 9.0 372 39.6 1.01
4 5-6 1.00 1.0 1.0 1.0 360 48.0 1.0
5 6-6 0.71 1.07 1.026 0.6 324 49,7 1.101
6 6-7 1.67 1.11 1.035 1.0 354 53.8 1.190
7 6-8 4.42 1.26 1.029 1.2 354 54.5 1.208
8 7-8 2.11 1.29 1.055 1.0 350 58.1 1.424
TABLE 3
Effect of Change in Wrap An!l:le on Normalized
Geometrical Parameters of Profile 4
Wrap(. Overlap Port (Deg,) Blow Leak.Lengths Discharge
(De g) Constant Inlet Disch Hole Contact Radial Port Area Area
250 0.9998 336 37.6 1.08 0.904 1.090 0.692
276 0.9952 354 43.3 1.04 0.953 1.045 0.858
300 0.9839 360 48.0 1.0 1.0 1.0 1.0
324 0.9628 372 51.8 0.95 1.048 0.928 1.130
350 0.9310 384 55.1 0.91 1.102 0.868 1.225
80
REFERENCES
L Singh, P. J., and Patel, G. C., 'A Generalized Performance Computer Program for Oil Flooded Twin-Screw Compressors,' International Compressor Engineering Conference Proceedings, Purdue, 1984.
2. Singh, P. J. and Onuschak, A. D., 'A Comprehensive, Computerized method for Twin-Screw Rotor Profile Generation and Analysis,' International Compressor Engineering Conference Proceedings, Purdue, 1984.
3. Fuziwara, M. et al, 'Computer Modeling for Performance Analysis of Rotary Screw Compressor,' International Compressor
N D Iz L r x,y -e-l3 ~
1l'i
f
m f
"'
fr "'
Engineering Conference Proceedings, Purdue, 1984.
SYMBOLS
Number of lobes Outside diameter Polar moment of inertia Rotor length Profile radius profile coordinates in x,y plane Cavity position angle Discharge port opening angle Wrap angle Built-in pressure ratio Integration around the profile
SUBSCRIPTS
Male rotor Female rotor Female rotor root diameter
81

5+6 Profile
7+6 Profile
Figure 1 - Two Sample Profiles Used In The Parametric
Evaluation
82
,...._ ~
30 <!)
~ .-I
20 0 i>
H 0 '-'
10 a Cj ..... <11 0 0 00 Q
"' ..c:: 0 Female Lobes Male Lobes u
-10 a Female Lobes Male Lobes
l!. Female Lobes Male Lobes
-20 3 4 5 6
Number of Male Lobes
Figure 2 - Percent Change In Rotors Volume Compared To Profile 4.
Cj 0 ..... '-' u 20 0)
.-I 'H 0)
~
H 0 0 .w 0 .,: 0) -20 .-I
"" s <11
i>< -40 Q ..... <11
~ -60 2 u
3
Female Lobes #Male L +1 Female Lobes ftMale L +2 Female Lobes f/Male L
4 5 6 7
Number of Male Lobes
+1
+2
Figure 3 - Percent Change In Female Rotor Deflection Compared To Profile No. 4 (Based On Female Rotor Root Dia, ).
83

0 ..... .j..) 4 ~ 0 Female Lobes "'
;., II Male Lobes +1 .j..) .....
3 0 II Female Lobes "' (J
0 II Male Lobes +2 r-1 Q)
> .j..) 2 1--l 0
p.,
Q) 1 llO 1--l
.2 (J
"' !) ..... C1 3 4 5 6 7
Number of Male Lobes
Figure 4 - Maximum Discharge Port Velocity Normalized To
Profile 4.
84
:>. <.)
5 ·...1 <.)
•...1 92 4-< 4-< P'l l <.),.-.. 2 -~w H"-' 90 3 .....
4 QJ
~ 6 .-I 7 0
88 8 :> 1
J. 1.10'
l
3-A QJ LOS
.;'; 3 ..... ctl
.-I 2 QJ 01'1
H 7 QJ-.:r
3 ~ QJ 1.00 .4
P.,..-1 A-. .... A6 ·...1 04-1
·...1 a 4-1 H ·...1 p... {J QJ a P,.-IJ
(f,J
o. 95 10 20 30 40 so
Male Rotor Tipspeed (m/sec)
Figure 5 - Normalized Specific Power And Volumetric Efficiency For All Profiles Versus Male Rotor Tips peed.
85
"""' c.JiN: .,.,.......,
t 90 Q)
5 .-I
~ 88 '---'---'---+-+----.,!:---L-..L--..I.-...L.-
1.11
1.09
l.Ql
1.0
10 20 30 0 200°
10 20 30 40 so Male Rotor Tipspeed (m/sec)
Figure 6 - Effect of Wrap Angle on Specific Power And Volumetric Efficiency of Profile 4.
86
"" >-. 92 r..> Q <])
•rl r..>
·rl -2.1'5 4-l 90 4-l 1.8 10<1
1.65 r..> ·rl 1.5 !-< ~ 88 <])
5 .-I 0
1.15 > 86
10 20
1.0
<])
:> •rl 1.03 ~ ctl
.-I
~ 2.15 ~u"") 1. 01 1.15 <].l-.Cl " . 1.8 0-< 1. 00 1.5 p..,
II 1. 65 -~0 4-l....._ • 99 ·rl ...:I
r..> . 98 <]) 0 o..u tn
• 97
10 20 30 40 50
Male Rotor Tipspeed (m/sec)
Figure 7 - Effect of L/D Ratio On Specific Power and Volumetric Efficiency For Profile 4.
87
~ u 0 00 0 _, 70,14° ..._ p., 23 = «<
~ 0! :>< 0 22 p.,
(.)
·.-! ...... ·.-I (.) 21 0! 0.
Vl
20
10 20 30 40 so Male Rotor Tip speed (m/ sec)
(a) 70
26
s ~ u 0 25 18.7° 0 ...... ..._
b:J 1'<1 .....,
24 H il)
:>< 0
p.,
(.) 23 ·.-I .., ·.-I (.) il) 0.
(/"]
22
21 20 30 40· 50 Male Rotor Tip speed (m/s)
(b)
Figure 9 - Effect of Early Opening of Discharge Port on
Specific Power for Profile 4.
(a) Wrap Angle - 3000.
(b) Wrap Angle - 200°.
88