Embed Size (px)
Citation preview

Desalination xxx (2013) xxx–xxx
DES-11890; No of Pages 12
Contents lists available at ScienceDirect
Desalination
j ourna l homepage: www.e lsev ie r .com/ locate /desa l
Effect of different commercial feed spacers on biofouling of reverse osmosis membranesystems: A numerical study
Sz.S. Bucs a,b,⁎, A.I. Radu c,d, V. Lavric b, J.S. Vrouwenvelder a,c,d, C. Picioreanu c
a King Abdullah University of Science and Technology, Water Desalination and Reuse Center, 4700 KAUST, 23955 Thuwal, Saudi Arabiab University “Politehnica” of Bucharest, Faculty of Applied Chemistry and Materials Science, Chemical and Biochemical Engineering Department, RO-011061 Bucharest, Romaniac Delft University of Technology, Faculty of Applied Sciences, Department of Biotechnology, Julianalaan 67, 2628BC Delft, The Netherlandsd Wetsus, Centre of Excellence for Sustainable Water Technology, Agora 1, PO Box 1113, 8900 CC Leeuwarden, The Netherlands
H I G H L I G H T S G R A P H I C A L A B S T R A C T
• Amicro-scale biofoulingmodel describesexisting experimental observations well.
• The biofilm developed on the spacer hasthe highest impact on pressure dropincrease.
• The shape of the spacer filaments influ-ences the feed channel pressure drop.
• Thicker spacer use reduces the effect ofbiofouling on feed channel pressuredrop.
⁎ Corresponding author at: 4700 KAUST, 23955, ThuwaE-mail addresses: [email protected] (Sz.S Bucs
[email protected] (J.S. Vrouwenveld
0011-9164/$ – see front matter © 2013 Elsevier B.V. All rihttp://dx.doi.org/10.1016/j.desal.2013.11.007
Please cite this article as: Sz.S. Bucs, et al., EA numerical study, Desalination (2013), http
a b s t r a c t
a r t i c l e i n f oArticle history:Received 4 August 2013Received in revised form 4 October 2013Accepted 4 November 2013Available online xxxx
Keywords:Feed spacer3-d mechanistic modelBiofoulingDesalinationDrinking water
Feed spacers and hydrodynamics have been found relevant for the impact of biofouling on performance inreverse osmosis (RO) and nanofiltration (NF) membrane systems.The objectives of this study on biofouling development were to determine the impact of (i) linear flow velocityand bacterial cell load, (ii) biomass location and (iii) various feed spacer geometries as applied in practice aswell as a modified geometry spacer.A three-dimensionalmathematicalmodel for biofouling of feed spacer channels including hydrodynamics, solutemass transport and biofilm formation was developed in COMSOL Multiphysics and MATLAB software.Results of this study indicate that the feed channel pressure drop increase caused by biofilm formation can bereduced by using thicker and/or modified feed spacer geometry and/or a lower flow rate in the feed channel.The increase of feed channel pressure drop by biomass accumulation is shown to be strongly influenced bythe location of biomass. Results of numerical simulations are in satisfactory agreement with experimental data,indicating that this micro-scale mechanistic model is representative for practice. The developed model canhelp to understand better the biofouling process of spiral-wound RO and NF membrane systems and to developstrategies to reduce and control biofouling.
© 2013 Elsevier B.V. All rights reserved.
l, Saudi Arabia. Tel.: +966 2 8084973.), [email protected] (A.I. Radu), [email protected] (V. Lavric), [email protected],er), [email protected] (C. Picioreanu).
ghts reserved.
ffect of different commercial feed spacers on biofouling of reverse osmosis membrane systems:://dx.doi.org/10.1016/j.desal.2013.11.007

2 Sz.S. Bucs et al. / Desalination xxx (2013) xxx–xxx
1. Introduction
Membrane filtration processes like reverse osmosis (RO) andnanofiltration (NF) have become increasingly important for high qualitydrinking water production in recent years. The major problem of thistechnology is biofouling — excessive growth of biomass leading toreduction of produced water quantity and quality, while increasingthe operational costs.
Feed spacers are essential parts of the spiral-wound NF and ROmodules that keep membranes apart to form the flow channel and topromotemixing of the fluid. Baker et al. [1] reported that initial depositsof fouling were found to accumulate alongside the membrane feedchannel spacer and with time these deposits encroached upon theremaining freemembrane area. Van Paassen et al. [2] observed an expo-nential increase of the feed channel pressure drop caused by biofoulingbuild up onto the feed spacer of themembranemodules. This biofoulingproved to be related with chemicals dosed to the feed water. Tran et al.[3] found that the vicinity of the feed spacer strands was most affectedby fouling. Strategies to reduce feed spacer biofouling have beenaddressed, e.g. periodic air/water flushing [4] and applying thick feedspacers [5]. Vrouwenvelder et al. [6] showed that for fresh waterthe feed spacer biofouling is much more important than membranebiofouling for feed channel pressure drop increase and thus for overallperformance decline. In summary, feed spacers are important for mem-brane performance and play a key role in biofouling of membrane sys-tems. Therefore, a better understating of the impact of feed spacers onbiofouling is of primary importance for an improved design of thespiral-wound membrane modules.
According to Li et al. [7], feed spacers can be characterized byfour parameters: (i) the distance between spacer filaments, (ii) theangle between spacer filaments, (iii) the flow attack angle and (iv) thetotal spacer thickness. Sablani et al. [8] studied experimentally the influ-ence of three feed spacers varying in thickness 20, 28 and 46 mil(1 mil = 25.4 μm; i.e., a 28 mil spacer = 711 μm thick) on concentra-tion polarization. They found a decrease in flux with decreasing spacerthickness, but the highest permeate flowwas obtained for the interme-diate spacer thickness. Recently, Araujo et al. [9] studied experimentallythe effect of different spacer thickness on biofouling. Their findingsshowed that with the increase of spacer thickness there is a decreaseof the feed channel pressure drop due to biofouling.
Computationalfluid dynamics (CFD) has become awidely used tool instudying the hydrodynamic behaviour of NF and RO membrane systems[10]. Many studies using CFD focused on the effect of feed channel spaceron fluid flow and mass transfer with different type of spacers [11–15].Simplified, cylindrical shapes were used for representation of spacerfilaments in most of the numerical studies on the effect of feed spacergeometry on mass transfer and fluid flow. Stereomicroscopic observa-tions of the feed spacer revealed that the spacers used in commerciallyavailable spiral-wound membrane modules have more complicatedgeometry, with filaments varying in thickness and thinnings [16].Picioreanu et al. [17] foundbynumerical simulations that the feed chan-nel pressure drop for a simplified spacer with cylindrical filaments issignificantly different from a more realistic spacer geometry with fila-ment thinnings. Although the effect of feed spacer geometry has beenextensively studied, it is still not clear how spacers affect biofoulingand the performance parameters.
In this study we examined with a numerical model the impacton feed channel pressure drop of: (i) liquid flow velocity and bacterialcell load; (ii) biomass location on the spacer and/or membrane surfacesand (iii) various feed spacer geometries (28, 31, 34 and 46 mil thick)as applied in commercially available spiral-wound reverse osmosismodules and a modified geometry having a 31 mil thick spacer. To theauthors knowledge this is the first paper using a three-dimensionalmathematical model on biofouling evaluating several realistic geome-tries (commercially available) feed spacers as used in full-scale spiral-wound membrane modules.
Please cite this article as: Sz.S. Bucs, et al., Effect of different commerciaA numerical study, Desalination (2013), http://dx.doi.org/10.1016/j.desal.
2. Model description
A three-dimensional numerical model was developed to study theimpact of feed spacer geometry on the biofouling of feed channels ofspiral-wound membrane modules. The model is based on the work ofPicioreanu et al. (2009), implemented here in more efficient computercode coupling COMSOL Multiphysics solvers (COMSOL 4.3a, ComsolInc., Burlington, MA, www.comsol.com) for fluid dynamics and solutetransport with MATLAB (MATLAB 2011a, MathWorks, Natick, MA,www.mathworks.com) code for biofilm formation.
2.1. Spacer geometry
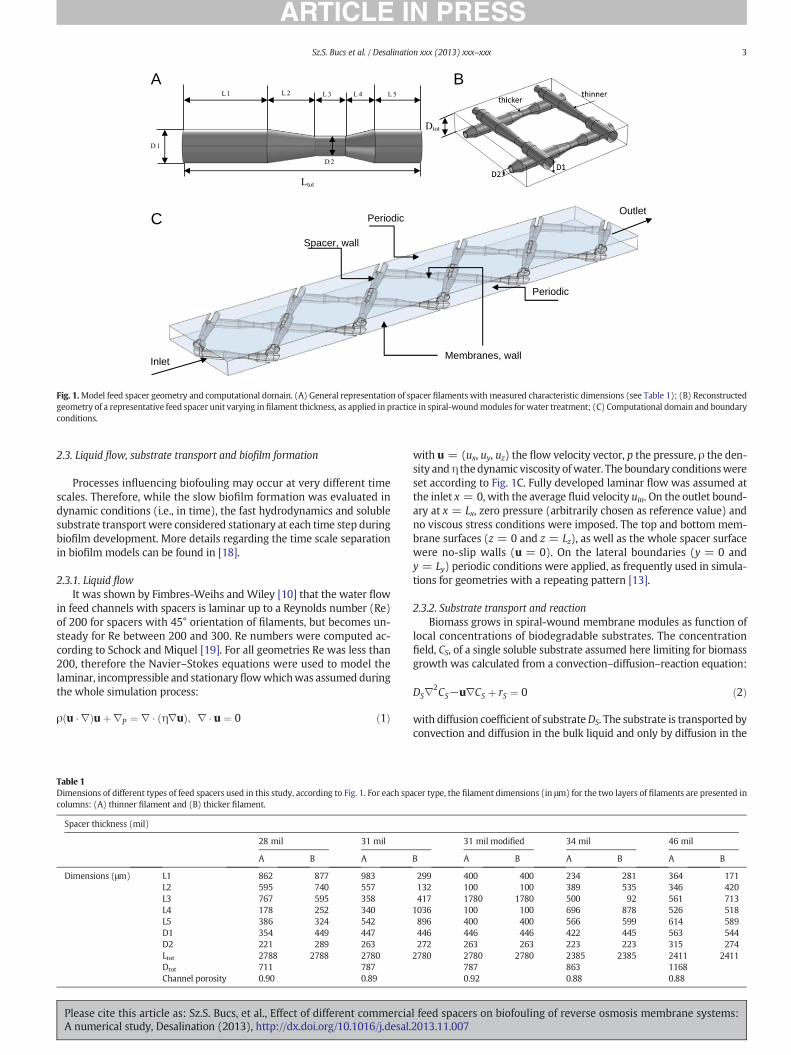
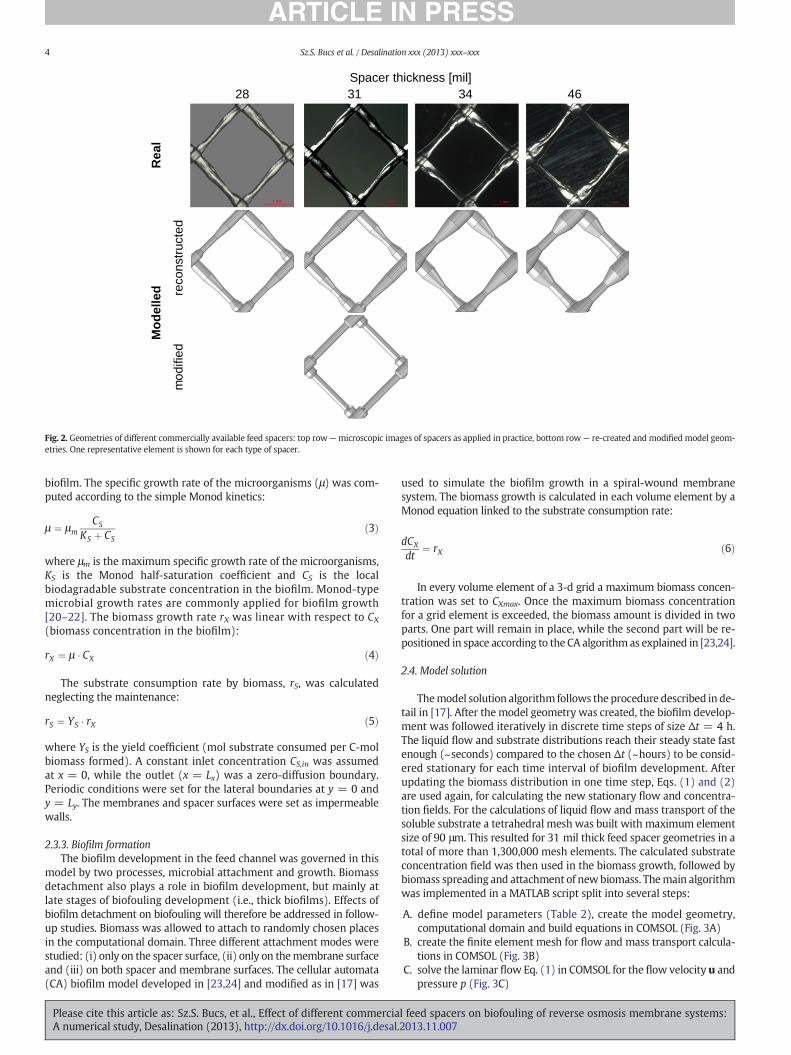
Geometries corresponding to four commercially available feedspacers used in full-scale spiral-wound ROmodules were characterizedusing a calibrated stereomicroscope (Leica M205 FA), followed bymea-surements using Qwin Pro 3.1.0 software, then reconstructed in theCOMSOLMultiphysics environment. The studied spacers differ in thick-ness, porosity and their filament shapes. For each filament, severalcharacteristic dimensions were considered, according to Fig. 1A. Everyspacer is constructed from two perpendicular layers of filaments(Fig. 1B), and the filaments from each layer have a unique shape. Thespacer filaments differ mainly in their diameter, with several specificregions identified for all filaments determining a characteristic shape,as shown in Fig. 1A. The dimensions and the flow channel porosity foreach spacer type are presented in Table 1. Additionally, a hypothetical31 mil thick modified spacer geometry was created to study the effecton feed channel porosity of spacers having the same thickness butdifferent filament dimensions.
The spacer geometries used in commercially available RO and NFmodules have standard thicknesses, but they can be provided by dif-ferent manufacturers and produced by different technologies, whichmay lead to diverse spacer geometries. These spacers vary especiallywith respect to the spacer unit length Ltot and the flow channel po-rosity (Table 1). All studied commercial feed spacers are displayedin Fig. 2.
2.2. Computational domain
The standard size of the industrial spiral-wound RO and NF moduleis a length of 40 in. (~1 m) and a diameter of 8 in. (~0.2 m)with a totalmembrane surface area of ~40 m2. A numerically accurate three-dimensional model of flow and biofilm formation in such a large areais virtually impossible within current computational limits. Still,because of the repetitive unit spacer geometry, the essential flow andbiofilm formation patterns can be captured within a smaller scale com-putational domain. The size of the computational domain used in thisstudy is in the range of 10−5 m2. The exact length, width and heightof the computational domain differs with the spacer geometry. In allcases, five spacer units in diamond configuration (i.e., 45° rotatedagainst the main flow direction) were placed in the computationaldomain (Fig. 1C). This is the current compromise between the necessarycalculation time and model realism.
The computational domain consisted of feed channel volumeavailable for flow and resulted from subtracting the spacer volumefrom a box bounded by membranes, inlet, outlet and lateral surfaces(Fig. 1C). An imprint of the feed channel spacer on the membranescan be observed during autopsies of spiral-wound RO modules, whichsuggests that the spacer filaments are actually pressing into the mem-branes on a sizeable contact area. Therefore, the flow channel wasconstructed so that the twomembrane planes cut 5 μm from the spacertop and bottom [11]. In addition to more realistic model geometry,this construction also avoids very sharp angles in contact areas, whichusually lead to computational difficulties and many unnecessarilysmall mesh elements.
l feed spacers on biofouling of reverse osmosis membrane systems:2013.11.007
A B
Membranes, wall
Outlet
Periodic
Spacer, wall
Inlet
PeriodicC
Fig. 1.Model feed spacer geometry and computational domain. (A) General representation of spacer filaments with measured characteristic dimensions (see Table 1); (B) Reconstructedgeometry of a representative feed spacer unit varying in filament thickness, as applied in practice in spiral-woundmodules for water treatment; (C) Computational domain and boundaryconditions.
3Sz.S. Bucs et al. / Desalination xxx (2013) xxx–xxx
2.3. Liquid flow, substrate transport and biofilm formation
Processes influencing biofouling may occur at very different timescales. Therefore, while the slow biofilm formation was evaluated indynamic conditions (i.e., in time), the fast hydrodynamics and solublesubstrate transport were considered stationary at each time step duringbiofilm development. More details regarding the time scale separationin biofilm models can be found in [18].
2.3.1. Liquid flowIt was shown by Fimbres-Weihs and Wiley [10] that the water flow
in feed channels with spacers is laminar up to a Reynolds number (Re)of 200 for spacers with 45° orientation of filaments, but becomes un-steady for Re between 200 and 300. Re numbers were computed ac-cording to Schock and Miquel [19]. For all geometries Re was less than200, therefore the Navier–Stokes equations were used to model thelaminar, incompressible and stationary flowwhichwas assumed duringthe whole simulation process:
ρ u �∇ð Þuþ∇P ¼ ∇ � η∇uð Þ; ∇ � u ¼ 0 ð1Þ
Table 1Dimensions of different types of feed spacers used in this study, according to Fig. 1. For each spacolumns: (A) thinner filament and (B) thicker filament.
Spacer thickness (mil)
28 mil 31 mil
A B A
Dimensions (μm) L1 862 877 983L2 595 740 557L3 767 595 358L4 178 252 340L5 386 324 542D1 354 449 447D2 221 289 263Ltot 2788 2788 2780Dtot 711 787Channel porosity 0.90 0.89
Please cite this article as: Sz.S. Bucs, et al., Effect of different commerciaA numerical study, Desalination (2013), http://dx.doi.org/10.1016/j.desal.
with u = (ux, uy, uz) the flow velocity vector, p the pressure, ρ the den-sity andη thedynamic viscosity ofwater. The boundary conditionswereset according to Fig. 1C. Fully developed laminar flow was assumed atthe inlet x = 0, with the average fluid velocity uin. On the outlet bound-ary at x = Lx, zero pressure (arbitrarily chosen as reference value) andno viscous stress conditions were imposed. The top and bottom mem-brane surfaces (z = 0 and z = Lz), as well as the whole spacer surfacewere no-slip walls (u = 0). On the lateral boundaries (y = 0 andy = Ly) periodic conditions were applied, as frequently used in simula-tions for geometries with a repeating pattern [13].
2.3.2. Substrate transport and reactionBiomass grows in spiral-wound membrane modules as function of
local concentrations of biodegradable substrates. The concentrationfield, CS, of a single soluble substrate assumed here limiting for biomassgrowth was calculated from a convection–diffusion–reaction equation:
DS∇2CS−u∇CS þ rS ¼ 0 ð2Þ
with diffusion coefficient of substrateDS. The substrate is transported byconvection and diffusion in the bulk liquid and only by diffusion in the
cer type, the filament dimensions (in μm) for the two layers of filaments are presented in
31 mil modified 34 mil 46 mil
B A B A B A B
299 400 400 234 281 364 171132 100 100 389 535 346 420417 1780 1780 500 92 561 713
1036 100 100 696 878 526 518896 400 400 566 599 614 589446 446 446 422 445 563 544272 263 263 223 223 315 274
2780 2780 2780 2385 2385 2411 2411787 863 11680.92 0.88 0.88
l feed spacers on biofouling of reverse osmosis membrane systems:2013.11.007
Spacer thickness [mil]28 31 34 46
Rea
lM
od
elle
d reco
nstr
ucte
dm
odifi
ed
Fig. 2. Geometries of different commercially available feed spacers: top row—microscopic images of spacers as applied in practice, bottom row— re-created and modified model geom-etries. One representative element is shown for each type of spacer.
4 Sz.S. Bucs et al. / Desalination xxx (2013) xxx–xxx
biofilm. The specific growth rate of the microorganisms (μ) was com-puted according to the simple Monod kinetics:
μ ¼ μmCS
KS þ CSð3Þ
where μm is the maximum specific growth rate of the microorganisms,KS is the Monod half-saturation coefficient and CS is the localbiodagradable substrate concentration in the biofilm. Monod-typemicrobial growth rates are commonly applied for biofilm growth[20–22]. The biomass growth rate rX was linear with respect to CX
(biomass concentration in the biofilm):
rX ¼ μ � CX ð4Þ
The substrate consumption rate by biomass, rS, was calculatedneglecting the maintenance:
rS ¼ YS � rX ð5Þ
where YS is the yield coefficient (mol substrate consumed per C-molbiomass formed). A constant inlet concentration CS,in was assumedat x = 0, while the outlet (x = Lx) was a zero-diffusion boundary.Periodic conditions were set for the lateral boundaries at y = 0 andy = Ly. The membranes and spacer surfaces were set as impermeablewalls.
2.3.3. Biofilm formationThe biofilm development in the feed channel was governed in this
model by two processes, microbial attachment and growth. Biomassdetachment also plays a role in biofilm development, but mainly atlate stages of biofouling development (i.e., thick biofilms). Effects ofbiofilm detachment on biofouling will therefore be addressed in follow-up studies. Biomass was allowed to attach to randomly chosen placesin the computational domain. Three different attachment modes werestudied: (i) only on the spacer surface, (ii) only on themembrane surfaceand (iii) on both spacer and membrane surfaces. The cellular automata(CA) biofilm model developed in [23,24] and modified as in [17] was
Please cite this article as: Sz.S. Bucs, et al., Effect of different commerciaA numerical study, Desalination (2013), http://dx.doi.org/10.1016/j.desal.
used to simulate the biofilm growth in a spiral-wound membranesystem. The biomass growth is calculated in each volume element by aMonod equation linked to the substrate consumption rate:
dCX
dt¼ rX ð6Þ
In every volume element of a 3-d grid a maximum biomass concen-tration was set to CXmax. Once the maximum biomass concentrationfor a grid element is exceeded, the biomass amount is divided in twoparts. One part will remain in place, while the second part will be re-positioned in space according to the CA algorithm as explained in [23,24].
2.4. Model solution
Themodel solution algorithm follows the procedure described in de-tail in [17]. After the model geometry was created, the biofilm develop-ment was followed iteratively in discrete time steps of size Δt = 4 h.The liquid flow and substrate distributions reach their steady state fastenough (~seconds) compared to the chosen Δt (~hours) to be consid-ered stationary for each time interval of biofilm development. Afterupdating the biomass distribution in one time step, Eqs. (1) and (2)are used again, for calculating the new stationary flow and concentra-tion fields. For the calculations of liquid flow and mass transport of thesoluble substrate a tetrahedral mesh was built with maximum elementsize of 90 μm. This resulted for 31 mil thick feed spacer geometries in atotal of more than 1,300,000 mesh elements. The calculated substrateconcentration field was then used in the biomass growth, followed bybiomass spreading and attachment of newbiomass. Themain algorithmwas implemented in a MATLAB script split into several steps:
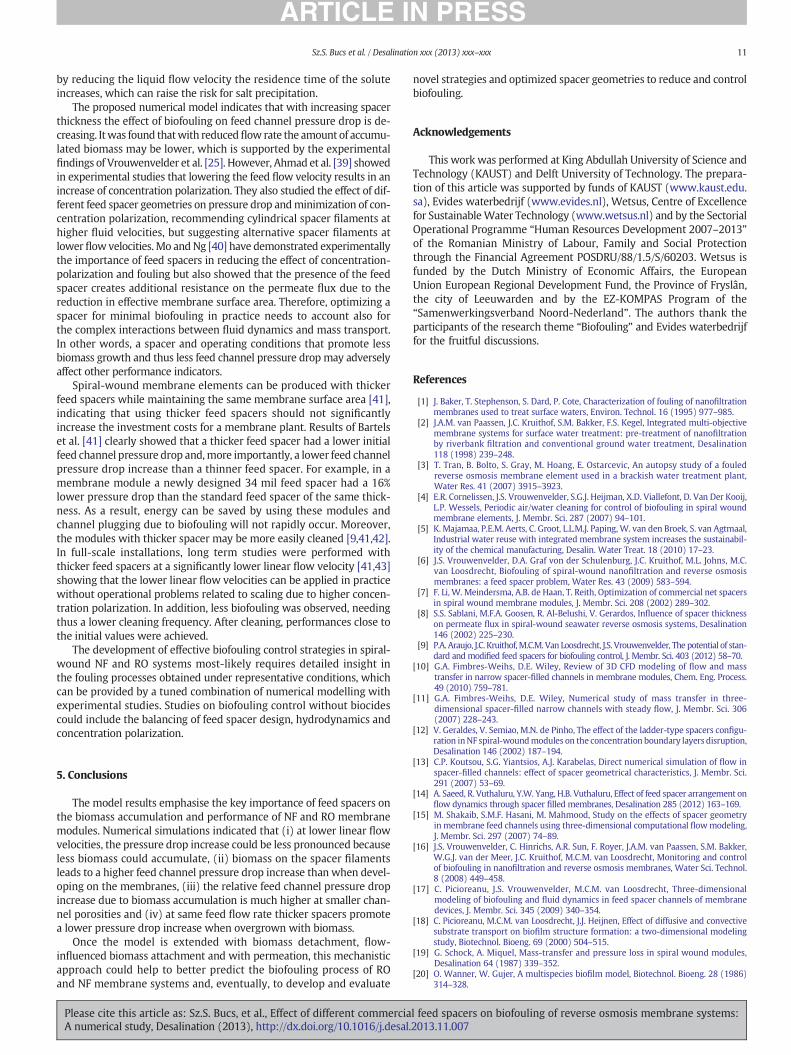
A. define model parameters (Table 2), create the model geometry,computational domain and build equations in COMSOL (Fig. 3A)
B. create the finite element mesh for flow and mass transport calcula-tions in COMSOL (Fig. 3B)
C. solve the laminar flow Eq. (1) in COMSOL for the flow velocity u andpressure p (Fig. 3C)
l feed spacers on biofouling of reverse osmosis membrane systems:2013.11.007

Table 2Model parameters.
Parameter Symbol Value Unit Source
Maximum biomass concentration in a grid element CXmax 1400 mol∙m−3 [14]Biomass maximum specific growth rate μm 1.25 × 10⁻⁵ s−1 ChosenSubstrate half-saturation coefficient KS 0.05 mol∙m−3 ChosenSubstrate concentration in the inlet CS,in 0.4 mol∙m−3 ChosenYield of substrate consumed per C-mol biomass YS 1 mol∙(Cmol)−1 Corresponding to acetateDiffusion coefficient of substrate DS 1 × 10⁻⁹ m2∙s−1 Small solute in waterLiquid density ρ 1000 kg∙m−3 WaterLiquid viscosity η 0.001 Pa∙s Water
5Sz.S. Bucs et al. / Desalination xxx (2013) xxx–xxx
D. solve substrate transport-reaction Eq. (2) for concentration CS(Fig. 3D)
E. evaluate biomass growth from Eq. (6) to get a new CX; transportbiomass by the CA method; attach new biomass (Fig. 3E). Afterthis biomass update the time is incremented with Δt and the algo-rithm flow returns to step C.
3. Results
The model was used to investigate the effect of linear flow velocity,bacterial cell load, biomass attachment location, and different commer-cially available and modified feed spacer geometries on biofouling andfeed channel pressure drop evolution. All simulated cases are listed inTable 3.
3.1. Effect of linear flow velocity
The linear flow velocity varies along the length of a membrane fil-tration installation, consisting of several membrane elements installedin series. Also, a variation of linear flow velocities has been reportedin the lead membrane elements in practice, from 0.07 to about0.2 m·s−1 [25].
Numerical simulations were run with different linear flow velocitiesand comparedwith experimental data (feed channel pressure drop, pres-sure drop increase) obtained in similar conditions byVrouwenvelder et al.[22] in experimental studies with membrane fouling simulators (MFS).For this set of simulations the 31 mil (787 μm) thick feed spacer geome-try was used at different linear flow velocities of uin = 0.163 m·s−1
(corresponding to hydrodynamic conditions frequently encountered inindustry), 0.082 m·s−1 and 0.041 m·s−1, the other model parametersbeing set as listed in Tables 2 and 3.
The initial pressure drop in absence of fouling (Fig. 4A, day 0)showed a small difference (b10%) between the simulation and experi-mental initial pressure drop. This difference may be due to e.g. thevariations in thickness and geometry of the spacer used in the experi-ments, but also to assumptions in the model calculations.
A B C
Geometry Mesh Flow
Fig. 3. Graphical representation of the model algorithm. The arrows indicate the sequence ofgeometry in MATLAB and COMSOL; (B) creates the 3-d tetrahedral mesh and 3-d rectanguhalf the flow channel height); (D) calculates substrate concentration (colour scale: solute dand (E) biomass attachment and growth (brown volume: biomass). In all the top-view figurethe references to colour in this figure legend, the reader is referred to the web version of this a
Please cite this article as: Sz.S. Bucs, et al., Effect of different commerciaA numerical study, Desalination (2013), http://dx.doi.org/10.1016/j.desal.
In time, the development of pressure drop caused by biofilmaccumulation resulted in a similar trend for both model simulationsand experimental studies. Small dissimilarities between the calculatedand measured data are observed. The amount of accumulated biomasswas the same at the end of the simulation studies (day 6), since thesame biomass attachment rate was used for all simulations and no de-tachmentwas considered.With increasing linearflowvelocity the effectof the accumulated fouling material (biomass) on pressure dropincreased (Fig. 4B). These results show that by applying a lower linearvelocity the impact of the foulingmaterial on performance can be signif-icantly reduced. In summary, the biofouling model describes existingexperimental observations for pressure drop and pressure drop increasewell. However, in reality the linear velocity has more complex implica-tions in terms of substrate load, bacterial transport and deposition rates,as well as biomass detachment rates. All of these factors impact theamount of accumulated biomass and, consequently, the feed channelpressure drop.
3.2. Effect of bacterial cell load
The biofouling onset may also be affected by the bacterial cell load(i.e., cell concentration multiplied by linear flow velocity) in the feedchannel. It is expected that when increasing the liquid flow rate, moremicroorganisms would pass through the channel per unit time [26],therefore more cell attachment could take place due to the higher cellsupply and higher shear rate. Eventually, a maximum deposition rateexists function of wall shear rate [27]. Because the decreased depositionefficiency at high shear rates relates to detachment rates, not includedin our model, this effect has to be systematically checked in futurestudies. For investigating the effect of cell load on performance decline,the 31 mil (787 μm) thick feed spacer was used in numerical simula-tions at different flow and cell attachment rates (Table 3). Three caseswere studied when the transported amount of biomass varied withflow rate: the cell attachment rate was reduced proportionally withthe reduction in flow rate. Comparing the results obtained at differentlinear flow velocities and constant attachment rate (see Table 3, effect
D E
Soluble substrate Biomass
algorithm steps, with a loop between steps (C) and (E). (A) sets model parameters andlar biomass grid; (C) calculates fluid flow (blue arrows: local flow velocity in a slice atistribution in a slice at half the flow channel height; blue: minimum; red: maximum);s of the 3-d model system the spacer filaments are shown in grey. (For interpretation ofrticle.)
l feed spacers on biofouling of reverse osmosis membrane systems:2013.11.007

Table 3Variable model parameters in different simulations.
Spacer thickness [mil] [μm] ratta
[Cmol·m−2·h−1]uin
b [m·s−1] Qc [L·h−1] Attachment location Section
Effect of linear flow velocity 31 787 1.08 × 10⁻² 0.163 16.0 Membrane + spacer 3.10.082 8.00.041 4.0
Effect of bacterial cell load 31 787 1.08 × 10⁻² 0.163 16.0 Membrane + spacer 3.25.4 × 10−3 0.082 8.02.7 × 10−3 0.041 4.0
Effect of attachment location 31 787 1.08 × 10⁻² 0.163 16.0 Membrane spacer 3.3Membrane + spacer
Effect of spacer shape and channel porosity 3131 modified
787 1.08 × 10⁻² 0.163 16.0 Membrane + spacer 3.4.1
Effect of spacer thickness as applied in practice 3.4.2At constant flow rate 28 711 1.08 × 10⁻² 0.178 16.0 Membrane + spacer 3.4.2
31 787 0.16334 863 0.15346 1168 0.115
At constant linear velocity 28 711 1.08 × 10⁻² 0.163 14.6 Membrane + spacer 3.4.231 787 16.034 863 16.946 1168 22.6
a Biomass attachment rate.b Average flow velocity in inlet.c Liquid volumetric flow rate (as experiments from [9]).
6 Sz.S. Bucs et al. / Desalination xxx (2013) xxx–xxx
of linear velocity: i.e., constant cell load) with those at flow-linkedattachment rate (see Table 3, effect of cell load: i.e., variable cell load)reveals that at lower linear fluid velocities the impact of accumulatedbiomass is lower. Possibly because of differences in hydrodynamicsand less biomass attachment in the flow channel (Fig. 5). Similarresults were obtained experimentally by Vrouwenvelder et al. [19–25]:with variable flow rate different amounts of biomass were found duringmembrane autopsy. However, there can be three causes for thisobservation: a higher substrate transfer rate leading to more biomassgrowth, more cell attachment due tomore biomass transported and de-posited and a combination ofmore growth andmore attachment. Theseresults suggest that the impact of biofouling in spiral-woundmembranemodulesmay be delayed by reducing the linear fluid velocity. However,in practice, applying lower linear flow velocities leads to an increase ofthe concentration polarization and to lower shear stress at the mem-brane surface, potentially affecting other types of fouling (e.g., scaling,colloidal) that may occur during RO operation.
3.3. Biomass location
Biofilm formation begins with bacterial transport followed by celladhesion. When cells become firmly attached to the support surface,growth into micro-colonies takes place, finally leading to a mature bio-film [28]. The adhesion of microorganisms in the NF and ROmembranesystems depends on the hydrodynamics [29] and on the surfaceproperties (hydrophobicity, surface charge, etc.) [30]. The preferentialplaces where cells attach in the initial phase of biofilm formation in NFand RO membranes are still unclear, but there are indications [31] thatbiofilm formation may be linked to the value of local shear stress in-duced by the liquid flow. It was reported that biofilm formation is notavoided by high shear stress conditions. On the contrary, biomass devel-oped under high shear was found to bemore compact and harder to re-move. This is also confirmed by industrial RO membrane moduleautopsies, for example, Tran et al. [3] found thicker biofilm layer under-neath or in the vicinity of feed spacer. On the other hand, other studiesindicate that biofilm formation beginsmainly in places behind the spac-er filament crossings [6,17,32], where the shear stress level is relativelylow.
With the numerical model of biofouling the consequences of bio-mass attachment at different locations on the development of the feed
Please cite this article as: Sz.S. Bucs, et al., Effect of different commerciaA numerical study, Desalination (2013), http://dx.doi.org/10.1016/j.desal.
channel pressure drop were investigated. Three different scenarios arepresented here, all with the same biomass attachment rate (Table 2):(i) attachment only to the membrane surface; (ii) random attachmentto both membrane and spacer surface and (iii) attachment only tothe spacer surface. Simulations were run with the same linear flowvelocity and inlet substrate concentration, using the 31 mil (787 μm)thick spacer geometry presented in Fig. 2. In the absence of biomass(at t = 0), the highest pressure drop occurs as the fluid passes betweenthe spacer filaments and membrane sheets [17]. The numerical resultsindicate that the accumulated biomass has a different influence onthe feed channel pressure drop when attached to the spacer surfacethan when attached to the membrane. The highest impact of the accu-mulated biomass on the feed channel pressure drop is observed whenthe biomass attached only to the feed spacer filaments (Fig. 6). Presenceof biomass on the spacer surface results in narrower flow channels in-creasing thus the local fluid velocity (Fig. 7) which leads to higher pres-sure drop (compare the pressure fields in Fig. 6C – biomass on spaceronly – , with those in Fig. 6A and B). The smallest pressure drop differ-ence was observed when biomass attachment was only allowed onthe membranes (Fig. 8A). Because the amount of accumulated biomasswas similar in all three cases (Fig. 8C), it can be concluded that there aresensitive locations in the feed spacer channel (especially in the middleof spacer fibres) where even a small amount of biomass could lead tohigh performance decline.
3.4. Spacer geometry
Various feed spacer geometries can be found in commercially avail-able NF and RO membrane modules. The main roles of spacers are toprovide an open channel for the flowing feed water and to promotemixing (i.e., intensify mass transfer and reduce concentration polariza-tion [3]). The disadvantages of using feed spacers include the increaseof feed channel pressure drop (an added resistance to flow) and theenhanced biofouling potential [3,6,33]. Feed spacers are most oftencharacterized by the manufacturers just by their thickness. Neverthe-less, it was shown that the distance, the angle between crossingfilaments and the filament orientation are also important for perfor-mance [34–37].
The main differences of spiral-wound membrane modules are dueto the installed membrane type and feed spacers geometry. This paper
l feed spacers on biofouling of reverse osmosis membrane systems:2013.11.007

A
B
5
4.5
4
3.5
3
2.5
2
1.5
1
0.5
0
Pre
ssu
re d
rop
[m
bar
/cm
]
1 2 3 4 5 6
Time [days]
0.041 [m/s]0.082 [m/s]0.163 [m/s]
0.041 [m/s]0.082 [m/s]0.163 [m/s]
2.5
2
1.5
1
0.5
0
Pre
ssu
re d
rop
incr
ease
[m
bar
/cm
]
experimental data modeled data
Linear flow velocity [m/s]
Fig. 4. Calculated and experimentally determined data at different linear flow velocities,for the 31 mil (787 μm) thick feed spacer. (A) Pressure drop in time during the biofoulingprocess (lines— calculated data, symbols—measured data); (B) pressure drop increase atday 6 relative to the initial pressure drop.
Fig. 5. Comparing the impact of linear fluid velocity and cell load on feed channel pres-sure drop. (A) Pressure drop in time (connected line — varying cell load, dashed linefor continuous cell load), (B) pressure drop increase due to biomass accumulation(day 6), and (C) accumulated biomass concentration at different linear flow velocities(day 6).
7Sz.S. Bucs et al. / Desalination xxx (2013) xxx–xxx
studies the effect of four different commercially available and one hypo-thetical feed spacer geometry on the feed channel pressure drop andpressure drop increase due to accumulation of biomass. The spacergeometries used in the industrial modules which are subject of thisstudy differ in their thickness and filaments shape. The simulation con-ditions, such as biomass attachment rate, substrate inlet concentrationand fluid linear flow velocity, were kept constant in all the cases.
3.4.1. Spacer shape and channel porosityThemodified spacer geometry does not represent an ideal feed spacer
geometry, but rather a simple hypothetical construct used to investi-gate the effect of a different filament shape with the same thicknesson performance decline. The numerical simulations clearly show howthe feed spacer resistance to flow can be reduced by increasing chan-nel porosity. Small changes in channel porosity (from 89% for commer-cial spacer to 92% for the modified spacer) led to significantly lowerinitial pressure drop (~20% lower) and less pressure drop increasein time in the presence of the same amount of biomass (Fig. 9). Thefeed channel spacer has a narrow area of contact with membrane
Please cite this article as: Sz.S. Bucs, et al., Effect of different commercial feed spacers on biofouling of reverse osmosis membrane systems:A numerical study, Desalination (2013), http://dx.doi.org/10.1016/j.desal.2013.11.007

4.50
pressure [mbar]
1 mm
B
A
C
Fig. 6. Liquid pressure and biofilm developed in the feed channel for different biomassattachment scenarios (day 6): (A) biomass attachment only on the membrane surface,(B) biomass attachment randomly on both membrane and spacer, (C) biomass attach-ment only on the feed spacer. The grown biomass is shown in brown and feed spacer ingrey. The same amount of biomass developed in all three cases. The colour scale indicatesthe pressure in the plane situated at half the channel height, z = 394 μm. The arrow indi-cates the flow direction.
0 0.5velocity [m/s]
A
B
C
1 mm
Fig. 7. Fluid velocity and biofilm developed in the feed channel for different biomassattachment scenarios (day 6). (A) biomass attachment only on the membrane surface,(B) biomass attachment randomly on both membrane and spacer, (C) biomass attach-ment only on the feed spacer. The grown biomass is shown in brown (day 6) and feedspacer in grey. The same amount of biomass developed in all three cases. The colourscale indicates the magnitude of fluid flow velocity in the plane situated at z = 197 μm.The arrow indicates the flow direction.
8 Sz.S. Bucs et al. / Desalination xxx (2013) xxx–xxx
sheets at the cross section of the filaments. The same thickness at thefilament crossings and reduced filament thickness elsewhere, result in ahigher feed channel spacer porosity and consequently in a lower pressuredrop increase. These results suggest that beside the spacer thickness (giv-ing channel height), spacer mesh size (distance between filament cross-sections) and the fluid flow attack angle, the filament shape (especiallyits thickness and thickness variation) is also important for feed channelpressure drop and the impact of biomass on pressure drop increase.
3.4.2. Spacer thicknessIndustrial RO and NF membrane modules are available with feed
spacers differing in thickness. We studied the effect on feed channelpressure drop of four different geometries corresponding to feedspacers used in commercially available spiral-wound RO/NF modules.The studied spacers displayed in Fig. 2 differed in thickness (28, 31, 34and 46 mil), porosity and filament shape, and their spatial dimensionsare listed in Table 1. Two sets of simulationswere run: (i) with constantflow rate, 16 L·h−1 (i.e., different linear flow velocities for differentspacer thickness) and (ii) constant linear flow velocity 0.163 m·s−1
(corresponding to various flow rates).In case of constant flow rate the linear liquid velocity becomes a
function of the spacer thickness, with the highestfluid velocity achievedfor the narrower 28 mil (711 μm) spacer geometry. As expected, thehighest initial pressure drop was found for the thinnest spacer geome-try. Both initial pressure drop and pressure drop increase due to biofilmformation show a decreasing trend with increasing feed spacer thick-ness, as shown in Fig. 10A,B. The initial pressure drop is caused onlyby the presence of feed spacer, while the pressure drop increase is dueto biomass accumulation. Because the amount of accumulated biomasswas similar for each type of spacer (~7.1 ∙ 10−3 Cmol m−2 after6 days), due to identical attachment rate and substrate concentrationin all cases (with neglecting biomass detachment, which could have
Please cite this article as: Sz.S. Bucs, et al., Effect of different commerciaA numerical study, Desalination (2013), http://dx.doi.org/10.1016/j.desal.
also played a role), it was found that the feed channel pressure drop in-crease is less affected by biofouling when using thicker spacer.
In the second scenario, a constant linear flow velocity was applied at0.163 m s−1. This resulted in varying flow rates because of differentchannel thicknesses. Similar trend as for the simulations at constantflow rate were observed. Highest pressure drop was found with thethinnest (28 mil) and the lowest with the thickest (46 mil) feed spacer(Fig. 10C,D). However, the initial pressure drop is lower for the casewhere constant linear flow velocity was applied than for the case withconstantflow rate. The difference in pressure drop increase for differentspacer thicknesses is similar for the two scenarios, but the changebetween the different thick spacer geometries is smaller for the secondscenario. Results for both cases (constant linear flow velocity andconstant flow rate) are in good agreement with the experimental datareported in [9].
4. Discussion
The objectives of the numerical studies on biofouling developmentin spiral-wound NF and RO systems were to determine the influenceof (i) liquid flow velocity and cell load, (ii) biomass location on thefeed spacer andmembrane surfaces, and (iii) various feed spacer geom-etries (28, 31, 34 and 46 mil thick) as applied in practice as well as amodified geometry 31 mil feed spacer. The computer simulationswere in agreement with existing experimental data on the effectof liquid flow velocity (Fig. 4) on feed channel pressure drop andpressure drop increase caused by biofilm formation, indicating thatthe model describes experimental data well. Biomass attachment onthe feed spacer had the highest impact on pressure drop increase com-pared to attachment to themembrane only and both themembrane andspacer (Figs. 6–8). Comparison of an in practice applied 31 mil feed
l feed spacers on biofouling of reverse osmosis membrane systems:2013.11.007

31 mil modified 31 mil0
0.5
1
1.5
2
Pre
ssu
re d
rop
incr
ease
s [m
bar
/cm
]
Spacer geometry
1 2 3 4 5 61.5
2
2.5
3
3.5
4
4.5
Pre
ssu
re d
rop
[m
bar
/cm
]
Time [days]
31 mil modified31 mil
A
B
Fig. 9. Pressure drop for two feed spacer geometrieswith the same thickness and same ac-cumulated biomass amount, but differing in channel porosity. (A) pressure drop in time;(B) pressure drop increasewith biomass relative to the clean channel (day 6). Simulationswere performed with a 31 mil thick feed spacer as applied in commercially availablespiral-wound modules (connected line) and a 31 mil spacer modified for thinner fibres(dashed line).
A
B
C
membrane membrane + spacer
spacer
4.5
4
3.5
3
2.5
2
Pre
ssu
re d
rop
[m
bar
/cm
]
1 2 3 4 5 6
Time [days]
membranemembrane + spacerspacer
2.5
2
1.5
1
0.5
2
Pre
ssu
re d
rop
incr
ease
[m
bar
/cm
]
Attachment location
0.012
0.010
0.008
0.006
0.004
0.002
01 2 3 4 5 6
Time [days]
Acc
um
ula
ted
bio
mas
s [C
-mo
l/m2 ]
9Sz.S. Bucs et al. / Desalination xxx (2013) xxx–xxx
Please cite this article as: Sz.S. Bucs, et al., Effect of different commerciaA numerical study, Desalination (2013), http://dx.doi.org/10.1016/j.desal.
spacer with a modified 31 mil spacer geometry showed that the shapeof spacer filaments influences the pressure drop and the pressure dropincrease caused by biofilm accumulation (Fig. 9). A thicker feed spacerresulted in: reduced initial pressure drop and decreased effect of accu-mulated biomass on pressure drop increase (Fig. 10).
4.1. Numerical model evaluation
The numerical biofoulingmodel describes existing experimental ob-servations well. Compared to earlier numerical biofouling models, amore detailed geometry for the feed spacer was used (Figs. 1 and 2).
Fig. 8. Effect of biomass attachment location on the development of feed channel pressuredrop due to biofilm formation. (A) Pressure drop development in time; (B) pressure dropincrease relative to the clean channel (day 6); (C) accumulated biomass in the feed chan-nel. The biomass attachment was randomly allowed (i) only on the feed spacer filaments(red line), (ii) both on the membrane and spacer surface (blue line), and (iii) onlyon membrane (yellow line). (For interpretation of the references to colour in this figurelegend, the reader is referred to the web version of this article.)
l feed spacers on biofouling of reverse osmosis membrane systems:2013.11.007

28 mil 31 mil 34 mil 46 mil0
1
2
2.5
1.5
0.5Pre
ssu
re d
rop
incr
ease
[m
bar
/cm
]
Spacer thickness
28 mil 31 mil 34 mil 46 mil0
0.5
1
1.5
2
Spacer thickness
1 2 3 4 5 60.5
1
1.5
2
2.5
3
3.5
4
4.5
5
Pre
ssu
re d
rop
[m
bar
/cm
]
Time [days]
28 mil31 mil34 mil46 mil
1 2 3 4 5 61
1.5
2
2.5
3
3.5
4
4.5
Pre
ssu
re d
rop
[m
bar
/cm
]
Time [days]
28 mil31 mil34 mil46 mil
A B
C D
Pre
ssu
re d
rop
incr
ease
[m
bar
/cm
]
Fig. 10. Changes in feed channel pressure drop for different feed spacer thicknesses and geometries (28, 31, 34 and 46 mil thick feed spacers) as applied in commercially available mem-brane modules. (A,C) Pressure drop in time, (B,D) pressure drop increase relative to the clean channel (day 0). Results at: (A,B) constant flow rate (16 L·h−1); (C,D) constant linear flowvelocity (0.163 m s−1).
10 Sz.S. Bucs et al. / Desalination xxx (2013) xxx–xxx
Also, the numerical model developed by Picioreanu et al. [17] has beenimplemented successfully in a more efficient computer code couplingCOMSOL Multiphysics solvers (COMSOL 4.3a, Comsol Inc., Burlington,MA, www.comsol.com) for fluid dynamics and solute transport withMATLAB (MATLAB 2011a, MathWorks, Natick, MA, www.mathworks.com) code for biofilm formation.
Possible future implementations into the model can be biodegrad-able substrate limitation and biomass detachment. The amount of ac-cumulated biomass in an NF and RO membrane module mostlydepends on the available biodegradable substrate concentration andhydrodynamics [25]. Although formally taken into account, the sub-strate limitation was not very effective due to the chosen combinationof CS and KS and, as a result, the biomass grew unlimited. If the bio-mass growth was substrate-limited, then in certain conditions thepermeate flux may also have an effect on the biomass growth rateby providing more substrate near the membrane [38]. Biofilm detach-ment was absent in the model. The biofilm was allowed to developinside the computational domain without taking in considerationthe shearing effect of hydrodynamics. These aspects will be taken
Please cite this article as: Sz.S. Bucs, et al., Effect of different commerciaA numerical study, Desalination (2013), http://dx.doi.org/10.1016/j.desal.
into account in the future model versions. How significantly thesemodel limitations affect the main conclusions reached in this studyremains to be evaluated in future investigations. However, thematch between model results and experiments from Araujo et al.[9] suggests that the model already accounted for the main processesaffecting the biofouling process.
4.2. Importance of feed spacer for biofouling
One of the factors with strong impact on the operational costs ofspiral-wound RO and NF membrane water desalination plants is thepressure drop increase along the modules. The feed channel pressuredrop is a result of frictional forces when the fluid flows through themodule. The initial pressure drop in an ROmodule when the feed chan-nel is clean (i.e., no fouling material has accumulated onmembranes orspacer) ismainly the result of the feed spacer resistance, which dependson the spacer geometry. It was suggested that by decreasing the linearflow velocity the initial pressure drop can be reduced [32]. However,
l feed spacers on biofouling of reverse osmosis membrane systems:2013.11.007
11Sz.S. Bucs et al. / Desalination xxx (2013) xxx–xxx
by reducing the liquid flow velocity the residence time of the soluteincreases, which can raise the risk for salt precipitation.
The proposed numerical model indicates that with increasing spacerthickness the effect of biofouling on feed channel pressure drop is de-creasing. Itwas found thatwith reducedflow rate the amount of accumu-lated biomass may be lower, which is supported by the experimentalfindings of Vrouwenvelder et al. [25]. However, Ahmad et al. [39] showedin experimental studies that lowering the feed flow velocity results in anincrease of concentration polarization. They also studied the effect of dif-ferent feed spacer geometries on pressure drop andminimization of con-centration polarization, recommending cylindrical spacer filaments athigher fluid velocities, but suggesting alternative spacer filaments atlowerflowvelocities. Mo andNg [40] have demonstrated experimentallythe importance of feed spacers in reducing the effect of concentration-polarization and fouling but also showed that the presence of the feedspacer creates additional resistance on the permeate flux due to thereduction in effective membrane surface area. Therefore, optimizing aspacer for minimal biofouling in practice needs to account also forthe complex interactions between fluid dynamics and mass transport.In other words, a spacer and operating conditions that promote lessbiomass growth and thus less feed channel pressure drop may adverselyaffect other performance indicators.
Spiral-wound membrane elements can be produced with thickerfeed spacers while maintaining the same membrane surface area [41],indicating that using thicker feed spacers should not significantlyincrease the investment costs for a membrane plant. Results of Bartelset al. [41] clearly showed that a thicker feed spacer had a lower initialfeed channel pressure drop and,more importantly, a lower feed channelpressure drop increase than a thinner feed spacer. For example, in amembrane module a newly designed 34 mil feed spacer had a 16%lower pressure drop than the standard feed spacer of the same thick-ness. As a result, energy can be saved by using these modules andchannel plugging due to biofouling will not rapidly occur. Moreover,the modules with thicker spacer may be more easily cleaned [9,41,42].In full-scale installations, long term studies were performed withthicker feed spacers at a significantly lower linear flow velocity [41,43]showing that the lower linear flow velocities can be applied in practicewithout operational problems related to scaling due to higher concen-tration polarization. In addition, less biofouling was observed, needingthus a lower cleaning frequency. After cleaning, performances close tothe initial values were achieved.
The development of effective biofouling control strategies in spiral-wound NF and RO systems most-likely requires detailed insight inthe fouling processes obtained under representative conditions, whichcan be provided by a tuned combination of numerical modelling withexperimental studies. Studies on biofouling control without biocidescould include the balancing of feed spacer design, hydrodynamics andconcentration polarization.
5. Conclusions
The model results emphasise the key importance of feed spacers onthe biomass accumulation and performance of NF and RO membranemodules. Numerical simulations indicated that (i) at lower linear flowvelocities, the pressure drop increase could be less pronounced becauseless biomass could accumulate, (ii) biomass on the spacer filamentsleads to a higher feed channel pressure drop increase than when devel-oping on the membranes, (iii) the relative feed channel pressure dropincrease due to biomass accumulation is much higher at smaller chan-nel porosities and (iv) at same feed flow rate thicker spacers promotea lower pressure drop increase when overgrown with biomass.
Once the model is extended with biomass detachment, flow-influenced biomass attachment and with permeation, this mechanisticapproach could help to better predict the biofouling process of ROand NF membrane systems and, eventually, to develop and evaluate
Please cite this article as: Sz.S. Bucs, et al., Effect of different commerciaA numerical study, Desalination (2013), http://dx.doi.org/10.1016/j.desal.
novel strategies and optimized spacer geometries to reduce and controlbiofouling.
Acknowledgements
This work was performed at King Abdullah University of Science andTechnology (KAUST) and Delft University of Technology. The prepara-tion of this article was supported by funds of KAUST (www.kaust.edu.sa), Evides waterbedrijf (www.evides.nl), Wetsus, Centre of Excellencefor SustainableWater Technology (www.wetsus.nl) and by the SectorialOperational Programme “Human Resources Development 2007–2013”of the Romanian Ministry of Labour, Family and Social Protectionthrough the Financial Agreement POSDRU/88/1.5/S/60203. Wetsus isfunded by the Dutch Ministry of Economic Affairs, the EuropeanUnion European Regional Development Fund, the Province of Fryslân,the city of Leeuwarden and by the EZ-KOMPAS Program of the“Samenwerkingsverband Noord-Nederland”. The authors thank theparticipants of the research theme “Biofouling” and Evides waterbedrijffor the fruitful discussions.
References
[1] J. Baker, T. Stephenson, S. Dard, P. Cote, Characterization of fouling of nanofiltrationmembranes used to treat surface waters, Environ. Technol. 16 (1995) 977–985.
[2] J.A.M. van Paassen, J.C. Kruithof, S.M. Bakker, F.S. Kegel, Integrated multi-objectivemembrane systems for surface water treatment: pre-treatment of nanofiltrationby riverbank filtration and conventional ground water treatment, Desalination118 (1998) 239–248.
[3] T. Tran, B. Bolto, S. Gray, M. Hoang, E. Ostarcevic, An autopsy study of a fouledreverse osmosis membrane element used in a brackish water treatment plant,Water Res. 41 (2007) 3915–3923.
[4] E.R. Cornelissen, J.S. Vrouwenvelder, S.G.J. Heijman, X.D. Viallefont, D. Van Der Kooij,L.P. Wessels, Periodic air/water cleaning for control of biofouling in spiral woundmembrane elements, J. Membr. Sci. 287 (2007) 94–101.
[5] K. Majamaa, P.E.M. Aerts, C. Groot, L.L.M.J. Paping, W. van den Broek, S. van Agtmaal,Industrial water reuse with integrated membrane system increases the sustainabil-ity of the chemical manufacturing, Desalin. Water Treat. 18 (2010) 17–23.
[6] J.S. Vrouwenvelder, D.A. Graf von der Schulenburg, J.C. Kruithof, M.L. Johns, M.C.van Loosdrecht, Biofouling of spiral-wound nanofiltration and reverse osmosismembranes: a feed spacer problem, Water Res. 43 (2009) 583–594.
[7] F. Li, W. Meindersma, A.B. de Haan, T. Reith, Optimization of commercial net spacersin spiral wound membrane modules, J. Membr. Sci. 208 (2002) 289–302.
[8] S.S. Sablani, M.F.A. Goosen, R. Al-Belushi, V. Gerardos, Influence of spacer thicknesson permeate flux in spiral-wound seawater reverse osmosis systems, Desalination146 (2002) 225–230.
[9] P.A. Araujo, J.C. Kruithof,M.C.M. Van Loosdrecht, J.S. Vrouwenvelder, The potential of stan-dard and modified feed spacers for biofouling control, J. Membr. Sci. 403 (2012) 58–70.
[10] G.A. Fimbres-Weihs, D.E. Wiley, Review of 3D CFD modeling of flow and masstransfer in narrow spacer-filled channels in membrane modules, Chem. Eng. Process.49 (2010) 759–781.
[11] G.A. Fimbres-Weihs, D.E. Wiley, Numerical study of mass transfer in three-dimensional spacer-filled narrow channels with steady flow, J. Membr. Sci. 306(2007) 228–243.
[12] V. Geraldes, V. Semiao, M.N. de Pinho, The effect of the ladder-type spacers configu-ration inNF spiral-woundmodules on the concentration boundary layers disruption,Desalination 146 (2002) 187–194.
[13] C.P. Koutsou, S.G. Yiantsios, A.J. Karabelas, Direct numerical simulation of flow inspacer-filled channels: effect of spacer geometrical characteristics, J. Membr. Sci.291 (2007) 53–69.
[14] A. Saeed, R. Vuthaluru, Y.W. Yang, H.B. Vuthaluru, Effect of feed spacer arrangement onflow dynamics through spacer filled membranes, Desalination 285 (2012) 163–169.
[15] M. Shakaib, S.M.F. Hasani, M. Mahmood, Study on the effects of spacer geometryin membrane feed channels using three-dimensional computational flowmodeling,J. Membr. Sci. 297 (2007) 74–89.
[16] J.S. Vrouwenvelder, C. Hinrichs, A.R. Sun, F. Royer, J.A.M. van Paassen, S.M. Bakker,W.G.J. van der Meer, J.C. Kruithof, M.C.M. van Loosdrecht, Monitoring and controlof biofouling in nanofiltration and reverse osmosis membranes, Water Sci. Technol.8 (2008) 449–458.
[17] C. Picioreanu, J.S. Vrouwenvelder, M.C.M. van Loosdrecht, Three-dimensionalmodeling of biofouling and fluid dynamics in feed spacer channels of membranedevices, J. Membr. Sci. 345 (2009) 340–354.
[18] C. Picioreanu, M.C.M. van Loosdrecht, J.J. Heijnen, Effect of diffusive and convectivesubstrate transport on biofilm structure formation: a two-dimensional modelingstudy, Biotechnol. Bioeng. 69 (2000) 504–515.
[19] G. Schock, A. Miquel, Mass-transfer and pressure loss in spiral wound modules,Desalination 64 (1987) 339–352.
[20] O. Wanner, W. Gujer, A multispecies biofilm model, Biotechnol. Bioeng. 28 (1986)314–328.
l feed spacers on biofouling of reverse osmosis membrane systems:2013.11.007

12 Sz.S. Bucs et al. / Desalination xxx (2013) xxx–xxx
[21] O. Wanner, H.J. Eberl, E. Morgenroth, D. Noguera, C. Picioreanu, B.E. Rittmann,M.C.M.V. Loosdrecht, Mathematical modeling of biofilms, IWA Scientific and TechnicalReport, London, 2006.
[22] M.T. Suidan, B.E. Rittmann, U.K. Traegner, Criteria establishing biofilm-kinetic types,Water Res. 21 (1987) 491–498.
[23] C. Picioreanu, M.C.M. van Loosdrecht, J.J. Heijnen, Mathematical modeling of biofilmstructure with a hybrid differential-discrete cellular automaton approach,Biotechnol. Bioeng. 58 (1998) 101–116.
[24] C. Picioreanu, M.C.M. van Loosdrecht, J.J. Heijnen, A new combined differential-discrete cellular automaton approach for biofilm modeling: application for growthin gel beads, Biotechnol. Bioeng. 57 (1998) 718–731.
[25] J.S. Vrouwenvelder, C. Hinrichs, W.G. Van der Meer, M.C. Van Loosdrecht, J.C.Kruithof, Pressure drop increase by biofilm accumulation in spiral wound RO andNF membrane systems: role of substrate concentration, flow velocity, substrateload and flow direction, Biofouling 25 (2009) 543–555.
[26] T. Paris, S. Skali-Lami, J.C. Block, Effect of wall shear rate on biofilm deposi-tion and grazing in drinking water flow chambers, Biotechnol. Bioeng. 97(2007) 1550–1561.
[27] E. Margalit, A. Leshansky, V. Freger, Modeling and analysis of hydrodynamic andphysico-chemical effects in bacterial deposition on surfaces, Biofouling 29 (2013)977–989.
[28] C.M. Pang, P.Y. Hong, H.L. Guo, W.T. Liu, Biofilm formation characteristics of bacterialisolates retrieved from a reverse osmosis membrane, Environ. Sci. Technol. 39(2005) 7541–7550.
[29] P. Stoodley, I. Dodds, J.D. Boyle, H.M. Lappin-Scott, Influence of hydrodynamics andnutrients on biofilm structure, J. Appl. Microbiol. 85 (1998) 19S–28S.
[30] S. Kang, H. Choi, Effect of surface hydrophobicity on the adhesion of S. cerevisiaeonto modified surfaces by poly(styrene-ran-sulfonic acid) random copolymers,Colloids Surf. B: Biointerfaces 46 (2005) 70–77.
[31] J.E. Duddridge, C.A. Kent, J.F. Laws, Effect of surface shear stress on the attachment ofPseudomonas fluorescens to stainless steel under defined flow conditions, Biotechnol.Bioeng. 24 (1982) 153–164.
Please cite this article as: Sz.S. Bucs, et al., Effect of different commerciaA numerical study, Desalination (2013), http://dx.doi.org/10.1016/j.desal.
[32] J.S. Vrouwenvelder, J. Buiter, M. Riviere, W.G. van der Meer, M.C. van Loosdrecht, J.C.Kruithof, Impact of flow regime on pressure drop increase and biomass accumula-tion and morphology in membrane systems, Water Res. 44 (2010) 689–702.
[33] W. Rukapan, B. Khananthai, C. Chiemchaisri, W. Chiemchaisri, T. Srisukphun,Short- and long-term fouling characteristics of reverse osmosis membrane atfull scale leachate treatment plant, Water Sci. Technol. 65 (2012) 127–134.
[34] G. Guillen, E.M.V. Hoek, Modeling the impacts of feed spacer geometry on re-verse osmosis and nanofiltration processes, Chem. Eng. J. 149 (2009) 221–231.
[35] C.P. Koutsou, A.J. Karabelas, Towards optimization of spacer geometrical characteris-tics for spiral woundmembrane modules, Desalin. Water Treat. 18 (2010) 139–150.
[36] C.P. Koutsou, S.G. Yiantsios, A.J. Karabelas, A numerical and experimental study ofmass transfer in spacer-filled channels: effects of spacer geometrical characteristicsand Schmidt number, J. Membr. Sci. 326 (2009) 234–251.
[37] A. Subramani, E.M.V. Hoek, Direct observation of initial microbial deposition onto re-verse osmosis and nanofiltration membranes, J. Membr. Sci. 319 (2008) 111–125.
[38] A.I. Radu, J.S. Vrouwenvelder, M.C.M. van Loosdrecht, C. Picioreanu, Effect of flowvelocity, substrate concentration and hydraulic cleaning on biofouling of reverseosmosis feed channels, Chem. Eng. J. 188 (2012) 30–39.
[39] A.L. Ahmad, K.K. Lau, M.Z. Abu Bakar, Impact of different spacer filament geometrieson concentration polarization control in narrow membrane channel, J. Membr. Sci.262 (2005) 138–152.
[40] H. Mo, H.Y. Ng, An experimental study on the effect of spacer on concentrationpolarization in a long channel reverse osmosis membrane cell, Water Sci. Technol.61 (2010) 2035–2041.
[41] C. Bartels, M. Hirose, H. Fujioka, Performance advancement in the spiral woundRO/NF element design, Desalination 221 (2008) 207–214.
[42] S.A. Creber, J.S. Vrouwenvelder, M.C.M. van Loosdrecht, M.L. Johns, Chemicalcleaning of biofouling in reverse osmosis membranes evaluated using magneticresonance imaging, J. Membr. Sci. 362 (2010) 202–210.
[43] K. Majamaa, J.E. Johnson, P.E.M. Aerts, Improved reverse osmosis element construc-tion reducingdifferential pressure in high fouling conditions, Proceedings IDAWorldCongress, Dubai, UAE, 2009, IDAWC/DB09-075, 2009.
l feed spacers on biofouling of reverse osmosis membrane systems:2013.11.007