Embed Size (px)
Citation preview
1
Effect of different extrusion treatments and particle size distribution on the physico-1
chemical properties of rice flour 2
3
Mario M. Martínez1, Adelina Calviño2, Cristina M. Rosell2, Manuel Gómez1* 4
1 Food Technology Area, E.T.S. Ingenierías Agrarias. Valladolid University, Ed. La Yutera, 5
Avd. Madrid 44, 34004 Palencia, Spain. 6
2 Institute of Agrochemistry and Food Technology (IATA-CSIC). Avda Agustin Escardino, 7. 7
Paterna-46980, Spain. 8
9
10
*Corresponding author e-mail: [email protected] 11
12
13
14
15
16
17

2
Abstract 18
Rice flour is an interesting alternative for developing gluten free products, but its features do not 19
always meet the process requirements. The objective of this study was to modify the functional 20
properties of rice flour by combining extrusion and size fractionation. Different extrusion 21
conditions (barrel temperature, feed moisture content and feed rate) were applied to vary the 22
severity of the treatment on the flour constituents. Extrusion and mechanical fractionation of the 23
rice flours modified their behavior affecting hydration, thermal and pasting features, besides 24
their susceptibility to enzymatic hydrolysis. Specifically, onset and peak temperature increased 25
and gelatinization enthalpy decreased when increasing barrel temperature of the extrusion. Fine 26
flours with stronger extrusion (high temperature barrel) showed the highest susceptibility to 27
enzymatic hydrolysis. Overall the combination of both physical treatments maybe an attractive 28
alternative for obtaining clean label rice flours with modified features. 29
30
31
Keywords: extrusion, rice flour, particle size, thermal properties, hydration, enzymatic 32
hydrolysis. 33
34
35

3
1. Introduction 36
Lately, there is an increasing interest for gluten free products that has prompted extensive 37
research, which has been mainly focused on improving the quality of gluten free products. 38
Nevertheless, the potential of flours from gluten free cereals has been scarcely exploited. 39
Physical treatments have the benefit over the chemical ones of changing starch functionalities 40
keeping the Green label (Jacobs & Delcour, 1998). 41
Rice flour functional properties are fully dependent on genotype and environmental conditions 42
(Yeh, 2004) and besides that, postharvest treatments could be an alternative for modulating flour 43
functional features. It is well known that rice grinding significantly affects rice flour properties, 44
like water binding capacity and swelling power (Perdon et al., 2001). Recently, it has been 45
shown that particle size fractionation of rice flour might be advisable for selecting specific 46
physico-chemical properties like different hydration properties and enzymatic starch hydrolysis 47
(de la Hera et al., 2013a); rheological properties (Moreira et al., 2013) or even oil barrier 48
properties (Lee et al., 2013). Moreover, those fractionated flours showed different processing 49
behaviour more suitable for bread or cake making depending on the particle size (de la Hera et 50
al., 2013b,c). 51
Thermal treatments are highly attractive to modify the functional properties of the cereal flours. 52
Extrusion cooking is considered high-temperature-short-time (HTST) during which flours are 53
submitted to high temperatures and mechanical shearing at relatively low levels of moisture 54
content (Camire et al., 1990). This treatment allows starch pregelatinization, denaturation of 55
protein, enzyme (in)activation, and Maillard reactions, the extent of which are dependent on the 56
severity of the extrusion. Those changes at the constituents’ level modify the rheological 57
behavior of flour (Hagenimana et al., 2006). During extrusion, the starch properties are 58

4
dependent on the temperature, initial moisture content and the screw speed (Wen et al., 1990). 59
By arising the intensity of the treatment is possible to break down the amylopectin chains 60
(Mercier & Feillet, 1975). In fact, Colonna et al. (1984) described that extruded wheat starches 61
have amylose and amylopectin chains of lower molecular weight than the ones obtained by 62
drum drying due to the shear effect, and that gave low thickening ability at low temperature 63
(Doublier et al., 1986). 64
The extrusion also promotes important nutritional changes in the flours, like an increase in the 65
soluble fiber content and a reduction in the lipid oxidation tendency, the content of 66
antinutritional factors and the microbial population (Camire et al, 1990). Besides, it could 67
increase the content of resistant starch in rice flours (Hagenimana et al, 2006), which is 68
dependent on the treatment intensity (Alsaffar, 2011). Extrusion cooking is responsible for 69
gelatinization and degradation of starch and also for changing the extent of molecular 70
associations between components, e.g. the amylose– lipid complex that can affect the in vitro 71
starch digestibility of the flours (Hagenimana et al, 2006). 72
Despite the impact of the extrusion on the molecular level, little attention has been paid to the 73
variation of the functional properties of the flours by hydrothermal treatments (Clerici et al., 74
2009), even though physically modified flours are considered to be natural materials with high 75
safety (Jacobs et al, 1998). In fact, Clerici et al. (2009) included 10% of extruded acid-modified 76
rice flours for making gluten free breads. When using rice flours extruded in the presence of 77
different amount of lactic acid, gluten free breads presented crust and crumb colour and texture 78
values similar to those of wheat bread, although specific volume was rather low. 79
Considering the influence of the flour fractionation on the functional properties of the rice flours 80
(de la Hera et al, 2013b), and the molecular changes induced by extrusion cooking, the 81
5
combination of both physical treatments could modify rice flour functional properties keeping 82
the green label. The aim of this study was to modify the functional properties of rice flour by 83
combining extrusion and size fractionation. With that purpose, different extrusion conditions 84
were applied to vary the severity of the treatment on the flour constituents. The impact of 85
processing on the flours was also followed by assessing the susceptibility of the flours to 86
enzymatic hydrolysis. 87
88
2. Materials and methods 89
2.1 Materials 90
Rice flours were provided by Harinera Los Pisones (Zamora, Spain) that carried out the 91
extrusion treatment in a single screw extruder Bühler Basf (Bühler S.A., Uzwil, Switzerland). 92
Extrusion parameters were chosen according to the manufacturer advice in order to achieve 93
flours with different properties. The length to diameter (L/D) ratio for the extruder was 20:1. 94
Rice flour was subjected to different extrusion intensities (barrel temperature, moisture content 95
of the mass feed and feed rate) yielding three types of extruded flours (1-3). Rice flour 1 and 2 96
were extruded at a maximum barrel temperature of 110ºC with a feed rate of 700kg/h. For flours 97
1 and 2 feed moisture content and screw speed was 17% and 30%, and 453rpm and 397rpm, 98
respectively. The diameter of the die hole and the number of holes used in those flours was 8mm 99
and 18 holes, respectively. Rice flour 3 was extruded at a maximum barrel temperature of 140ºC 100
with a feed-rate of 500kg/h and feed moisture content of 25%. The screw speed was 340rpm, the 101
diameter of the die hole was 6 mm and the number of holes was 9. The same rice flour (rice 102
flour 0) without any treatment was used as a control. 103
6
Extruded product was dried by convection air and then ground with a compression roller till 104
particle size was lower than 200 microns. Ground extrudates were sifted in a Bühler MLI 300B 105
(Bühler AG, Uzwil, Switzerland) with screens of 132 and 200 microns to obtain fine (f) – lower 106
than 132µm- and coarse (c) – 132µm-200 µm- extruded flours. 107
Flours were stored in air-tight plastic containers and held at 4°C until analysis. 108
Both the extruded and non-extruded flours were involved in the analytical measurements. 109
2.2 Methods 110
2.2.1. Flours characterization 111
Flours were analyzed following AACC method (AACC, 2012) for protein (AACC, 46-30.01) 112
with a Leco TruSpec device (Leco, St. Joseph, MI, USA). The particle size distribution was 113
measured using a particle size analyzer with laser diffraction Helos & Rodos (Sympatec, 114
Clausthal-Zellerfeld, Germany) following AACC method (AACC, 55-40.01). Determinations 115
were carried out in duplicate. 116
Free sugars 117
The glucose content was measured using a glucose oxidase-peroxidase (GOPOD) kit. The 118
absorbance was measured using an Epoch microplate reader (BIOTEK EPOCH, Izasa, 119
Barcelona, Spain) at 510 nm. In all cases four replicates were assayed for each experimental 120
point. 121
Damage starch 122
The content of damaged starch was determined according to AACC 76-30A method (AACC, 123
2012). A fungal enzyme from Aspergillus oryzae (A6211, Sigma Chemical Co., St. Louis, MO, 124
USA) was used in that analysis. Three determinations were made for each sample. Damaged 125
starch was expressed as percentage of flour weight on dry basis. 126

7
Hydration properties 127
Hydration properties included swelling and water binding capacity (WBC) (Nelson, 2001). 128
Swelling volume or the volume occupied by a known weight of flour was evaluated by mixing 129
5g (±0.1mg) of flour with 100ml distilled water and allowing it to hydrate during 16h. 130
Water binding capacity defined as the amount of water retained by the flour after it has been 131
subjected to centrifugation was measured as described the method 56.30 (AACC, 2012). 132
Determinations were carried out in duplicate. 133
Emulsifying properties 134
Flour suspension (360 mL) of 0.5% (w/v) starch concentration was mixed with commercial 135
sunflower oil (Langosta, F. Faiges S.L, Daimiel, Ciudad Real, Spain) (36 mL). The content was 136
stirred for one min with a beater (Taurus Bapi 350 CP/CM, Taurus, Oliana, Lérida, Spain) to 137
disperse the sample in the oil. The suspensions were then centrifuged at 800xg for 10 min. The 138
emulsifying capacity (EC) was calculated as: 139
EC=(ev/tv)*100 (Eq. 2) 140
where ev is the emulsion volume and tv is total volume. 141
Emulsion stability (ES) against high temperatures, were determined in the emulsions that were 142
heated in a water bath at 80ºC for 30 min, and centrifuged at 800xg for 10 min. ES was 143
calculated as: 144
ES=(fev/iev)*100 (Eq. 3) 145
146
where fev is the final emulsion volume and iev is initial emulsion volume. Determinations were 147
carried out in duplicate. 148
Foaming properties 149
8
Aliquots (150mL) of 4% w/v suspension were whipped at moderate speed for one min using a 150
beater (Taurus Bapi 350 CP/CM, Taurus, Oliana, Lérida, Spain). Foam volumes were recorded 151
after 30 s. The foam capacity (FC) was calculated as follows: 152
FC=(ifv/tsv)*100 (Eq. 4) 153
where ifv is the initial foam volume and tsv is the total suspension volume. 154
The foam stability (FS) was calculated as the foam volume after 20 min. 155
FS=(ffv/tsv)*100 (Eq. 5) 156
where ffv is the foam volume after 20 min and tsv is total suspension volume. Results were the 157
average of two determinations. 158
Pasting characteristics 159
Pasting properties of flours were analyzed using the standard method (AACC, 2012), (AACC, 160
61-02.01) with a Rapid Visco Analyser (RVA-4) (Newport Scientific Pty Ltd., Warriewood, 161
Australia) controlled by Thermocline software (Newport Scientific Pty. Limited, Warriewood, 162
Australia) for Windows. 163
Thermal properties 164
Analyses were performed in a differential scanning calorimeter DSC-7 (Perkin–Elmer, 165
Waltham, MA, USA), using aluminum pans (PE 0219-0062). The equipment was calibrated 166
with Indium and an empty pan was used as a reference. Flour (3 mg) was loaded into the 167
aluminum pan and distilled water (10µL) was added with the help of a Hamilton micro syringe. 168
Samples were hermetically sealed and allowed to stand for 1 h at room temperature before 169
heating in the DSC. The calorimeter scan conditions were set as follows: samples were kept at 170
30°C for 2 min, heated from 30 to 110ºC at 5ºC/min. Onset temperature (To), peak temperature 171
(Tp), gelatinization temperature range (Tp- To), peak height index (∆Hg/ Tp- To) as well as the 172

9
enthalpy of starch gelatinization (∆Hg) (expressed as mJ/mg of sample) were determined. All 173
samples were run in quadruplicate. 174
Colour of flours 175
Colour was measured using a Minolta CN-508i spectrophotometer (Minolta, Co.LTD, Tokyo, 176
Japan) with the D65 standard illuminant and the 2° standard observer. Results were expressed in 177
the CIEL*a*b* colour space. Colour determinations were made 5×2 times on each sample of 178
flour. 179
Enzymatic hydrolysis of starch 180
Starch hydrolysis was measured following the method described by Gularte and Rosell (2011) 181
with minor modifications. Briefly, for free sugars removal, flour sample (100 mg) suspended in 182
two milliliters of 80% ethanol was kept in a shaking water bath at 85ºC for five minutes, and 183
then centrifuged for 10 min at 1000×g. The pellet was incubated with porcine pancreatic α-184
amylase (10 mg/ml) (Type VI-B, ≥10 units/mg solid, Sigma Chemical, St. Louis, MO, USA) 185
and amyloglucosidase (3300 U/ml) (Sigma Chemical, St. Louis, MO, USA) in 10 ml of 0.1M 186
sodium maleate buffer (pH 6.0) in a shaking water bath at 37 ºC (0.25–16 h). Aliquots of 200 μl 187
were withdrawn during the incubation period. Aliquots were mixed with 200 μl of ethanol 188
(96%) to stop the enzymatic reaction and the sample was centrifuged for 5 min at 10000×g and 189
4 ºC. The precipitate was washed twice with 50% ethanol (100 μl) and the supernatants were 190
pooled together and kept at 4 ºC for further glucose determination. 191
The remnant starch after 16 h hydrolysis was solubilized with 2ml of 2M KOH using a Polytron 192
ultraturrax homogenizer IKA-T18 (IKA works, Wilmington, NC, USA) during 1min at speed 3. 193
The homogenate was diluted with 8ml 1.2M sodium acetate pH 3.8 and incubated with 100μl 194

10
amyloglucosidase (3300 U) at 50 ºC for 30 min in a shaking water bath. After centrifuging at 195
2000×g for 10 min, supernatant was kept for glucose determination. 196
The glucose content was measured using a glucose oxidase-peroxidase (GOPOD) kit. The 197
absorbance was measured using an Epoch microplate reader (Biotek Instruments, Winooski, VT, 198
USA) at 510 nm. Starch was calculated as glucose (mg)×0.9. Replicates (n=2-4) were carried 199
out for each determination. 200
Experimental data were fitted to a first-order equation (Goñi et al., 1997): 201
Ct = C∞ (1-e –kt ) Eq. 5 202
Where Ct is the concentration of glucose released at time t, C∞ is the concentration at the end 203
point, and k is the pseudo-first order rate constant. Although this equation requires the 204
estimation of an accurate C∞, it was useful because long reaction times were applied to 205
determine resistant starch after complete enzymatic hydrolysis. The plot of ln [(C∞ - Ct)/ C∞ ] = 206
–kt against t was used to estimate the slope that corresponded to –k. 207
However, as recently suggested Butterworth et al. (2012), the linear plot of ln (dC/dt) against t 208
was also represented to calculate the slope (-k), and the intercept on the y axis was used for 209
calculating the ln (k C∞). This plot was used to demonstrate if the data were of logarithmic form 210
and the rate constant remained unchanged along the whole hydrolysis reaction, as recommended 211
Poulsen et al. (2003). 212
2.2.2. Statistical analysis 213
Multiple analyses of variance were used to determine the individual effects of thermal treatment 214
and particle size of flours. Fisher’s least significant differences test was used to calculate the 215
means with their 95% confidence intervals. Several correlations were also run. The statistical 216

11
analysis was performed with the Statgraphics Plus Centurion XVI software (Statpoint 217
Technologies, Inc., Warrenton, VA, USA). 218
219
3. Results and Discussion 220
Rice flour was subjected to different extrusion treatments that differed on the maximum barrel 221
temperature and feed moisture content in order to obtain different extrusion intensities. de la 222
Hera et al. (2013b,c) reported the functional properties and processing behavior of fractionated 223
flours. Size fractionation allowed obtaining flours more suitable for bread or cake making 224
depending on the particle size. In this study, extruded flours were ground and then separated in 225
two fractions coarse extruded flour (132µm-200µm) and fine extruded flour (<132µm). Overall 226
eight samples were obtained from each batch, which differed on the level of extrusion (identified 227
as 0-3, higher values are related to higher intensity of extrusion conditions) and the particle size 228
(coarse, fine). Flour 0 was not subjected to any extrusion treatment and was used as a reference. 229
230
3.1 Damage starch and free sugars 231
To get a complete picture of the effect of extrusion and particle size a multiple analysis of 232
variance was applied to the experimental results (Table 1). The extrusion intensity (barrel 233
temperature, moisture content) and particle size (fine and coarse) had a significant effect on the 234
content of free sugars (Table 1), which increased with the extrusion temperature and moisture 235
content and with the reduction of the particle size (18.74% in coarse flour vs 24.21% in fine 236
flour). In fact, flour 3 (treated at higher barrel temperature) showed 49.91 % free sugars whereas 237
no treated flour (or flour 0) had a sugar content of 6.92%. Nevertheless, no significant 238
differences were observed between the free sugars content of the control (flour 0) and the mild 239
12
extrusion treatment (flour 1). Thus the hydrolysis responsible of the sugar release required a 240
minimum barrel temperature and also sufficient feed moisture content, since flours 1 and 2 were 241
extruded at the same temperature and with different moisture feeding. Extrusion induced a 242
progressive increase of the damage starch content with the temperature raise in the extrusion 243
treatment, likely due to damage produced by the shears force and the heat during extrusion 244
(Camire et al, 1990). Conversely, damage starch decreased with the particle size, showing coarse 245
flours the greatest amount of damage starch (19.98%), which agrees with the trend observed by 246
de la Hera et al. (2013a), when studying the features of different particle size fractions of rice 247
flours. 248
249
3.2 Hydration, emulsifying and foaming properties 250
Hydration, emulsifying and foaming properties were significantly affected by the extrusion 251
process (0-3) and the particle size of the flours (coarse and fine) (Table 1). Hydrations properties 252
(WBC and swelling) increased with the extrusion temperature and moisture content and also 253
with the particle size of the flour. WBC increased from 1.26 g water /g solid (flour 0) to 4.94 g 254
water /g solid when extrusion was carried out at the maximum temperature (flour 3). Those 255
effects were partially attributed to the increase in the amount of damage starch since it was 256
found a positive correlation between the amount of damage starch and WBC (r=0.88) and with 257
the swelling (r=0.88). Moreover, the cooking produced during extrusion led to gelatinized 258
starch that would have higher WBC and swelling, as occurred with the water absorption index 259
(Hagenimana et al, 2006). Camire et al. (1990) proposed that the breakage of the starch granule 260
integrity led to a poorly ordered molecular phase with hydroxyl groups prone to bind water 261
molecules. 262
13
The extrusion significantly reduced the emulsifying capacity (EC) of the flours, with the 263
exception of flour 3 (86.34), compared to the control flour (flour 0) (87.58), being the values for 264
flour 1 and 2, 84.92 and 85.70, respectively. And an increase of the EC was observed with the 265
severity of the extrusion, namely flour 3 (86.34)> flour 2 (85.70)> flour 1(84.92). That effect 266
must result from the protein and starch changes during extrusion process. Considering the 267
proteins, extrusion forces the unfolding and aggregation due to protein crosslinking involving 268
SH/SS interchange, oxidation and hydrophobic interactions (Rosell & Foegeding, 2007), which 269
might result in a decrease of the EC of the flour. As the extrusion temperature increase, starch 270
modification might partially mask the protein denaturation. Gelatinized starch has greater 271
number of hydroxyl groups, which would be available to form hydrogen bonds with the proteins 272
leading to better emulsion capacity. 273
Emulsion stabilities (ES) were higher in the flours obtained from lower extrusion temperature 274
(flour 1 and 2), showing values of 113.20 and 113.23, respectively. Likely the denaturation of 275
the rice proteins during extrusion increased the stability. The particle size (coarse or fine) of the 276
rice flours did not affect significantly the EC, but the ES significantly increased with the particle 277
size reduction, from 110.80 in coarse flours to 113.61 in fine flours. A reduction in the particle 278
size of the flour improves the emulsifying properties of the flours (Aluko et al., 2009). In the 279
present study, it was observed a significant positive relationship between the ES and the free 280
sugars content (r=0.93, P<0.001), which could reduce the total charge of the proteins leading the 281
formation of interfacial protein membranes that stabilize the emulsion (Aluko et al, 2009). 282
Extrusion improved the foaming capacity (FC) of the rice flours (Table 1), but there was no 283
trend with the extrusion severity (temperature or moisture content). The foam stability (FS) 284
could be only measured in flour 3 (50.00 for fine flour and 45.18 for coarse flour), because very 285

14
unstable foams were obtained with the other flours. The FC has been attributed to its 286
microstructure, size and distribution of the gas cells and the interfacial properties (Zhang et al., 287
2011). Hydrothermal treatments can improve the foaming properties, like it has been reported 288
with corn kernels (Boladea et al., 2002). Nevertheless, the minor effect observed in the extruded 289
rice flours could be attributed to the low protein content of the rice flour. Protein isolates show 290
great foaming capacity that improves with the hydrothermal treatments (Wang & Johnson, 291
2001). The effect of extrusion on foam formation followed an opposite trend to the one observed 292
on the emulsion formation, which suggests that different mechanisms are involved during 293
interfacial membrane formation at the air-water and oil-water interfaces. Concerning the particle 294
size, the major FC was observed in fine flours (26.77) compared to coarse flours (22.92). This 295
effect could be explained by the greater availability of lowering interfacial components in those 296
flour fractions, as proposed Aluko et al. (2009). 297
298
3.3. Colour 299
Luminosity (L*) of the flours significantly decreased with the extrusion temperature and 300
moisture content (Table 1), from 90.55 in flour 0 to 88.62 in flour 3. Conversely, the a* and b* 301
increased. Nevertheless, whereas a steady increased with the extrusion temperature and moisture 302
content (flours 0 to 3) was observed in the case of the luminosity and b*, no trend was observed 303
in the case of a*. The extrusion process could lead to Maillard reactions and a reduction of the 304
lipids oxidation due to enzymes inactivation that induces the formation of melanoidins and the 305
pigments protection, which in turn produces the modification of the flours color (Camire et al, 306
1990). Moreover, higher L* and lower a* y b* were obtained in the fine flours. It has been 307

15
proposed that fine flours had higher surface area that favors the contact of the constituents with 308
the oxygen promoting the pigments oxidation (Atwell, 2001). 309
310
3.4. Pasting characteristics 311
Pasting plots of the extruded flours are displayed in Figure 1a (coarse flour) and in Figure 1b 312
(fine flour). Concerning the extrusion treatment (flours 0 to 3), the viscosity during heating and 313
cooling decreased with the extrusion intensity, obtaining minimum viscosity in flour 3 (with the 314
highest intensity). Nevertheless, when particle size was taken into account, a progressive 315
decrease of viscosity was observed in the coarse flours (Figure 1a), but fine flours (Figure 1 b) 316
from treatment 1 and 2 did not show any difference in the pasting profile. Since flour 1 and 2 317
were treated at maximum barrel temperature of 110ºC and the unique variation was the feed 318
moisture content, it seems that the effect on pasting profiles was independent on the feed 319
moisture content during extrusion when small particle size were subjected to this treatment. 320
Peak viscosity was significantly dependent on the damage starch content (r=-0.79), which agree 321
with previous studies connecting peak viscosity with gelatinized and damage starch that was 322
related to the polymerization degree of the starch granules (Barres et al., 1990). The reduction 323
observed in the final viscosity and setback was displaying the extension of the effect on the 324
amylose chains, which might lose the ability to retrograde during cooling due to their 325
fragmentation during extrusion. This effect agrees with previous results of Doublier et al. 326
(1986). 327
328
3.5. Differential Scanning Calorimetry (DSC) 329

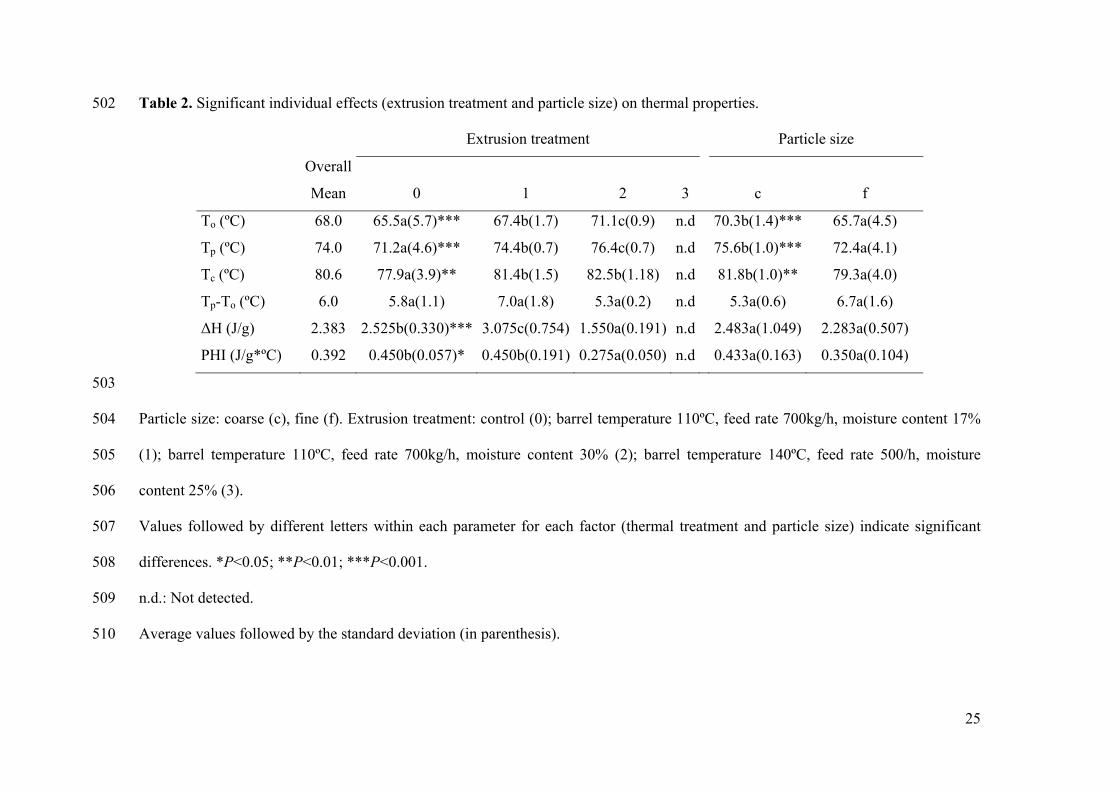
16
The effect of extrusion treatment and particle size on the thermal properties of the starch is 330
shown in Table 2. In the range of temperature tested (from 30 to 110ºC), flours exhibited one 331
endothermic peak corresponding to amylopectin gelatinization, with the exception of flour 3 (no 332
peak detected). The absence of an endothermic peak for flours 3 indicated total gelatinization of 333
amylopectin. Indeed, these results agree with those previously discussed regarding the very 334
small pasting curve observed in the extruded flours 3 at 50ºC. The extrusion treatment 335
significantly modified the gelatinization temperatures (To, Tp, Tc) of the flours, and those 336
temperatures were also dependent on the particle size of the flours (coarse and fine flours). 337
Gelatinization temperatures (Tp) were sifted to higher values when flours were treated at 338
increasing extrusion intensity (3 was the highest intensity), but the temperature range (Tp-To) 339
was not affected. Higher gelatinization temperature indicated that more energy is required to 340
initiate gelatinization of the starch suggesting that extrusion is affecting the outer and more 341
amorphous part of the granule and is progressing to the core of the granule till no crystalline 342
structure is left for gelatinization (flour 3). 343
When comparing extruded flours, the gelatinization enthalpy (ΔH) was significantly reduced in 344
flour 2, where extrusion temperature and moisture content was sufficient to induce starch 345
gelatinization, likely due to an increase of the damage starch content (Chiu & Solarek, 2009). 346
Nevertheless, the mild extrusion treatment (flour 1) gave significantly higher gelatinization 347
enthalpy (3.075 J/g) compared to the untreated flour (flour 0) (2.525 J/g). Taking into account 348
that treatment 1 was applied using lower feed moisture content (insufficient to complete 349
gelatinization), the higher enthalpy of this sample could be attributed to a reorientation of the 350
structure of the amorphous region to resemble that of the crystalline region (Camire et al, 1990). 351
The extrusion process modifies the crystalline structure of the starch granule affecting the 352
17
temperature at which swelling starts (Camire et al, 1990). Fine flours showed lower 353
gelatinization temperatures than the corresponding coarse flours, but without affecting the peak 354
high index and the gelatinization enthalpy (Table 2). 355
356
3.6. Starch hydrolysis 357
The susceptibility of the extruded flours to the enzymatic hydrolysis was analyzed. Figure 2 358
shows the kinetic plots of the extruded flours and the effect of the particle size. The enzymatic 359
hydrolysis profiles were dependent on the particle size, and fine flours showed faster hydrolysis 360
and reached higher asymptotic values than course flours. de la Hera et al. (2013a) observed 361
lower hydrolysis rate in the coarse flours when studied the effect of particle size distribution on 362
the rice flour functionality. This result could be attributed to the high surface area of the fine 363
flours that increases the water diffusion and enzyme accessibility. The hydrolysis curves were 364
fitted to a first order kinetics according to Goñi et al. (1997) and also to Butterworth et al. (2012) 365
to obtain the kinetic parameters (Table 3). As it was observed in the plots, there was an increase 366
in the equilibrium concentration (C∞) parallel to the extrusion intensity (except flour 2f). 367
Regarding the rate of the hydrolysis, k, there was no general trend with the extrusion intensity. 368
There was great agreement with the equilibrium concentration estimated from both fitted 369
methods, indicating that the kinetic parameters can be fitted to a logarithmic function and that 370
the rate constant did not vary along the hydrolysis reaction (Poulsen et al., 2003). 371
Resistant starch was also quantified to determine the potential impact of the extrusion on the 372
structural level of starch. Although there was no clear tendency about the resistant starch 373
content, the highest extrusion intensity gave the flours with the lower level of RS (flour 3). This 374
finding disagrees with previous observations of Hagenimana et al. (2006), who found an 375

18
increase in RS content with the treatment severity. Those authors attributed the increase in RS to 376
the formation of amylose-lipid complexes during the extrusion, which retarded the enzymatic 377
digestion. Therefore, results divergence might be explained because of the lower content of 378
amylose of the flours in the present study compared with the reported ones. In addition 379
Chinnaswamy & Hannah (1990) reported a change in the percentage of amylose/amylopectin 380
ratio in extruded corn flours that was ascribed to both chains fragmentation, being more intense 381
in the former. That fact could affect the starch hydrolysis rate. Moreover, Hagenimana et al. 382
(2006) stated that the susceptibility of the extruded starches to be enzymatically hydrolyzed was 383
directly related to the intensity of the extrusion treatment. 384
The particle size did not significantly affect the hydrolysis rate, but fine flours showed higher 385
values of C∞ and lower amount in RS. Al-Rabadi et al. (2011) stated that fine extruded flours of 386
barley and sorghum had major digestibility than the coarser ones. The most compact structure, 387
besides the smaller surface area of coarser flours, could hinder the accessibility of the enzymes 388
within the starch structure, since diffusion of the enzyme is the first stage in the enzymatic 389
hydrolysis (Al-Rabadi et al. 2011; Ghaid et al., 2009). 390
391
4. Conclusion 392
Extrusion and mechanical fractionation of the rice flours modified their behavior affecting 393
hydration, thermal and pasting features, besides their susceptibility to enzymatic hydrolysis. The 394
severity of the extrusion treatment was accompanied by an increase in the amount of damage 395
starch and free sugars content, the former contributing to the Maillard reaction, which affected 396
the luminosity of the flours. In parallel, hydration ability increased with the extrusion intensity, 397
leading higher viscosity in cold solution, which might be very interesting for some food 398
19
applications. Thermal properties (temperature and enthalpy) increased with the intensity of the 399
extrusion and that effect was intensified with the greatest particle size of the flours. Fine flours 400
with stronger extrusion showed the highest susceptibility to enzymatic hydrolysis and extrusion 401
process increased that effect. Therefore, extrusion and fractionation can be an alternative to 402
produce flours with different functional properties, which might be useful in gluten free 403
breadmaking. Future studies will be undertaken to test these flours in breadmaking process. 404
405
Acknowledgements 406
Authors acknowledge the financial support of Junta de Castilla y León (VA054A12-2), the 407
Spanish Ministry of Economy and Sustainability (Project AGL2011-23802), and the European 408
Regional Development Fund (FEDER). Authors are also grateful to Harinera Los Pisones, 409
(Zamora, Spain) for supplying the rice flours. 410
411
References 412
AACC. (2012). Approved methods of the American Association of Cereal Chemists, methods 413
46-30.01 (protein), 55-40.01 (particle size), 76-30a (damaged starch), 56-30 (WBC), 61-02.01 414
(RVA) (11th ed.). St. Paul, Minnesota: American Association of Cereal Chemists. 415
Al-Rabadi, G., Torley, P., Williamsa, B., Brydena, W., & Gidley, M. (2011). Effect of extrusion 416
temperature and pre-extrusion particle size on starch digestion kinetics in barley and sorghum 417
grain extrudates. Animal Feed Science and Technology, 168, 267-279. 418
Alsaffar, A. (2011). Effect of food processing on the resistant starch content of cereals and 419
cereal products - A review. International Journal of Food Science and Technology, 46, 455-462. 420

20
Aluko, R., Mofolasayo, O., & Watts, B. (2009). Emulsifying and foaming properties of 421
commercial yellow pea (Pisum sativum L.) seed flours. Journal of Agriculture and Food 422
Chemistry, 57, 9793-9800. 423
Atwell, W. (2001). Composition of commercial flour. In W. Atwell (Ed.), Wheat Flour (pp. 27-424
42). St. Paul, Minnesota, USA: American Association of Cereal Chemists. 425
Barres, C., Verges, B., Tayeb, J., & Della Valle, G. (1990). Transformation of wheat flour by 426
extrusion cooking. Influence of screw configuration and operating conditions. Cereal Chemistry, 427
67, 427-433. 428
Boladea, M., Usman, M., Rasheed, A., Benson, E., & Salifou, I. (2002). Influence of 429
hydrothermal treatment of maize grains on the quality and acceptability of tuwon masara 430
(traditional maize gel). Food Chemistry, 79, 479–483. 431
Butterworth, P.J., Warren, F.J., Grassby, T., Patel, H., & Ellis, P.R. (2012). Analysis of starch 432
amylolysis using plots for first-order kinetics. Carbohydrate Polymers, 87, 2189-2197. 433
Camire, M., Camire, A., & Krumhar, K. (1990). Chemical and nutritional changes in foods 434
during the extrusion. Food Science Nutrition 29, 35-57. 435
Chinnaswamy, R., & Hannah, M. (1990). Macromolecular and functional properties of native 436
and extruded corn starch. Cereal Chemistry, 67, 490-499. 437
Chiu, C., & Solarek, D. (2009). Modification of starch. In J. BeMiller, & R. Whistler (Eds.), 438
Starch. Chemistry and Technology (pp. 629-656). New York. USA: Academic Press. 439
Clerici, M., Arioldi, C., & El-Dash, A. (2009). Production of acidic extruder rice flour and its 440
influence on the qualities of gluten free bread. Food Science and Technology, 42, 618-623. 441

21
Colonna, P., Doublier, J., Melcion, J., Demonredon, F., & Mercier, C. (1984). Extrusion cooking 442
and drum drying of wheat-starch.1. Physical and macromolecular modifications. Cereal 443
Chemistry, 61, 538-543. 444
de la Hera, E., Gómez, M., & Rosell, C. (2013a). Particle size distribution affecting the starch 445
enzymatic digestion and hydration of rice flour carbohydrates. Carbohydrates Polymers, 98, 446
421– 427. 447
de la Hera, E., Martínez, M., & Gómez, M. (2013b). Influence of flour particle size on quality of 448
gluten-free rice bread. LWT-Food Science and Technology, 54, 199-206. 449
de la Hera, E., Martínez, M., Oliete, B., & Gómez, M. (2013c). Influence of flour particle size 450
on quality of gluten-free rice cakes. Food Bioprocess Technology, 6, 2280-2288. 451
Doublier, J., Colonna, P., & Mercier, C. (1986). Extrusion cooking and drum drying of wheat-452
starch. 2. Rheological characterization of starch pastes. Cereal Chemistry, 63, 240-246. 453
Ghaid, J., Al-Rabadi, G., Gilbert, R., & Gidley, M. (2009). Effect of particle size on kinetics of 454
starch digestion in milled barley and sorghum grains by porcine alpha-amylase. Journal of 455
Cereal Science, 50, 198-204. 456
Goñi, I., Garcia-Alonso, A. & Saura-Calixto, F. (1997). A starch hydrolysis procedure to 457
estimate glycemic index. Nutrition Research, 17, 427–437. 458
Gularte, M.A., & Rosell, C.M. (2011). Physicochemical properties and enzymatic hydrolysis of 459
different starches in the presence of hydrocolloids. Carbohydrate Polymers, 85, 237–244. 460
Hagenimana, A., Ding, X., & Fang, T. (2006). Evaluation of rice flour modified by extrusion 461
cooking. Journal of Cereal Science, 43, 38-46. 462
Hasjim, J., Li, E., & Dhital, S. (2012). Milling of rice grains: The roles of starch structures in the 463
solubility and swelling properties of rice flour. Starch/Starke, 64, 631–645. 464
22
Jacobs, H., & Delcour, J. (1998). Hydrothermal modifications of granular starch, with retention 465
of the granular structure: a review. Journal of Agricultural and Food Chemistry, 46, 2895-2905. 466
Lee, S.M., Yoo, J., Inglett, G.E., & Lee, S. (2013). Particle size fractionation of high-amylose 467
rice (Goami 2) flour as an oil barrier in a batter-coated fried system. Food Bioprocess 468
Technology, 6, 726-733. 469
Mercier, C., & Feillet, P. (1975). Modification of carbohydrate components by extrusion-470
cooking of cereal products. Cereal Chemistry, 63, 283-297. 471
Moreira, R., Chenlo, F., & Torres, M.D. (2013). Rheology of gluten-free doughs from blends of 472
chestnutand rice flours. Food Bioprocess Technology, 6, 1476-1485. 473
Nelson, A. (2001). Properties of Hihg-fibre ingredientes. Cereal Foods World, 46, 93-97. 474
Perdon, A., Siebenmorgen, T., Mauromoustakos, A., Griffin, V., & Johnson, E. (2001). Degree 475
of milling effects on rice pasting properties. Cereal Chemistry, 78, 205-209. 476
Poulsen, B., Ruiter, G., Visser, J., & Iversen, J. (2003). Determination of first order rate 477
constants by natural logarithm of the slope plot exemplified by analysis of Aspergillus niger in 478
batch culture. Biotechnology Letters, 25, 565-571. 479
Rosell, C.M., & Foegeding, A. (2007). Interaction of hydroxypropylmethylcellulose with gluten 480
proteins: small deformation properties during thermal treatment. Food Hydrocolloids, 21, 1092-481
1100. 482
Wang, C., & Johnson, L. (2001). Functional properties of hydrothermally cooked soy protein 483
products. Journal of the American Oil Chemists Society, 78, 189-195. 484
Wen, L., Rodis, P., & Wasserman, B. (1990). Starch fragmentation and protein insolubilization 485
during twin-screw extrusion of corn meal. Cereal Chemistry, 67, 268-275. 486
23
Yeh, A. (2004). Preparation and applications of rice flour. In E. Champagne (Ed.), Rice: 487
Chemistry and Tehnology (pp. 495-540). St. Paul, Minesota. U.S.A: American Association of 488
Cereal Chemist. 489
Zhang, M., Bai, X., & Zhang, Z. (2011). Extrusion process improves the functionality of soluble 490
dietary fiber in oat bran. Journal of Cereal Science, 54, 98-113. 491
492

24
Table 1: Significant individual effects of extrusion treatment (1-3) and particle size (coarse, fine) on free sugars, damaged starch, 493
emulsifying, foaming and colorimetric properties of rice flours. 494
Extrusion treatment Particle size
Overall
Mean 0 1 2 3
c f
Free Sugars (%) 21.47 6.92a(2.08)*** 9.49a(0.88) 19.58b(0.64) 49.91c(10.52) 18.74a(15.08)** 24.21b(21.73)**
Damaged Starch (%) 18.08 6.66a(1.69)*** 9.85b(1.38) 23.33c(5.95) 32.49d(4.66) 19.98b(13.71)** 16.18a(8.83)
WBC (g water/g solid) 2.42 1.26a(0.05)*** 1.35b(0.06) 2.13c(0.25) 4.94d(0.05) 2.46b(1.60)* 2.39a(1.59)
Swelling (mL/g) 3.50 0.95a(0.25)*** 1.55b(0.19) 2.90c(1.10) 8.60d(0.43) 3.85b(3.30)** 3.15a(3.22)
EC 86.21 87.58c(1.25)** 84.92a(0.53) 85.70ab(0.39) 86.34bc(1.35) 86.60a(1.71) 85.82a(0.80)
ES 112.21 111.49a(2.47)*** 113.20b(0.55) 113.23b(0.72) 110.90a(2.93) 110.80a(2.12)*** 113.61b(0.27)
FC 24.85 17.94a(1.17)*** 29.97c(7.15) 21.44b(1.86) 30.04c(1.51) 22.92a(5.47)*** 26.77b(7.12)
L* 91.0 94.36c(0.42)*** 90.55b(2.01) 90.43b(1.42) 88.62a(2.56) 89.66a(3.05)*** 92.31b(1.46)
a* 0.19 -0.17a(0.21)*** 0.23c(0.19) 0.16b(0.04) 0.55d(0.14) 0.23b(0.40)*** 0.15a(0.17)
b* 9.63 6.82a(0.46)*** 10.22b(1.68) 10.37b(1.32) 11.13c(2.14) 10.83b(2.35)*** 8.44a(1.23)
Particle size: coarse (c), fine (f). Extrusion treatment: control (0); barrel temperature 110ºC, feed rate 700kg/h, moisture content 17% 495
(1); barrel temperature 110ºC, feed rate 700kg/h, moisture content 30% (2); barrel temperature 140ºC, feed rate 500/h, moisture 496
content 25% (3) 497
Values followed by different letters within each parameter for each factor (thermal treatment and particle size) indicate significant 498
differences.*P<0.05; **P<0.01; ***P<0.001. 499
Average values followed by the standard deviation (in parenthesis). 500
WBC, water binding capacity; EC, emulsifying capacity; ES, emulsion stability; FC, foaming capacity. 501
25
Table 2. Significant individual effects (extrusion treatment and particle size) on thermal properties. 502
Extrusion treatment Particle size
Overall
Mean 0 1 2 3 c f
To (ºC) 68.0 65.5a(5.7)*** 67.4b(1.7) 71.1c(0.9) n.d 70.3b(1.4)*** 65.7a(4.5)
Tp (ºC) 74.0 71.2a(4.6)*** 74.4b(0.7) 76.4c(0.7) n.d 75.6b(1.0)*** 72.4a(4.1)
Tc (ºC) 80.6 77.9a(3.9)** 81.4b(1.5) 82.5b(1.18) n.d 81.8b(1.0)** 79.3a(4.0)
Tp-To (ºC) 6.0 5.8a(1.1) 7.0a(1.8) 5.3a(0.2) n.d 5.3a(0.6) 6.7a(1.6)
ΔH (J/g) 2.383 2.525b(0.330)*** 3.075c(0.754) 1.550a(0.191) n.d 2.483a(1.049) 2.283a(0.507)
PHI (J/g*ºC) 0.392 0.450b(0.057)* 0.450b(0.191) 0.275a(0.050) n.d 0.433a(0.163) 0.350a(0.104)
503
Particle size: coarse (c), fine (f). Extrusion treatment: control (0); barrel temperature 110ºC, feed rate 700kg/h, moisture content 17% 504
(1); barrel temperature 110ºC, feed rate 700kg/h, moisture content 30% (2); barrel temperature 140ºC, feed rate 500/h, moisture 505
content 25% (3). 506
Values followed by different letters within each parameter for each factor (thermal treatment and particle size) indicate significant 507
differences. *P<0.05; **P<0.01; ***P<0.001. 508
n.d.: Not detected. 509
Average values followed by the standard deviation (in parenthesis). 510
26
To, gelatinization onset; Tp, peak temperature; Tc, conclusion temperature, Tp-To, gelatinization range, ΔH, enthalpy and PHI, peak 511
high index. 512

27
Table 3. Kinetic parameters extracted from first-order and LOS plots of different flours. 513
514
k (min-1) by first order eq.
k (min-1) by LOS C∞ (%) C∞ (%) by
LOS Resistant starch (%)
0f 0.043(0.001) 0.044(0.001) 137.48(5.14) 150.63(5.10) 5.52(0.50) 0c 0.053(0.006) 0.051(0.005) 124.39(3.61) 130.72(3.55) 5.91(0.86) 1f 0.074(0.009) 0.071(0.007) 358.42(12.39) 388.85(13.45) 3.29(0.38) 2f 0.061(0.011) 0.059(0.010) 338.79(13.08) 364.30(14.08) 4.01(0.74) 3f 0.145(0.015) 0.143(0.014) 387.35(11.58) 727.46(12.10) 2.23(0.36) 1c 0.054(0.001) 0.053(0.001) 134.98(5.02) 143.25(4.74) 6.10(1.32) 2c 0.076(0.006) 0.073(0.008) 143.38(4.86) 156.65(4.20) 5.75(0.98) 3c 0.061(0.004) 0.059(0.006) 230.75(7.25) 243.55(7.56) 2.11(0.51)
515
k, kinetic constant; C∞, equilibrium concentration 516
Numbers in sample codes are referred to extrusion intensity and letters are associated to coarse 517
(c) or fine (f) flour. 518
Average values followed by the standard deviation (in parenthesis). 519
520
521

28
FIGURE CAPTIONS 522
Figure 1a. Effect of extrusion treatment on the pasting properties of coarse rice flours. Flour 0 523
(black line), flour 1 (clear grey line), flour 2 (intermediate tone grey line), flour 3 (dark grey 524
line). Temperature profile (discontinuous line). 525
Figure 1b. Effect of extrusion treatment on the pasting properties of fine rice flours. Flour 0 526
(black line), flour 1 (clear grey line), flour 2 (intermediate tone grey line), flour 3 (dark grey 527
line). Temperature profile (discontinuous line). 528
Figure 2. Effect of extrusion treatment on the enzymatic hydrolysis of rice flours with different 529
particle size. Flour 0 (●,black line), flour 1 (▼, clear grey line), flour 2 ( ▀, intermediate tone 530
grey line ), flour 3 (♦, dark grey line). Coarse flours (a), fine flours (b). 531


![Extrusion - donar.messe.dedonar.messe.de/exhibitor/hannovermesse/2017/G284411/extrusion-ger... · Extrusion Lösungen aus Kunststoff Technische Lösungen [Entwicklung] [Spritzguss]](https://img.pdfslide.net/doc/110x75/5c74d0f309d3f2123b8c609e/extrusion-donarmesse-extrusion-loesungen-aus-kunststoff-technische-loesungen.jpg)


![Dental Extrusion with Orthodontic Miniscrew Anchorage: A ... · Miniscrews for orthodontic treatments are available in severallengths(5–12mm)anddiameters(1.2–2.0mm)[17]. E. Mizrahi](https://img.pdfslide.net/doc/110x75/5ed55049eb5803601c17fbed/dental-extrusion-with-orthodontic-miniscrew-anchorage-a-miniscrews-for-orthodontic.jpg)